
WFT-Fati-Dec: Enhanced Fatigue Detection AI System Based on Wavelet Denoising and Fourier Transform

1
Smart Systems Engineering Laboratory, College of Engineering, Prince Sultan University, Riyadh 11586, Saudi Arabia
2
Department of the Robotics and Intelligent Machines, Faculty of Artificial Intelligence, Kafrelsheikh University, Kafrelsheikh 33516, Egypt
3
Department of Information Technology, College of Computer and Information Sciences, Princess Nourah Bint Abdulrahman University, P.O. Box 84428, Riyadh 11671, Saudi Arabia
*
Authors to whom correspondence should be addressed.
Appl. Sci. 2023, 13(5), 2785; https://0-doi-org.brum.beds.ac.uk/10.3390/app13052785
Submission received: 17 January 2023
/
Revised: 6 February 2023
/
Accepted: 12 February 2023
/
Published: 21 February 2023
(This article belongs to the Special Issue New Trends on Machine Learning Based Pattern Recognition and Classification)
Abstract
:As the number of road accidents increases, it is critical to avoid making driving mistakes. Driver fatigue detection is a concern that has prompted researchers to develop numerous algorithms to address this issue. The challenge is to identify the sleepy drivers with accurate and speedy alerts. Several datasets were used to develop fatigue detection algorithms such as electroencephalogram (EEG), electrooculogram (EOG), electrocardiogram (ECG), and electromyogram (EMG) recordings of the driver’s activities e.g., DROZY dataset. This study proposes a fatigue detection system based on Fast Fourier Transform (FFT) and Discrete Wavelet Transform (DWT) with machine learning and deep learning classifiers. The FFT and DWT are used for feature extraction and noise removal tasks. In addition, the classification task is carried out on the combined EEG, EOG, ECG, and EMG signals using machine learning and deep learning algorithms including 1D Convolutional Neural Networks (1D CNNs), Concatenated CNNs (C-CNNs), Support Vector Machine (SVM), Random Forest (RF), Decision Tree (DT), k-Nearest Neighbor (KNN), Quadrature Data Analysis (QDA), Multi-layer Perceptron (MLP), and Logistic Regression (LR). The proposed methods are validated on two scenarios, multi-class and binary-class classification. The simulation results reveal that the proposed models achieved a high performance for fatigue detection from medical signals, with a detection accuracy of 90% and 96% for multiclass and binary-class scenarios, respectively. The works in the literature achieved a maximum accuracy of 95%. Therefore, the proposed methods outperform similar efforts in terms of detection accuracy.
1. Introduction
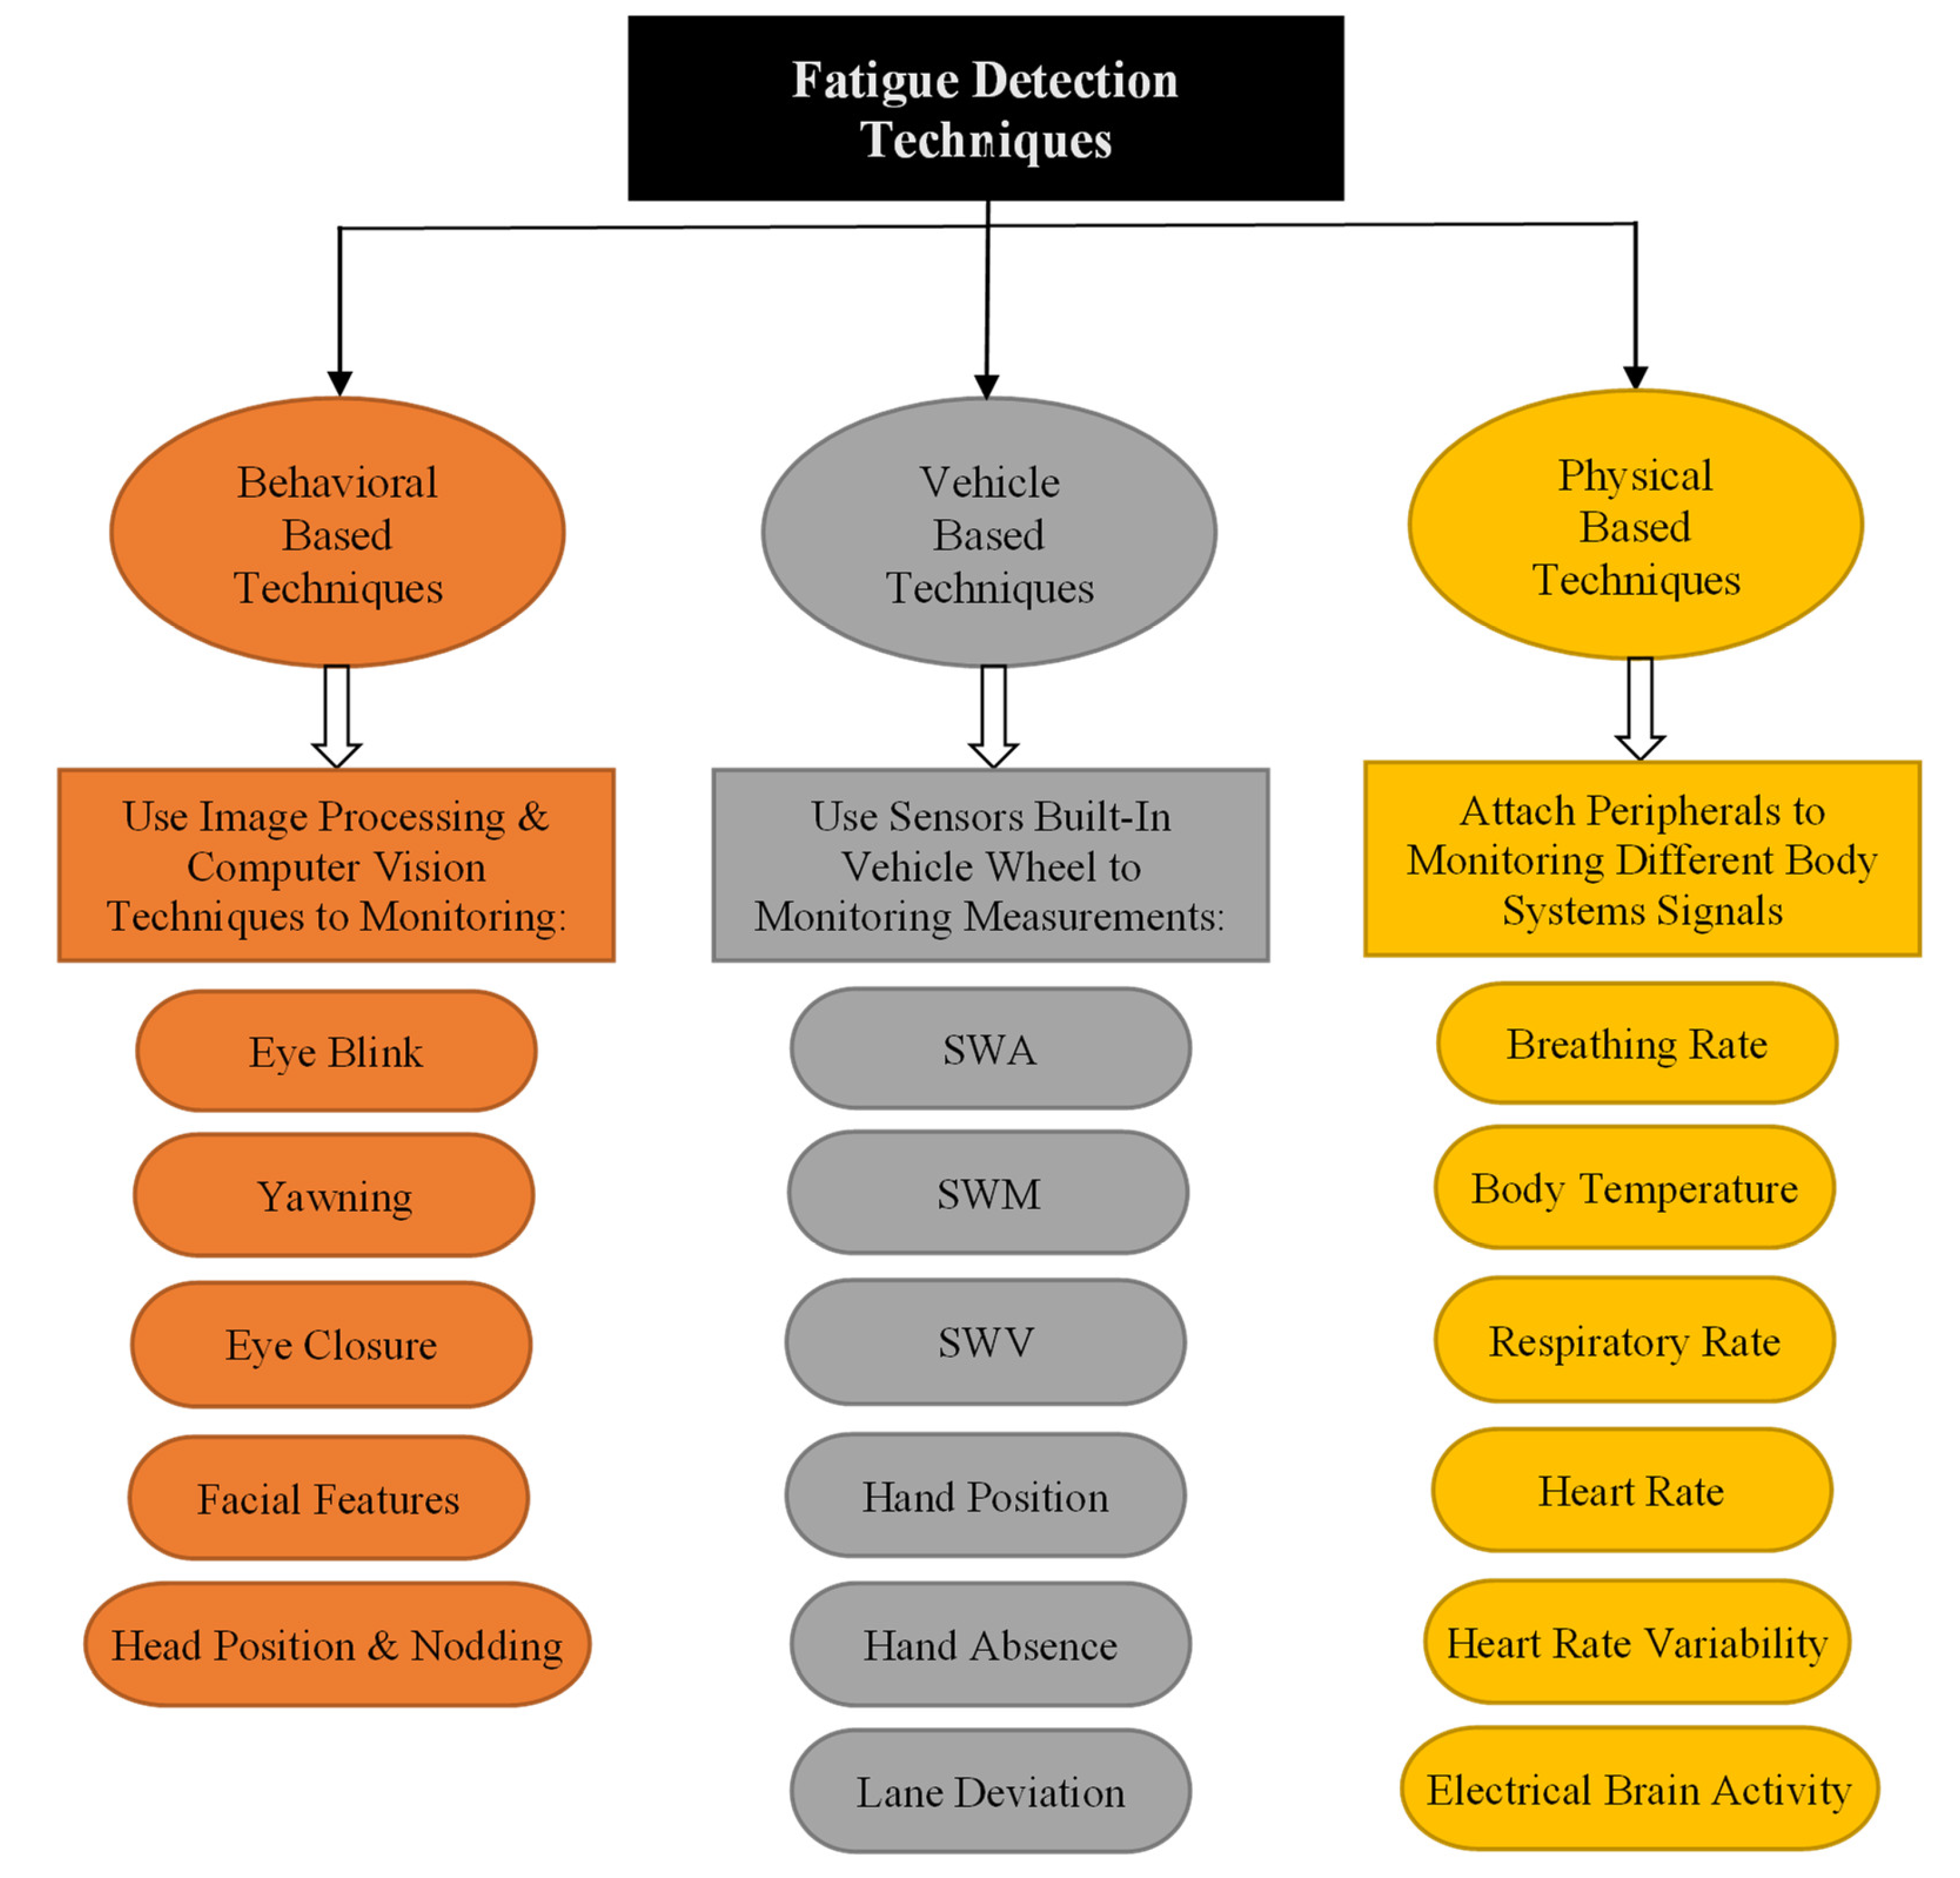
Researchers in the automotive industry are currently working on a slew of drowsiness detection systems to address the widespread problem of drivers nodding off behind the steering wheel. Consider the various sensors, cloud services, servers, smartphones, and centralized and distributed data processing that comprise the Internet of Things and its associated applications [1]. Human behavior, automotive, and environmental analysis are the three most common approaches to developing an efficient fatigue detection system [2]. Figure 1 summarizes the key characteristics shared by these types of systems.
The first trend comprises behavioral technologies which employ image processing and computer vision to analyze the driver’s images and videos. This method relies on monitoring many driver-related metrics to determine whether he is alert, tired, or asleep. Key factors are gleaned from observations such as yawning with the lips open and closed, eye closure, facial features, head posture, and nodding [3].
In vehicle-based systems, devices and sensors are embedded in vehicle wheels which form a system for detecting driver fatigue [4]. This integrated system monitors steering wheel angle, steering wheel movement, steering wheel velocity, hand placement, hand absence, and lane departure.
Physical-based methods monitor the signals from the driver’s internal systems by attaching sensors to the driver’s hands, head, fingers, and chest, such as ECG, EOG, EEG, and percentage of eyelid closure (PERCLOS). In addition, monitoring various output signals [5], such as respiratory rate, core temperature, electrical brain activity, pulse rate, heart rate variability, and total heart rate, are used in this method.
Moreover, drowsiness detection system methods can be divided into traditional and machine learning algorithms [6]. SVM and CNN are widely used and highly efficient classifiers in machine learning algorithms [7]. SVM is accurate when it is applied to large datasets, but it suffers from low speed. On the other hand, CNN provides high accuracy and consistency across large and small datasets, but it takes time to train on CPUs and it is expensive to process on GPUs [7].
Developing a system to detect driver fatigue, with safe driving practices, is a significant undertaking. Previous attempts at behavior-based techniques involved evaluating images captured of the driver in real-time using Infrared (IR) illumination, then using software to track their driving behavior [8]. This concept uses a wide range of parameters including the PERCLOS, the number of times the driver nods his head, and how long he keeps his eyes closed. A fuzzy classifier examines these factors to determine whether the driver is in danger. The superiority of the system, over competing algorithms, is due to the abundant tracking, analysis factors, and day-and-night data collection periods.
A fatigue detection system was proposed by Flores et al. [9], which scanned and monitored the driver’s face and eyes to decide based on facial expressions and eye movement. The gadget was tested in real-world scenarios with varying levels of illumination. Another method is proposed by Abtahi et al. [10] They created a straightforward technique based on image processing. Their strategy is to keep an eye out for signs of fatigue by tracking the driver’s face in the image and capturing features like eye and lip movement to detect yawning and ocular languor. This method represents the wide variety of facial structures used while motoring. Other methods for improving the accuracy of fatigue detection include [11,12,13], which both seek to identify the similarity of geometrical features.
Physical-based fatigue detection comprises classifying medical signals. Some researchers employ different feature extraction algorithms such as Correa et al. [14], who used time and frequency characteristics extracted from EEG recordings. They stated that their Artificial Neural Network (ANN)-based classification system had an accuracy of 83%. Another feature extraction method using Approximation Entropy (AE) and Sample Entropy (SE) was applied to EEG signals by Xiong et al. [14] to predict driver fatigue. This method was carried out on fifty people. They used the SVM for classification, and their proposed method achieved a classification accuracy of 90% with two categories of driver weariness. Furthermore, driver fatigue was predicted using EEG data by Chai et al. [15] using an autoregressive model. In this study, 48 people participated with two fatigue levels. They employed Independent Component Analysis (ICA) to reduce the feature vector size as part of their investigation. They deployed a Bayesian classifier which achieved an accuracy of 88.2%. Another type of feature extraction from EEG signals based on Fuzzy Entropy (FE) is proposed by Yin et al. [16] They tested their method on six participants to identify two distinct states of driving fatigue using an ANN classifier which is reported to be 90%. Hu et al. [17] used AE, SE, and FE to extract the features from EEG data to evaluate driver fatigue. In their study, eight people volunteered to be assessed using an AdaBoost classifier with 92% accuracy. Min et al. [18] used the AE, SE, and FE which extracted features of EEG signals to identify fatigue. Their sensitivity, specificity, and accuracy for classifying data were all 100% when using the ANN classifier.
Trigonometric transformation techniques are involved in feature extraction. Ko et al. [19] extracted Frequency information from EEG signals using the FFT to detect the driver’s state of weariness. Fifty participants used Virtual Reality (VR) equipment during the trials. According to proponents, the LR model reliably classified data at a 90% rate. Another effort is proposed by Wang et al. [20] to extract components from EEG recordings and they used Power Spectral Density (PSD) to perform this task. Their classification accuracy is 83% using the LR model. Mou et al. [21] used FFT to extract frequency information from EEG recordings to distinguish between two states of driver fatigue. They analyzed data from twenty individuals with a reliability in classifying objects of 85%. Nugraha et al. [22] extracted numerous time-frequency and statistical metrics from EEG data, such as mean, standard deviation, and correlation with FFT, to determine whether or not a driver was fatigued. Thirty people were tested using the Emotiv EPOC+ (EEG based device “https://www.emotiv.com/epoc/” (accessed on 29 November 2022)) to identify two distinct phases of driver fatigue. They boast a 96% accuracy rate when it enrolled into a classification task.
Another approach is proposed by Luo et al. [23]. They used a combination of adaptive scaling factor and entropy characteristics using two channels of EEG signals (Fp1 and Fp2). They achieved 40% on a two-stage classification of driver fatigue. In addition, the EEG toolbox was also used to filter out unwanted EOG activity. This task enhanced the system’s performance with a classification accuracy of 98%.
Gao et al. [24] turned to deep neural networks (DNNs) with testing on ten participants. They used 11 convolutional layers to create their deep network. They achieved a classification rate of 95%. A combination of EEG signals, facial expressions, and gyroscope data is proposed by Karuppusamy et al. [25]. They proposed a system based on DNNs, which achieved an accuracy of 93%.
It is clear from the works discussed that many feature extraction methods were employed to extract the key features from the input signals. Furthermore, the classification task utilized several strategies to reach the optimal detection accuracy. However, they reached a maximum detection accuracy of 95% using powerful feature extractors and classifiers. As a result, this article attempts to build an improved system with a high detection accuracy rather than the ones proposed in the literature.
Machine and deep learning modalities have recently been involved in several applications [26,27], such as emotion recognition [28], speech recognition [29], and medical diagnosis [30,31,32,33]. In this paper, we propose a drowsiness detection system to determine the level of fatigue based on EEG, EOG, and EMG signals. The objective is to develop a system that can detect a driver’s fatigue with a high detection rate and a fast testing time. For this purpose, we employed wavelet transform for the feature extraction task with PCA preprocessing. In addition, machine and deep learning models are deployed on the extracted features to detect fatigue states. The following are some examples of how the proposed work will advance the field:
- Propose a feature extraction method based on trigonometric transformations for EEG signals.
- Medical signal preprocessing using PCA and rescaling techniques.
- Investigate an enhanced method for fatigue detection from EEG signals based on machine and deep learning models.
- Evaluate the methods, discuss the results and highlight their advantages and disadvantages.
- Compare the accomplished performance with the works in the literature.
The remainder of this paper is divided into four sections. Section two describes the materials and methods proposed for this work. The third section discusses the outcomes of the proposed methods. Section four briefly compares the proposed methods to works in the literature. Finally, section five brings the paper to a close.
2. Materials and Methods
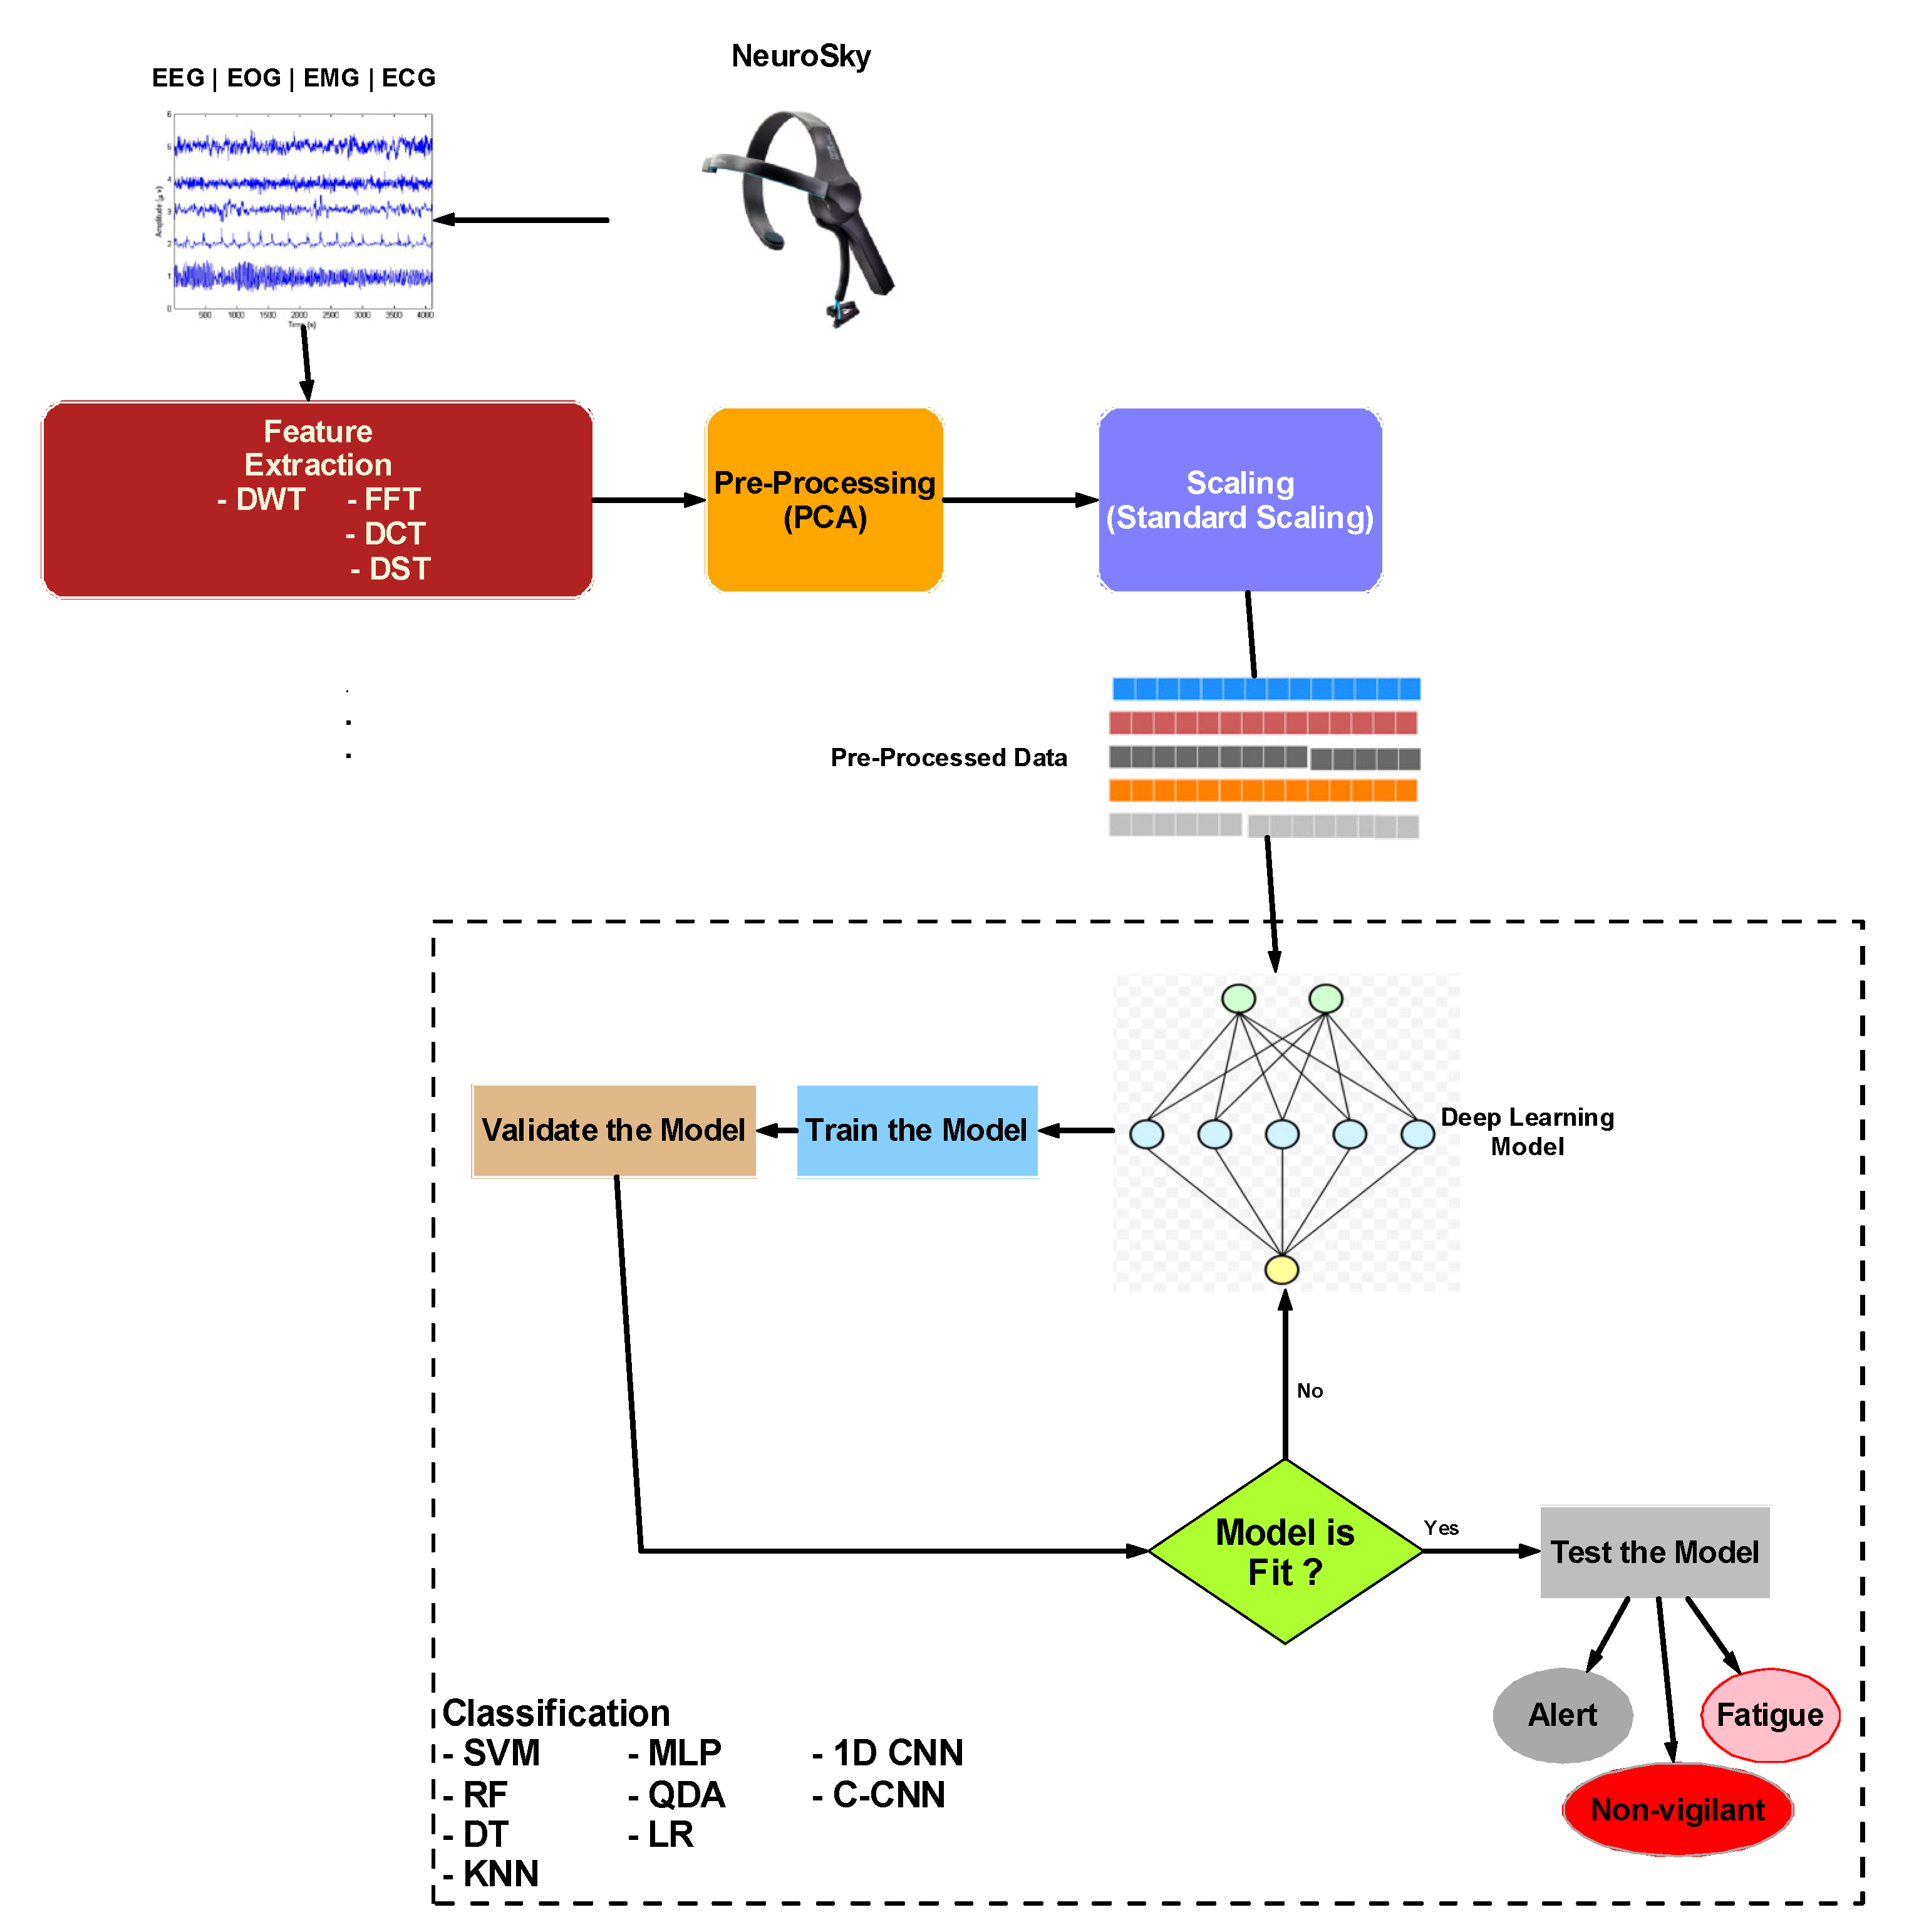
This paper proposes a fatigue detection system based on medical signals. The proposed method is divided into four stages: feature extraction, preprocessing, scaling, and classification, as shown in Figure 2. The feature extraction task is carried out using DWT, FFT, Discrete Cosine Transform (DCT), and Discrete Sine Transform (DST). The DWT is employed for noise reduction. The extracted signals are transformed using the trigonometric transformations, FFT, DCT, and DST. PCA is used through the preprocessing stage to improve the classification process and decorrelate the extracted features. The extracted features are then classified using machine and deep learning models.
Classifiers such as DT, KNN, SVM, RF, MLP with backpropagation, QDA, and LR are used in the machine learning approach. In addition, the hyperparameters of the proposed algorithms are mechanically chosen using the grid search method [34,35]. Table 1 illustrates samples of the ittrations of hyperparameter selection, while Table 2 presents the results of our research regarding the optimal values for the classifier’s hyper-parameters.
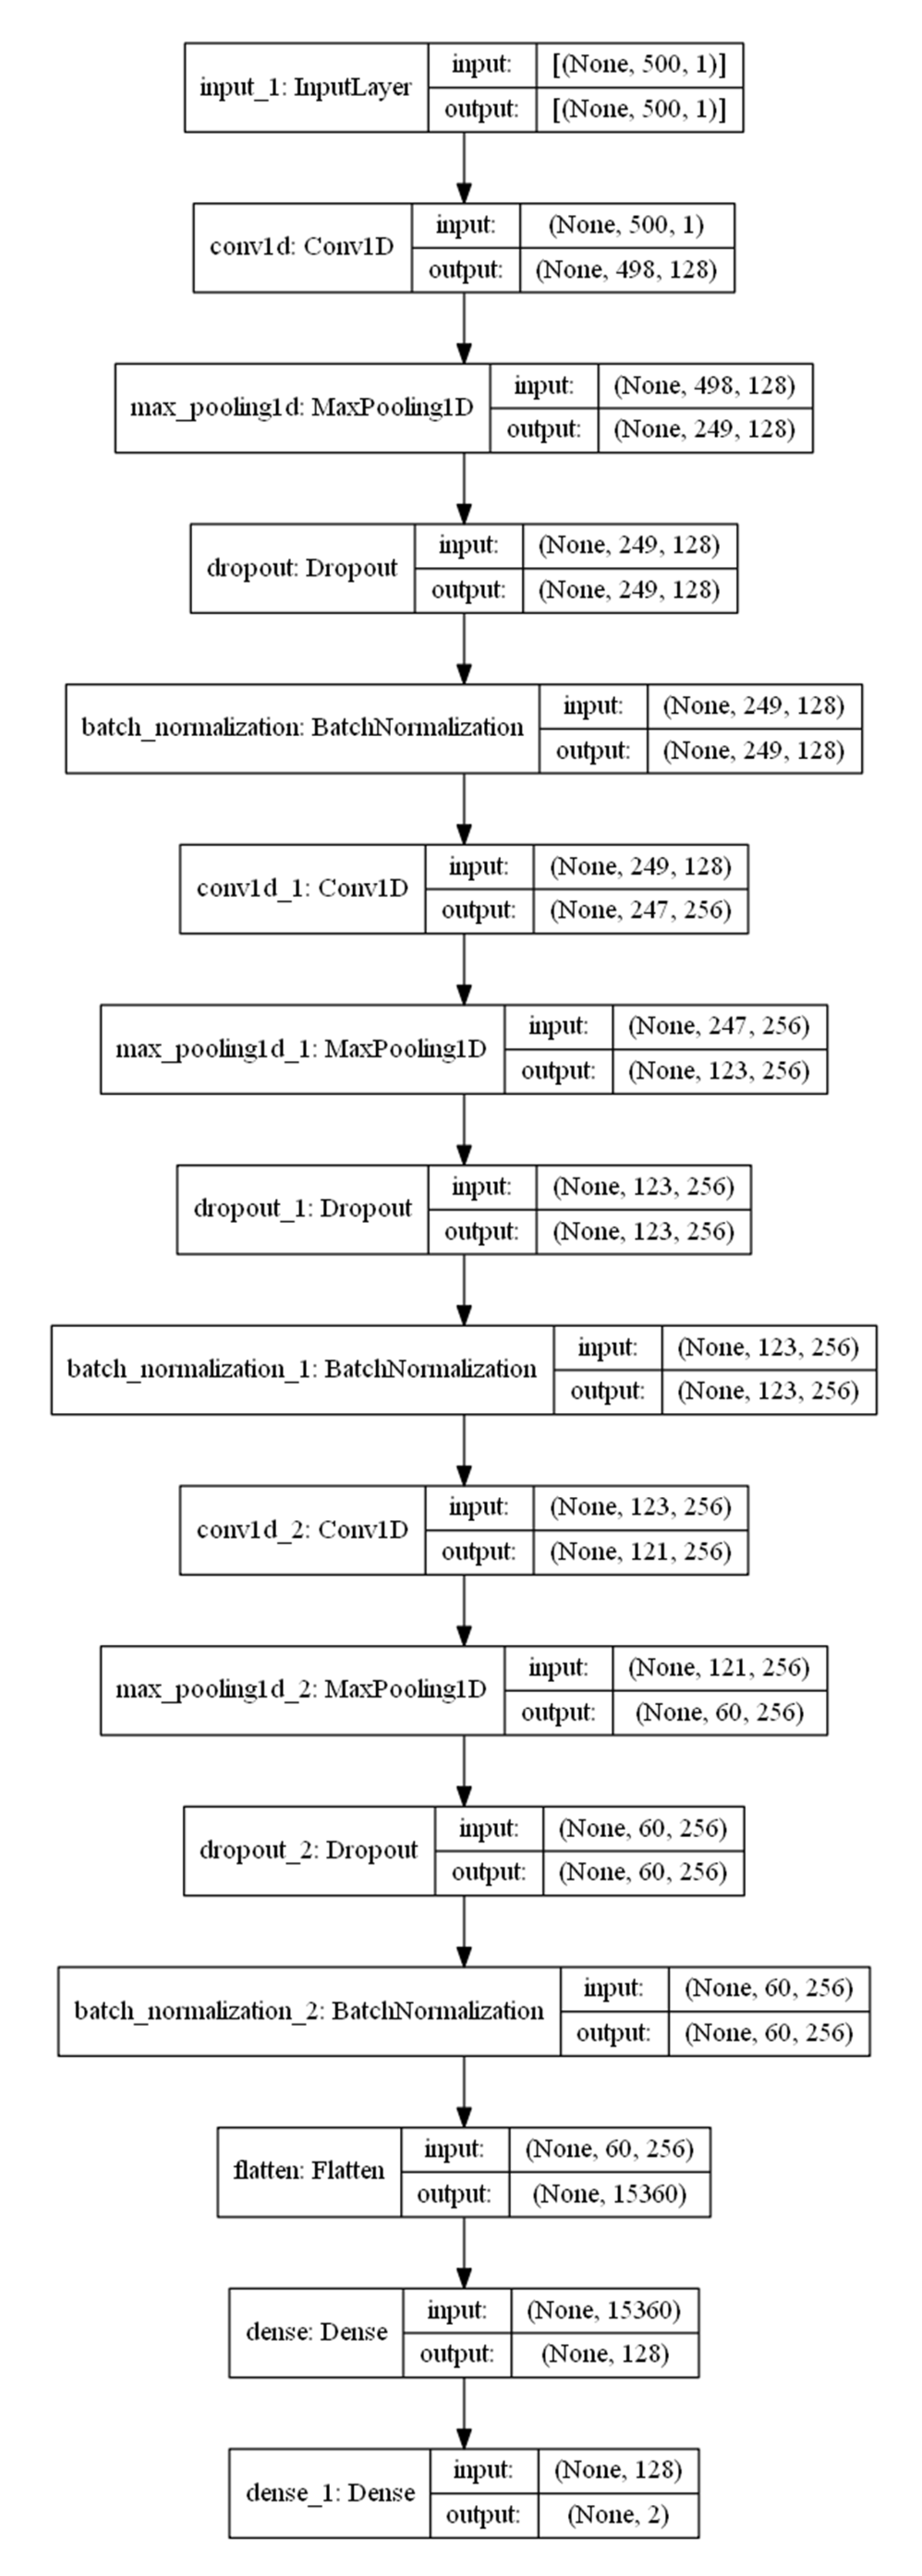
The deep learning approach includes concatenated CNNs and 1D CNNs. The proposed CNN model consists of an input layer, three convolutional, max pooling, dropout, and batchnormalization layers, a flatten layer, and a dense layer. At the input layer, the data is reduced to 500 features to be enrolled in the proposed models. The maximum pooling and convolutional layers are used to extract features from input data. The first, second, and third convolutional layers have 128, 128, and 256 filters, respectively. Each set also includes a dropout and a batch normalization layer. These layers are used to prevent overfitting from occurring. Furthermore, the flatten layer, which prepares the feature vectors for enrollment in classification, completes the connection between the feature extractors and the classification layer. A dense layer with a softmax activation function is used to deploy the classification task.
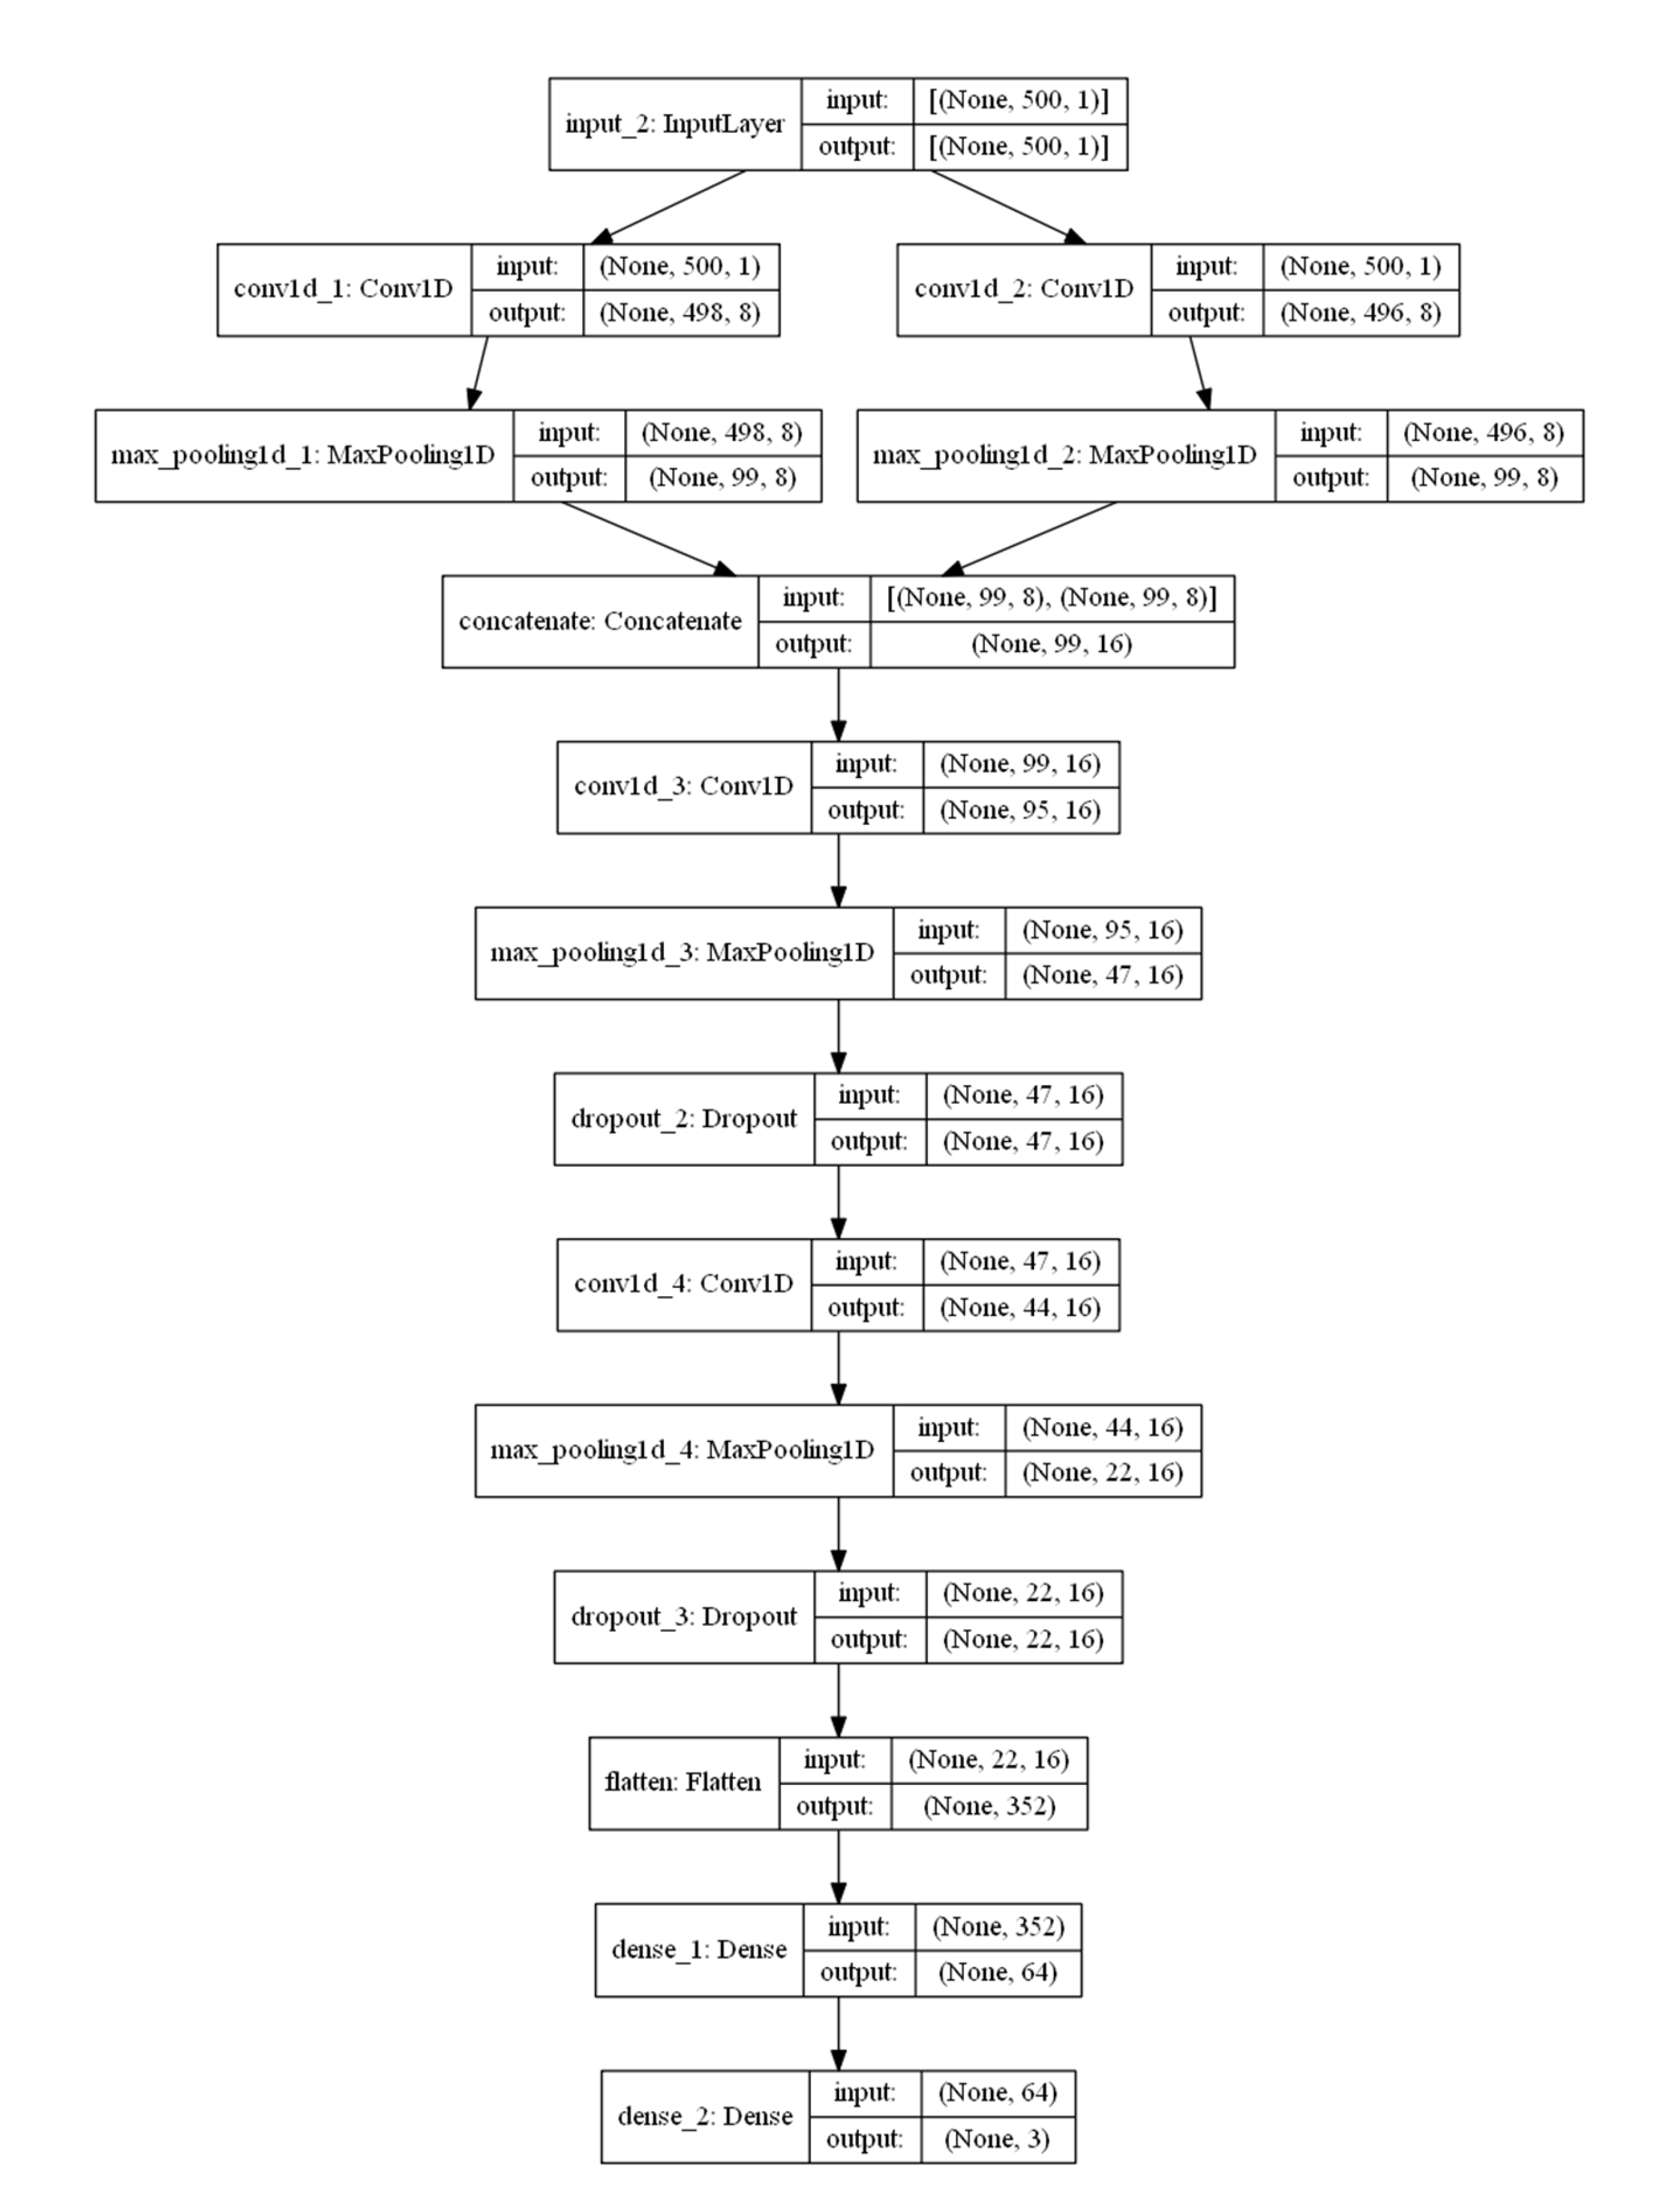
In this paper, we propose another sequential model based on C-CNNs. Concatenation describes how multiple forks or sub-models process the input data. In a concatenation layer, the results of these individual models are combined. The proposed concatenated model’s architecture, as shown in Figure 3, consists of an input layer, and two branches of a sequence of convolutional, max pooling, and dropout layers. The branch outputs are then concatenated using a concatenation layer. The concatenated feature vector is then enrolled in three convolutional, max pooling, and dropout layers. A flatten layer is used for fully connected tasks, and a dense layer is used for classification tasks. Figure 4 depicts the hyperparameters of the proposed C-CNN model.
3. Results
This section provides a thorough examination of the proposed algorithms. First, the dataset is thoroughly described. The evaluation metrics used to assess the performance of the proposed methods are displayed. The hyperparameter selection is discussed. The findings are then summarized, followed by commentary and discussion. The results are then compared to those found in the literature.
The proposed methods are performed on a PC outfitted with a Core i7 processor, an 8 GB NVIDIA GPU device, 32 GB of RAM, and Windows 11. The proposed models are deployed using Python 3.8 codebases using the Keras, Scikit-learn, and TensorFlow libraries. The proposed methods’ layers and learning parameters are displayed in Table 2 and Figure 3 and Figure 4.
3.1. Dataset Description
The proposed techniques are tested on the “ULg Multimodality Drowsiness Database” (abbreviated DROZY [36]). This dataset is in two parts (video monitoring and EEG signals). First, data from 14 healthy young adults were gathered (3 males and 11 females).
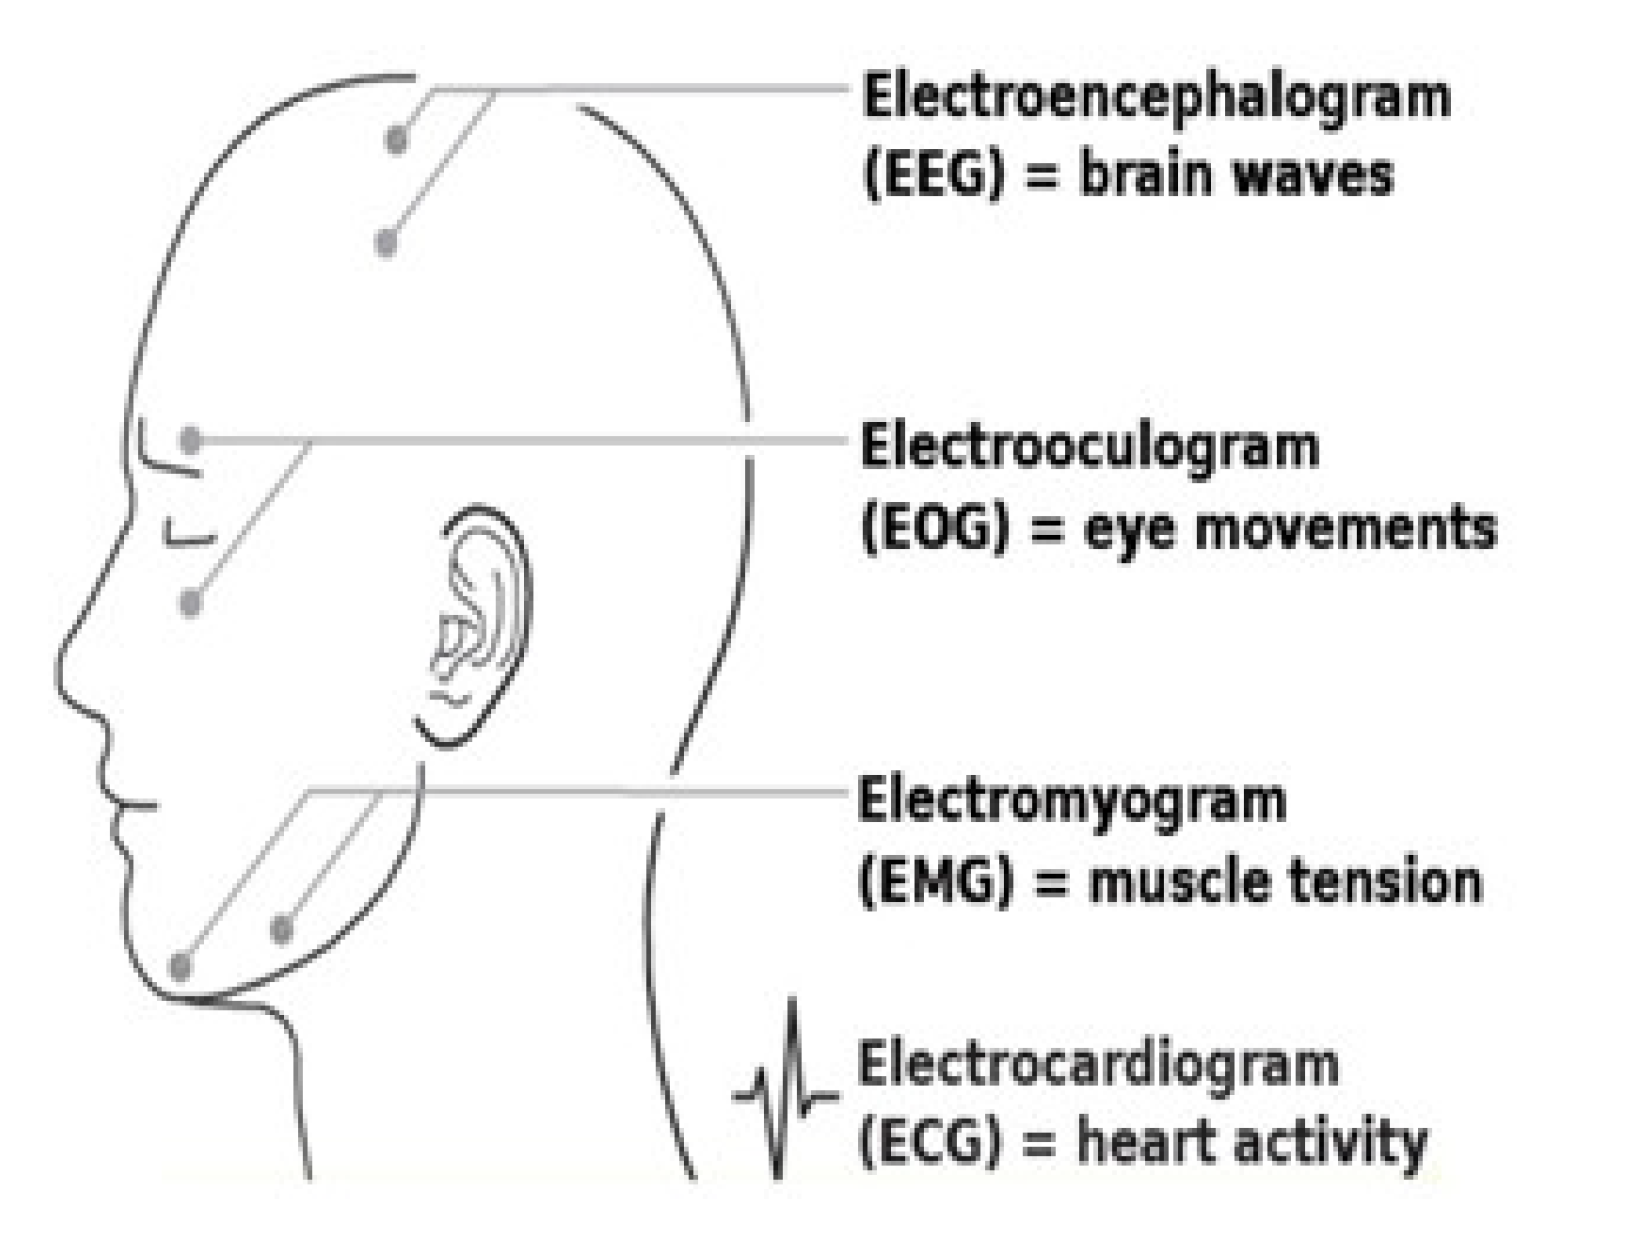
DROZY includes a sleepiness indicator that uses data from sources such as the Karolinska Sleepiness Scale (KSS) and polysomnography (PSG) to provide an accurate picture of a person’s sleepiness. Polysomnograms typically have eleven electrodes: five for EEG, two for EOG, one for EMG, and one for ECG, all of which operate at 512 hertz. Figure 5 depicts the progression of polysomnographic signals through the driver’s brain, using what is now known as NeuroSky (NeuroSky. NeuroSky is an EEG and ECG biosensor for consumer-facing, wearable technology products (https://neurosky.com/ accessed on 30 September 2022)).
3.2. Evaluation Metrics
To rank the quality of the proposed solutions, various metrics are used. The F1-Score is based on the metrics of Recall, Precision, F1-score, Accuracy, and Matthews Correlation Coefficient (MCC). The corresponding equations define the measurements from Equations (1)–(5) [37,38,39].
Where:
- (1)
- The number of sleepy states that were incorrectly labeled “normal” is shown in the false-negative column.
- (2)
- The True Positive metric indicates the percentage of drowsy states that were accurately identified.
- (3)
- The True Negative () value indicates the proportion of false negatives correctly identified as false positives.
- (4)
- The number of times a normal status was mistakenly labeled as a drowsy status is shown in the false positive.
3.3. Hyperparameter Setting
The process of hyperparameter selection is carried out using a grid search algorithm for both machine learning and deep learning approaches to select the optimal values which achieve the maximum accuracy. Table 2 shows the hyperparameters which are set to the proposed methods. These hyperparameters are achieved with 100 iterations for each model.
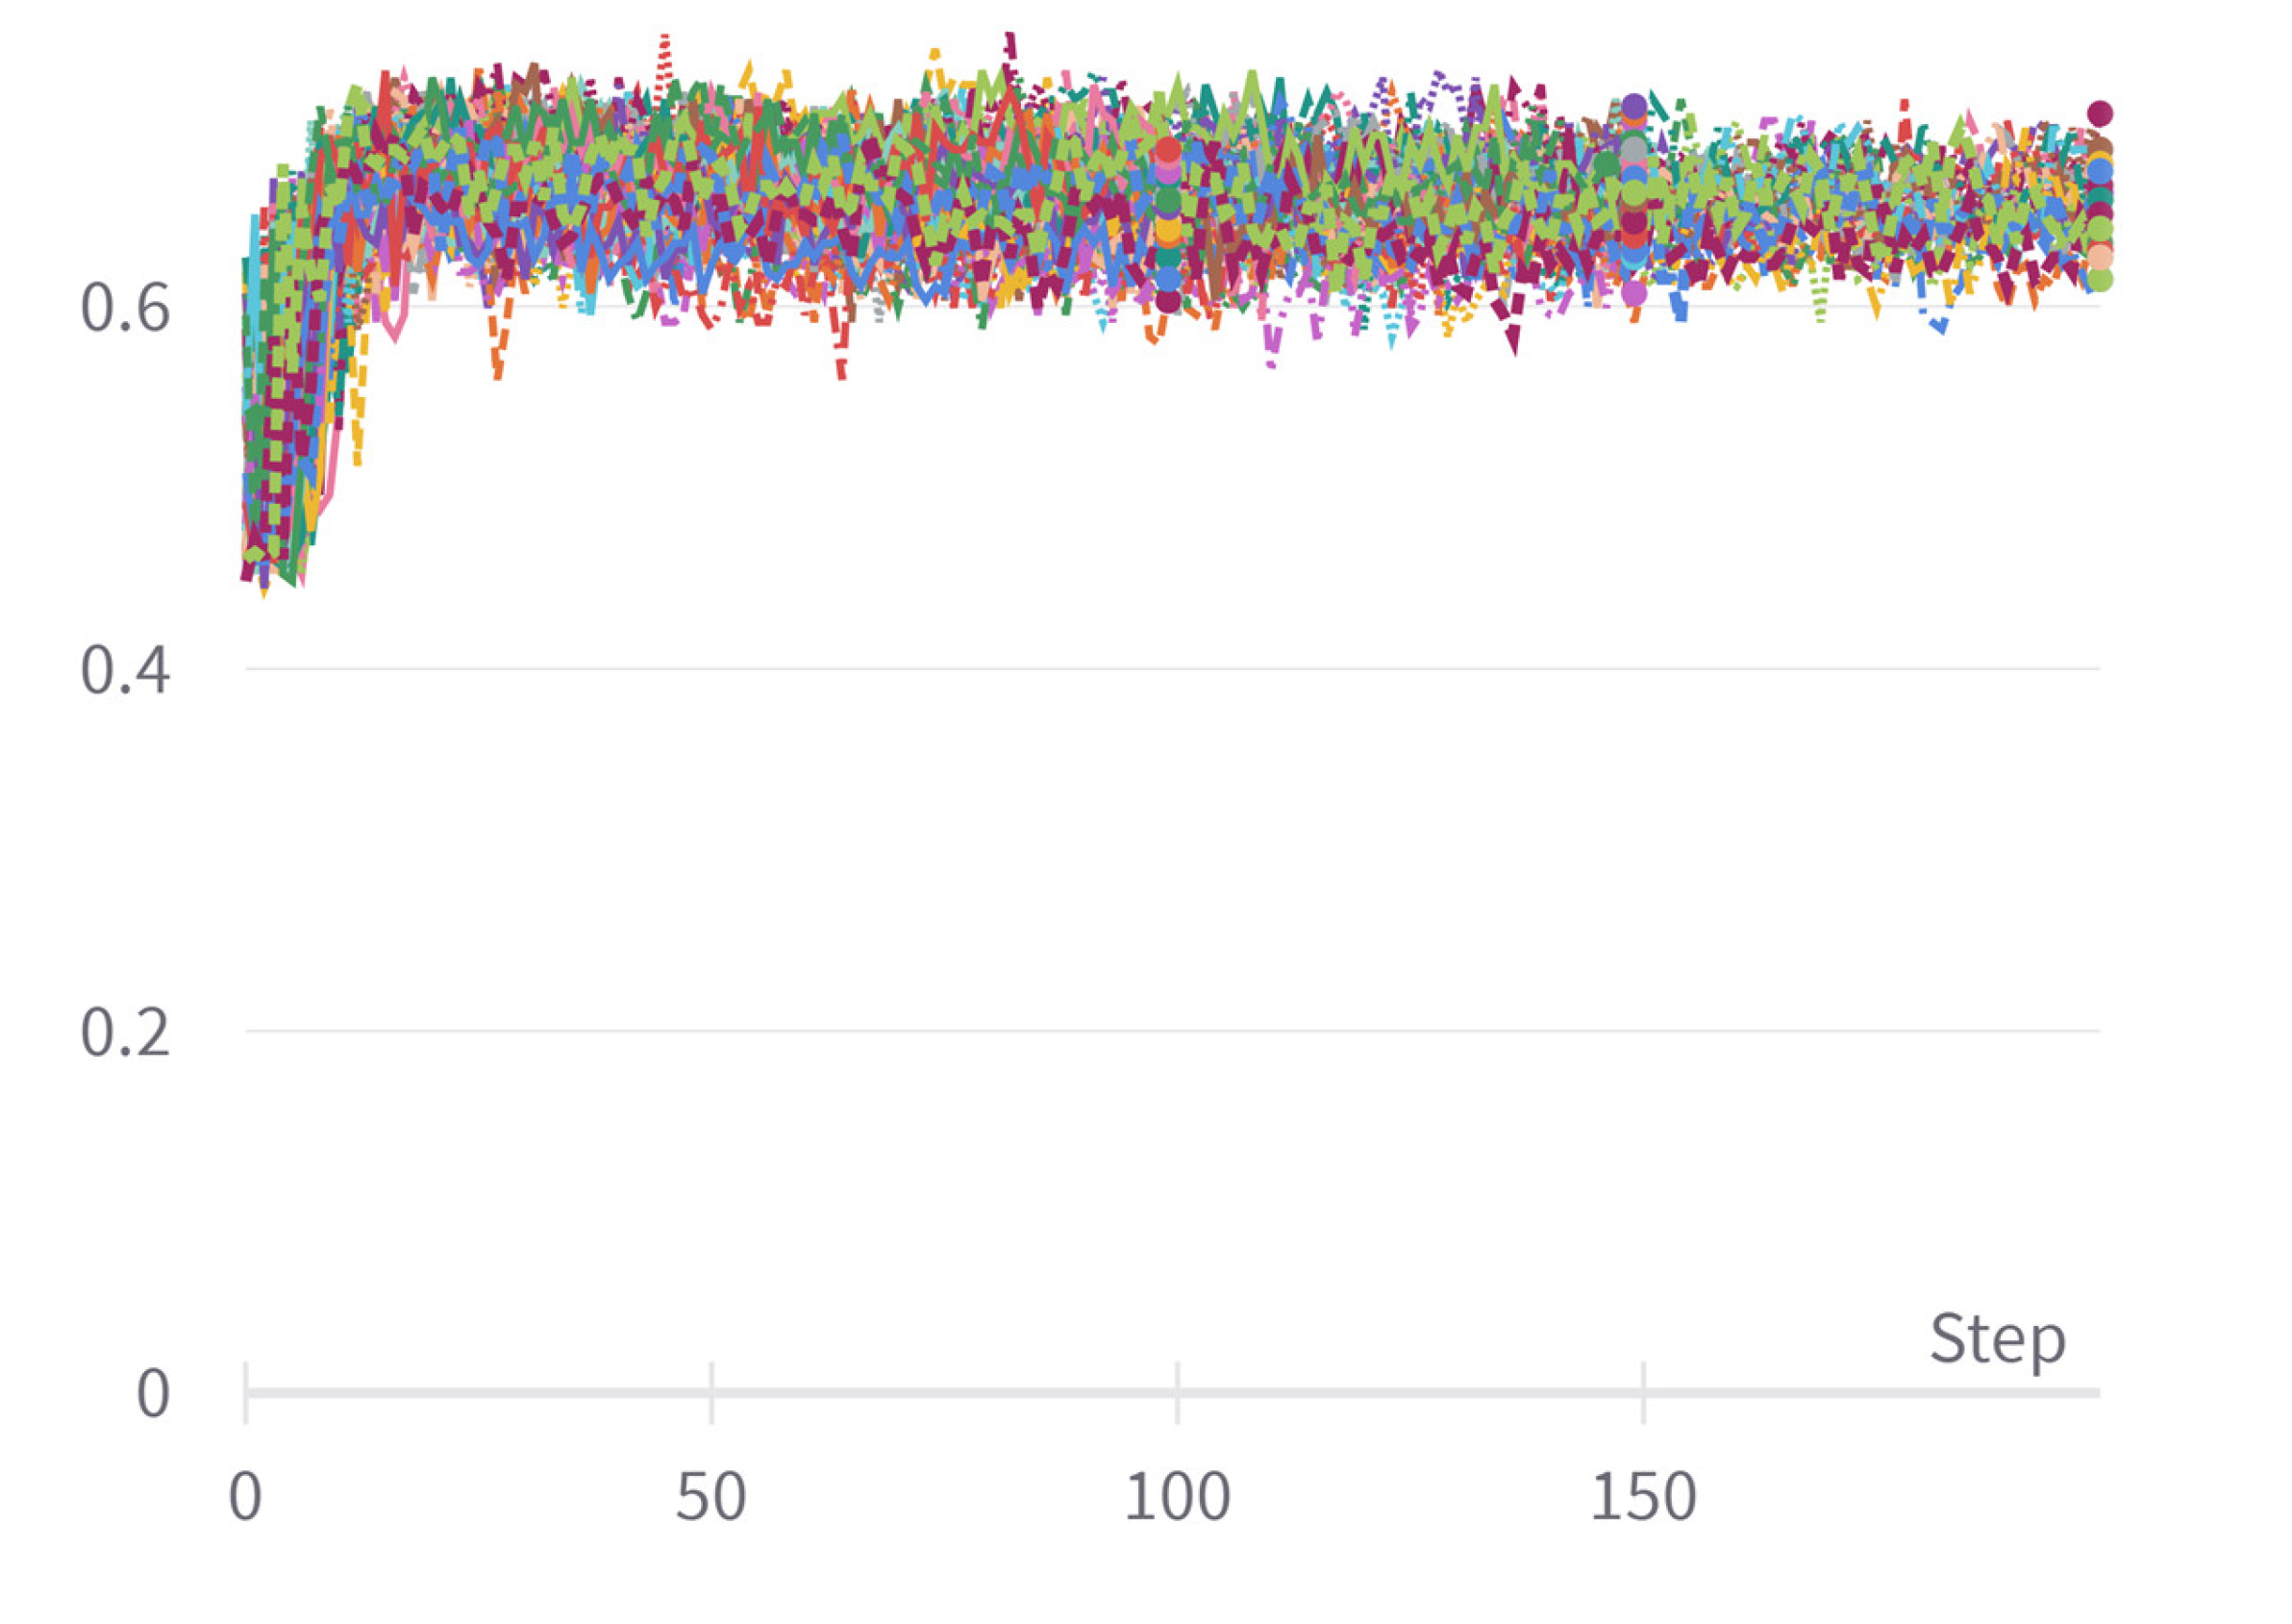
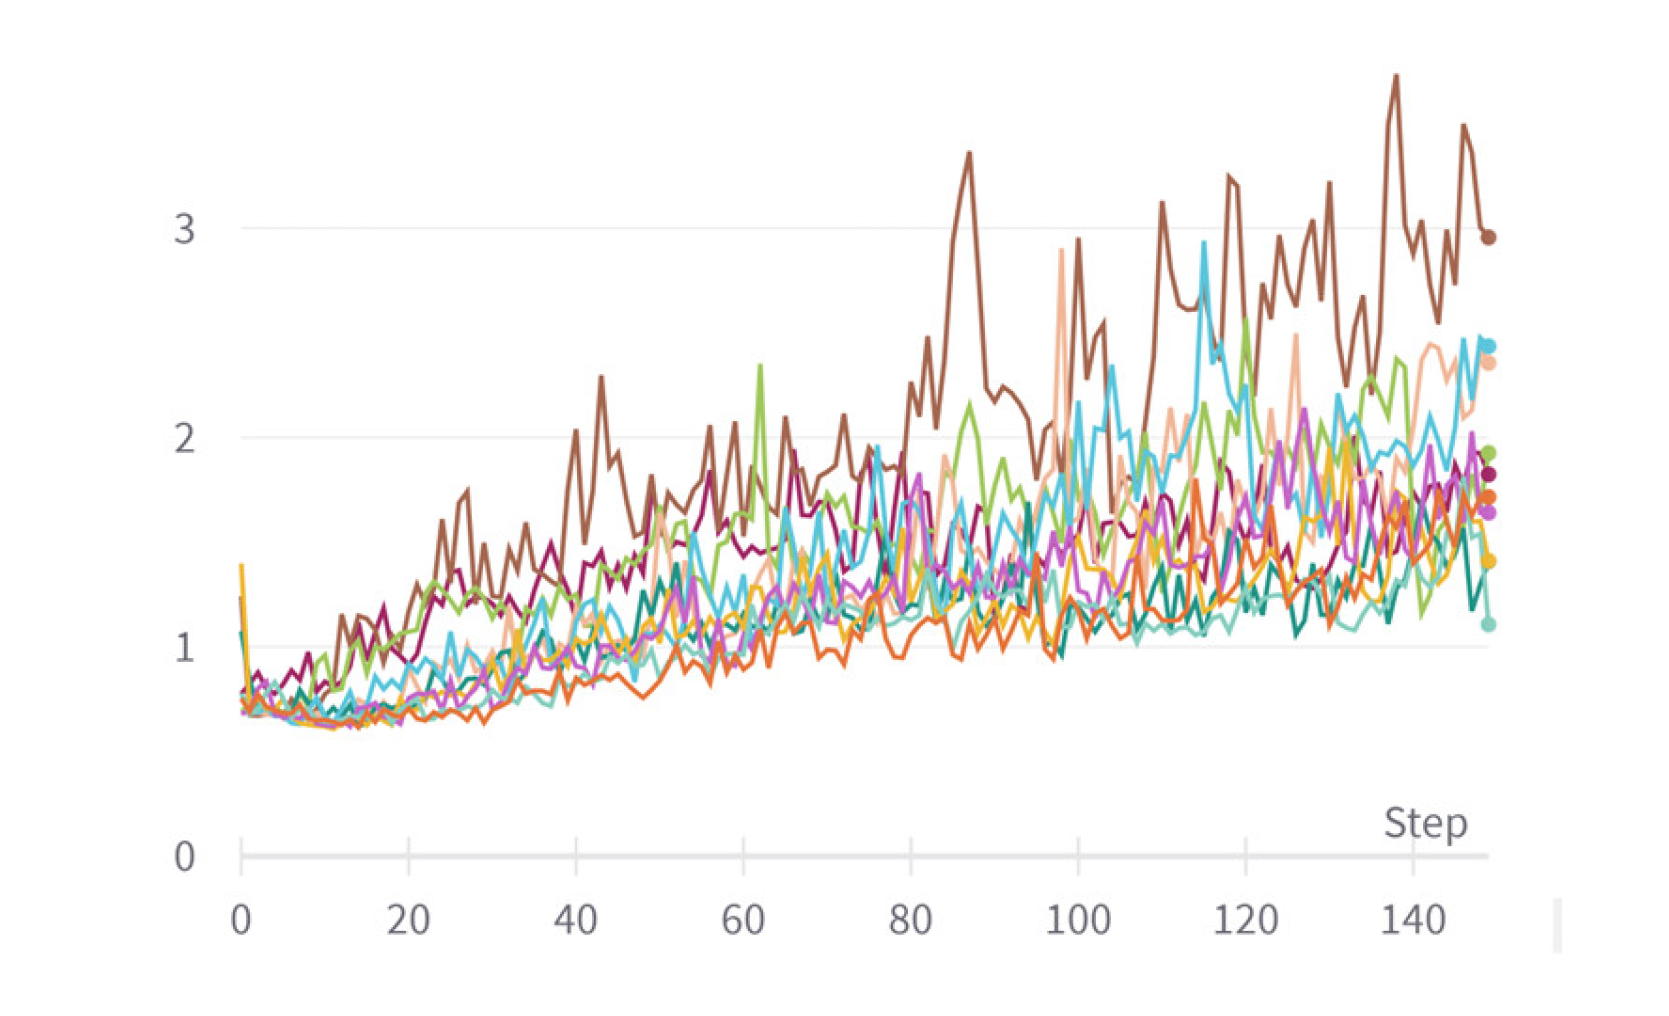
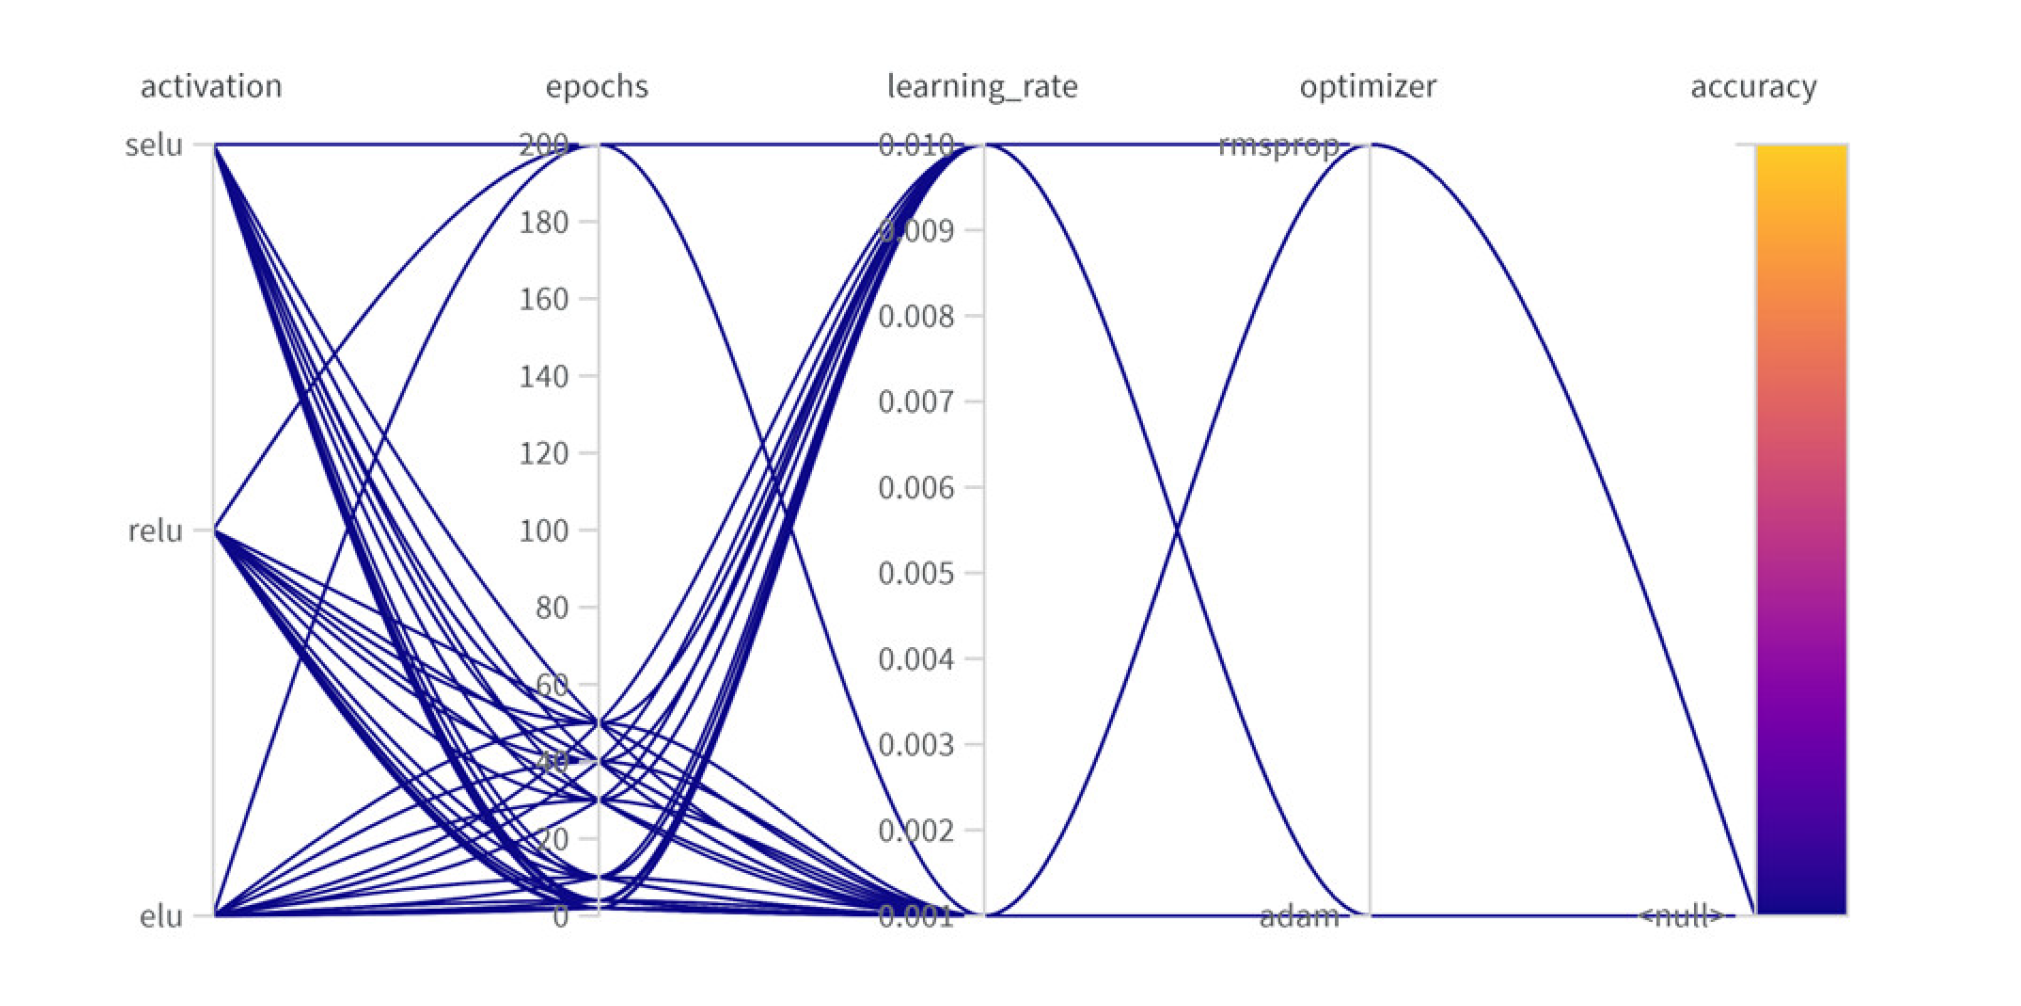
The strategy of hyperparameter selection is based on the permutations of model architecture and the training process. The model architecture trend comprises the values of filters of the convolutional layers, units of the dropout layers, and activation functions. The training process trend comprises the type of optimizer, learning rate, and number of epochs. Figure 6 and Figure 7 show samples of the learning curve for accuracy and loss which is obtained during the hyperparameter optimization. It can be observed that the performance of the model is enhanced through the runs due to the permutations of the hyperparamer values. In addition, Figure 8 shows an infograph of the accuracy with the variation of hyperparameter values. Moreover, Table 1 illustrates some iterations for the hyperparamer optimization for the deep learning model. Table 2 illustrates the selected hyperparameters for the proposed methods.
3.4. Simulation Results
This section discusses the simulation results of the proposed methods for different feature extractions and classification techniques. The strategy to propose an efficient system comprises the selection of a strong feature extraction technique, then the selection of an efficient classification method. This paper selects the feature extraction technique among DWT, FFT, DWT with FFT, DCT, DCT with DWT, DST, and DST with DWT. This variety of feature extraction methods provides an extensive study to achieve the optimal one. In addition, these techniques are evaluated prior to precision, recall, F1-score, and accuracy using the proposed classification techniques. Table 3, Table 4, Table 5 and Table 6 illustrates the evaluation metrics of the feature extraction techniques through the employment of the proposed classification methods. The simulation results reveal that FFT with DWT achieves the optimal performance among the presented methods.
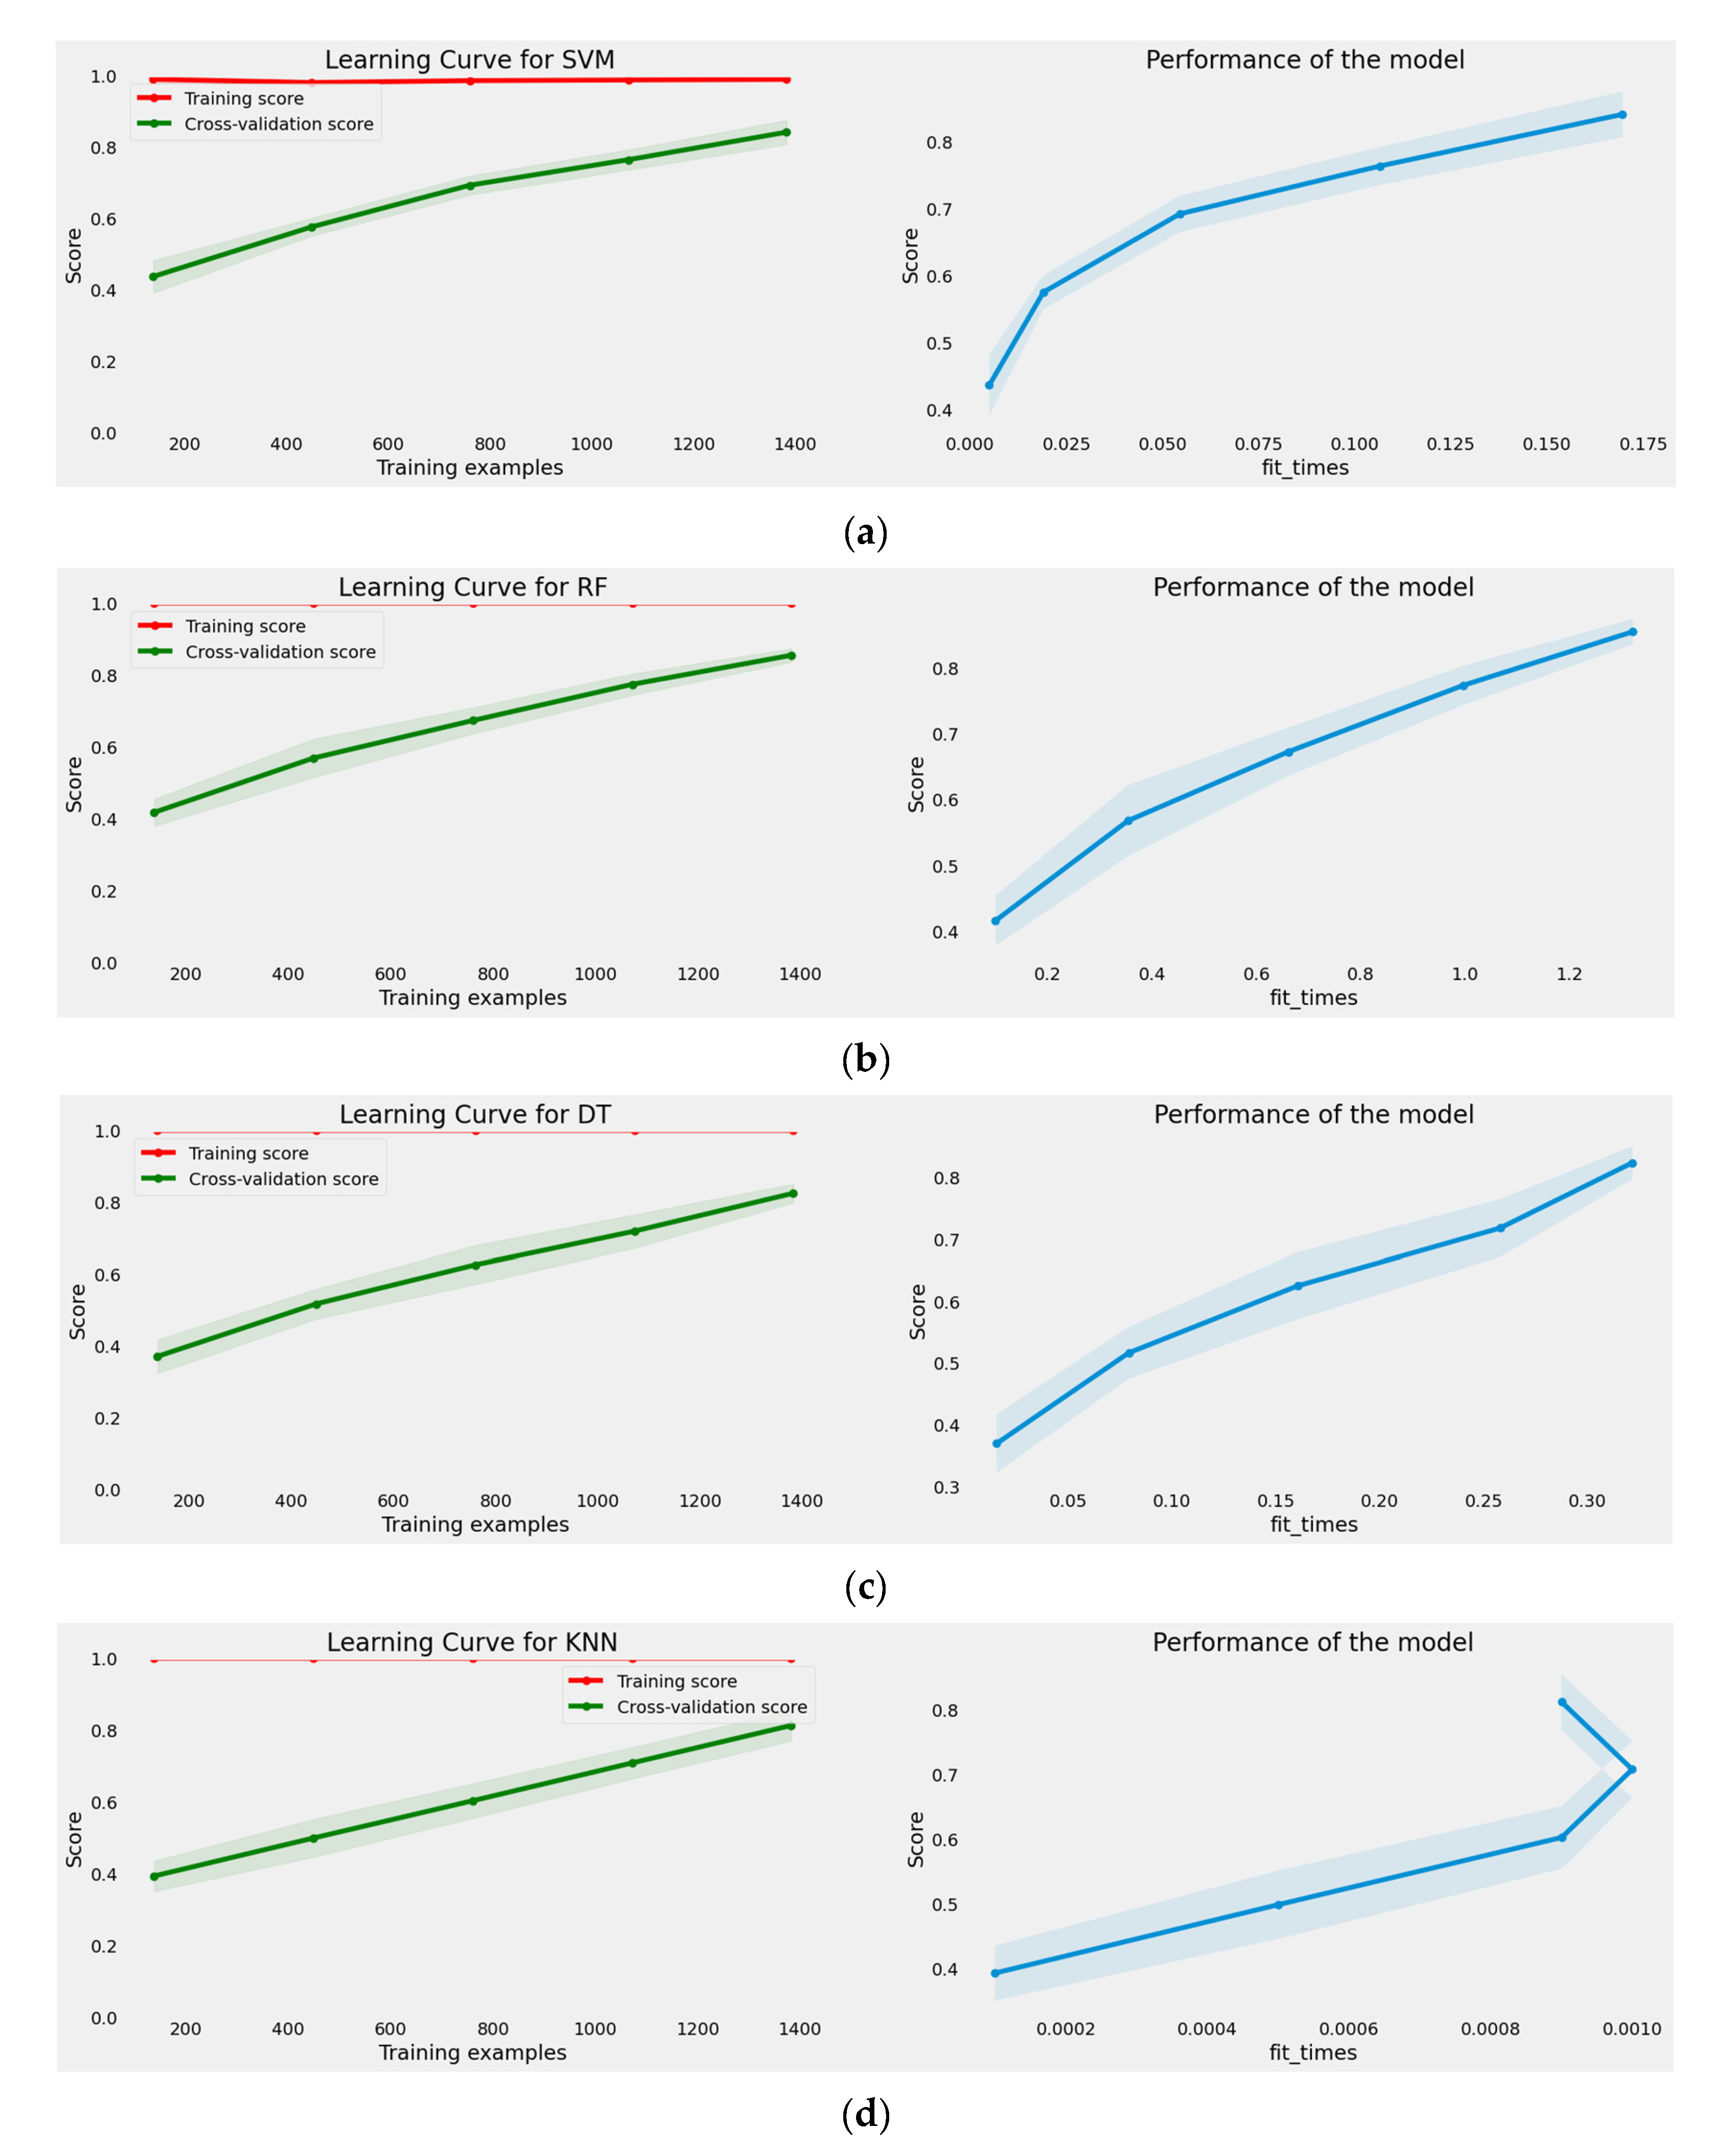
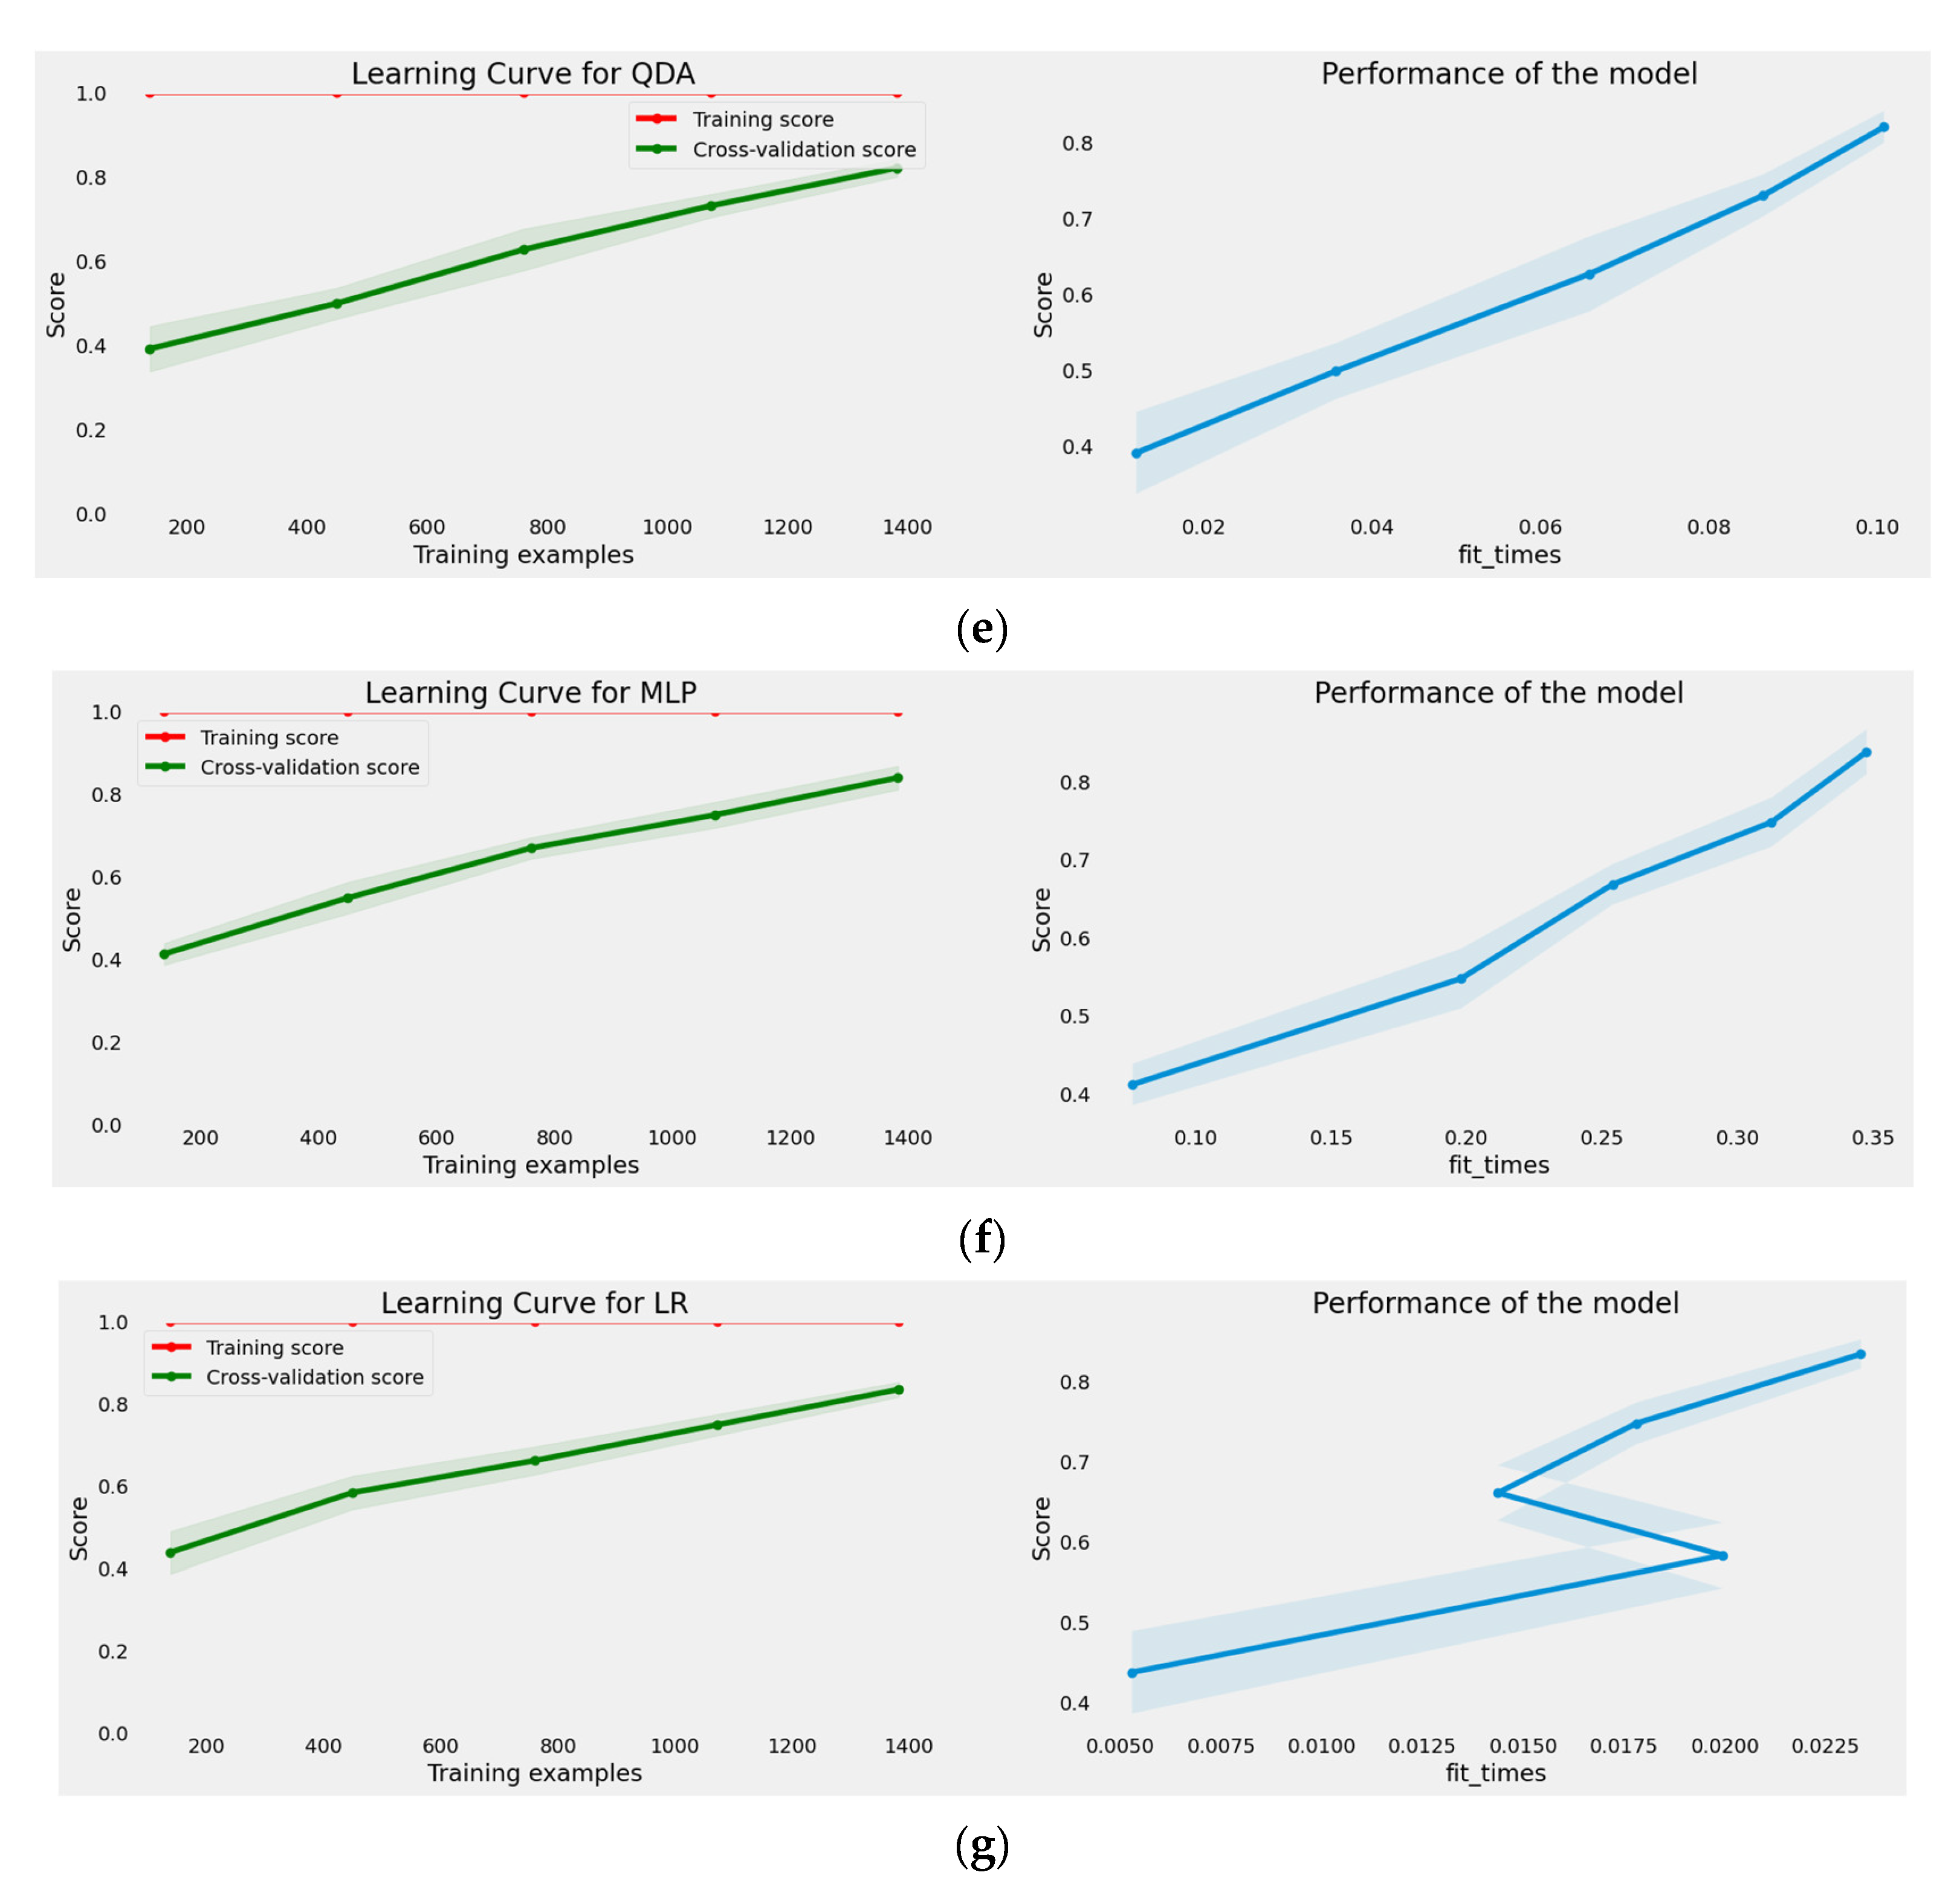
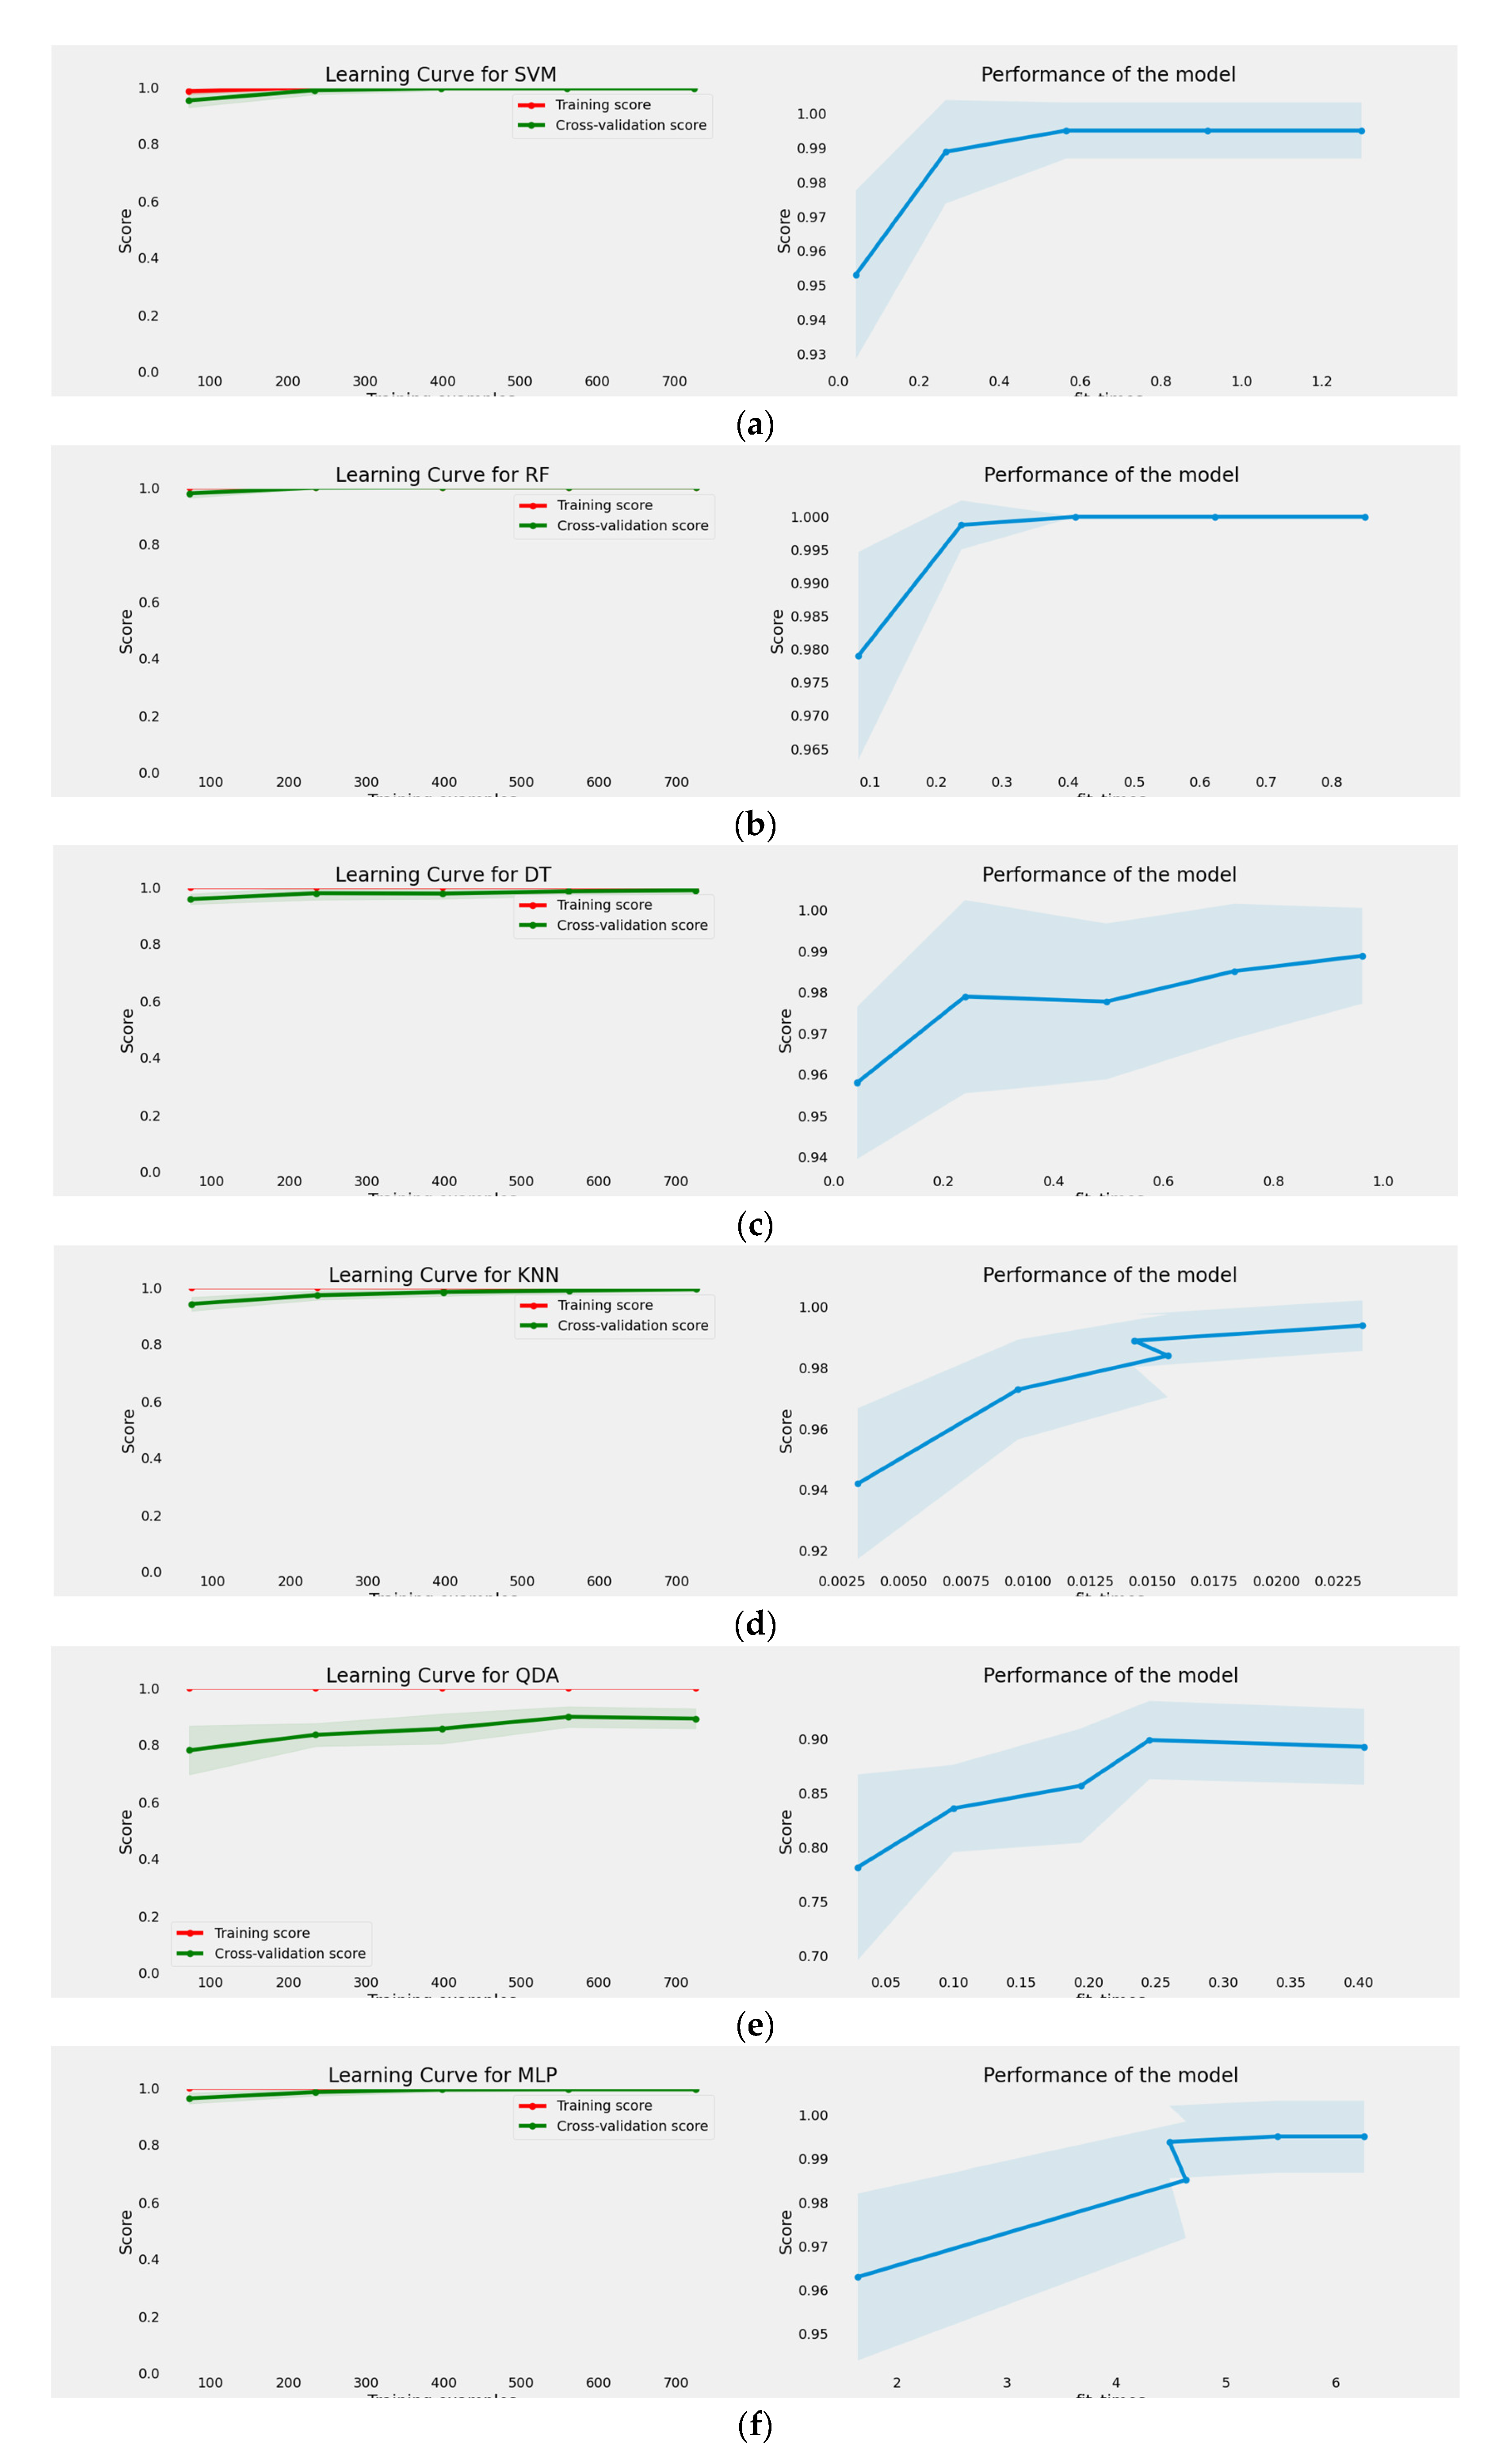
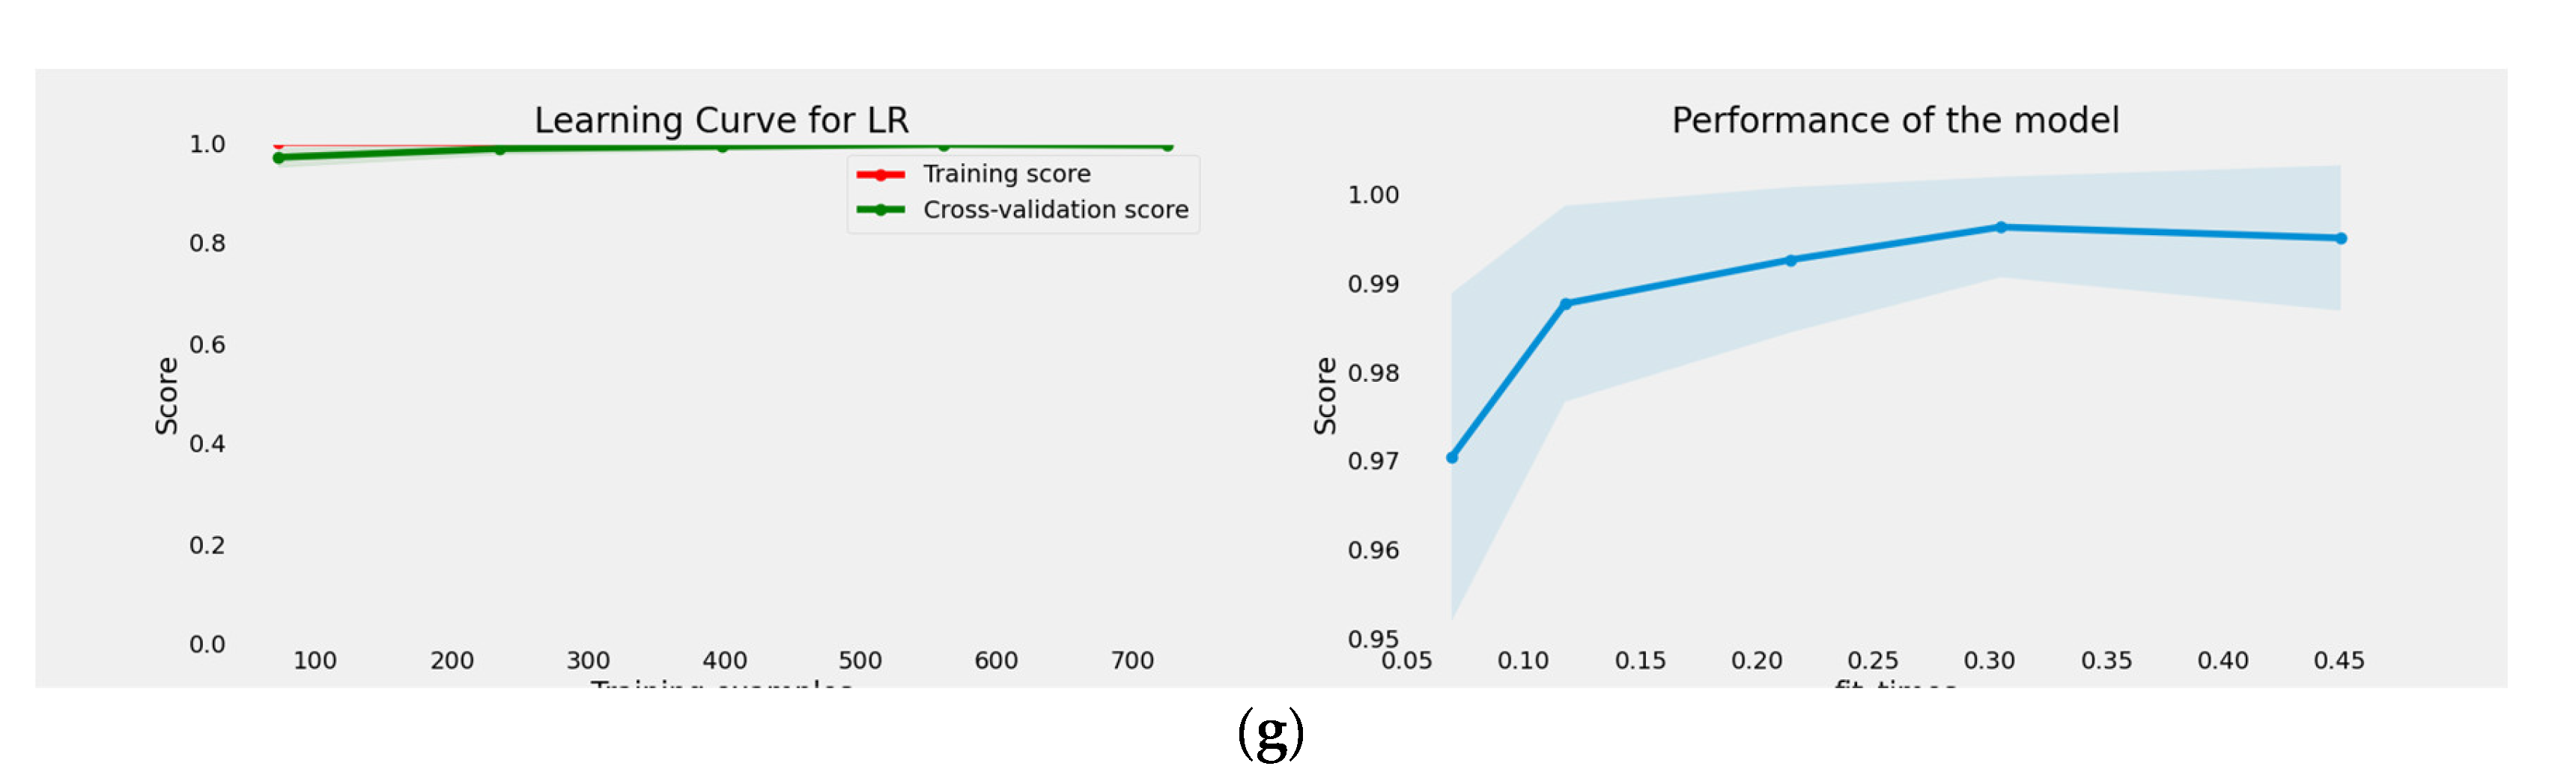
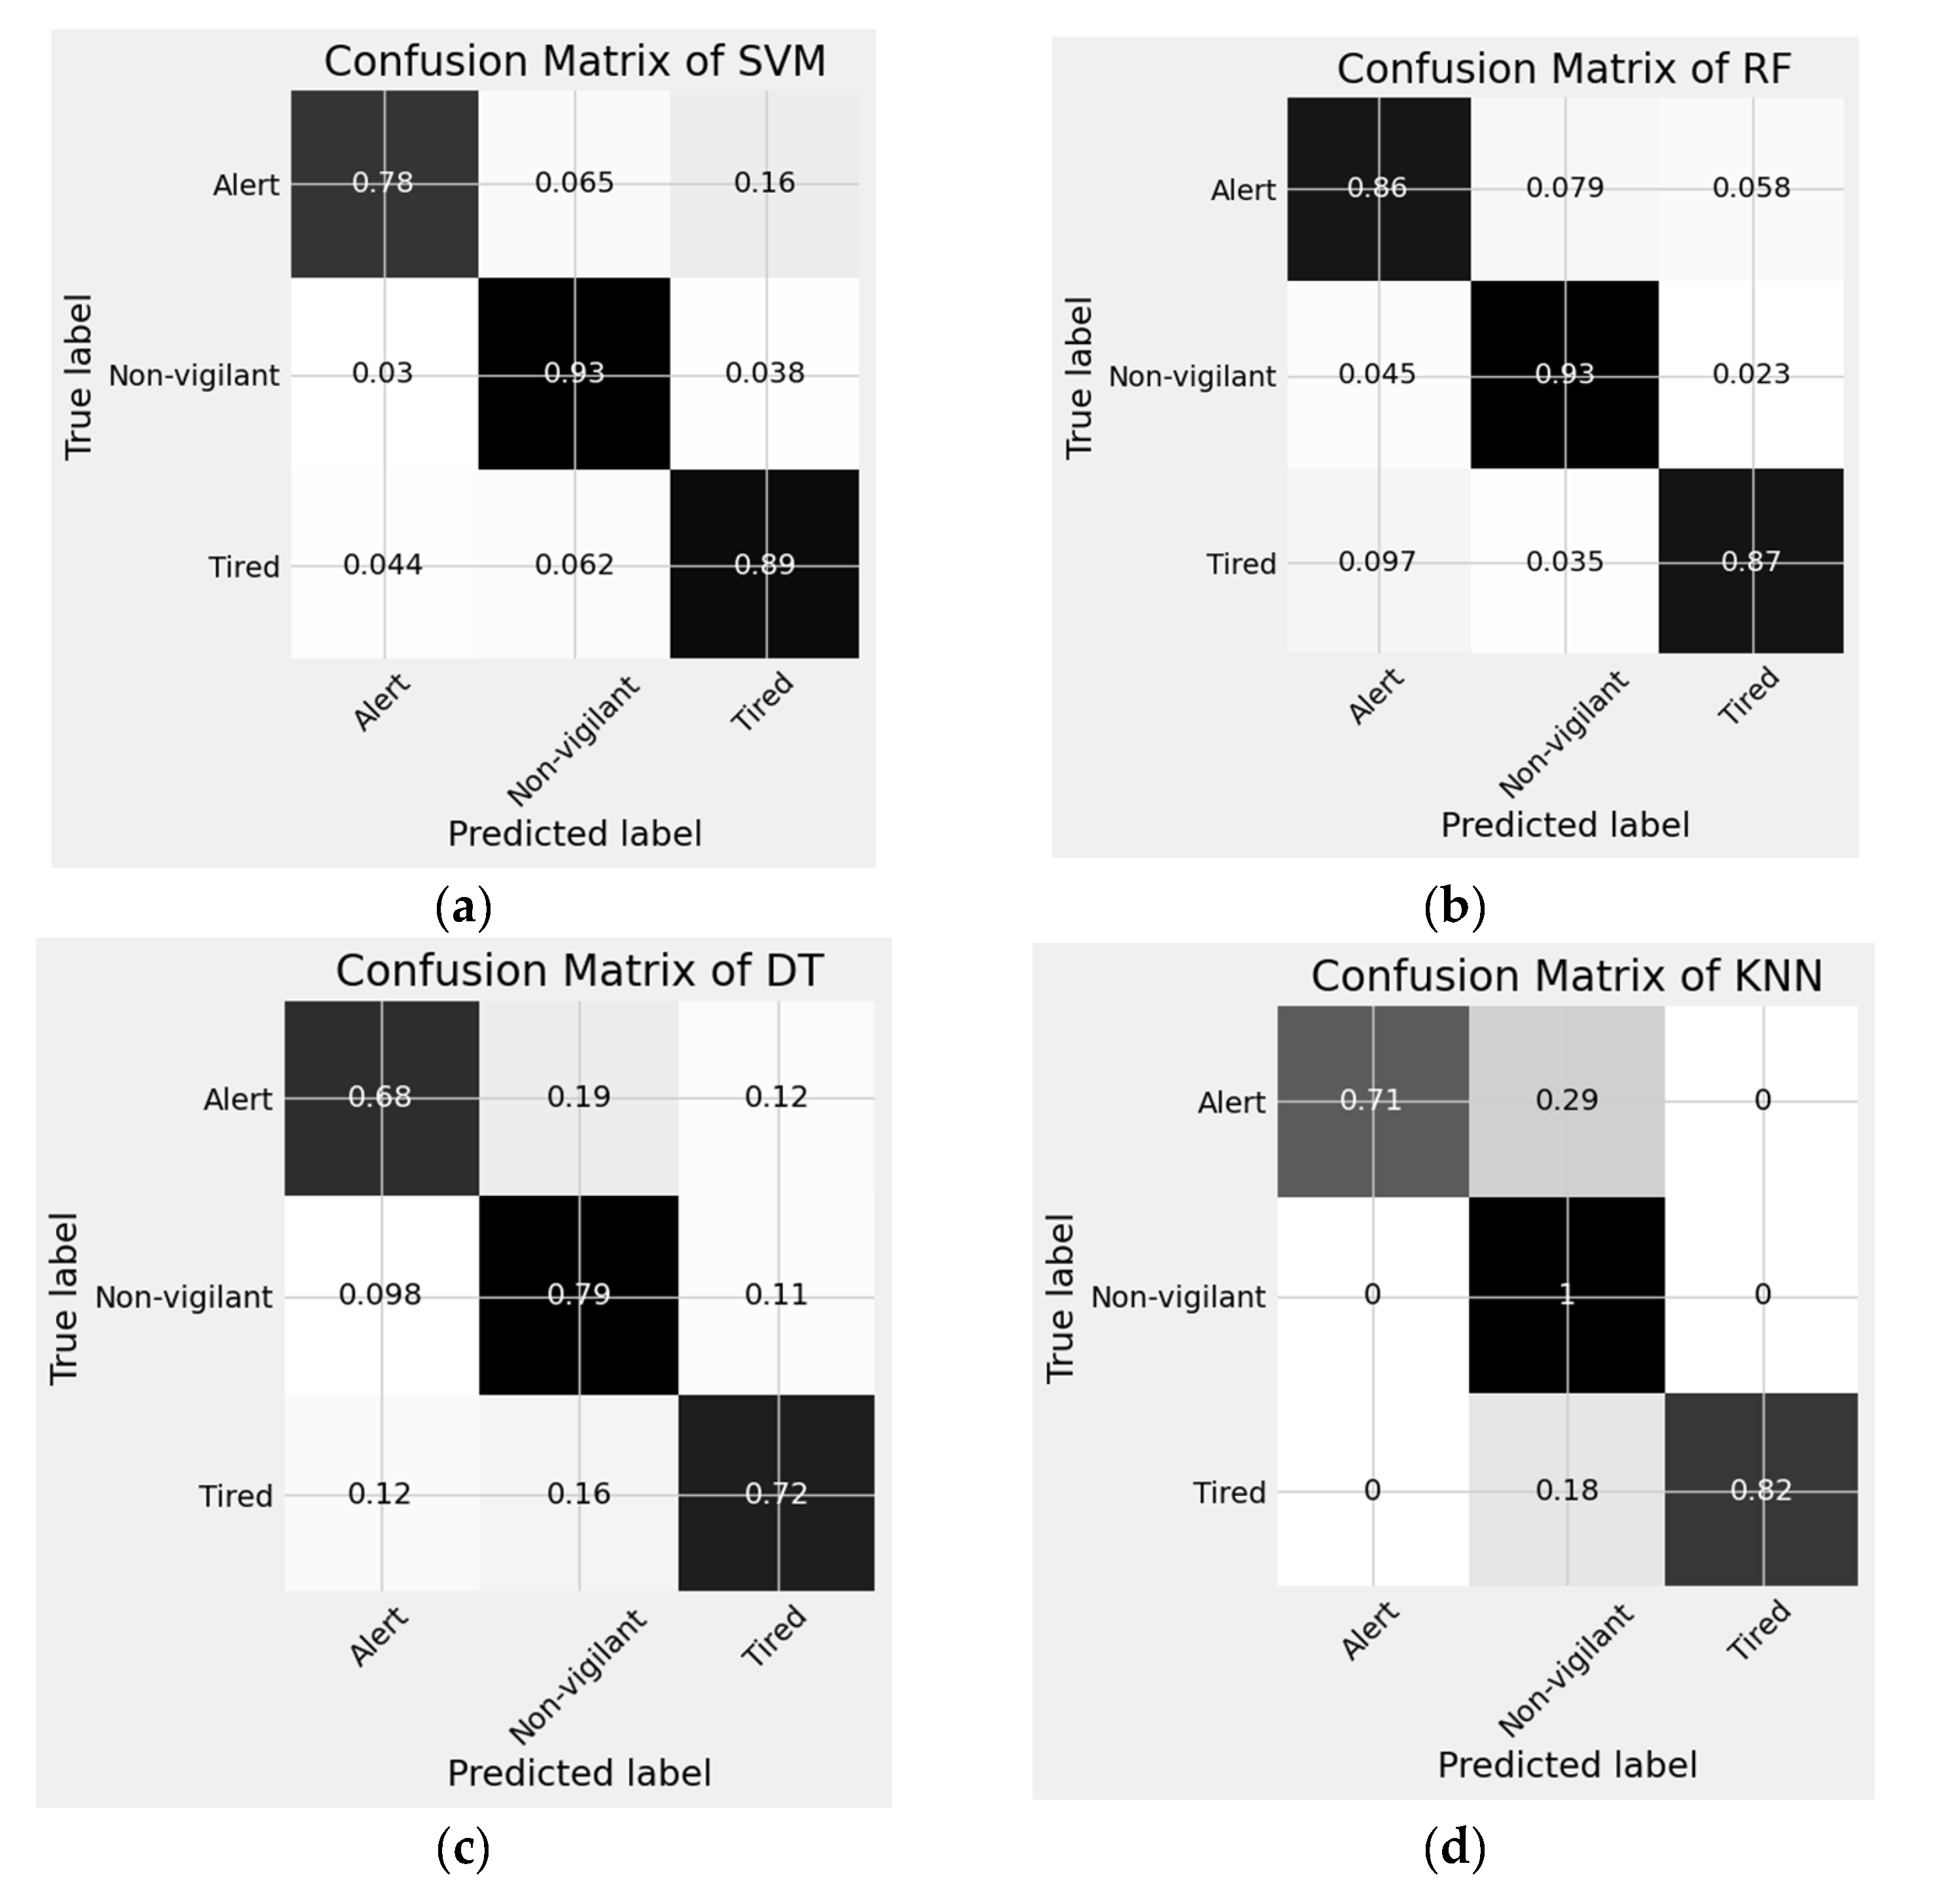
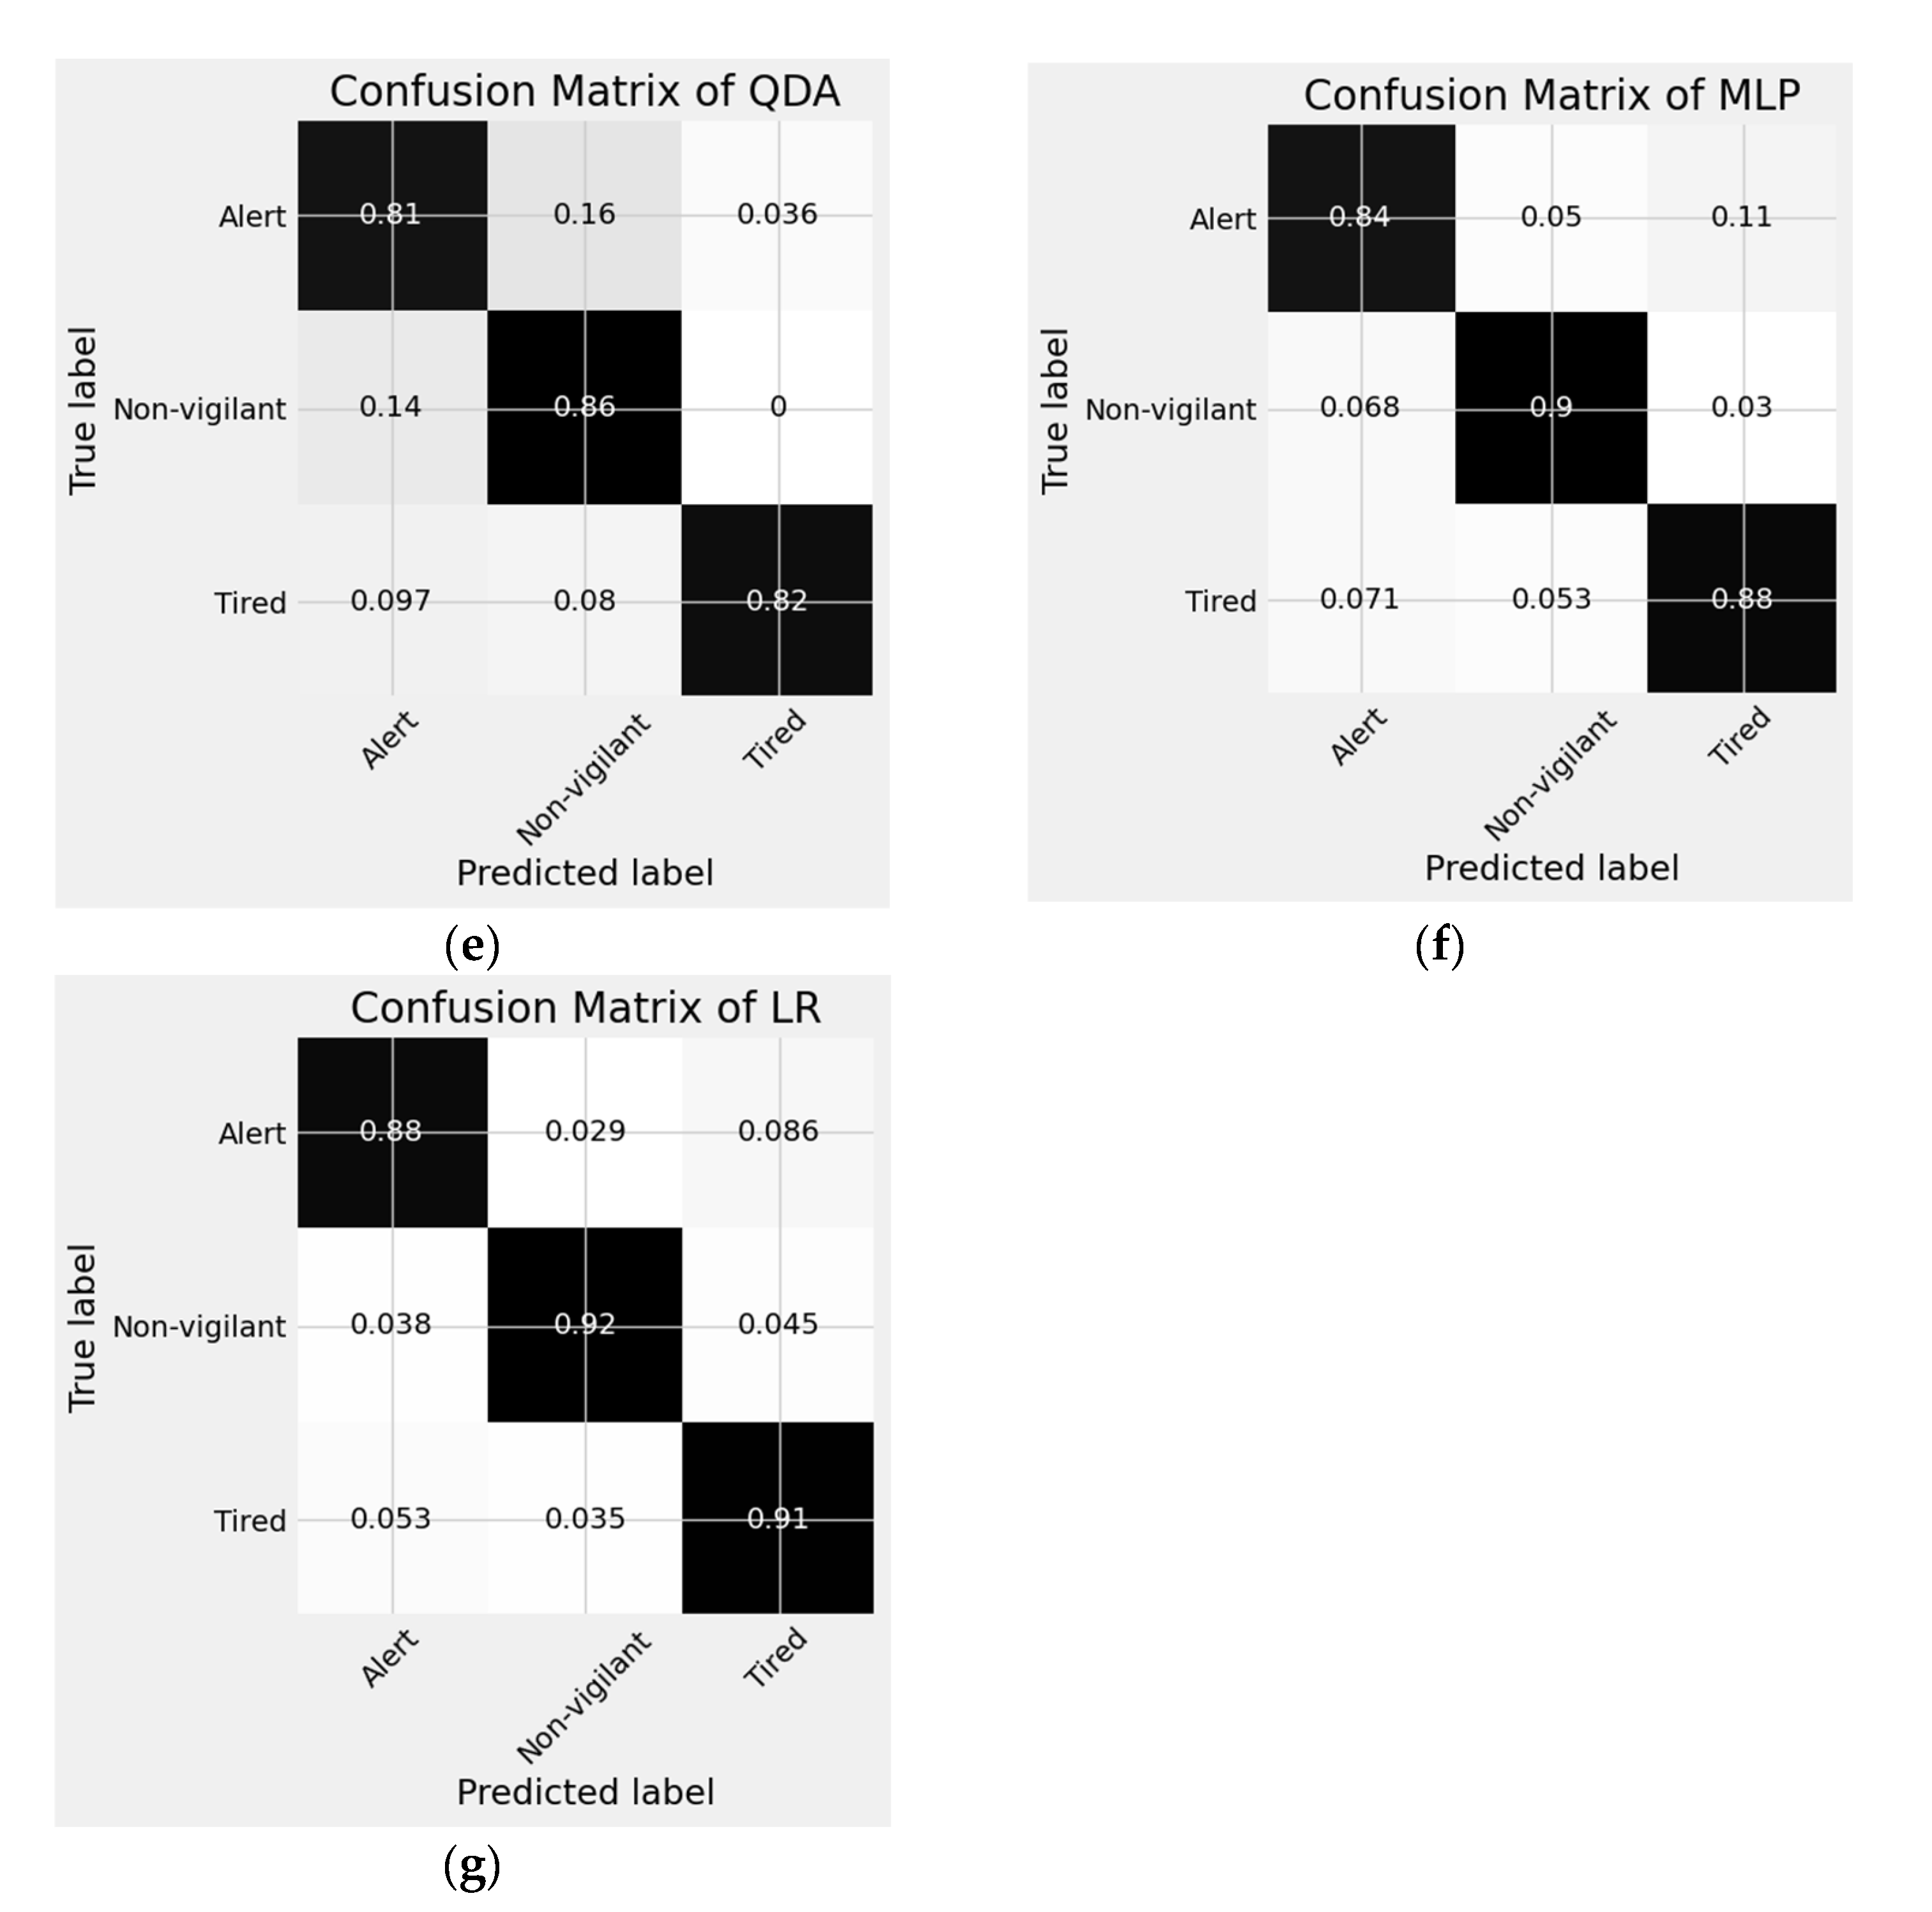
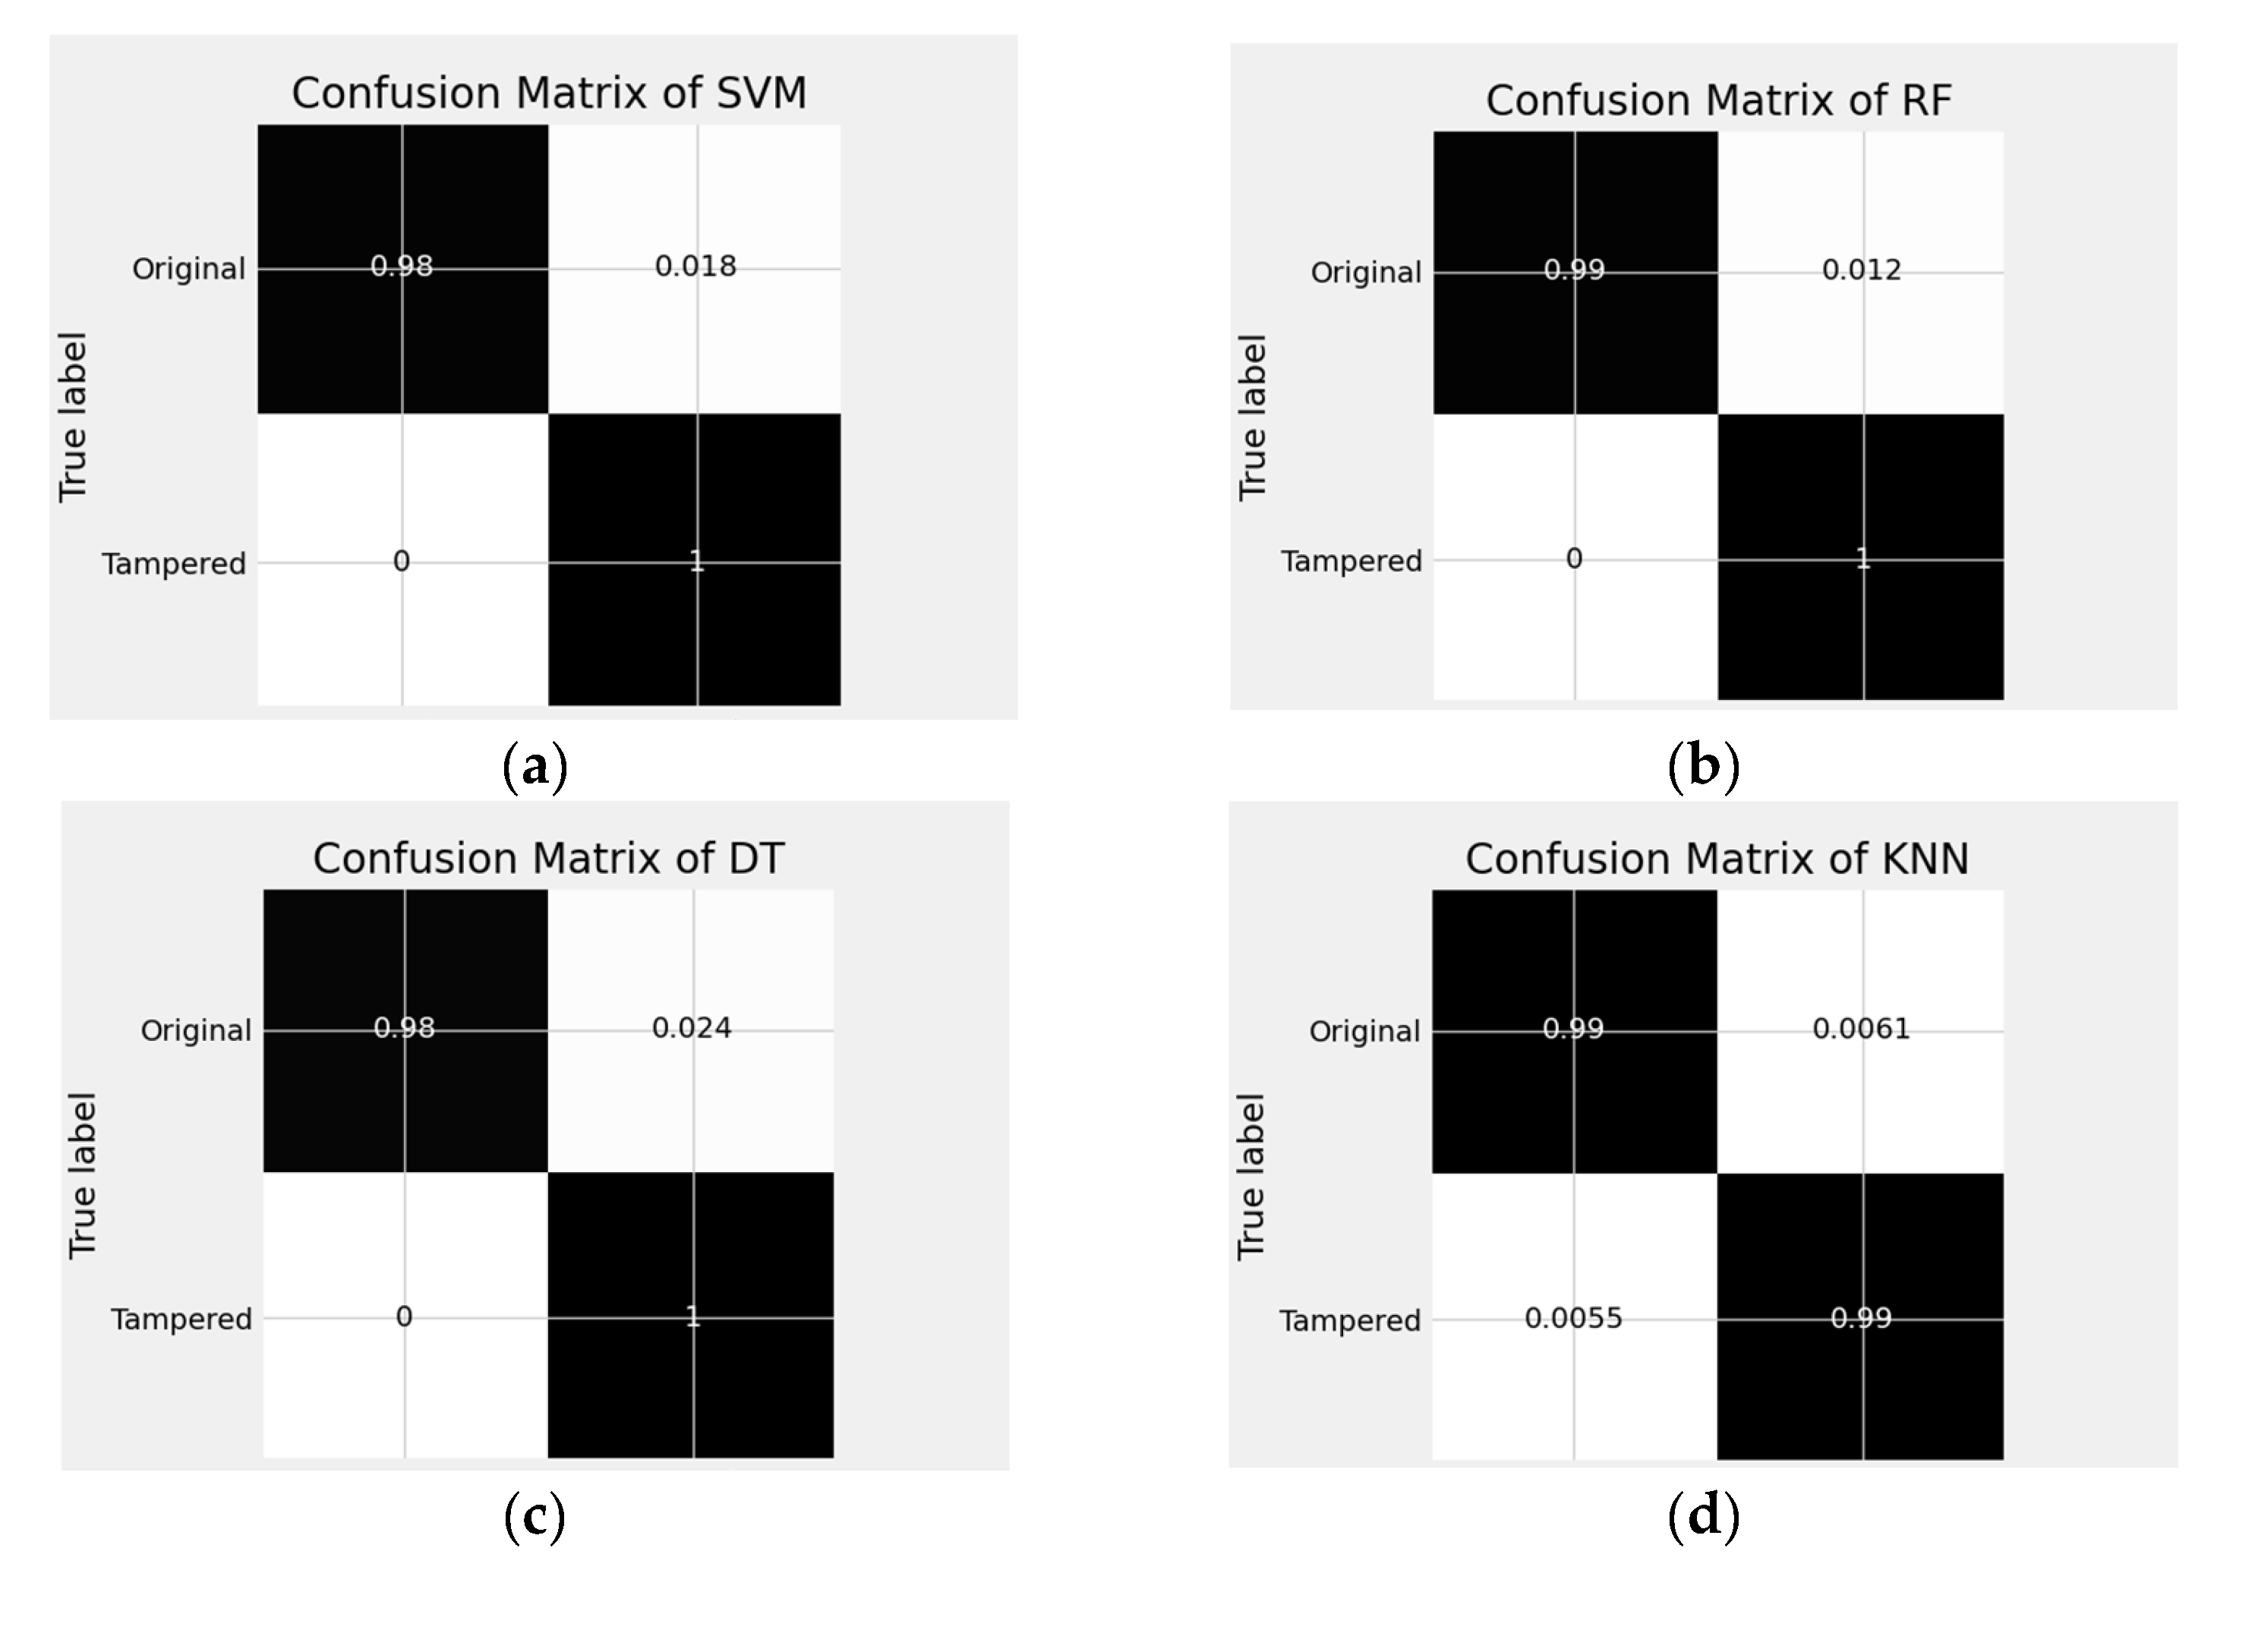
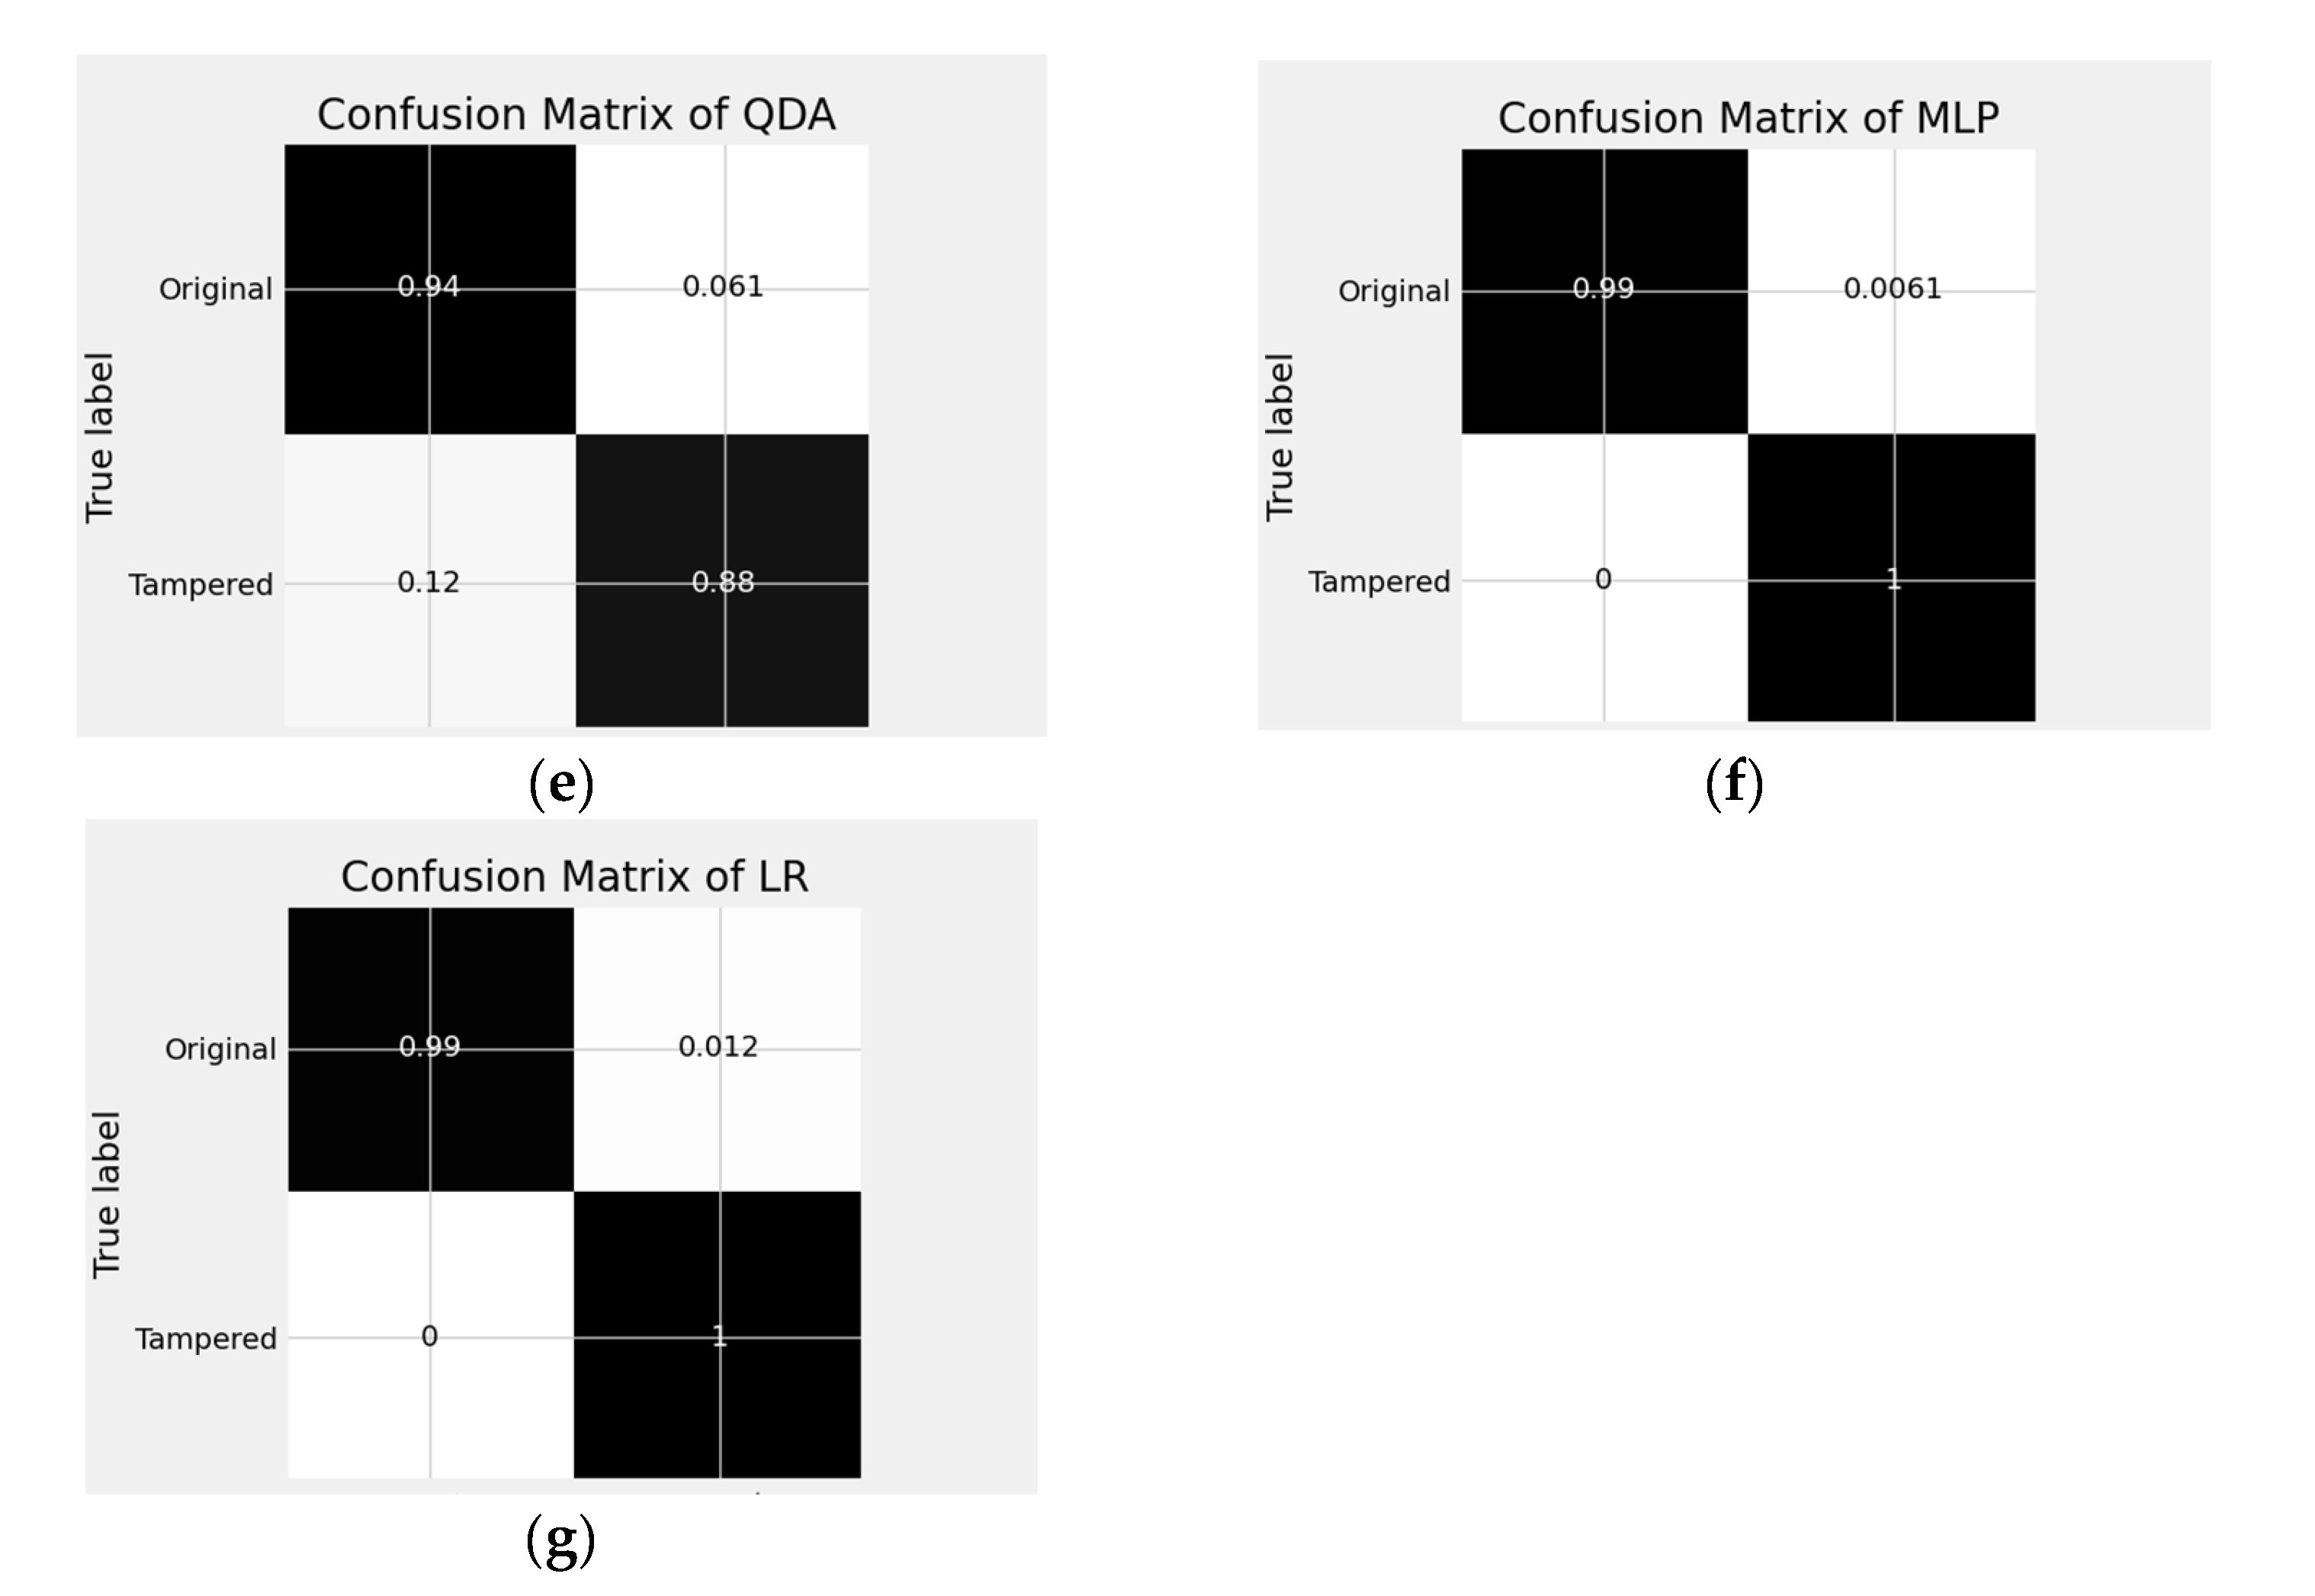
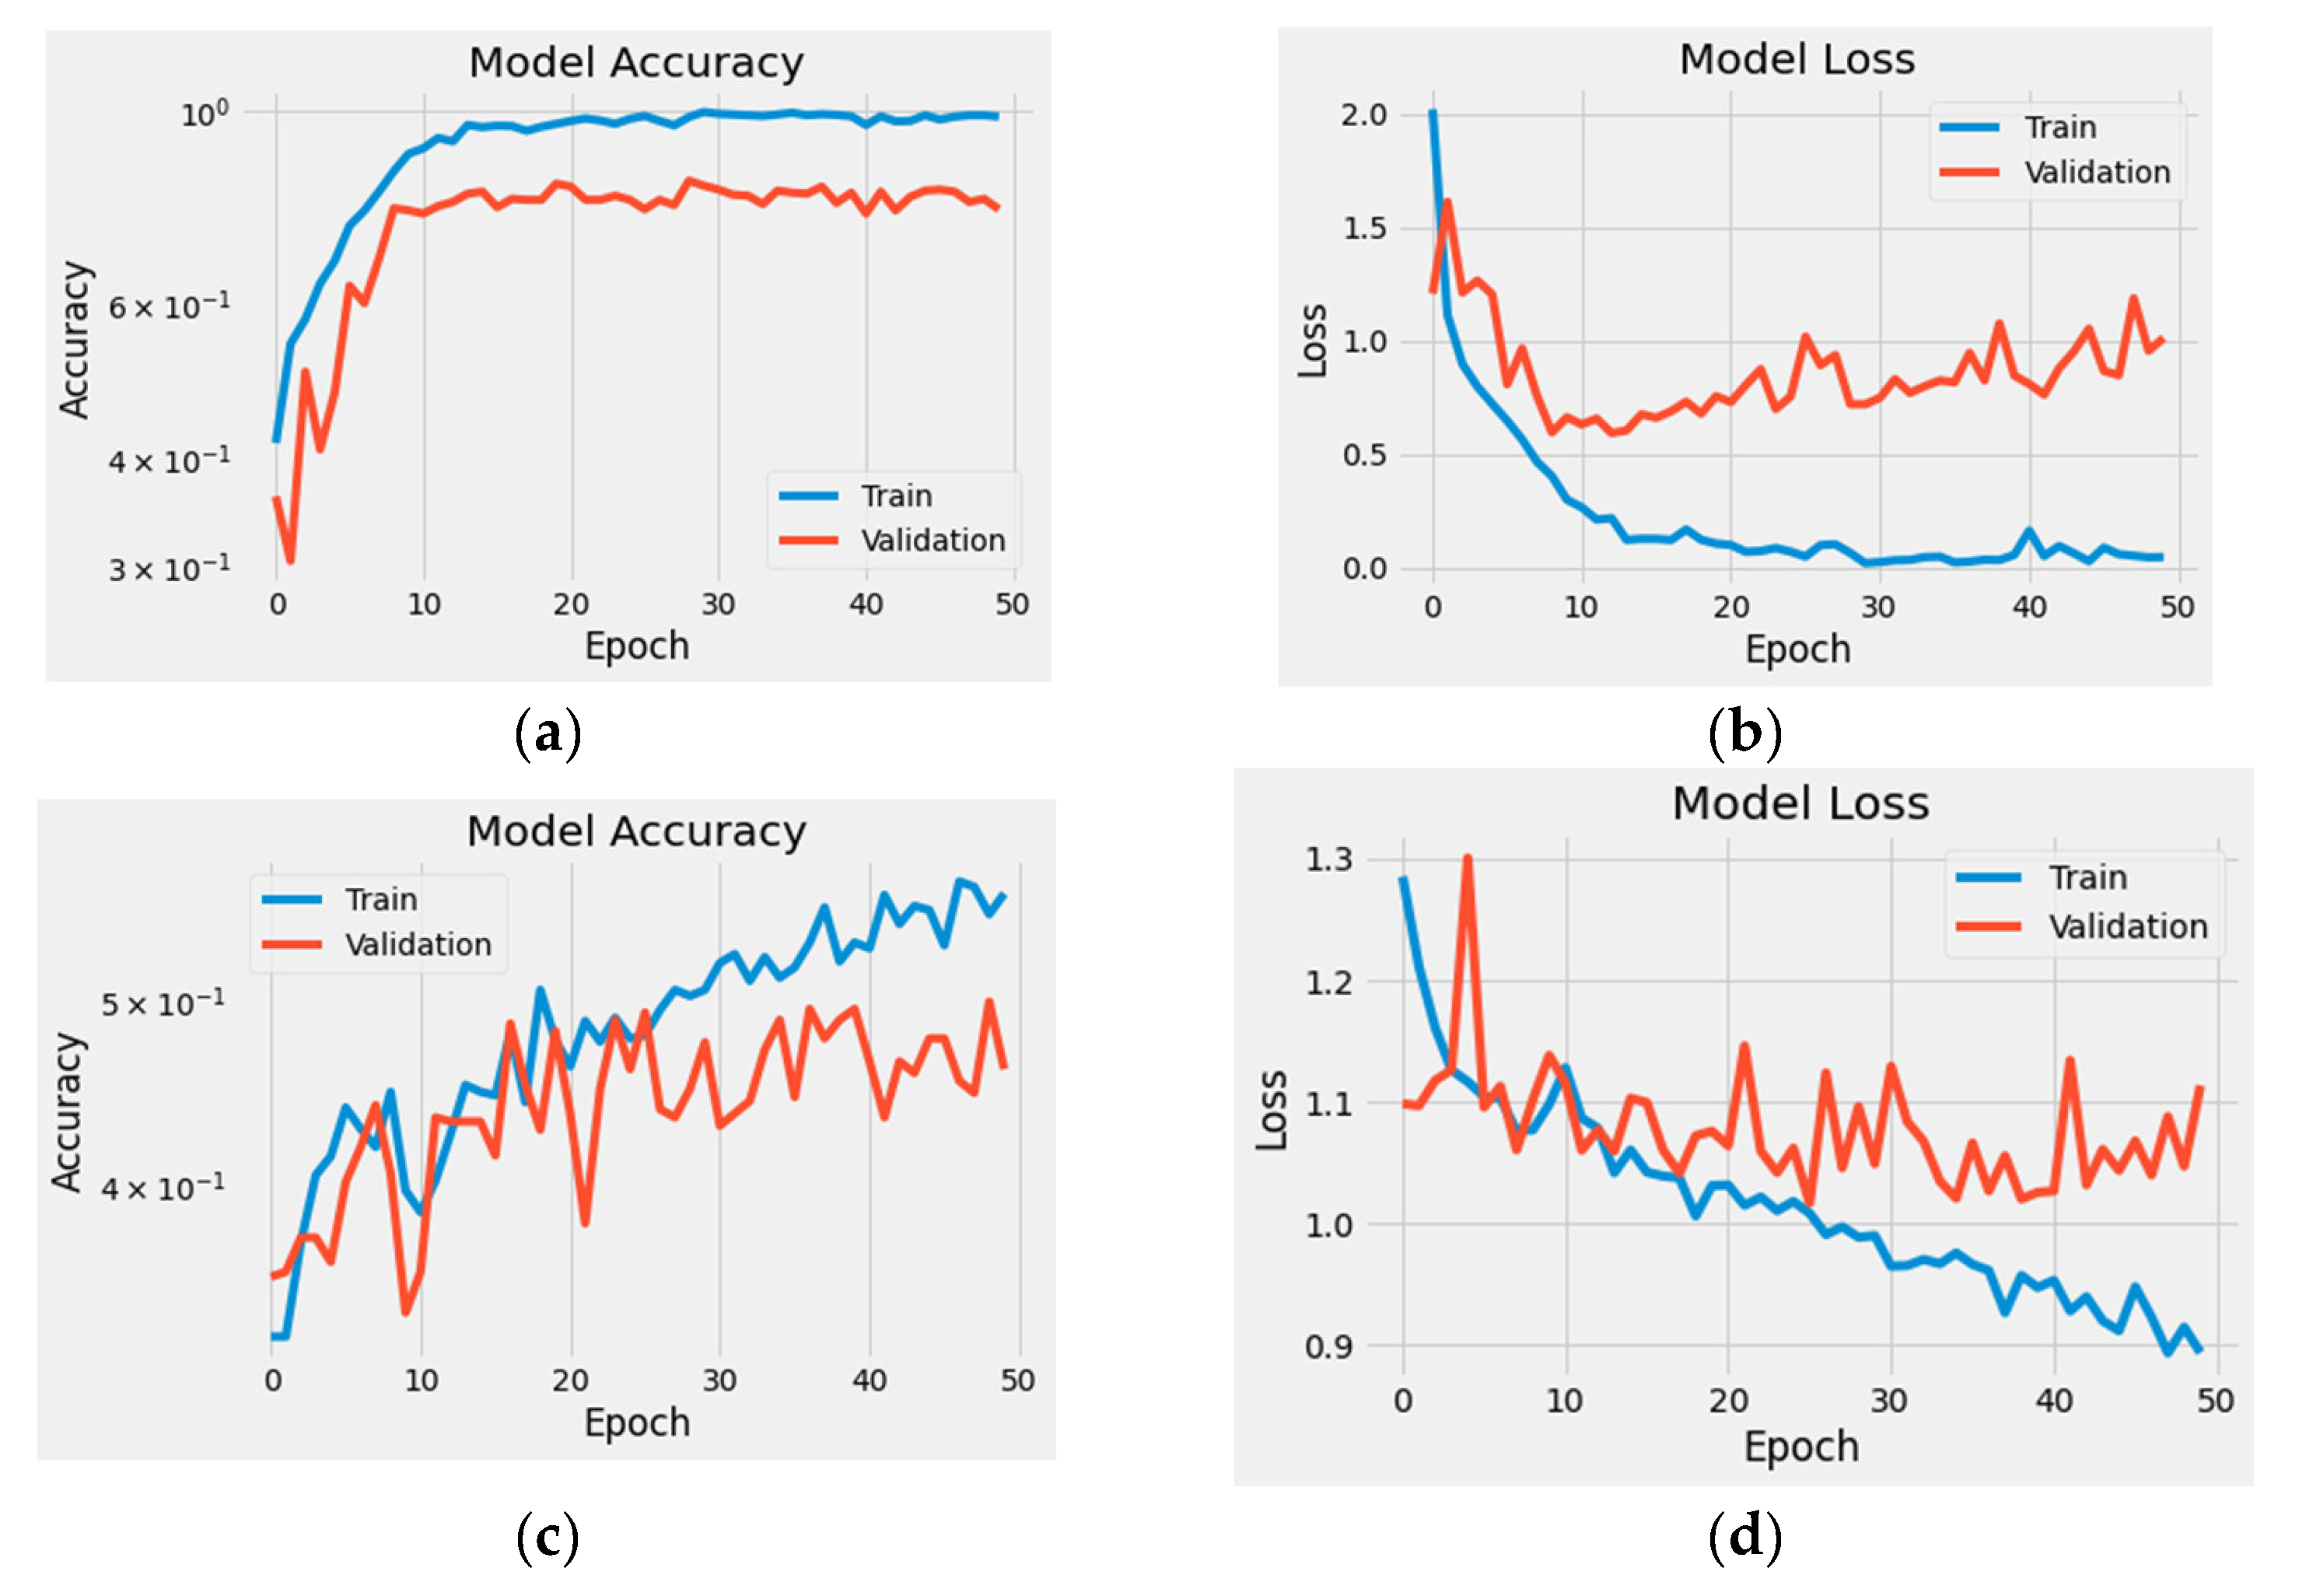
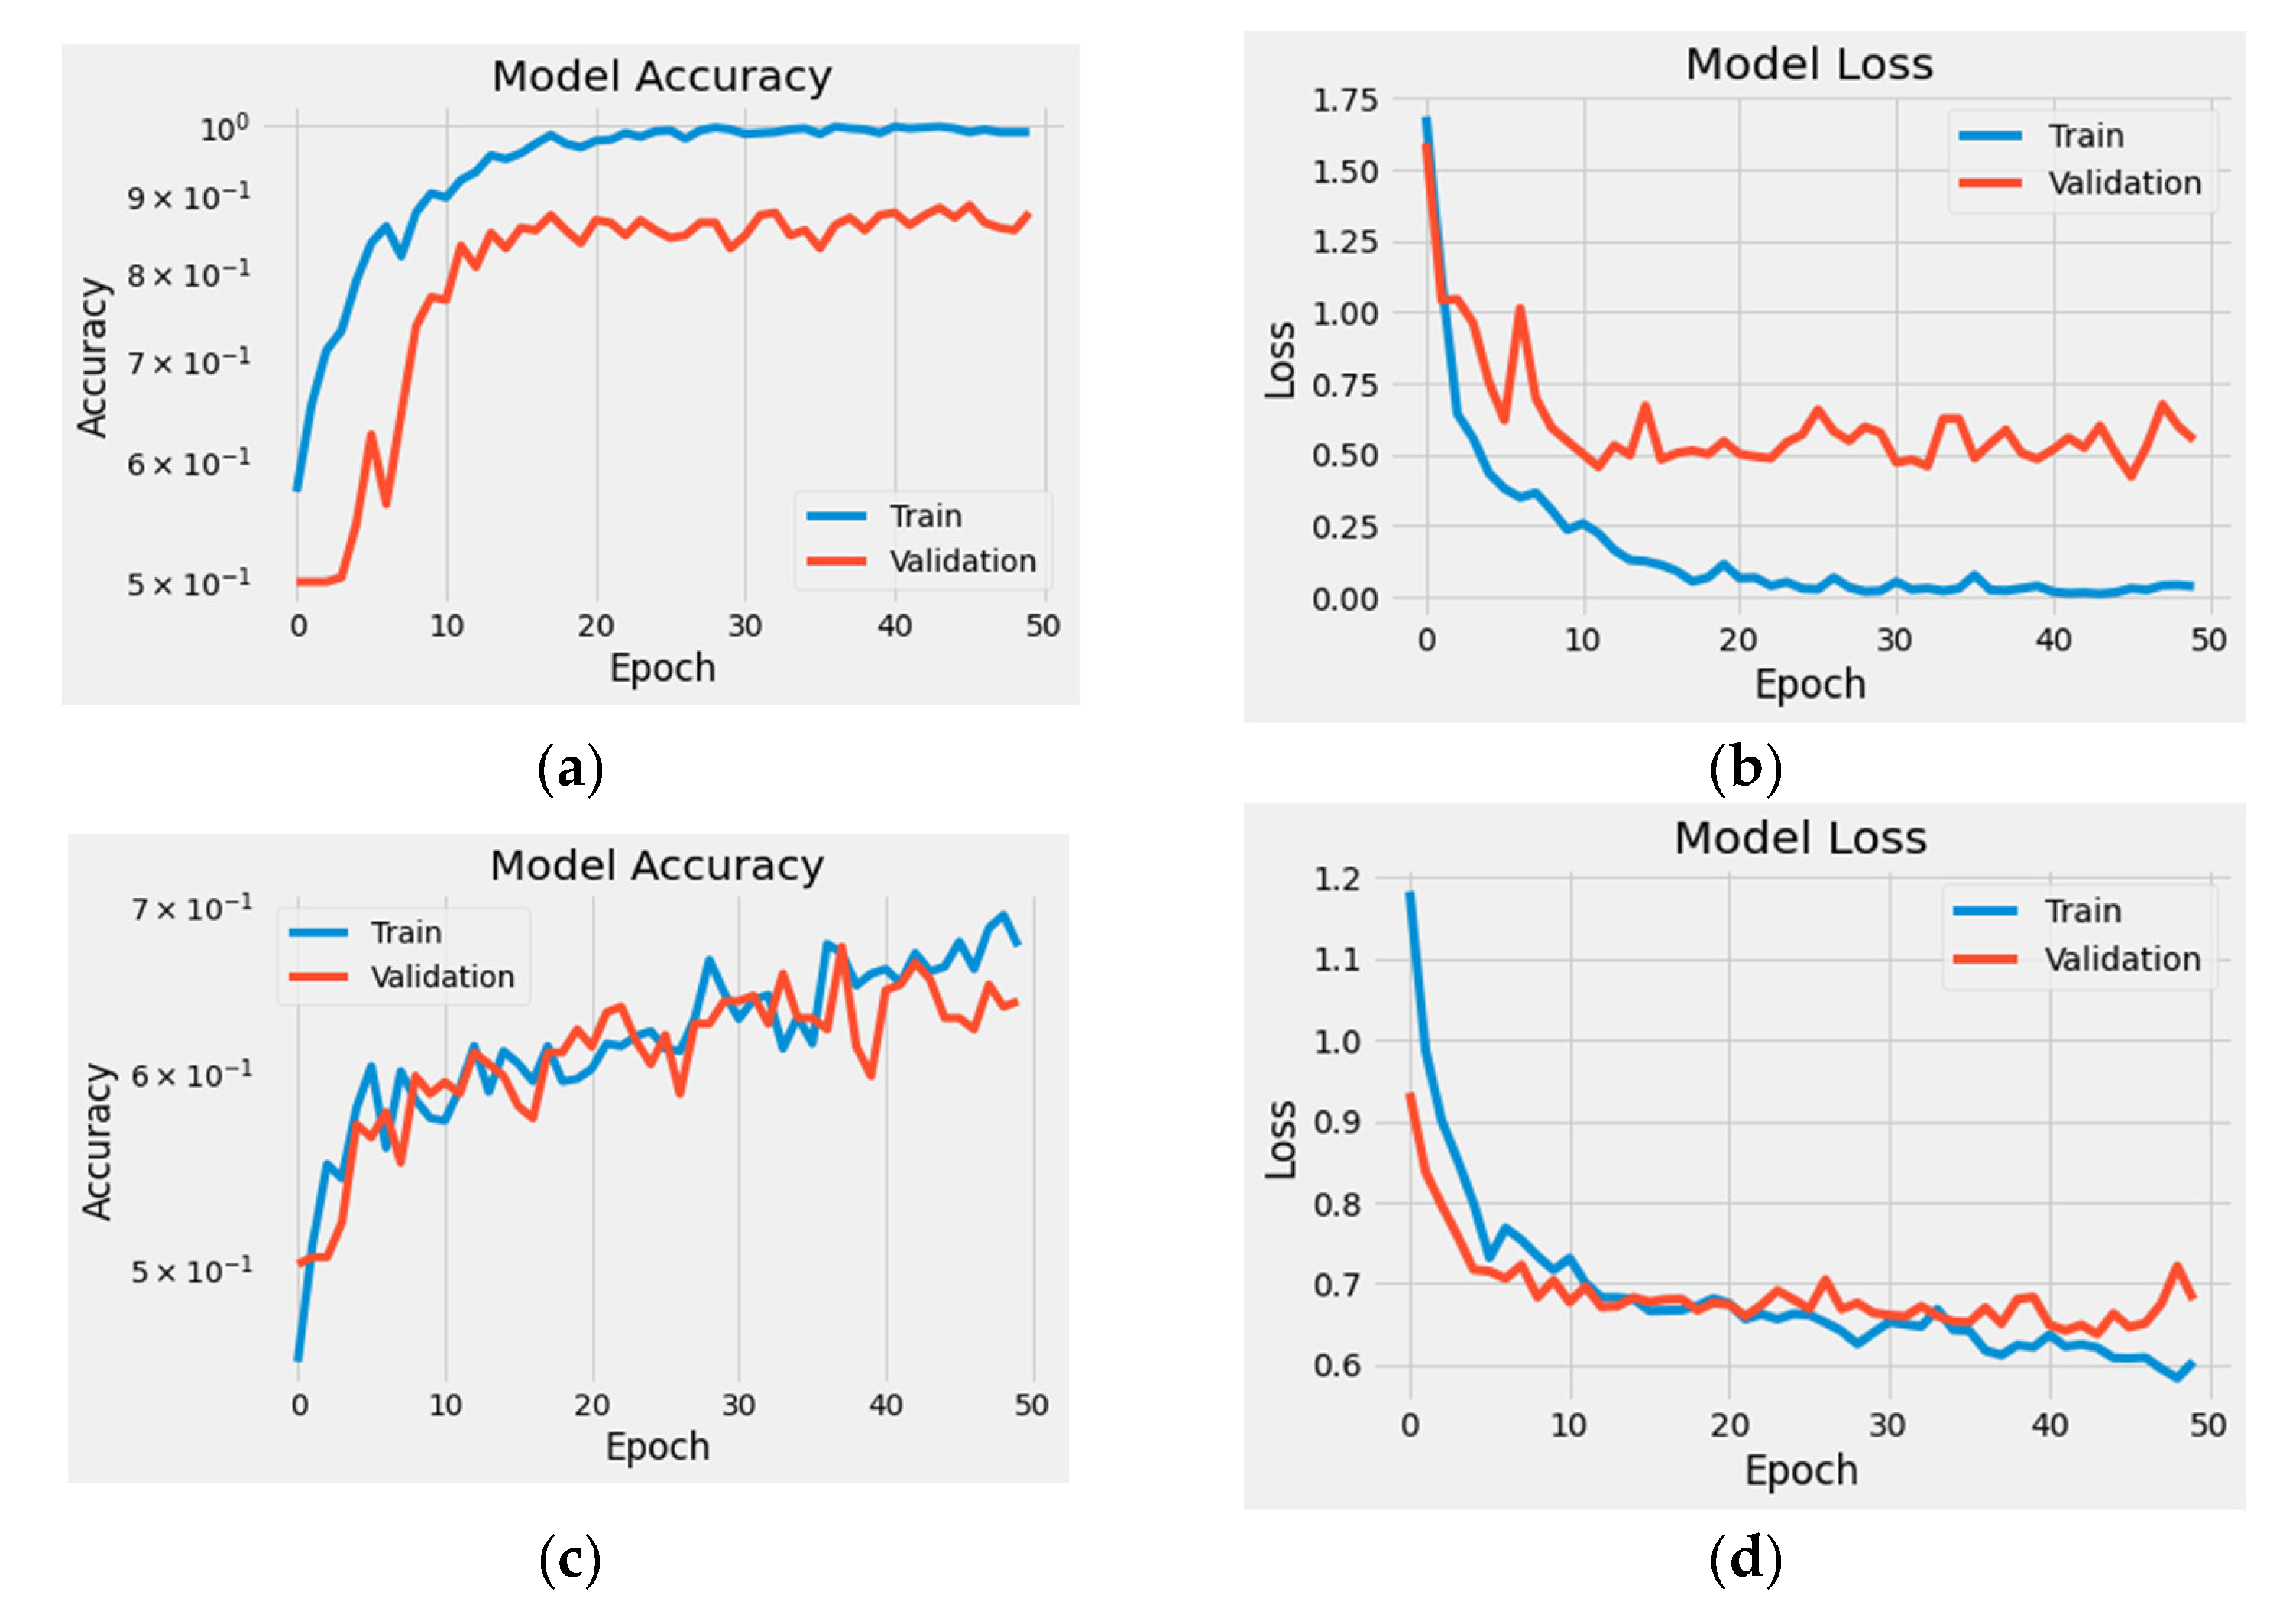
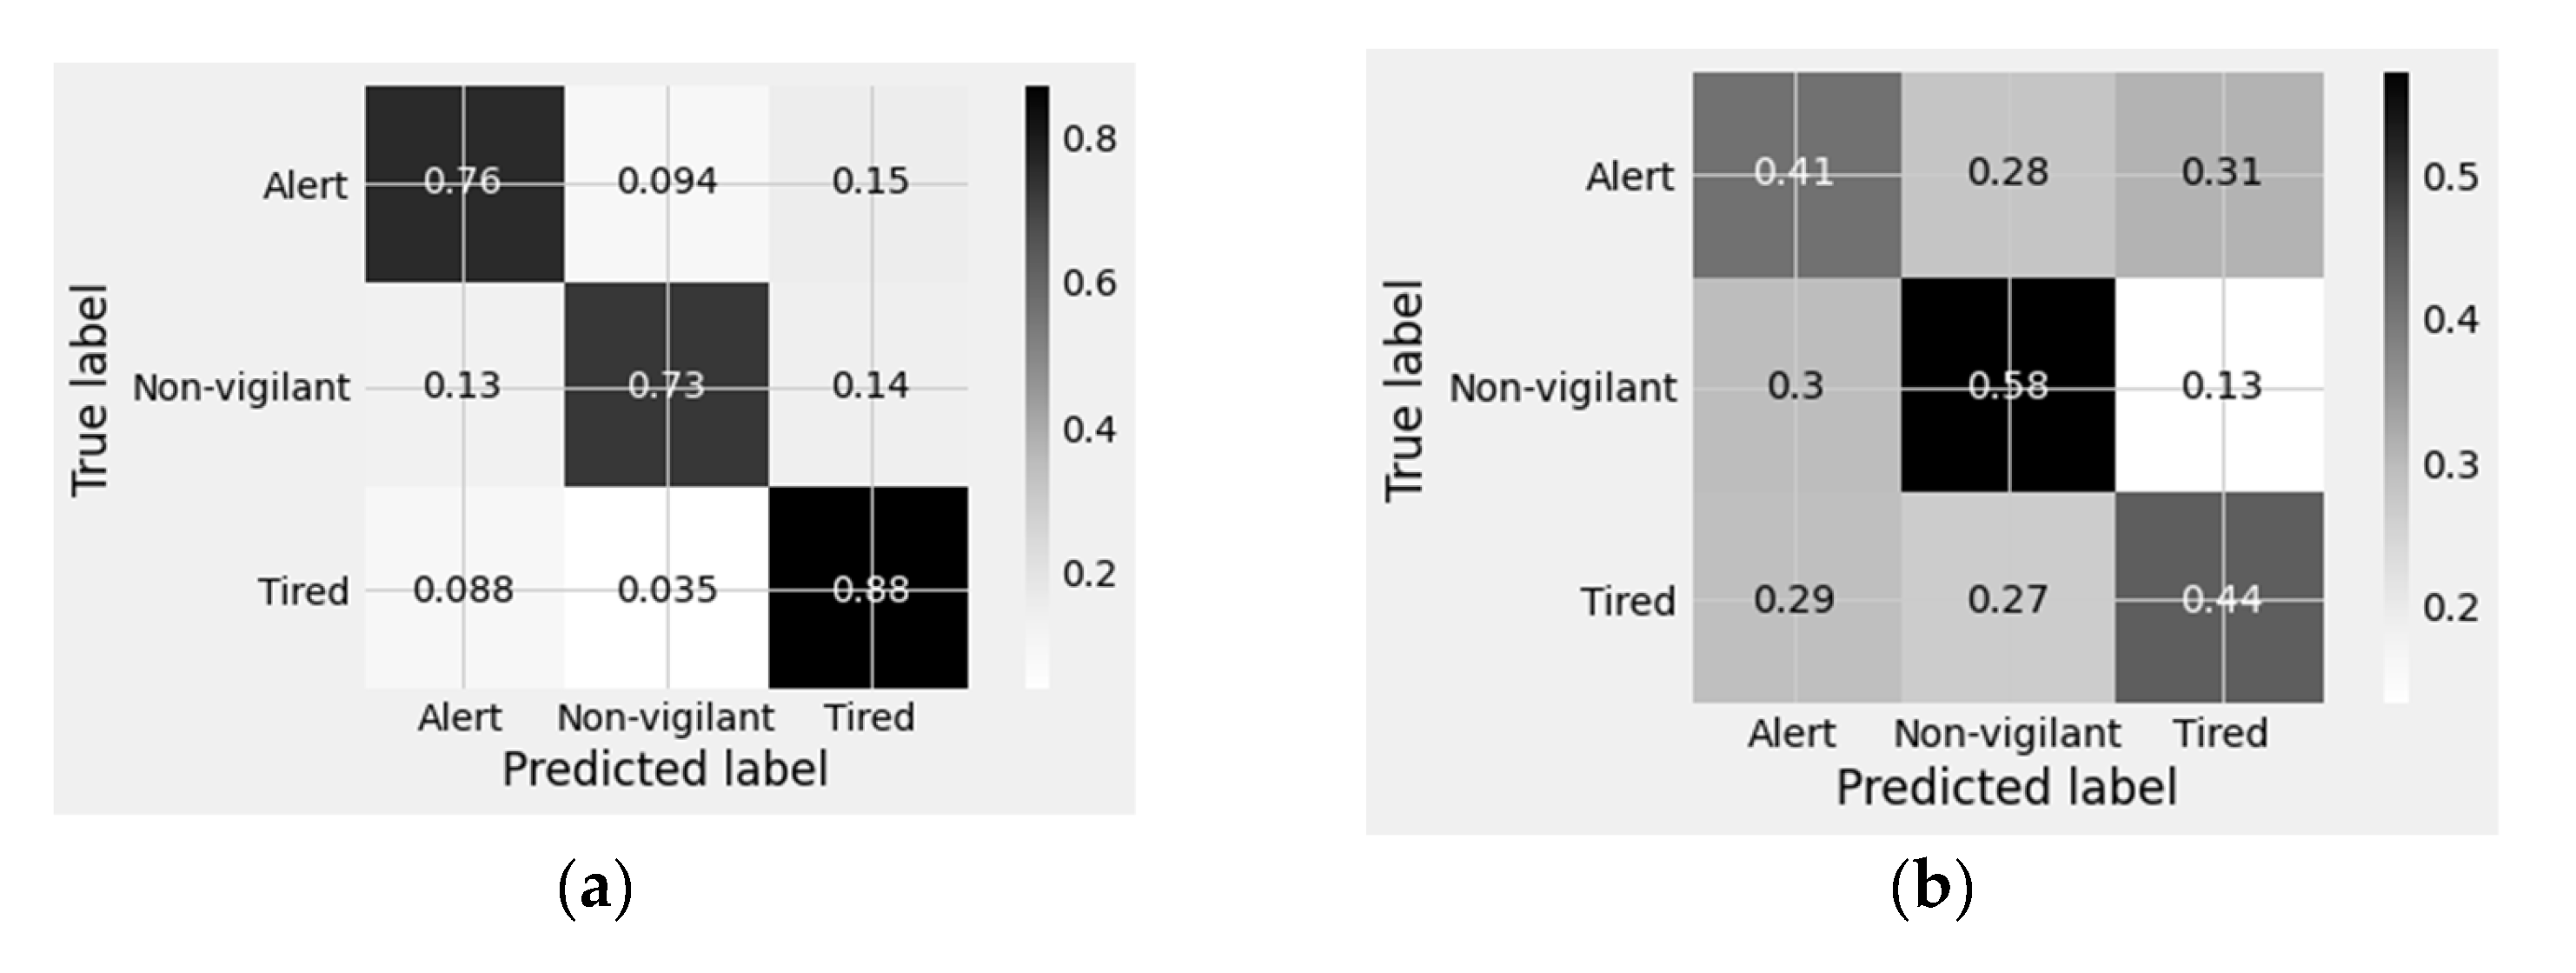
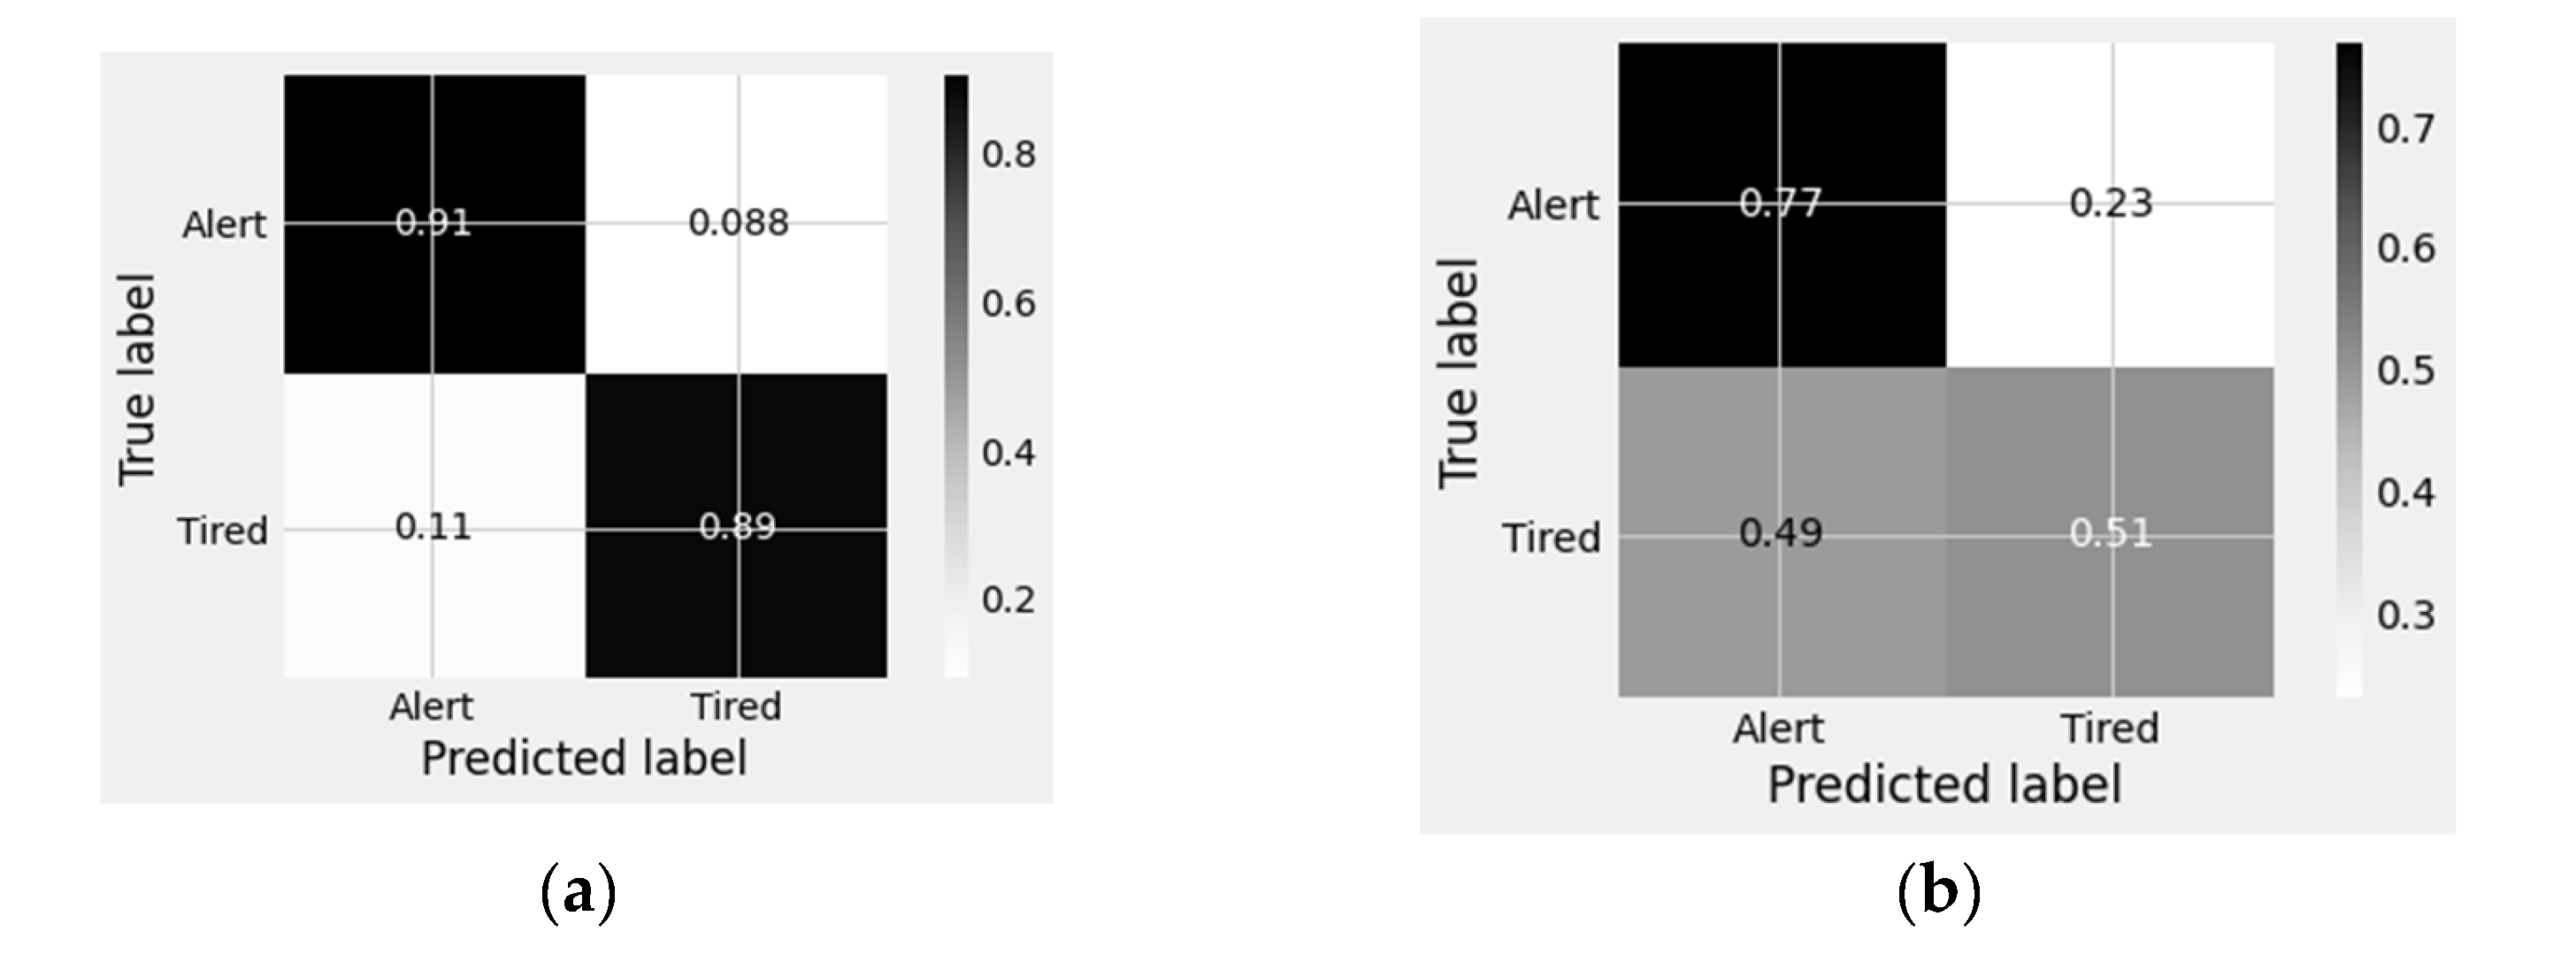
Moreover, the classification task is carried out using machine learning and deep learning approaches. The selection of classification method is carried out among the proposed methods including SVM, RF, DT, KNN, QDA, MLP, LR, CNN, and C-CNN. The optimal classification method is one which achieves a high performance prior to accuracy of detection. The proposed classification methods are carried out on the EEG signals in the time domain and the frequency domain. The performance of the proposed methods are evaluated prior to precision, recall, f1-score, and accuracy. The dataset is split into 70% and 30% for training and testing, respectively. In addition, these methods are trained and validated using k-fold cross validation, with k = 10. Furthermore, the classification task is performed in two scenarios of detection, binary-class and multi-class. The objective of the binary-class classification is to distinguish between states of alertness and tiredness. On the other hand, the objective of the multi-class classification is to classify among alert, tired, and non-vigilant states. The learning curves of the proposed machine learning methods are shown in Figure 9 and Figure 10, while the visual representation of the confusion matrices are shown in Figure 11 and Figure 12. In addition, the learning curves of the deep learning are displayed in Figure 13 and Figure 14. A visual representation of the confusion matrix of the proposed deep learning methods are shown in Figure 15 and Figure 16. Table 7 illustrates the simulation results of the proposed classification methods which are carried out on the transformed EEG signals using FFT with DWT. In a multiclass scenario, the proposed LR and RF models outperform the others with 90% and 89% accuracy, respectively, while SVM, RF and LR have 96% accuracy, for the binary-class scenario. Therefore, the proposed system consists of FFT with DWT for feature extraction and a LR classifier for the wide deployment for both binary-class and multiclass scenarios.
4. Discussion
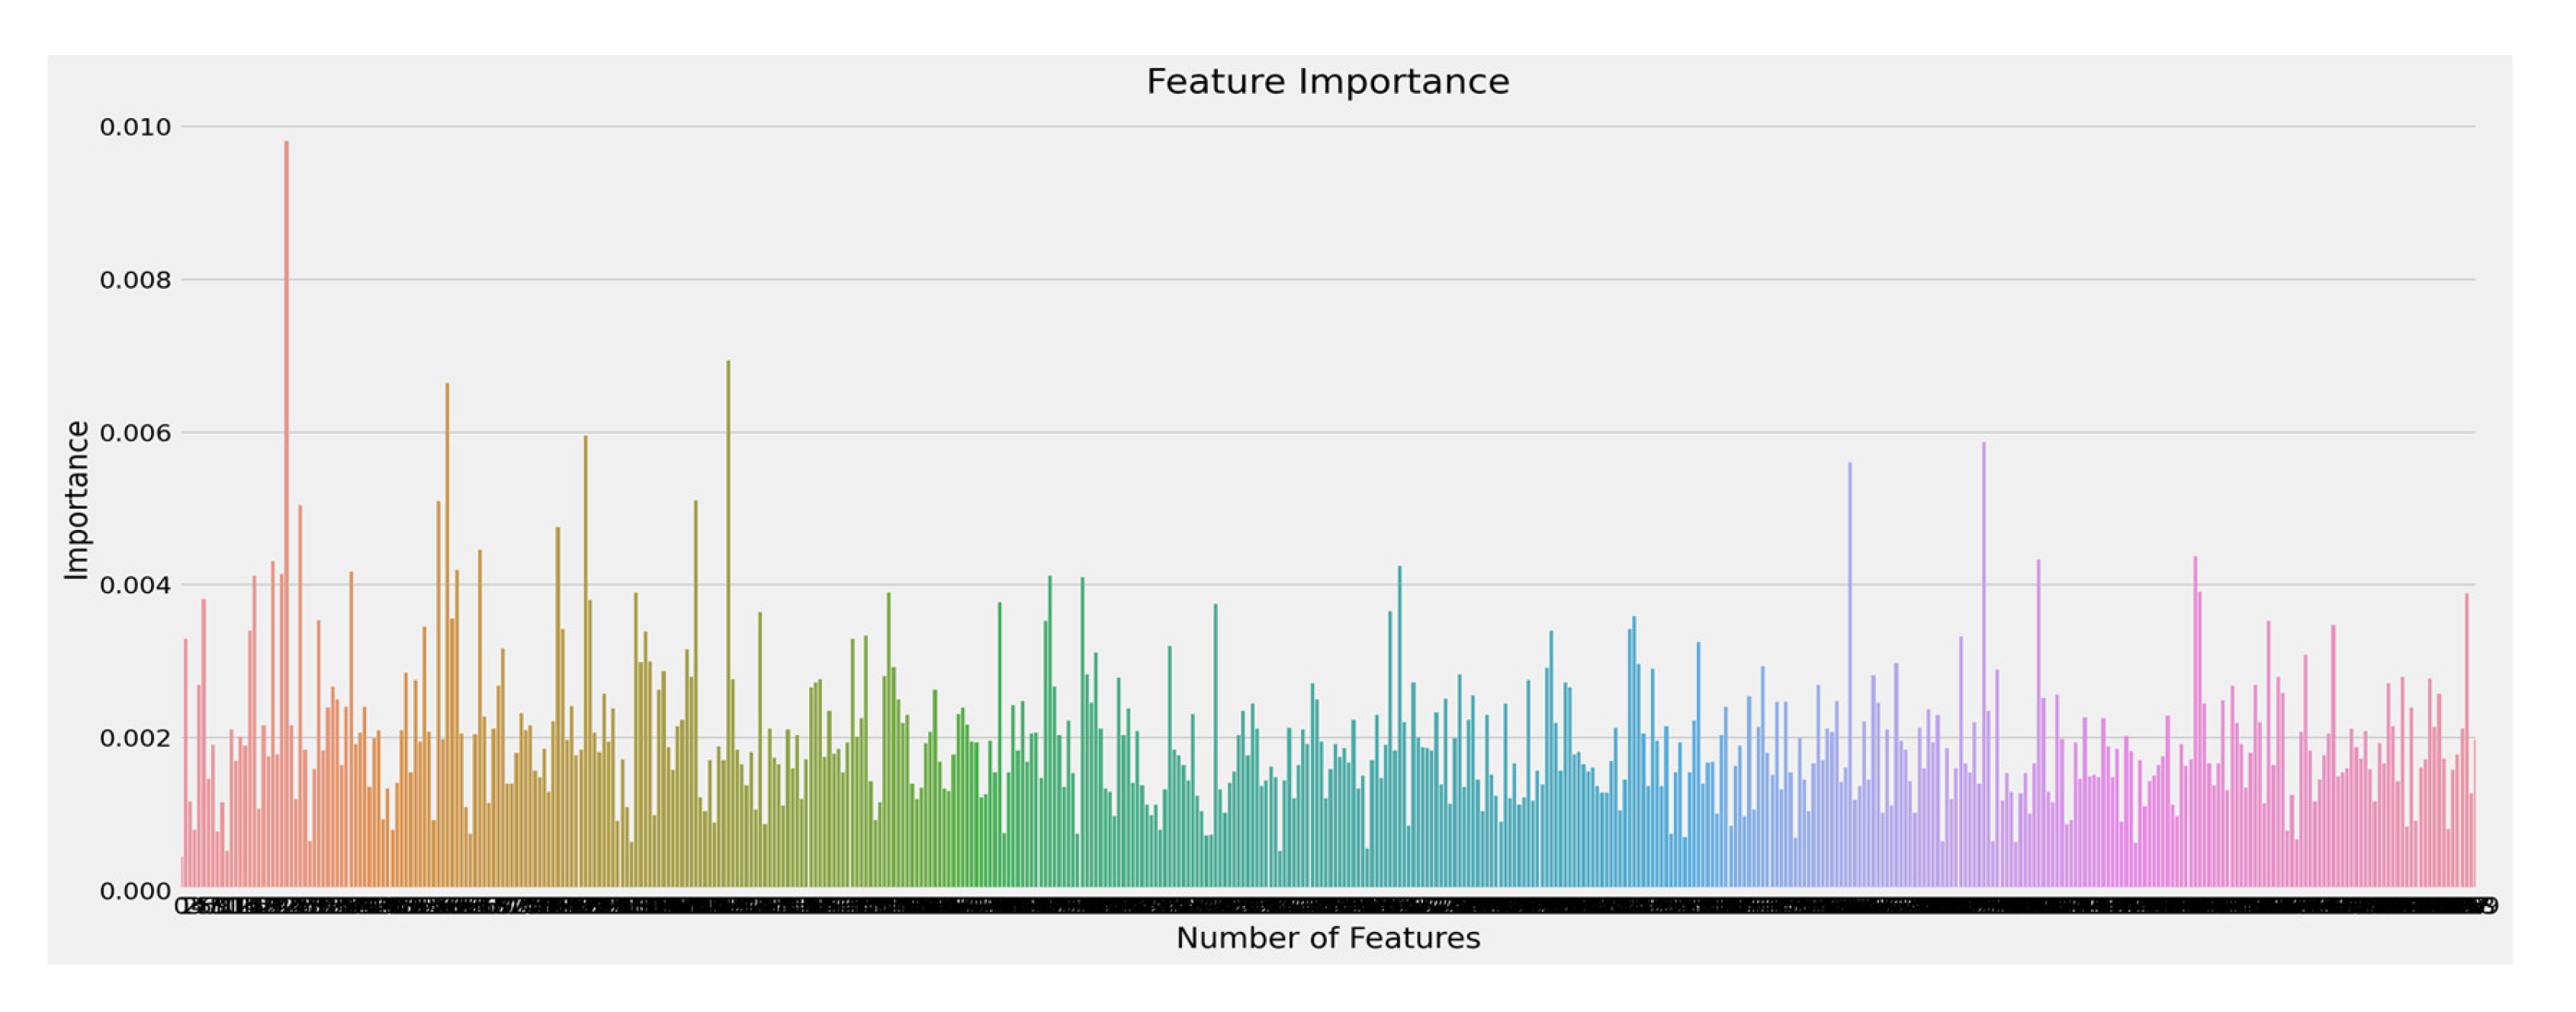
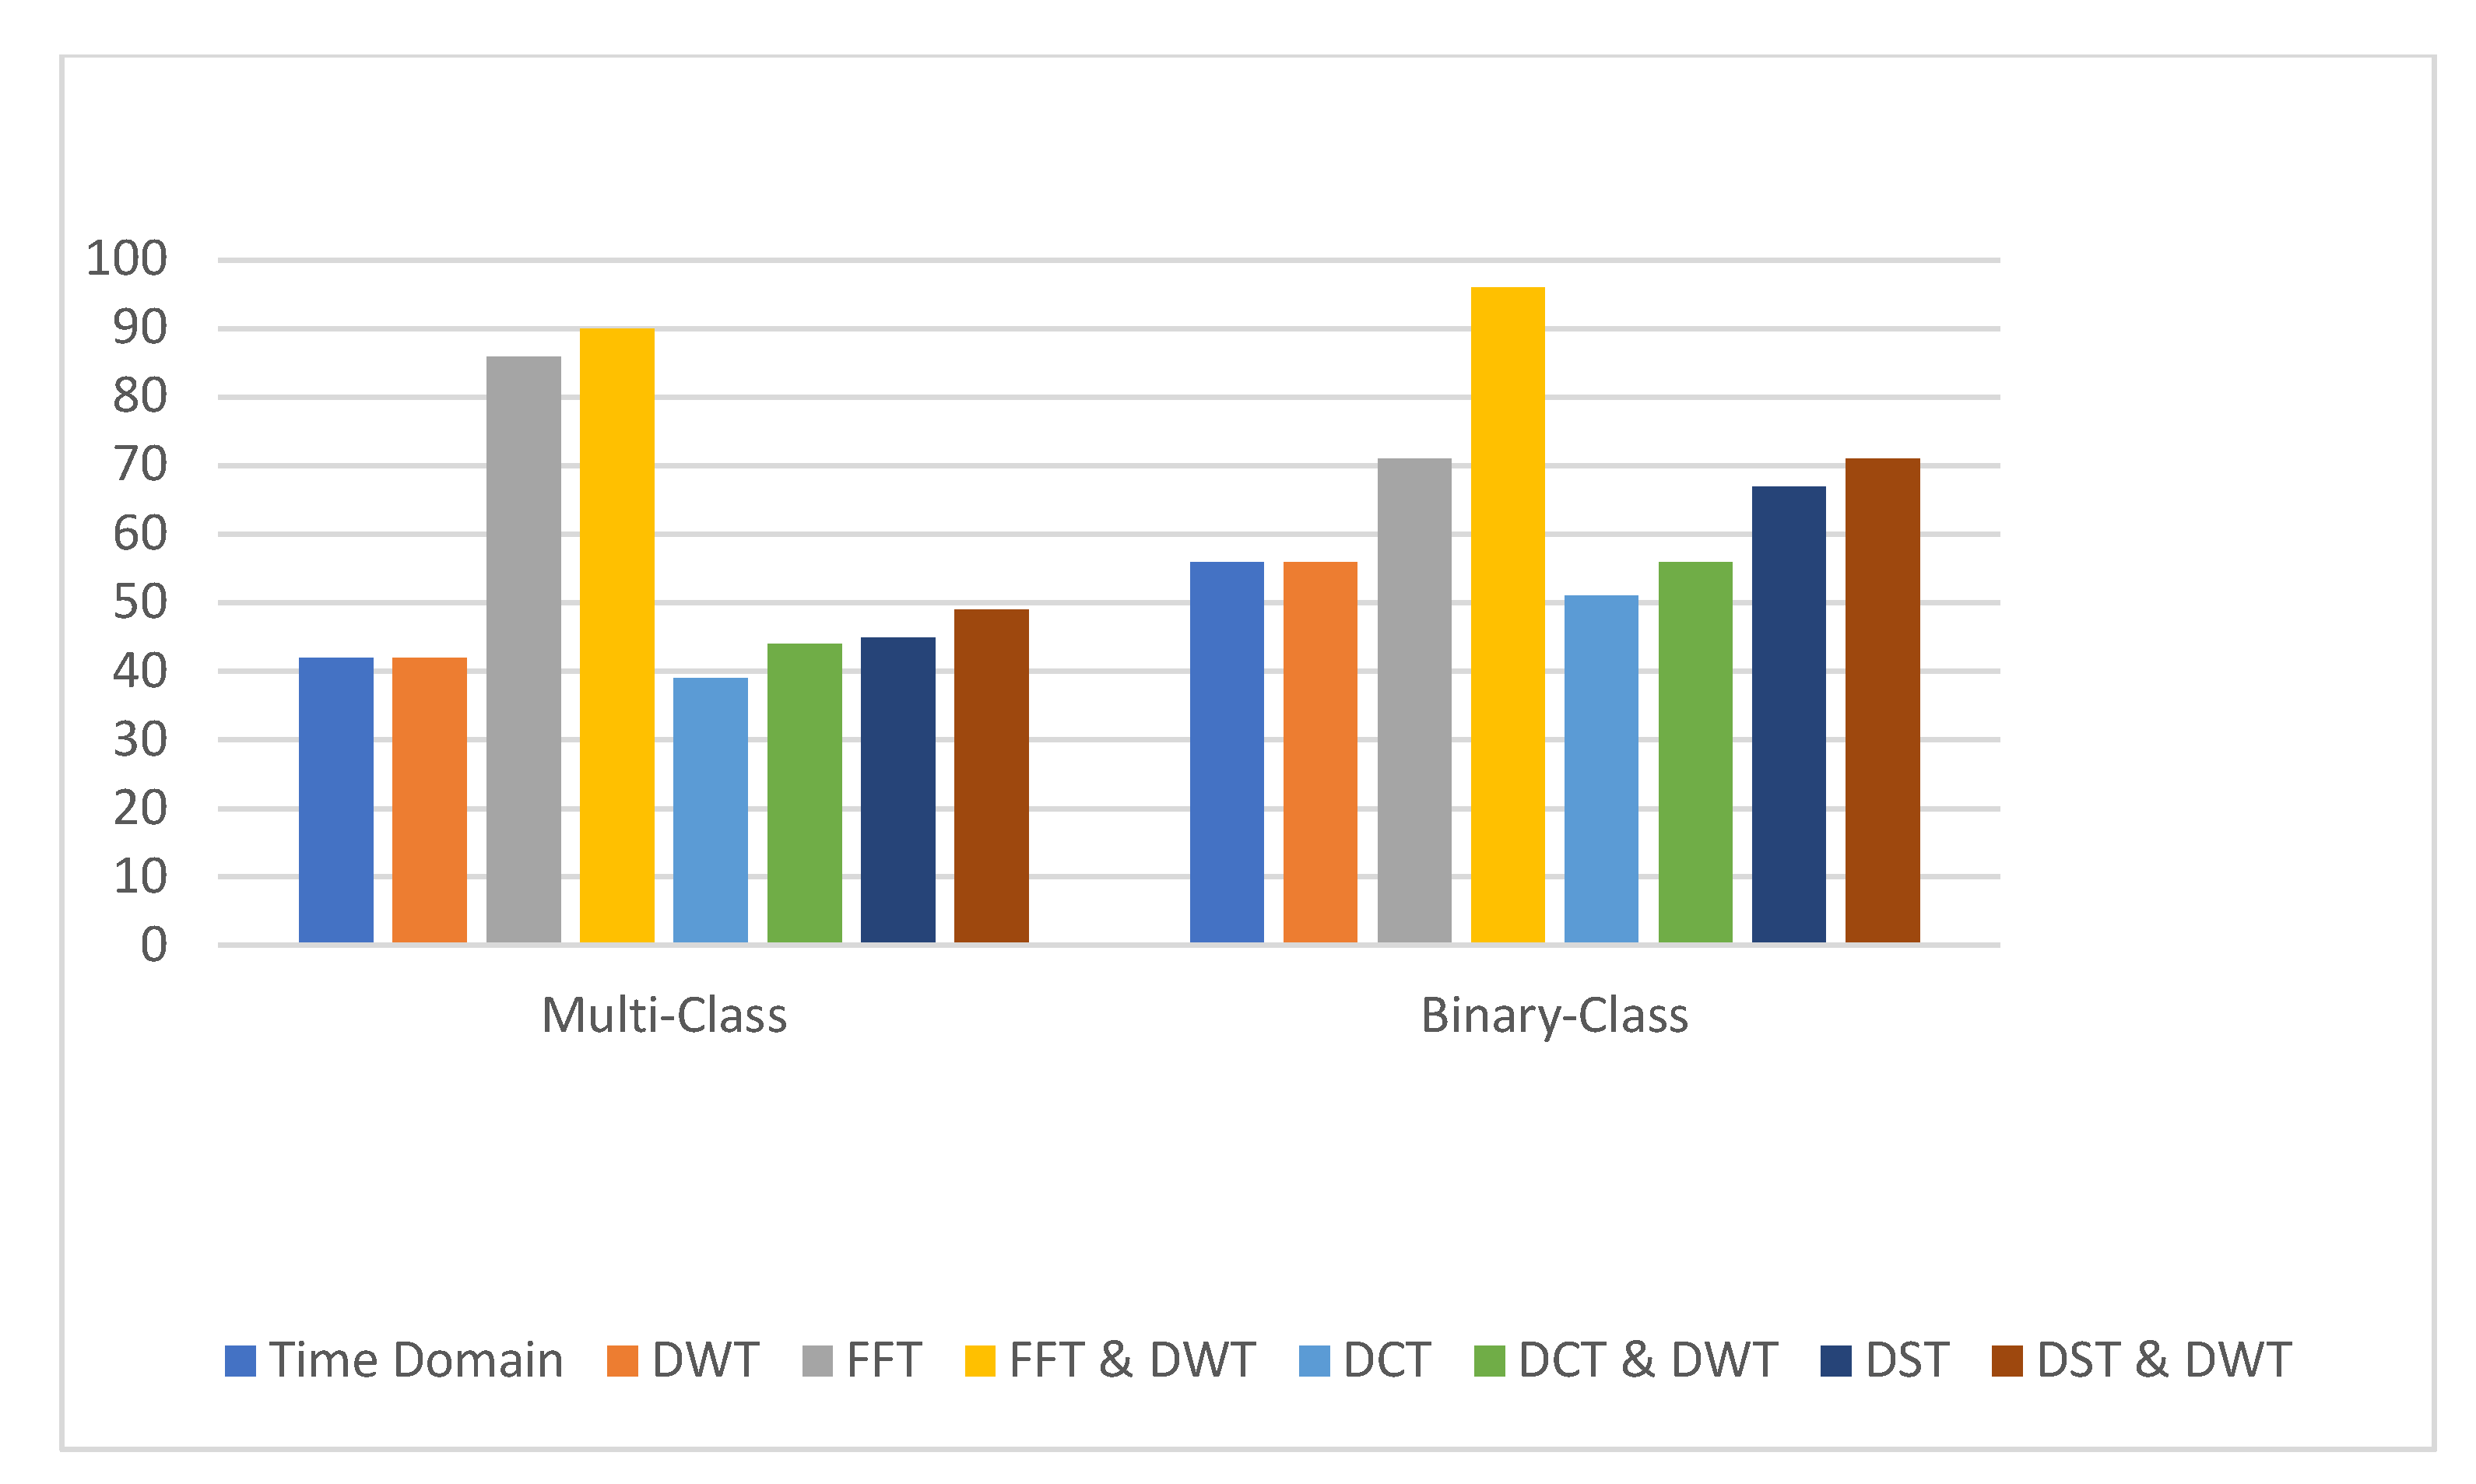
This paper proposes a system for drowsiness detection based on medical signals. This system comprises feature extraction and classification tasks. The feature extraction task is carried out using several trigonometric transformations including DWT, FFT, DCT, and DST. The classification task is performed using machine learning and deep learning algorithms. Figure 17 shows the extracted features and their importance for the output. The accomplished system comprises FFT with DWT for feature extraction and LR for classification. In this section, we discuss the performance of the proposed system in different cases including the performance of the LR classifier on the signals in the time domain and different transformations in addition to its performance with the added DWT denoising technique. Figure 18 shows a comparison of the proposed system in different scenarios including binary-class and multi-class scenarios.
Moreover, the proposed models are compared with the efforts in the literature. This comparison comprises both feature extraction and classifications utility for each research work. Table 8 illustrates this comparison prior to accuracy of detection. Corea et al. [40] proposes a system based on multimodal analysis for feature extraction and ANN for classification. They achieved 83% accuracy of detection. Another work was proposed by Ko et al. [41] which used FFT for feature extraction and ANN for classification. They deployed their system on EEG signals from a wireless device, like Neurosky. They achieved an accuracy of detection of 90%. It can be observed that the employment of the DWT denoising technique and different classifiers leads to a considerable enhancement of the accuracy. Yin et al. proposed their system based on FE and SVM for feature extraction and classification tasks, respectively. They achieved an accuracy of detection of 95%. This comparison reveals that the proposed system presents a superior performance than the works in the literature. Therefore, it can be considered as an efficient fatigue detection system for real-life applications.
5. Conclusions
The problem of driver fatigue detection has been discussed in this paper. The proposed approach comprises both feature extraction and classification tasks. The feature extraction task has been accomplished using FFT and DWT. The classification task has been performed using machine learning and deep learning methods including SVM, RF, LR, MLP, QDA, KNN, DT, 1D CNN, and C-CNN. In addition, the proposed models are carried out on EEG, EOG, EMG, and ECG signals, which are included in the DROZY dataset. Furthermore, two scenarios have been carried out for the classification, multiclass and binary-class scenarios. The proposed method achieves an accuracy of 96% with superior performance among the proposed efforts prior to fatigue detection.
However, the proposed approach has a drawback which is represented in the low performance of deep learning methods. Therefore, the performance can be enhanced in future work with some ideas. Using different feature selection and feature engineering algorithms will improve the performance by selecting some features with optimal importance. Another type of enhancement is to employ different optimization techniques to improve the performance of the deep learning approach. Furthermore, recurrent models can be considered and tested by the DROZY dataset.
Author Contributions
Conceptualization, methodology, software, validation, formal analysis, investigation, resources, writing—original draft preparation, A.S. and M.M.; writing—review and editing, visualization H.M. All authors have read and agreed to the published version of the manuscript.
Funding
Princess Nourah bint Abdulrahman University Researchers Supporting Project number (PNURSP2023R137): Princess Nourah bint Abdulrahman University, Riyadh, Saudi Arabia.
Acknowledgments
The authors would like to acknowledge the support of Prince Sultan University for paying the Article Processing Charges (APC) of this publication.
Conflicts of Interest
The authors declare no conflict of interest.
Abbreviations
| SVM | Support Vector Machine |
| KNN | k-Nearest Neighbor |
| MLP | Multilayer Perceptron |
| RF | Random Forest |
| LR | Logistic Regression |
| DT | Decision Tree |
| QDA | Quadrature Data Analysis |
| CNN | Convolutional Neural Network |
| C-NN | Concatenated Convolutional Neural Network |
| MCC | Matthews Correlation Coefficient |
| ANN | Artificial Neural Network |
| FFT | Fast Fourier Transform |
| DWT | Discrete Wavelet Transform |
| DST | Discrete Sine Transform |
| DCT | Discrete Cosine Transform |
| EEG | Electroencephalogram |
| ECG | Electrocardiogram |
| EOG | Electrooculogram |
| EMG | Electromyogram |
| IoT | Internet of Things |
| FE | Fuzzy Entropy |
| SE | Sample Entropy |
| PSD | Power Spectral Density |
References
- Abbas, Q.; Alsheddy, A. Driver Fatigue Detection Systems Using Multi-Sensors, Smartphone, and Cloud-Based Computing Platforms: A Comparative Analysis. Sensors 2020, 21, 56. [Google Scholar] [CrossRef] [PubMed]
- Ramzan, M.; Khan, H.U.; Awan, S.M.; Ismail, A.; Ilyas, M.; Mahmood, A. A Survey on State-of-the-Art Drowsiness Detection Techniques. IEEE Access 2019, 7, 61904–61919. [Google Scholar] [CrossRef]
- Niloy, A.R.; Chowdhury, A.I.; Sharmin, N. A Brief Review on Different Driver’s Drowsiness Detection Techniques. Int. J. Image Graph. Signal Process. 2020, 10, 41. [Google Scholar]
- Choudhary, P.; Sharma, R.; Singh, G.; Das, S. A Survey Paper on Drowsiness Detection & Alarm System for Drivers. Int. Res. J. Eng. Technol. 2016, 3, 1433–1437. [Google Scholar]
- Khan, M.Q.; Lee, S. A Comprehensive Survey of Driving Monitoring and Assistance Systems. Sensors 2019, 19, 2574. [Google Scholar] [CrossRef] [PubMed] [Green Version]
- Chen, L.; Zhi, X.; Wang, H.; Wang, G.; Zhou, Z.; Yazdani, A.; Zheng, X. Driver Fatigue Detection via Differential Evolution Extreme Learning Machine Technique. Electronics 2020, 9, 1850. [Google Scholar] [CrossRef]
- Fuletra, J.D.; Bosamiya, D. A Survey on Drivers Drowsiness Detection Techniques. Int. J. Recent Innov. Trends Comput. Commun. 2013, 1, 816–819. [Google Scholar]
- Bergasa, L.M.; Nuevo, J.; Sotelo, M.A.; Barea, R.; Lopez, M.E. Real-Time System for Monitoring Driver Vigilance. IEEE Trans. Intell. Transp. Syst. 2006, 7, 63–77. [Google Scholar] [CrossRef] [Green Version]
- Flores, M.J.; Armingol, J.M.; de la Escalera, A. Real-Time Warning System for Driver Drowsiness Detection Using Visual Information. J. Intell. Robot. Syst. 2010, 59, 103–125. [Google Scholar] [CrossRef]
- Abtahi, S.; Hariri, B.; Shirmohammadi, S. Driver Drowsiness Monitoring Based on Yawning Detection. In Proceedings of the 2011 IEEE International Instrumentation and Measurement Technology Conference, Hangzhou, China, 10–12 May 2011; pp. 1–4. [Google Scholar]
- Lenskiy, A.A.; Lee, J.-S. Driver’s Eye Blinking Detection Using Novel Color and Texture Segmentation Algorithms. Int. J. Control. Autom. Syst. 2012, 10, 317–327. [Google Scholar] [CrossRef]
- Jo, J.; Lee, S.J.; Kim, J.; Jung, H.G.; Park, K.R. Vision-Based Method for Detecting Driver Drowsiness and Distraction in Driver Monitoring System. Opt. Eng. 2011, 50, 127202. [Google Scholar] [CrossRef]
- Malla, A.M.; Davidson, P.R.; Bones, P.J.; Green, R.; Jones, R.D. Automated Video-Based Measurement of Eye Closure for Detecting Behavioral Microsleep. In Proceedings of the 2010 annual international conference of the IEEE engineering in medicine and biology, Buenos Aires, Argentina, 31 August–4 September 2010; pp. 6741–6744. [Google Scholar]
- Xiong, Y.; Gao, J.; Yang, Y.; Yu, X.; Huang, W. Classifying Driving Fatigue Based on Combined Entropy Measure Using EEG Signals. Int. J. Control Autom. 2016, 9, 329–338. [Google Scholar] [CrossRef]
- Chai, R.; Naik, G.R.; Nguyen, T.N.; Ling, S.H.; Tran, Y.; Craig, A.; Nguyen, H.T. Driver Fatigue Classification with Independent Component by Entropy Rate Bound Minimization Analysis in an EEG-Based System. IEEE J. Biomed. Health Inform. 2016, 21, 715–724. [Google Scholar] [CrossRef]
- Yin, J.; Hu, J.; Mu, Z. Developing and Evaluating a Mobile Driver Fatigue Detection Network Based on Electroencephalograph Signals. Healthc. Technol. Lett. 2017, 4, 34–38. [Google Scholar] [CrossRef] [PubMed]
- Hu, J. Automated Detection of Driver Fatigue Based on AdaBoost Classifier with EEG Signals. Front. Comput. Neurosci. 2017, 11, 72. [Google Scholar] [CrossRef] [PubMed] [Green Version]
- Min, J.; Wang, P.; Hu, J. Driver Fatigue Detection through Multiple Entropy Fusion Analysis in an EEG-Based System. PLoS ONE 2017, 12, e0188756. [Google Scholar] [CrossRef] [Green Version]
- Ko, W.; Oh, K.; Jeon, E.; Suk, H.-I. Vignet: A Deep Convolutional Neural Network for Eeg-Based Driver Vigilance Estimation. In Proceedings of the 2020 8th International Winter Conference on Brain-Computer Interface (BCI), Gangwon, Republic of Korea, 26–28 February 2020; pp. 1–3. [Google Scholar]
- Wang, Y.; Liu, X.; Zhang, Y.; Zhu, Z.; Liu, D.; Sun, J. Driving Fatigue Detection Based on EEG Signal. In Proceedings of the 2015 Fifth International Conference on Instrumentation and Measurement, Computer, Communication and Control (IMCCC), Qinhuangdao, China, 18–20 September 2015; pp. 715–718. [Google Scholar]
- Zhendong, M.; Jinghai, Y. Mobile Healthcare System for Driver Based on Drowsy Detection Using EEG Signal Analysis. Metall. Min. Ind. 2015, 7, 266–273. [Google Scholar]
- Nugraha, B.T.; Sarno, R.; Asfani, D.A.; Igasaki, T.; Munawar, M.N. Classification of driver fatigue state based on eeg using emotiv epoc+. J. Theor. Appl. Inf. Technol. 2016, 86. [Google Scholar]
- Luo, H.; Qiu, T.; Liu, C.; Huang, P. Research on Fatigue Driving Detection Using Forehead EEG Based on Adaptive Multi-Scale Entropy. Biomed. Signal Process. Control 2019, 51, 50–58. [Google Scholar] [CrossRef]
- Gao, Z.-K.; Li, Y.-L.; Yang, Y.-X.; Ma, C. A Recurrence Network-Based Convolutional Neural Network for Fatigue Driving Detection from EEG. Chaos Interdiscip. J. Nonlinear Sci. 2019, 29, 113126. [Google Scholar] [CrossRef]
- Karuppusamy, N.S.; Kang, B.-Y. Multimodal System to Detect Driver Fatigue Using EEG, Gyroscope, and Image Processing. IEEE Access 2020, 8, 129645–129667. [Google Scholar] [CrossRef]
- Aamir, M.; Rahman, Z.; Dayo, Z.A.; Abro, W.A.; Uddin, M.I.; Khan, I.; Imran, A.S.; Ali, Z.; Ishfaq, M.; Guan, Y. A Deep Learning Approach for Brain Tumor Classification Using MRI Images. Comput. Electr. Eng. 2022, 101, 108105. [Google Scholar] [CrossRef]
- Aamir, M.; Pu, Y.-F.; Rahman, Z.; Tahir, M.; Naeem, H.; Dai, Q. A Framework for Automatic Building Detection from Low-Contrast Satellite Images. Symmetry 2018, 11, 3. [Google Scholar] [CrossRef] [Green Version]
- Siam, A.I.; Soliman, N.F.; Algarni, A.D.; Abd El-Samie, F.E.; Sedik, A. Deploying Machine Learning Techniques for Human Emotion Detection. Comput. Intell. Neurosci. 2022, 2022, 8032673. [Google Scholar] [CrossRef]
- El-Moneim, S.A.; Sedik, A.; Nassar, M.A.; El-Fishawy, A.S.; Sharshar, A.M.; Hassan, S.E.A.; Mahmoud, A.Z.; Dessouky, M.I.; El-Banby, G.M.; El-Samie, F.E.A.; et al. Text-Dependent and Text-Independent Speaker Recognition of Reverberant Speech Based on CNN. Int. J. Speech Technol. 2021, 24, 993–1006. [Google Scholar] [CrossRef]
- Hammad, M.; Abd El-Latif, A.A.; Hussain, A.; Abd El-Samie, F.E.; Gupta, B.B.; Ugail, H.; Sedik, A. Deep Learning Models for Arrhythmia Detection in IoT Healthcare Applications. Comput. Electr. Eng. 2022, 100, 108011. [Google Scholar] [CrossRef]
- Ibrahim, F.E.; Emara, H.M.; El-Shafai, W.; Elwekeil, M.; Rihan, M.; Eldokany, I.M.; Taha, T.E.; El-Fishawy, A.S.; El-Rabaie, E.M.; Abdellatef, E. Deep Learning-based Seizure Detection and Prediction from EEG Signals. Int. J. Numer. Method. Biomed. Eng. 2022, 38, e3573. [Google Scholar] [CrossRef]
- Shoaib, M.R.; Emara, H.M.; Elwekeil, M.; El-Shafai, W.; Taha, T.E.; El-Fishawy, A.S.; El-Rabaie, E.-S.M.; El-Samie, F.E.A. Hybrid Classification Structures for Automatic COVID-19 Detection. J. Ambient Intell. Humaniz. Comput. 2022, 13, 4477–4492. [Google Scholar] [CrossRef]
- Daoui, A.; Yamni, M.; Karmouni, H.; Sayyouri, M.; Qjidaa, H.; Motahhir, S.; Jamil, O.; El-Shafai, W.; Algarni, A.D.; Soliman, N.F. Efficient Biomedical Signal Security Algorithm for Smart Internet of Medical Things (IoMTs) Applications. Electronics 2022, 11, 3867. [Google Scholar] [CrossRef]
- Li, L.; Jamieson, K.; DeSalvo, G.; Rostamizadeh, A.; Talwalkar, A. Hyperband: A Novel Bandit-Based Approach to Hyperparameter Optimization. J. Mach. Learn. Res. 2017, 18, 6765–6816. [Google Scholar]
- Crammer, K.; Singer, Y. On the Algorithmic Implementation of Multiclass Kernel-Based Vector Machines. J. Mach. Learn. Res. 2001, 2, 265–292. [Google Scholar]
- Massoz, Q.; Langohr, T.; François, C.; Verly, J.G. The ULg Multimodality Drowsiness Database (Called DROZY) and Examples of Use. In Proceedings of the 2016 IEEE Winter Conference on Applications of Computer Vision (WACV), Lake Placid, NY, USA, 7–10 March 2016; pp. 1–7. [Google Scholar]
- Chicco, D.; Jurman, G. The Advantages of the Matthews Correlation Coefficient (MCC) over F1 Score and Accuracy in Binary Classification Evaluation. BMC Genom. 2020, 21, 6. [Google Scholar] [CrossRef] [PubMed] [Green Version]
- Karpiński, R. Knee Joint Osteoarthritis Diagnosis Based on Selected Acoustic Signal Discriminants Using Machine Learning. Appl. Comput. Sci. 2022, 18, 71–85. [Google Scholar] [CrossRef]
- Karpiński, R.; Krakowski, P.; Jonak, J.; Machrowska, A.; Maciejewski, M.; Nogalski, A. Diagnostics of Articular Cartilage Damage Based on Generated Acoustic Signals Using ANN—Part II: Patellofemoral Joint. Sensors 2022, 22, 3765. [Google Scholar] [CrossRef] [PubMed]
- Correa, A.G.; Orosco, L.; Laciar, E. Automatic Detection of Drowsiness in EEG Records Based on Multimodal Analysis. Med. Eng. Phys. 2014, 36, 244–249. [Google Scholar] [CrossRef]
- Ko, L.-W.; Lai, W.-K.; Liang, W.-G.; Chuang, C.-H.; Lu, S.-W.; Lu, Y.-C.; Hsiung, T.-Y.; Wu, H.-H.; Lin, C.-T. Single Channel Wireless EEG Device for Real-Time Fatigue Level Detection. In Proceedings of the 2015 International Joint Conference on Neural Networks (IJCNN), Killarney, Ireland, 12–17 July 2015; pp. 1–5. [Google Scholar]
- Liu, Y.; Lan, Z.; Cui, J.; Sourina, O.; Müller-Wittig, W. Inter-Subject Transfer Learning for EEG-Based Mental Fatigue Recognition. Adv. Eng. Inform. 2020, 46, 101157. [Google Scholar] [CrossRef]
Figure 1.
A summary of the major techniques used in fatigue detection systems.

Figure 2.
Proposed system for detecting fatigue.

Figure 3.
Architecture of the proposed 1D CNN model.

Figure 4.
Architecture of the proposed C-CNN model.

Figure 5.
The physical distribution of drozy polysomnography signals on the driver’s head.

Figure 6.
Learning curves (accuracy) of the iterations in the hyperparameter optimization.

Figure 7.
Learning curves (loss) of the iterations of the hyperparameter optimization.

Figure 8.
Infograph of the variation of the hyperparameters and the accuracy.

Figure 9.
Multiclass learning and performance curves of the proposed machine learning models. (a) Learning Curve and Performance plots of The Proposed SVM Model. (b) Learning Curve and Performance plots of The Proposed RF Model. (c) Learning Curve and Performance plots of The Proposed DT Model. (d) Learning Curve and Performance plots of The Proposed KNN Model. (e) Learning Curve and Performance plots of The Proposed QDA Model. (f) Learning Curve and Performance plots of The Proposed QDA Model. (g) Learning Curve and Performance plots of The Proposed LR Model.


Figure 10.
Binary-class learning and performance curves of the proposed machine learning models. (a) Learning Curve and Performance plots of The Proposed SVM Model. (b) Learning Curve and Performance plots of The Proposed RF Model. (c) Learning Curve and Performance plots of The Proposed DT Model. (d) Learning Curve and Performance plots of The Proposed KNN Model. (e) Learning Curve and Performance plots of The Proposed QDA Model. (f) Learning Curve and Performance plots of The Proposed MLP Model. (g) Learning Curve and Performance plots of The Proposed LR Model.


Figure 11.
Confusion Matrix of The Proposed Machine Learning Models for Multi-class Scenarion (a) SVM, (b) RF, (c) DT, (d) KNN, (e) QDA, (f) MLP, (g) LR.
Figure 11.
Confusion Matrix of The Proposed Machine Learning Models for Multi-class Scenarion (a) SVM, (b) RF, (c) DT, (d) KNN, (e) QDA, (f) MLP, (g) LR.


Figure 12.
Confusion Matrix of The Proposed Machine Learning Model for Binary Classification (a) SVM, (b) RF, (c) DT, (d) KNN, (e) QDA, (f) MLP, (g) LR.
Figure 12.
Confusion Matrix of The Proposed Machine Learning Model for Binary Classification (a) SVM, (b) RF, (c) DT, (d) KNN, (e) QDA, (f) MLP, (g) LR.


Figure 13.
Proposed Deep Learning Models for Multi-class Scenario Learning and Performance Curves. (a) Accuracy of 1D CNN. (b) Loss of 1D CNN. (c) Accuracy of C-CNN. (d) Loss of C-CNN.
Figure 13.
Proposed Deep Learning Models for Multi-class Scenario Learning and Performance Curves. (a) Accuracy of 1D CNN. (b) Loss of 1D CNN. (c) Accuracy of C-CNN. (d) Loss of C-CNN.

Figure 14.
Deep learning models for binary-class scenario learning and performance curves (a) Accuracy for 1D CNN, (b) Loss for 1D CNN, (c) Accuracy for C-CNN, (d) Loss for C-CNN.
Figure 14.
Deep learning models for binary-class scenario learning and performance curves (a) Accuracy for 1D CNN, (b) Loss for 1D CNN, (c) Accuracy for C-CNN, (d) Loss for C-CNN.

Figure 15.
Confusion Matrix of The Proposed Deep Learning Model for Multi Classification. (a) iD CNN. (b) C-CNN.
Figure 15.
Confusion Matrix of The Proposed Deep Learning Model for Multi Classification. (a) iD CNN. (b) C-CNN.

Figure 16.
Confusion Matrix of The Proposed Deep Learning Model for Binary Classification (a) iD CNN. (b) C-CNN.
Figure 16.
Confusion Matrix of The Proposed Deep Learning Model for Binary Classification (a) iD CNN. (b) C-CNN.

Figure 17.
Plot of The Importance of The Input Features.

Figure 18.
Brief Comparison of The Proposed System in different scenarios.


Table 1.
Sample of iterations for Hyperparameter Optimization.
| Hyper Parameter | Accuracy | |||||
|---|---|---|---|---|---|---|
| No. of Filters | Activation Function | Dropout | Epochs | Learning Rate | Optimizer | |
| 128 | relu | 0.4 | 150 | 0.01 | adam | 1 |
| 256 | relu | 0.2 | 200 | 0.001 | rmsprop | 1 |
| 256 | relu | 0.3 | 150 | 0.01 | adam | 1 |
| 256 | relu | 0.2 | 150 | 0.001 | rmsprop | 0.99900794 |
| 64 | relu | 0.3 | 150 | 0.01 | rmsprop | 0.99900794 |
| 256 | relu | 0.2 | 200 | 0.01 | rmsprop | 0.99900794 |
| 128 | relu | 0.3 | 200 | 0.01 | adam | 0.99900794 |
| 256 | relu | 0.2 | 150 | 0.001 | adam | 0.99900794 |
| 64 | relu | 0.4 | 100 | 0.001 | rmsprop | 0.991071403 |
| 64 | relu | 0.4 | 150 | 0.001 | adam | 0.990079343 |
| 64 | relu | 0.3 | 100 | 0.01 | adam | 0.990079343 |
| 64 | relu | 0.4 | 100 | 0.01 | adam | 0.989087284 |
| 256 | relu | 0.4 | 100 | 0.001 | adam | 0.988095224 |
| 256 | relu | 0.2 | 100 | 0.001 | adam | 0.987103164 |
| 256 | relu | 0.3 | 200 | 0.01 | adam | 0.986111104 |
| 56 | 56 | 75 | 96 | 52 | 56 | 72 |
| 59 | 68 | 88 | 91 | 57 | 62 | 65 |
| 50 | 54 | 18 | 77 | 71 | 59 | 34 |
Table 2.
Hyperparameters of The Proposed Methods.
| Model | Hyperparameters |
|---|---|
| SVM | C: 275 gamma: ‘scale’ kernel: ‘rbf’ |
| RF | n_estimators:79 Criterion: ‘entropy’ |
| DT | criterion: ‘gini’ min_samples_leaf: 1 min_samples_split: 2 ccp_alpha: 0 |
| KNN | n_neighbors:1 leaf_size: 30 metric: ‘minkowski’ p: 2 weights’: ‘uniform’ |
| QDA | tol = 0.0001 |
| MLP | Num_hidden_layers:2 hidden_layer_sizes: [34,35] activation: ‘relu’ max_iter: 200 solver: ‘adam’ |
| LR | solver: ‘lbfgs’ C: 1.0 fit_intercept: True |
| CNN | Optimizer: adam Epochs: 150 Batch size: 20 Activation function: relu Number of filters: 128 Dropout: 0.4 Learning rate: 0.01 |
| C-CNN | Optimizer: adam Epochs: 150 Batch size: 20 Activation function: relu Number of filters: 128 Dropout: 0.4 Learning rate: 0.01 |
Table 3.
Brief Comparison among The Precision of The Proposed Machine Learning Models in Different Domains.
Table 3.
Brief Comparison among The Precision of The Proposed Machine Learning Models in Different Domains.
| Scenario | Model | Feature Extraction Method | |||||||
|---|---|---|---|---|---|---|---|---|---|
| Time Domain | Time Domain + DWT | FFT | FFT + DWT | DCT | DCT + DWT | DST | DST + DWT | ||
| Multiclass | SVM | 41 | 50 | 89 | 87 | 50 | 50 | 48 | 48 |
| RF | 47 | 56 | 84 | 89 | 49 | 46 | 42 | 48 | |
| DT | 38 | 42 | 67 | 73 | 32 | 41 | 47 | 29 | |
| KNN | 43 | 51 | 82 | 90 | 38 | 38 | 34 | 34 | |
| QDA | 37 | 44 | 84 | 88 | 36 | 33 | 35 | 41 | |
| MLP | 39 | 40 | 82 | 87 | 42 | 44 | 48 | 44 | |
| L.R. | 43 | 43 | 86 | 90 | 40 | 44 | 49 | 41 | |
| CNN | 43 | 52 | 71 | 79 | 42 | 47 | 53 | 43 | |
| C-CNN | 34 | 56 | 28 | 47 | 30 | 18 | 20 | 44 | |
| Binary-Classes | SVM | 41 | 57 | 77 | 97 | 63 | 63 | 68 | 68 |
| RF | 58 | 67 | 83 | 96 | 68 | 65 | 61 | 67 | |
| DT | 53 | 57 | 82 | 82 | 41 | 50 | 66 | 48 | |
| KNN | 47 | 55 | 70 | 92 | 53 | 53 | 51 | 51 | |
| QDA | 47 | 54 | 69 | 92 | 57 | 54 | 42 | 48 | |
| MLP | 51 | 52 | 64 | 93 | 57 | 59 | 63 | 59 | |
| L.R. | 56 | 56 | 75 | 96 | 52 | 56 | 72 | 64 | |
| CNN | 59 | 68 | 88 | 91 | 57 | 62 | 65 | 55 | |
| C-CNN | 50 | 54 | 18 | 77 | 71 | 59 | 34 | 48 | |
Table 4.
Brief Comparison among The Recall of The Proposed Machine Learning Models in Different Domains.
Table 4.
Brief Comparison among The Recall of The Proposed Machine Learning Models in Different Domains.
| Scenario | Classifier | Feature Extraction Method | |||||||
|---|---|---|---|---|---|---|---|---|---|
| Time Domain | Time Domain + DWT | FFT | FFT + DWT | DCT | DCT + DWT | DST | DST + DWT | ||
| Multiclass | SVM | 41 | 50 | 84 | 87 | 47 | 49 | 48 | 48 |
| RF | 45 | 55 | 83 | 89 | 48 | 46 | 45 | 42 | |
| DT | 37 | 41 | 66 | 73 | 32 | 40 | 38 | 47 | |
| KNN | 36 | 44 | 81 | 85 | 32 | 35 | 34 | 34 | |
| QDA | 36 | 43 | 75 | 87 | 36 | 40 | 38 | 35 | |
| MLP | 39 | 40 | 82 | 87 | 41 | 44 | 46 | 48 | |
| L.R. | 42 | 42 | 86 | 90 | 39 | 44 | 45 | 49 | |
| CNN | 43 | 52 | 69 | 79 | 42 | 47 | 47 | 52 | |
| C-CNN | 33 | 37 | 27 | 48 | 30 | 18 | 30 | 18 | |
| Binary-Classes | SVM | 48 | 57 | 68 | 96 | 61 | 63 | 65 | 65 |
| RF | 57 | 67 | 83 | 96 | 67 | 65 | 63 | 60 | |
| DT | 53 | 57 | 82 | 82 | 42 | 50 | 57 | 66 | |
| KNN | 47 | 55 | 70 | 91 | 49 | 52 | 51 | 51 | |
| QDA | 47 | 54 | 59 | 89 | 46 | 50 | 45 | 42 | |
| MLP | 51 | 52 | 64 | 93 | 55 | 58 | 61 | 63 | |
| L.R. | 56 | 56 | 71 | 96 | 51 | 56 | 67 | 71 | |
| CNN | 59 | 68 | 88 | 89 | 57 | 62 | 60 | 65 | |
| C-CNN | 50 | 54 | 18 | 51 | 71 | 59 | 34 | 48 | |
Table 5.
Brief Comparison among The F1-score of The Proposed Machine Learning Models in Different Domains.
Table 5.
Brief Comparison among The F1-score of The Proposed Machine Learning Models in Different Domains.
| Scenario | Classifier | Feature Extraction Method | |||||||
|---|---|---|---|---|---|---|---|---|---|
| Time Domain | Time Domain + DWT | FFT | FFT + DWT | DCT | DCT + DWT | DST | DST + DWT | ||
| Multiclass | SVM | 39 | 58 | 84 | 86 | 45 | 48 | 47 | 47 |
| RF | 44 | 55 | 84 | 89 | 48 | 46 | 45 | 42 | |
| DT | 37 | 41 | 66 | 73 | 32 | 40 | 38 | 47 | |
| KNN | 34 | 43 | 81 | 85 | 26 | 32 | 34 | 34 | |
| QDA | 37 | 44 | 73 | 87 | 36 | 31 | 30 | 27 | |
| MLP | 38 | 39 | 82 | 87 | 41 | 44 | 45 | 47 | |
| L.R. | 42 | 42 | 86 | 90 | 39 | 44 | 45 | 49 | |
| CNN | 43 | 51 | 70 | 78 | 42 | 46 | 46 | 51 | |
| C-CNN | 32 | 36 | 29 | 47 | 30 | 22 | 29 | 17 | |
| Binary-Classes | SVM | 38 | 57 | 65 | 96 | 60 | 63 | 63 | 63 |
| RF | 56 | 67 | 83 | 96 | 67 | 65 | 62 | 59 | |
| DT | 53 | 57 | 82 | 82 | 42 | 50 | 57 | 66 | |
| KNN | 44 | 53 | 70 | 91 | 46 | 52 | 48 | 48 | |
| QDA | 47 | 54 | 53 | 90 | 59 | 54 | 45 | 42 | |
| MLP | 51 | 52 | 64 | 93 | 55 | 58 | 61 | 63 | |
| L.R. | 56 | 56 | 69 | 96 | 51 | 56 | 67 | 71 | |
| CNN | 59 | 67 | 88 | 90 | 58 | 62 | 60 | 65 | |
| C-CNN | 50 | 54 | 17 | 64 | 66 | 58 | 34 | 48 | |
Table 6.
Brief Comparison among The Accuracy of The Proposed Machine Learning Models in Different Domains.
Table 6.
Brief Comparison among The Accuracy of The Proposed Machine Learning Models in Different Domains.
| Scenario | Classifier | Feature Extraction Method | |||||||
|---|---|---|---|---|---|---|---|---|---|
| Time Domain | Time Domain + DWT | FFT | FFT + DWT | DCT | DCT + DWT | DST | DST + DWT | ||
| Multiclass | SVM | 41 | 50 | 84 | 86 | 47 | 49 | 48 | 48 |
| RF | 45 | 55 | 83 | 89 | 48 | 46 | 45 | 42 | |
| DT | 37 | 41 | 66 | 73 | 32 | 40 | 38 | 47 | |
| KNN | 36 | 43 | 81 | 84 | 32 | 35 | 34 | 34 | |
| QDA | 36 | 43 | 75 | 87 | 36 | 33 | 38 | 35 | |
| MLP | 39 | 40 | 82 | 87 | 41 | 44 | 46 | 48 | |
| L.R. | 42 | 42 | 86 | 90 | 39 | 44 | 45 | 49 | |
| CNN | 43 | 51 | 69 | 78 | 42 | 47 | 47 | 52 | |
| C-CNN | 33 | 37 | 27 | 48 | 30 | 18 | 30 | 18 | |
| Binary-Classes | SVM | 48 | 57 | 68 | 96 | 61 | 63 | 65 | 65 |
| RF | 57 | 67 | 83 | 96 | 67 | 65 | 63 | 60 | |
| DT | 53 | 57 | 82 | 83 | 42 | 50 | 57 | 66 | |
| KNN | 47 | 54 | 70 | 91 | 49 | 52 | 51 | 51 | |
| QDA | 47 | 54 | 59 | 90 | 57 | 54 | 45 | 42 | |
| MLP | 51 | 52 | 64 | 93 | 55 | 58 | 61 | 63 | |
| L.R. | 56 | 56 | 71 | 96 | 51 | 56 | 67 | 71 | |
| CNN | 59 | 67 | 88 | 90 | 57 | 62 | 60 | 65 | |
| C-CNN | 50 | 54 | 18 | 64 | 45 | 59 | 34 | 48 | |
Table 7.
Brief Comparison among The Proposed Machine Learning Models.
| Scenario | Model | Precision | Recall | F1-Score | Accuracy | MCC |
|---|---|---|---|---|---|---|
| Multiclass | SVM | 87 | 87 | 86 | 86 | 80 |
| RF | 89 | 89 | 89 | 89 | 83 | |
| DT | 73 | 73 | 73 | 73 | 59 | |
| KNN | 90 | 85 | 85 | 84 | 79 | |
| QDA | 88 | 87 | 87 | 87 | 75 | |
| MLP | 87 | 87 | 87 | 87 | 81 | |
| L.R. | 90 | 90 | 90 | 90 | 86 | |
| CNN | 79 | 79 | 78 | 78 | 73 | |
| C-CNN | 47 | 48 | 47 | 48 | 42 | |
| Binary-Classes | SVM | 97 | 96 | 96 | 96 | 93 |
| RF | 96 | 96 | 96 | 96 | 92 | |
| DT | 82 | 82 | 82 | 83 | 65 | |
| KNN | 92 | 91 | 91 | 91 | 83 | |
| QDA | 92 | 89 | 90 | 90 | 81 | |
| MLP | 93 | 93 | 93 | 93 | 87 | |
| L.R. | 96 | 96 | 96 | 96 | 94 | |
| CNN | 91 | 89 | 90 | 90 | 82 | |
| C-CNN | 77 | 51 | 64 | 64 | 59 |
Table 8.
Brief Comparison among The Proposed Models and Works in The Literature.
| Work | Year | Feature Extractor | Classifier | Accuracy |
|---|---|---|---|---|
| Corea et al. [40] | 2014 | Multimodal Analysis | ANN | 83 |
| Ko et al. [41] | 2015 | FFT | ANN | 90 |
| Xiong et al. [14] | 2016 | AE and SE | SVM | 90 |
| Chai et al. [15] | 2016 | Entropy Rate Round Minimization Analysis | BNN | 88.2 |
| Yin et al. [16] | 2017 | FE | SVM | 95 |
| Karuppusamy et al. [25] | 2020 | DNN | DNN | 73 |
| Lui et al. [42] | 2020 | Deep Transfer Learning | Deep Learning | 93 |
| Proposed | 2023 | FFT + DWT | SVM | 96 |
| FFT + DWT | RF | 96 | ||
| FFT + DWT | LR | 96 |
Disclaimer/Publisher’s Note: The statements, opinions and data contained in all publications are solely those of the individual author(s) and contributor(s) and not of MDPI and/or the editor(s). MDPI and/or the editor(s) disclaim responsibility for any injury to people or property resulting from any ideas, methods, instructions or products referred to in the content. |
© 2023 by the authors. Licensee MDPI, Basel, Switzerland. This article is an open access article distributed under the terms and conditions of the Creative Commons Attribution (CC BY) license (https://creativecommons.org/licenses/by/4.0/).
Share and Cite
MDPI and ACS Style
Sedik, A.; Marey, M.; Mostafa, H. WFT-Fati-Dec: Enhanced Fatigue Detection AI System Based on Wavelet Denoising and Fourier Transform. Appl. Sci. 2023, 13, 2785. https://0-doi-org.brum.beds.ac.uk/10.3390/app13052785
AMA Style
Sedik A, Marey M, Mostafa H. WFT-Fati-Dec: Enhanced Fatigue Detection AI System Based on Wavelet Denoising and Fourier Transform. Applied Sciences. 2023; 13(5):2785. https://0-doi-org.brum.beds.ac.uk/10.3390/app13052785
Chicago/Turabian StyleSedik, Ahmed, Mohamed Marey, and Hala Mostafa. 2023. "WFT-Fati-Dec: Enhanced Fatigue Detection AI System Based on Wavelet Denoising and Fourier Transform" Applied Sciences 13, no. 5: 2785. https://0-doi-org.brum.beds.ac.uk/10.3390/app13052785
Note that from the first issue of 2016, this journal uses article numbers instead of page numbers. See further details here.