1. Introduction
Osteoporosis is a degenerative disease of the bones caused by decreased bone quality and density; it is commonly found in the elderly. With reduced bone quality and density in cases of osteoporosis, bones will become more fragile and carry a high risk of bone fractures. Osteoporosis is usually detected based on DEXA (dual-energy X-ray absorptiometry) data examination for BMD evaluation, with manual inspection by specialists. Automatized detection of osteoporosis based on image modalities is now possible based on artificial intelligence (AI)/machine learning (ML). However, joint issues such as the limited number of data and attributes extracted from the image are still limiting the enhancement of AI/ML input features. To solve this problem, we have tried to adopt signal-processing techniques from other disciplines (e.g., the geosciences discipline) to enhance the attributes/features of medical image processing.
There are similarities between the problems experienced in the medical field and in other disciplines such as geoscience, and these are prevalent when their technologies attempt to understand the object behind the surface (either geobodies in the geoscience domain or inside the human body). Various technologies commonly used in both disciplines include destructive and non-destructive methods. As an example, the data in the geosciences discipline are mostly recorded as the signal. In contrast, the others in the medical field are kept as an image. However, both technologies are designed to improve the understanding of the object beneath the surface. Thus, a key question is whether it is possible to adopt technology from one discipline and apply it to the others to improve their workflow for specific purposes, for example, through implementing new technologies where artificial intelligence (AI)/machine learning (ML) are applied.
One of the key techniques in geoscience for subsurface characterization is the seismic method. The seismic method is a non-destructive method used to analyze the subsurface, wherein acoustic waves from an active seismic source are recorded as a signal and analyzed. Data processing utilizes a variety of signal-processing techniques to improve the resulting image. The other challenging problem in geosciences is the case of determining the optimum dew point pressure, which is very important during the production of hydrocarbon from a targeted reservoir. Selection of a suitable empirical model can be achieved by applying hybrid neuro-fuzzy [
1]. Similarly, in medicine, different apparatuses such as X-ray scanning machines have been used to image the human organs inside the body. The effectiveness of the interdisciplinary transfer of technology within medical geology is most intriguing, wherein the concept of geology in the geosciences discipline is applied to link the natural environment and human health for the betterment of global society [
2].
This paper addresses the possibility of adopting the standard data-processing techniques into the image processing of medical data to enhance features that can be used for further studies, such as the application of AI/ML for better automatization and recognition in medical cases. This paper aims to enhance the image attributes taken from CT scanning to solve some specific issues in osteoporosis identification.
2. Literature Review
2.1. Medical Problem: Osteoporosis
Osteoporosis is a common disease, especially for the elderly. Osteoporosis is defined as a disease characterized by reduced bone mass and alteration of bone architecture resulting in increased bone fragility and fracture risk [
3]. People with osteoporosis usually also have a high risk of bone fractures. However, this disease is treatable, although early detection is often difficult. The diagnosis is usually determined by analyzing the bone mineral densitometry based on dual energy X-ray absorptiometry (DEXA) scanning. Unfortunately, DEXA has several limitations in assessing the severity of osteoporosis at certain locations in the human body. Density evaluation based on DEXA also lacks standardization, especially in measuring hard and soft tissues. There are large discrepancies in the measurement results from different DEXA instrument manufacturers [
4]. Furthermore, DEXA is not always available in certain hospitals or clinics. Hence, a diagnostic alternative using different modalities, e.g., utilizing CT scans, is needed to cover the limitations of the existing method.
Bone quality is crucial to a person’s health, especially in supporting the function of the body’s skeleton. Low-quality bones due to diseases such as osteoporosis result in bone fragility, which causes the bones to become severely vulnerable to fractures from intentional and unintentional excessive loading during daily activities. Osteoporosis is a systemic skeletal disease indicated by a decrease in bone density. This condition causes the bones to become more brittle and imposes a high risk of bone fractures. Osteoporosis can affect all types of bones, including the femur, spine, and wrist. Osteoporosis is found in about 200 million patients, with a higher potential for bone fractures in women [
5].
The risk factor for fractures in osteoporosis generally increases with age and gender, particularly in post-menopausal women, people with low body weight, and people with a history of parental fractures. Osteoporosis can be diagnosed by looking at bone fragility using dual energy X-ray absorptiometry (DEXA), which is the main standard for diagnosing osteoporosis without fractures. However, it is widely reported that DEXA scans of diagnosed patients with fractures reveal normal BMD (bone mineral density), whereas diagnoses based on CT scans indicate osteoporosis. This shows that there is still room for the sensitivity of DEXA to be improved for better osteoporosis detection. It is inherently necessary to have alternative scanning techniques that are more sensitive than the existing technique for the early prognosis of osteoporosis.
The ability to diagnose osteoporosis earlier on can reduce the risk of bone fractures. Effective medical action can be undertaken if the symptoms of osteoporosis are readily identified and the patient exercises proper caution. However, early detection of osteoporosis symptoms is sometimes difficult due to limited diagnostic techniques from existing technology. Lack of sensitivity from the current imaging techniques and limited imaging data limits the ability to detect the quality of bone directly. The widely utilized method that directly indicates bone quality is executed by reading the grayscale level; this level is known as the Hounsfield unit (HU) on CT scan data. However, this HU reading is often ambiguous, as it is not very sensitive to indicating bone quality, more specifically in cases involving osteoporosis.
Thus, this study aims to develop an image attribute to differentiate normal bone from osteoporosis bone which can be used as an alternative technology and that is safe for detecting osteoporosis and helping AI/ML studies in the future for automated identification of the disease. The success of this technology is expected to help doctors enforce the necessary medical measures earlier to treat osteoporotic patients.
2.2. Bone Quality and Common Imaging Technique
Bones provide the primary support for our body and form our shape. Bone formation mainly constitutes the cells and bone matrix. The bone matrix itself consists of inorganic components, which include about 69% hydroxyapatite and 22% organic components of collagen as the main constituents [
6]. From a physiological point of view, bones consist of supporting cells called osteoblasts and osteocytes, and remodeling cells called osteoclasts. These components are responsible for the dynamic processes that comprise the modeling and remodeling processes inside the bone.
Bones are characterized by stiffness, hardness, and a degree of dynamic processes within the bone, such as modeling and remodeling processes. Based on these characteristics, bone can be categorized into two components: cortical bone and trabecular bone. The cortical bone is dense and surrounds the marrow space, whereas the trabecular bone is a honeycomb-like tissue consisting of interspersed trabecular plates and rods [
6]. Bone quality and quantity are commonly assessed to determine the characteristics of bone geometry and microarchitecture using different modalities of non-destructive methods, such as CT scanning, high-resolution peripheral quantitative CT (HR-pQCT) scanning, high-resolution MRI, and micro-CT scanning.
In the last decade, CT scan machines have been widely proposed as an alternative technology for evaluating bone quality. The device uses a cone-type source and a 2D digital array detector to scan 3D volumes in a single scan. The scanner has the convenience of performing slice scans (up to 64 rows can be obtained at one time) [
7]. With this CT scan technology, the examination time is shortened, and the distortion effect due to the internal movement of the patient during the scan can be reduced.
The quality of the CT scan image is controlled by using the field of view (FOV). If a larger FOV is set, the image quality decreases, the contrast between different tissues is reduced, and the image becomes more scattered (artifacts) [
7,
8,
9]. The quality of the CT scan image also depends on the size of the detector as a voxel area, which is independent of the slice thickness [
10].
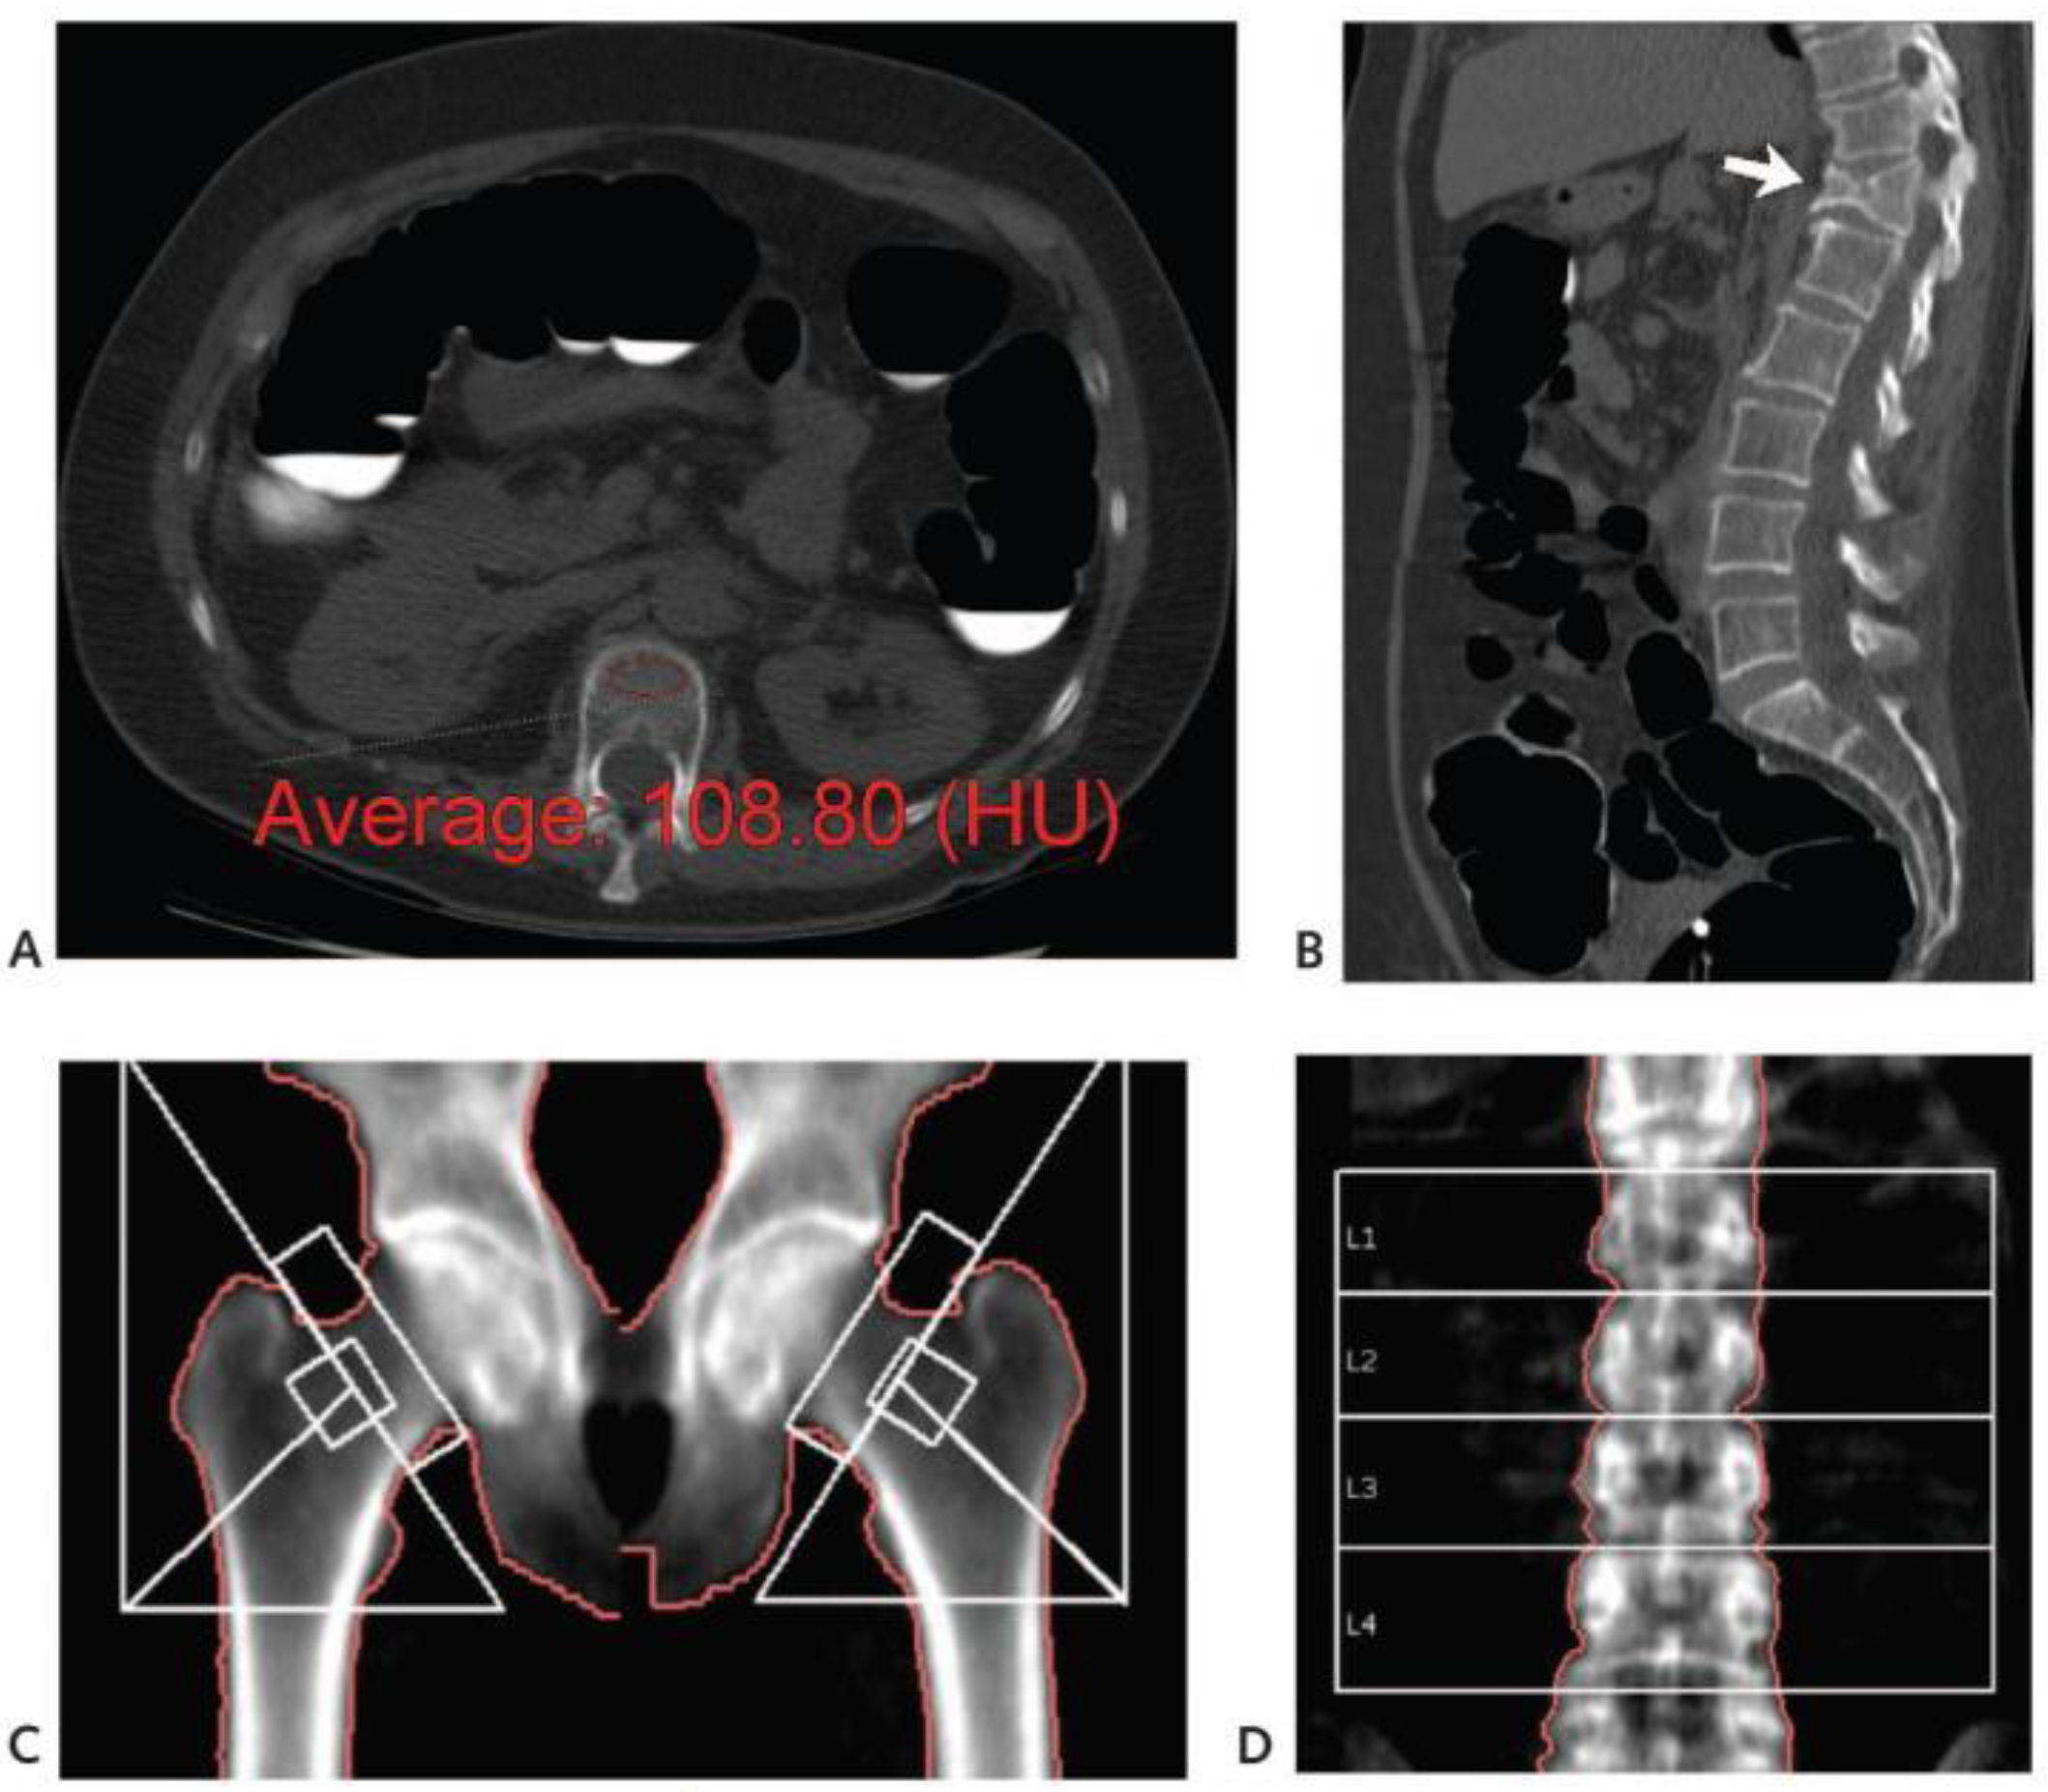
Some researchers have investigated studies on the loss of bone quality using CT scans by looking at CT scans on spinal weakening compared to readings from other methods such as DEXA. An illustration of the detection of weakened bone quality in the spine using a CT scan technique is shown in
Figure 1. In their research, the bone quality was determined from the HU obtained from CT scan data, which was then compared with the standard DEXA method, as shown in
Figure 1D.
2.3. Application of AI/ML- in Medical Image Processing
AI/ML based on medical imaging modalities has been widely used to solve medical problems. It was used as a tool for the early detection of various diseases. Machine learning based on ultrasound images has been used to diagnose breast cancer. In this application, machine learning was trained to identify breast cancer based on time-dependent feature extraction and contourlet transformation techniques by classifying data into three classes: benign, malignant, and healthy control test samples [
12]. It has not only been applied to solve the problem based on images; AI/ML has also been used to solve signal-based problems. Human brain activities will change as a response to a stimulus. Movement intention identification is an example of utilizing AI/ML upon the real-time electro encephalogram (EEG) signal. Automating movement intention identification is very important for controlling the movement of intelligent prosthetics to help patients after amputation. An algorithm satisfying any movement scenario must be developed as accurately as possible. In this case, the different classes of movement, such as resting state, right or left hand movement, left or right foot movement, and others, must be defined accurately. A convolutional neural network (CNN) network has been successfully applied to identify the movement intention based on EEG signal [
13].
The disease is related to a specific human organ or body part appearance. For example, by recognizing the face patient, doctors can diagnose a particular type of disease, such as beta-thalassemia, hyperthyroidism, Down’s syndrome, and leprosy. It is challenging for engineering to automate face recognition to identify specific conditions; however, this may help doctors/practitioners to determine diseases automatically. Deep transfer learning architectures were successfully applied in recognizing deep facial diagnoses based on facial images. Transfer learning can identify 2D face images and classify them into certain diseases related to bone deformities, endocrine disorders, Down’s syndrome, and mycobacterium diseases [
14].
3. Methodology
Osteoporosis does not only tend to manifest in older people, but also in young people who experience bone problems due to specific medical factors and an unhealthy lifestyle. For people who have osteoporosis, their bone density becomes reduced and more brittle. Hence, the expected X-ray response of osteoporotic bone will differ from that of normal bone.
X-ray-based scanning is a common practice for diagnosing osteoporosis at low to high dose rates. Low doses are good for health; however, they will produce a less clear image with a lower resolution or contrast. Meanwhile, the use of high doses of X-rays can improve image quality but also increase radiation exposure. The energy of exposure by X-ray is expressed in the Hounsfield value (HU). It can be seen that if the evaluation of bone quality is based on the HU value, it will greatly depend on the X-ray energy used. This will result in ambiguity when determining the cut-off or limit of normal and osteoporosis indications based on this HU value.
This feasibility study proposes a new parameter that can be used to indicate bone quality without relying on HU, so that it can resolve the ambiguity when CT scans are conducted at different doses. Several imaging attributes adopted from signal processing are generated on each image data scanning. Different modalities of scanning consisting of CT and DEXA scanning were used to see the robustness of the technique. Experiments were carried out on the normal and osteoporosis bone. To quantify the degree or strength of the attribute, an attribute index number is defined as the density of attributes. The definition of the attribute index is as follows:
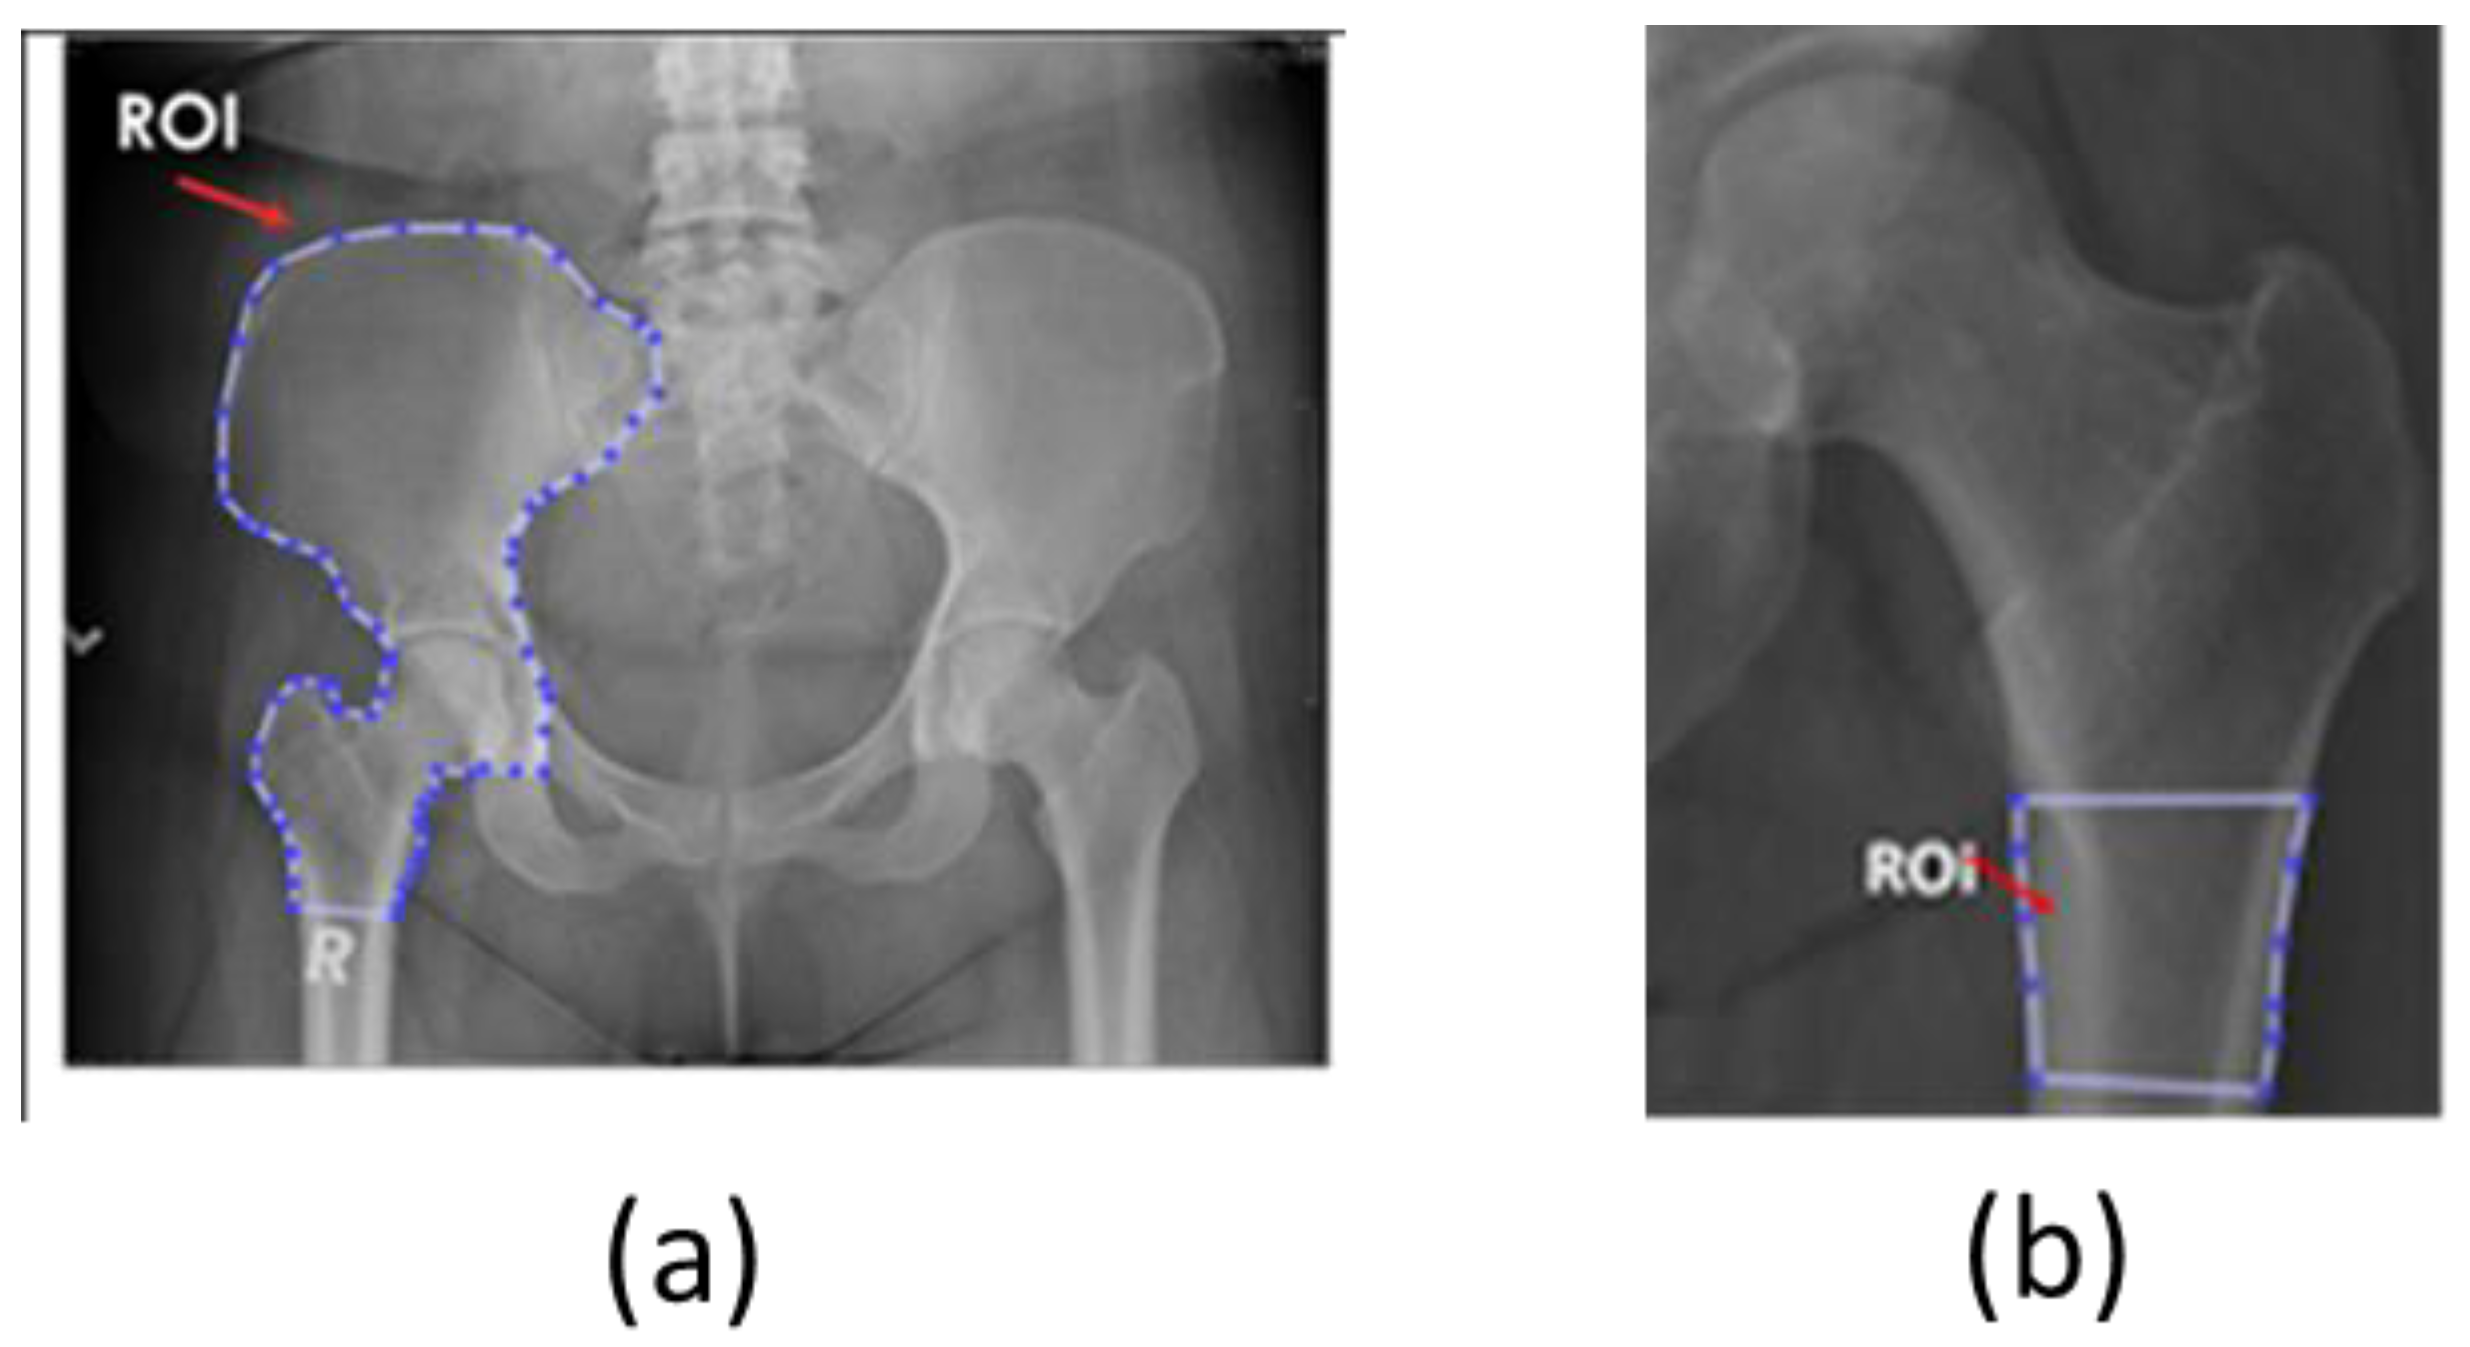
Adopted attributes from the signal-processing technique were calculated on the selected region of interest (ROI), which was picked manually. The target area or ROI was based on the indication of a common osteoporosis location. The ROIs are used in the normal and osteoporotic bone at the same location.
Figure 2 shows an example of ROI selection at the pelvic and hip locations, which will be used for both normal and osteoporosis data.
4. Proposed Method: Adopting a Signal-Processing Technique
When data are recorded as a time series signal, they are usually collected by a specific configuration of a source–receiver arrangement, followed by signal processing to enhance the signal-to-noise ratio. Many techniques have been developed to understand the data for better interpretation, including signal attribute analysis. Signal attributes are generated or extracted from the original signal data by applying specific mathematical expressions to bring the signal data from one domain into other attribute domains. Each attribute has different functionality and characteristics that help in understanding the target object’s behavior.
In general, some attributes that can be extracted from signal data are based on amplitude, frequency, and phase. Amplitude-based attributes provide information on medium properties. Meanwhile, frequency-based attributes indicate the geometry of the object and some absorption properties of the medium. The instantaneous phase attribute is based on the signal phase and is not dependent on amplitude. The usage of phase attributes is more to identify the features such as discontinuity of medium. The phase attribute generally indicates the geometry of the subsurface object, not the type or presence of internal properties of the medium.
4.1. Root Mean Square (RMS) Amplitude
Signal data as the medium response are recorded as an amplitude with a positive and negative value of the time series. The negative and positive values tied to specific medium properties sometimes become difficult to decipher when related to certain phenomena or properties prediction. In such a case, rather than using original signal data, analysis is carried out by converting the signal into root mean square (
RMS) amplitudes, where all the values are positive. The
RMS amplitude is the squared amplitude within a specific interval, as calculated using the following mathematical expression:
where
N is the number of samples, and
Amp is the amplitude of each sample. The calculated
RMS amplitudes can now be directly related to the properties of the medium.
However, interpretations based on amplitude anomalies have their pitfalls due to the non-unique amplitude responses due to the complexity of the constituent of the medium. Sometimes the high amplitudes of the signal are not uniquely related to the certain condition of the medium.
Medical imaging such as CT scanning is conducted to image the human body using X-ray energy. Different media/tissues will absorb X-ray energy differently, which will then be projected into an image as a grayscale or Hounsfield unit (HU). CT scans produce a three-dimensional image in which each voxel of the image indicates the properties of human tissue. A high grayscale value (brighter) is associated with hard tissues such as bones and teeth, while a dimmer (darker) is related to soft tissues such as muscles or lungs. The grayscale values of the pixel in the images resemble the RMS amplitude scale in the time series signal. Analysis based on this value can be used to characterize the properties of human tissues. Unfortunately, different machines of X-ray produce different levels of energy which impact the recorded grayscale values. High grayscale values are sometimes caused not only by hard tissue but also by the source of the X-ray. Hence, the direct interpretation of the grayscale value needs to consider the X-ray energy source used during scanning.
4.2. Frequency
Signal data are also commonly converted from the times series into a frequency domain through Fourier Transform. Further analysis of the frequency domain will give some other information that is particularly related to the resolution and thickness of the targeted object. The Fourier transform transforms the time series signal into a one-dimensional (1D) signal and is also applicable for various data in lateral distribution, such as the two-dimensional (2D) image. Fourier transforms will capture the global frequency for the entire signal. Consequently, if the local frequencies are needed for analysis, this technique may not capture them. As an alternative, wavelet transforms may be a suitable choice. Wavelet transforms are able to decompose the signal into a localized area.
A mathematical expression of the discrete Fourier transform (DFT) is presented in Equation (3) to show how to transform the image into the frequency domain. Application of DFT in image processing can show the most frequent pixels in one corner and the least frequent in the other corner. Additionally, by transforming the image into a frequency domain, a particular filter based on frequency can be applied.
The DFT of the image with the size MxN is formulated as follows:
where
f(i,j) is the image in the spatial domain, and
F(k,l) is the Fourier transform pair in Fourier space. The maximum frequency is defined by
The frequency attribute extracted from signal data is dependent on the thickness or geometry of the medium, and has limitations due to tuning and the quality of the signal-to-noise ratio. The high frequency of signal sometimes comes from noise, but is usually handled during the data processing. In medical imaging, images are regarded as a signal whereby the frequency component is related to the quality of the signal and is also handled during image processing. The component of a low-frequency image will be related to the high peak signal-to-noise ratio. Laterally, the frequency in the image is related to the distribution of the object, which is also related to the artifact due to scattering when the X-ray signal enters very hard tissue.
4.3. Instantaneous Phase
Raw signal data are recorded as a real value of time series. However, during analysis, the signal can be converted into complex series by adding the Hilbert transform of the real signal to an original signal series. The mathematical expressions of the complex signals of time series are
where
c(
t) is a complex signal,
s(
t) is a real signal time series,
H{
s(
t)} is a Hilbert transform of the real part of the time series signal, and ∅(
t) is an instantaneous phase of the time series. The instantaneous phase ∅(
t) is taken as an arc tangent of the Hilbert transform of
s(
t) and
s(
t):
The instantaneous phase attribute is an amplitude-independent signal attribute; hence, this attribute is commonly used to identify structure rather than properties. The strata of the medium become more detailed by displaying this attribute. As this attribute is not dependent on amplitude, the attribute does not indicate the internal properties of the layers. However, this attribute can highlight a good record of the strata of the medium. It is predicted that if this attribute is adopted for medical imaging analysis, it can produce a different visualization between normal and osteoporosis bone, as the osteoporosis mechanism can change the physical geometry of bone. If osteoporosis can change bone structure, it is expected to be revealed in this attribute.
4.4. First-Time Derivative Attribute (Contrast Attribute)
The first-time derivative attribute is calculated as an envelope rate change of time series data. This attribute shows the strength of energy changes in the medium. It also indicates the strength of absorption of energy in the medium. The first-time derivative attribute is defined as
where
ajk is the envelope at the
j and
k position, while
x and
y are the spatial coordinates. This attribute can be directly implemented into the image processing, where the a is taken from the grayscale image of the CT scan and
x and
y are the coordinates of the pixel, and where
C is the value located in the center of the calculated pixels.
The contrast attribute is directly related to amplitude changes, where the amplitude anomalies indicate the layers’ internal properties. However, due to ambiguity in the amplitude of the time series, the interpretation of the contrast amplitude also leads to ambiguity or non-unique interpretations. This can also occur in X-ray imaging; a density change in human tissue can cause HU contrast. However, the value of the HU contrast itself will lead to ambiguity due to the dependency of HU on X-ray energy used during recording, resulting in difficulties when one cut-off/ threshold value is applied for different scanning modalities. Some statistical studies are needed to determine the cut-off or threshold value for osteoporosis determination.
5. Results and Discussion
Four attributes adopted from the signal processing were tested: grayscale index, frequency index, instantaneous phase index, and contrast index. The scale of the indices was normalized with the scale range of 0–100.
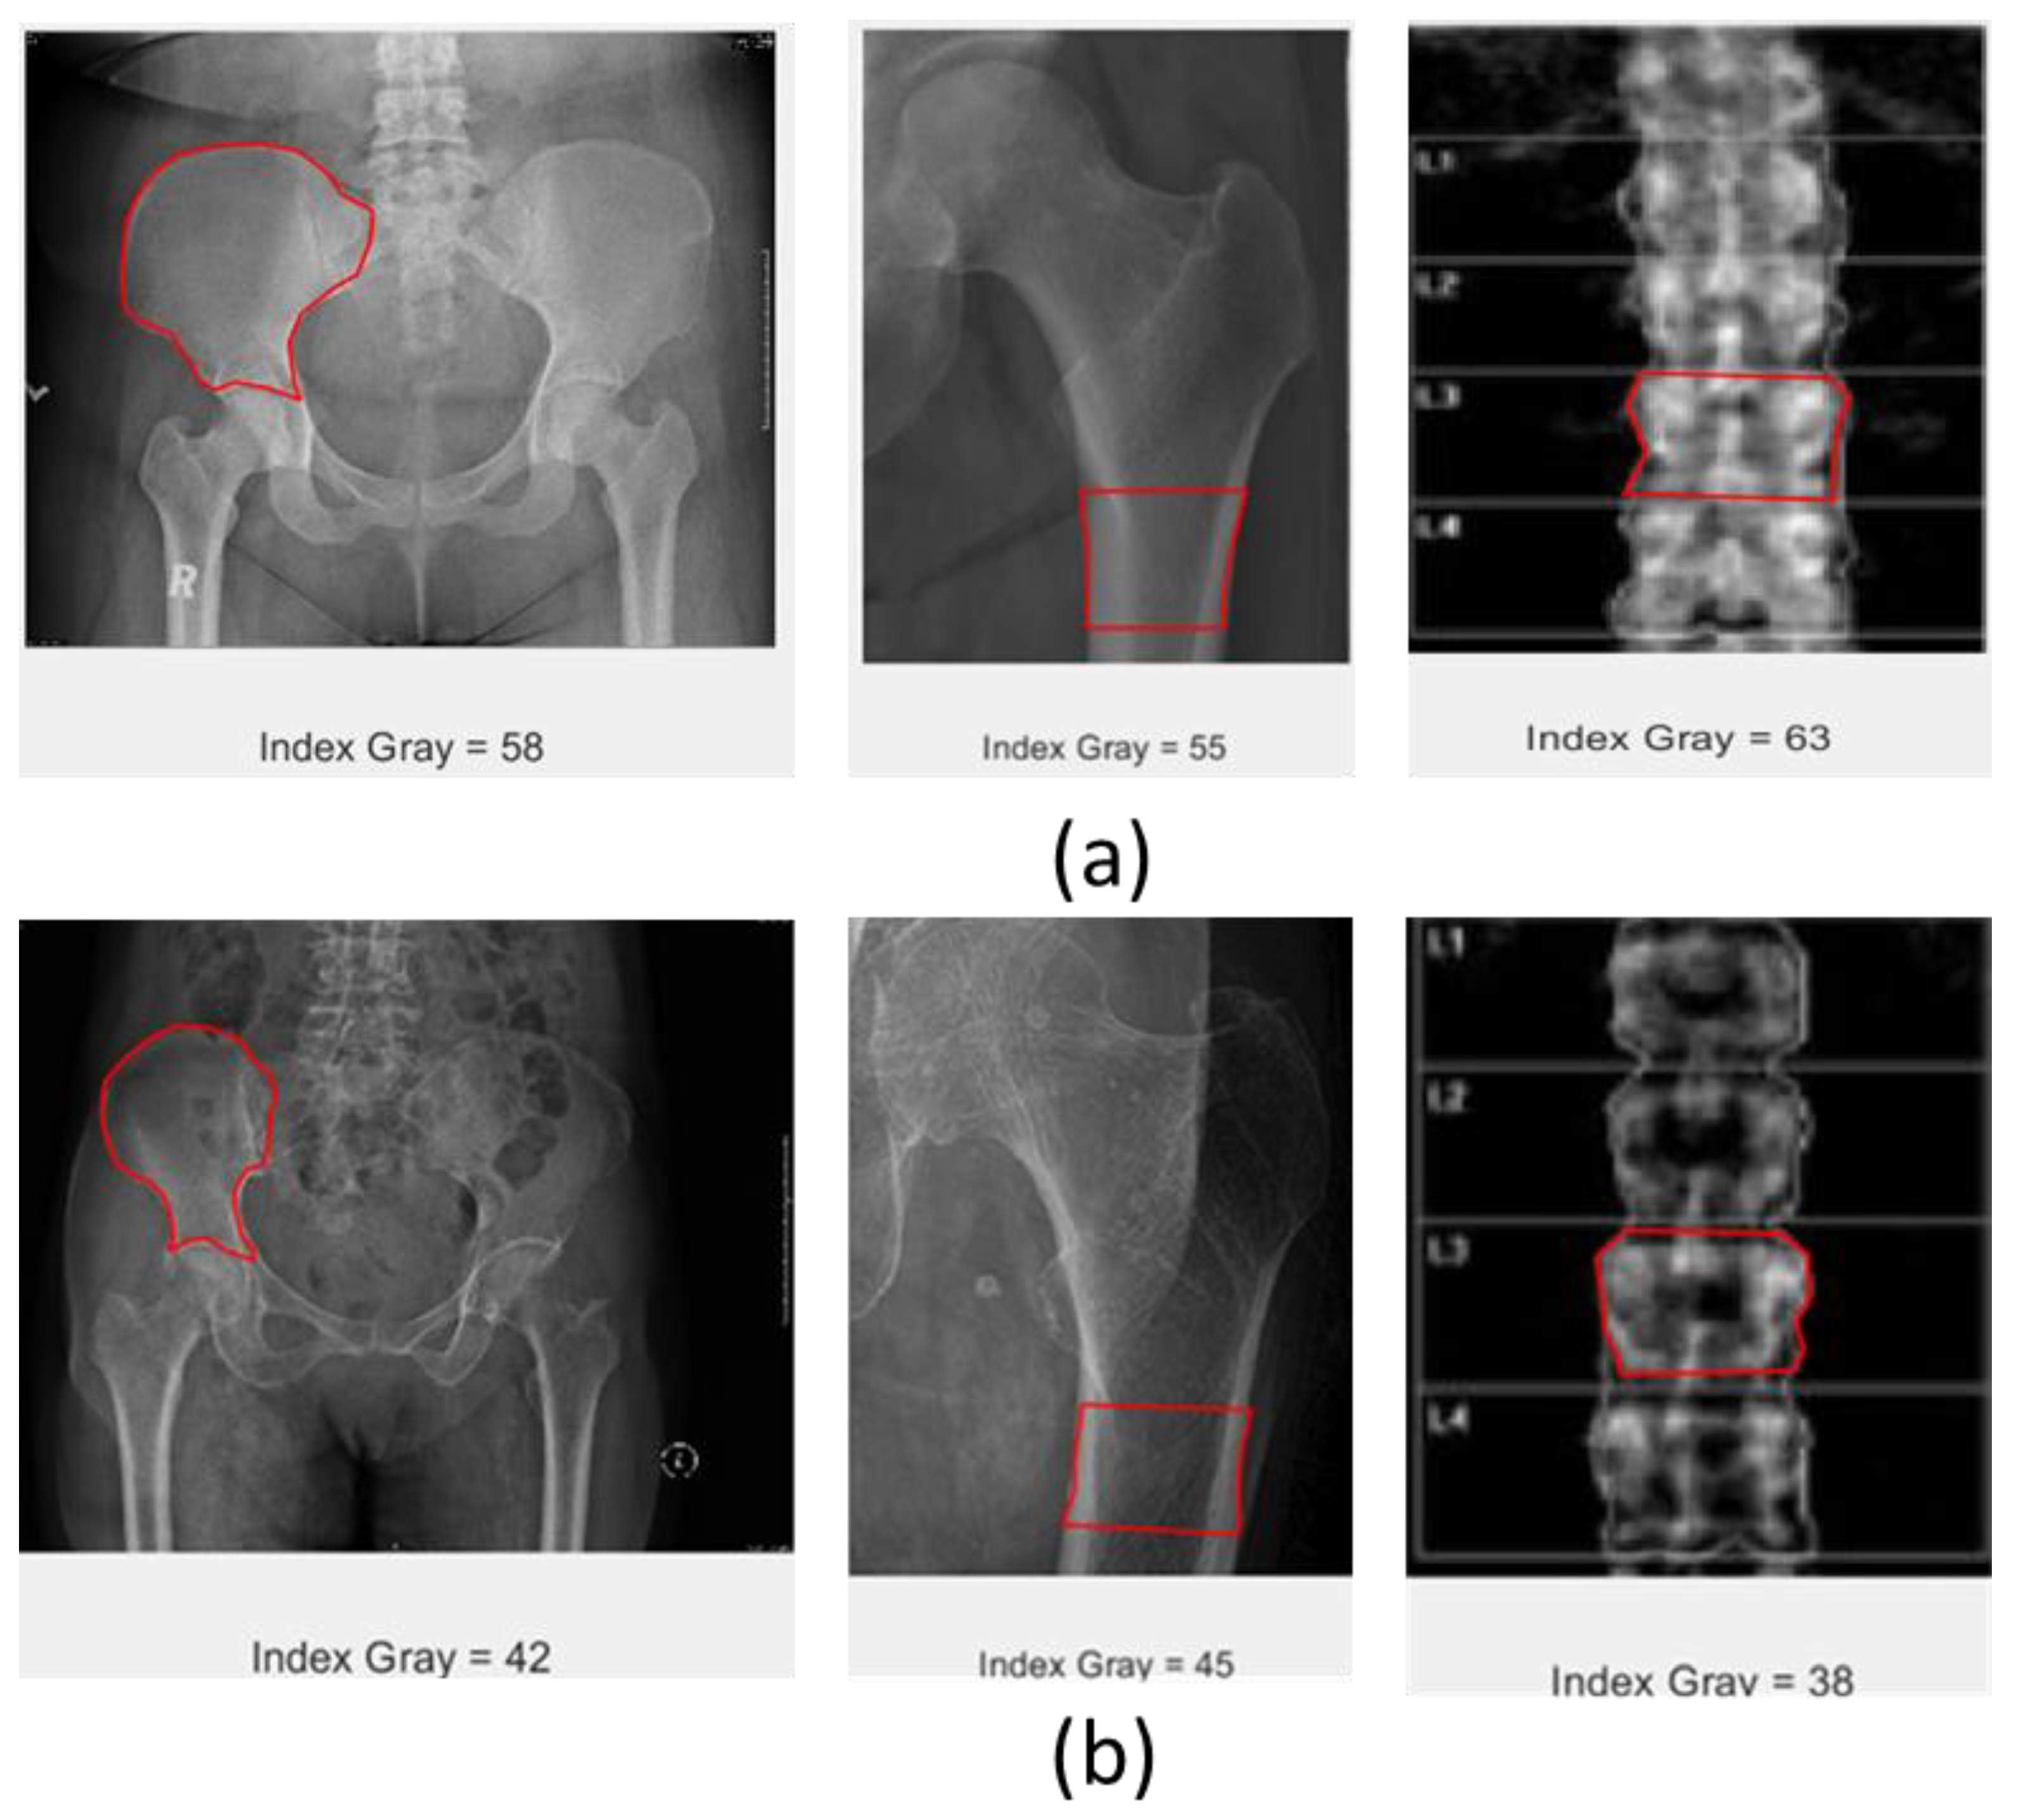
5.1. Grayscale Index
The grayscale index is calculated based on the total grayscale value inside the ROI divided by the total pixels of the ROI. The grayscale value indicates the hardness of the tissues; if tissues are hard, they will be displayed as white, while the soft ones will be darker. The grayscale value is equivalent to amplitude values in the time series signal, and in this case, shows the intensity of the CT scan image of the object. Grayscale index values for patients with normal bone are expected to be higher than those of osteoporosis patients.
Figure 3 illustrates the data sets from the experiment. Data sets consist of CT scan data of the pelvic and hip, and DEXA scans of the lumbar spine. The X-ray energy used for CT scanning is 400 times higher than that used in DEXA scanning. The result showed that the grayscale value tends to decrease from normal to osteoporosis bone, and the difference is quite significant. As expected, healthy bone is harder compared with osteoporotic bone; thus, its appearance upon X-ray scanning will be displayed as brighter than osteoporosis. The grayscale index consistently decreases in both CT scans and DEXA images from normal to osteoporotic bone.
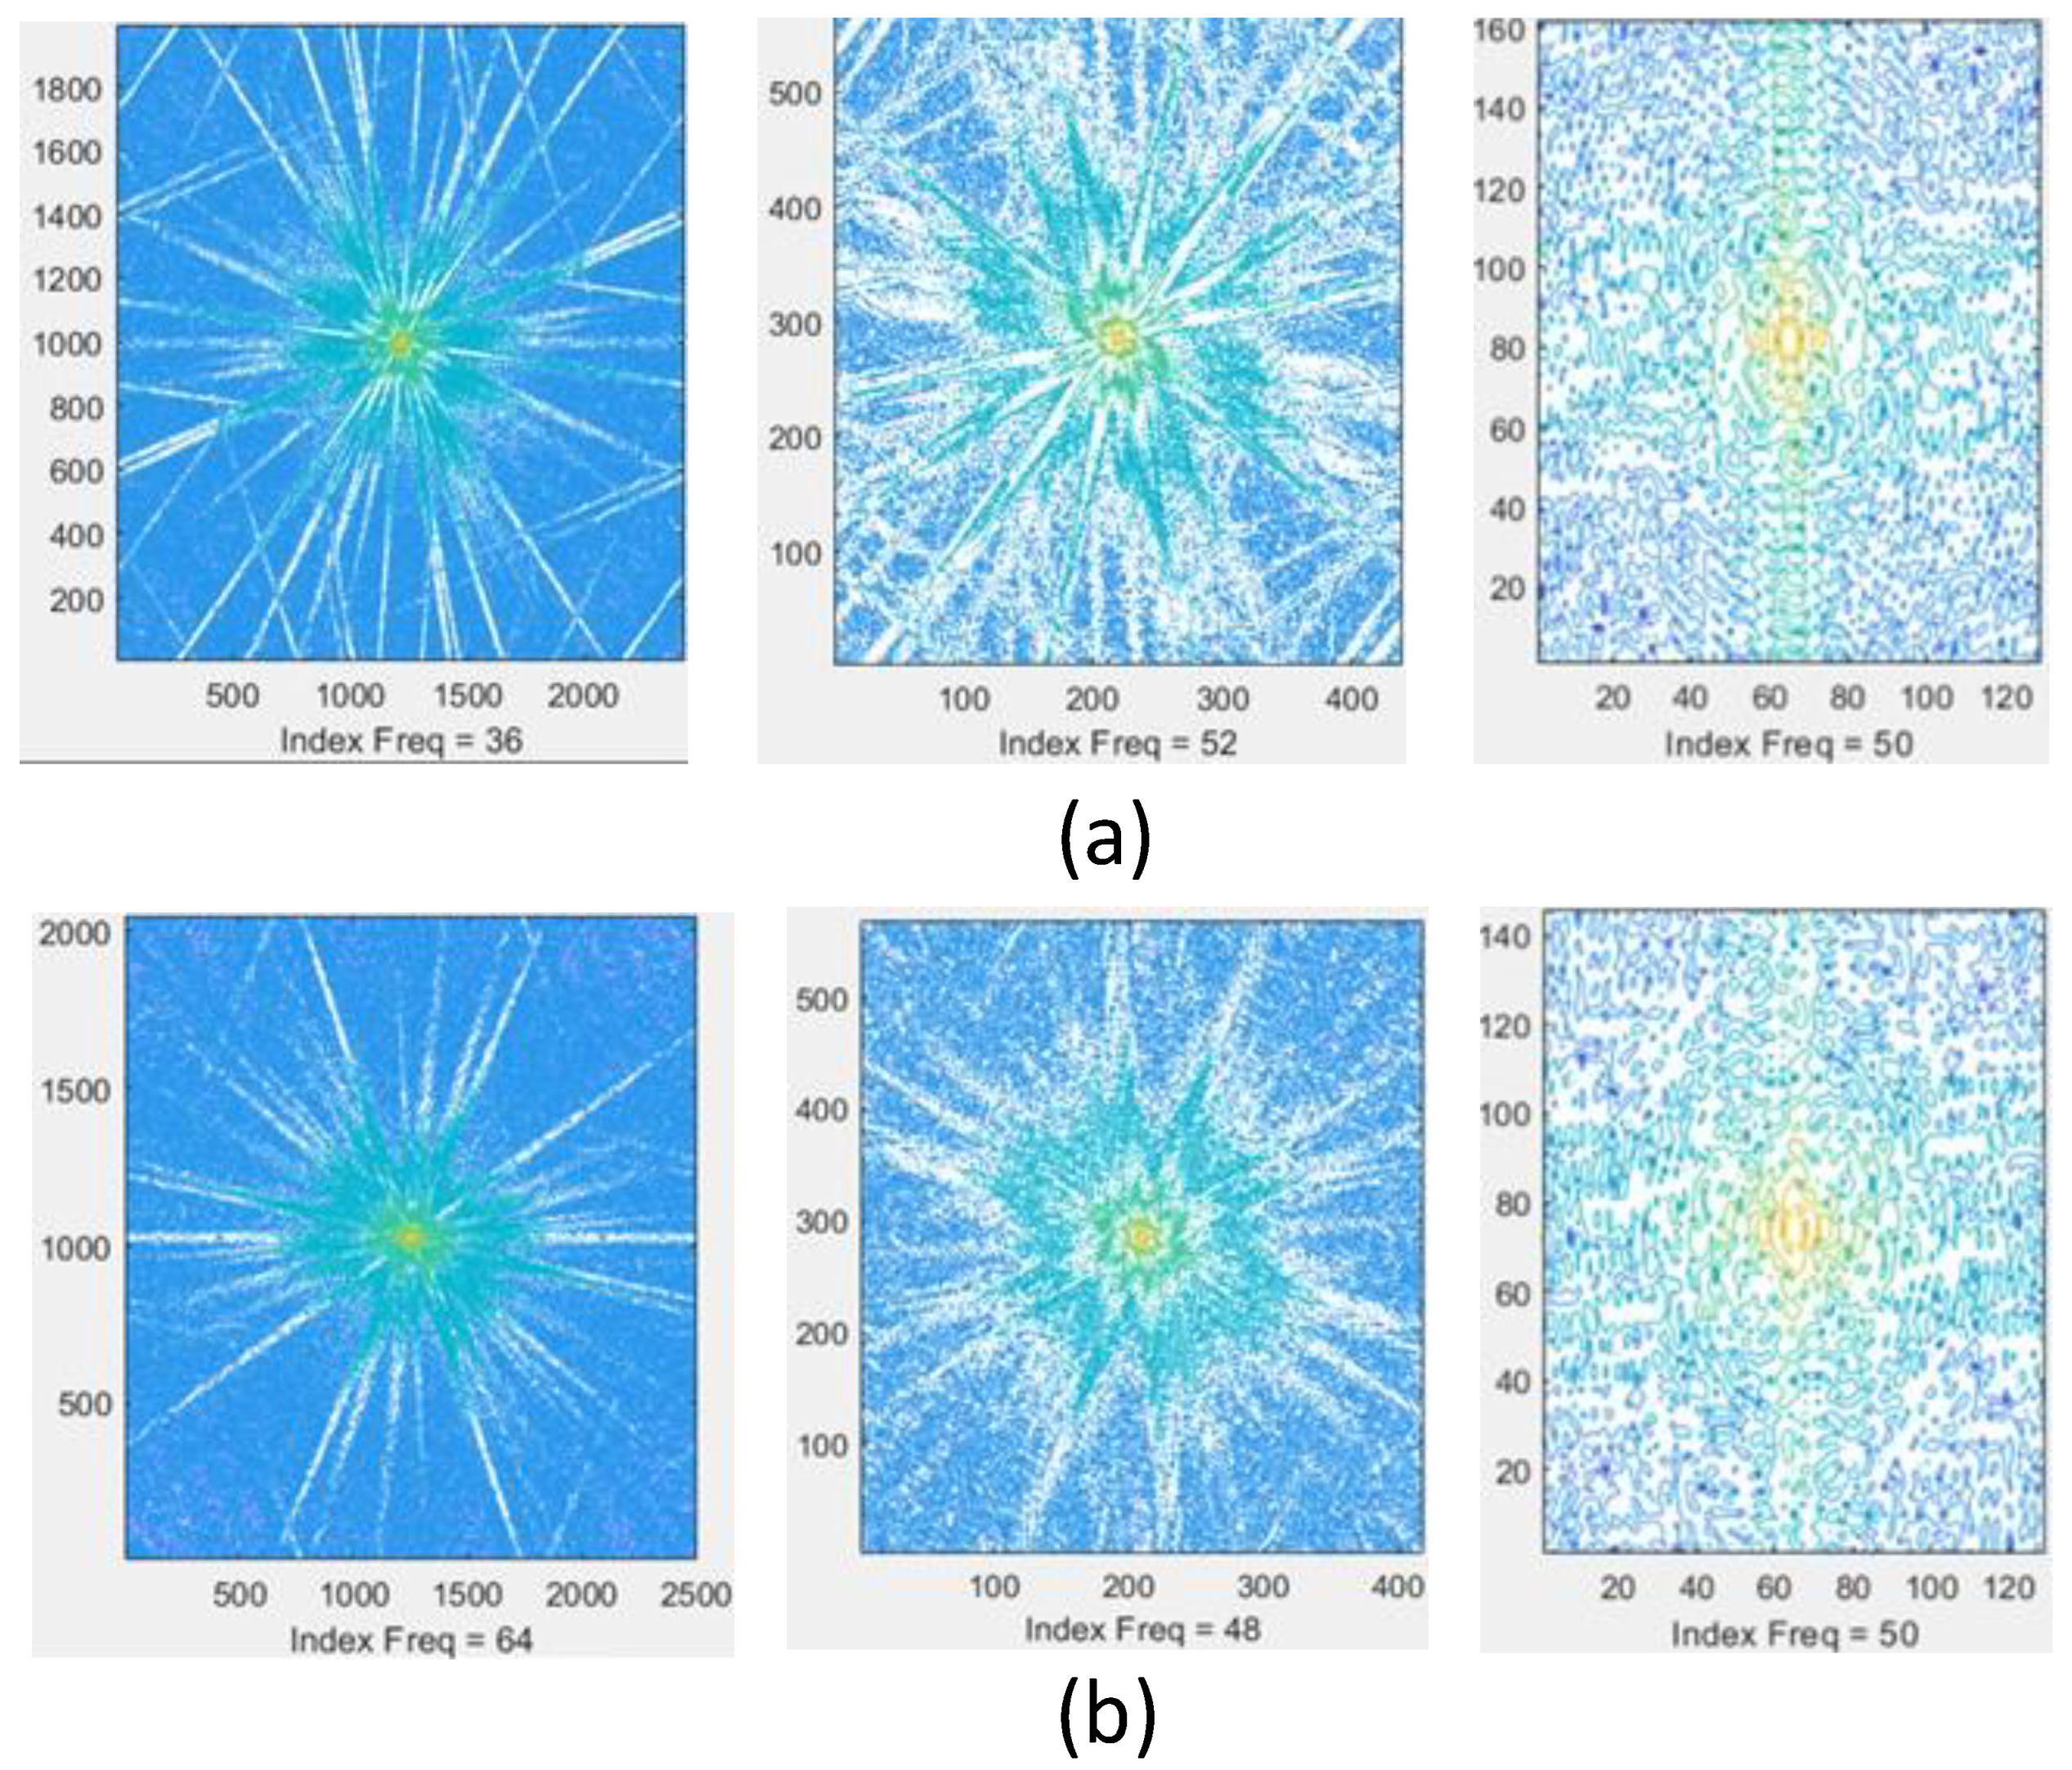
5.2. Frequency Index
The frequency index is obtained by transforming the image into a frequency domain through a 2D Fourier transform. The selected ROI is transformed, and the value of the spectral is used to calculate the frequency index for the selected ROI. The frequency index is defined as the total intensity of spectral in the ROI divided by the number of pixels in the ROI. Implementation of this frequency attribute on the data set is illustrated in
Figure 4. The image resulting from the Fourier transform indicates the frequency distribution, wherein the low-frequency component is distributed in the center, while the high-frequency component is distributed in the peripherals. The frequency index showed a significant increment from normal to osteoporotic bone at the pelvis, but decreased at the hip location on the CT scan images. Meanwhile, there are no differences between normal and osteoporotic bone at the lumbar spine location from DEXA scanning. It is still difficult to see the consistency of this attribute in differentiating osteoporosis from normal bone.
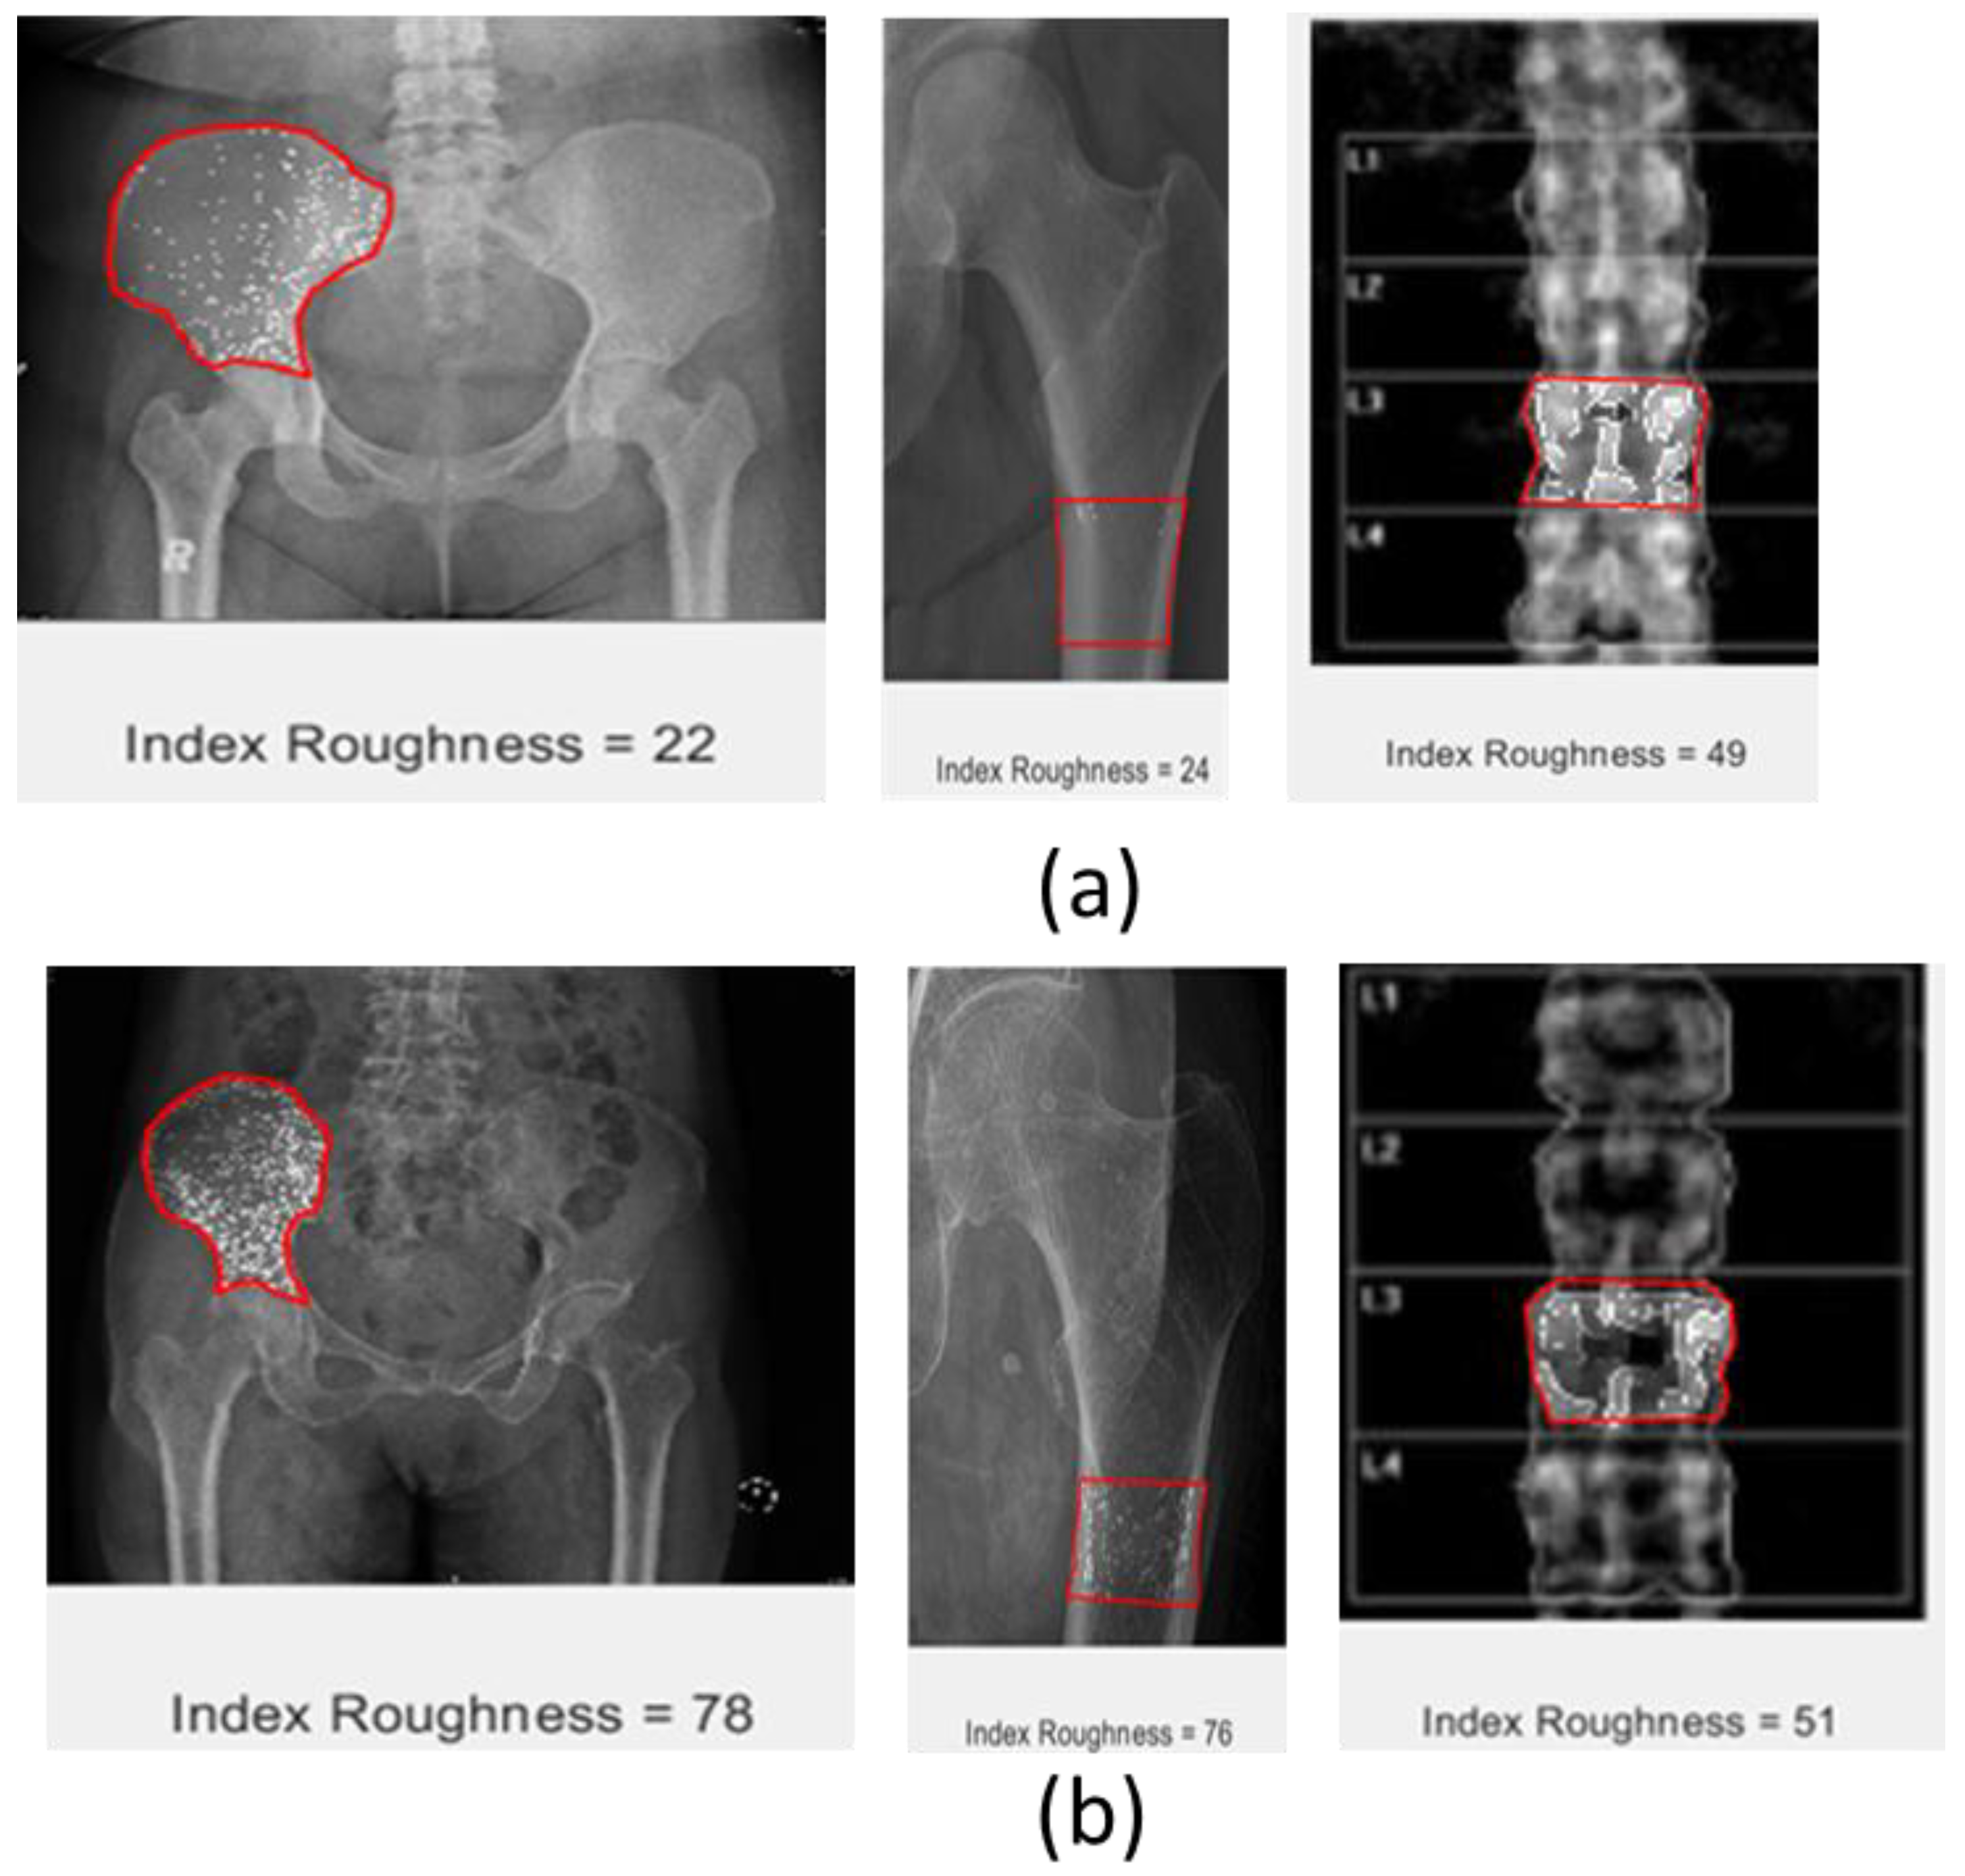
5.3. Roughness Index
The roughness attribute is calculated by subtracting the intensity of each pixel from the average value of intensity for the whole image. The roughness index is then calculated as the total value divided by the total number of pixels inside the ROI. The roughness index consistently indicated a significant increment from normal to osteoporosis on all scanning modalities in both CT scans and DEXA images, where the roughness index of osteoporosis is higher than normal bone. The visual image of roughness also indicates the significant difference between normal and osteoporotic bone, as bone with osteoporosis is visualized with a prominent white spot and normal bone with a less dominant white spot. Looking at this visual, it will also be easier to differentiate normal bone from osteoporotic bone. A summary of the roughness attribute applied to the ROI for each data set is shown in
Figure 5.
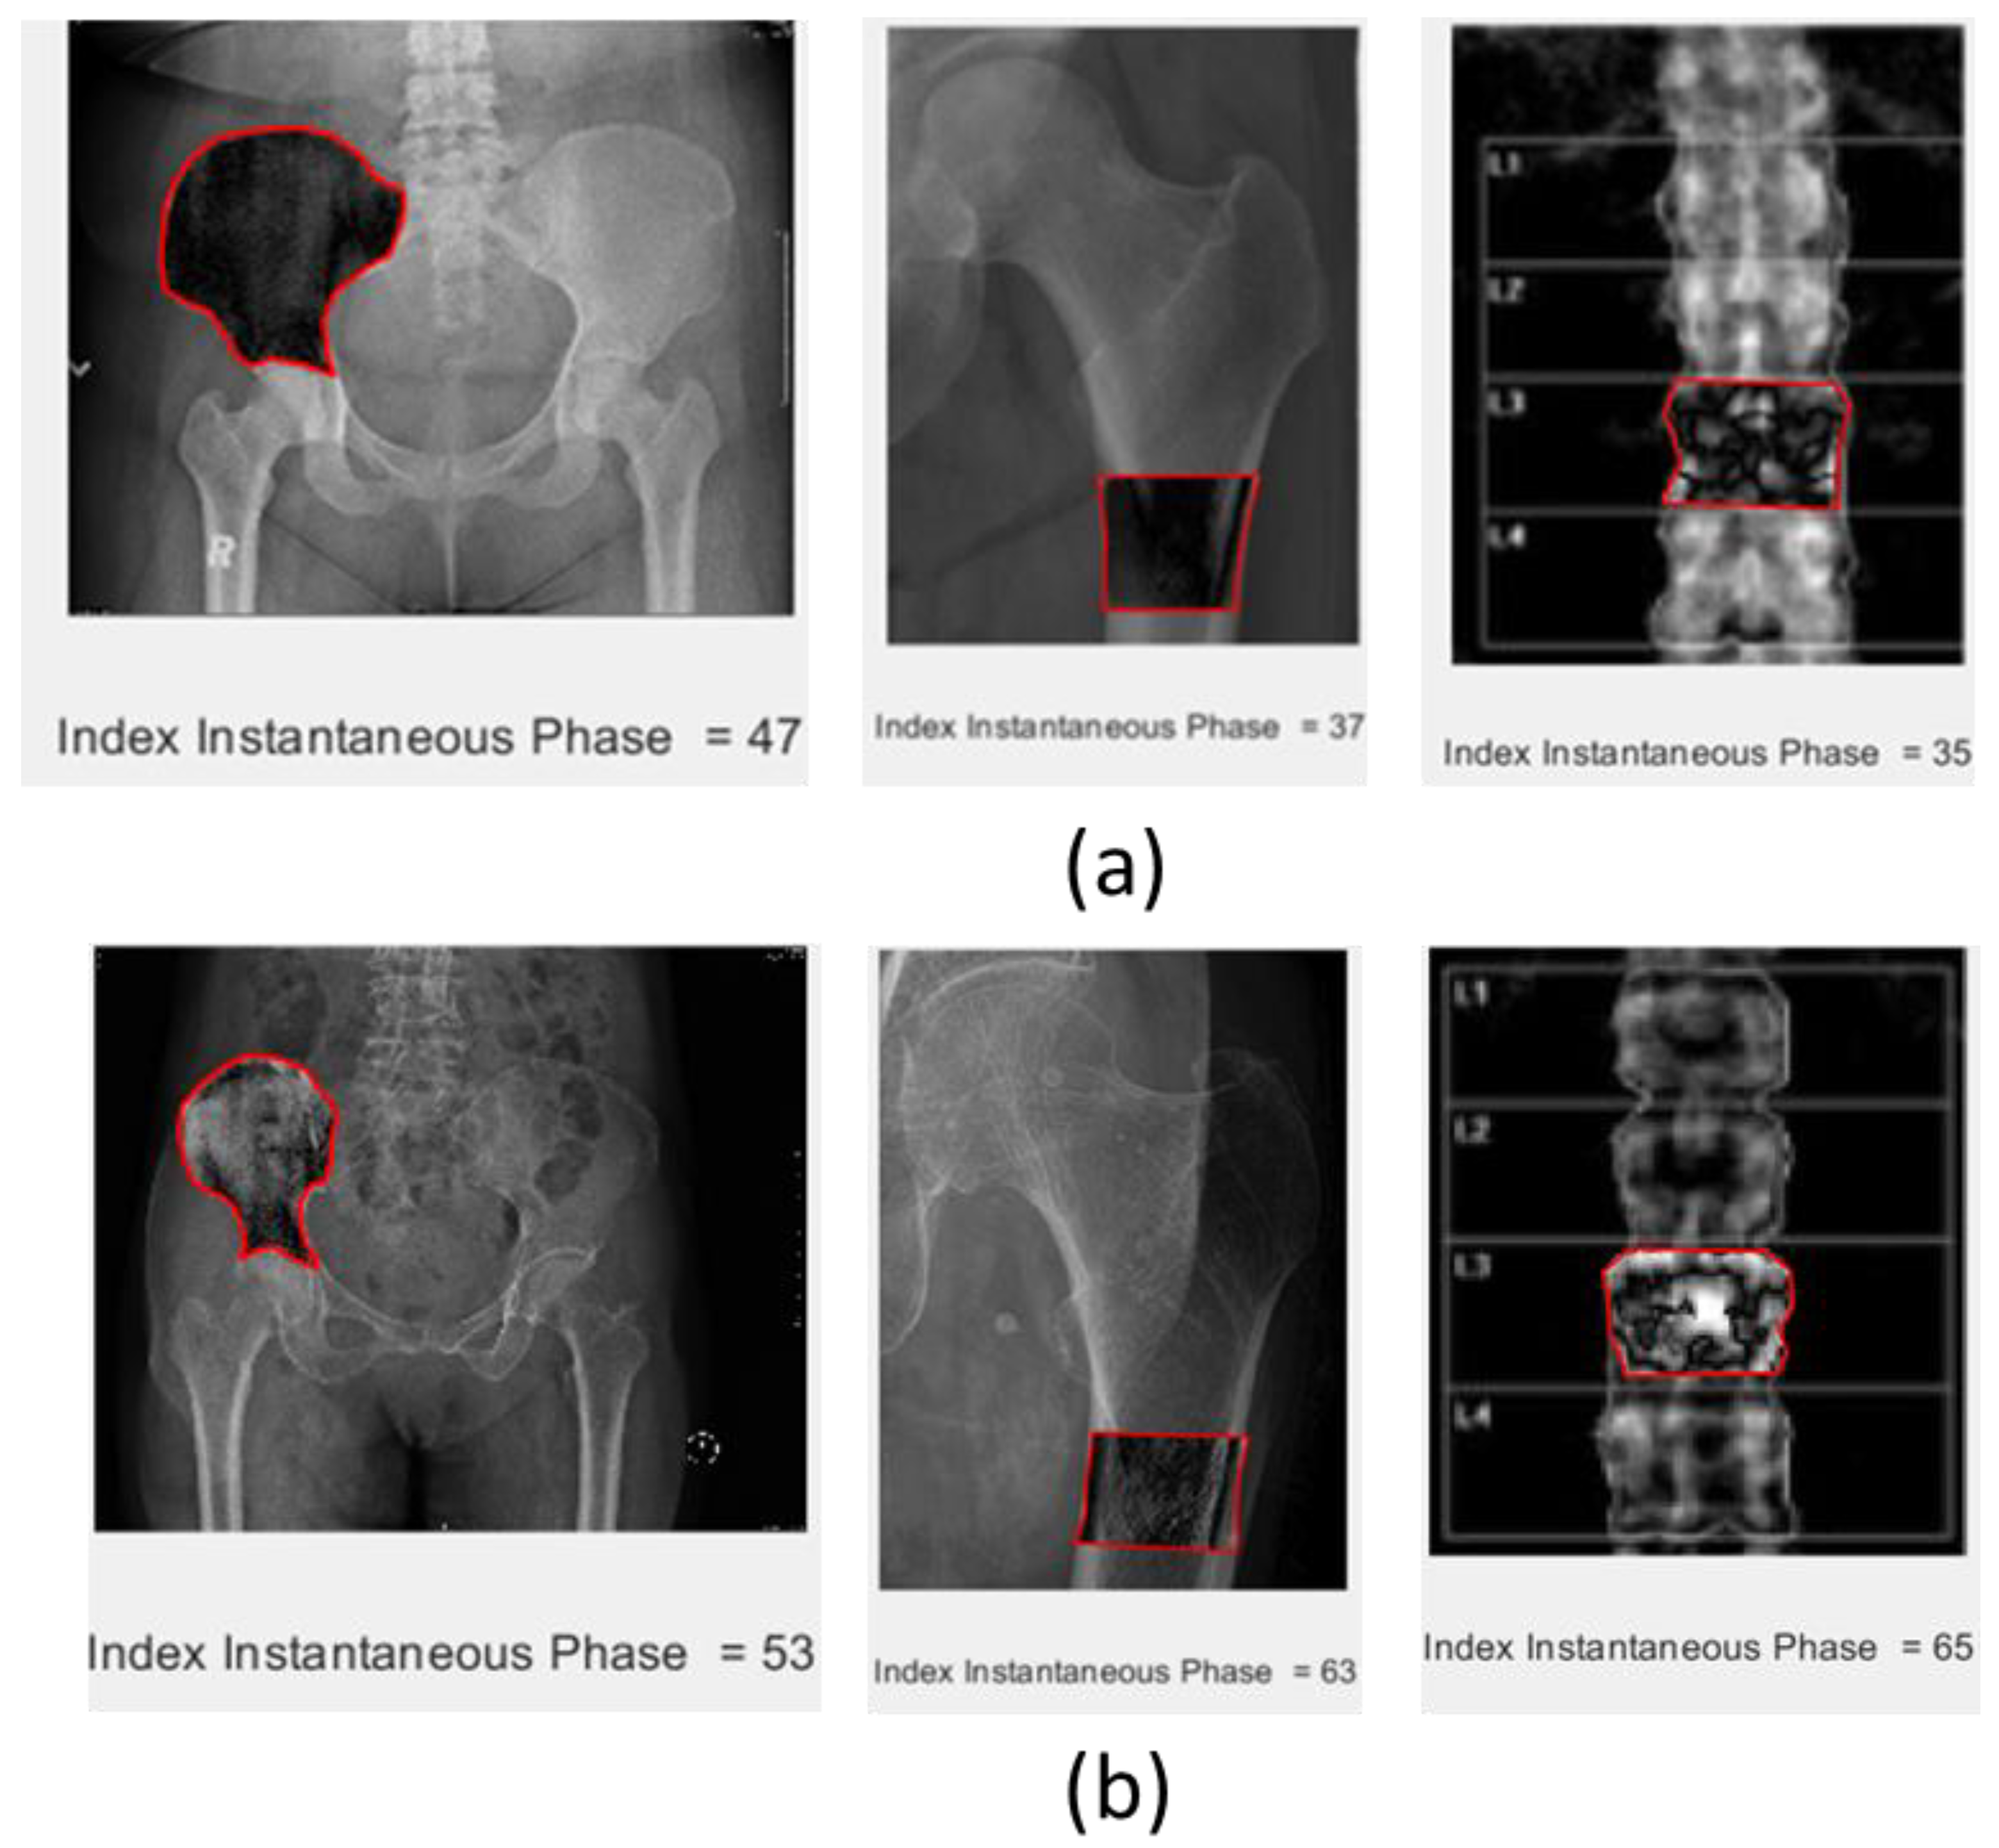
5.4. Phase Index
The phase of the image was obtained by calculating the real part and imaginary part of the 2D image at the ROI. The imaginary part is obtained by transforming the real part using the Hilbert transform. The phase index is calculated as the total value of absolute phase intensity in the ROI divided by the number of pixels in the ROI. Implementation of the phase attribute on the data sets is shown in
Figure 6. The figure indicates that the phase index increased consistently from normal to osteoporosis in all modalities of CT scans and DEXA images. Additionally, the visual of these attributes will bring a new appearance of the ROI that is different from the original images, where the osteoporotic bone is visualized with more white spots than the normal one. The image of the selected ROI has a significantly different pattern between normal and osteoporotic bone.
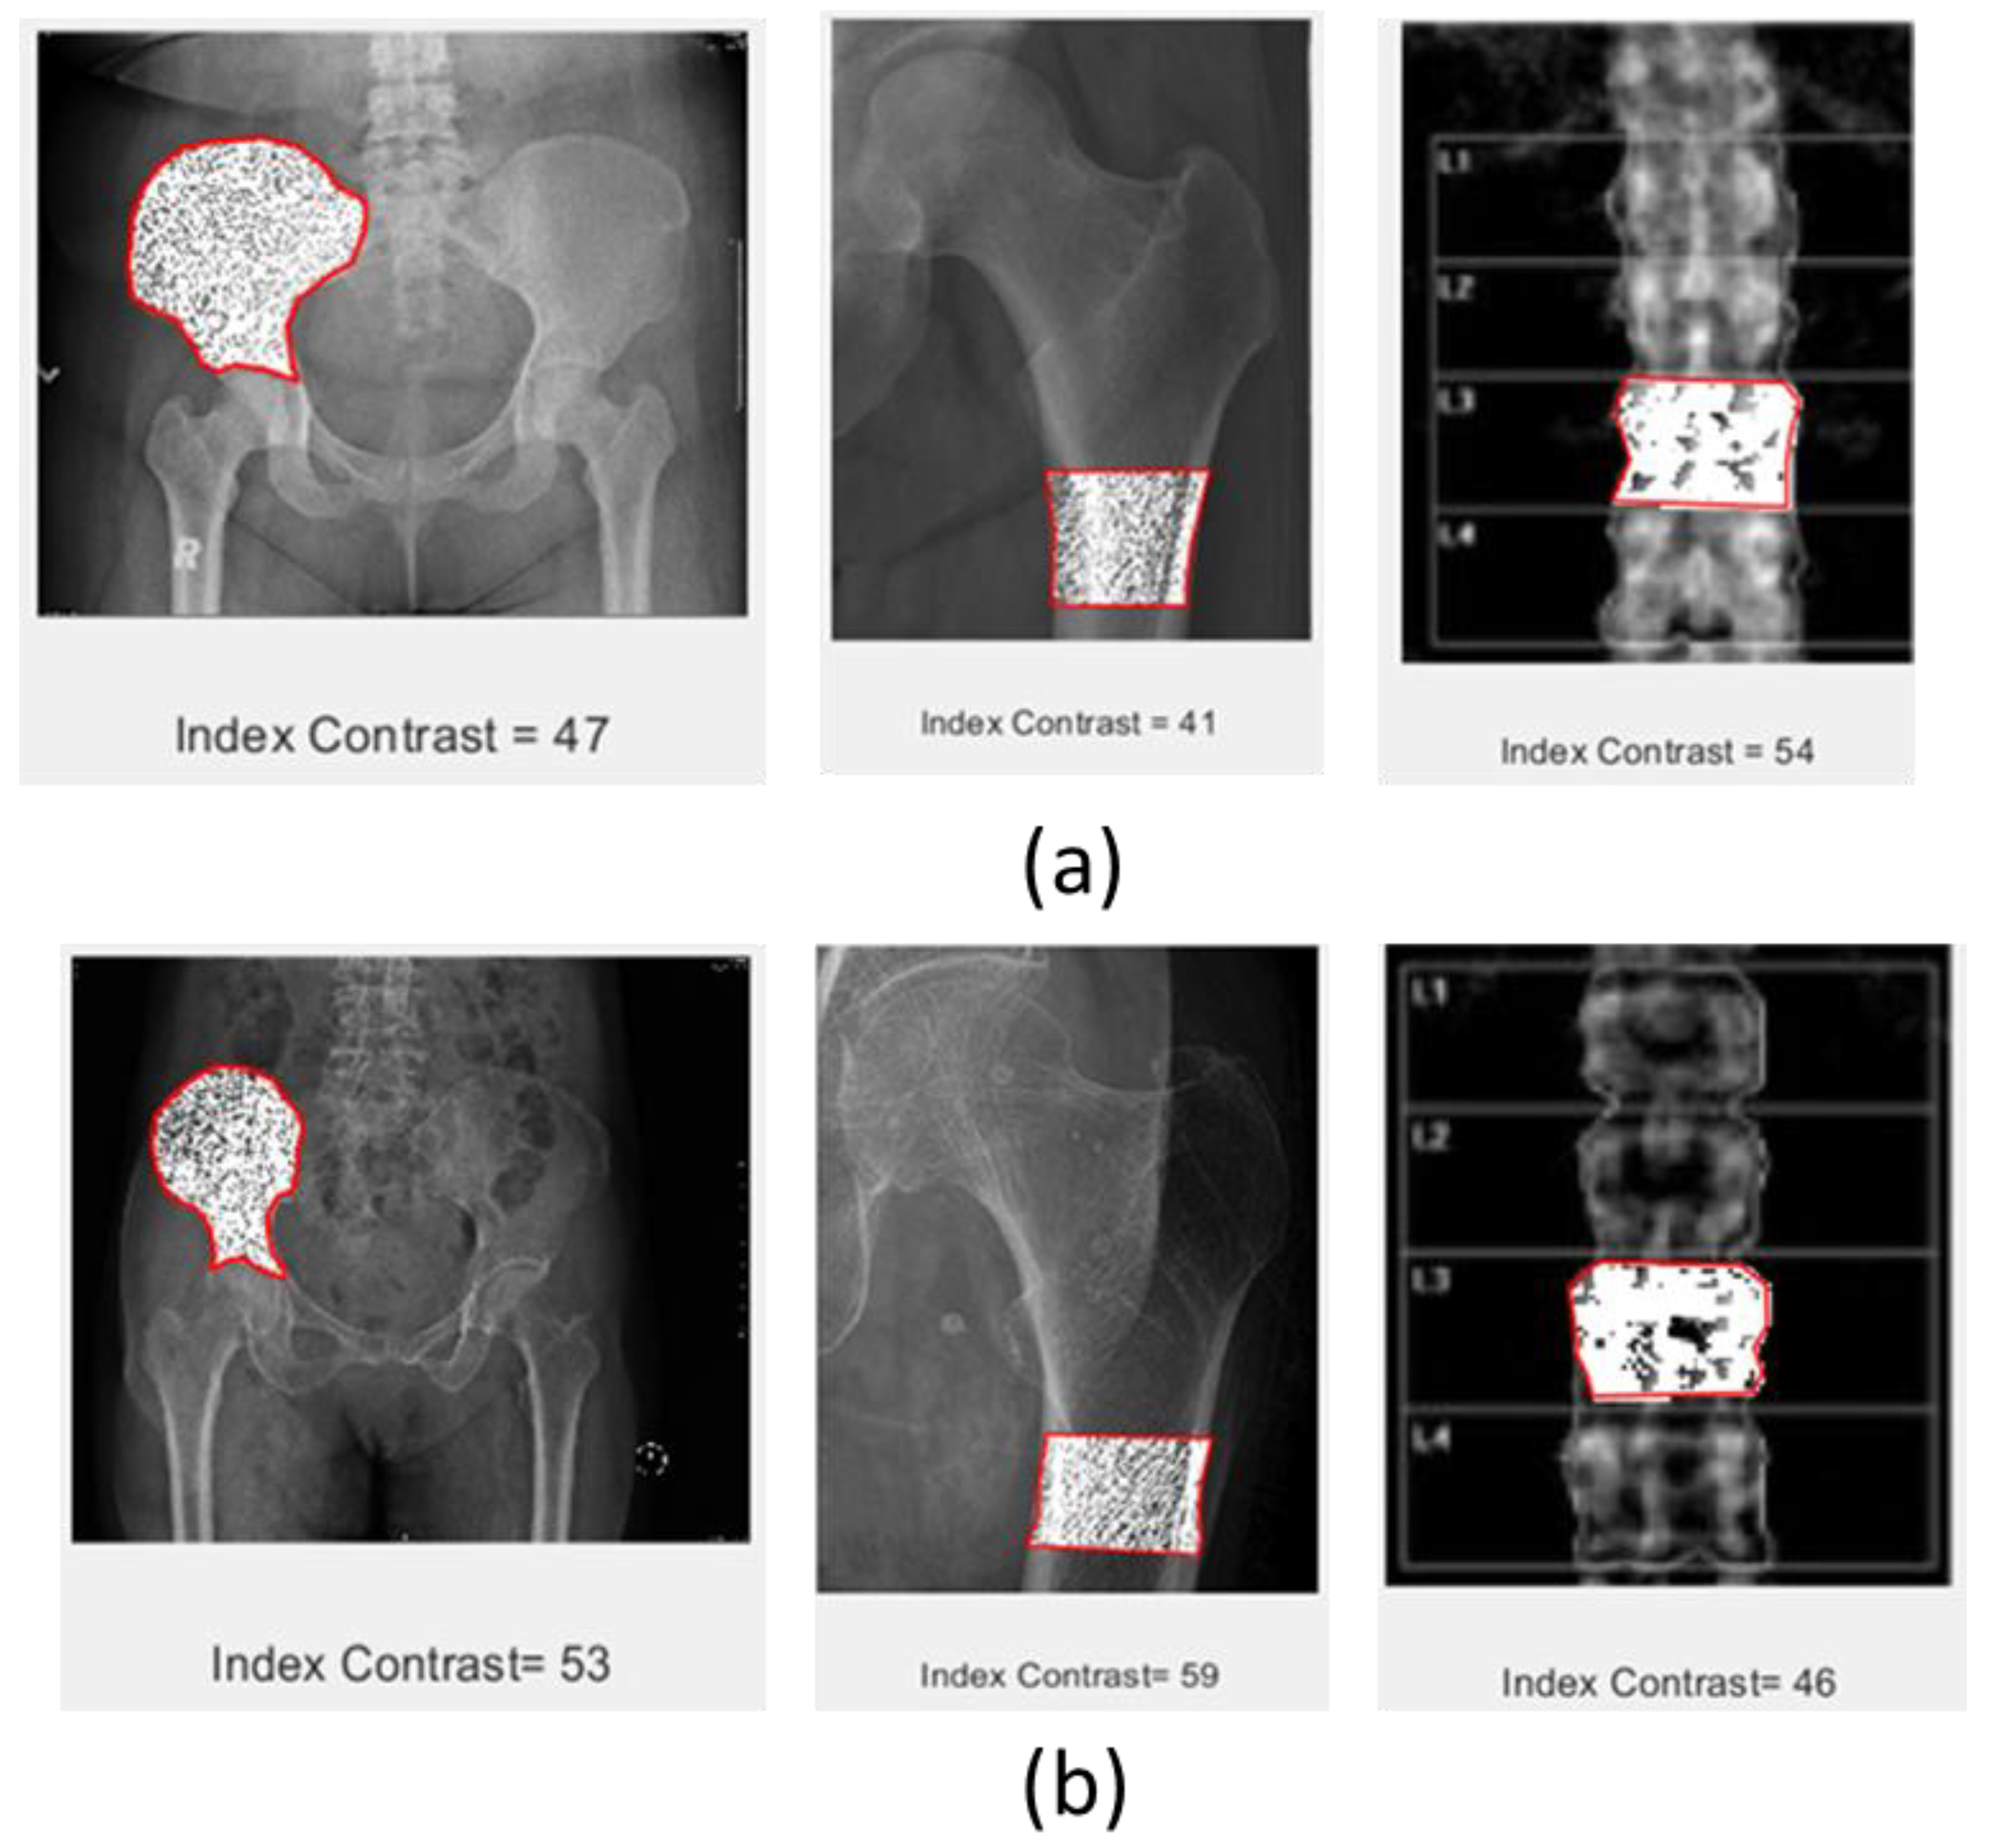
5.5. First Derivative (Contrast Attribute)
The first derivative attribute or contrast attribute was taken based on a pixel compared to the surrounding pixels. It was calculated in the vertical and horizontal directions only. It can also be extended to view the contrast in the diagonal direction. The contrast index was calculated as the total contrast counted inside the ROI divided by the number of pixels inside the ROI. The contrast index showed a significant difference between normal and osteoporotic bone, whereby the osteoporotic bone has a higher value than the normal bone on the CT scan images. In contrast, DEXA imaging showed that the normal bone has a higher value than the osteoporotic bone. There are also some inconsistencies regarding the different modalities of scanning. Therefore, further experiments need to be conducted to verify the robustness of this attribute in different modalities. The direct display of the contrast attribute highlights the significant difference between normal and osteoporotic bone, as shown in
Figure 7.
Based on the experimental results, the adoption of signal-processing techniques into image processing can enhance the variability of image attributes, which is possibly helpful for feature enhancement during the application of artificial intelligence (AI) or machine learning (ML) for the automatization of osteoporosis diagnosis.
As a feasibility study, this research work can contribute to the stage of image attribute generation in medicine by adopting signal-processing techniques that have already been proven in characterizing subsurface objects, much like in the geosciences disciplines, where attributes such as grayscale, instantaneous phase, frequency, roughness, and first derivative (contrast) have been able to highlight significant differences between normal and osteoporosis bone images. Some attributes, i.e., instantaneous phase, roughness, and contrast attributes, produce significantly different visual images between normal and osteoporotic bone. The density of the anomalies of those attributes is quite different. It is possible that converting the image into these attributes will increase the anomalies in the targeted area. If an anomaly detection algorithm is applied, these attributes may obtain better anomaly detection. Zheng et al. [
15] used a two-stage training method with an anomaly detection algorithm to maintain a low overfitting value. Their technique consists of a pre-training process for determining sample distribution and an implicit regularization process for optimizing the feature boundaries. They claimed that the proposed method produced a better classification result and consistently outperformed other regularization methods on deep CNNs. Other signal attributes may possess similar potential; however, further experiments need to be conducted to achieve optimum separation between normal and osteoporotic bone.
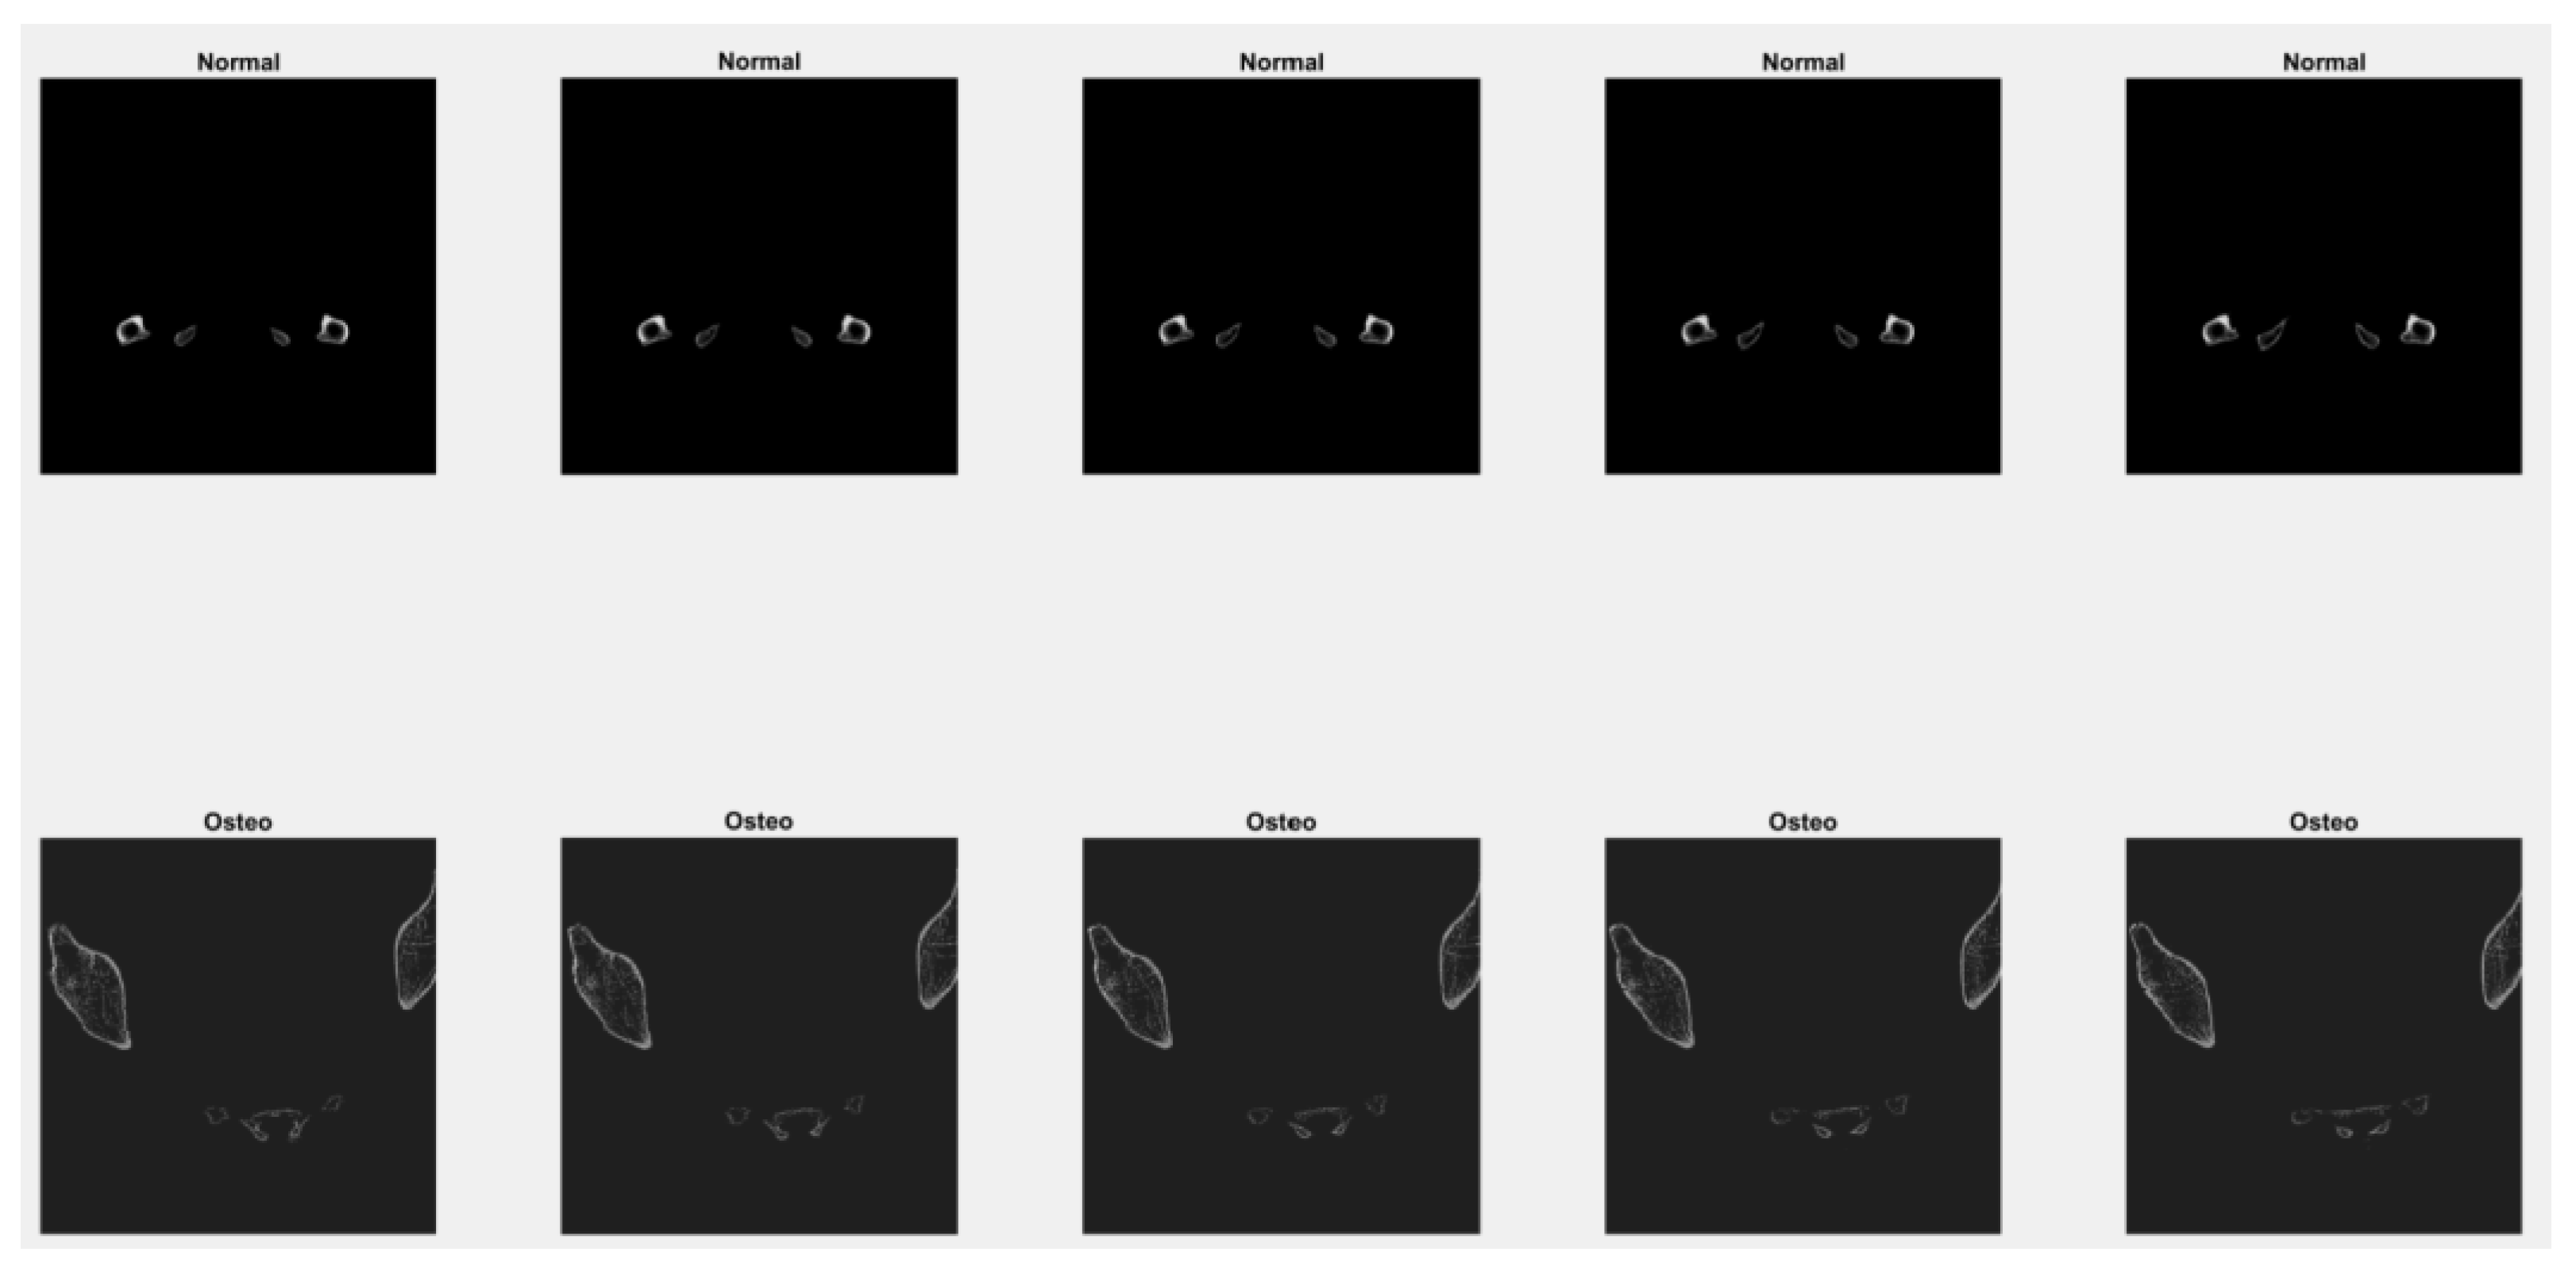
5.6. Bone Classification Using a Convolutional Neural Network: Case Study Examples
In this experiment, a deep learning model named the convolutional neural network is used to classify between normal bone and osteoporotic bone. The experiment is carried out in two scenarios; in the first scenario, the datasets used to train the models are from CT scan images of normal and osteoporotic bone only. Meanwhile, for the second scenario, the attributes of roughness index, phase index, and contrast attributes were included as the input together with the original CT scan image for both normal and osteoporotic bone. The datasets are shuffled and normalized to help better train the model. To avoid an imbalanced dataset during the training of the model, the datasets selected have the same number of normal and osteoporotic bones. The total amount of data used during the training stage is 50 images, which consist of the same number normal and osteoporosis bone images. In the testing stages, ten images consisting of five samples of normal and osteoporotic bone were used.
In the CT images used for this experiment, 3D slicing with axial slicing was selected. Examples of images taken for the training and testing stages are shown in
Figure 8.
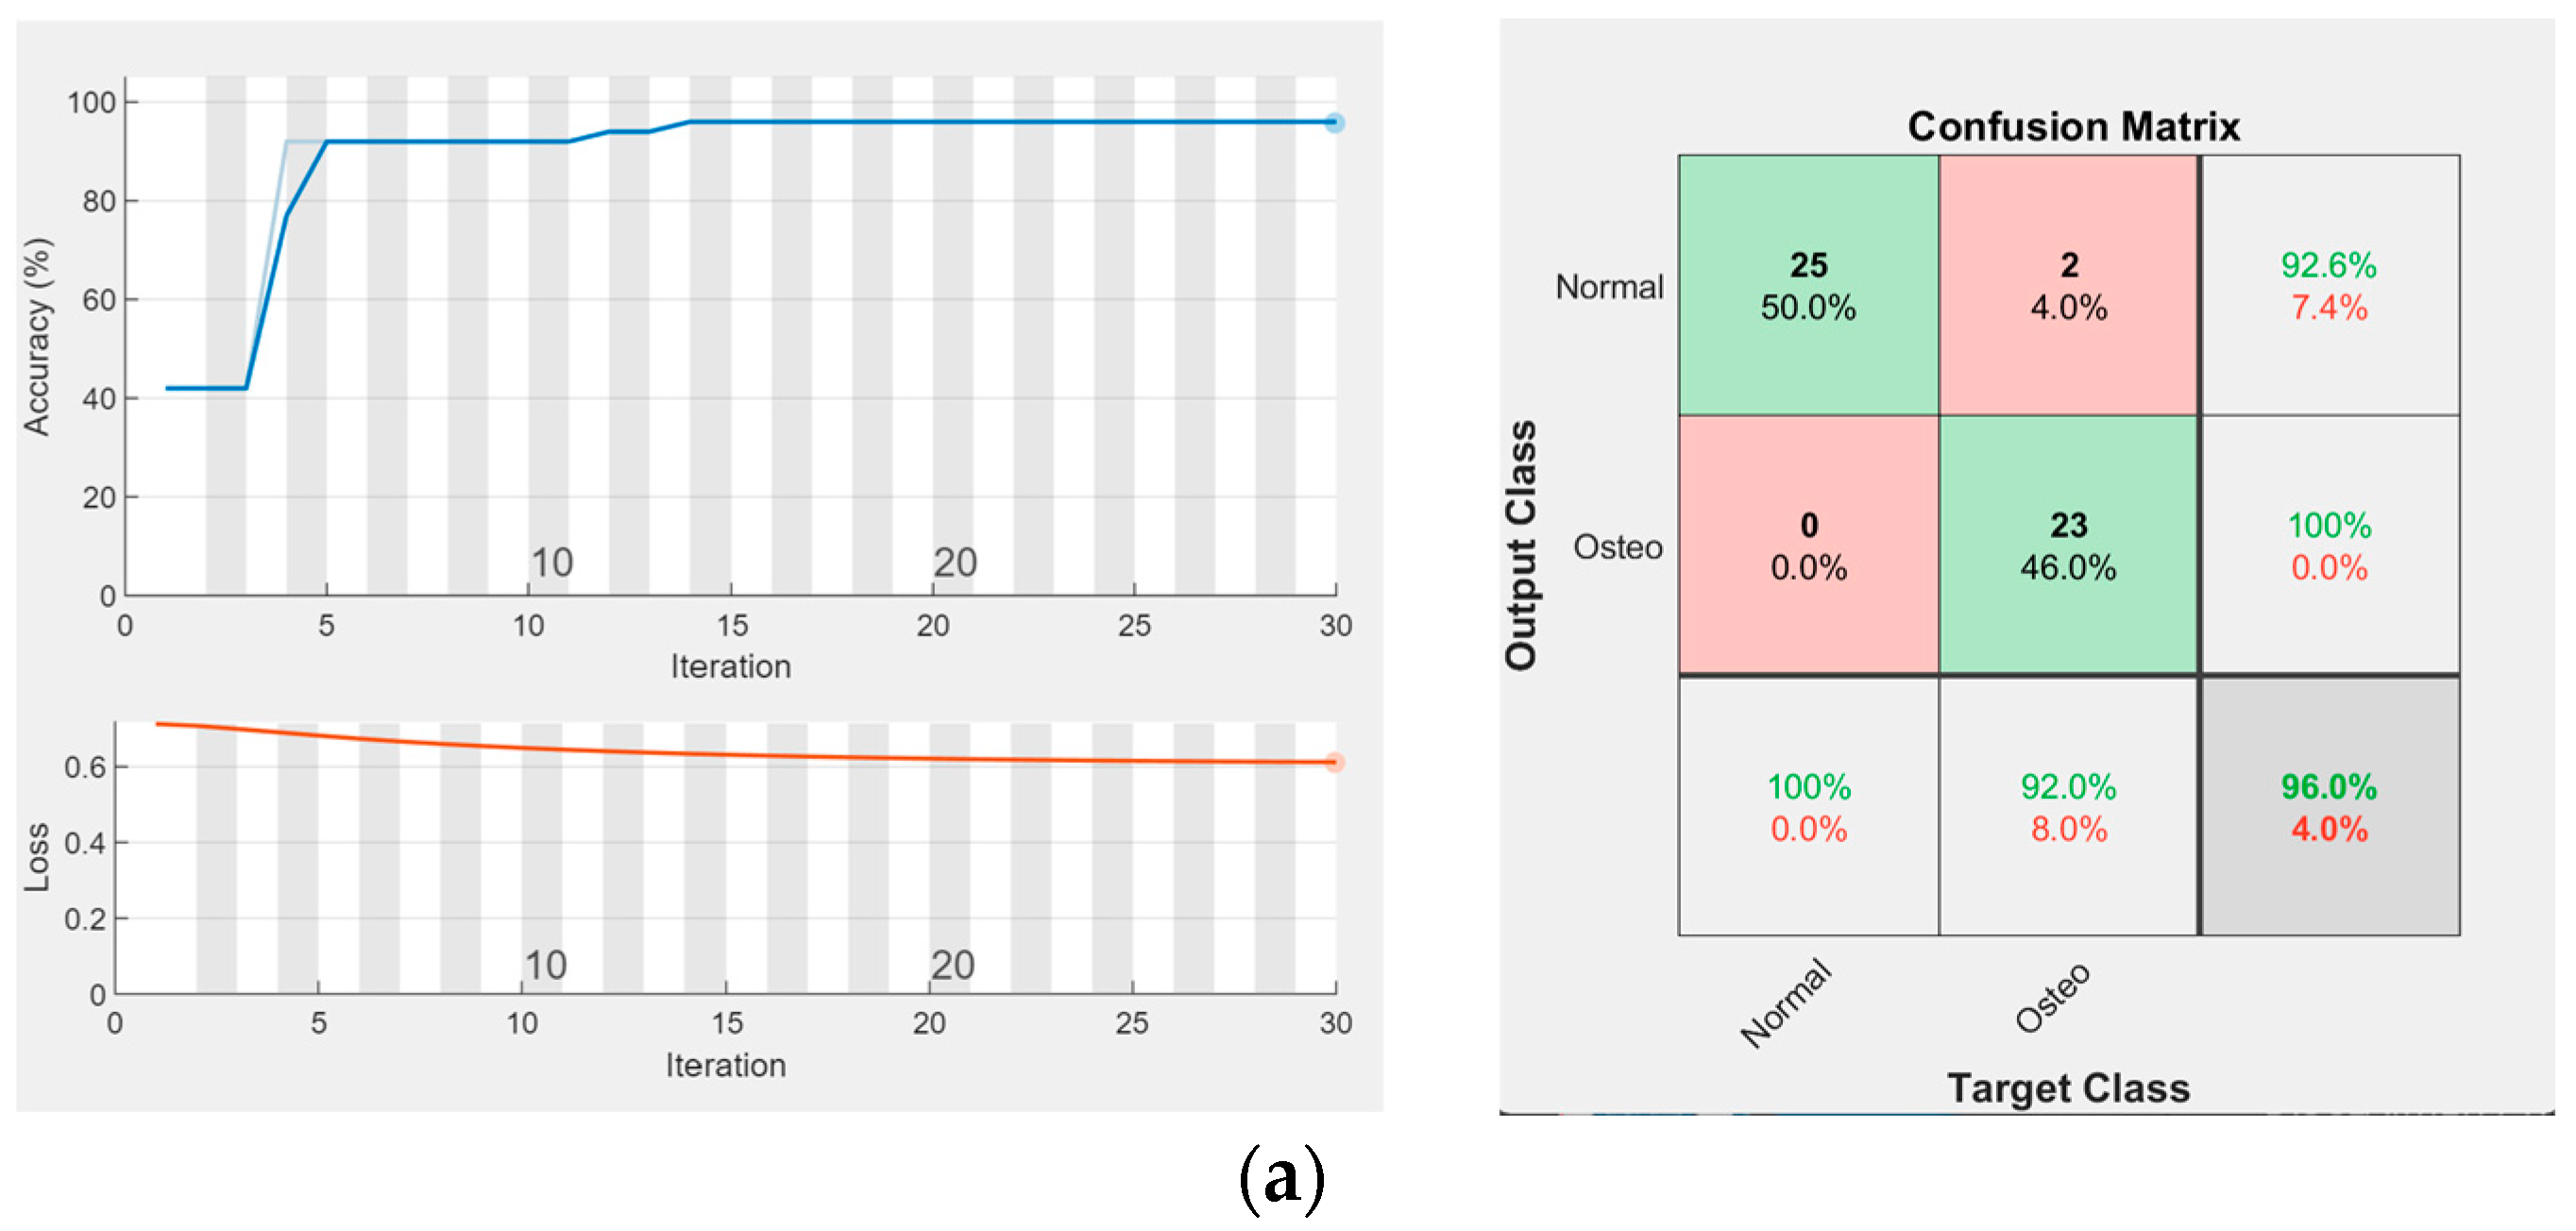
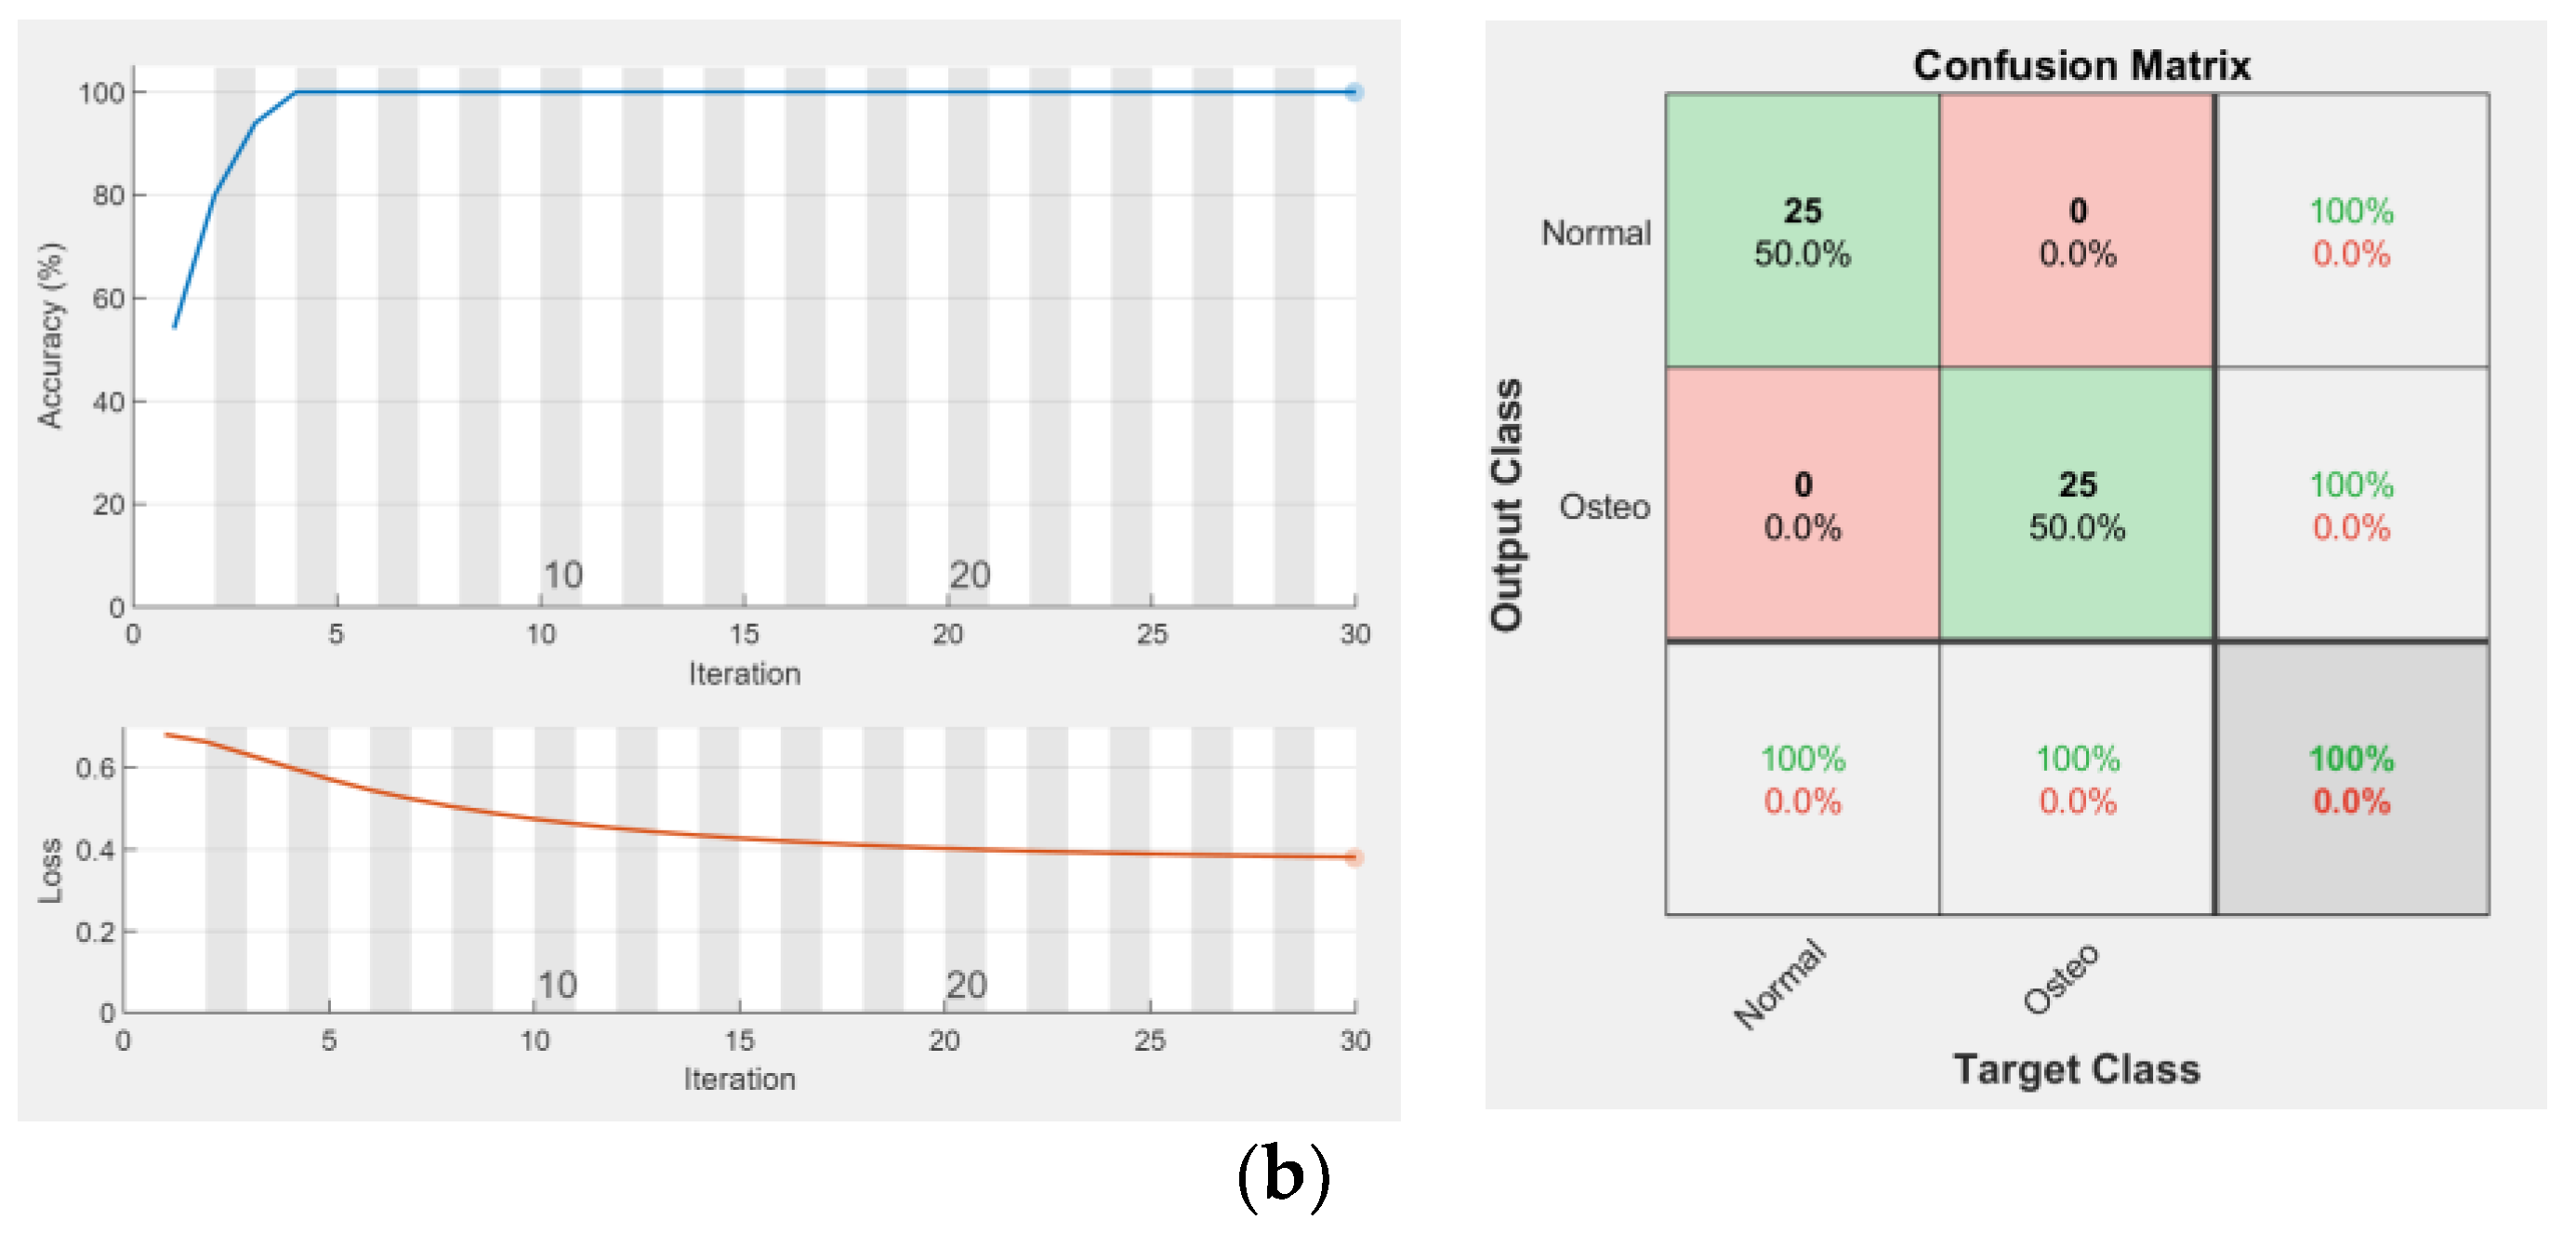
The performances of the network are shown by plotting the accuracy and loss function plot for both scenarios, as indicated in
Figure 9.
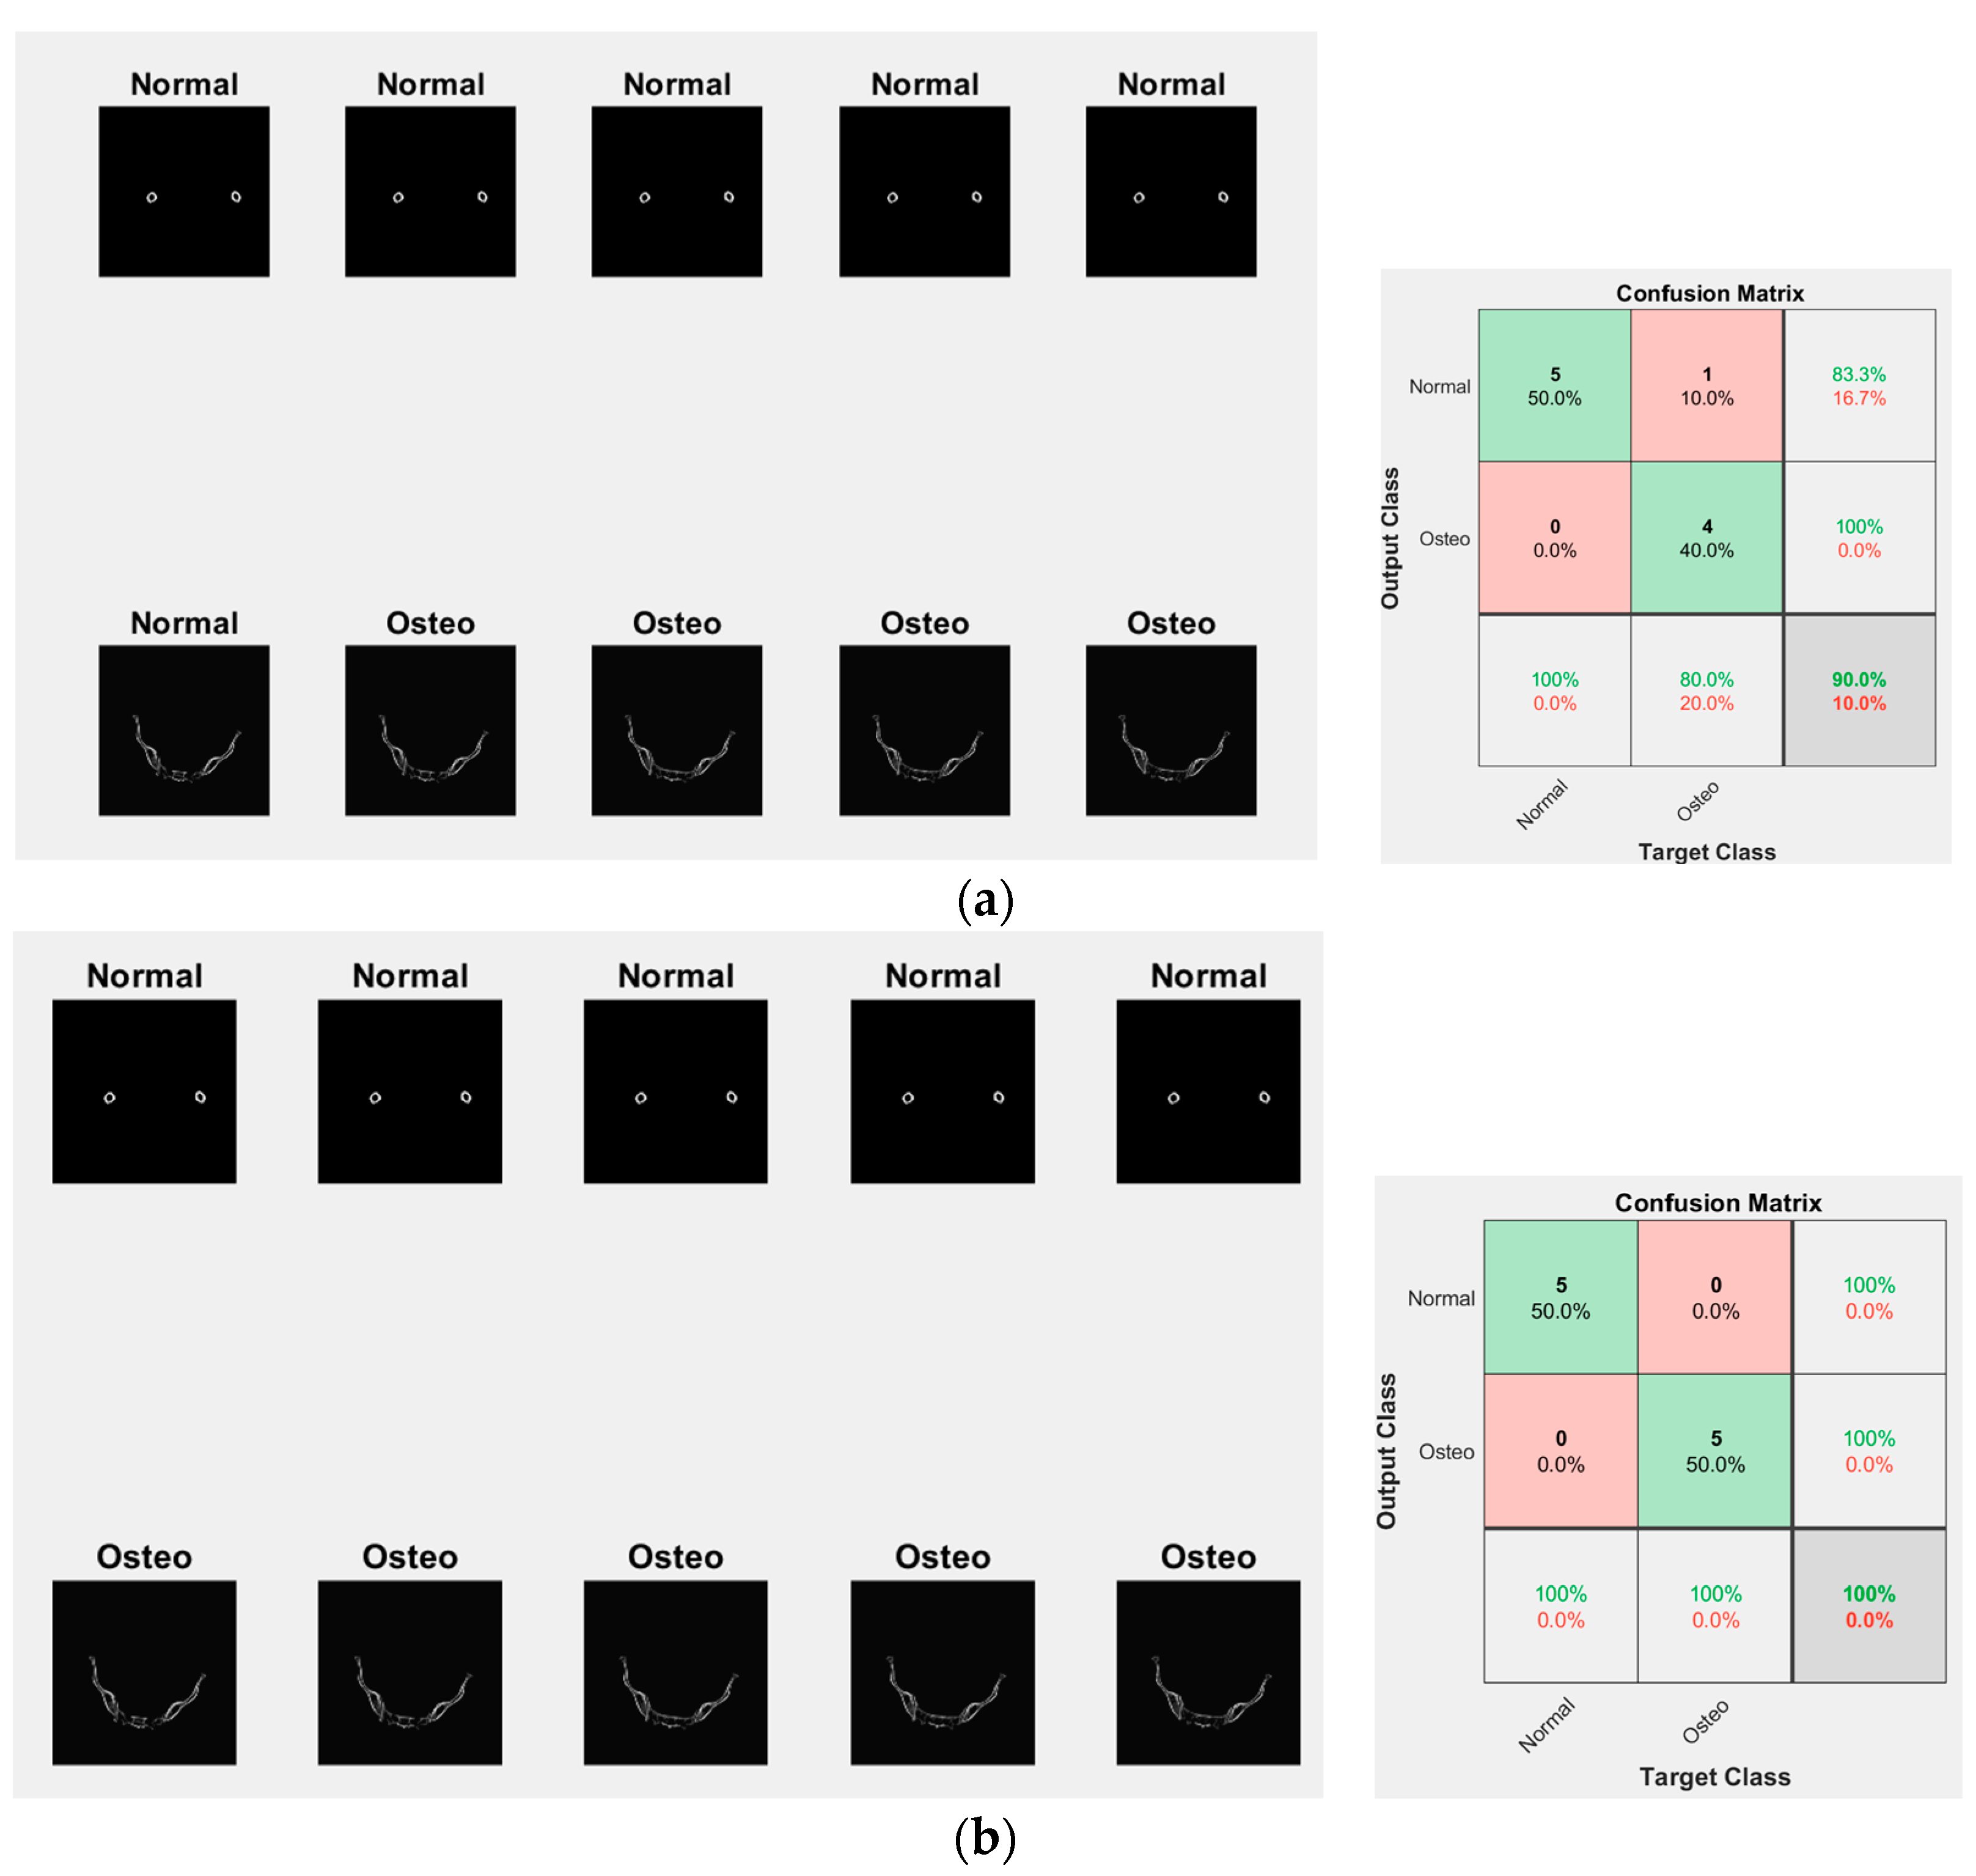
The model is trained and tested in different patients to avoid bias and to make the model more objective. Blind testing of this model was carried out with different patients, with the five images taken from each normal and osteoporotic bone. The results are shown in
Figure 10.
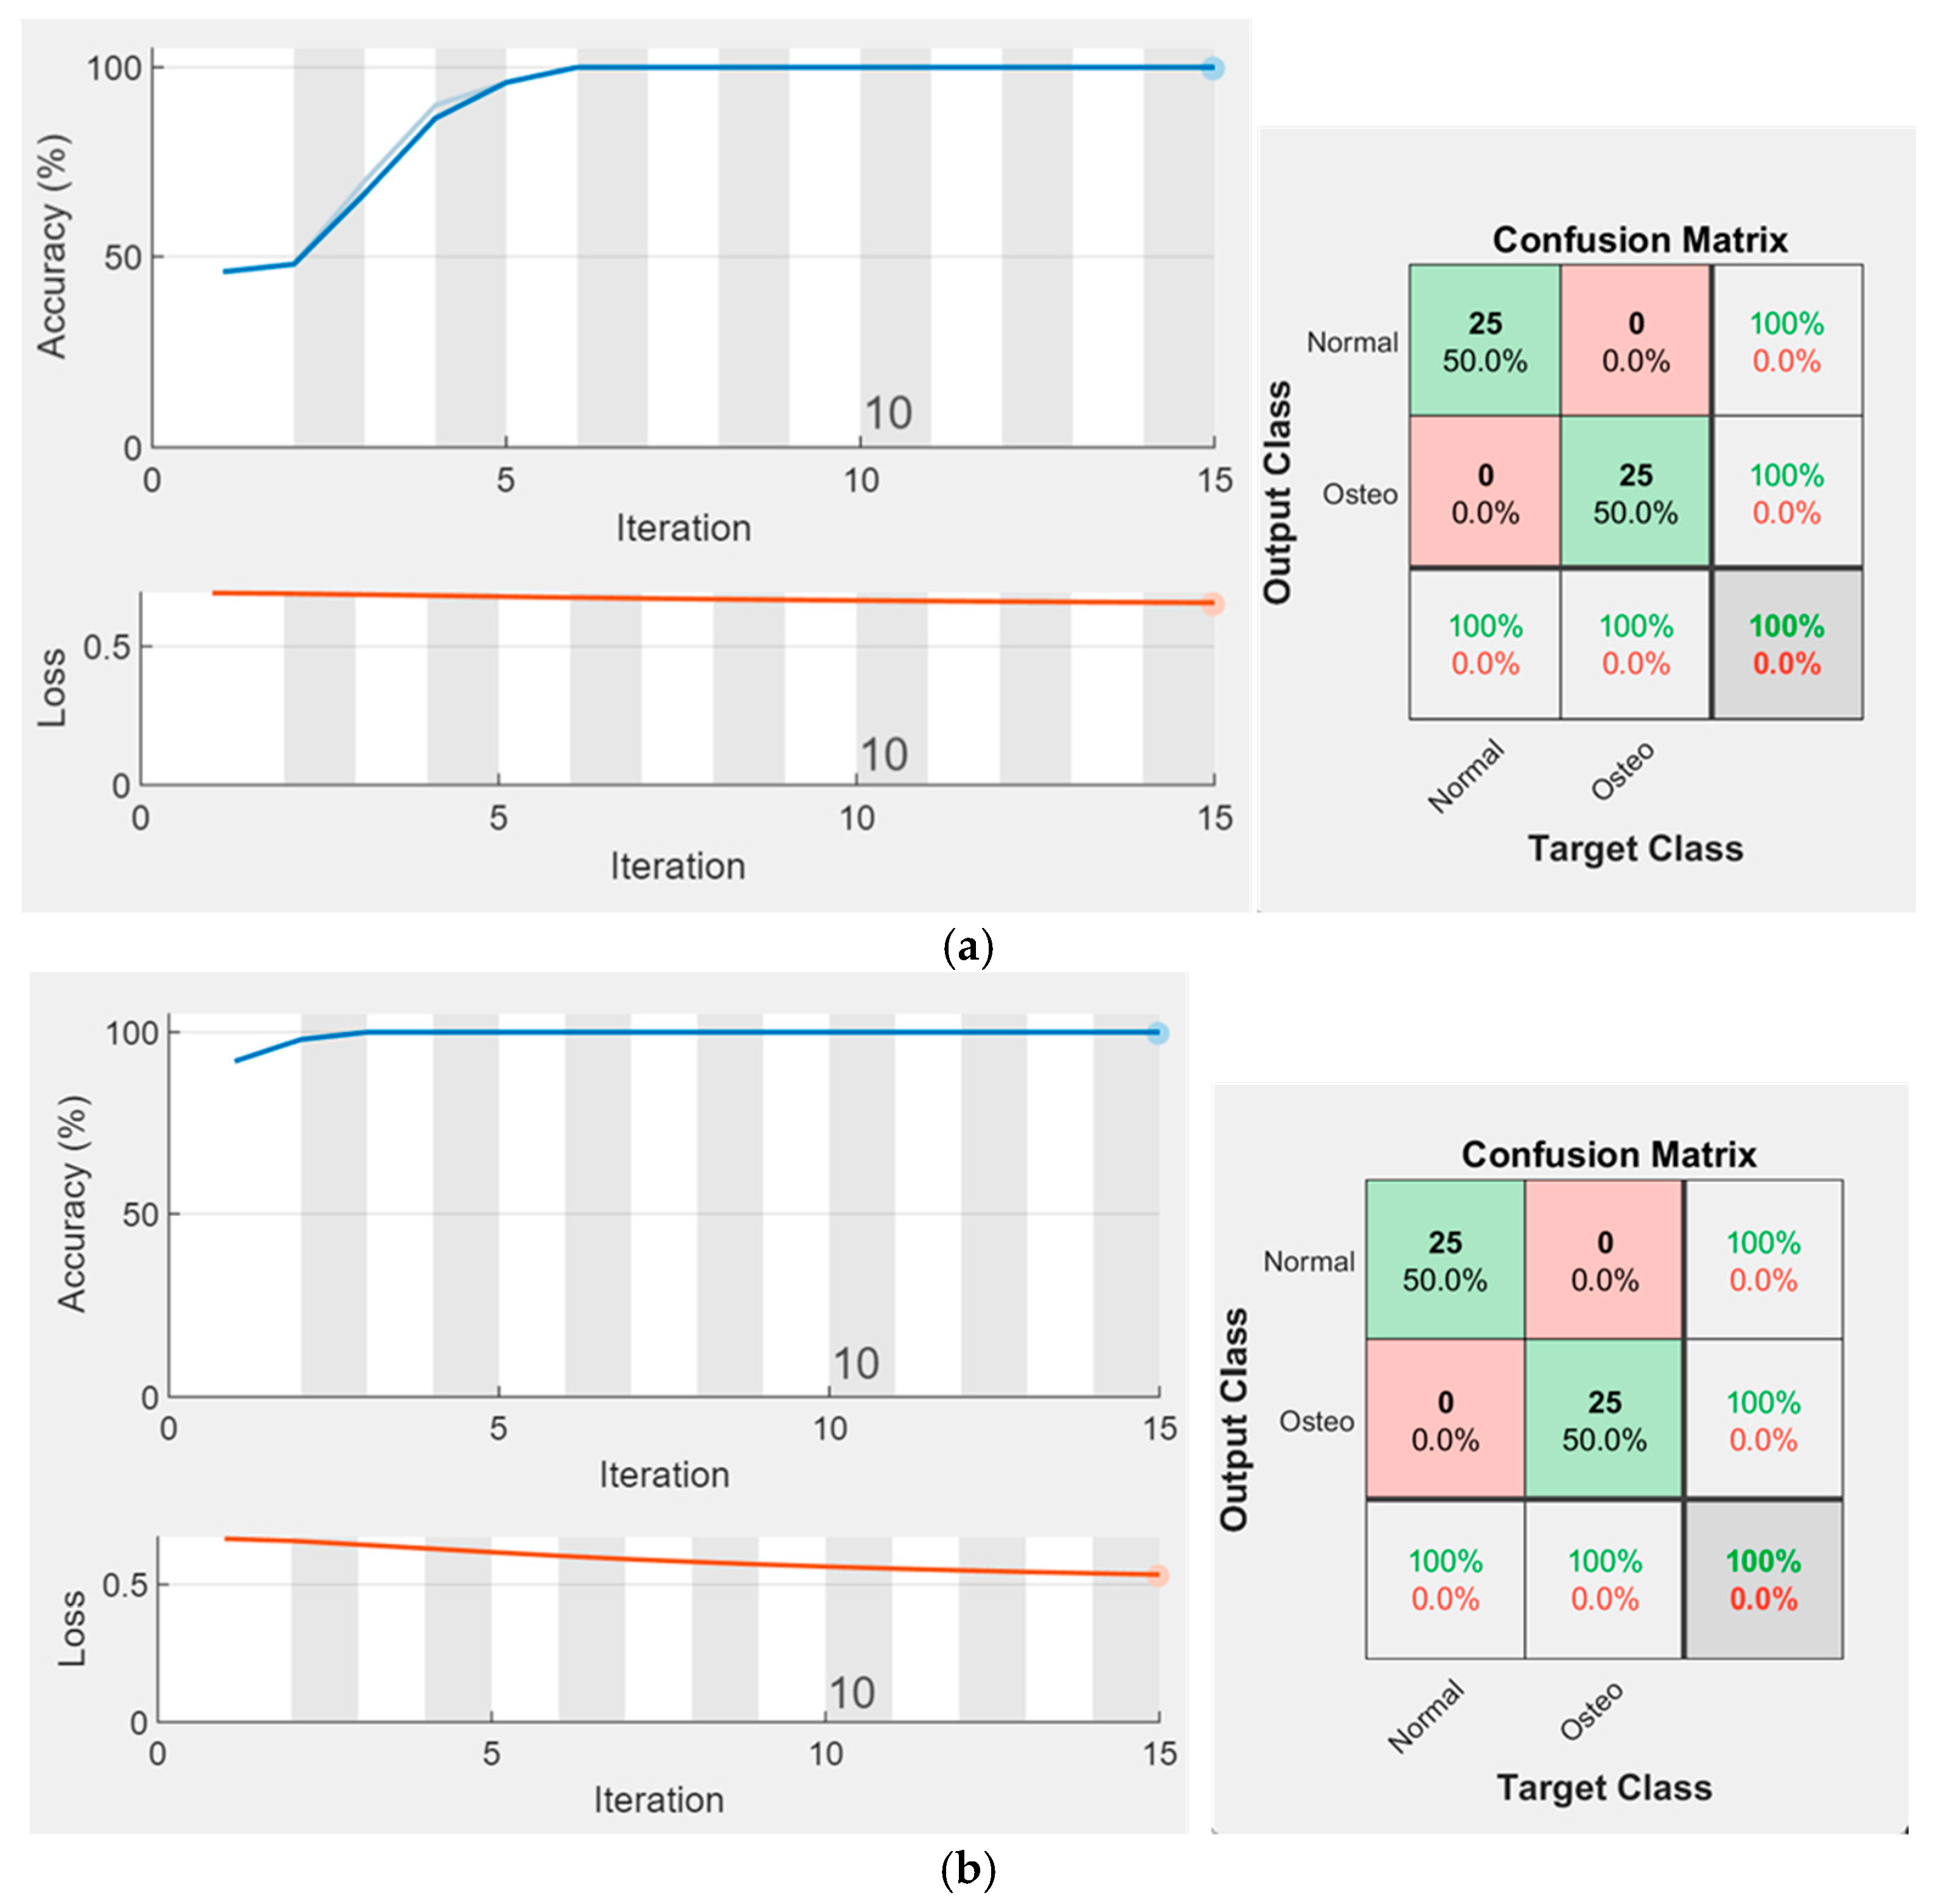
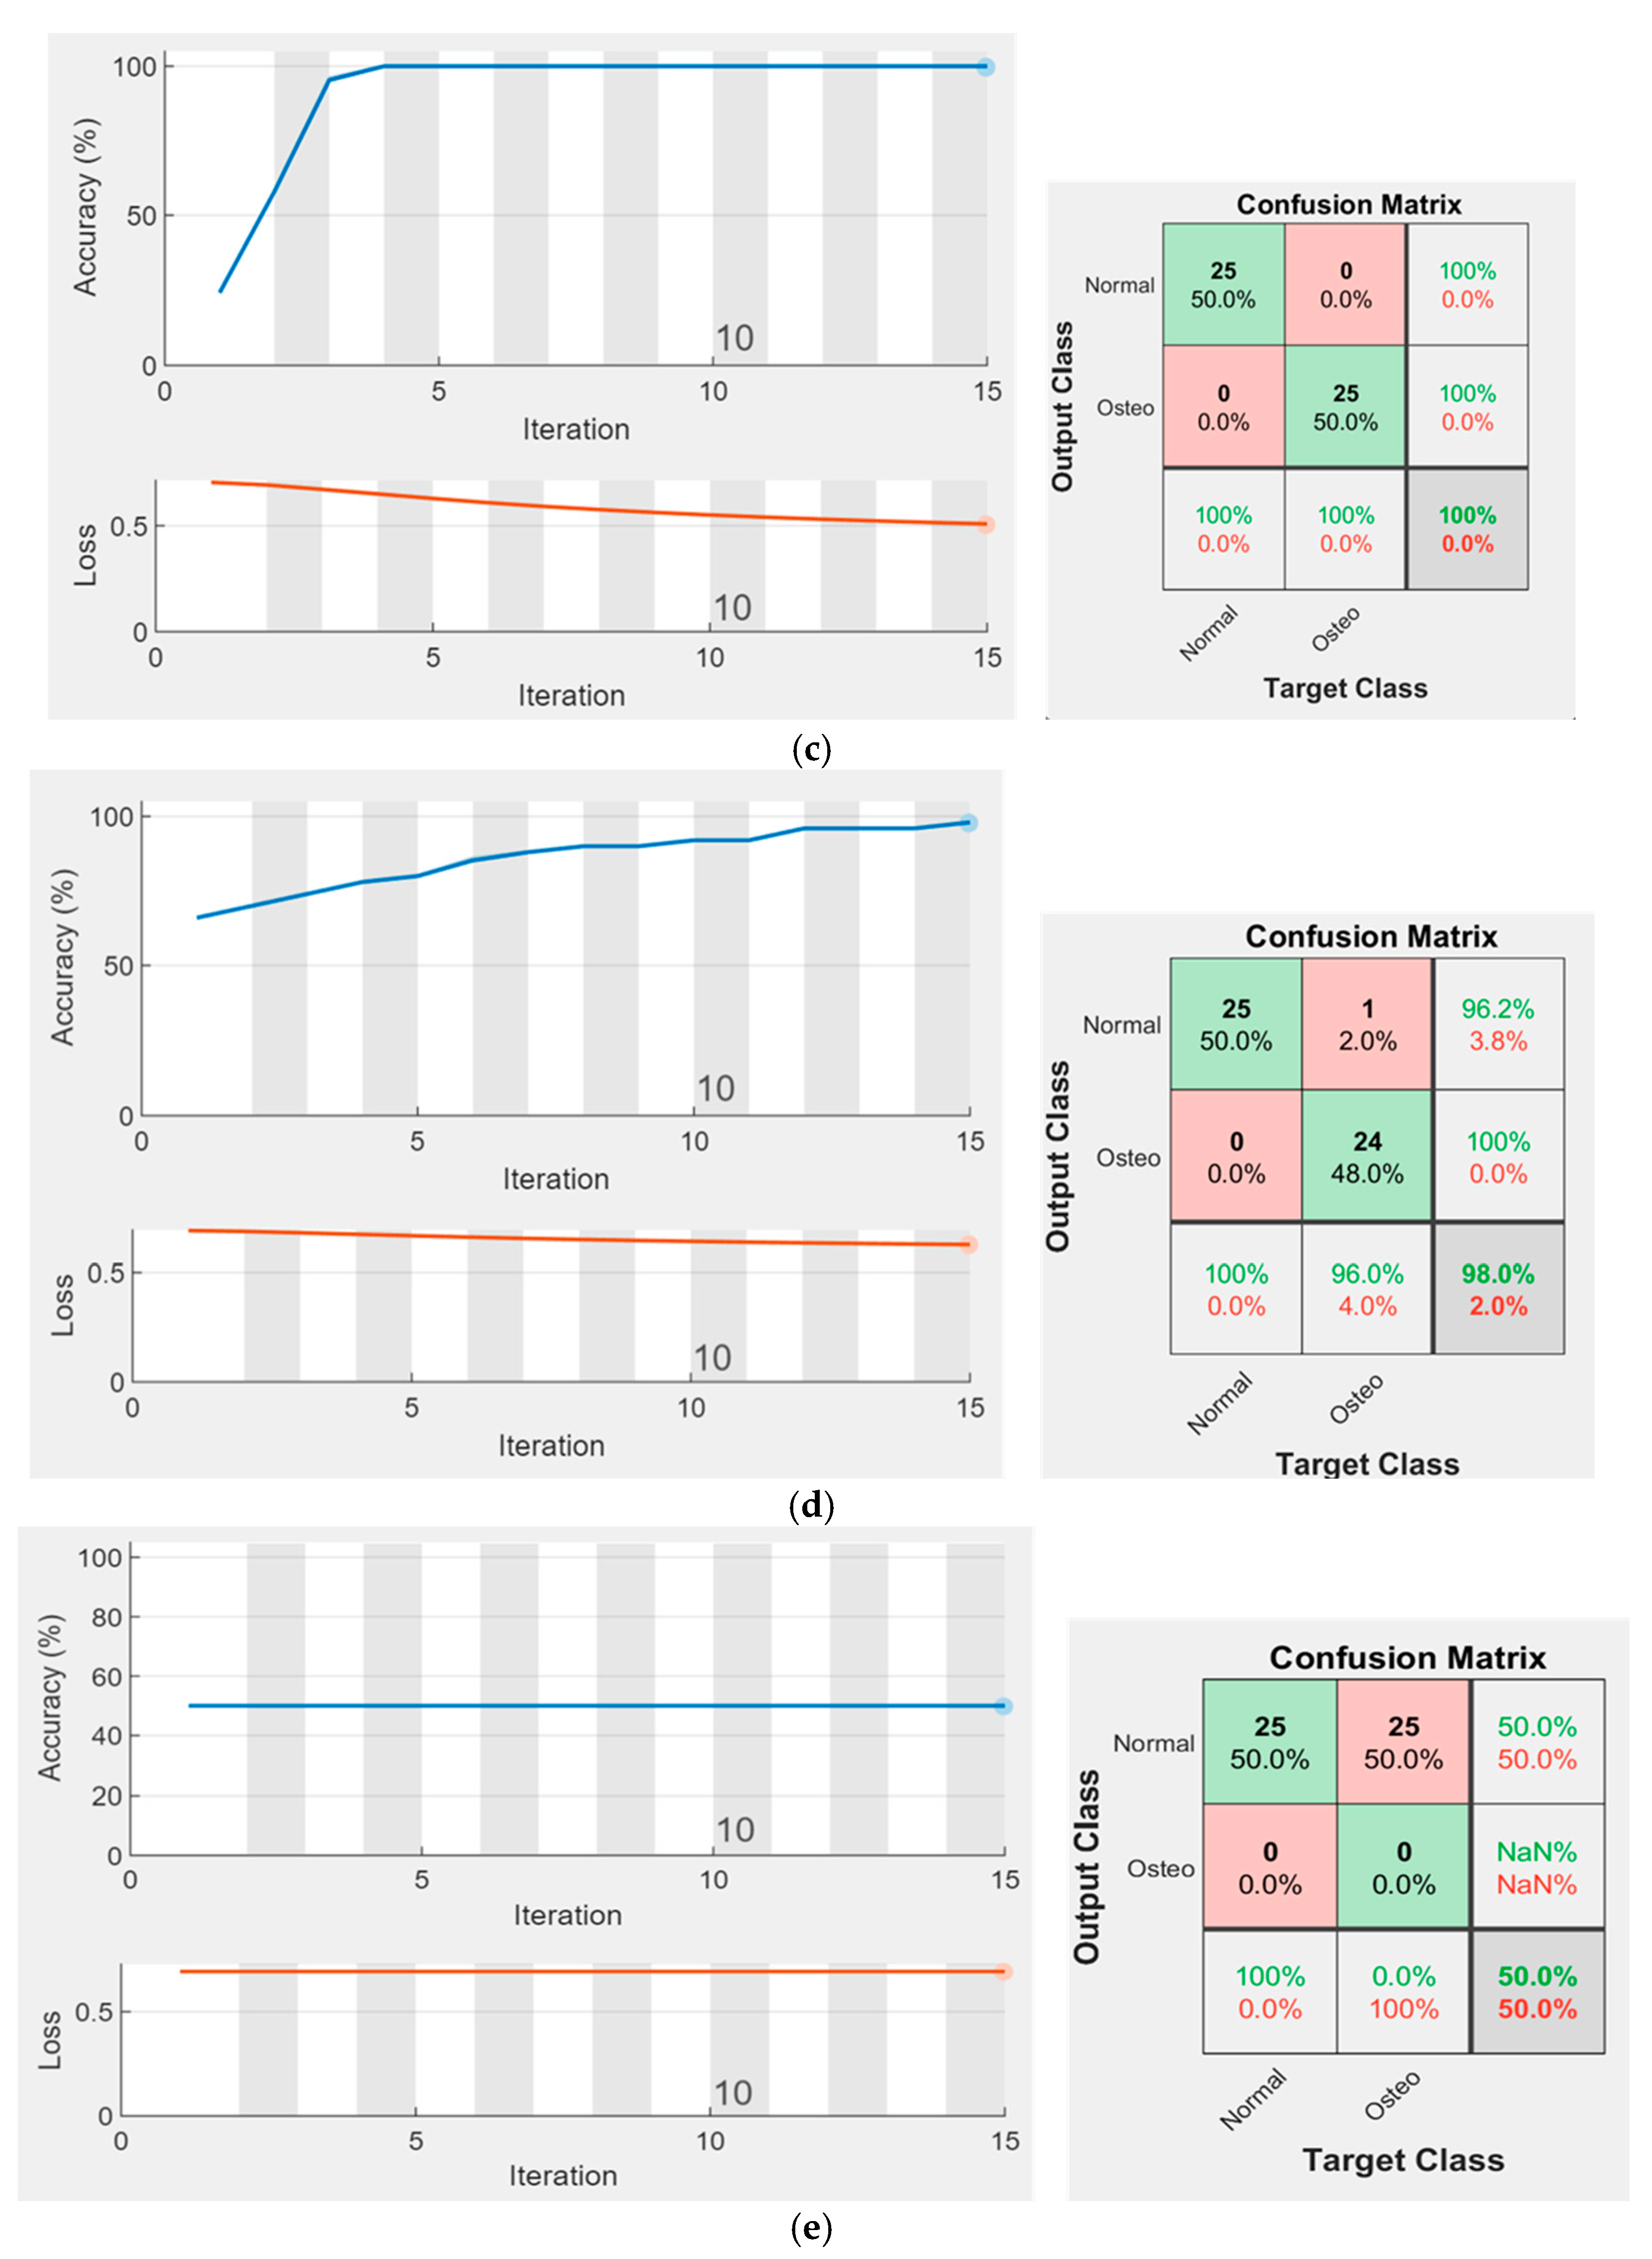
Additional input into the CNN engine through adding the attributes to the image layer increased the performance of the engine. Scenario 1, in which the input is only a CT scan image, failed to classify one osteoporotic bone image; however, all normal bones were predicted well (90% were well predicted). Scenario 2, in which the input consisted of CT scan images including its attribute, successfully classified the image testing (100% were well predicted). The ablation study for the proposed five indices has been conducted to evaluate the individual contribution of each attribute as an additional feature to complement the original images. The results show that the roughness index gives the highest performance, followed by the contrast attribute and phase. However, the frequency index does not show a positive contribution to the performance. The performance of the contribution is calculated as the accuracy and loss plot versus iteration, and the confusion matrix as shown in
Appendix A.
The experiments were conducted on 2D images selected from 3D CT scan images. Because the slicing is chosen on the axial view, the distribution of bone properties in the sagittal and coronal view is not considered. The experiments would be more precise if the bone was evaluated as a 3D object, whereby the analysis is voxel-based rather than pixel-based. Voxel embedded-based deep learning has successfully been applied to 3D instance segmentation in a quantifying dynamic cellular case study [
16]. Osteoporosis will impact the quantitative and qualitative measurements of bone, as the bone mass becomes lesser and more fragile. If the attributes are extended into 3D images, they may better represent the bone quality. A combined approach with embedded-based deep learning may be an alternative for future work on osteoporosis identification. Another limitation in identifying osteoporosis based on a CT scan is the segmentation of the bone itself; the bone should be segmented from other organ bodies. Due to some overlapping in the grayscale value between one organ and the others, the simple threshold technique to segment the bone is insufficient. Another method of the segmentation algorithm can be integrated to obtain only the bone part and remove the other part of the body. Yao et al. [
17] developed a segmentation method using compound figures with boundary detection and side loss. This technique can improve extraction of the targeted image from the compounded figures. We believe this method is also suitable for bone segmentation, where bone identification can be tracked by looking at the grayscale value and considering the boundary. However, this hypothesis needs to be investigated further, and we will incorporate it into future work.
6. Conclusions
Based on the conducted experiments, several significant points have been highlighted. The adopted signal-processing technique can generate a new visualization of images which differs from the original images. Enhanced feature generation of images can be achieved by adopting these technologies for image processing in medicine, which will make a significant contribution if AI/ML studies are applied for osteoporosis differentiation based on CT scan data. Some attribute indices highlight consistency in differentiating osteoporosis from normal bone in different scanning modalities (the grayscale, phase, and roughness attributes). Other attributes are consistently different within the same modalities; however, they show no contrast at different modalities (the contrast attribute). One attribute appears to be consistent only on CT scan images, but displays no difference between normal and osteoporotic bone on the DEXA images (the frequency attribute). More experiments on the different modalities should be conducted to test the robustness of these attributes before they are applied as a practical method utilized by the medical practitioner. Studies on the automation and classification of bone by implementing AI/ML technology can be inspired by other studies in different disciplines, especially for classification problems. Hence, the standard workflow for classification purposes in the signal-processing discipline can also be adopted to solve medical problems, especially for osteoporotic bone classification. Future research should be directed toward the implementation of this technique as part of an AI/ML study.
7. Future Research
This research focuses on generating image attributes adopted from the signal-processing technique. However, the robustness and effectiveness of using these attributes for machine learning/artificial intelligence applications must be tested on various AL/ML architectures and image modalities such as CBCT, DEXA, pQCT and others.
Author Contributions
Conceptualization, M.G. and M.H.; data processing, J.Y.A. and B.M.Y., methodology, M.G. and M.H.; validation, E.M.A. and C.P.U. All authors have read and agreed to the published version of the manuscript.
Funding
This research was funded by the Ministry of Research, Technology and Higher Education of the Republic of Indonesia through project code 446/LL3/AK.04/2022, and the APC was partly funded by Research Creativity and Management Office of Universiti Sains Malaysia and the TDC Holdings Sdn Bhd industrial grant through Universiti Sains Malaysia (304.PPSG.6150194/T152) and Research Grant: YUTP-FRG 1/2021 (015LC0-348).
Institutional Review Board Statement
The study was conducted in accordance with the Declaration of Helsinki, and approved by the Institutional Review Board (or Ethics Committee) of USM (protocol code USM/JEPeM/22080524 and date of approval: 9 January 2023).
Informed Consent Statement
Not applicable.
Data Availability Statement
Data are unavailable due to privacy.
Acknowledgments
We would like to thank YARSI University and DIKTI for supporting this research and all partners/collaborators, including AIMST University, USM, and UTP for supporting this work.
Conflicts of Interest
The authors declare no conflict of interest.
Appendix A
Figure A1.
Ablation Study. (a) Original images only; (b) With roughness index; (c) With contrast index; (d) With phase index; and (e) With frequency index, green color indicate the same class while red indicate different class.
Figure A1.
Ablation Study. (a) Original images only; (b) With roughness index; (c) With contrast index; (d) With phase index; and (e) With frequency index, green color indicate the same class while red indicate different class.
References
- Seyed Alizadeh, S.M.; Bagherzadeh, A.; Bahmani, S.; Nikzad, A.; Aminzadehsarikhanbeglou, E.; Tatyana Yu, S. Retrograde Gas Condensate Reservoirs: Reliable Estimation of Dew Point Pressure by the Hybrid Neuro-Fuzzy Connectionist Paradigm. J. Energy Resour. Technol. 2022, 144, 063007. [Google Scholar] [CrossRef]
- Prashanth, M.; Verma, O. Medical Geology: An Interdisciplinary Approach Intended to Unfold the Issues of Natural Environment on Public Health. J. Geosci. Res. 2022, 7, 139–144. [Google Scholar] [CrossRef]
- Akkawi, I.; Zmerly, H. Osteoporosis: Current Concepts. Joints 2018, 6, 122–127. [Google Scholar] [CrossRef] [PubMed]
- Wendy, M.K.; Institute of Medicine (US) Committee on Military Nutrition Research. Dual-Energy X-Ray Absorptiometry: Research Issues and Equipment. In Emerging Technologies for Nutrition Research: Potential for Assessing Military Performance Capability; Carlson-Newberry, S.J., Costello, R.B., Eds.; National Academies Press: Washington, DC, USA, 1997; Volume 6. Available online: https://0-www-ncbi-nlm-nih-gov.brum.beds.ac.uk/books/NBK233779/ (accessed on 23 January 2022).
- Sözen, T.; Özışık, L.; Başaran, N.Ç. An overview and management of osteoporosis. Eur. J. Rheumatol. 2017, 4, 46–56. [Google Scholar] [CrossRef] [PubMed]
- Kini, U.; Nandeesh, B.N. Physiology of Bone Formation, Remodelling, and Metabolism. In Radionuclide and Hybrid Bone Imaging; Fogelman, I., Gnanasegaran, G., Van der Wall, H., Eds.; Springer: Berlin/Heidelberg, Germany, 2012; pp. 29–57. [Google Scholar]
- Shah, N.; Bansal, N.; Logani, A. Recent advances in imaging technologies in dentistry. World J. Radiol. 2014, 6, 794–807. [Google Scholar] [CrossRef] [PubMed]
- Scarfe, W.C.; Farman, A.G. What is cone-beam CT and how does it work? Dent. Clin. N. Am. 2008, 52, 707–730. [Google Scholar] [CrossRef] [PubMed]
- Sonya, D.; Davies, J.; Ford, N.L. A comparison of cone-beam computed tomography image quality obtained in phantoms with different fields of view, voxel size, and angular rotation for iCAT NG. J. Oral Maxillofac. Radiol. 2016, 4, 31–39. [Google Scholar]
- Spin-Neto, R.; Gotfredsen, E.; Wenzel, A. Impact of voxel size variation on CBCT-based diagnostic outcome in dentistry: A systematic review. J. Digit. Imaging 2013, 26, 813–820. [Google Scholar] [CrossRef] [PubMed]
- Pickhardt, P.J.; Pooler, B.D.; Lauder, T.; del Rio, A.M.; Bruce, R.J.; Binkley, N. Opportunistic screening for osteoporosis using abdominal computed tomography scans obtained for other indications. Ann. Intern. Med. 2013, 158, 588–595. [Google Scholar] [CrossRef] [PubMed]
- Masjidi, B.H.K.; Bahmani, S.; Sharifi, F.; Peivandi, M.; Khosravani, M.; Mohammed, A.H. CT-ML: Diagnosis of Breast Cancer Based on Ultrasound Images and Time-Dependent Feature Extraction Methods Using Contourlet Transformation and Machine Learning. Comput. Intell. Neurosci. 2022, 2022, 1493847. [Google Scholar] [CrossRef]
- Shahini, N.; Bahrami, Z.; Sheykhivand, S.; Marandi, S.; Danishvar, M.; Danishvar, S.; Roosta, Y. Automatically Identified EEG Signals of Movement Intention Based on CNN Network (End-To-End). Electronics 2022, 11, 3297. [Google Scholar] [CrossRef]
- Jin, B.; Cruz, L.; Gonçalves, N. Deep Facial Diagnosis: Deep Transfer Learning From Face Recognition to Facial Diagnosis. IEEE Access 2020, 8, 123649–123661. [Google Scholar] [CrossRef]
- Zheng, Q.; Yang, M.; Yang, J.; Zhang, Q.; Zhang, X. Improvement of Generalization Ability of Deep CNN via Implicit Regularization in Two-Stage Training Process. IEEE Access 2018, 6, 15844–15869. [Google Scholar] [CrossRef]
- Hao, M.Z.; Liu, Q.; Jha, A.; Deng, R.; Yao, T.; Jansen, A.M.; Tyska, M.J.; Millis, B.A.; Huo, Y. VoxelEmbed: 3D Instance Segmentation and Tracking with Voxel Embedding based Deep Learning. In International Workshop on Machine Learning in Medical Imaging; Springer: Cham, Germany, 2021; pp. 437–446. [Google Scholar]
- Yao, T.; Qu, C.; Liu, Q.; Deng, R.; Tian, Y.; Xu, J.; Jha, A.; Bao, S.; Zhao, M.; Fogo, A.B.; et al. Compound Figure Separation of Biomedical Images with Side Loss. In Deep Generative Models, and Data Augmentation, Labelling, and Imperfections; Springer: Cham, Germany, 2021; pp. 173–183. [Google Scholar]
Figure 1.
Identification of bone quality based on the HU value of a CT scan. (
A) axial; (
B) sagittal, from abdominal CT scan with a moderate compression fracture (arrow). (
C) pelvic bone; and (
D) T-score from DEXA data where L1-L4 are a vertebral levels. [
11].
Figure 1.
Identification of bone quality based on the HU value of a CT scan. (
A) axial; (
B) sagittal, from abdominal CT scan with a moderate compression fracture (arrow). (
C) pelvic bone; and (
D) T-score from DEXA data where L1-L4 are a vertebral levels. [
11].
Figure 2.
Examples of ROI selection for attribute index calculation at (a) pelvic, and (b) hip locations.
Figure 2.
Examples of ROI selection for attribute index calculation at (a) pelvic, and (b) hip locations.
Figure 3.
Grayscale index of different image data of pelvic (left), hip (middle), and lumbar spine (right); (a) normal bone and (b) osteoporotic bone, red box indicates a selected ROI.
Figure 3.
Grayscale index of different image data of pelvic (left), hip (middle), and lumbar spine (right); (a) normal bone and (b) osteoporotic bone, red box indicates a selected ROI.
Figure 4.
Frequency index of different image data of pelvic (left), hip (middle), and lumbar spine (right); (a) normal bone and (b) osteoporotic bone, where the color is indicating the intensity of frequency.
Figure 4.
Frequency index of different image data of pelvic (left), hip (middle), and lumbar spine (right); (a) normal bone and (b) osteoporotic bone, where the color is indicating the intensity of frequency.
Figure 5.
Roughness index of different image data of pelvic (left), hip (middle), and lumbar spine (right); (a) normal bone and (b) osteoporotic bone, red box indicate a selected ROI.
Figure 5.
Roughness index of different image data of pelvic (left), hip (middle), and lumbar spine (right); (a) normal bone and (b) osteoporotic bone, red box indicate a selected ROI.
Figure 6.
Phase index of different image data of pelvic (left), hip (middle), and lumbar spine (right); (a) normal bone and (b) osteoporotic bone, red box indicate a selected ROI.
Figure 6.
Phase index of different image data of pelvic (left), hip (middle), and lumbar spine (right); (a) normal bone and (b) osteoporotic bone, red box indicate a selected ROI.
Figure 7.
Contrast index of different image data of pelvic (left), hip (middle), and lumbar spine (right); (a) normal bone and (b) osteoporotic bone, a red box indicates a selected ROI.
Figure 7.
Contrast index of different image data of pelvic (left), hip (middle), and lumbar spine (right); (a) normal bone and (b) osteoporotic bone, a red box indicates a selected ROI.
Figure 8.
Samples of images for the training and testing stages of the bone classification study using CNN.
Figure 8.
Samples of images for the training and testing stages of the bone classification study using CNN.
Figure 9.
Accuracy, loss function, and confusion matrix plot of (a) Scenario 1: input CT scan only, and (b) Scenario 2: input including CT scan and its attribute, green color indicate the same class while red indicate different class.
Figure 9.
Accuracy, loss function, and confusion matrix plot of (a) Scenario 1: input CT scan only, and (b) Scenario 2: input including CT scan and its attribute, green color indicate the same class while red indicate different class.
Figure 10.
Classification results of (a) Scenario 1: CT scan only, and (b) CT scan and its attributes together with the confusion matrix, green color indicate the same class while red indicate different class.
Figure 10.
Classification results of (a) Scenario 1: CT scan only, and (b) CT scan and its attributes together with the confusion matrix, green color indicate the same class while red indicate different class.
| Disclaimer/Publisher’s Note: The statements, opinions and data contained in all publications are solely those of the individual author(s) and contributor(s) and not of MDPI and/or the editor(s). MDPI and/or the editor(s) disclaim responsibility for any injury to people or property resulting from any ideas, methods, instructions or products referred to in the content. |
© 2023 by the authors. Licensee MDPI, Basel, Switzerland. This article is an open access article distributed under the terms and conditions of the Creative Commons Attribution (CC BY) license (https://creativecommons.org/licenses/by/4.0/).

 ,
, 


