1. Introduction
Customer interactions are being transformed by the proliferation of task-oriented conversational systems and digital assistants in everyday routines. As a result, the ability to comprehend users and their requirements has become increasingly crucial for these services and devices. In the realm of online customer services, a plethora of business services offers these assistants to enhance the customer experience, particularly in providing prompt and accurate responses to queries. Although human workers possess a superior understanding of customer needs, they are constrained by inherent limitations in their abilities. Conversely, automated agents are cost-effective and easy to implement, can work uninterruptedly, are less prone to errors, and can even communicate in multiple languages. These features make them a viable solution for online customer service.
However, it was reported that, while chatbots are gaining popularity, customers still prefer interacting with real-life assistants due to concerns about potential errors made by chatbots [
1]. Consequently, the main challenge is equipping these services and agents with the capability to comprehend customer needs and respond to their queries in a manner that mimics human behavior. The technology that corresponds to this field of knowledge is Natural Language Understanding (NLU), a subset of Artificial Intelligence (AI) that addresses challenges present in Natural Language Processing (NLP). NLU is responsible for comprehending human language, enabling computers to understand without a predefined syntax, such as programming languages. While both NLU and NLP can comprehend natural language, the former focuses on communicating with individuals and comprehending them.
To train the NLU models, deep neural networks optimized for large-scale utterances are typically used. These models typically use a supervised machine learning approach and require training with annotated data. However, the annotating process is often costly and time-consuming. It has been reported that up to 76% of enterprises in AI have annotated their own data [
2]. However, insufficient data quality can result in project deployment failures.
A solution for addressing this problem is proposed in this work by using a text representation model, based on transfer learning, to feed a clustering mechanism for the annotation of unlabeled data. For this purpose, both classical approaches and transformer-based models were examined for text representation. Furthermore, three clustering algorithms are evaluated. The goal is to propose a solution for annotating unlabeled data by feeding the embeddings of transformer-based models to clustering algorithms and training the models to identify the user’s intent in the text. This article comprises five sections, outlining the state-of-the-art in
Section 2.
Section 3 presented the used materials and developed methods. Furthermore,
Section 4 presents and discusses the attained results. The conclusions reached are shown in the final section.
2. Related Work
In recent years, there has been increasing research on intent detection using unsupervised methods. However, supervised methods remain the most commonly used [
3,
4,
5,
6]. Furthermore, classical clustering algorithms are the most popular unsupervised method [
7,
8,
9]. For example, a hidden Markov model with multivariate Gaussian distributions can be used to generate each utterance from the Global Vectors (GloVe) model’s vectors, applying a weight to every word. This approach can be compared with other unsupervised methods, such as K-Means [
10].
A proposed framework, denoted AutoDial, utilizes multiple features, including frequent keywords present in utterances, part-of-speech tags, and topics. It performs feature assembly by leveraging an autoencoder [
11]. It also clusters the user dialog intents by employing hierarchical clustering and displays superior intent clustering results compared to conventional approaches that use K-Means. An ensemble approach was used in a different study to discover semantically related intents by comparing multiple classical word embedding methods, including Word2Vec and GloVe [
12].
One of the challenges with clustering data is determining the appropriate number of partitions to use. A usual approach is to set the number of partitions to a value greater than the number of class labels determined by ground truth [
12]. A possible way of addressing this problem is by using density-based clustering algorithms, for example, Hierarchical Density-Based Spatial Clustering of Applications with Noise (HDBSCAN), that are capable of retrieving dynamically formed natural clusters [
13].
Previous studies have employed a Bidirectional Encoder Representations from Transformers (BERT) model trained using a combination of unlabeled and labeled utterances to determine a user’s intent with a low amount of labeled data, using a clustering layer on top [
14]. By creating a pairwise similarity matrix and using ground truth labels, the model can identify similarities and differences among utterances. A threshold determines which samples to train on. As the training progresses, the model performs self-labeling on more difficult unlabeled pairs. The model discards pairs that are neither very similar nor dissimilar. By taking this approach, a semi-supervised framework named Constrained Deep Adaptive Clustering with Cluster Refinement (CDAC) can produce a binary classification from a multi-class dataset. This approach can help the model learn intent discriminative features and find new intents [
14].
Although some studies have reported the superiority of unsupervised methods [
14,
15], these approaches have significant limitations for practical applications since it is impossible to find data for all scenarios. Lin and Xu [
16] proposed a different approach to intent detection by training a Bidirectional Long Short-Term Memory (Bi-LSTM) on labeled data to identify their distinctive characteristics. The learned features were then used as input to an anomaly detection algorithm to identify previously unseen intents. Another model could then process new intents to assess feasible labels.
Multi-view clustering is another approach that was used for intent clustering. A better final clustering solution can be achieved by using several sample representations. This approach has been shown to surpass approaches that use a single algorithm alone [
17]. The alternating-view K-Means model employs this concept to better represent a user’s utterance [
18].
The examined works proposed a methodology to address the same problem studied in this work. Still, most have tried using supervised learning or intended to discover further examples for a given category. The approach followed in this work goes in a different direction, using unsupervised methods (clustering algorithms) fed with sentence embeddings from machine learning-based models (transformers).
3. Materials and Methods
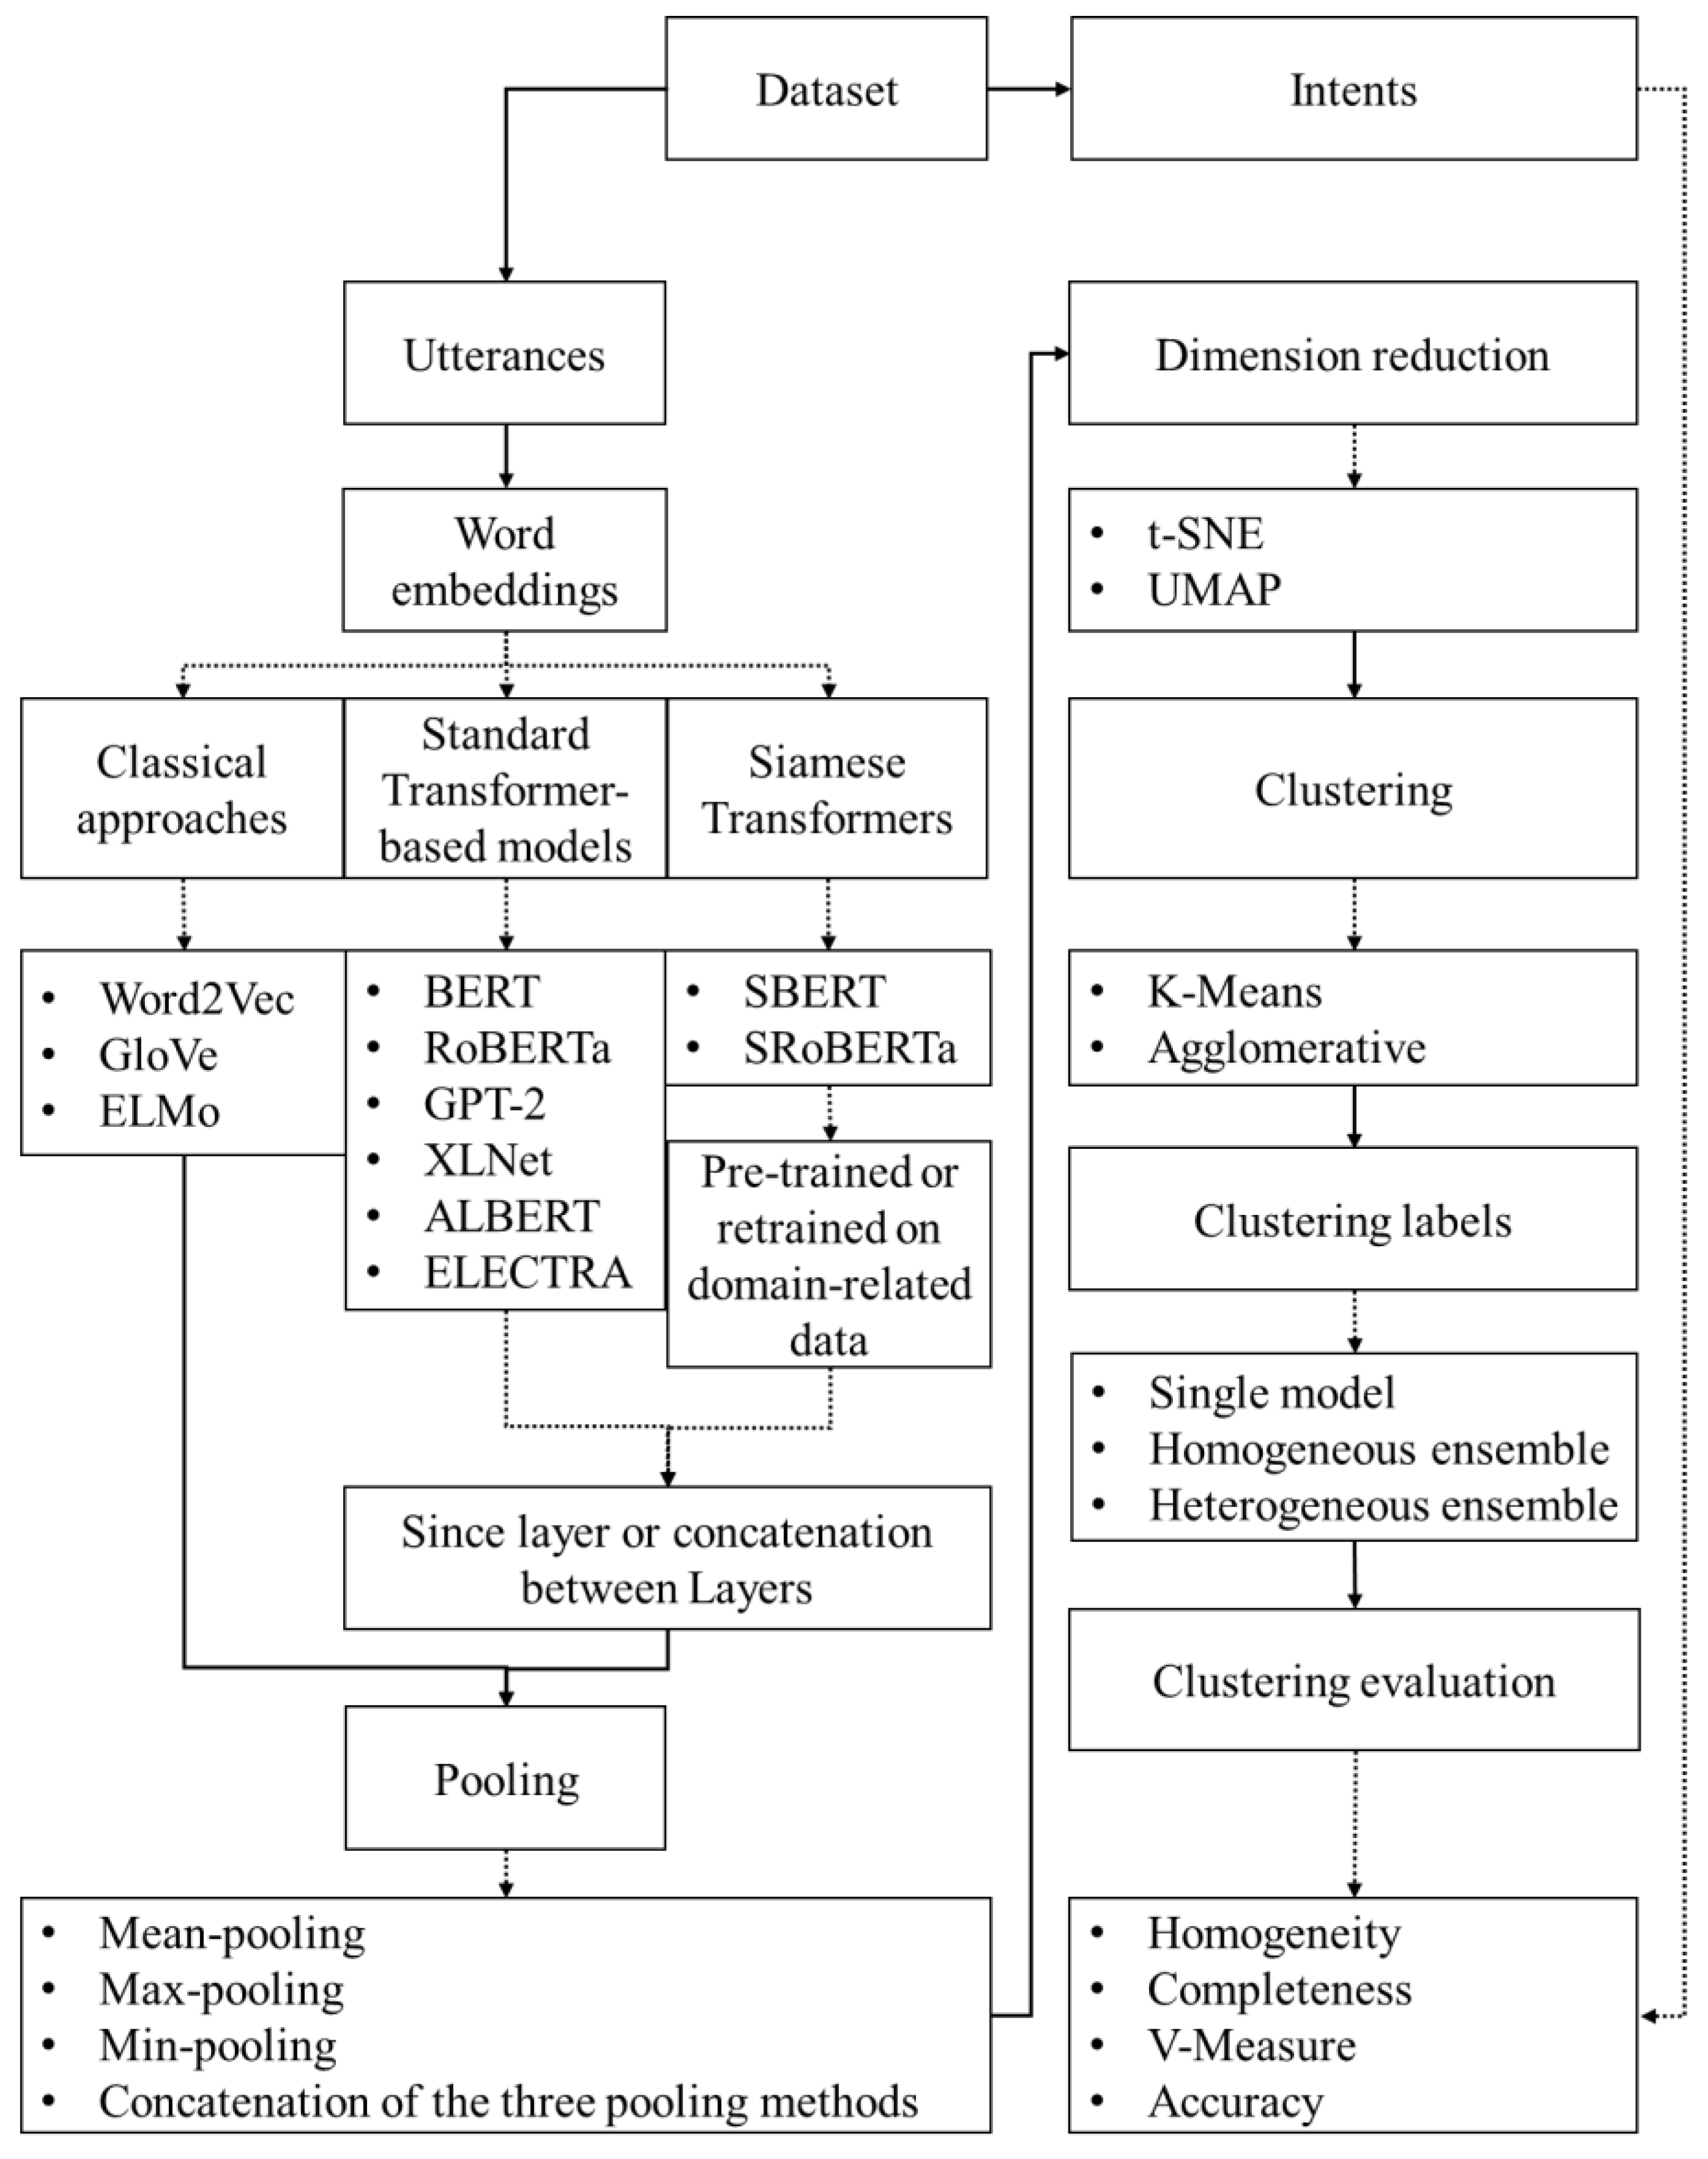
This section covers the developed solution by indicating the used data followed by the employed methodology. A total of three classical approaches and six transformer-based models were examined for sentence embedding creation. Specifically, the classical approaches were Word2Vec, GloVe, and Embeddings from Language Models (ELMo). The transformer-based models were BERT, Robustly Optimized BERT Pre-Training Approach (RoBERTa), Generative Pre-trained Transformer (GPT) 2, XLNet, A Lite BERT (ALBERT), and Efficiently Learning an Encoder that Classifies Token Replacements Accurately (ELECTRA).
This information was then fed to the clustering algorithm for data annotation. Furthermore, the employment of dimension reduction was also studied. As a result, the studied factors were: the embedding produced by the transformers; the pooling techniques; the clustering algorithms; the number of clusters; and the dimension reduction algorithms (checking if they are beneficial). This article evaluates how each element contributes to identifying the most suitable solution, following the sequence presented in
Figure 1.
3.1. Examined Data
This study uses the schema-guided dialogue state tracking task dataset of the 8th Dialogue System Technology Challenge (DSTC8) [
19], which is available at
https://huggingface.co/datasets/schema_guided_dstc8 (accessed on 27 March 2023). This dataset contains task-oriented conversations between a virtual assistant and humans, covering several domains. Moreover, each domain has numerous tasks annotated. A sequence of turns characterized each conversation, comprising both virtual assistant and human utterances. Multiple labels are provided for each utterance, including the user’s intent, entities and their attributes, and slots. Only the intent labels (ground truth) and their corresponding human-only utterances were used since this study focuses on representing dialog sentences to cluster user intents.
For this study, 16,142 human-only utterances and the corresponding intent labels were sampled, resulting in 34 different intents over 14 domains. It is worth noting that system dialogs were excluded from the dataset since they consist of short utterances and are not representative of real-world dialogs (they are synthetic). The distribution of intents per domain is described in
Table 1. The data includes several intents for each domain, and the number of utterances per intent is unbalanced. Utterances containing unusual characters were filtered.
3.2. Baseline Models for Word Embeddings
Numerous methods exist for representing text, with the most recent approaches employing prediction-based models. These models are trained on large corpus in a self-supervised manner, typically through language modeling and similar techniques that use machine learning algorithms, such as neural networks, to generate word representations in dense vectors. There are two types of word embeddings (word representations): static representations, which provide a representation for each word independent of its context or surrounding words, and contextual representations, which can vary depending on the specific context in which a word is used.
Word2Vec [
20] is a standard model to create word and sentence embeddings. It uses a neural network with only one hidden layer. There are two variations of this method: the continuous bag of words, which tries to predict the target words from a given set of surrounding words (context words) [
20], and the skip-gram, which, given only one context word, predicts the surrounding words [
21]. GloVe is similar to Word2Vec, but the training is performed on combined global word-word co-occurrence statistics from a corpus. These two approaches are standard static word vectors, frequently employed as baselines when performing sentence representation [
22,
23]. One of the main limitations of static representations is that they assign a fixed mapping to each word without considering its context. As a result, approaches based on this methodology cannot capture the semantic and syntactic meanings of words in each sentence as the terms are represented independently. Deep contextual representations become a topic of interest as they can address these limitations.
Newer models such as ELMo [
24], universal language model fine-tuning [
25], and InferSent [
26] employ context-dependent approaches by using a Bi-LSTM architecture. Of these methods, ELMo is usually a good choice when there is a need for embeddings to capture the nuances of language and context dependency. As a result, the selected baseline models to compare against the transformer-based models were Word2Vec, GloVe, and ELMo embeddings.
3.3. Transformer Models for Word Embeddings
Typically, when training a neural network, the data is labeled to enable a supervised approach. Such information allows the network to discern patterns and recognize relevant input features based on the labels. In contrast, self-supervised training occurs when the network uses the data as labels, enabling it to learn autonomously without human intervention.
In the field of NLP, a common self-supervised training method involves utilizing a vast text corpus such as Wikipedia. A sequence of words is fed to the model, which is tasked with predicting a subsequent word. This technique is named language modeling and is frequently employed in pre-training, where large models, including transformer-based ones, are pre-trained on extensive data to acquire general language knowledge and features. Transfer learning is applied after the pre-training stage, allowing the models to learn from smaller amounts of labeled data. Pre-training before actual training can result in better performance than training a model from scratch. Several models have been developed and made publicly available, generally following the approach proposed for BERT [
27].
The Transformer model utilizes self-attention as its core concept, enabling it to process complete input sequences simultaneously and capture the interdependence among different parts of the sequence. This ability to perform parallel processing makes it faster than conventional recurrent neural networks and enables it to handle longer sequences effectively.
Six Transformer models, chosen for their excellence in NLP’s state-of-the-art, were selected for this study. To ensure fairness, all models, except for one, have a comparable number of parameters. The models are available at the HuggingFace model hub, and the employed embedding dimension was 768. The examined models were:
BERT employs two pre-training tasks to learn both word- and sentence-level representations simultaneously [
27]. The first task is Masked Language Modeling (MLM), where the model fills in the missing words in a sequence. The second task is Next Sentence Prediction (NSP), where BERT receives a pair of sentences and predicts whether the second sentence implies the first one or not. The model uses a classification token called (CLS) to classify the sentence pairs into two categories: sequential (50% of cases) and randomly drawn from the corpus with no entailment relationship (the other 50%). The examined model consists of 12 transformer encoder layers, each having a multi-head self-attention mechanism followed by a feedforward neural that maps the input sequence to a higher-dimensional space, thus enabling the model to capture more complex relationships between words.
RoBERTa shares the same architecture as BERT, but it was trained on a larger dataset with a more effective training procedure. Furthermore, the NSP was removed since it resulted in inferior downstream results [
28].
GPT-2 is a transformer-based language model that utilizes a standard architecture with decoder blocks. It is an autoregressive model that considers previous tokens to forecast the current token. As a result, it is a unidirectional model, which can limit its ability to understand the context that comes after the current token [
29]. Its architecture comprises 12 transformer encoder layers that use a self-attention mechanism and a feed-forward neural network. This design allows the model to concentrate on various segments of the input sequence and extract significant features. This is made possible by the self-attention mechanism that enables the model to recognize dependencies between different tokens in the sequence. The output of the self-attention mechanism is processed by a feedforward neural network, which applies non-linear transformations to refine the features further.
ALBERT is a simpler variation of BERT. It tries to keep the same performance while improving computational efficiency. To achieve this goal, ALBERT eliminates the Next Sentence Prediction (NSP) pre-training and introduces a new one named Sentence Order Prediction (SOP), which comprises a binary classification task for which the algorithm is given a pair of sentences (one with swapped order and one consecutive) and asked to determine which has the right order [
30].
XLNet is a natural language processing model that uses a distinct pre-training approach known as permutation language modeling. Unlike BERT’s MLM, XLNet generates all possible permutations of the input sequence. The model was trained autoregressively, predicting each token based on both its left and right context without the need for the artificial tokens used in BERT. This approach allows XLNet to capture more global context and dependencies between tokens, improving performance on various language tasks [
31]. It uses the concept of two-stream self-attention, and the 12-transformer encoder layer version was used in this work.
ELECTRA has a similar architecture to BERT but with a different pre-training task [
32]. In this case, the model was trained to predict whether each token in a sentence is original or generated (i.e., replaced by a model-generated token). A discriminator network performs this task. Additionally, the ELECTRA model includes a smaller generator network that corrupts the input sentence by replacing some of its tokens with generated ones. The discriminator is trained on this corrupted input to distinguish between original and generated tokens. This training strategy allows for more efficient pre-training than BERT, where the entire input sequence is masked and predicted.
The models analyzed in previous studies have demonstrated superior performance compared to BERT on certain tasks in a supervised learning setting [
28,
30,
31,
32]. Therefore, it is important to investigate whether these models also have superior sentence representation capabilities.
3.4. Sentence Embeddings
Both classical embedding methods, such as Word2Vec, and recent transformer-based models operate at the word or sub-word level, meaning that the output representations are for words or sub-words and not sentences. To attain a fixed representation for sentences, a usual approach is to take the word embeddings’ mean (mean-pooling) [
33,
34,
35]. However, maximum (max-pooling) and minimum (min-pooling) pooling are also possible. Hence, the three pooling approaches were examined. The concatenation between the three pooling methods was also evaluated.
Although transformer-based models can attain the best state-of-the-art results in numerous supervised NLP tasks, it is unclear if they can deliver helpful out-of-the-box sentence embeddings. Recent studies on this topic concluded that the [CLS] embeddings, provided by a pre-trained BERT model, do not offer optimal embeddings for similarity tasks. Such evidence points to the need for assessing the embeddings’ quality for tasks that include clustering, ranking purposes, and information retrieval. In fact, averaging the token embeddings of a sentence also leads to poor performance on similarity tasks, with older embedding creation methods, such as GloVe, outperforming BERT.
To address this issue, it was proposed to retrain a BERT model with a natural language inference dataset using a Siamese structure. This dataset requires the model to predict the truthfulness of a given hypothesis (neutral, entailment, or contradiction) based on a given premise [
22]. Afterward, the model was fine-tuned by feeding pairs of sentences one by one in a Siamese fashion. Then, pooling was employed, and a SoftMax classifier was used on top.
A Sentence Evaluation (SentEval) toolkit can evaluate the quality of sentence embeddings on a range of tasks, including sentiment analysis, paraphrase detection, and sentence similarity. It achieves this by taking embeddings generated by any model and using them as features to train a logistic regression classifier, which can then be used to assess the performance of the features. SBERT was evaluated by SentEval, reaching state-of-the-art performance and surpassing preceding standard sentence encoders, including InferSent and the Universal Sentence Encoder (USE) [
36].
Since SBERT and Sentence-RoBERTa (SRoBERTa) were shown to be capable of attaining state-of-the-art results, they were also examined in this work. Though both models were fine-tuned using domain-independent data, this work postulates that they would transfer properly for conversational clustering, outperforming their pre-trained versions.
3.5. Dimension Reduction
Dealing with high-dimensional data poses a significant challenge as the distance between points loses its meaning. In other words, as data dimensionality increases, the distance between any two points becomes roughly equidistant from all other points. Moreover, measuring such distances can be computationally expensive, further exacerbating the problem. Furthermore, high-dimensional data can be problematic for clustering algorithms; hence, there might be a need for the use of a dimension-reduction algorithm.
Principal component analysis [
37] is one of the most commonly used dimensionality reduction algorithms. Although it can show the data’s global patterns, it can fail to identify local ones. More advanced algorithms, such as t-Distributed Stochastic Neighborhood Embedding (t-SNE) [
38] and Uniform Manifold Approximation and Projection (UMAP) [
39], address this problem by trying to more accurately represent the data. Therefore, both algorithms were tested.
3.6. Clustering
Clustering algorithms refer to a category of unsupervised machine learning algorithms that enable the grouping of similar data points, usually based on their similarity or distance. The primary objective of clustering is to divide a dataset into clusters to ensure that data points within the same cluster exhibit a high level of similarity, while those in different clusters are dissimilar. Numerous clustering algorithms have been proposed as state-of-the-art to cluster sentence embeddings. Among them, the K-Means [
40] is still one of the most used since it is highly scalable and converges quickly. This algorithm divides the data points into
k clusters (a user-specified parameter) such that each point is assigned to exactly one cluster.
Agglomerative clustering is a common alternative to K-Means. This algorithm takes a bottom-up approach, where data points initiate their own cluster [
41]. Then, iteratively, the closest cluster pairs are merged until all points belong to a single cluster.
Both K-Means and agglomerative clustering were examined in this work. HDBSCAN, a clustering algorithm based on density that builds a hierarchy of clusters using a tree structure, was also studied to determine if noise detection could improve performance. Regarding HDBSCAN, two cluster extraction methods were explored: leaf and Excess of Mass (EOM). The latter calculates the cluster stability from the condensed cluster tree, while the former choose leaf nodes that belong to a condensed tree hierarchy.
3.7. Ensemble Models
An ensemble clustering approach involves the use of several base algorithms, either multiples of the same or different ones, to reach superior performance. The main goal of ensemble clustering is to obtain more stable results, and it has been successfully applied to intent clustering [
12]. Another advantage of ensemble clustering is the potential to obtain various perceptions from the data.
Multiple ensemble configurations can be considered. Hence, there is a need to focus only on suitable solutions. Initially, a homogeneous ensemble composed of several K-Means clustering algorithms was employed to determine the results’ stability by continuously increasing the number of clustering algorithms used. A combination of different clustering algorithms was also evaluated since the quantity of algorithms does not necessarily imply quality. Additionally, multiple embeddings can be used in conjunction or individually. Combining embeddings from different models with dissimilar interpretations and knowledge can yield better performance due to their combined understanding. In this scenario, the consensus function used was standard plurality voting, where the most agreed-upon cluster determines the class of a point.
3.8. Evaluation Metrics
Four standard evaluation metrics were examined for benchmarking the models. The first was homogeneity, which is a metric used in clustering that determines if the points of each cluster belong to a unique class (given the ground truth label). The score ranges from 0 to 1, with 1 indicating all clusters containing data points from a single class. This metric is defined as [
42]
where
is the conditional entropy of the class distribution given the cluster assignments, and
E(
C) is the entropy of the class distribution. Completeness was the second metric, and it assessed whether the data points that belonged to the same class were placed in the same cluster. This metric also reports a value that ranges from 0 to 1, and is given by [
42]
where
is the conditional entropy of the cluster assignments given the class distribution, and
is the cluster assignment entropy.
The V-Measure was the third metric, and it evaluates the correctness of cluster assignments by analyzing conditional entropy. A higher V-Measure value indicates greater similarity. It is seen as the harmonic mean of the stated previous metrics through [
42].
Accuracy is a metric commonly used to evaluate classification models, but it can also be used to evaluate clustering algorithms. However, the Hungarian method was employed to address the correspondence problem since the cluster labels do not have any inherent meaning (the labels specify the group to which each sample belongs). Similar to what was conducted for CDAC development, the clustering accuracy was also measured for the studied ensemble methods [
14]. The calculation of accuracy is given by the number of correct predictions divided by the total number of predictions.
4. Results and Discussion
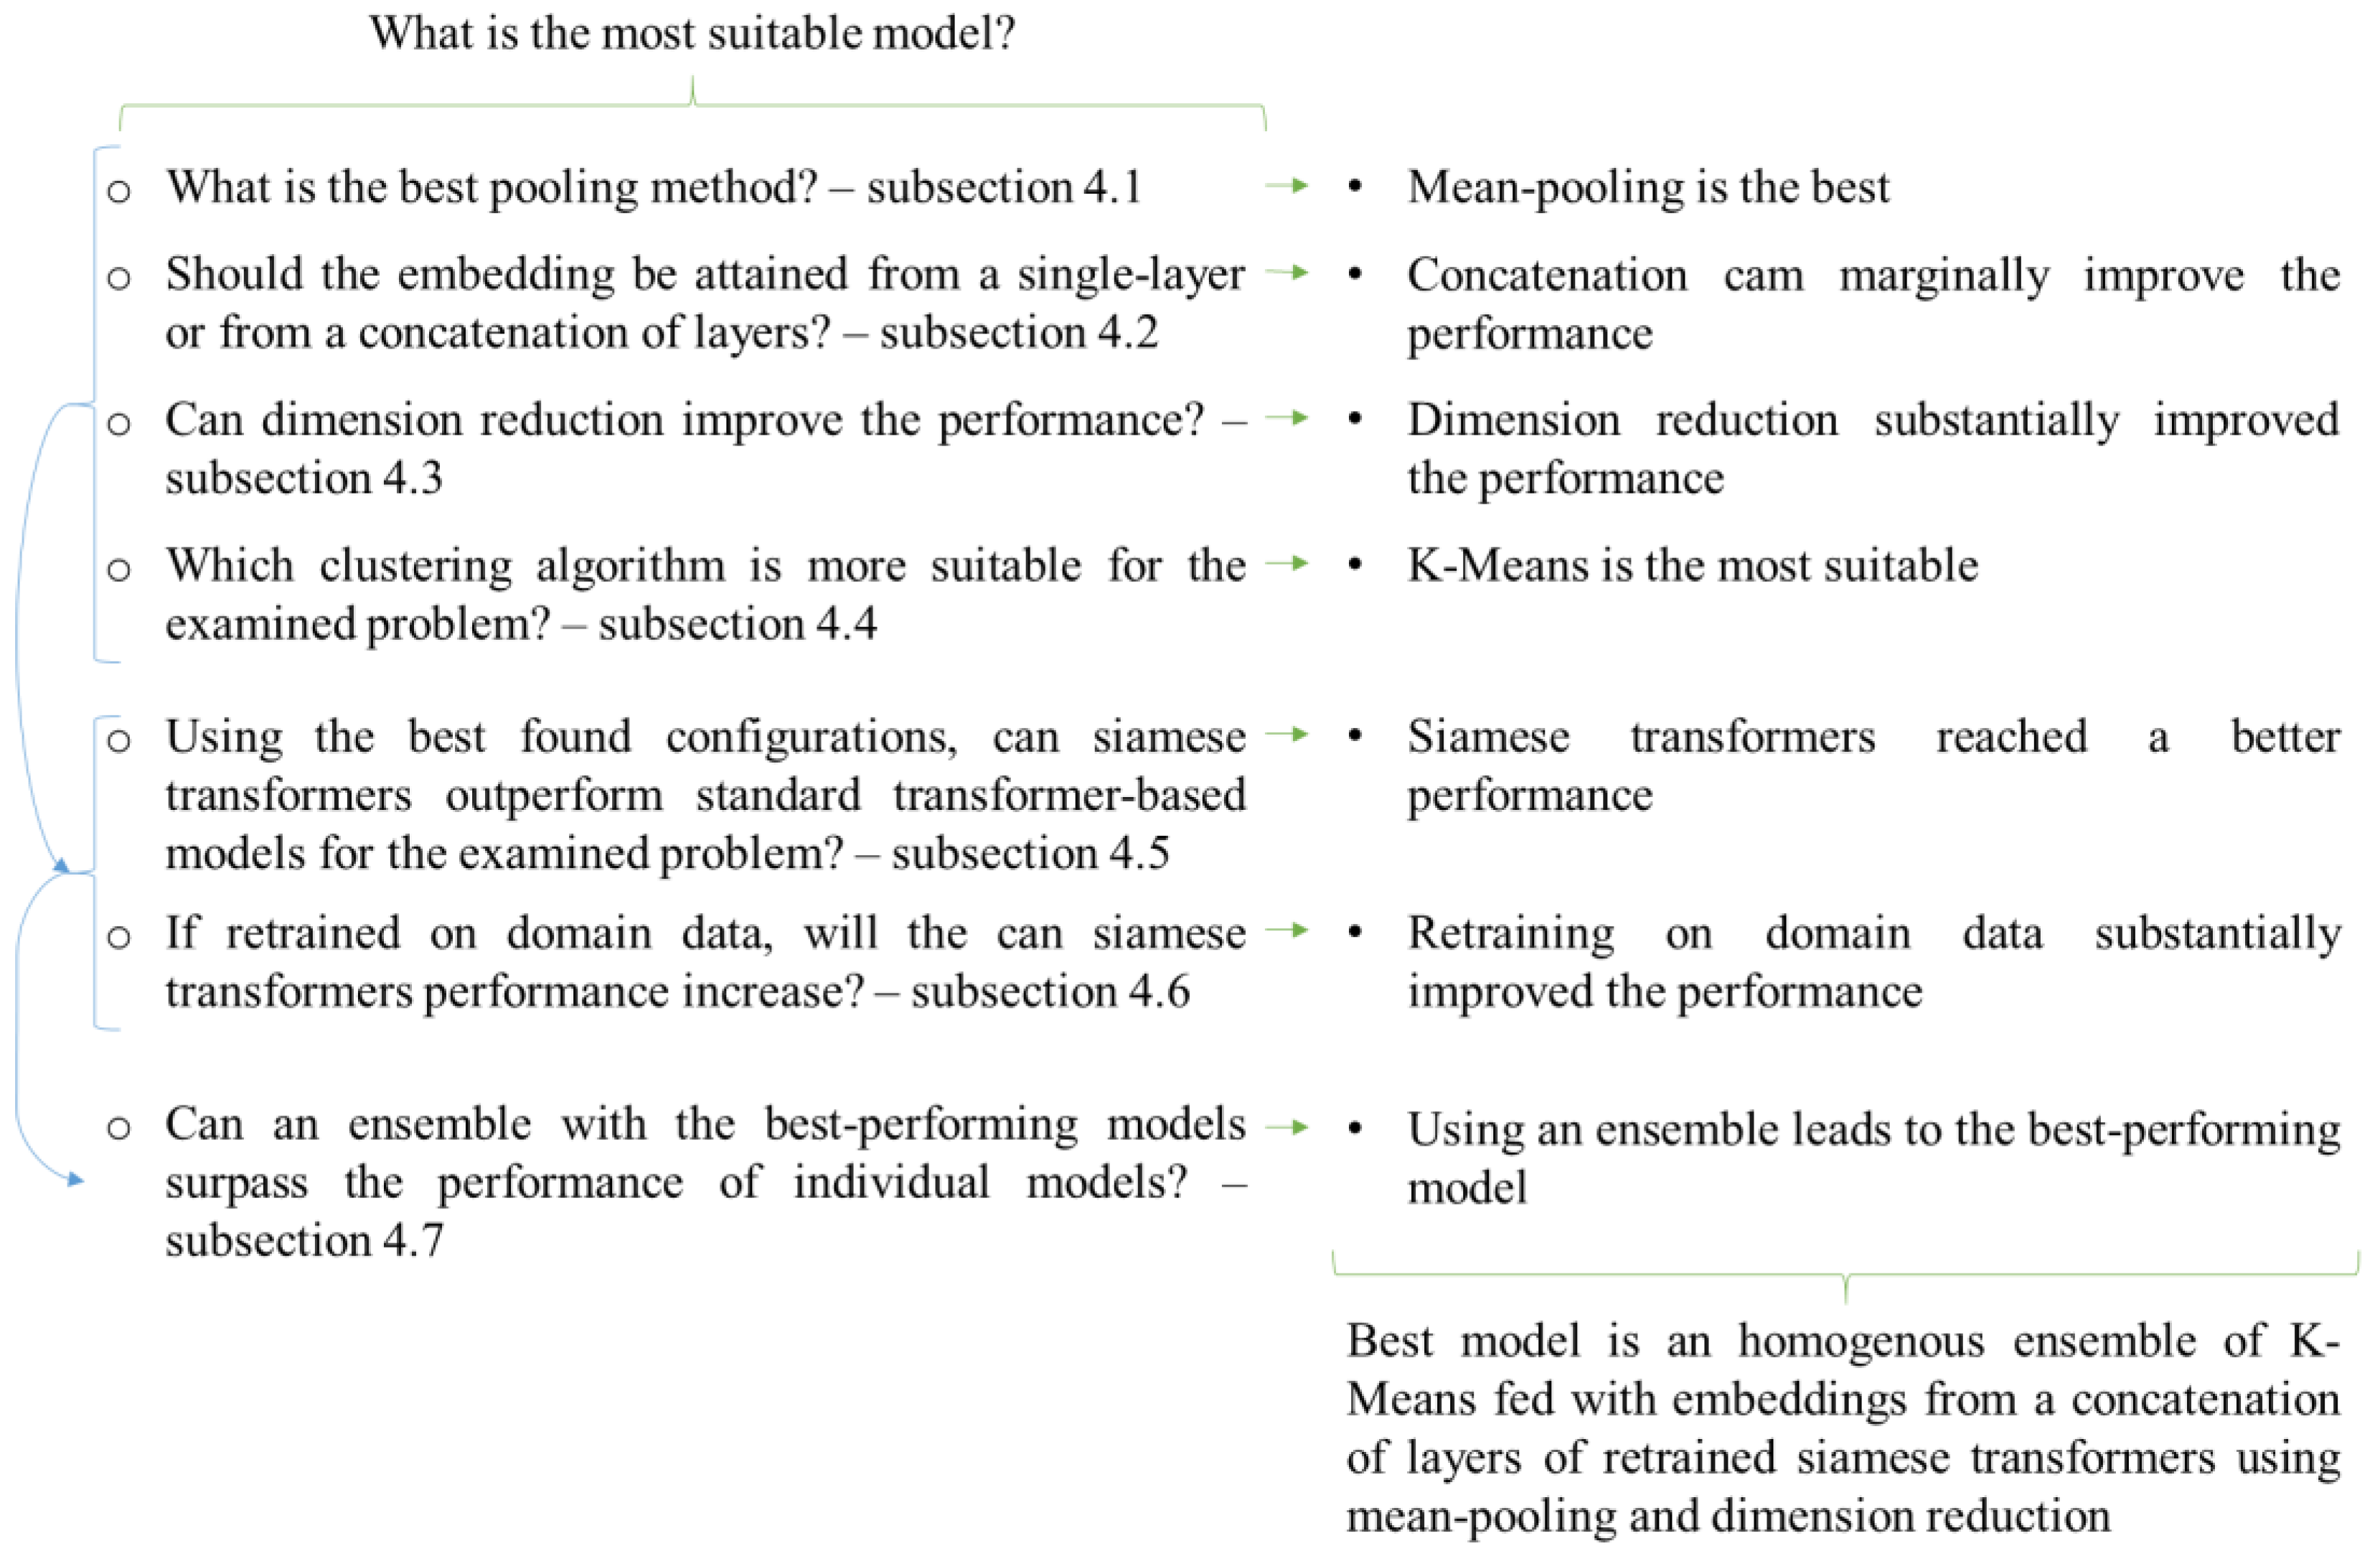
This section presents the results of this work, which were divided into seven experiments. The first one evaluated the performance according to the pooling methods used. At the same time, the second examined whether the concatenation of two or more layers from the transformer-based models for creating the embeddings could improve the results. The third experiment evaluated the need for using dimension reduction on the embeddings, while the fourth studied the clustering algorithms. These first four examinations allowed the definition of the best pipeline, which was then used in the following two experiments. Specifically, in the sixth evaluation, the Siamese transformers were studied to define a baseline performance that was then used to compare the effect of retraining these models on domain data. The final experiment used the best-performing models identified earlier and combined them using ensemble-based approaches.
The followed-up sequence of queries and the conclusions reached after each investigation are shown in
Figure 2. The clustering labels generated by the models represent their outputs, which were then evaluated by comparing them with the ground truth labels using the clustering evaluation metrics described in
Section 3.8.
Except for the experiments carried out with HDBSCAN and agglomerative in
Section 4.4, all other experiments used the embeddings from either the baseline models or from specific layers (indicated in the experiment) of the transformer-based models to feed the K-Means for clustering the data into 34 clusters (the number of intents in the dataset). Afterward, the evaluation metrics were used to assess the quality of the found clusters according to the database intents. The analysis primarily focused on finding the maximum V-measure since this is the most relevant metric.
4.1. Pooling Methods
This experiment evaluates the effect of using different pooling methods for sentence embedding when feeding a K-Means clustering. The V-measure scores of all six models are shown in
Table 2. The best layer reports the highest score found in each model. By examining the table, it is possible to determine that BERT, RoBERTa, and GPT-2 are the best overall performers. Even though RoBERTa’s authors reported better performance for downstream tasks through eliminating the NSP and training on further data, in this analysis, this model offers no substantial improvements over BERT, which was the best performer using mean-pooling. Unexpectedly, GPT-2 achieves the best performance when max-pooling is used. This model is remarkable for text generation but is not known for its word and sentence embeddings for clustering or information retrieval tasks. Most models perform the best in the initial layers, except for RoBERTa and ALBERT. ALBERT was the only model that achieved better results using its last layer, possibly due to its new pre-training task (the SOP).
Mean-pooling was identified as the best choice for sentence representation. GPT-2 was the only outlier, where min-pooling and max-pooling methods were superior to mean-pooling. It was observed that concatenating pooling methods did not lead to better performance, even though additional information was provided by this method. Unsurprisingly, the baselines show superior performance, namely Word2Vec and GloVe. These two embeddings have been designed explicitly for sentence representation, while ELMo and transformer-based models have not. ELMo and transformers perform downstream tasks well, but a good sentence representation is not implied.
4.2. Concatenation between Layers
The BERT model creators indicated the possibility of attaining superior performance by concatenating layers for downstream tasks instead of employing a single layer [
27]. Therefore, this experiment analyzed whether concatenation between layers (in pairs or tuples) can improve utterance embeddings. The models were examined using the best pooling technique found in the preceding analysis.
Table 3 presents the attained results.
By examining
Table 3, it was concluded that using concatenation layers led to inferior performance compared to using a single-layer representation. Overall, no indication at this stage suggests combining several layers provides further relevant information. Since concatenating leads to an increase in the size of the vector, a feasible approach is to sum them instead, preserving the original size of the sentence vector. It was observed that the performance was almost the same as concatenation. The only exception was GPT-2, for which the summation of the first two layers increased the V-measure metric to 46%, roughly a 3% increase from the best single-layer result and surpassing the other models. Therefore, it is possible that combining multiple layers can lead to better performance. Still, the increase in complexity of the overall model might not be desirable if it leads to a slight improvement in performance.
4.3. Dimension Reduction
The outcome of applying dimension reduction before the clustering process is examined in this experiment. Considering that the output embeddings created by the transformer-based models are highly dimensional, it is likely that numerous features are redundant [
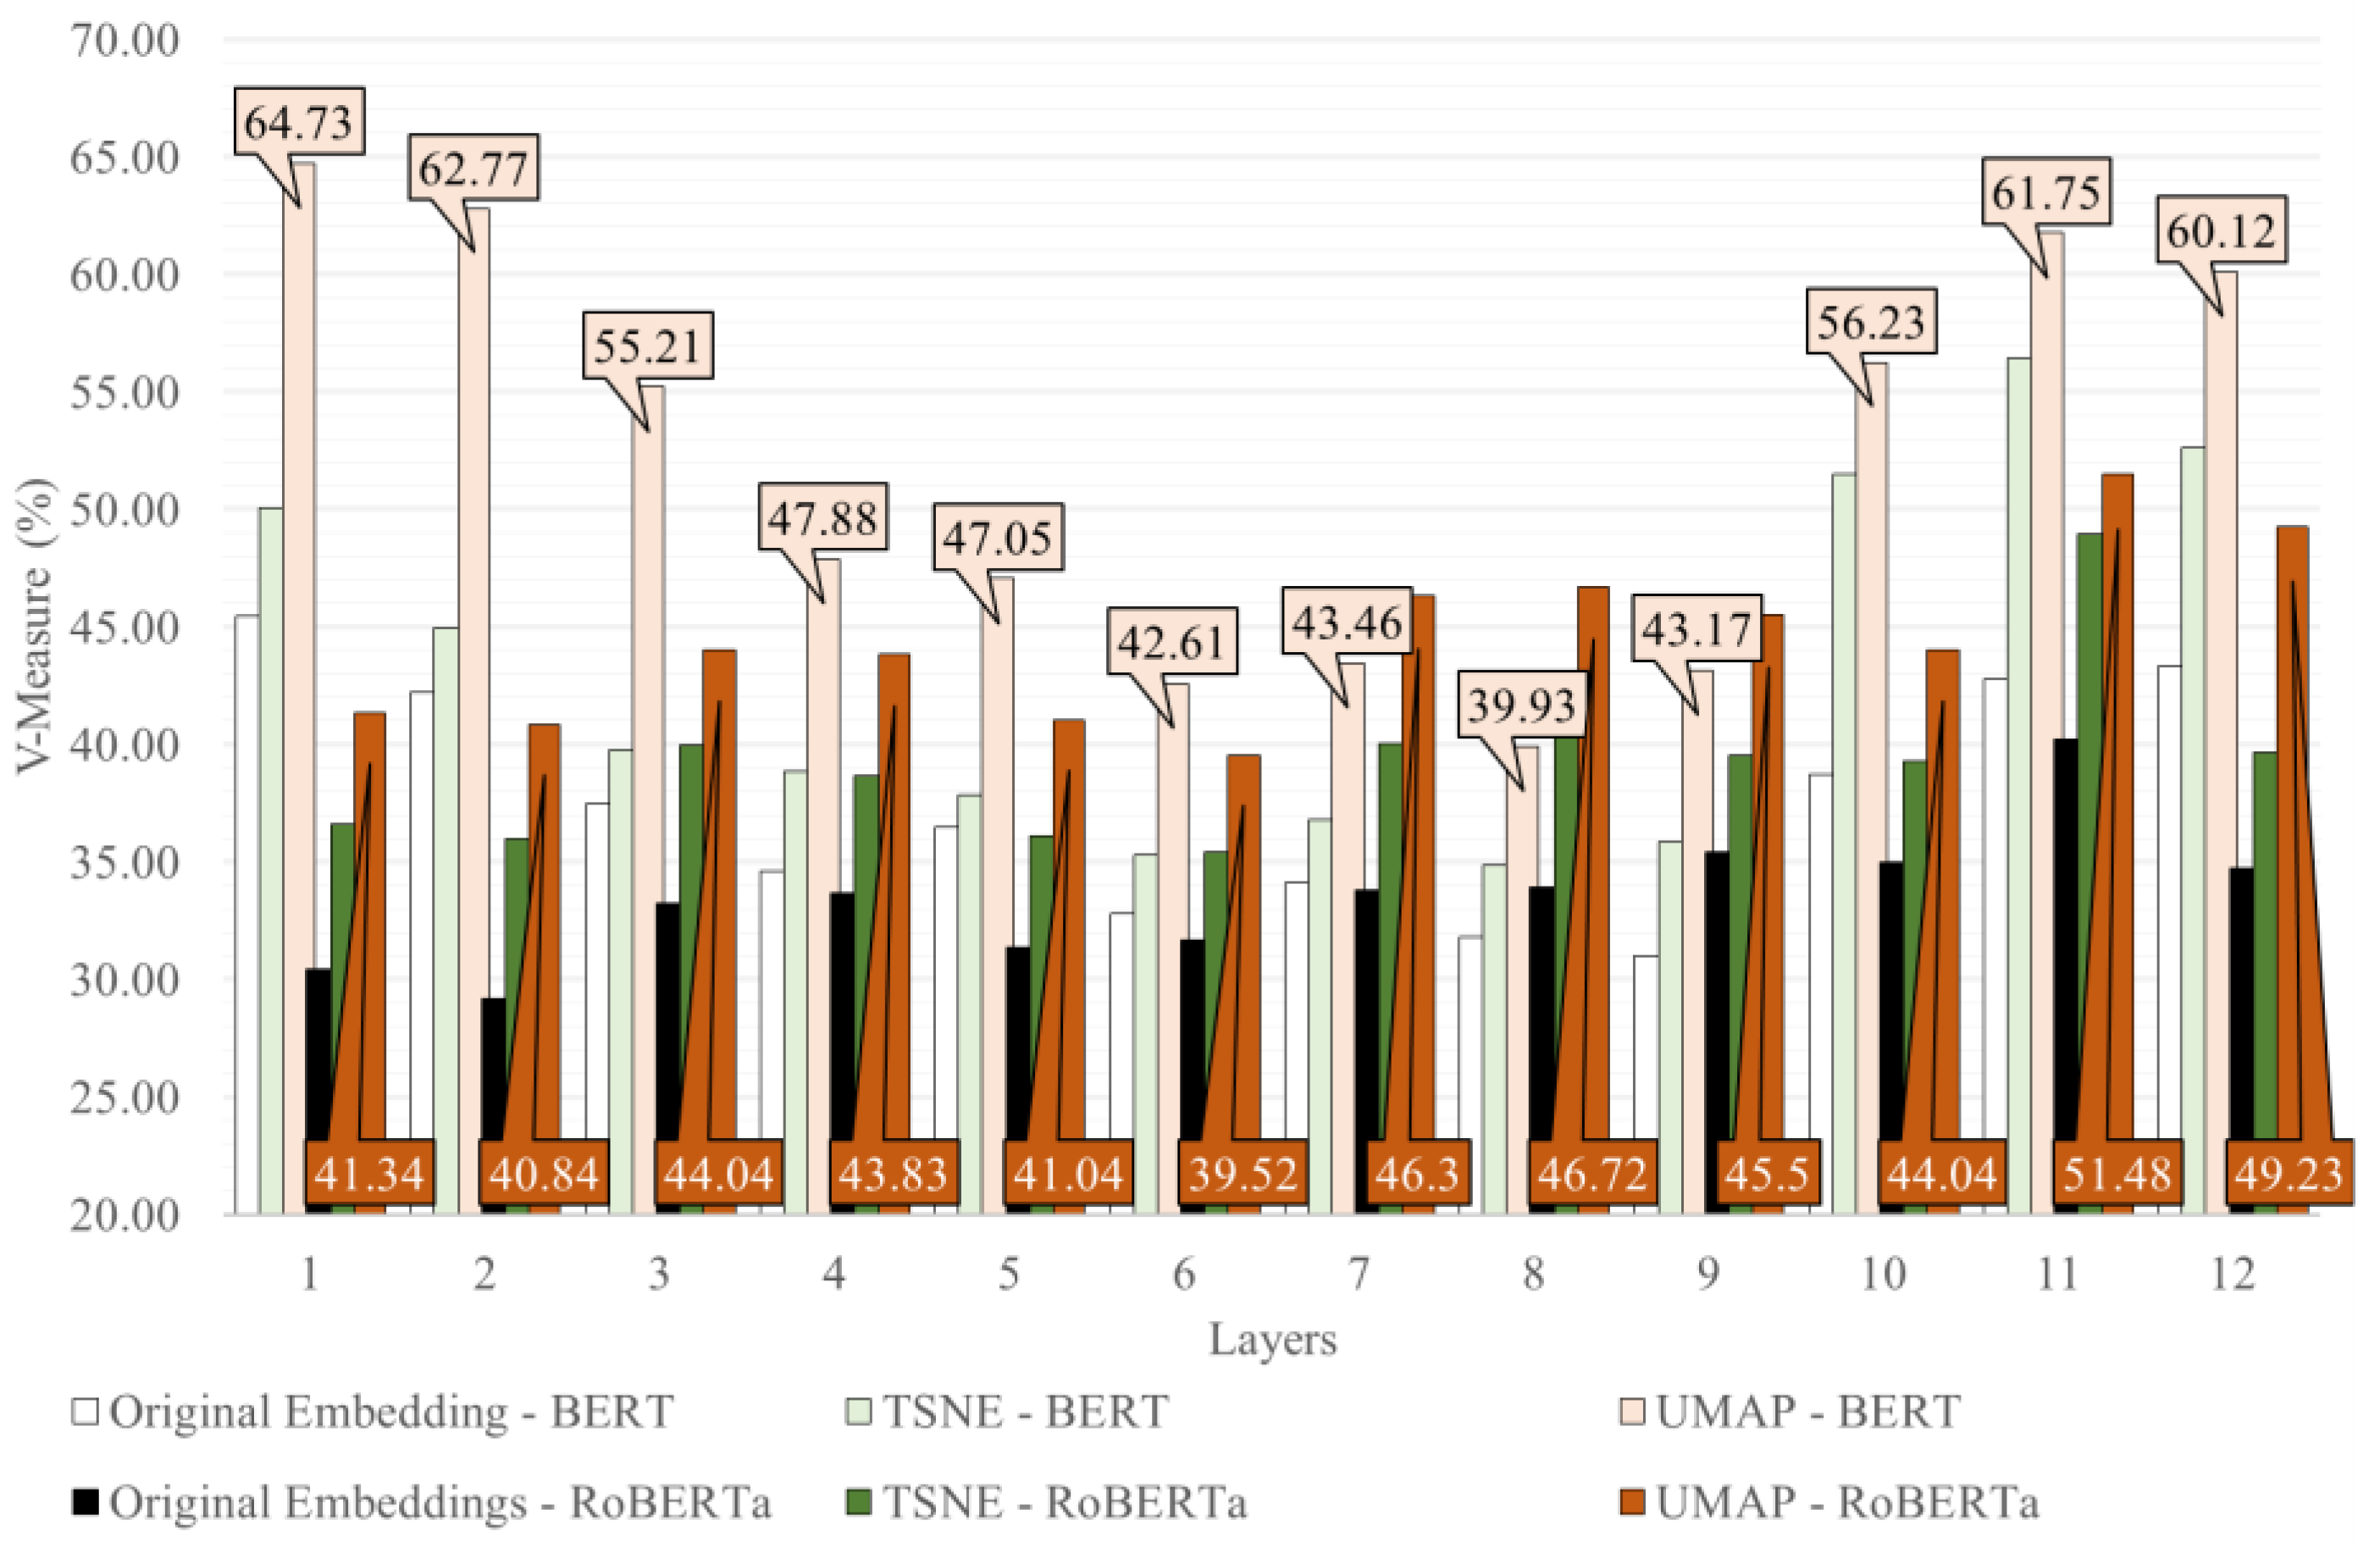
43]. Therefore, both t-SNE and UMAP, which are non-linear algorithms, were examined, comparing the results against the use of the original embedding. The algorithms’ parameters were empirically tuned by randomly repeating the simulation multiple times. The best number of dimensions and neighbors was observed to be 2 and 70, respectively. Furthermore, for UMAP, the optimal minimum distance was 0, while for t-SNE, the optimal perplexity was 50.
Figure 3 shows t-SNE and UMAP applied to BERT and RoBERTa’s embeddings (the best-performing models using a single layer), respectively, and all layers of the models were examined. Using any of the dimension reduction algorithms led to a substantial performance improvement. Notably, it was observed that UMAP increased by almost 20% the performance of the model that uses BERT. It was also concluded that UMAP surpasses t-SNE in this setting. The vectors’ size was reduced by a factor of 384 (from 768). Several values were investigated for the number of components to assess the potential loss of information due to compression. The results indicate slight variations in the vector dimensionality.
4.4. Clustering Algorithms
This experiment first evaluated the two simplest clustering algorithms, K-Means and agglomerative (Agglo) clustering (using four linkage criteria, specifically, Ward, average (avg), maximum (max), and single). The embeddings were transformed with UMAP (found to be the best for dimension reduction) with two components before applying the clustering algorithm.
Table 4 reports the results for each model, presenting the mean and Standard Deviation (SD).
Examining the table’s results, it was concluded that single linkage produced inferior results. Low homogeneity with higher completeness was anticipated as this method combines clusters based on the closest pairs of points. When multiple clusters or points are in close proximity, the algorithm may link them to form a larger cluster. This behavior is commonly referred to as chaining. On the contrary, both K-Means and agglomerative using average criteria linkage attained the best performance. However, since K-Means is a simpler algorithm, it was chosen as the best choice. BERT reached the best-balanced results regarding the examined metrics, followed by GPT-2. The XLNet-based model achieved the worst performance.
Unlike the previous cluster algorithms, HDBSCAN, used in the second part of this experiment, needs to tune parameters. This examination aims to empirically find a suitable choice of parameters and study the advantage of outlier detection using BERT embeddings. Cluster size and minimum samples are the two most important parameters for the HDBSCAN algorithm. It was found that the former can be chosen to be a lower value (in this case, 10) while not affecting the performance.
A superior value would lead to a more conservative clustering, with further data points being declared as noise. Therefore, a grid search was conducted for this parameter, varying from 10 to 150 with steps of 10. The results for the two examined cluster extraction approaches (EOM and leaf) are presented in
Table 5.
By examining
Table 5 results, it is notorious that leaf and EOM can lead to highly homogeneous clusters. When provided with identical parameters, leaf clustering can produce more refined clusters even when working with less clustered data. The resulting clusters in leaf clustering are more homogeneous because they originate from the bottom of the condensed tree. Due to their smaller size, these clusters tend to be even more homogeneous. In contrast, EOM can cluster a larger amount of data but requires fewer clusters to do so.
It is notorious that both algorithms attained the best V-measure using a minimum sample value of 150. Furthermore, the leaf method created 32 clusters, a value closer to the dataset’s number of intentions (34), but only 56% of the data were clustered. EOM provided a marginally higher percentage of clustered data, but the number of clusters is lower.
Even though a low minimum sample can lead to a greedy algorithm with an inferior V-measure, it has the ability to capture a large number of highly homogeneous clusters. Compared to previous clustering algorithms, HDBSCAN requires the creation of fewer clusters than the number of intents in the examined dataset to surpass their V-measure score. Thus, this method is unsuitable for this analysis.
4.5. Pre-Trained Siamese Transformers
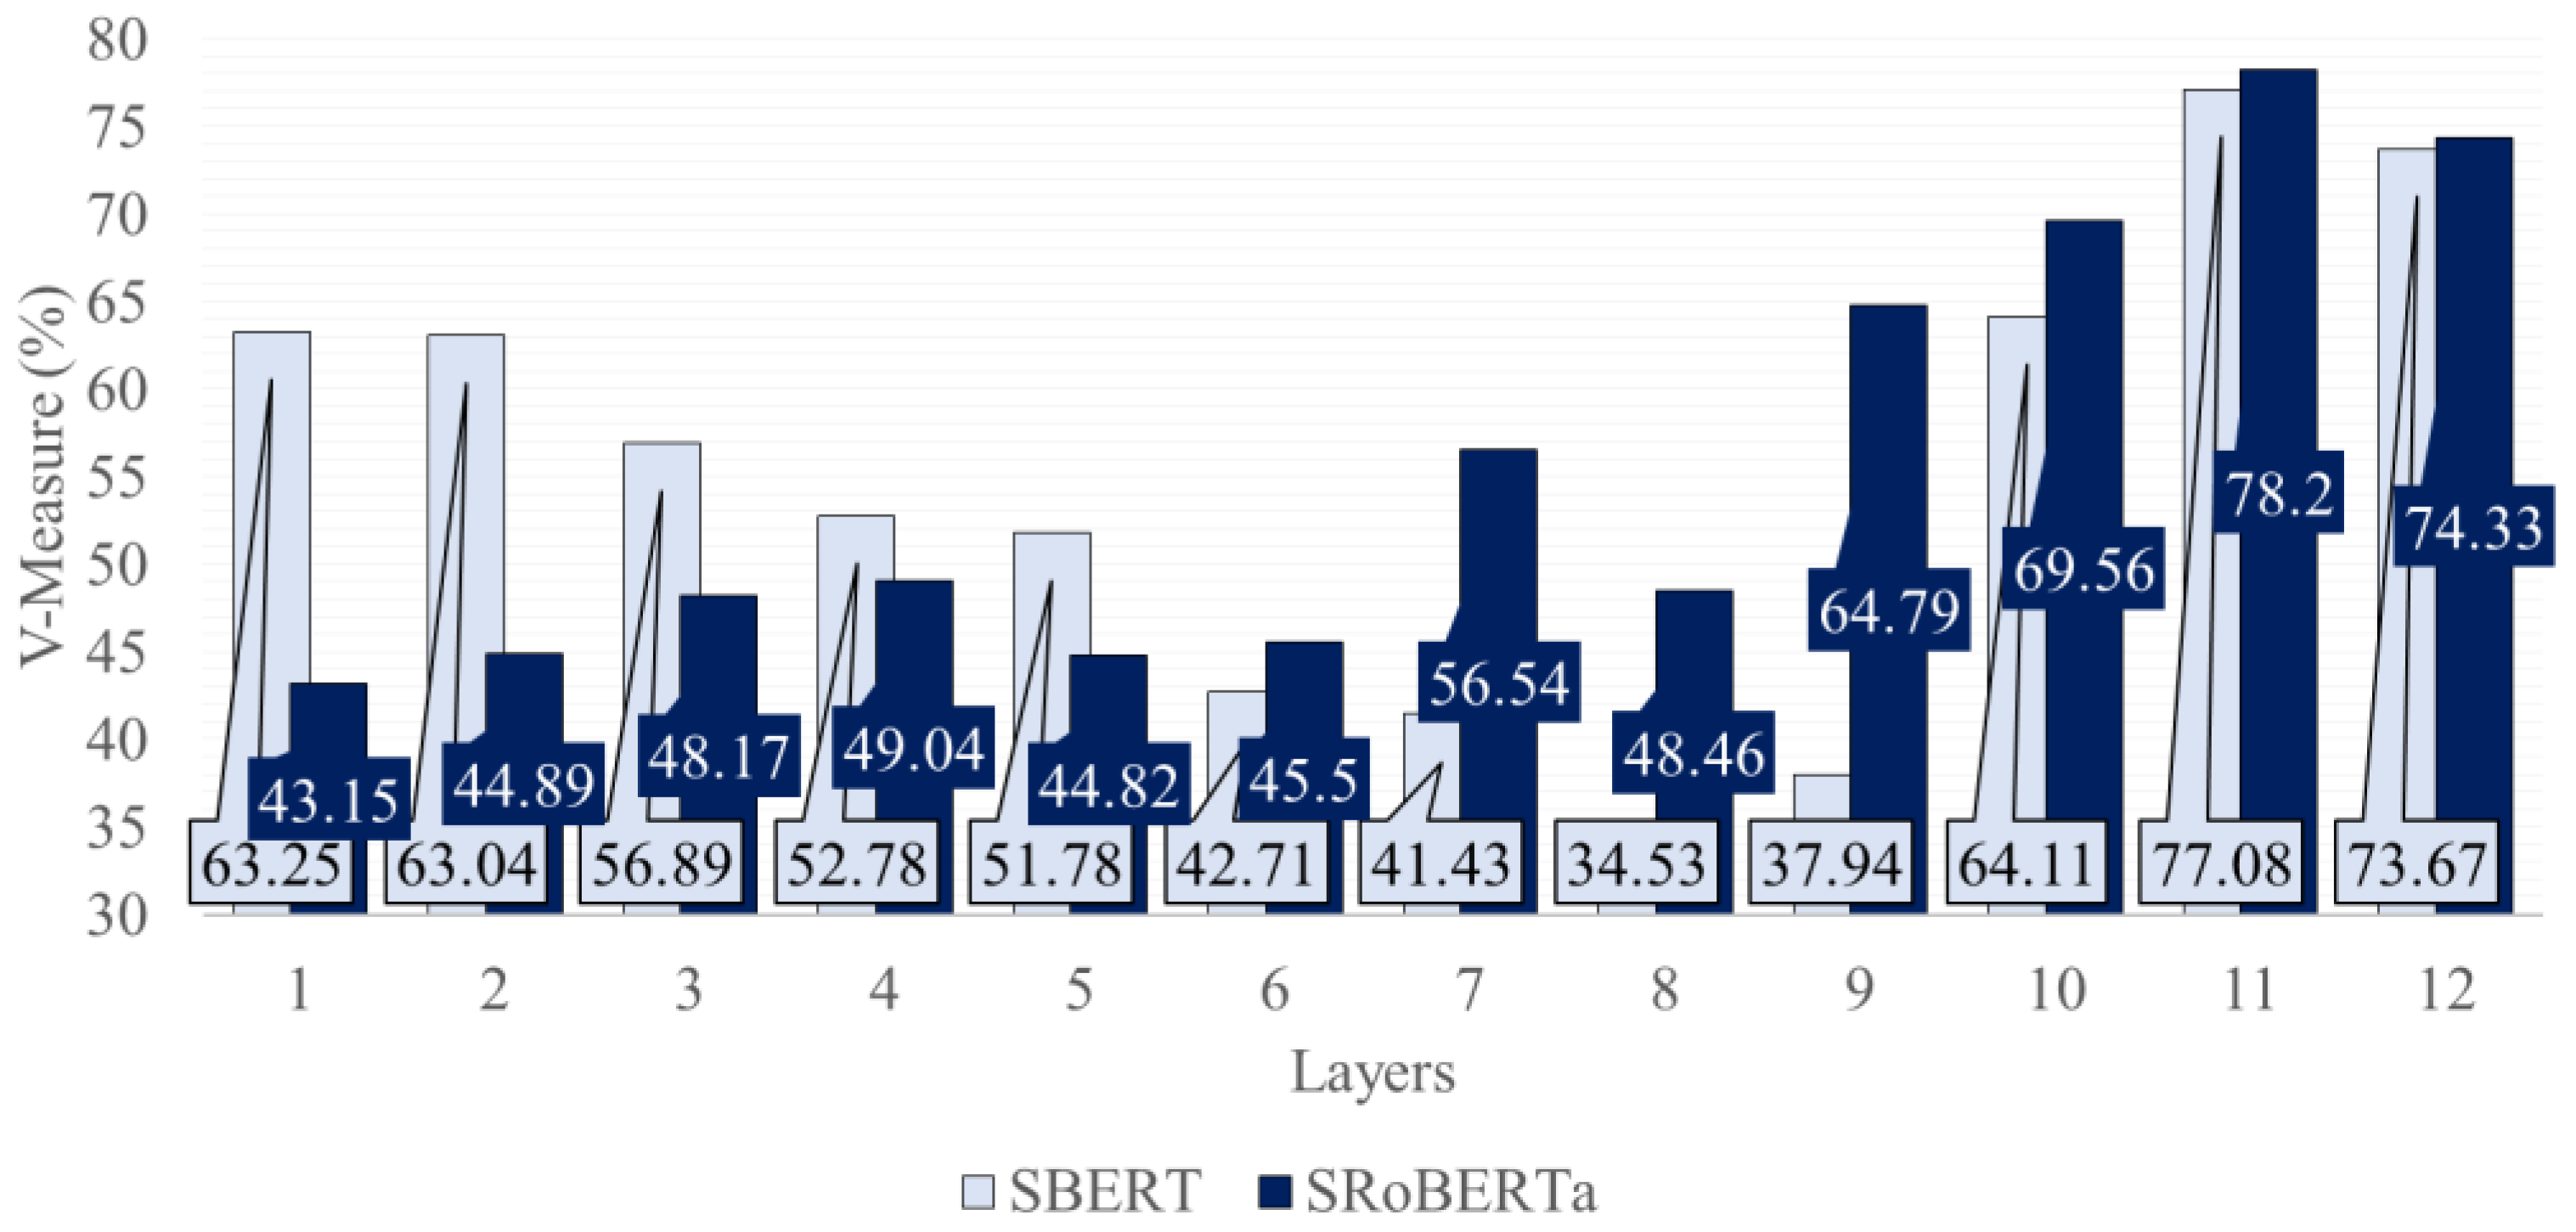
This experiment examined the pre-trained Siamese transformers SBERT and SRoBERTa for embedding creation using the previously best-found pooling approach (mean-pooling). The results are presented in
Figure 4. By examining the figure, the superior V-measure of the Siamese transformers is evident when compared with their pre-trained base models (shown in
Figure 3). Notably, using the last two layers of the network allows an improvement from 15% to 25% when compared to the pre-trained bases BERT and RoBERTa, respectively.
The same concatenation strategies previously studied were tested. However, no meaningful improvement was reached when compared to the single-layer approach. The utilization of the second-to-last layer, which was found to be superior compared to the use of the last layer, is a common factor in both models, displaying an improvement of 4% and 3.41% for SRoBERTa and SBERT, respectively. Although both models are domain-agnostic, they attained exceptional results and surpassed all examined baseline models.
4.6. Retraining Siamese Transformers
This experiment examines whether retraining the studied Siamese transformers can yield a better V-measure. It was reported that training a model on domain-related data can produce better results in NLP [
44,
45]. To examine this idea first, the USE model, which has learned similarity through dialog-type data, was studied in the same configuration as the previous experiment. It attained an average V-measure of 80.45%, a value that surpasses all examined models by at least 2%.
During its training in a multi-task scenario, the USE model included input response selection as one of its tasks. The training for this task can be attained using a Siamese structure. In this case, it was using two sentences (response and context) that were separately encoded, constructing two vectors. Afterward, the two embeddings’ cosine similarity, or dot product, was calculated similarly to SBERT. The model receives a batch of context-response pairs during training to learn similarity in input-response selection. In this scenario, the response was considered a positive sample for a particular context, while all other responses from different pairs were considered negative or incorrect. To train the model, the negative log-likelihood of the SoftMax score was minimized using the Multiple Negative Ranking (MNR) loss function.
Inspired by USE results, the two examined Siamese Transformer models were retrained from their pre-trained checkpoints in the Amazons-QA dataset [
46,
47] using the MNR loss and mean-pooling. The dataset consists of 1.4 million questions and answers. From these, 9011 were selected from the appliances category. To prepare the training set, contexts containing a straightforward yes or no question were excluded, resulting in 4318 pairs.
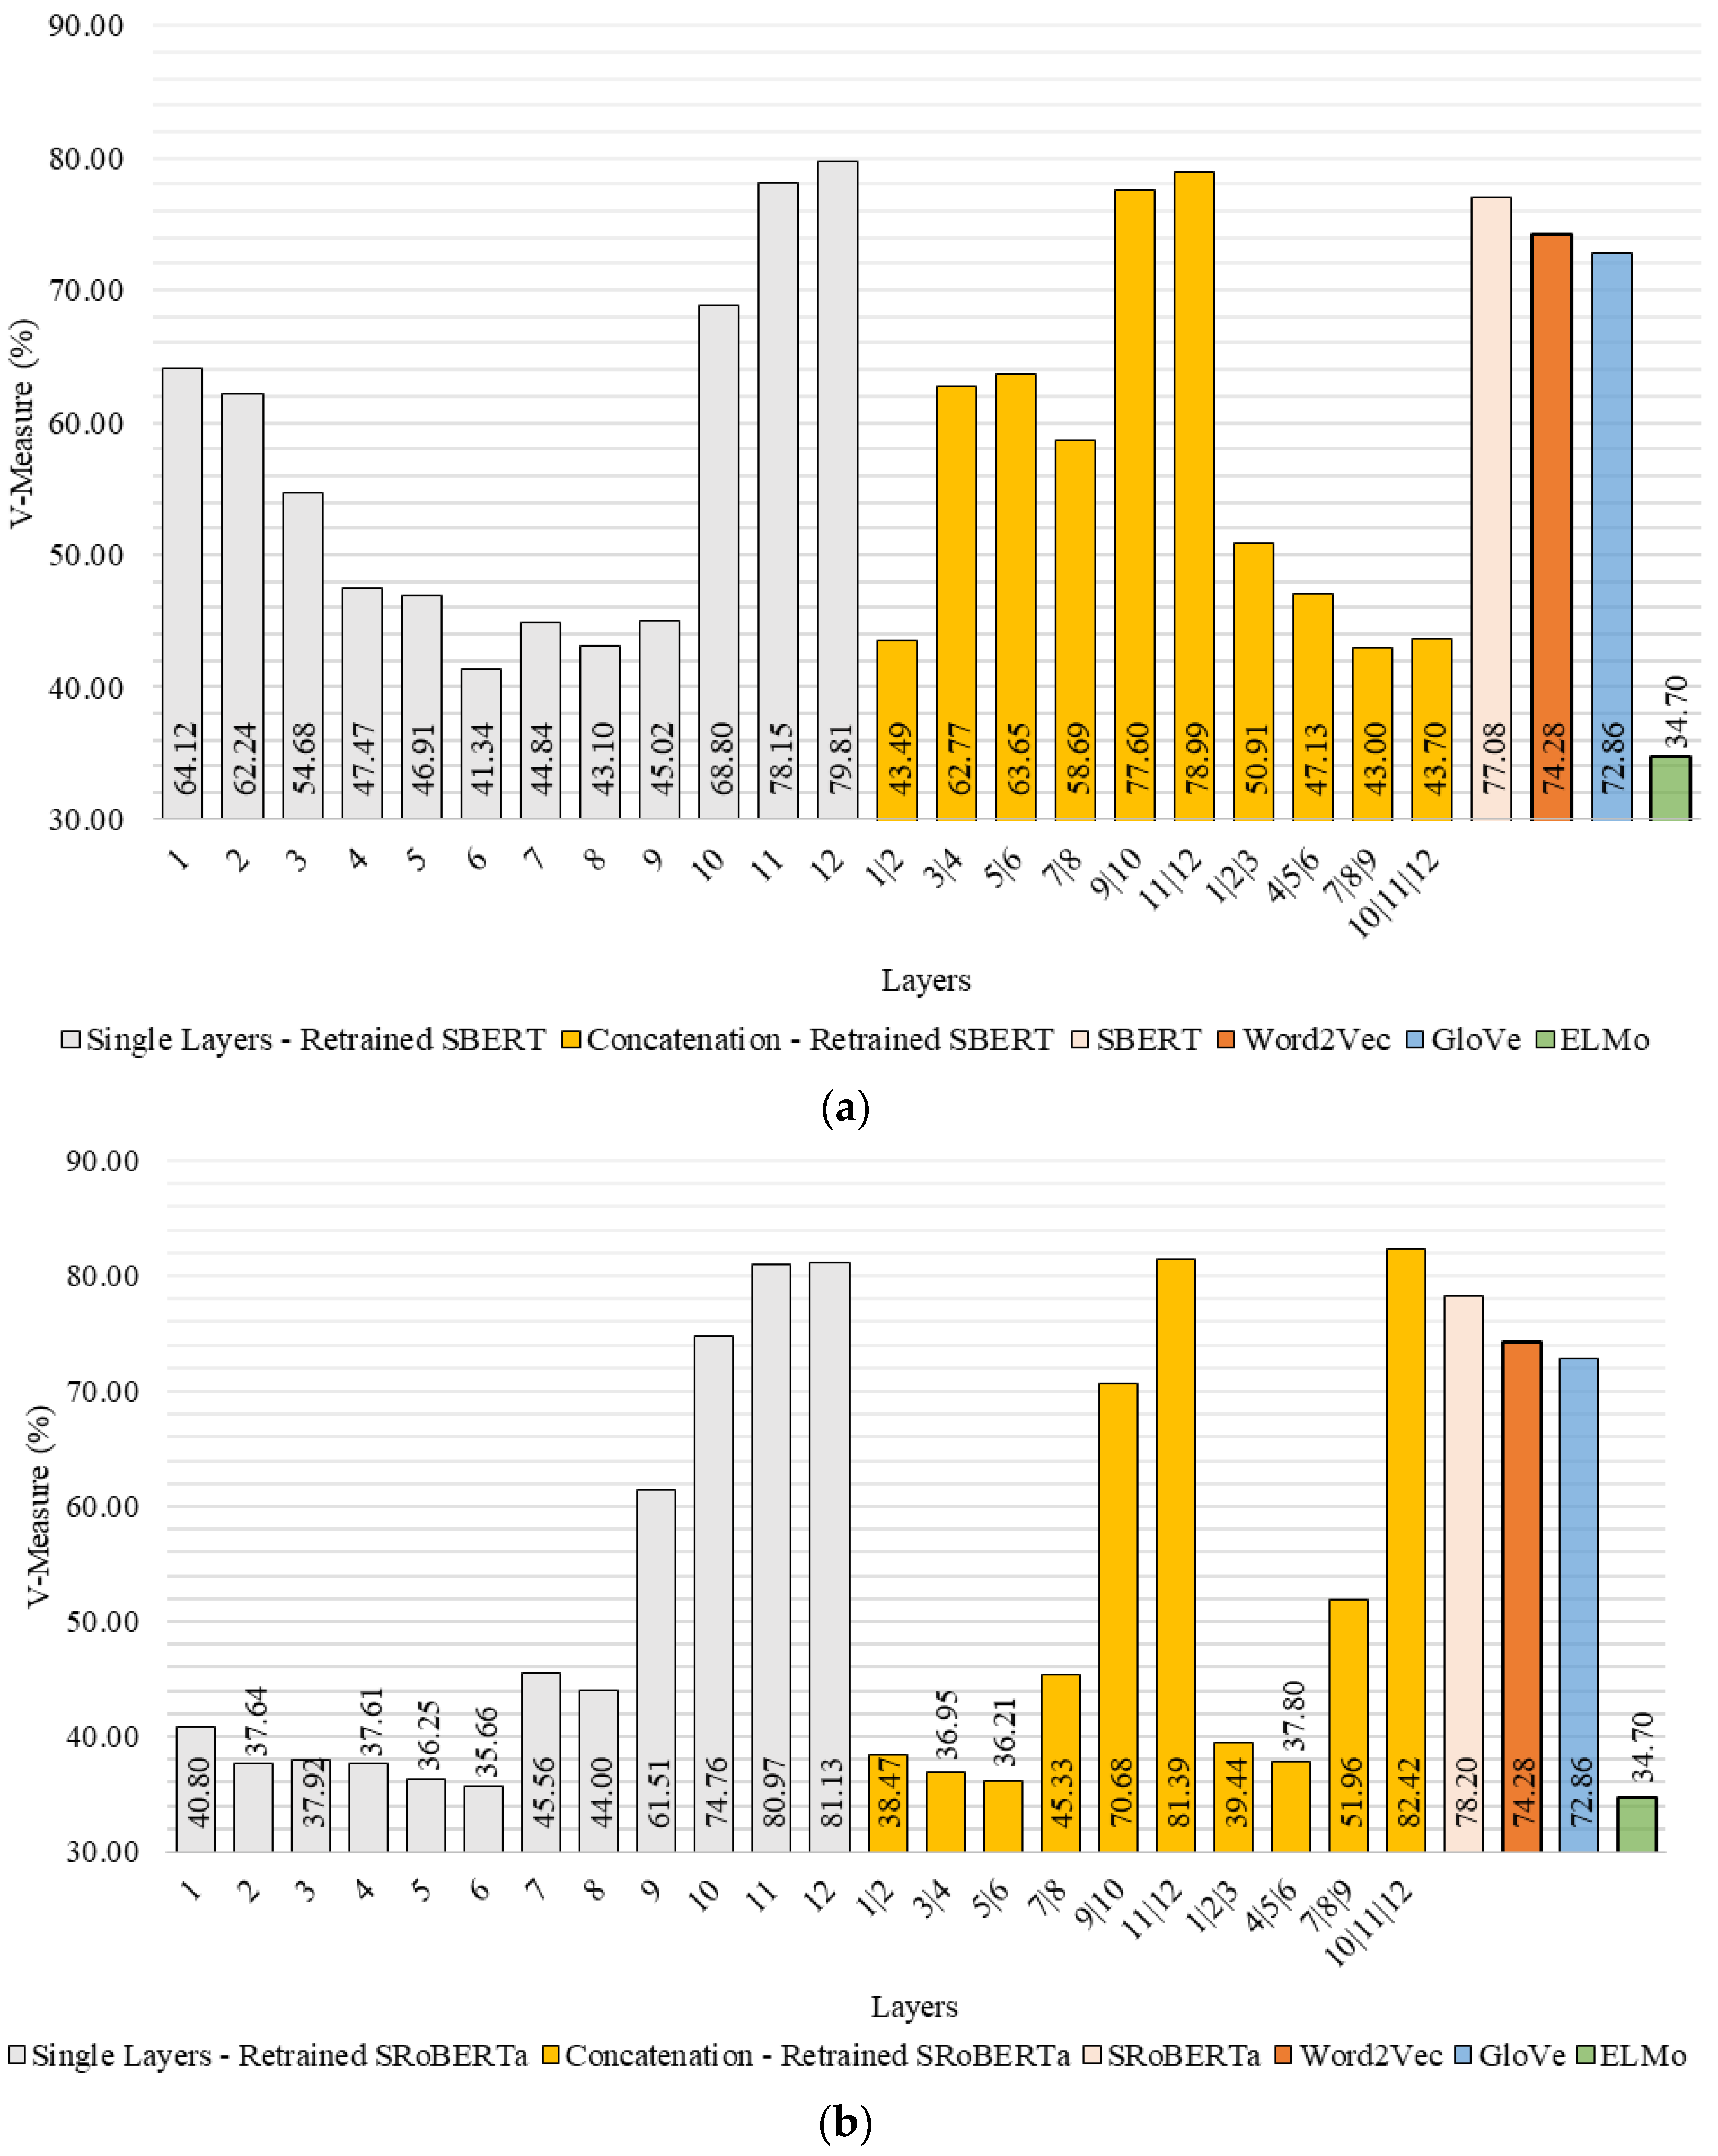
The V-measures attained by using the retrained models for producing embeddings are presented in
Figure 5. This figure shows the performance when using single layers and layer concatenation. Furthermore, the results using the pre-trained models (without retraining) attained in the previous experiment and using the baseline models are shown to allow a direct comparison. The figure’s results show that the retrained SBERT and SRoBERTa achieve a V-measure of 79.81% and 81.18%, respectively, in single layers. Therefore, SBERT is aligned with USE, and SRoBERTa surpasses it, especially when concatenating the last three layers (V-measure of 82.45%). These results show the importance of retraining in domain data, as both the not-retrained and baseline models were considerably surpassed.
4.7. Ensemble Models
This last experiment evaluates whether an ensemble can improve intent detection performance. Specifically, four ensemble configurations were studied:
Homogeneous ensemble of multiple K-Means fed from the same embedding;
Homogeneous ensemble of multiple K-Means using embeddings created by combining embeddings from three different models;
Heterogeneous ensemble composed of two dissimilar clustering algorithms (agglomerative and K-Means) fed with the same embedding;
Heterogeneous ensemble composed of two dissimilar clustering algorithms (agglomerative and K-Means), where the embeddings were created by combining embeddings from three different models.
The three models that reached the highest V-measure (considering single layers only since the concatenation did not perform substantially better) were evaluated for embedding creation. These models were the two retrained (on the QA-Amazon dataset) Siamese transformers examined in the previous experiment (SBERT-QA and SRoBERTa-QA) and USE. HDBSCAN was not considered since it was previously found unsuitable for this examination.
The attained results are presented in
Table 6. Checking the results, it was concluded that the performance using an ensemble-based approach had risen substantially compared to the previously found best-performing model without an ensemble (SRoBERTa-QA), whose accuracy and V-measure were 60% and 81%, respectively. The ensemble-based approach’s advantage is clear, as ensembling just 10 K-Means produced a substantial improvement in accuracy, ranging from 13% to 19%, when compared to the best-found method without an ensemble. This increase is even higher when the number of ensemble models increases. It is also possible to conclude that the combination of three embeddings results in an enhancement compared to using a single embedding.
The homogeneous ensembles achieved a better performance when compared to the heterogeneous solutions, a result particularly notorious when checking the attained accuracy. Yet, the model based on USE embeddings substantially benefits from the heterogeneous configuration. The superiority of the homogenous configuration could be attributed to the size of the ensemble matrix and the stochastic nature of K-Means’ initializations, which can generate diverse clustering solutions in each run, resulting in some points being, by chance, assigned to their correct group.
As the ensemble method follows a plurality voting approach, the ensemble matrix sizes for K-Means configurations with 10, 50, and 100 instances are 10, 50, and 100 rows, respectively. On the other hand, the heterogeneous configuration comprises only five rows, each corresponding to a distinct clustering algorithm. Additionally, the input embeddings play a crucial role, and their combination outperforms individual embeddings consistently. Using 100 K-Means led to the best results in this work, although the small ensemble with 50 K-Means reached almost the same performance.
While comparing our results to the state-of-the-art works described in
Section 2, it is important to acknowledge that this can only serve as a preliminary analysis. The reason is that the previous studies have utilized different datasets with differing numbers of intents and reported diverse performance metrics. The most commonly reported metric was accuracy. It was reported to range from 24% to 91%, depending on the examined dataset, while using unsupervised methods [
14]. Another study reported accuracy in the range of 40% to 44%, depending on the examined dataset [
18], while other studies achieved an accuracy of 73% [
10], 79% using unsupervised methods [
15], and 84% [
11]. It is worth noting that the studies that achieved higher accuracy examined fewer intents (less than 20), while this work examined 34 intents.
5. Conclusions
This article proposes a sequence of procedures and models for intent clustering. For this purpose, a dataset containing multiple utterances from multiple domains was utilized. Standard transformer-based models with different architectures were initially examined. Afterward, various pooling approaches were examined, and the transformer-based models’ layers were assessed individually and jointly. The result of using dimension reduction and different clustering methods was also assessed. New models were also trained on domain data with positive results. Lastly, ensemble-based approaches were examined for combining the embeddings from the best-performing models.
It was concluded that, among the examined transformers, GPT-2, RoBERTa, and BERT were found to be the best for the examined problem, especially when using average pooling. K-Means was found to be the most suitable clustering algorithm, although a suitable performance was also reached using agglomerative clustering with average or Ward linkage. It was also determined that using dimension reduction (UMAP or t-SNE) can substantially improve the clustering results. Both tested algorithms could maintain the most relevant information even when using substantial reduction, achieving an immense performance improvement. Consequently, they support using slower clustering methods that would otherwise be computationally unfeasible.
The two examined pre-trained Siamese Transformers (SBERT and SRoBERTa) provide better embeddings for intent clustering than the baseline models. Nonetheless, it was verified that they could be enhanced even further through fine-tuning domain-specific data. Furthermore, the performance can be improved using an ensemble composed of several K-Means instances, whose input embeddings are from these retrained models. As a result, it was concluded that the key elements for achieving superior outcomes are embedding quality and the utilization of dimension reduction methods.
The proposed techniques provide a framework for future work aimed at creating a fully automated system that can cluster sentences based on their underlying intents. Surprisingly, pre-trained embeddings of GloVe and Word2Vec showed decent results right out of the box. The utterances used for evaluation are short sentences that may explain how a simple average pooling can obtain comparable results to Siamese transformers. The subsequent steps of this research involve studying what occurs if a context is added to the utterances. Exploring more intent detection datasets is essential to further corroborate the conclusions of this study. It is also important to consider the impact of longer sentences on performance and explore strategies for manipulating and evaluating longer sentences. Some possible approaches for manipulating longer sentences could include breaking them down into smaller segments or identifying key phrases or concepts within the sentence to focus on.


 ,
, 


