Experimental Study on the Protection of an Asphalt Coating to Reinforcement in Magnesium Oxychloride Cement Concrete

1
School of Civil Engineering, Lanzhou University of Technology, Lanzhou 730050, China
2
Gansu Advanced Civil Engineering Materials Engineering Research Center, Lanzhou 730050, China
*
Author to whom correspondence should be addressed.
Appl. Sci. 2023, 13(8), 4759; https://0-doi-org.brum.beds.ac.uk/10.3390/app13084759
Submission received: 9 March 2023
/
Revised: 31 March 2023
/
Accepted: 7 April 2023
/
Published: 10 April 2023
(This article belongs to the Section Civil Engineering)
Abstract
:To mitigate the corrosion of steel bar in magnesium oxychloride cement concrete (MOCC), an asphalt coating is used for protection. According to the service environment in the Salt Lake area of western Qinghai, China, a solution immersion test on MOCC was performed. The test results showed that, after soaking for 2160 days, the corrosion current density icorr was 7.88 µA/cm2, and RC was 113.51 Ω for group A and icorr is 0.08 µA/cm2 and RC is 842.57 Ω for group B. The time parameters for groups A and B fell in the high-frequency range of 103–105 Hz and low-frequency range of 10−2 to 10−1 Hz. The relative dynamic moduli of the elasticity evaluation parameters ω1 and ω2 were 0.942 and 0.959 and 0.946 and 0.962 for groups A and B, respectively, at 2160 days, exhibiting a downward trend on the whole. Fourier transform infrared spectroscopy and microscopic testing revealed that the corrosion of the chloride solution on asphalt was mainly the corrosion of chloride in the interior of the asphalt and that the invaded salt provided a channel for the water solution to invade into the interior.
1. Introduction
There are copious amounts of harmful salts in western saline soil, including sulphates, chlorides, and carbonates [1,2]. These salts adversely affect ordinary concrete [3,4]. For example, concrete can gradually spall and crack under sulphate corrosion, and the reinforcement of concrete undergoes accelerated corrosion under the action of chloride salt, resulting in corrosion expansion damage [5,6,7]. Magnesium oxychloride cement concrete (MOCC) without modification offers good performance in terms of salt brine corrosion resistance, and it has shown good working performance in this area [8,9,10,11,12]. However, corrosion of steel bars limits its application [13,14,15,16,17]. Aiming to solve this problem, Wang [10,11] adopted a method using zinc-rich epoxy resin to prevent corrosion of steel bars. The zinc-rich coatings need to sacrifice themselves to protect the steel bars, and it is also necessary to study the coatings that primarily serve as insulation.
In the field of civil engineering, asphalt, with its excellent waterproof properties and anticorrosion performance, is widely used in roofing, on the ground, in underground waterproof structures, for wood treatment, and as an anticorrosive in steel [18,19]. For example, Smith [20] used butyl rubber with asphalt to treat pipeline joints when laying pipelines in the sea. After soaking the pipeline at 65 °C for 28 days, there was no corrosion at the joints. Li [21] adopted a heavy epoxy anticorrosive coating over a trust primer/IPN topcoat for anticorrosion treatment of an oil field pipeline and used electronic impact spectroscopy and scanning electron microscopy (SEM) to study the causes of pipeline corrosion. The treatment achieved excellent performance for preventing pipeline corrosion. Wang [22] used an SBS asphalt coating to protect reinforcements and then performed electrochemical tests on magnesium-oxychloride-coated reinforced concrete, analysed the polarisation curve in the protection process, and concluded that SBS asphalt can protect reinforcement well.
In the application to asphalt roads, Panos [23] used epoxy asphalt to improve the durability of asphalt mixtures. Tests have shown that increasing the epoxy modification level in asphalt leads to materials with higher rigidity and strength, thereby increasing fatigue resistance. In addition, asphalt bonding materials can significantly improve the bonding strength between asphalt pavement layers. Huang [24] used asphalt modified by silane coupling agent to improve the robustness of the freeze–thaw cycle resistance of the adhesive layer on the surface of seasonally frozen regions of steel bridges through visibility. Direct tensile and bending beam rheometer tests were used to evaluate the bonding ability of epoxy asphalt and epoxy asphalt rubber. It was concluded that the low-temperature pull-off strength and shear strength of epoxy asphalt rubber can be improved after modification with surface-treated rubber particles. With about 1.2 times the layer, the average interfacial fracture energy was about twice as high as that of the epoxy asphalt bonding layer. Xiao and Huang [25] studied the changes in moisture sensitivity of asphalt after ageing. The moisture resistance of short-term aged asphalt was better, and the moisture resistance of long-term aged asphalt significantly decreased. Zhang [26] prepared a new composite material (OMMT/PAR) that can improve the interfacial adhesion between aggregates and asphalt. Wang [27] has studied the adhesion between different asphalt binders and aggregates, and the results showed that composite anti-stripping agents can effectively improve the water stability and adhesion of asphalt mixtures.
There have been few studies of the use of asphalt coated steel bars in concrete, and currently the main research is on the anti-corrosion effect of asphalt coating on steel bars. Zamanizadeh [28,29] used asphalt coatings to protect steel bars and studied the impact of natural montmorillonite on the corrosion resistance of asphalt coatings. According to the EIS results, asphalt coatings with natural montmorillonite add had good corrosion resistance. Shahsavari [30] studied the effect of nano cerium oxide particles on the corrosion resistance of zinc rich asphalt coatings through salt spray and immersion tests. The results showed that asphalt coatings containing nano cerium oxide particles can reduce the penetration path of water and corrosive ions into the reinforcement, thereby protecting the reinforcements from corrosion.
The above research demonstrates that asphalt or modified asphalt has good anticorrosion ability and cohesiveness. This performance makes it possible to use it as an anticorrosive coating for steel bars. Most studies of the use of asphalt coatings to protect steel bars have focused on the modification of the anti-corrosion ability of asphalt coatings with additives, while few studies have been conducted on the durability of coated steel bars when they interact with concrete. Therefore, we performed a long-term solution immersion accelerated corrosion test on magnesium oxychloride-coated reinforced concrete. Polarisation curves and AC impedance values measured using an electrochemical workstation were used to study the corrosion degree and the steps of corrosion during the coating anticorrosion process. Leaf infrared spectroscopy testing was performed to study the mechanism of asphalt anticorrosion degradation, and SEM tests were performed on asphalt coatings for different time periods to investigate the surface microscopic changes.
2. Test Materials and Testing Scheme
2.1. Raw Materials
The raw materials used in magnesium-oxychloride cement-reinforced concrete (MOCRC) are mainly magnesium oxide (MgO), magnesium chloride (MgCl2), a water-reducing agent, a water-resisting agent, fly ash, stone, sand, and reinforcement. The river sand is well graded and classified as medium sand. The gravel has continuous grading, and its performance index is qualified. Grade I fly ash (added to improve the durability of concrete) was used in this test. The water-resistant agent used was phosphoric acid (H3PO4); its H3PO4 content was not less than 85.0%, and the unit of chroma and haze was not more than 25. KD naphthalene superplasticiser JM-PCA (I) was used as the water-reducing agent. The specific basic physical properties are listed in Table 1. Tap water was selected, as it meets the requirements of the national industry standard “Concrete Mixing Water Standard” jgj63-2006. The reinforcement was hpb300, with Fy = 300 N/mm2. The mix of the magnesium cement concrete is listed in Table 2. The organic coating used was YP asphalt; its specific parameters are listed in Table 3.
2.2. Testing Scheme
The diameter of the reinforcement used was 8 mm, and the length was 100 mm. The reinforcement was subjected to acid and alkali washing before the preparation of the coating, and the thickness of the coating was 0.4 mm. The MOCRC was prepared according to the mix ratio in Table 2. The side length of the cube test piece was 100 mm, and the thickness of the protective layer was 46 mm. Group A comprised reinforced MOCC, and group B comprised ACRMOCC. After 24 h of forming, the sample was removed, and after 28 days of maintenance, the benchmark value was tested with an HC-U81 multifunctional concrete ultrasonic detector. Tests were conducted twice in the x- and y-axis directions. Each face was tested at the test point, as shown in Figure 1, avoiding the coated reinforcement during the test, and the average of four tests was calculated to represent the ultrasonic test results. Then, the mass of the test piece was weighed. Finally, the block was placed in a sodium chloride solution with a concentration of 1.5 mol/L, with the solution height reaching 2/3 that of the test block. After immersion for 1 day, the benchmark value test was performed with a CS350 electrochemical workstation. The electrochemical test diagram is shown in Figure 2. The electrode area of coated steel bar as a working electrode was 25.12 cm2, and that of the thin stainless-steel plate as an auxiliary electrode was 30 cm2 larger than that of the working electrode. The saturated KCl electrode was used as the reference electrode.
According to the previous research results of our research group, the solution immersion test was used to study the durability of concrete [9,10,11]. After the benchmark value test, the test piece was immersed in a solution. We conducted an electrochemical test on the test block every 90 days. After the electrochemical test, the test block was dried for 5 days, and then conduct ultrasonic testing and mass loss testing were performed. A standard glass slide was used as the bearing base plate, and the paving thickness of asphalt on the glass slide was 0.2 cm. The prepared asphalt specimen was immersed in magnesium chloride solution (the chloride ion concentration was 1.5 mol/L). Fourier transform infrared spectroscopy (FTIR) was conducted every 180 days. The FTIR used in the experiment (Nicolet 6700) had an optical resolution of 0.9 cm−1, a spectral range of 350–7800 cm−1, and 15 scanning speeds. The Fourier transform infrared spectrometer is shown in Figure 3. The morphology of asphalt in the chloride solution was analysed using a low-vacuum scanning electron microscope (JSM-5600LV, manufactured by Japan Electronics Corporation, Tokyo, Japan), the resolution of which was 3.5 nm. The corresponding relationship between the corrosion current density and the corrosive degree of reinforcement is reported in Table 4.
3. Test Results
3.1. Polarisation Curve Test Results
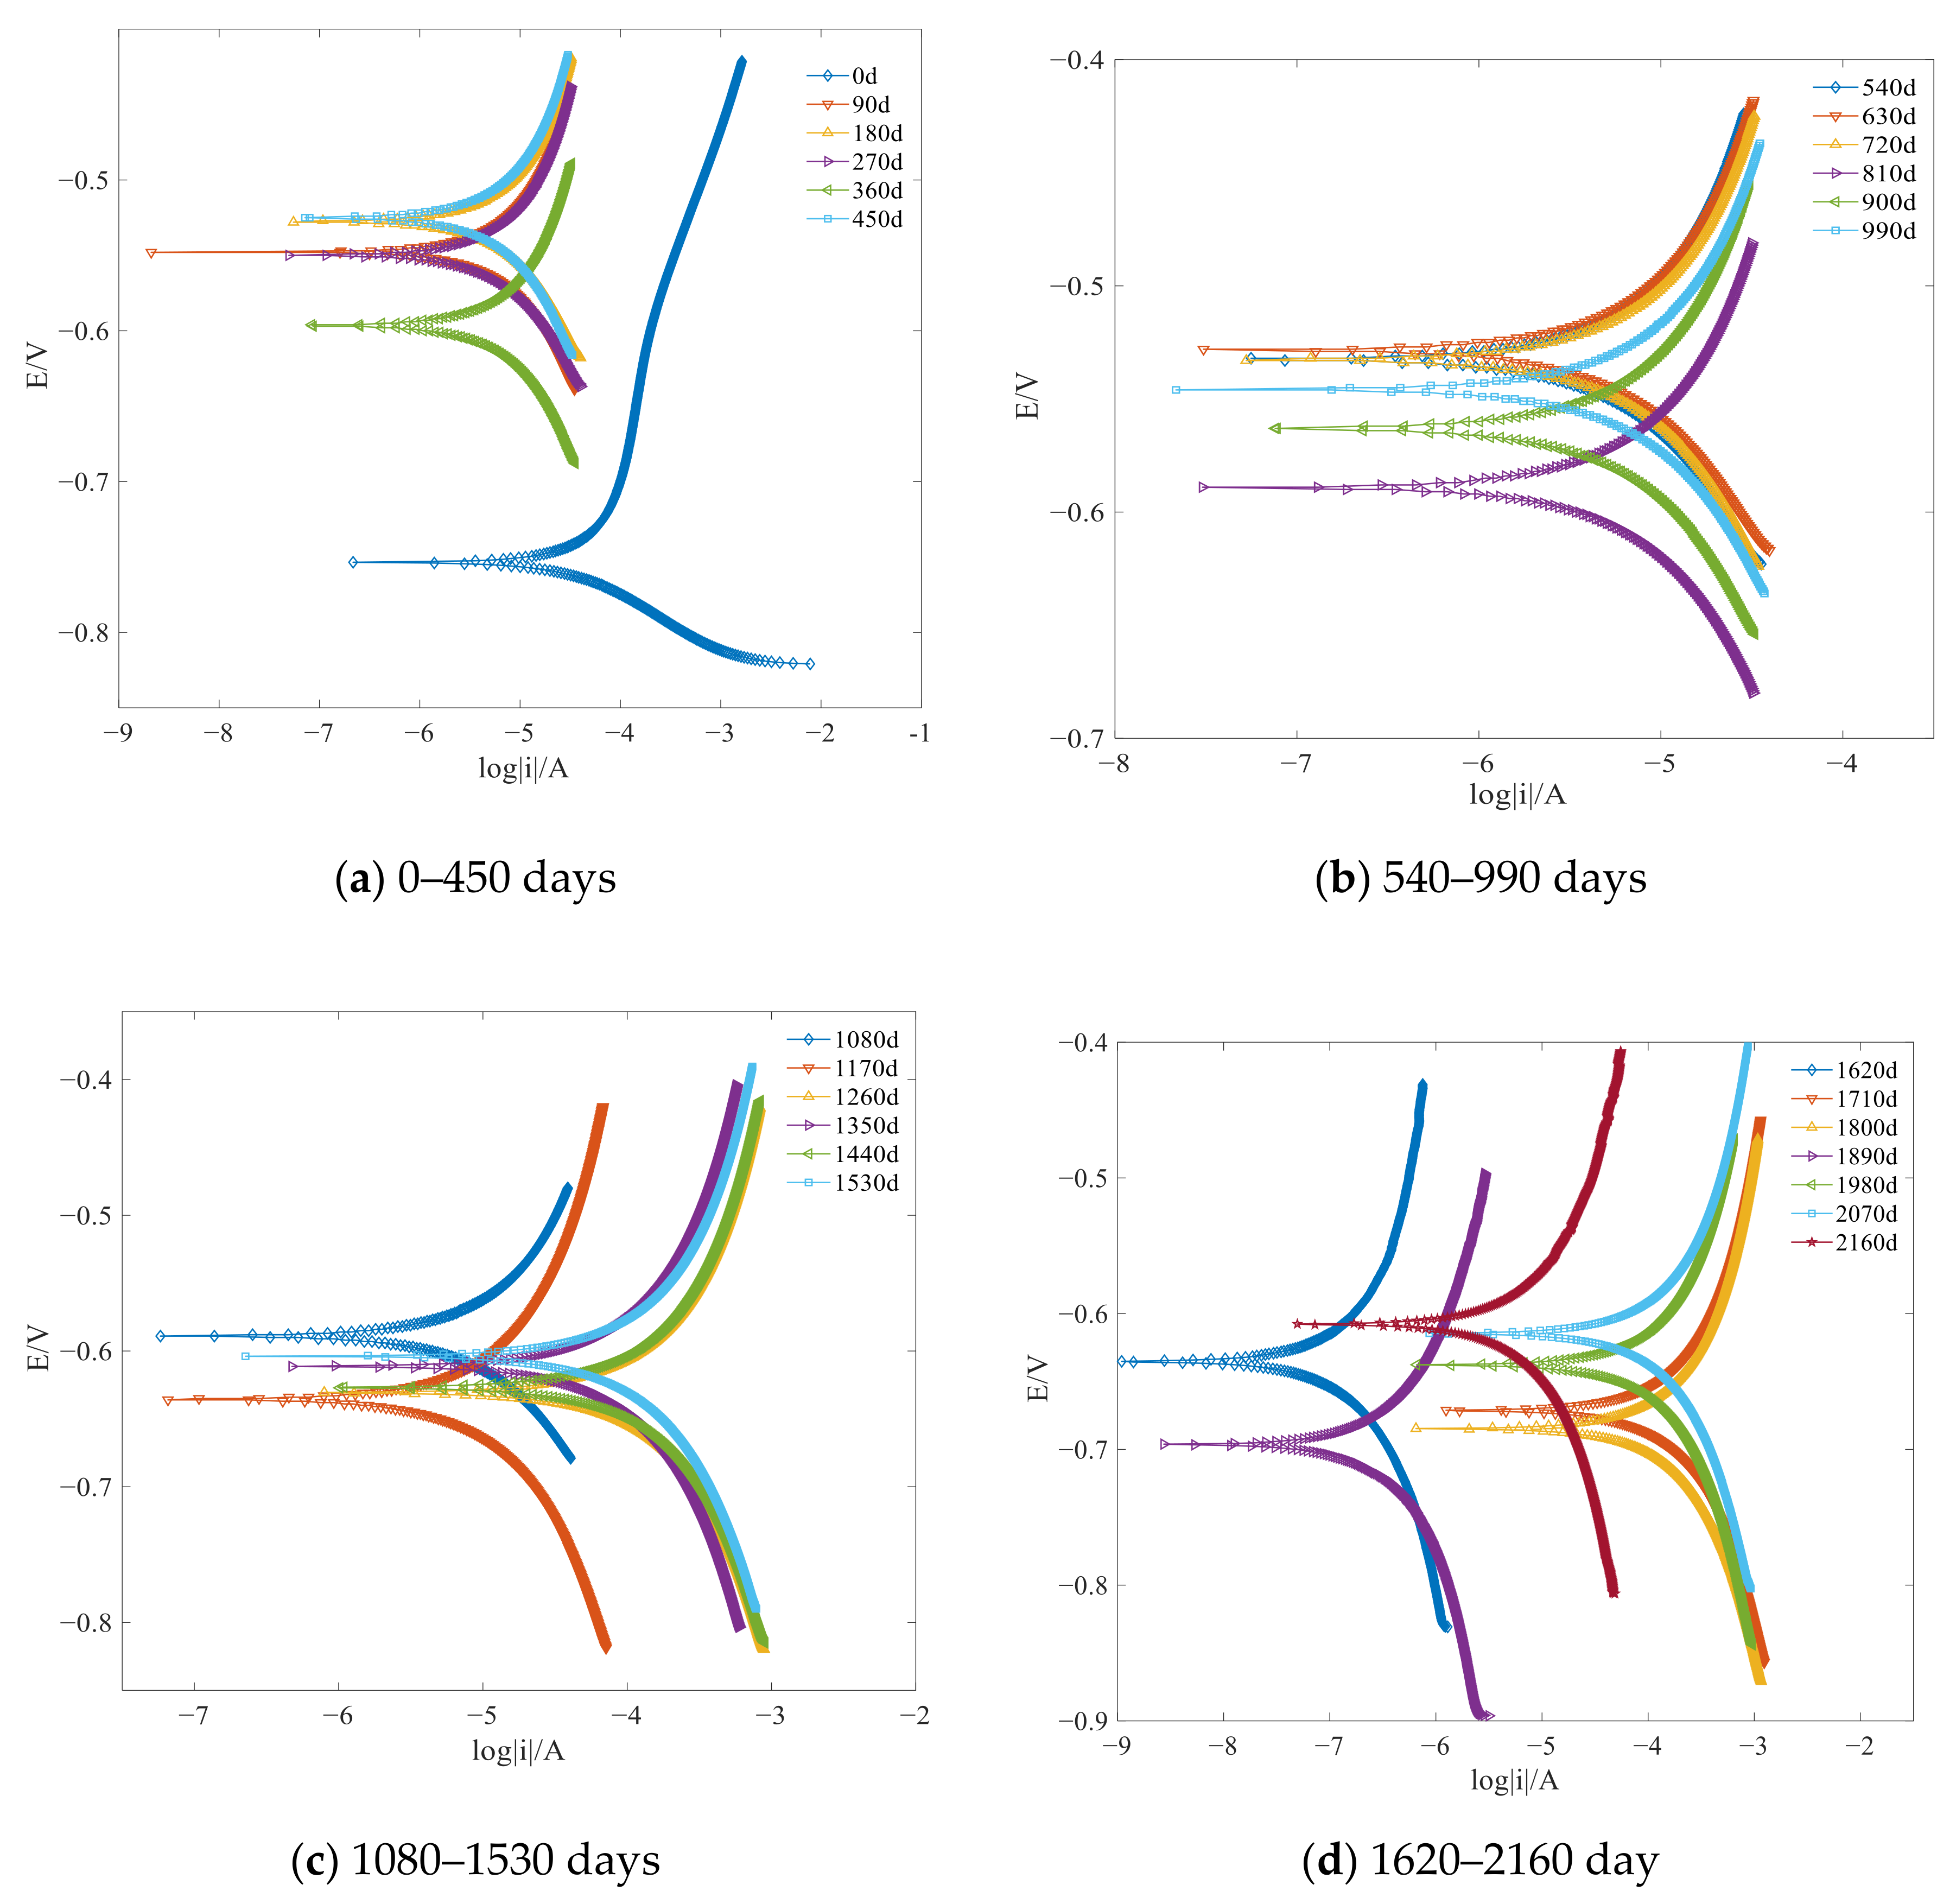
Figure 4a–d shows that, from 0 to 90 days, the corrosion potential moved in a positive direction, from −0.75 to −0.55 V. From 90 to 180 days, the corrosion potential shifted from −0.55 to − 0.53 V. From 180 to 270 days, the corrosion potential changed from −0.53 to −0.56 V. From 270 to 360 days, the corrosion potential changed from −0.56 to −0.60 V. From 360 to 450 days, the corrosion potential changed from −0.60 to −0.52 V. Finally, from 450 to 2160 days, the corrosion location moved in both the positive and the negative directions. The corrosion potential of group B also moved during the whole immersion period. It can be seen that the corrosion potential of groups A and B moved in both positive and negative directions during the whole immersion period. These positive and negative movements of the corrosion potential reflect the difficulty in corroding (coated) steel bars. The positive movement indicates that corrosion is more difficult, while the negative movement indicates that corrosion is easier [31,32,33].
Figure 5 shows that the anodic polarisation curve is steep and that the cathodic polarisation curve is gentle during part of the immersion cycle, but the anodic polarisation curve becomes gentle, and the cathodic polarisation curve becomes steep as the immersion progresses. The anode polarisation curve is slightly flat, indicating that the Tafel slope is somewhat small, while the cathode polarisation curve is steep, indicating that the cathode Tafel slope is somewhat large. That is, there is slight resistance to anodic dissolution, indicating that the coated steel bar is in an easily corrodible state. A slightly steep anodic polarisation curve indicates a slightly larger Tafel slope, while a gentle cathodic polarisation curve indicates a slightly smaller Tafel slope. That is, there is slightly greater resistance to anodic dissolution, indicating that the coated steel bar is in a state in which corrosion is difficult.
When oxygen is sufficient, Fe(OH)2 is oxidised to Fe(OH)3, and Fe(OH)3 is dehydrated to form Fe2O3 (red rust):
In contrast, under the condition of insufficient oxygen, Fe(OH)2 is oxidised insufficiently to form Fe3O4 (black rust):
Therefore, the continuous accumulation of steel corrosion and the continuous penetration of chloride ions into the corrosion layer further led to the positive and negative movement of corrosion potential and the changes in the slopes of the anode and cathode polarisation curves [35,36].
For group B specimens, the protection provided by asphalt to reinforcements is mainly a barrier function; that is, the asphalt prevented direct contact between Cl− ions and reinforcements and prevented them from accelerating the corrosion of reinforcement. It can be seen from Figure 5 that, from 0 to 2160 days, the Tafel slope of the anodic polarisation curve is less than that of the cathodic polarisation curve; that is, the solution continuously invaded the coating, causing corrosion of the steel bars.
Figure 6 shows that icorr of group A is 0.11 µA/cm2 at 0 days, and that of group B is 0.03 µA/cm2 at 0 days. According to Table 4, group A specimens are in a low-corrosion state, and group B specimens are in a no-corrosion state. That is, when reinforcements are not protected by the coating, they will reach a state of corrosion after curing in MOCC. icorr for group A is 7.88 µA/cm2 at 2160 days, and that of group B is 0.08 µA/cm2 at 2160 days. According to Table 4, the specimens in group A are in a serious corrosive state, whereas those in group B are still in a no-corrosion state. These results demonstrate that the YP coating can protect the steel bars from corrosion in MOCC.
3.2. AC Impedance Test Results
Figure 7, Figure 8, Figure 9, Figure 10, Figure 11, Figure 12, Figure 13 and Figure 14 show the electronic impact spectroscopy test results for group A and B samples, among which Figure 7a, Figure 8a, Figure 9a, Figure 10a, Figure 11a, Figure 12a, Figure 13a and Figure 14a are Nyquist diagrams, and Figure 7b, Figure 8b, Figure 9b, Figure 10b, Figure 11b, Figure 12b, Figure 13b and Figure 14b are Bode diagrams. Nyquist and Bode diagrams reflect the changes in the corrosion system process of the steel. Based on the equivalent circuit, the Rc values of asphalt-coated steel and bare steel were calculated, as shown in Figure 15. It can be concluded from Figure 7a, Figure 8a, Figure 9a and Figure 10a that there are two resistance arcs in the figure, namely the resistance arcs with small radii in high- and low-frequency areas. This feature indicates that the reinforcement is rusted. From Figure 11a, Figure 12a, Figure 13a and Figure 14a, one can observe two capacitance reactance arcs, namely the semicircle resistance arc with a small radius in the high-frequency region and the capacitance arc with a large radius in the low-frequency region, and the tail drag phenomenon in the low-frequency area is short. The capacitance information for the interface between the surface of the coating and the pore electrolyte solution of magnesium oxychloride cement in the high-frequency region is the resistance and the barrier capacitance of the coating. The greater arc resistance radius in the high-frequency area indicates a better protective effect of the coating on the reinforcement. The capacitance information for the interface between the bottom reinforcement and the electrolyte solution corresponds to the resistance arc in the low-frequency region. The drag phenomenon [37,38] is also produced, indicating the appearance of diffusion-related Warburg impedance of the original corrosion system. The reason for the tail dragging in the low-frequency area is that the solution gradually invades the inside of the coating, causing the steel bar to rust, and the corrosion product concentration at the interface is high; thus, it needs to spread to the outside. During the whole immersion period, the arc radius of the high-frequency zone increases and decreases continuously. The main reason for this behaviour is that the formation of a corrosion layer acts as a barrier, and the barrier prevents further corrosion. As the corrosion further invades the inside of the coating, the impedance value increases and decreases, causing the change in the resistance radius in the high-frequency region. In addition, Figure 7b, Figure 8b, Figure 9b, Figure 10b, Figure 11b, Figure 12b, Figure 13b and Figure 14b show that the time parameters of group A samples occur in the high-frequency area with a frequency of 103–105 Hz, and there is no time parameter generation at other frequencies, indicating that corrosion occurs on the surface of the steel bars and the corrosion substance acts as protection. For group B, the time parameters appear in the low-frequency region (25) with a frequency of 10−2–10−1 Hz; that is, corrosion on the surface of the substrate occurs. For group A, RC was 1440.21 Ω at 0 days and 113.51 Ω at 2160 days, exhibiting a trend of decreasing with the increase in soaking time. For group B, RC was 6.71 × 10⁴ Ω at 0 days and 842.57 Ω at 2160 days, and it decreased with the increase in soaking time.
3.3. FTIR Test Results
The FTIR test on asphalt was performed every 180 days. Figure 16 shows the peak area in the atlas changes under different soaking ages, and the hydroxyl peak at 3400 cm−1, the carbonyl group at 1700 cm−1, and the carbonyl group at 1031 cm−1 undergo obvious changes, while the other peak position spectra only change slightly. The reason for this difference is that there are hydroxyl groups in the phenol molecules. Owing to the influence of aromatic rings, the p orbital of the hydroxyl oxygen with lone pair electrons in the phenol is conjugated with the π bond of the aromatic ring. This conjugation endows phenols with obviously different properties from those of other substances containing hydroxyl groups. When they meet with water, they can form hydrogen bonds with it. In addition, phenols will ionise when they meet with water and dissociate into hydrogen ions with a positive charge and phenoxy anions with a negative charge, as shown below (Figure 17) [22].
Its molecular formula can be written as ![Applsci 13 04759 i001]() . When water is present, the following reactions occur (Figure 18) [22]:
. When water is present, the following reactions occur (Figure 18) [22]:
 . When water is present, the following reactions occur (Figure 18) [22]:
Sulphite is unstable, and the following decomposition reactions can occur in the presence of water [22]:
3.4. Crack Development and Quality Degradation Results
The durability of MOCRC was analysed using the relative dynamic modulus of elasticity evaluation parameters ω1 and relative mass evaluation parameters ω2 [22]. The formula for ω1 is
where , with E0 being initial dynamic elastic modulus, Et being the dynamic elastic modulus at time t, V0 being the initial wave velocity (in km/s), and Vt being the wave velocity (km/s) at time t. When ω1 < 0, the specimen reaches the failure state; when 0 ≤ ω1 < 1, the specimen undergoes damage but does not reach the failure state; and when ω1 ≥ 1, the specimen does not reach the failure state and is in good condition. The formula for ω2 is
where , with M0 being the initial mass and Mt being the mass at time t. When ω2 < 0, the specimen reaches a failure state; when 0 ≤ ω2 < 1, the specimen undergoes damage but does not reach a failure state; and when ω2 ≥ 1, the specimen does not reach a failure state and is in good condition.
As shown in Figure 19a, at 2610 days, the relative dynamic modulus of the elasticity evaluation parameter ω1 for group A specimens is 0.942, and that of group B specimens is 0.946, indicating that there is crack development in the specimens. From Figure 19b, the masses of groups A and B began to decrease after 90 days. At 2610 days, ω2 for group A was 0.959, and that for group B was 0.962. However, on the whole, the quality loss was not substantial, being 0.2% and 0.3%, respectively. The development of cracks and quality loss interact with each other, and they promote each other. At the same time, the corrosion of steel bars will also cause the development of cracks. However, the mass loss of concrete is due to the continuous hydrolysis of 5Mg(OH)2·MgCl2·8H2O and 3Mg(OH)2·MgCl2·8H2O, which produce Mg(OH)2 and MgCl2, and continuously decreases the concrete’s compactness. The specific chemical path is as follows [22]:
HCl and some of the Mg(OH)2 generate water-soluble MgCl2, the chemical equation of which is
3.5. Microscopic Test Results
SEM images of YP asphalt in different periods are shown in Figure 20. Among them, Figure 20a,b show that YP asphalt is soaked for 1080 and 2160 days, respectively, and the magnifications in the panels designated −1, −2, and −3 are 200×, 500×, and 5000×, respectively. It can be seen in Figure 20 that numerous white crystals have attached to the asphalt surface, and these white crystals are MgCl2. An enlargement of the attachment of chloride crystals in Figure 20(a-2) is shown in Figure 20(a-3), from which we can see that there are many folds on the asphalt surface. It can be seen from Figure 20b that, with the increase in soaking time, the amount of chloride salt adhesion on the asphalt surface is increasing, and the chloride salt adhesion is enhanced. The result is shown in Figure 20(b-3), from which it can be seen that the chloride salt has penetrated into the asphalt. Therefore, it can be further concluded that the protective effect of asphalt on reinforcements is mainly realised by its barrier function, while the corrosion of the chloride solution on asphalt is mainly the corrosion of chloride to the interior of asphalt, and the invading salt provides a channel for the water solution to invade into the interior of asphalt. The combination of the two results in the degradation of the asphalt protective effect.
4. Conclusions
(1) According to the polarisation curve test results, after 2160 days of immersion in the solution, group A specimens were in a severely corroded state, while group B specimens were still in an uncorroded state, indicating that the asphalt coating had a good protective effect on the reinforcement.
(2) According to the relative dynamic elastic modulus evaluation index and the relative quality evaluation index, the durability deterioration of the specimens with asphalt coating after 2160 days of solution immersion was less than that of bare steel specimens. It is shown that using asphalt coating to protect steel bars can effectively improve the durability of MOCRC.
(3) According to the SEM test results, the protective effect of asphalt on reinforcements is mainly realised by its barrier function. Based on the comprehensive analysis of solution immersion test results, it can be concluded that it is feasible to use asphalt coating to insulate the corrosion of chloride ions in MOCRC to steel bars and improve the durability of MOCRC.
Author Contributions
Conceptualisation, Y.L., H.Q. and A.Y.; data curation, A.Y.; funding acquisition, H.Q.; project administration, H.Q.; software, Y.L. and A.Y.; validation, A.Y.; writing—original draft, Y.L.; writing—review and editing, H.Q. All authors have read and agreed to the published version of the manuscript.
Funding
This work was financially supported by the National Natural Science Foundation of China (Nos. 52178216, 51868044). The authors appreciate the financial and equipment support.
Institutional Review Board Statement
Not applicable.
Informed Consent Statement
Not applicable.
Data Availability Statement
The data presented in this study are available upon request from the corresponding author.
Acknowledgments
We gratefully acknowledge the Gansu Advanced Civil Engineering Materials Engineering Research Center.
Conflicts of Interest
The authors declare no conflict of interest.
References
- Wang, P.; Qiao, H.; Zhang, Y.; Li, Y.; Feng, Q. Three-dimensional characteristics of steel corrosion and corrosion-induced cracks in magnesium oxychloride cement concrete monitored by x-ray computed tomography. Constr. Build. Mater. 2020, 246, 118504. [Google Scholar] [CrossRef]
- Wang, P.; Qiao, H.; Zhang, Y.; Li, Y.; Chen, K. Meso-damage evolution analysis of magnesium oxychloride cement concrete based on X-CT and grey-level co-occurrence matrix. Constr. Build. Mater. 2020, 255, 119373. [Google Scholar] [CrossRef]
- Gao, S.; Ban, S.; Wang, H.; Lei, D.; Gong, Y. The influence of oiled fiber, freeze-thawing cycle, and sulfate attack on strain hardening cement-based composites. Rev. Adv. Mater. Sci. 2022, 61, 208–220. [Google Scholar] [CrossRef]
- Yu, Y.; Li, B.; Zhang, Y.; Zhang, C. Deterioration characteristics of recycled aggregate concrete subjected to coupling effect with salt and frost. Rev. Adv. Mater. Sci. 2022, 61, 27–40. [Google Scholar] [CrossRef]
- Angst, U.M. Challenges and opportunities in corrosion of steel in concrete. Mater. Struct. 2018, 51, 4. [Google Scholar] [CrossRef] [Green Version]
- Torbati-Sarraf, H.; Poursaee, A. Corrosion improvement of carbon steel in concrete environment through modification of steel microstructure. J. Mater. Civ. Eng. 2019, 31, 04019042. [Google Scholar] [CrossRef]
- Alhozaimy, A.; Hussain, R.R.; Al-Negheimish, A.I.; Singh, J.K.; Singh, D. Protection against reinforcement corrosion using phosphoric acid-based rust converter. ACI Mater. J. 2018, 115, 935–944. [Google Scholar] [CrossRef]
- Wei, L.Z.; Wang, Y.C.; Jiang, T.; Xiao, J.Z. Feasibility study of strain hardening magnesium oxychloride cement-based composites. Constr. Build. Mater. 2018, 165, 750–760. [Google Scholar] [CrossRef]
- Gong, W.; Yu, H.; Ma, H.; Qiao, H.; Chen, G. Study on corrosion and anticorrosion of rebar in magnesium oxychloride cement concrete. Emerg. Mater. Res. 2019, 8, 94–104. [Google Scholar] [CrossRef]
- Wang, P.; Qiao, H.; Feng, Q.; Cao, H. Degradation in durability of magnesium oxychloride-coated reinforced steel concrete. ACI Mater. J. 2020, 117, 33–41. [Google Scholar]
- Wang, P.; Qiao, H.; Chen, K.; Li, Y.; Feng, Q. Life prediction and long-term durability of coated steel bars in magnesium oxychloride concrete. KSCE J. Civ. Eng. 2020, 24, 2120–2131. [Google Scholar] [CrossRef]
- Zhang, M.; Xu, R.; Liu, K.; Sun, S. Research progress on durability of marine concrete under the combined action of Cl− erosion, carbonation, and dry–wet cycles. Rev. Adv. Mater. Sci. 2022, 61, 622–637. [Google Scholar] [CrossRef]
- Chen, X.Y.; Zhang, T.T.; Bi, W.L.; Cheeseman, C. Effect of tartaric acid and phosphoric acid on the water resistance of magnesium oxychloride (MOC) cement. Constr. Build. Mater. 2019, 213, 528–536. [Google Scholar] [CrossRef]
- Huang, T.; Yuan, Q.; Deng, D. The role of phosphoric acid in improving the strength of magnesium oxychloride cement pastes with large molar ratios of H2O/MgCl2. Cem. Concr. Compos. 2019, 97, 379–386. [Google Scholar] [CrossRef]
- He, P.; Poon, C.S.; Tsang, D. Comparison of glass powder and pulverized fuel ash for improving the water resistance of magnesium oxychloride cement. Cem. Concr. Compos. 2018, 86, 98–109. [Google Scholar] [CrossRef]
- He, P.; Poon, C.S.; Tsang, D. Effect of pulverized fuel ash and co2 curing on the water resistance of magnesium oxychloride cement (moc). Cem. Concr. Res. 2017, 97, 115–122. [Google Scholar] [CrossRef]
- Khatkar, S. Hybrid magnesium matrix composites: A review of reinforcement philosophies, mechanical and tribological characteristics. Rev. Adv. Mater. Sci. 2023, 62, 20220294. [Google Scholar] [CrossRef]
- Nian, T.; Li, P.; Wei, X.; Wang, P.; Li, H.; Guo, R. The effect of freeze-thaw cycles on durability properties of sbs-modified bitumen. Constr. Build. Mater. 2018, 187, 77–88. [Google Scholar] [CrossRef]
- Nian, T.; Li, P.; Mao, Y.; Zhang, G.; Liu, Y. Connections between chemical composition and rheology of aged base asphalt binders during repeated freeze-thaw cycles. Constr. Build. Mater. 2018, 159, 338–350. [Google Scholar] [CrossRef]
- Smith, F.H. Field joint coating of pipelines—Effect of soluble salt contamination on 2-layer heat shrink sleeve performance. Anti-Corros. Methods Mater. 2016, 63, 105–115. [Google Scholar] [CrossRef]
- Tang, L.M.; Bi, W.J. The improvement of anticorrosive technology for pipeline in panjin oilfield. Adv. Mater. Res. 2012, 472, 2901–2904. [Google Scholar] [CrossRef]
- Wang, P.; Qiao, H.; Li, Y.; Chen, K.; Nian, T. Durability of organic coated reinforced magnesium oxychloride cement concrete. Struct. Concr. 2021, 22, 2595–2610. [Google Scholar] [CrossRef]
- Pa, A.; Xl, A.; Se, A.; Asa, B. Use of epoxy asphalt as surfacing and tack coat material for roadway pavements—Sciencedirect. Constr. Build. Mater. 2020, 250, 118936. [Google Scholar]
- Huang, Q.; Qian, Z.; Chen, L.; Zhang, M.; Hu, J. Evaluation of epoxy asphalt rubber with silane coupling agent used as tack coat for seasonally frozen orthotropic steel bridge decks. Constr. Build. Mater. 2020, 241, 117957. [Google Scholar] [CrossRef]
- Xiao, R.; Huang, B.S. Moisture damage mechanism and thermodynamic properties of hot-mix asphalt under aging conditions. ACS Sustain. Chem. Eng. 2022, 10, 14865–14887. [Google Scholar] [CrossRef]
- Wang, W.Z.; Shen, A.Q.; He, Z.M.; Liu, H.C. Evaluation of the adhesion property and moisture stability of rubber modified asphalt mixture incorporating waste steel slag. J. Adhes. Sci. Technol. 2023, 37, 296–318. [Google Scholar] [CrossRef]
- Zhang, G.; Qiu, J.; Zhao, J.; Wei, D.; Wang, H. Development of Interfacial Adhesive Property by Novel Anti-Stripping Composite between Acidic Aggregate and Asphalt. Polymers 2020, 12, 473. [Google Scholar] [CrossRef] [Green Version]
- Zamanizadeh, H.R.; Danaee, I.; Shishesaz, M.R.; Zarei, D. Preparation, adhesion and barrier properties of bituminous composite coatings on steel 37. Sci. Iran. 2016, 23, 2784–2790. [Google Scholar] [CrossRef] [Green Version]
- Zamanizadeh, H.R.; Shishesaz, M.R.; Danaee, I.; Zaarei, D. Investigation of the corrosion protection behavior of natural montmorillonite clay/bitumen nanocomposite coatings. Prog. Org. Coat. 2015, 78, 256–260. [Google Scholar] [CrossRef]
- Shahsavari, A.R.; Danaee, I.; Baniasad, F. Effect of Nano Cerium Oxide on Cathodic Protection and Barrier Properties of Zinc Rich Bitumen Coatings. Prot. Met. Phys. Chem. Surf. 2022, 58, 981–990. [Google Scholar] [CrossRef]
- Yu, J.H.; Zhang, Y.F.; Jin, X.Y.; Chen, L.; Xue, W.B. Fabrication and optical emission spectroscopy of enhanced corrosion-resistant CPEO films on Q235 low carbon steel. Surf. Coat. Technol. 2019, 363, 411–418. [Google Scholar] [CrossRef]
- Ohba, M.; Scarazzato, T.; Espinosa, D.C.R.; Panossian, Z. Study of metal electrodeposition by means of simulated and experimental polarization curves: Zinc deposition on steel electrodes. Electrochim. Acta 2019, 309, 86–103. [Google Scholar] [CrossRef]
- Luo, D.; Li, F.; Xing, G. Corrosion resistance of 6061-T6 aluminium alloy and its feasibility of near-surface reinforcements in concrete structure. Rev. Adv. Mater. Sci. 2022, 61, 638–653. [Google Scholar] [CrossRef]
- Wu, J.; Dong, L.; Deng, J.H.; Hou, D.; Li, G.Z.; Li, D.J.; Xue, W.B. Direct growth of oxide layer on carbon steel by cathodic plasma electrolysis. Surf. Coat. Technol. 2018, 338, 63–68. [Google Scholar] [CrossRef]
- Tao, Z.; He, W.; Wang, S.; Zhang, S.; Zhou, G. A study of differential polarization curves and thermodynamic properties for mild steel in acidic solution with nitrophenyl triazole derivative. Corros. Sci. 2012, 60, 205–213. [Google Scholar] [CrossRef]
- Fajardo, S.; Llorente, I.; Jiménez, J.A.; Bastidas, J.M.; Bastidas, D.M. Effect of Mn additions on the corrosion behaviour of TWIP Fe-Mn-Al-Si austenitic steel in chloride solution. Corros. Sci. 2019, 154, 246–253. [Google Scholar] [CrossRef]
- Benarioua, M.; Mihi, A.; Bouzeghaia, N.; Naoun, M. Mild steel corrosion inhibition by Parsley (Petroselium Sativum) extract in acidic media. Egypt. J. Pet. 2019, 28, 155–159. [Google Scholar] [CrossRef]
- Rengaraju, S.; Neelakantan, L.; Pillai, R.G. Investigation on the polarization resistance of steel embedded in highly resistive cementitious systems—An attempt and challenges. Electrochim. Acta 2019, 308, 131–141. [Google Scholar] [CrossRef]
Figure 1.
Test block plan.

Figure 2.
Three-electrode system electrolytic cell test schematic.

Figure 3.
Fourier transform infrared spectrometer.

Figure 4.
Polarisation curves for group A specimens.

Figure 5.
Polarisation curves for group B specimens.


Figure 6.
Calculation results for corrosion current density.

Figure 7.
Nyquist and Bode diagrams for group A specimens (0–450 days).

Figure 8.
Nyquist and Bode diagrams for group A specimens (540–990 days).

Figure 9.
Nyquist and Bode diagrams for group A specimens (1080–1530 days).

Figure 10.
Nyquist and Bode diagrams for group A specimens (1620–2160 days).

Figure 11.
Nyquist and Bode diagrams for group B specimens (0–450 days).

Figure 12.
Nyquist and Bode diagrams for group B specimens (540–990 days).

Figure 13.
Nyquist and Bode diagrams for group B specimens (1080–1530 days).

Figure 14.
Nyquist and Bode diagrams for group B specimens (1620–2160 days).

Figure 15.
Polarisation impedance for group A and B specimens.

Figure 16.
FTIR spectrum of asphalt.

Figure 17.
Phenol ionization reaction.

Figure 18.
Sulfoxides react with water to form sulfurous acid.

Figure 19.
ω1 and ω2 results for group A and B specimens.

Figure 20.
SEM images of asphalt in a chloride solution at different times and magnifications. (a-1) ×200. (a-2) ×500. (a-3) ×5000. (b-1) ×200. (b-2) ×500. (b-3) ×5000.
Figure 20.
SEM images of asphalt in a chloride solution at different times and magnifications. (a-1) ×200. (a-2) ×500. (a-3) ×5000. (b-1) ×200. (b-2) ×500. (b-3) ×5000.


Table 1.
Physical indicators of the water-reducing agent.
| Species | Density Value (g/mL) | pH | Alkali Content (%) | Water Reduction Rate (%) | Bleeding Rate (%) | Compressive Strength Ratio | Recommended Dosage | ||
|---|---|---|---|---|---|---|---|---|---|
| 3 d | 7 d | 28 d | |||||||
| PCA(I) | 0.0003 | 8.08 | ≤3.88 | 34 | 0 | 168 | 149 | 139 | 0.02 |
Table 2.
Mixing proportion of MOCC (kg/m3).
| MgO | Water Reducer | Water Repellent | Sand | Cobblestone | MgCl2 | Water | Slum (mm) |
|---|---|---|---|---|---|---|---|
| 388.96 | 2.288 | 1.6016 | 625 | 1162 | 147.811 | 135.586 | 120 |
Table 3.
YP-modified asphalt technical indicators.
| Detection Indicator | Unit | Test Result | Technical Requirement |
|---|---|---|---|
| Penetration (25 °C, 5 s, 100 g) | 0.1 mm | 88 | 80–100 |
| Penetration index (PI) | — | −1.06 | −1.5–1.0 |
| Ductility at 10 °C | cm | >100 | ≥30 |
| Softening point TR&B | °C | 45.0 | ≥44 |
| Dynamic viscosity coefficient at 60 °C | — | 281.0 | ≥140 |
| Flash point | °C | 295 | ≤245 |
| Solubility | °C | 99.74 | ≥99.5 |
| Wax content (distillation method) | % | 1.7 | ≤2.2 |
| Density | g/cm3 | 0.986 | Measured value |
| RTFOT | Quality change | −0.04 | −0.8–0.8 |
| Residual penetration ratio | 75 | ≥57 | |
| Residual ductility at 5 °C | 46 | ≥8 |
Table 4.
Corresponding relationship between corrosion current density and corrosive degree of rebar.
Table 4.
Corresponding relationship between corrosion current density and corrosive degree of rebar.
| icorr (μA·cm−2) | icorr < 0. 1 | 0.1 ≤ icorr < 0.5 | 0.5 ≤ icorr < 1 | icorr ≥ 1 |
|---|---|---|---|---|
| rusting condition | no corrosion | low corrosion | medium corrosion | serious corrosion |
Disclaimer/Publisher’s Note: The statements, opinions and data contained in all publications are solely those of the individual author(s) and contributor(s) and not of MDPI and/or the editor(s). MDPI and/or the editor(s) disclaim responsibility for any injury to people or property resulting from any ideas, methods, instructions or products referred to in the content. |
© 2023 by the authors. Licensee MDPI, Basel, Switzerland. This article is an open access article distributed under the terms and conditions of the Creative Commons Attribution (CC BY) license (https://creativecommons.org/licenses/by/4.0/).
Share and Cite
MDPI and ACS Style
Li, Y.; Qiao, H.; Yang, A. Experimental Study on the Protection of an Asphalt Coating to Reinforcement in Magnesium Oxychloride Cement Concrete. Appl. Sci. 2023, 13, 4759. https://0-doi-org.brum.beds.ac.uk/10.3390/app13084759
AMA Style
Li Y, Qiao H, Yang A. Experimental Study on the Protection of an Asphalt Coating to Reinforcement in Magnesium Oxychloride Cement Concrete. Applied Sciences. 2023; 13(8):4759. https://0-doi-org.brum.beds.ac.uk/10.3390/app13084759
Chicago/Turabian StyleLi, Yuanke, Hongxia Qiao, and An Yang. 2023. "Experimental Study on the Protection of an Asphalt Coating to Reinforcement in Magnesium Oxychloride Cement Concrete" Applied Sciences 13, no. 8: 4759. https://0-doi-org.brum.beds.ac.uk/10.3390/app13084759
Note that from the first issue of 2016, this journal uses article numbers instead of page numbers. See further details here.