1. Introduction
Theoretical and experimental development of methods for measuring the ultra-low absorption of ultrapure materials is carried out in many laboratories around the world. One of the most sensitive methods are photothermal methods—in particular, photothermal common-path interferometry [
1,
2,
3,
4,
5,
6,
7,
8] and laser-induced deflection techniques [
4,
9,
10,
11]. Achievements in the development of these methods can be assessed using data from Heraeus, a manufacturer of some of the world’s purest quartz glasses. According to the presented data [
12], the optical absorption (λ ≈ 1 μm) in Suprasil 3001 glass is below the detection limit of the methods used (~1 ppm/cm for bulk absorption). Increasing the sensitivity of ultra-low absorption measurements in quartz materials to 10
−9 cm
−1 is a general problem with important applications. In particular, it will make it possible to measure absorption variations introduced by impurities against the background of the fundamental absorption of quartz glass and the absorption of the OH group (1 ÷ 5 × 10
−8 cm
−1/ppm) [
13]. Such measurements open up the possibility of monitoring the concentrations of the most common metal impurities (Fe, Ti, etc.) at a uniquely low level of 1 ppt in quartz glasses [
14]. Its relevance is confirmed by the manufacturers’ data [
15,
16], in which the detection limit value of the measurement method used is indicated as the impurity concentration value in the purest glasses (for example, <0.5 ppb for iron in SK-1300 glass [
16]).
In [
17], we presented a new method for measuring ultra-low absorption (with a sensitivity of ~10
−6 cm
−1 achieved at the moment with a signal-to-noise ratio ≈100/1 for quartz glass), called time-resolved photothermal common-path interferometry (TPCI). The TPCI scheme is a modified version of the thermal lens scheme [
18,
19] and the photothermal common-path interferometry scheme [
1,
2,
3,
4,
5,
6,
7,
8]. Differences between these schemes are discussed in [
20,
21]. We have developed a theory that relates the values of the measured signals with the absorption coefficients of isotropic [
17] and anisotropic solid dielectrics of some classes of symmetries [
20]. In [
22], a modified optical part of the TPCI scheme, which provided a Gaussian-like shape of laser beams in the volume of the tested samples, was presented, bringing the experimental conditions as close as possible to the theoretical description. In addition, the effect of ambient air on absorption measurements was studied.
This paper discusses the problem of measuring absorption under conditions of developed heat diffusion. Until now, the problem of measuring absorption using a TPCI scheme has been considered in the absence of heat diffusion in the region of the heating beam, since the duration of its pulse,
, was much less than the characteristic time of heat diffusion,
. For example, for quartz glass,
≈ 100 μs and
≈ 2600 μs. Here, C is the heat capacity, ρ is the density, Λ is the heat conductivity coefficient, and a
h is the heating beam waist radius at the 1/e intensity decay level. One of the ways to improve the sensitivity of measurements is to increase the energy of the heating pulse by increasing its power. However, there is a limit related to the dependence of the refractive index on the radiation power density of the heating laser in the sample volume, which finally masks the absorption signal [
1]. On the other hand, the heating energy can be increased without increasing the field intensity but by increasing the pulse duration. It follows from the calculations presented below that this way of increasing sensitivity also has its limits. Using the obtained analytical expressions, we present a calculation of the pulse shape of the time-varying component of the probe radiation with the heating pulse duration
, the value of which permits one to correctly calculate the absorption coefficient taking into account the heat diffusion effect. This makes it possible to use calibration samples with different heat diffusion times.
2. Materials and Methods
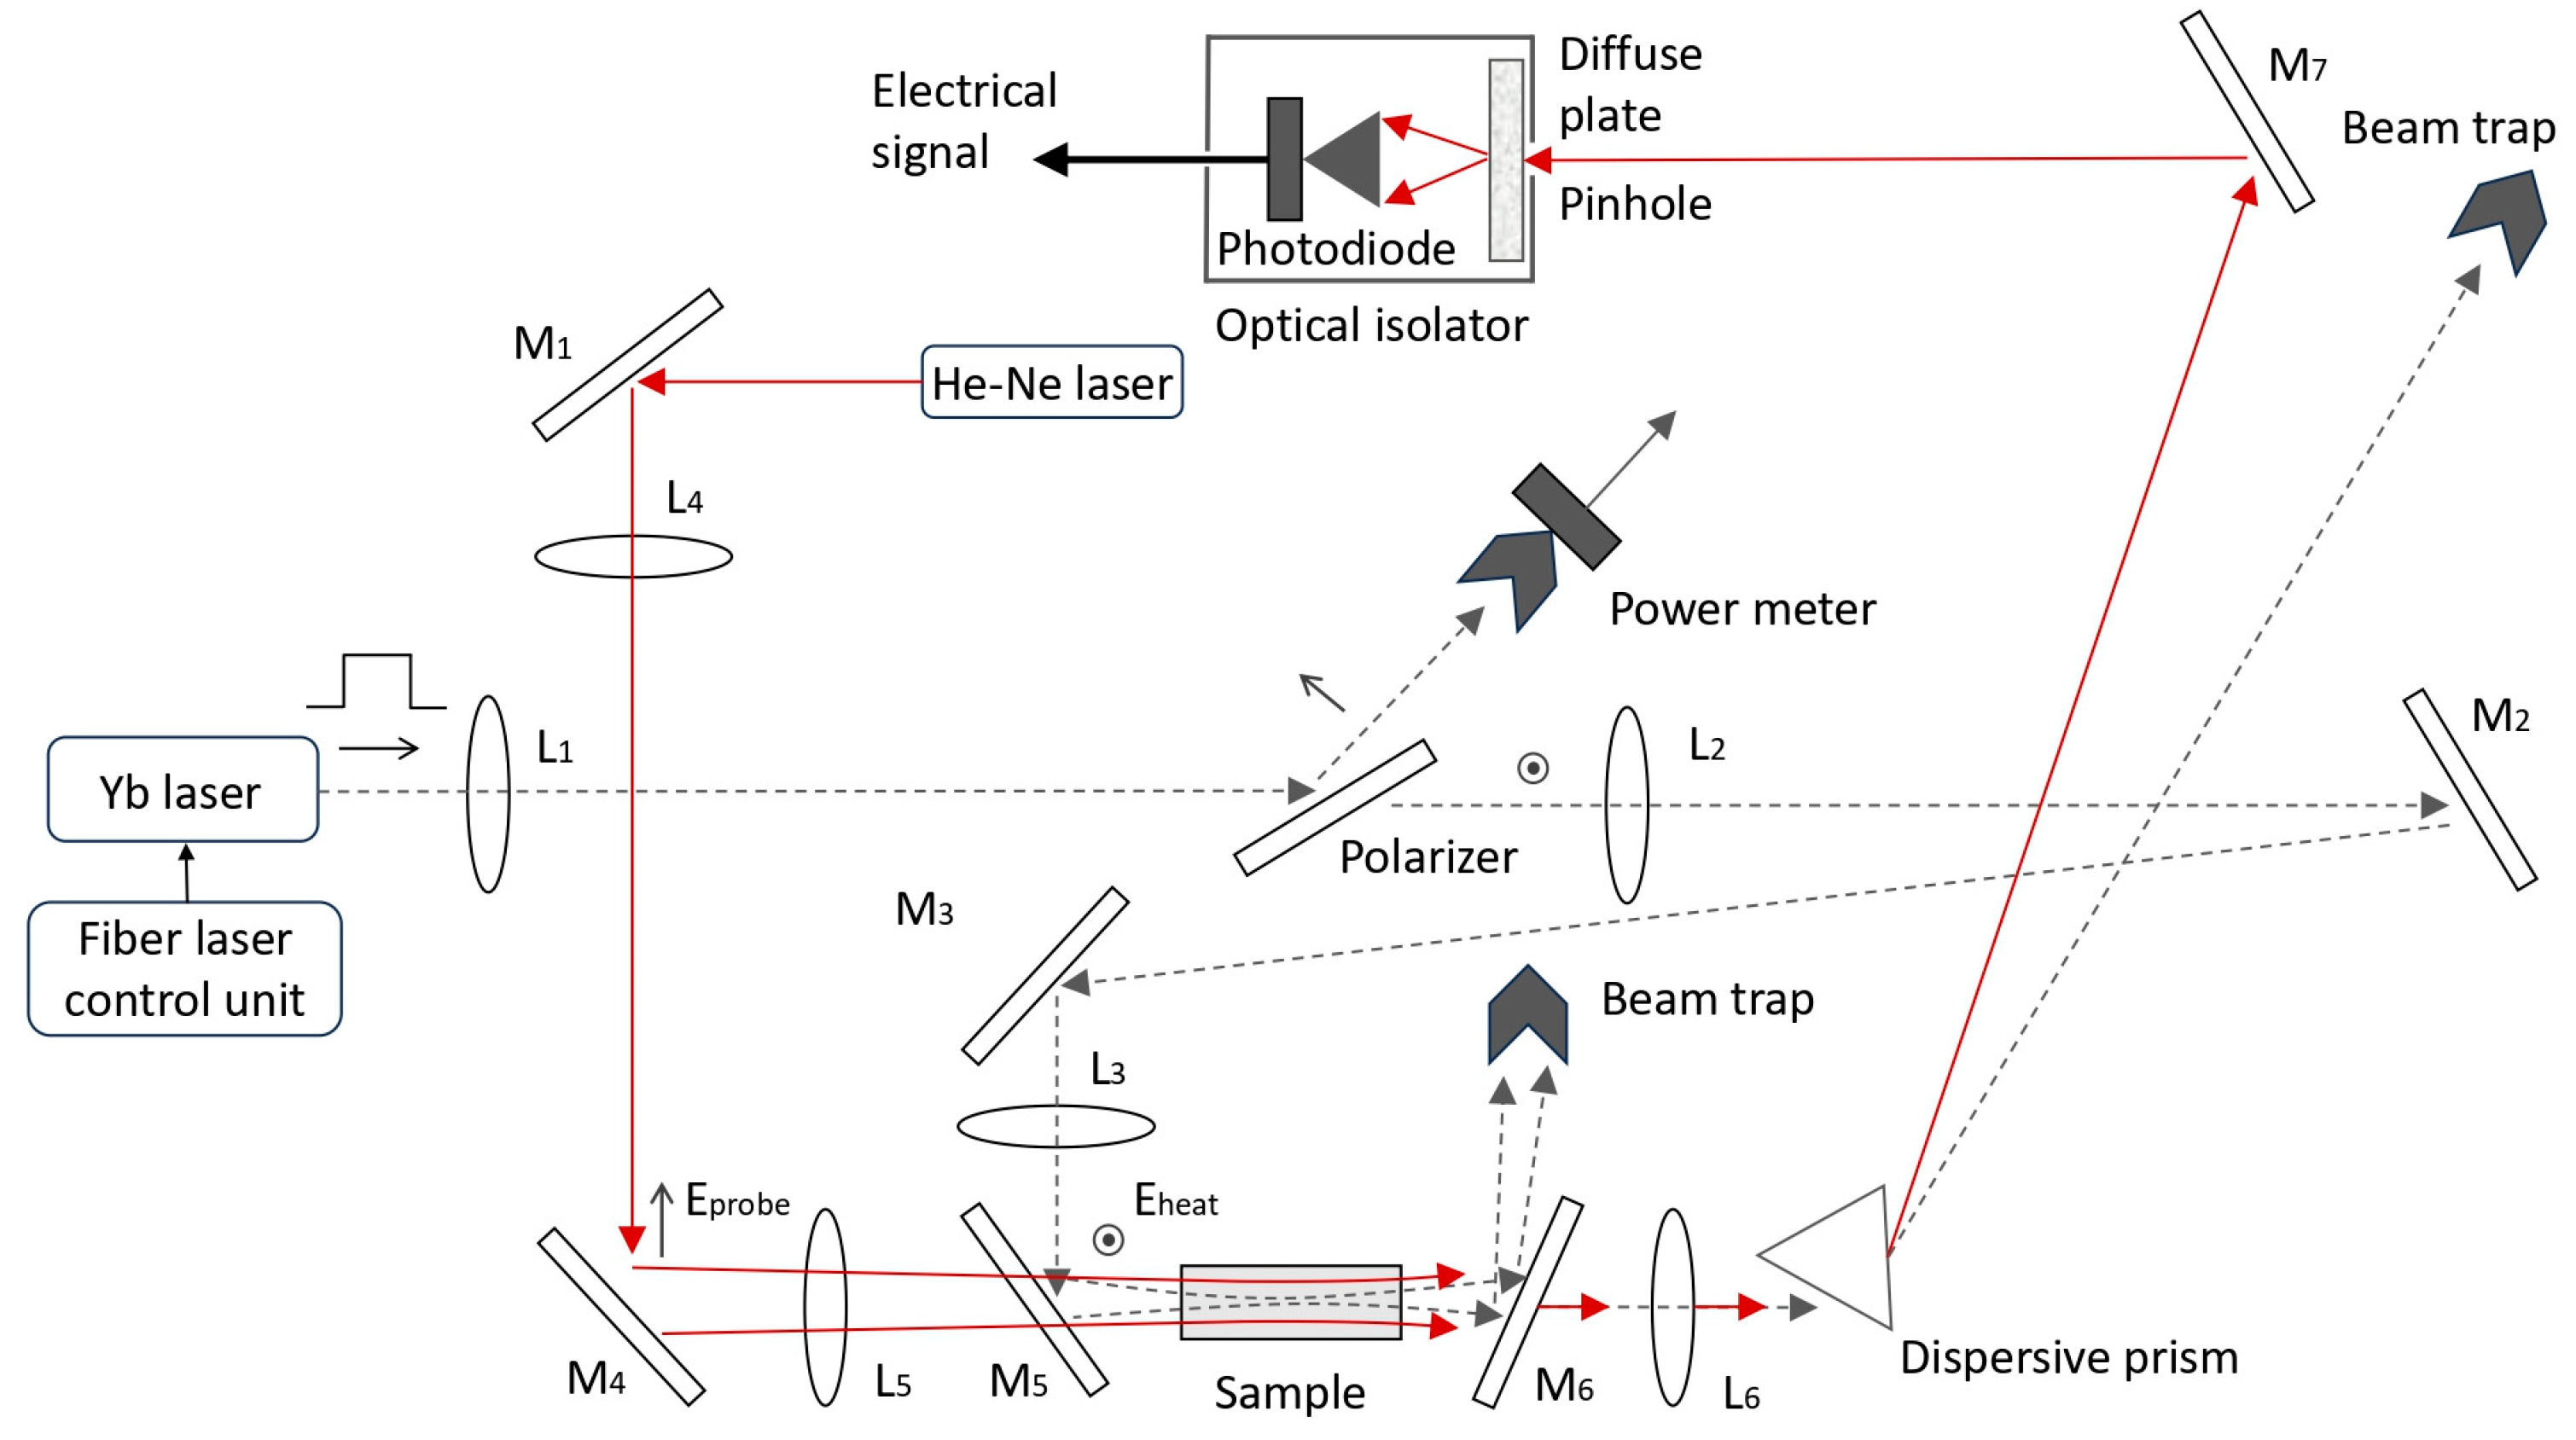
Figure 1 shows the optical part of the TPCI scheme, which we modified in comparison with its first version [
17] to study the effect of ambient air absorption on measurements [
22]. The essence of the modification was to employ a system of lenses L
1, L
2, and L
3 and lenses L
4 and L
5 to eliminate technically caused radiation distortions in the waist area of the heating and probe laser beams, respectively (these distortions appeared when the radiation was focused into the center of the sample with a single lens). This was modified to better match the measurement conditions and theoretical approximations and improve the accuracy of the calculation of absorption values. Due to these lens systems, a Gaussian-like laser radiation profile with the required transverse size of the beam waist was formed along the entire length of the sample. The waist radius at the 1/e level was a
h = 47 μm and a
probe = 100 μm for the heating and probe beams, respectively. The waist length of the heating beam in the sample, equal to
(n is the refractive index of the sample and λ
h = 1070 nm), was 2.9 cm, and the length of the sample we used was ≈8 cm. Thus, the radius of the Gaussian-shaped heating beam varied from 47 μm in the waist to 110 µm at the sample boundaries. The waist length of the probe beam in the sample was 29 cm. To measure the radii of the beams, a digital video camera with a pixel size of 4 μm was employed. The radius values were calculated by processing a digital signal, averaged over 100 realizations. The accuracy of calculating the characteristic time of heat diffusion is estimated at ±3%.
As before [
17,
20,
21,
22], a single-mode fiber ytterbium laser (λ = 1071 nm, M
2 = 1.08) operating in a pulse-periodic regime was used as a heating laser, and a continuous-wave single-mode He-Ne laser (λ = 633 nm) with an output power of 2 mW was employed as a probe laser.
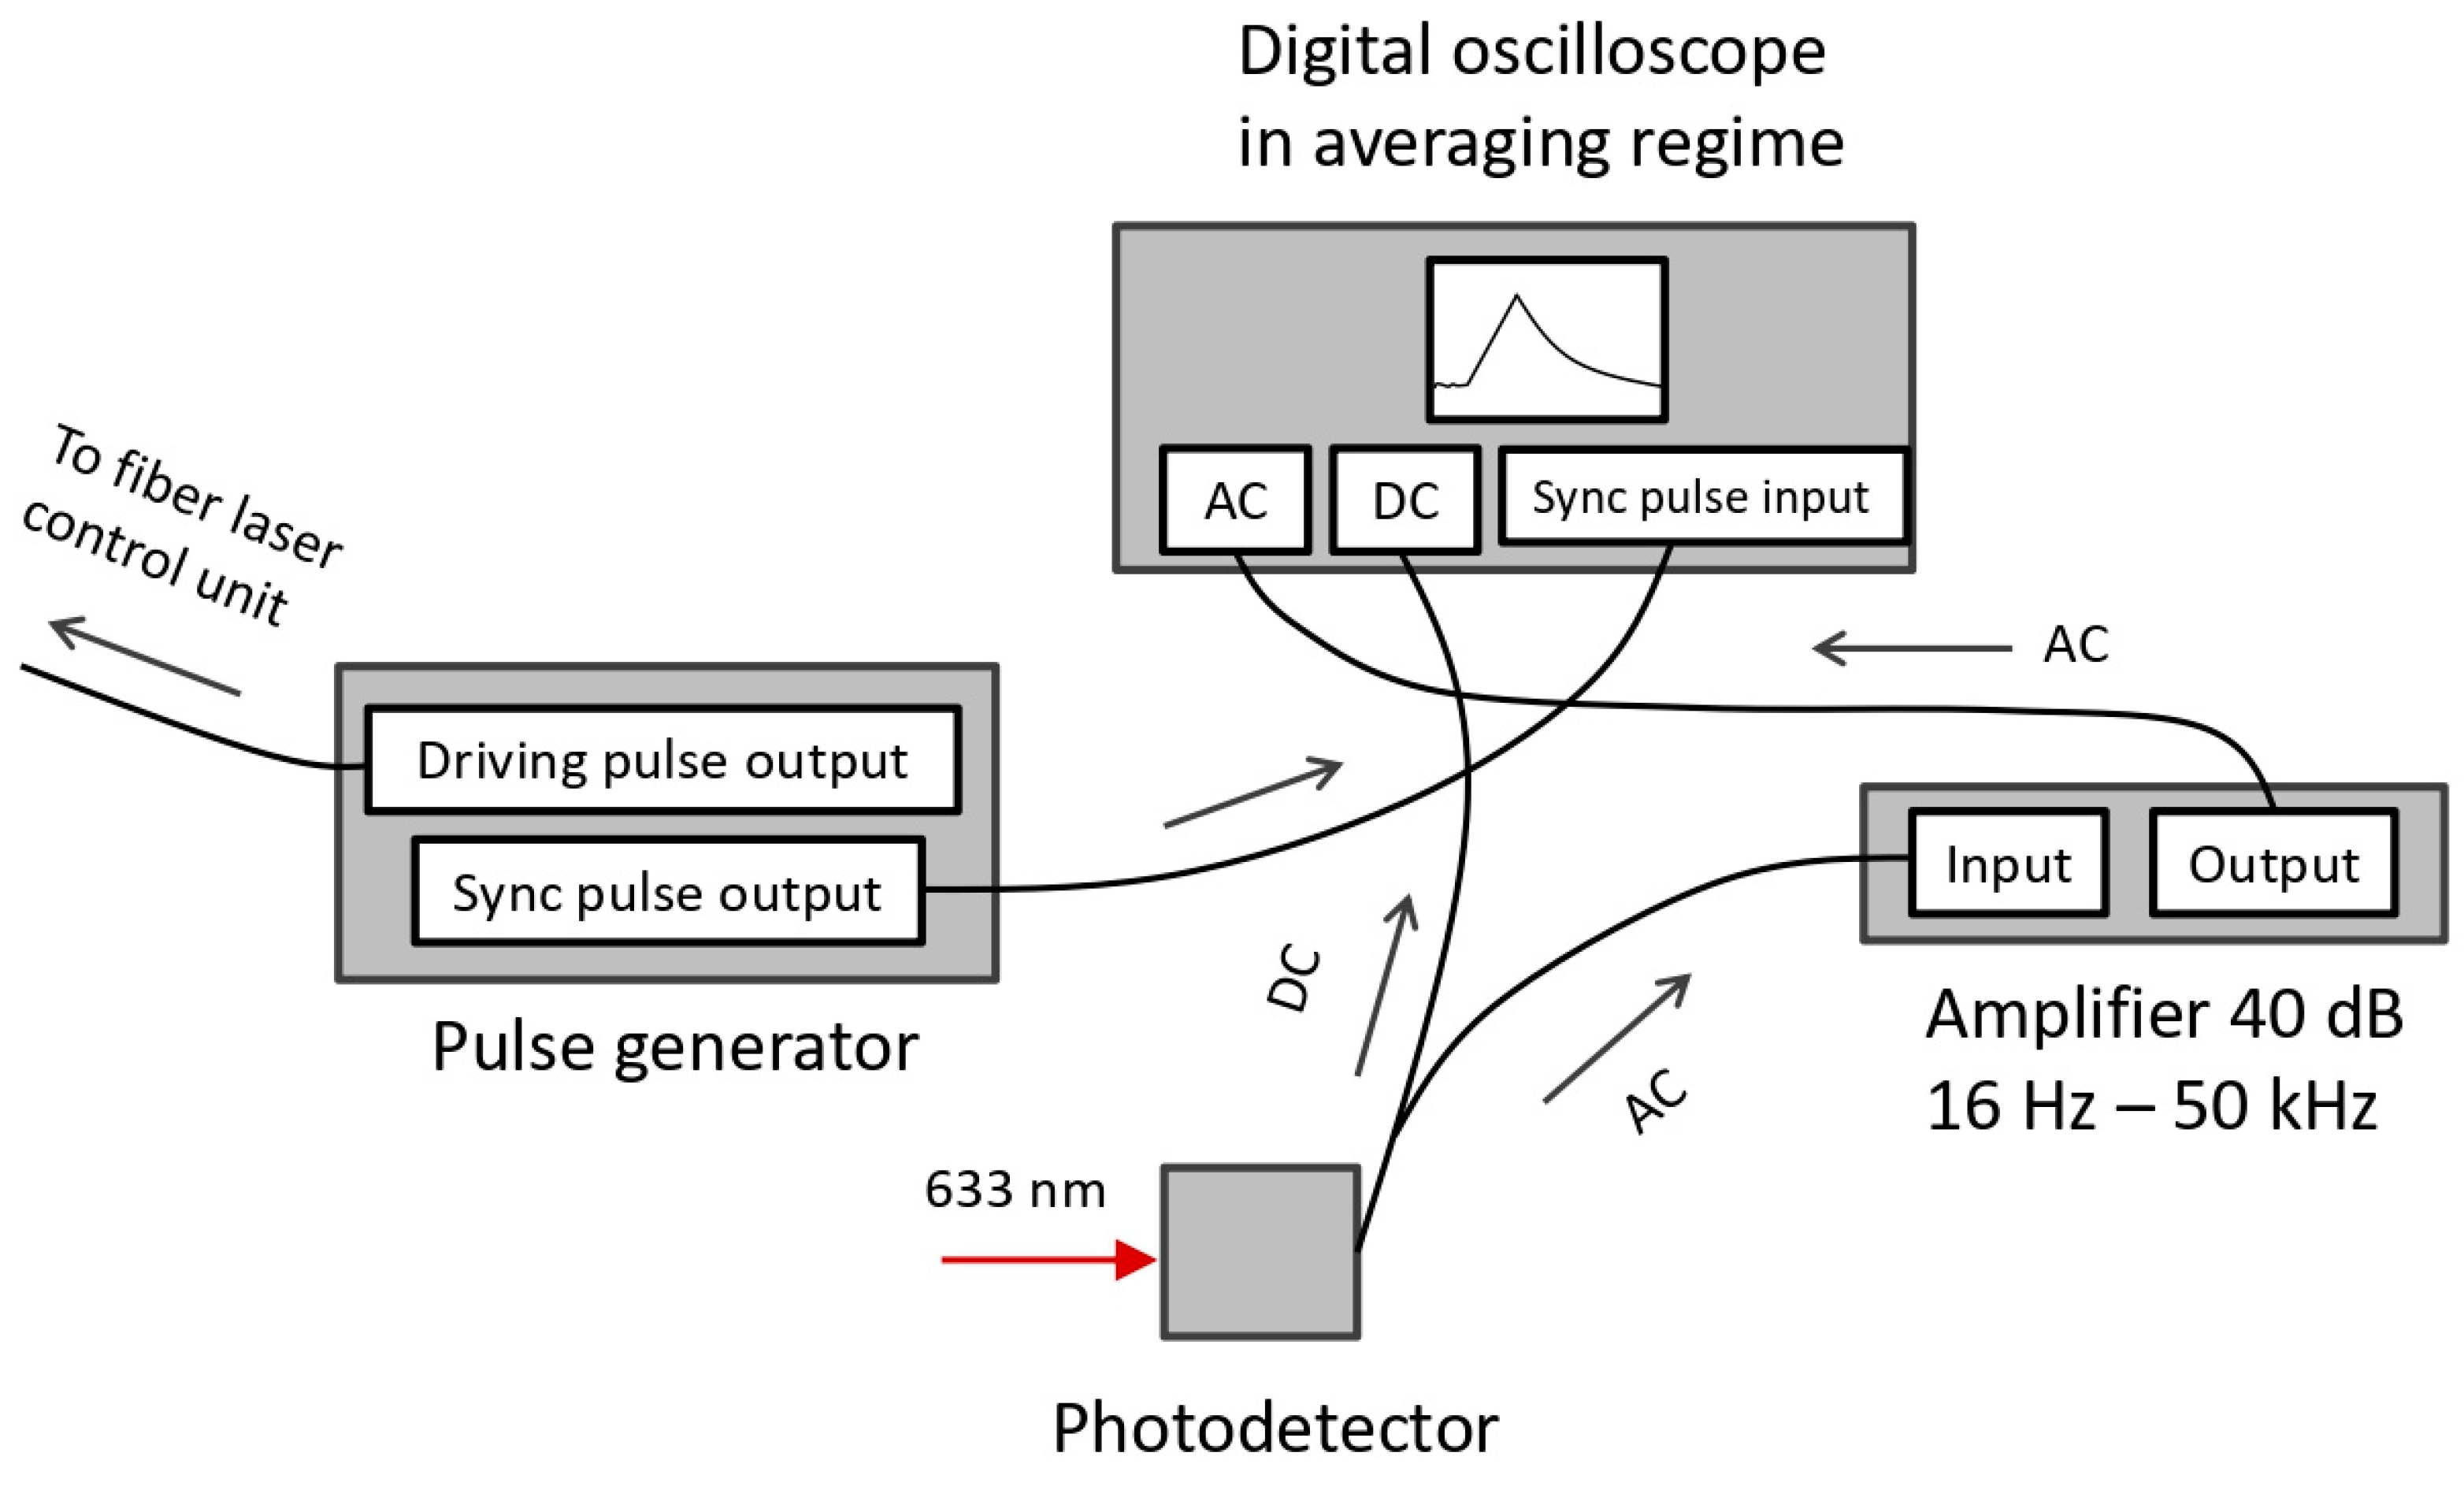
Figure 2 shows a block diagram of the electronic part of the setup. The driving pulse generator set the repetition rate as well as the duration of the heating laser pulse, which varied from 100 μs to 1000 μs in the experiment. The pulse repetition rate ranged from 10 Hz to 30 Hz. The output energy of the heating laser radiation pulse varied from 1 to 40 mJ due to the laser control unit. The radiation pulse had a quasi-rectangular temporal shape, the structure of the leading edge of which, with a duration of about 7 μs, was determined by the process of the build-up of the stationary generation of a fiber laser. The duration of the trailing edge, measured using a fast diode and a broadband oscilloscope, was ≈10
−8 s.
The beams of heating and probe radiation were coaxial. The probe beam waist was located near the heating beam waist in the center of the sample. Pulsed heating radiation created a time-varying, spatially inhomogeneous distribution of temperature deformations in the sample, and the diffraction of the probe beam by them led to the appearance of a time-varying component of the probe radiation power. This component was recorded using a system consisting of a photodiode with 70% quantum efficiency at the probe radiation wavelength, a diaphragm, a matte plate (to smooth out the effect of the inhomogeneity of the photodiode cathode and speckle structure on measurements [
23]), lens L
6 (see the description of
Figure 1), and an amplifier (a gain of 40 dB in the frequency band from 16 Hz to 50 kHz), in which its time-varying component of power was singled out. A 100-fold amplified pulse-time-varying component was fed to the input of a digital oscilloscope operating in the averaging regime. In a real experiment, averaging was performed by ≤10
4 pulses, which made it possible to significantly (by more than 100 times) reduce the maximum amplitude of the noise component.
Samples of ultrapure quartz glass (UQG) Suprasil 311 (“Heraeus”) [
24] and synthetic crystalline quartz (SCQ) (“Quartz technologies”) [
25] grown with the hydrothermal method were used for experimental research. Suprasil 311 quartz glass is made by the soot outside vapor deposition method. It is one of the most transparent quartz glasses on the world market and differs from other glasses of the Suprasil family by having a relatively high content of hydroxyl groups (~250 ppm), which increases its absorption for wavelengths around 1064 nm. In addition, the time-varying component, which was observed in the absence of samples when the probe and heating laser beams propagated in the ambient air, was measured.
All the presented samples had significantly different absorption coefficients and thermo-optical parameters P [
26] (an analog of dn/dT, which takes into account the stresses arising in the sample during local heating [
17]), as well as the speed of spreading of the temperature profile when the medium is heated by a spatially inhomogeneous laser beam. This speed can be characterized quantitatively by using the mentioned parameter
, derived from dimension considerations. Above, we conventionally called this quantity the heat diffusion time since the expression for
includes physical constants that affect the heat diffusion rate. The values of the constants for the samples used in the experiment are given in
Table 1.
In the experiments described below, the heating pulse duration was chosen to be 1 ms, which increased the sensitivity of measurements by almost 10 times compared to the case where the pulse duration was 100 μs [
17]. This enabled one to perform measurements on crystalline quartz samples with an absorption coefficient of α ~10
−7 cm
−1. As can be seen in
Table 1,
was ≈1/2 of the heating pulse duration.
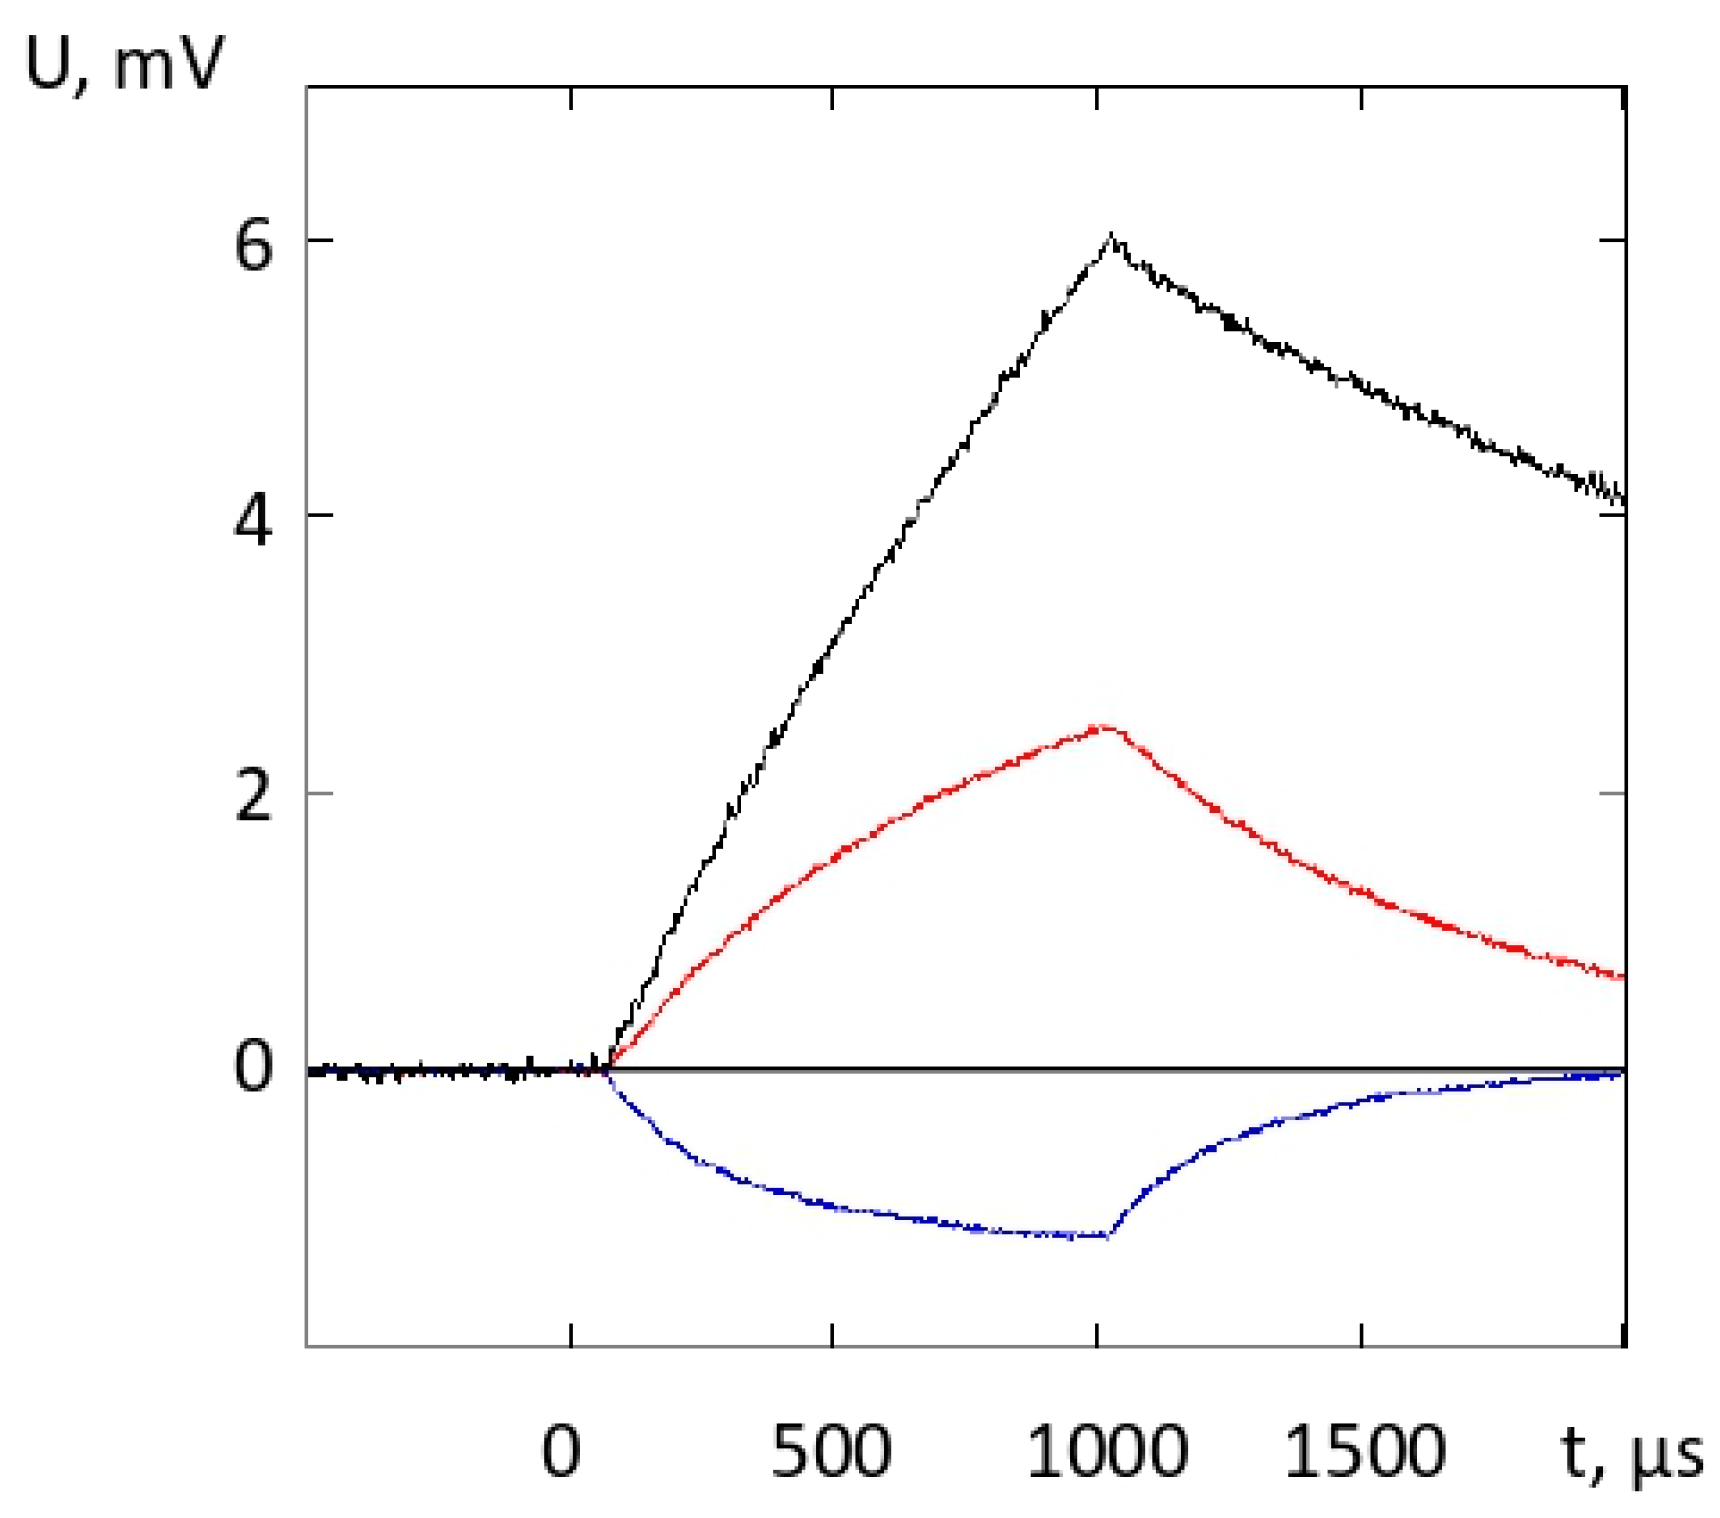
Figure 3 shows typical oscillograms of the time-varying component averaged over ≤10
4 events and obtained under conditions where the duration of the heating pulse was 1 ms, the pulse power was 33 W, and the pulse repetition rate was 30 Hz. The red curve was obtained with a crystalline quartz sample having an absorption coefficient of
α = 8 × 10
−6 cm
−1; the black curve, with a Suprasil 311 sample having an absorption coefficient of
α = 2.6 × 10
−6 cm
−1; and the blue curve, in the ambient air with an absorption coefficient of
α ~10
−9 cm
−1 [
17]. The figure shows that the heat diffusion effect leads to a drastic change in the oscillograms of the time-varying component. Thus, for air, for which
, which is a factor of 10 less than the heating pulse duration
, this distortion leads to a weak dependence of the pulse amplitude of the time-varying component on pulse duration. While in the case of quartz glass, for which
is about 2.5 times greater than
the growth of this amplitude over time shows only a slight deviation from linearity. For crystalline quartz, the degree of distortion of the oscillogram shape is intermediate between the two values considered. In this example, the Suprasil 311 quartz glass sample was used as a calibration sample for absorption measurements in crystalline quartz. All physical constants necessary for calculating thermo-optical parameters are known for these samples. The absorption coefficient of glass
α = 2.6 × 10
−6 cm
−1 was measured by us earlier [
17] for the heating pulse duration 100
, i.e., under the condition
, where the heat diffusion effect could be neglected with a sufficient degree of accuracy. In the presented experiment, the task was to calculate the absorption coefficient of crystalline quartz using the observed oscillograms for quartz glass and crystalline quartz.
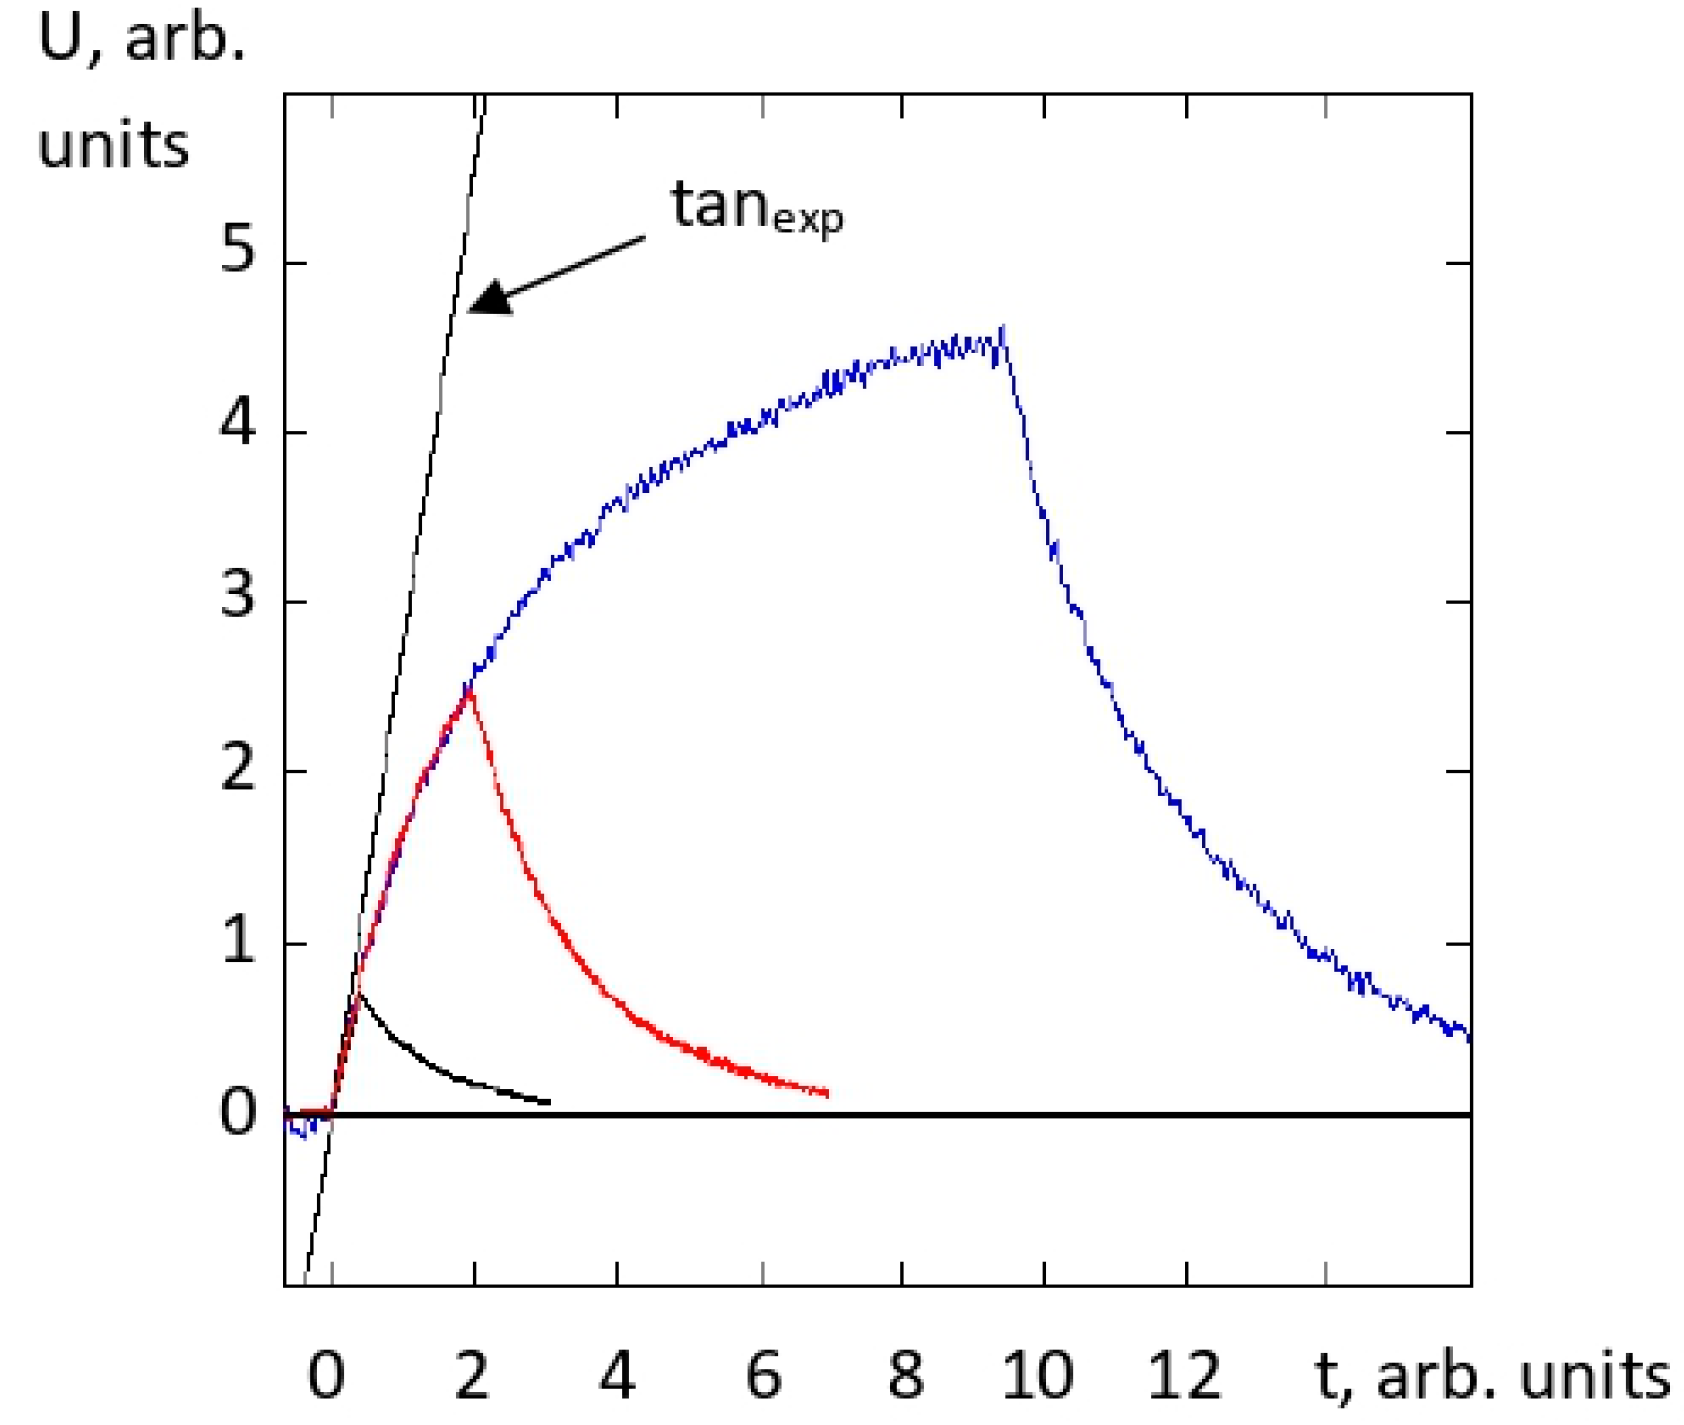
The fact that the observed distortions of the temporal shape were due to the effect of heat diffusion is confirmed by
Figure 4, which shows the oscillograms of
Figure 3 processed as follows. The oscillograms were plotted as functions of the times normalized to the corresponding heat diffusion time
, and the heights of the oscillograms were normalized to the products of the corresponding absorption coefficients and thermo-optical parameters.
Figure 4 clearly shows that, with the accuracy of the presented measurements, the oscillograms demonstrate similar shapes over the time interval of the heating pulse. These forms depend on heat diffusion times, thermo-optical parameters, and absorption coefficients, which determine the processes of heating and heat diffusion.
To correctly calculate the absorption coefficient under conditions of developed heat diffusion, we proposed a method [
22] based on the processing of experimental oscillograms of the time-varying component of the probe radiation power. To do this, a tangent to the oscillogram obtained for the sample under study was first constructed at the point corresponding to the moment the pulse started. The ratio between two values, namely, the value of the tangent line at the end of the heating pulse (this corresponded to the oscillogram value in the absence of heat diffusion) and the experimentally obtained value of the maximum pulse amplitude of the time-varying component, was calculated. This ratio determines the correction factor. The correction factor obtained in this way took into account the decrease in the amplitude of the time-varying component as a result of the heat diffusion process. This coefficient was employed as a correction multiplier, which was included in the formula for the linear dependence of the signal amplitude on the heating pulse energy, which is valid for short heating pulse durations. This procedure for the Suprasil 311 calibration sample was not performed due to the smallness of the correction. As a result, the absorption coefficient of the crystal was calculated using the obtained correction and the known value of the thermo-optical parameter of crystalline quartz, as well as the known absorption of quartz glass. In [
22], the resulting correction factor was equal to 1.7. The disadvantage of this method is the ambiguity of constructing tangent lines, which is related to both the noisiness of the oscillograms and the finite duration of the leading edge of the heating pulse due to the transient generation of the heating laser, as well as the finite resolution of the measuring system. These factors lead to great ambiguity in the results obtained during measurements in crystals with low absorption (~10
−7 cm
−1). The theoretical calculation presented below is intended to increase the accuracy of calculations and eliminate the mentioned ambiguity when measuring absorption coefficients
α~10
−7 cm
−1 in crystalline quartz. Moreover, this is also topical for measurements in synthetic ultrapure quartz glasses, the absorption of which can drop to the level of the fundamental absorption of SiO
2 material, which, according to theoretical estimates, is
α~5 × 10
−8 cm
−1 [
27] at wavelengths of 1000 nm.
3. Theory
Earlier in [
17,
20], calculations of the power of the time-varying component of the probe radiation were performed for short pulse durations of heating radiation, when the heat diffusion effect can be neglected. In this section, we calculate the power of the time-varying component of the probe radiation with an allowance for heat diffusion.
When solving this problem, we considered the deformation of the temperature profile
due to the heat conductivity effect described using the equation:
Here,
is the absorption coefficient of the heating wave (cm
−1) and
is the spatiotemporal distribution of the power density of the heating radiation (W/cm
2) with a profile corresponding to the Gaussian beam:
, where
,
is the wavelength of the heating radiation and
is the coordinate of the entrance face of the sample. We transform the equation to dimensionless form using the replacements
,
, and
(“old” refers to the old variables of Equation (1)). Then, we obtain an equation in dimensionless independent variables:
Here,
and
is a small parameter, the value of which in the experiment was ~4 × 10
−6. The smallness of the parameter is related to the slow change in the temperature distribution
along the
z coordinate in a focused single-mode laser heating beam compared with the corresponding transverse change. With an allowance for the value of the parameter, the term
in Equation (2) can be neglected. Then, in further expressions, all functions will depend parametrically.
The right-hand side of Equation (2) has a Gaussian dependence on normalized coordinates, which corresponds to a real heating beam,
. Then, the solution for
under zero initial conditions has the following form:
This solution describes the dependence of the temperature profile on the heating pulse duration. After the end of the heating pulse, the sample cooling process begins due to heat diffusion. The process is described by Equation (2) with a zero right-hand side and the initial condition in the form of the resulting solution for the temperature profile after heating. The solution
in this case has the following form:
Further, this function describing the spatiotemporal temperature distribution should be substituted into the right-hand side of the parabolic equation (its derivation is given in [
17] (Equation (2)) for the field
of the time-varying component of the probe beam propagating through a region disturbed by inhomogeneous heating:
In this equation,
is the field of an undisturbed Gaussian probe beam, and time t is included in the equation as a parameter. When solving this equation, we first perform a direct Fourier transform over the transverse coordinate r. The result is a differential equation with respect to the longitudinal coordinate z, which the inverse Fourier transform is performed after solving. Due to the Gaussian shape of the functional dependence of the right-hand side on the transverse coordinate, all the described transformations are trivial. Then, it is necessary to integrate over the diaphragm aperture the expression for the power density of the time-varying component
(c is the speed of light in vacuum, and n is the refractive index (λ = 633 nm) of the tested sample) in the cross section at a distance L from the exit face of the sample. The result is a formula for the time dependence of the power
of the time-varying component of the probing beam, which is incident on the photocathode:
where L is the distance from the exit face of the sample to the section projected by the lens L
6 onto the photodiode diaphragm (see
Figure 1); L
sample is the length of the tested sample; R is the radius of the diaphragm in front of the photodiode, which is normalized to a
h and taken with a coefficient corresponding to the projection into the section at a distance L from the exit face of the sample; and
is the current energy of the heating pulse. The coefficient K
contains a dependence on all possible variations of the geometric parameters of the scheme and the tested samples. The expression for the coefficient during heating, i.e., in the interval [0,
] has the following form:
where
is the power of the probe beam;
,
,
,
,
,
is the distance in the free space of the probe beam waist center from the reference plane, which, when the sample is installed, would be in its center;
is the wavelength of the probe radiation;
is the probe beam waist radius at the 1/e intensity decay level; and
is the absorption coefficient of the probe wave (cm
−1). Functions
are complex functions of real variables and have the following form:
To describe the process of the power decay of the time-varying component in the interval from to a certain t in Equation (7), the upper limit of integration over time should be replaced by (here, τpulse is the pulse duration normalized to the time ), and the variable t in the integrand should be replaced by t+θ).
4. Results and Discussion
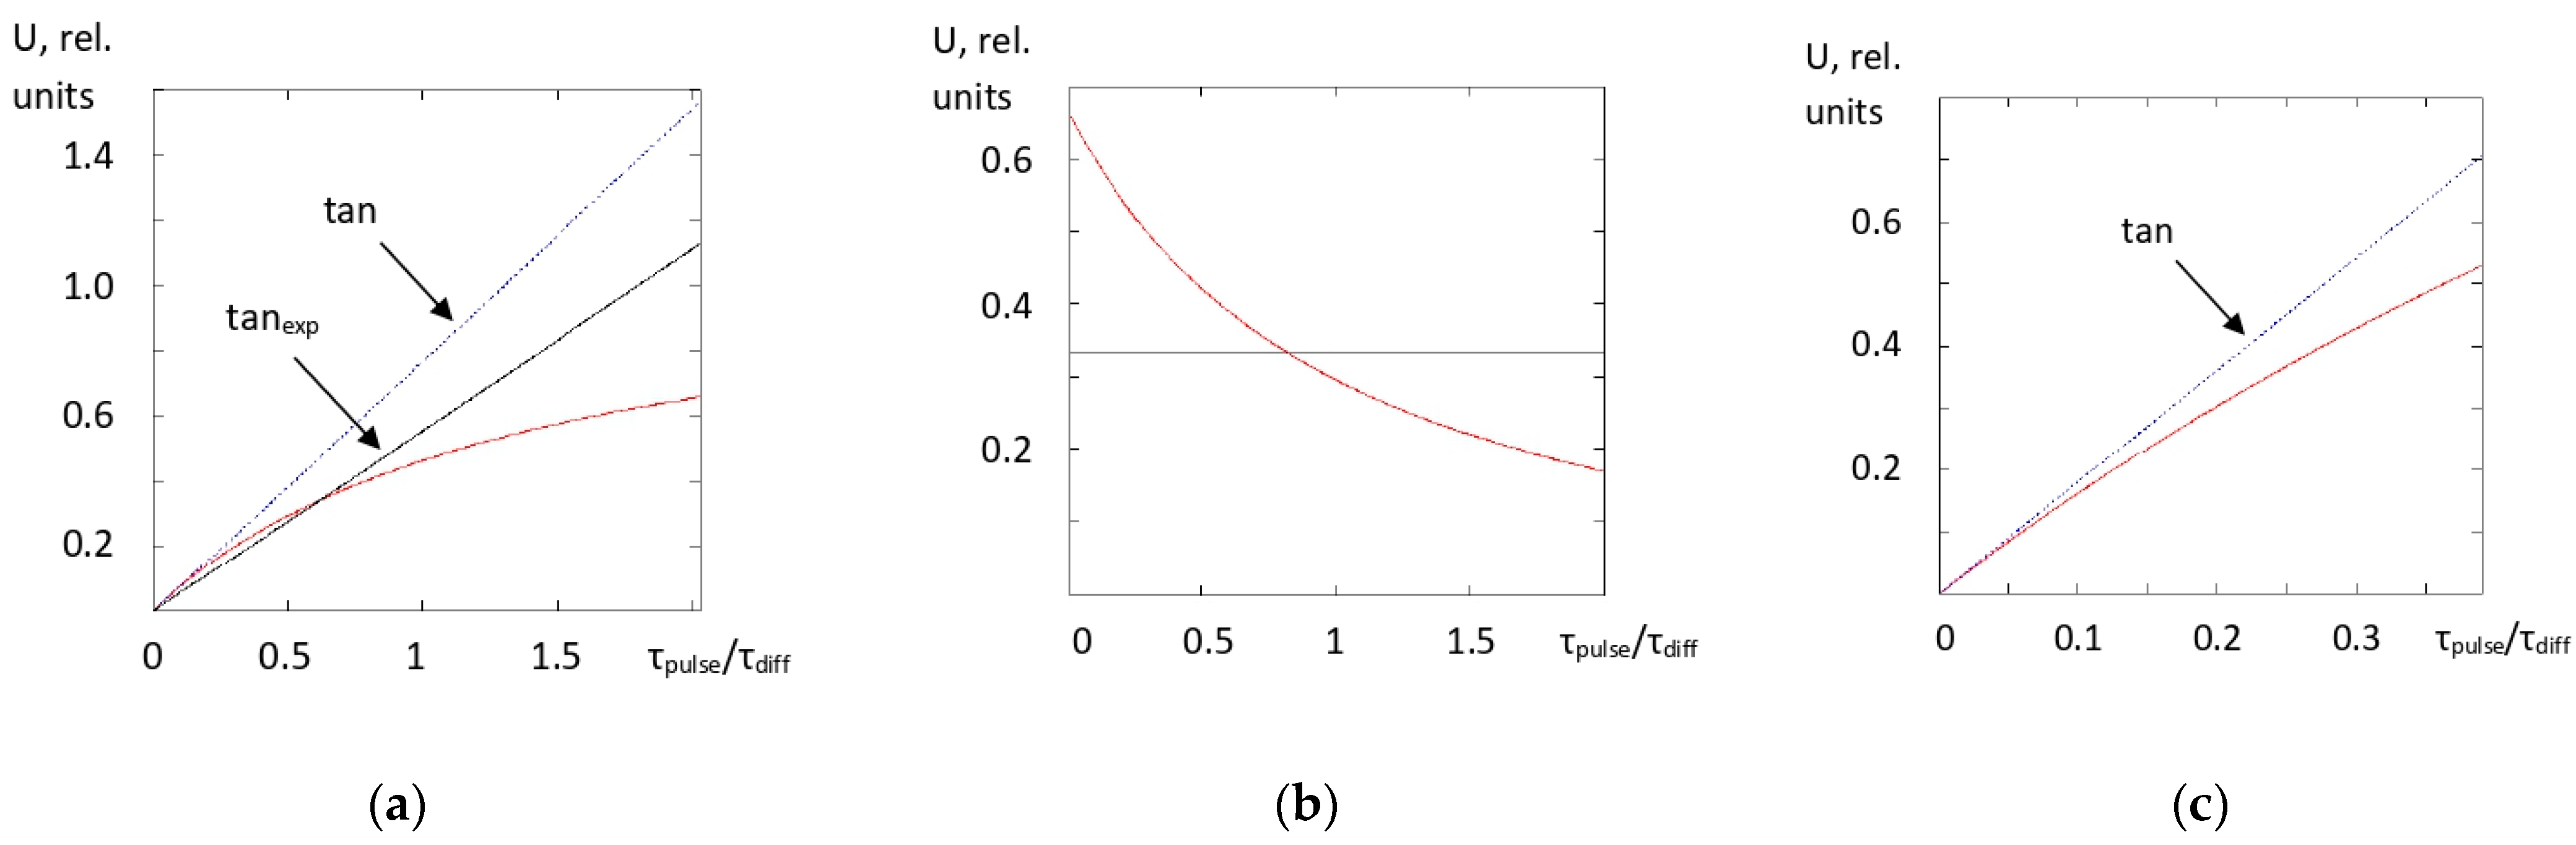
Figure 5 shows the calculated temporal waveforms for the SCQ (a) and UQG (c) samples. Time t is normalized to the heat diffusion time τ
diff.
Figure 5b demonstrates a typical waveform after the end of the heating pulse upon cooling of the UQG sample due to heat diffusion.
The calculation of the correction factor for theoretically obtained oscillograms was similar to the above calculation for oscillograms obtained in the experiment. First, waveforms of the time-varying component were constructed for the Suprasil 311 UQG calibration sample and the SCQ sample for two cases, namely, under conditions of developed heat diffusion and in its absence. In the second case, the amplitude of the time-varying component increases linearly with time. Its diagram coincides with the tangent to the functional dependence, describing the shape of the time-varying component at the moment the heating pulse starts. Further, the ratios of the maxima of the calculated signals, namely, 2.36 and 1.25 for SCQ and Suprasil 311, respectively, were obtained. The resulting correction factor for SCQ was calculated as k
diff = 2.36/1.25 = 1.73. Note that, despite the difference in the slopes of the theoretical and experimental tangents (
Figure 5a) due to the notable difference between the leading edge of the heating pulse and the rectangular one, the calculated and measured coefficients almost coincide. Such an exact coincidence is accidental due to the ambiguity in constructing tangents to the experimental curves, mentioned in
Section 2.
In addition to calculating the correction factor, to check the validity of the theory, the amplitude decay time of the time-varying component due to cooling of the heated area after the end of the heating pulse was also calculated. It should be noted that the cooling rate nontrivially depends on the transverse size of the temperature profile deformed during heating due to heat diffusion. For all three samples, the cooling conditions were markedly different, and the decay times normalized by were also expected to be markedly different.
Table 2 shows the results of calculations of the amplitude decay time of the time-varying component for Suprasil 311 UQG, SCQ samples, and ambient air. When calculating τ
diff for SCQ, the heat conductivity value was taken as the average of heat conductivities along the crystallographic axes C and a
i. The τ
1/2_exp column shows the measured decay times at a half-maximum signal amplitude of the time-varying component after the end of the heating pulse. The signal amplitude decay time was measured using digital oscillograms obtained by averaging over 10
4 pulses, and the level of the noise component did not exceed 1/100. The uncertainty of the obtained values did not exceed ±1%. For the SCQ sample, measurements were taken in high-absorption regions of the crystal, for which the ambient air effect is masked by the high absorption of the material. In the SCQ sample, laser radiation propagated along one of the second-order crystallographic axes, and the polarization of the heating radiation was parallel to the third-order axis. The remaining two columns of the table show the calculated and measured decay times normalized to the heat diffusion time.
From
Table 2, it can be concluded that the calculated values of the decay time of the power of the time-varying component for all three samples, namely, SCQ, Suprasil 311, and ambient air, are in good agreement (
Table 1). Thus, comparison of the results of nontrivial calculations with experimentally measured ones indicates the reliability of theoretical calculations.
To conclude, we note that for quartz glasses, with a further increase in the duration of the heating pulse from 1 ms to 5 ms, which corresponds to the relation
, the amplitude of the time-varying component shown in black in
Figure 5 increases by about three times and will be 18 mV while maintaining the noise component level (≈15 µV). Accordingly, the measurement sensitivity (the signal-to-noise ratio is 1) in this configuration of the experimental scheme will be 2 × 10
−9 cm
−1. Measuring absorption at such a low level can find application in the problem of determining the concentration of impurities in ultrapure quartz glasses.


