Article

A Self-Paced P300 Healthcare Brain-Computer Interface System with SSVEP-Based Switching Control and Kernel FDA + SVM-Based Detector

1
Institute of Mechatronic Engineering, National Taipei University of Technology, Taipei 10608, Taiwan
2
Department of Mechanical Engineering, Chung Yuan Christian University, Chungli 32023, Taiwan
*
Author to whom correspondence should be addressed.
Submission received: 31 December 2015 / Revised: 19 April 2016 / Accepted: 28 April 2016 / Published: 12 May 2016

Abstract

:
This paper presents a novel brain-computer interface (BCI)-based healthcare control system, which is based on steady-state visually evoked potential (SSVEP) and P300 of electroencephalography (EEG) signals. The proposed system is composed of two modes, a brain switching mode and a healthcare function selection mode. The switching mode can detect whether a user has the intent to activate the function selection mode by detecting SSVEP in an ongoing EEG. During the function selection mode, the user is able to select any functions that he/she wants to activate through a healthcare control panel, and the function selection is done by detecting P300 in the user’s EEG signals. The panel provides 25 functions representing 25 frequently performed activities of daily life. Therefore, users with severe motor disabilities can activate the system and any functions in a self-paced manner, achieving the goal of autonomous healthcare. To achieve high P300 detection accuracy, a novel P300 detector based on kernel Fisher’s discriminant analysis (kernel FDA) and support vector machine (SVM) is also proposed. Experimental results, carried out on five subjects, show that the proposed BCI system achieves high SSVEP detection (93%) and high P300 detection (95.5%) accuracies, meaning that the switching mode has a high sensitivity, and the function selection mode has the ability to accurately detect the functions that the users want to trigger. More important, only three electrodes (Oz, Cz, and Pz) are required to measure EEG signals, enabling the system to have good usability in practical use.

1. Introduction

Brain-computer interface (BCI) has recently received increasing attention in many research fields including neuroscience, neuroengineering, robotics, and machine learning. BCI has been considered a promising technology to improve the quality of life of patients with severe motor disabilities, such as locked-in patients, patients with stroke, and elderly or chronically ill people. Without using any neuromuscular pathways, BCIs allow such patients to communicate with outer environments or control prostheses by means of identifying their brain activities [1,2]. Brain activity can be measured by different technologies, such as electroencephalogram (EEG) [3,4], near-infrared spectroscopy (NIRS) [5,6,7,8], and functional magnetic resonance imaging (fMRI) [9,10]. Among these, EEG is the most frequently adopted due to many advantages such as lower cost, better portability, and higher temporal resolution. An EEG-based BCI system extracts features from scalp EEG and translates the features into commands. Applications include motor imagery-based BCIs [11,12], P300-based BCIs [13,14,15], emotion recognition [16,17], and steady-state visually evoked potential (SSVEP)-based BCIs [18,19]. In this paper, EEG is adopted as the input of the developed BCI.
SSVEP and P300 are visual evoked potential and event related potential (ERP) in EEG, respectively [20,21]. SSVEP is a response to visual stimuli at specific flicker frequencies, where the response is the increase of EEG spectral power at the same frequency or near the flickering frequency [22]. SSVEP has a good signal-to-noise ratio (SNR) [23]. To induce SSVEP, a subject needs to keep gazing at a device which generates continuous visual stimuli at a specific flickering frequency, such as a flashing LED. However, a long-term continuous flickering stimulus may result in visual fatigue. Therefore, SSVEP is useful in designing a brain-controlled switch [18]. In contrast with SSVEP, P300 is relatively suitable for the design of a function BCI with multiple options. P300 is a response to an anticipated but infrequent stimulus, and typically appears in EEG signals around 300 ms after the stimulus onset. In P300 BCIs, a visual stimulus matrix is often designed and utilized to elicit P300 potentials in EEG signals, and the visual stimuli provided by this matrix follow the so-called oddball paradigm: rows and the columns of the matrix are intensified in a random order, and one at a time. Examples include the P300 word speller BCI [24], where a 6 × 6 visual stimulus matrix is designed to provide users with 36 different options (characters and numbers), and the BCI system for upper-limb robotic rehabilitation [25]. Therefore, P300 BCIs can provide users with more options than SSVEP ones. However, EEG typically exhibits a very low SNR [26]. Therefore, P300-based BCIs rely on multiple repetitions of a stimulation sequence in order to increase the SNR of the P300 ERP [20], which results in a long EEG recording procedure.
In this paper, we develop a healthcare BCI system by integrating the advantage of each of the two visually evoked EEG potentials. The system is composed of two modes, one is the switching mode and the other is the function selection mode. The switching mode allows a user to turn on the function selection mode whenever he/she wants by detecting the SSVEP in ongoing EEG. In the function selection mode, we design a healthcare function selection panel consisting of a 5 × 5 visual stimulus matrix, and the 25 elements of the matrix represent 25 different daily activities that are frequently performed. The function selection mode allows the user to choose the element that he/she wants (called target element) by detecting P300 in ongoing EEG signals. The function represented by the target element is activated as soon as the target element is detected by the BCI system. Users can turn on the system and control multiple devices in a self-paced manner by means of the proposed healthcare BCI system, achieving the objective of autonomous healthcare.
In addition to the development of the BCI system, in this paper we also address one challenging issue related to the accuracy of the target element detection in the element selection mode. The accuracy of target element detection accuracy is directly related to the one of P300 detection. Previously, P300 detection was treated as a binary classification problem of P300 and non-P300, where P300 refers to an EEG epoch containing a P300, and non-P300 refers to an EEG epoch that does not carry a P300 potential. Accordingly, any binary classifiers can serve as the P300 detector for which the input is an EEG epoch. However, it is difficult to detect P300 in single-trial EEG due to low SNR. The input to a P300 BCI is, in general, the average EEG over a number of trials, resulting in a time-consuming EEG data collection stage. Therefore, the selection of a robust P300 detector which can provide robust P300 detection in noisy EEG signals (i.e., EEG averaged over a few trials) is one of the critical issues in the BCI community.
Previously, various classifiers have been proposed and tested. A boosting approach was applied to the orthogonal least square classifier in the work of Hoffmann et al. [27]. Linear discriminant analysis (LDA) method was applied to classify P300 and non-P300 potentials in [26]. The Bayesian LDA (BLDA)-based P300 detector was further used in the different P300 BCIs [28,29]. In addition to LDA, the support vector machine (SVM) has also gained wild acceptance in P300 BCIs [24,25,30,31]. In addition to being the classifier, feature extraction also plays a key role in EEG recognition. Principal component analysis (PCA) has been commonly used as a feature extraction and dimensionality reduction tool. LDA has also been used for dimensionality reduction in various pattern recognition problems, such as face recognition [32,33] and electromyography (EMG) classification [34]. In the BCI community, LDA is often employed as a classifier [20,26,35,36,37]. Recently, LDA has also been introduced to EEG-based emotion recognition as a dimension reduction method [17]. However, EEG has the property of nonlinearity. Features extracted by PCA or LDA may not provide satisfactory representations due to their linear natures. In this paper, we chose the kernel Fisher’s discriminant analysis (Kernel FDA) method [38] as the feature extraction. Kernel FDA is a nonlinear version of LDA. It maps a set of data into a higher dimensional feature space where the mapped data distribution becomes linear, and then performs the regular LDA in this space. Kernel FDA has shown successful results in various applications, such as face recognition [32] and EEG-based emotion recognition [17]. To achieve high target function accuracy, we developed a novel P300 detector by combining Kernel FDA and SVM in this paper.
The rest of this paper is organized as follows. In Section 2, the overview of the proposed healthcare BCI system is provided. Settings and apparatus, such as EEG recoding sites and preprocessing, are given in Section 3. In Section 3, we introduce the switching and option selection modes in details, including the proposed SSVEP and P300 detection strategies in the two modes, respectively. Experimental results and discussions are provided in Section 4. Conclusions are drawn in Section 5.

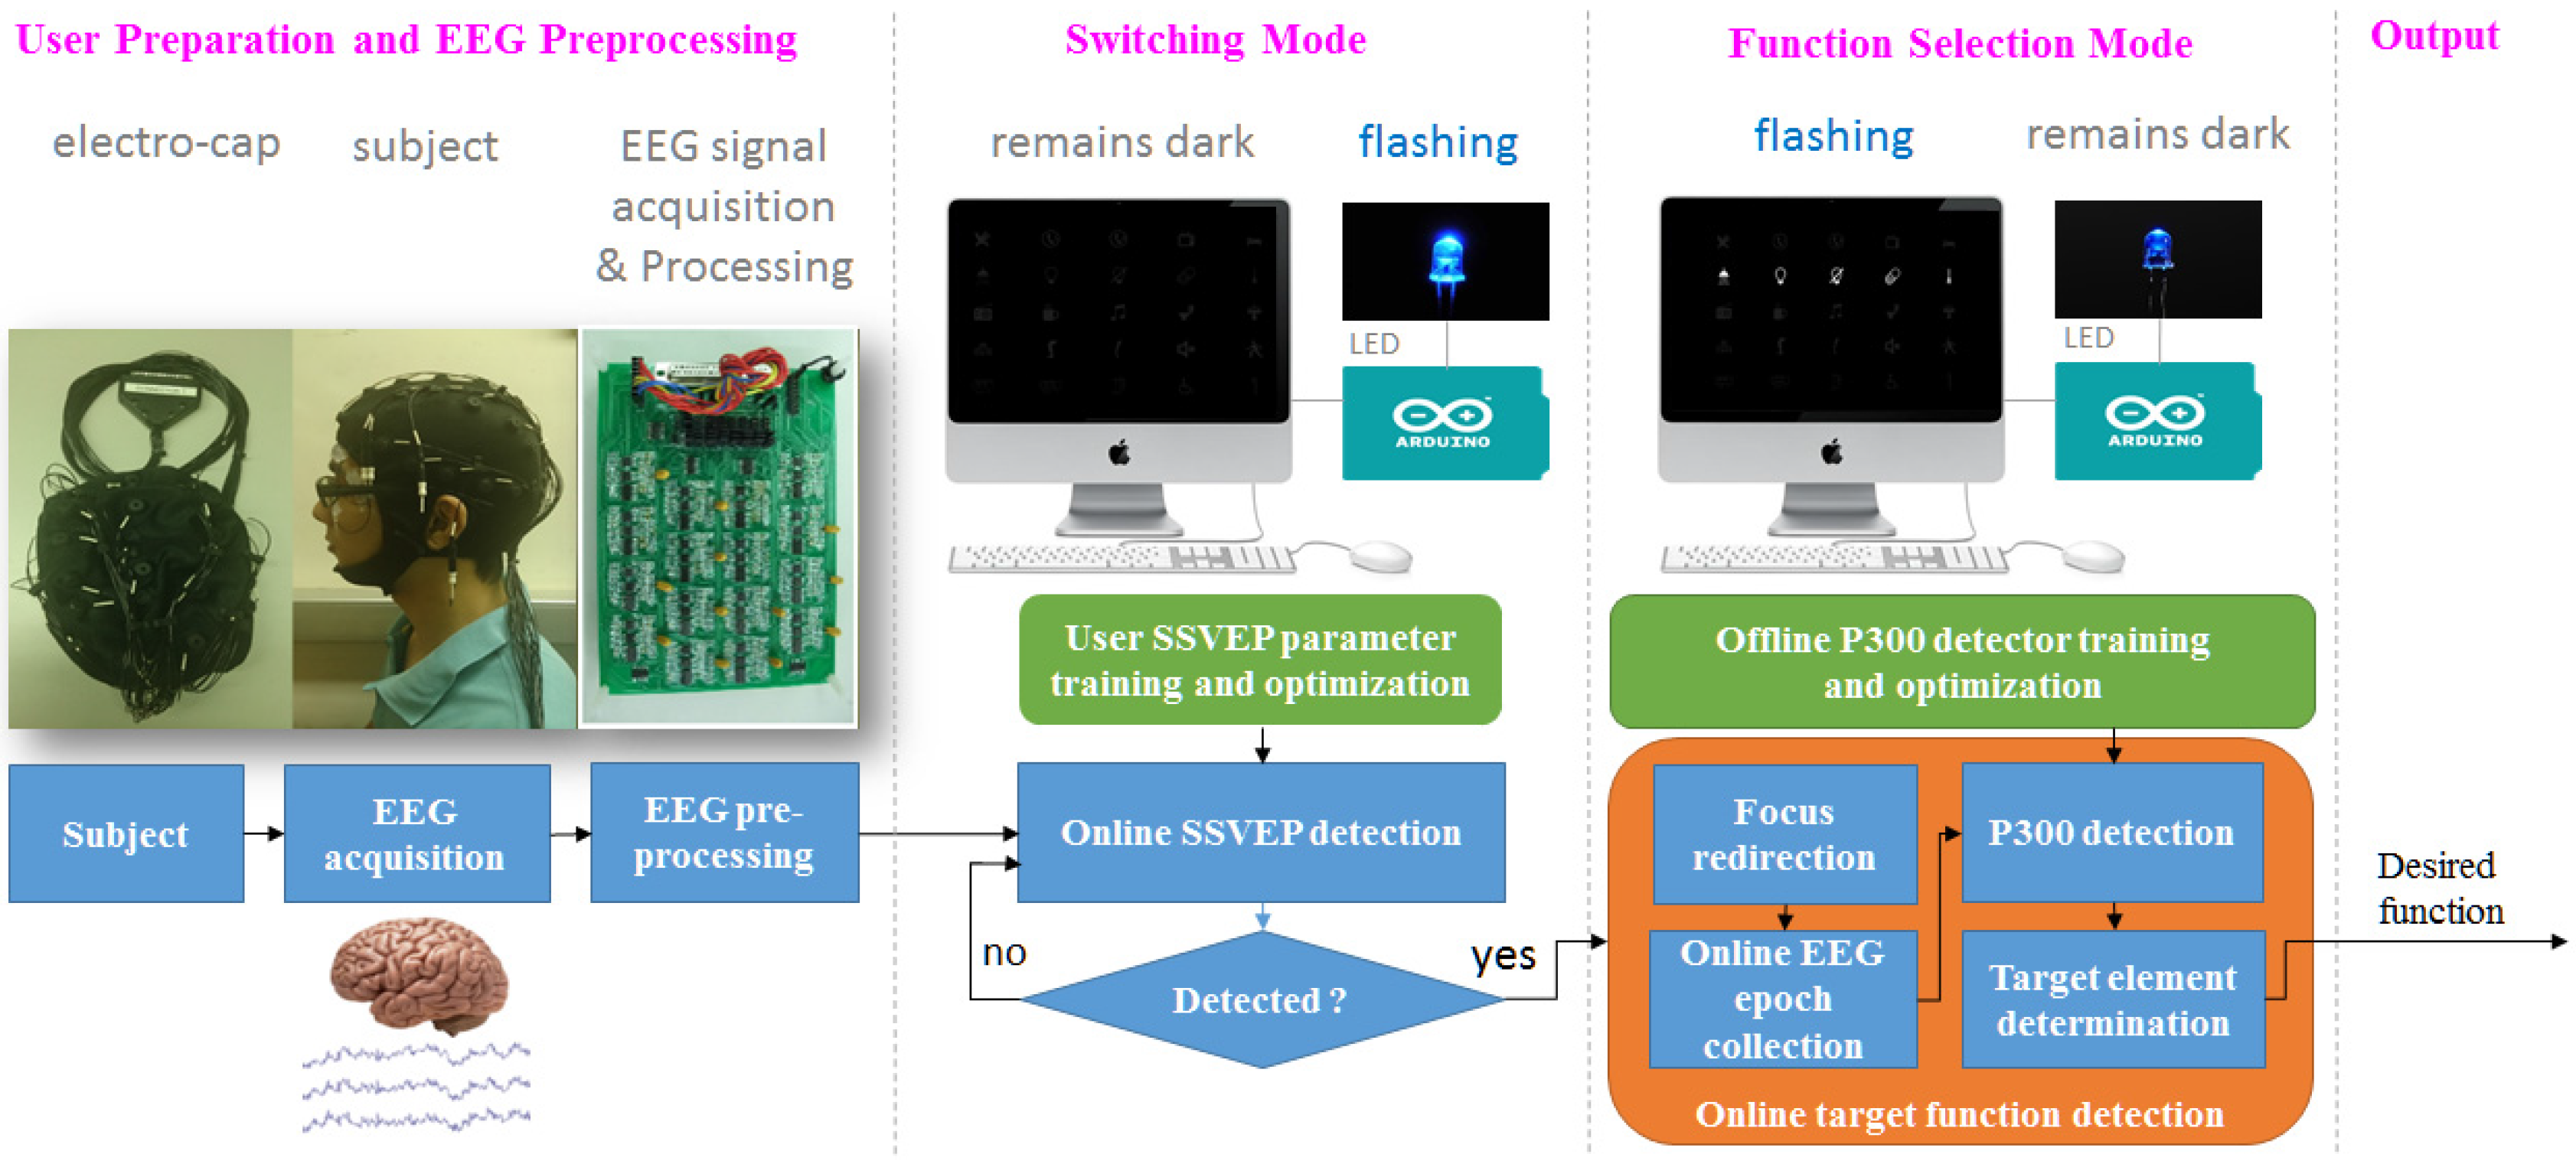
2. Overview of the Healthcare BCI System

The proposed system is composed of a switching mode and a function selection mode. When the system operates in an online scenario, a small LED lamp located beside the computer keeps flashing (flickering) at a specific frequency in this switching mode, as illustrated in Figure 1. Also, the user’s EEG is recorded continuously, and the healthcare function selection panel in the computer screen remains dark (see Figure 2a). The flickering LED lamp serves as a source that provides the user with a continuously flickering stimulus. This stimulus can induce SSVEPs in the user’s EEG as long as the user keeps gazing at the LED lamp for a few seconds. Therefore, if the user wants to open the function selection mode, he/she simply needs to gaze at the flickering LED lamp until the function selection mode is turned on. The function selection mode is activated once an SSVEP is detected in the ongoing EEG.
The function selection mode allows the user to choose the function that he/she wants to activate. In this mode, there is a 3-s focus redirection period followed by an online EEG epoch acquisition period. During the focus redirection period, the whole healthcare function selection panel is intensified, as shown in Figure 2b, and the user needs to redirect his/her focus to the element that he/she wants to choose, i.e., the target element within the 3 s. During the online EEG epoch acquisition period, the rows and the columns of the panel are intensified in a random order, one column or one row at a time. Each row or column intensification triggers an EEG epoch in a time-lock fashion. Figure 2c shows that the second row of the panel is being intensified. After performing a number of rounds of row-column intensifications, the average EEG epochs over rounds are fed into the P300 detector for P300 detection, one at a time. Finally, the BCI system determines the target element according to the P300 detection results, and activates the function that the target element represents. All the periods/procedures mentioned above, including EEG processing, SSVEP detection, offline P300 detector training and online target element detection, are introduced in details in Section 3.

3. Methods

3.1. EEG Acquisition and Preprocessing

Our system records EEG using the five monochannels (Ag/AgCl electrodes) (Compumedics Inc., Charlotte, NC, USA) located at Cz, Pz, O1, O2, and Oz. The electrodes at Cz and Pz are used for detecting P300, and the three on the occipital lobe are for SSVEP detection. The ground is on the forehead, and the references are A1 and A2. The measurement sites follow the International 10–20 system. A 32-channel electro-cap (Quick-Cap 32) produced by Compumedics Inc. (Charlotte, NC, USA) is used for recording the six-channel EEGs. The electro-cap is connected to a self-designed eight-channel EEG signal acquisition and preprocessing circuit board, shown in Figure 1. The multi-channel EEG signals acquired by the electrodes are directly sent to the circuit board for analog signal processing, including band-pass filtering (1–70 Hz) and amplification. The processed signals are then sent into to an analog-to-digital converter produced by National Instrument (DAQ-6212 of NI, Austin, TX, USA). The digitized signals are transferred to the computer via USB port of the data acquisition (DAQ) at a sampling frequency of 250 Hz.

3.2. Switching Mode

The electro-cap is attached to a user. An electrolyte gel (Compumedics Inc., Charlotte, NC, USA) is applied to reduce the impedances of the electrodes. The user sits at the position around 70 cm in front of a liquid crystal display (LCD). A light (LED lamp) is located beside the computer. It can flash at different flickering frequencies and different duty cycles, which are controlled by an Arduino board (Arduino UNO R3) (Arduino, Strambino TO, Italy) connected to the computer. Figure 3 shows the Arduino board and the LED lamp used in our BCI system.

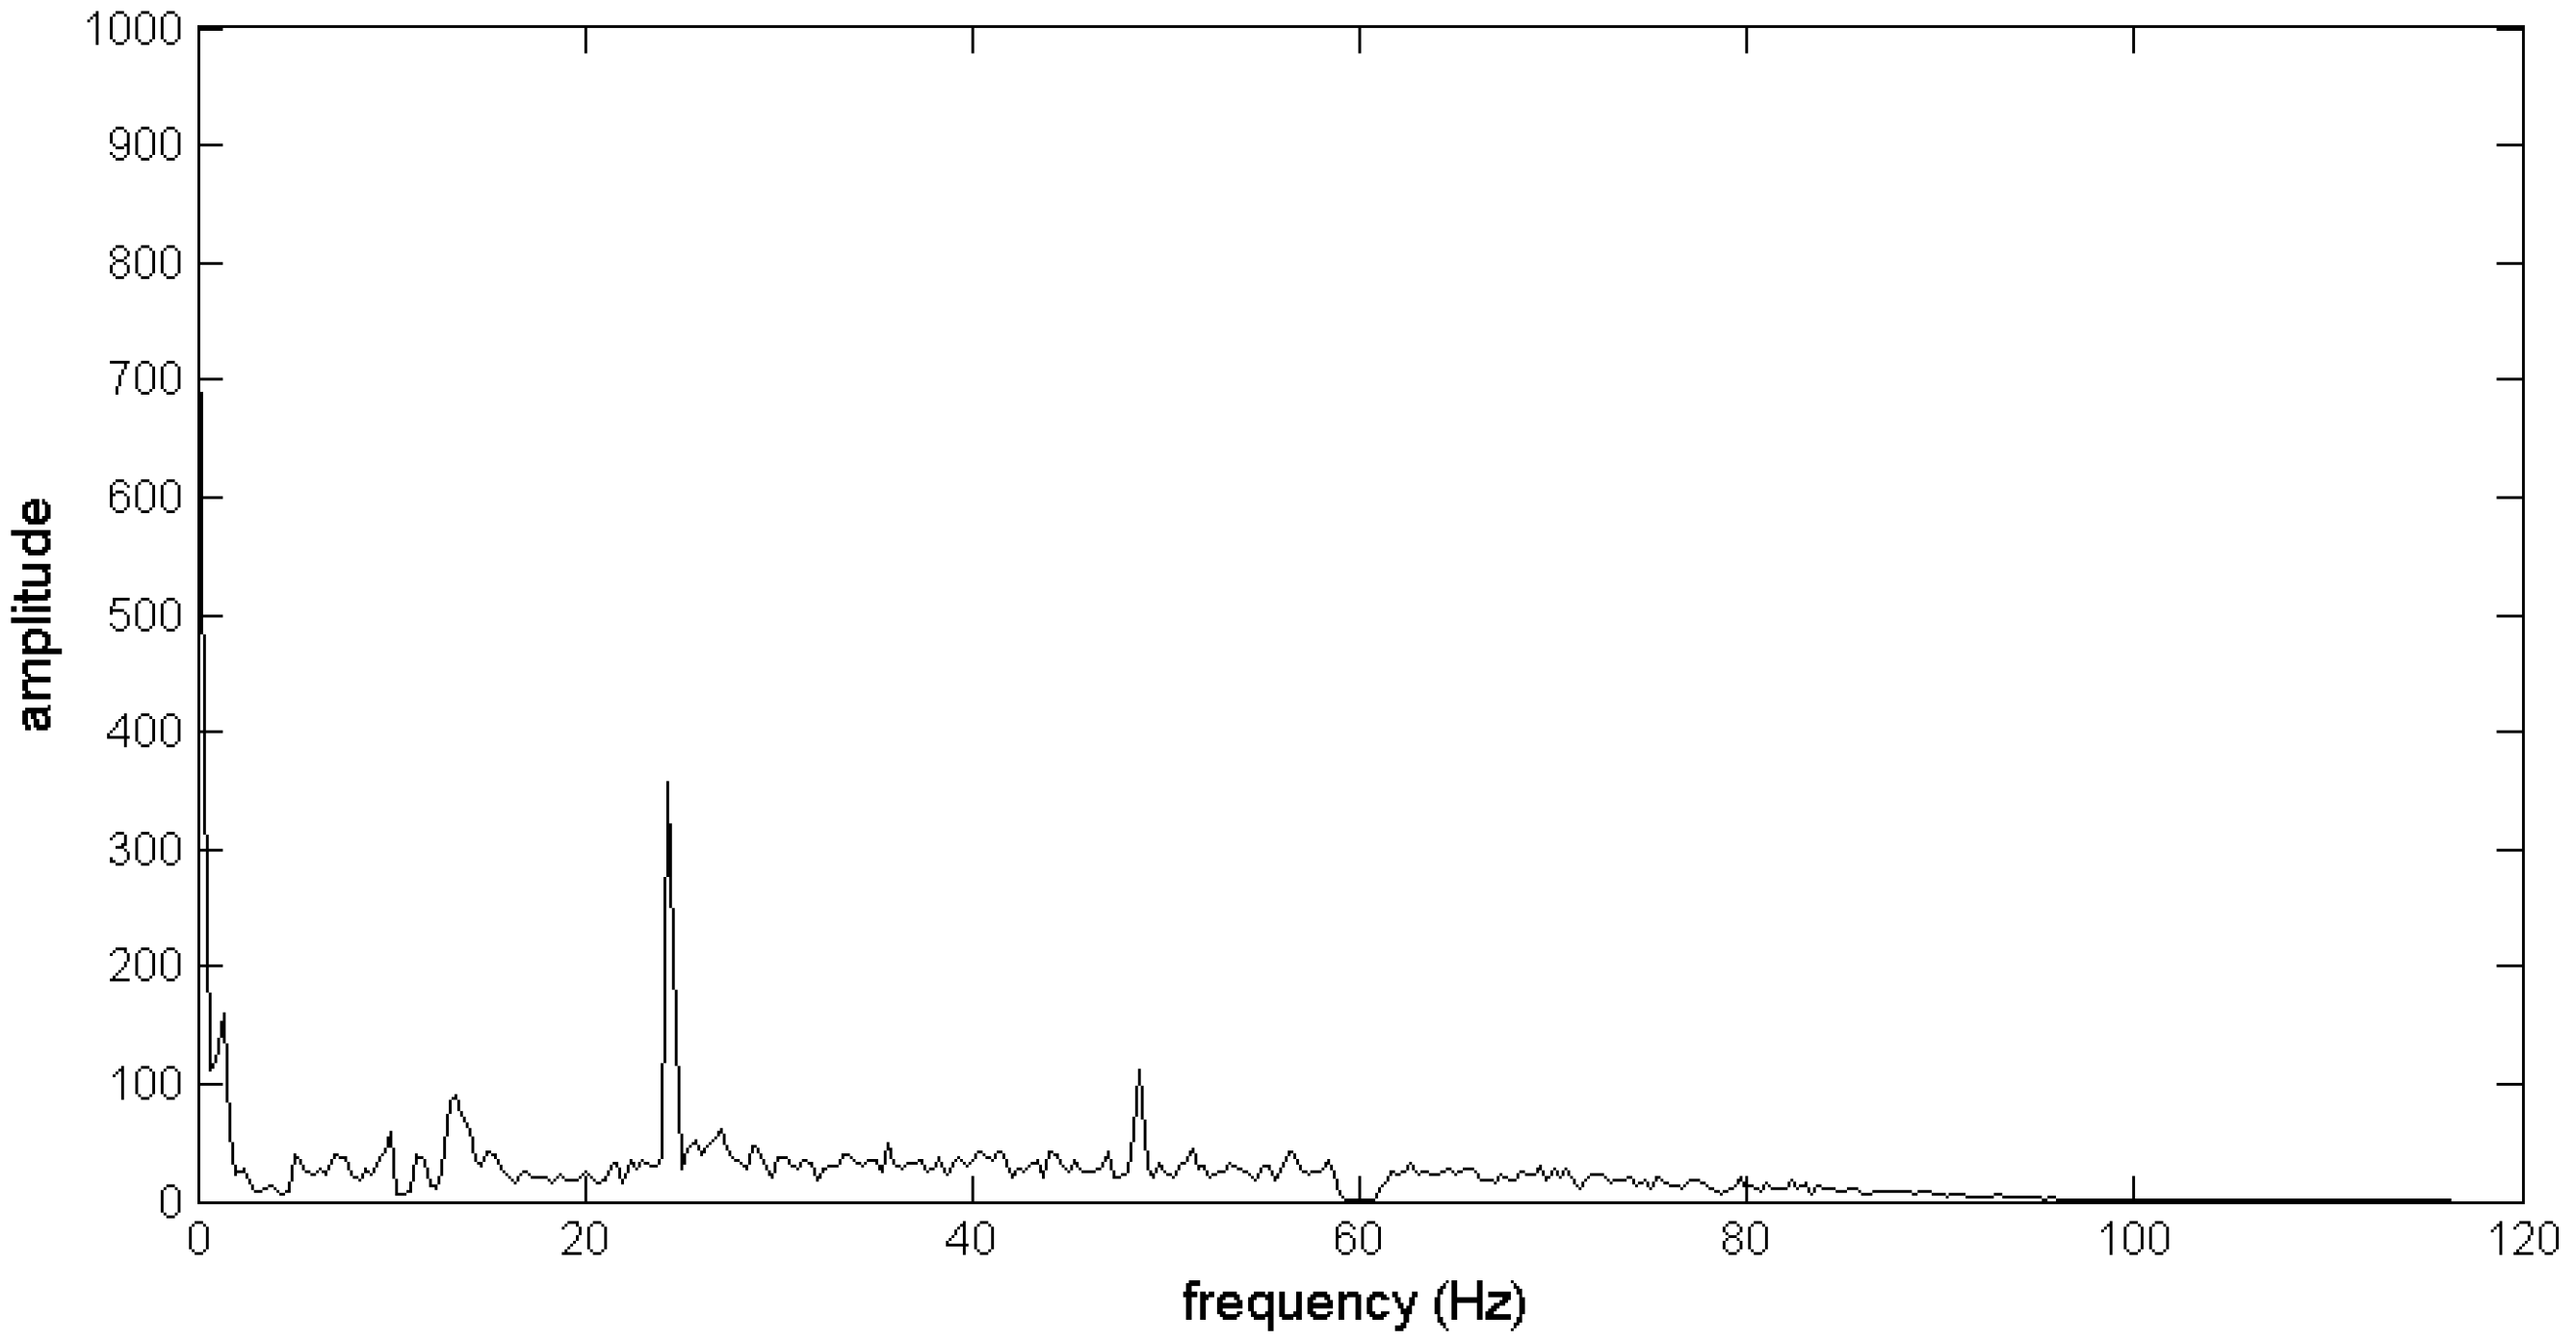
3.2.1. Online SSVEP Detection

When the switching mode is activated, the LCD lamp keeps flickering at a specific frequency ω f and duty cycle, where the duty cycle means the ratio of lighting time to one flickering period [39]. Our EEG recording devise acquires EEG signal from the user and detects SSVEP in the ongoing EEG with a time window of 3 s and a shifting length of 1 s. The system detects SSVEP in every EEG window according to the criterion: an SSVEP is detected in a window if the relative change (RC) value
R C = P f P r P r
computed from the window signal is larger than a threshold T, where P f is the average of the spectrum powers within the narrow band [ ω f 0.1 , ω f + 0.1 ] centered at the flickering frequency ω f , and P r is the average power of the interval [ ω f 2   , ω f + 2   ] Hz. The switching mode is terminated and the next mode (i.e., the function selection mode) is activated as soon as an SSVEP is detected.

3.2.2. SSVEP Parameter Training and Optimization

Different flickering frequencies and duty cycles result in different RC values, and the best combination of the two SSVEP parameters for each user may be different. To find the best parameters for each user, an offline training stage is performed to test 11 flickering frequencies (20 Hz, 20.41 Hz, 20.83 Hz, 21.28 Hz, 21.72 Hz, 22.22 Hz, 22.73 Hz, 23.26 Hz, 23.81 Hz, 24.39 Hz, and 25 Hz) and five different duty cycles (10%, 30%, 50%, 70%, and 90%) for each user. Figure 4 shows the spectrum of the 3-s EEG signal recorded at Oz, respectively, where the flickering frequency of the LED is 24.39 Hz. We can observe from this spectrum the peaks at its first (24.39 Hz) and the second (48.78 Hz) harmonic frequencies. Additionally, the peak corresponding to the second harmonic is much smaller than the one corresponding to the first harmonic. However, there is no peak at its third harmonic (73.17 Hz), which could be due to the fact that the EEG signal has been band-passed (1–70 Hz) in an EEG preprocessing circuit board. The best combination of the two SSVEP parameters results in the largest RC value. When the BCI system performs online with a user, the best flickering frequency and the best duty cycle associated with this user are adopted. By doing so, optimum sensitivity of online SSVEP detection is achieved.

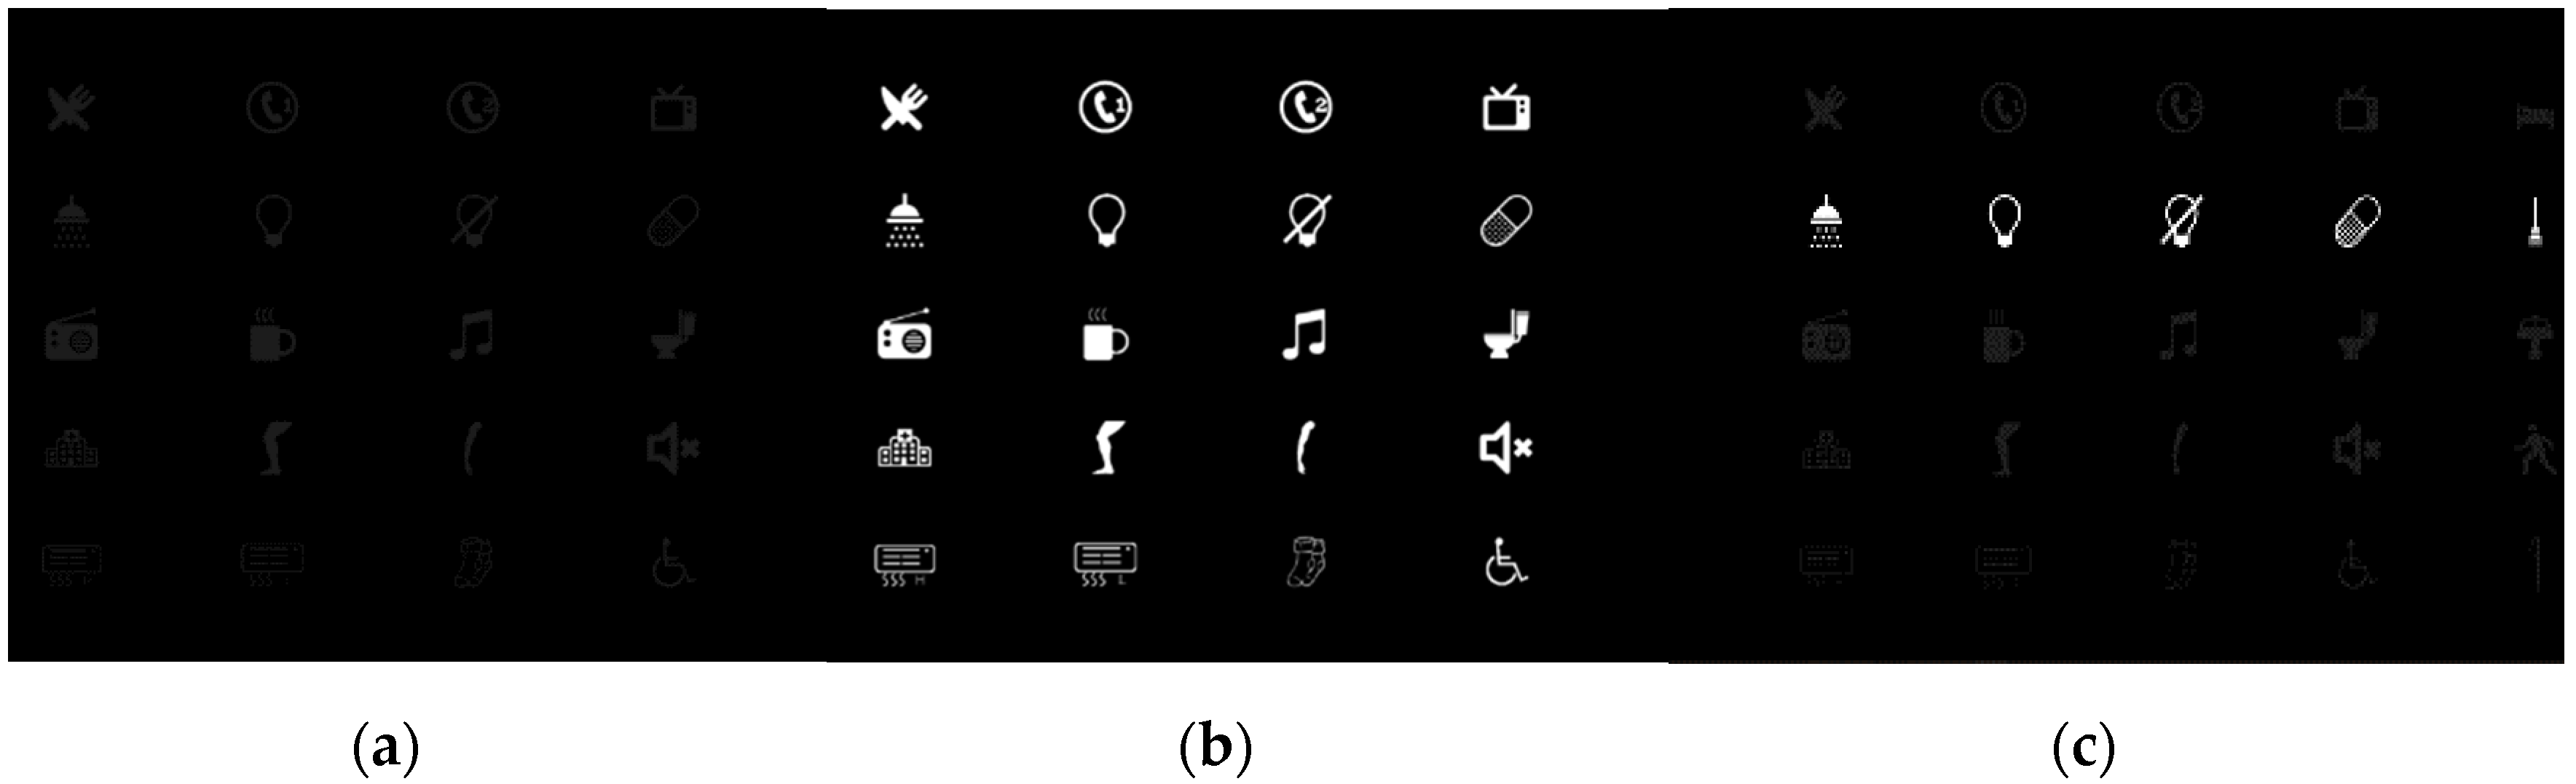
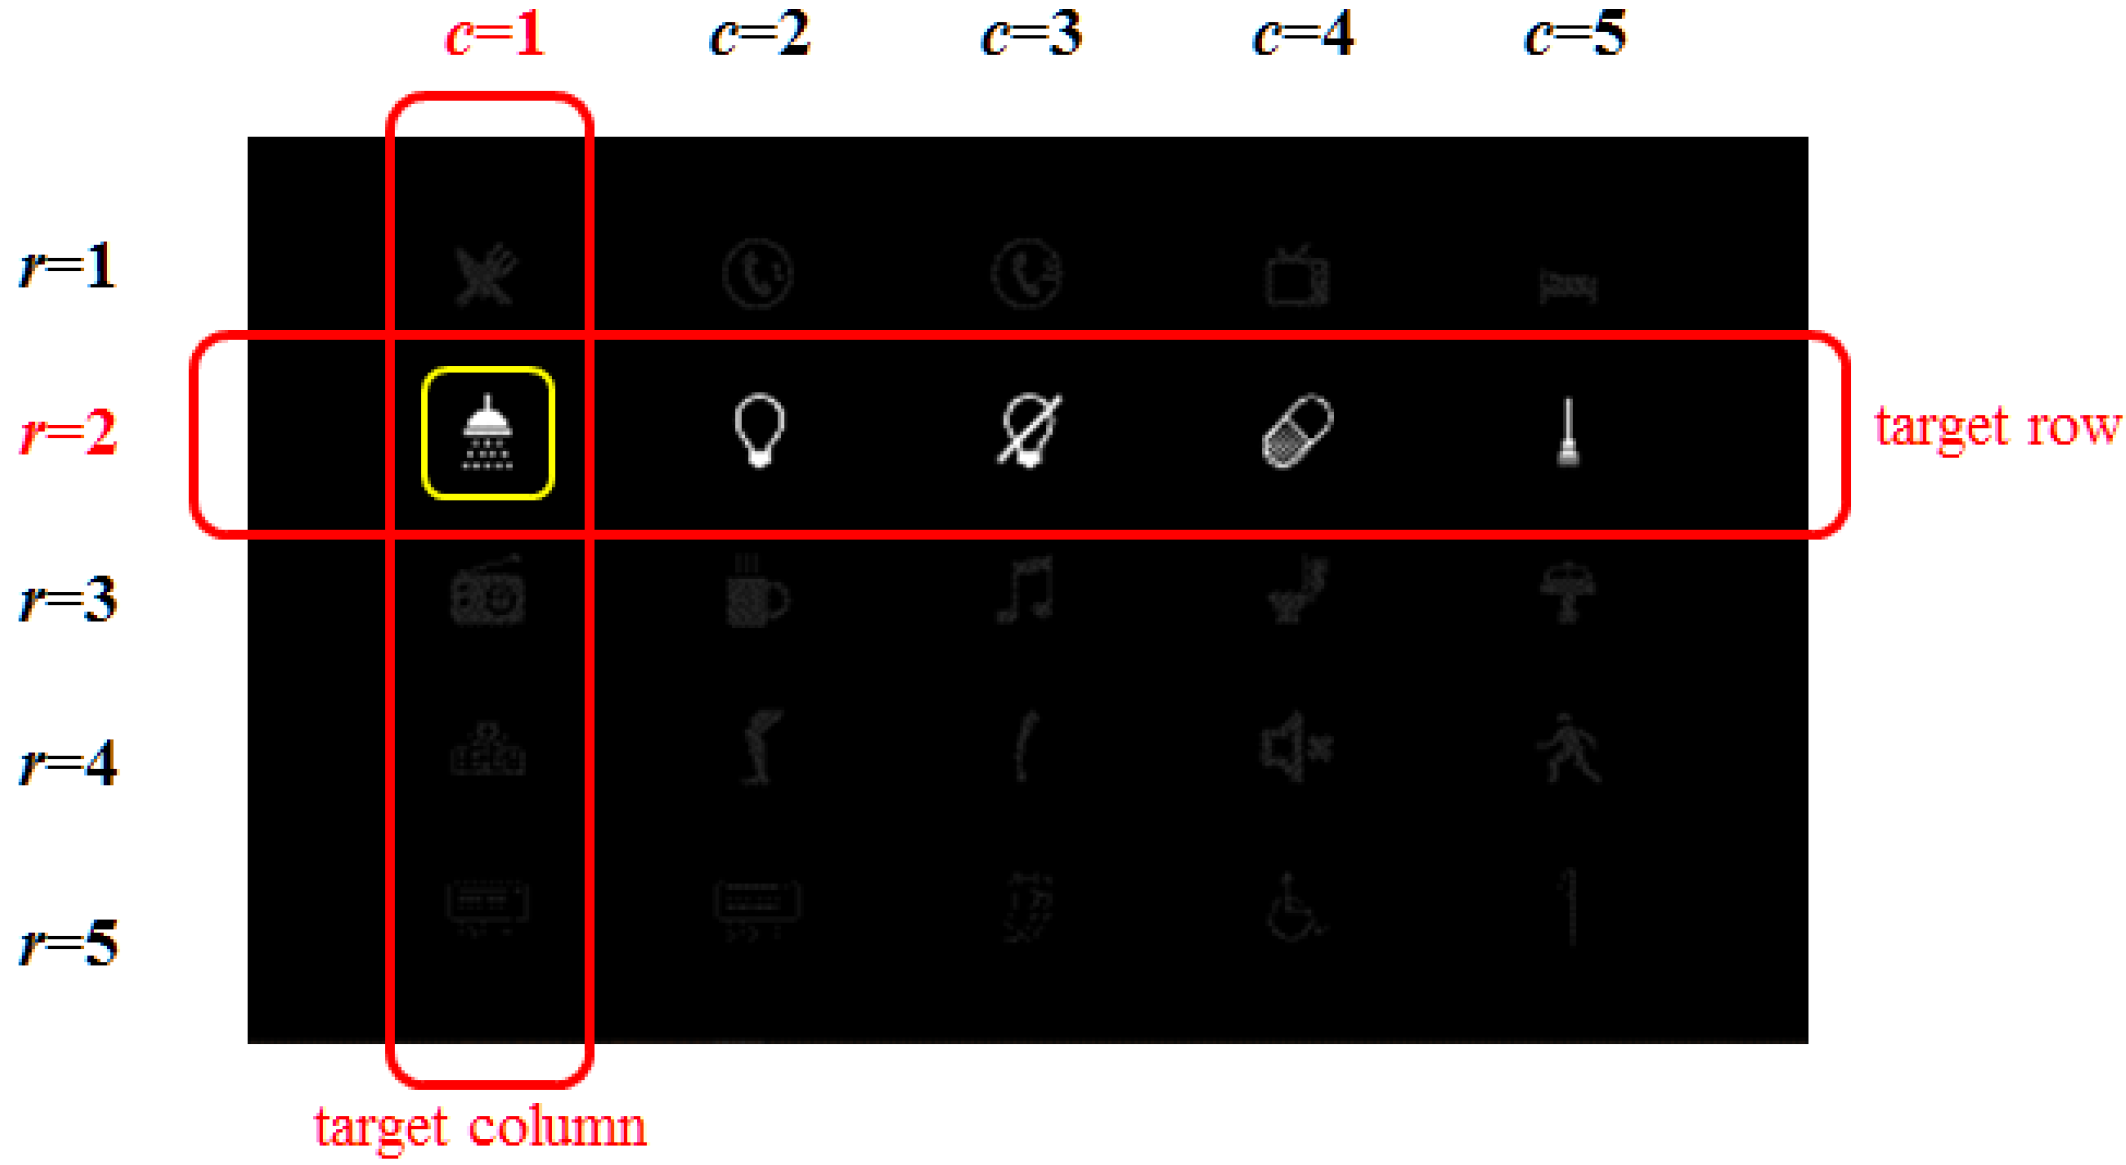
3.3. Function Selection Mode

In this subsection, we introduce the offline P300 detector training and then provide the details of online target element detection.

3.3.1. Offline P300 Detector Training and Optimization

EEG Training Data Collection and Labeling

When the training data collection procedure begins, one of the elements in the healthcare function selection panel is highlighted as the target element for 2 s, and the rest of the 24 elements remains dark. The user needs to keep focusing on the target element during the following N-round intensification process.
As soon as the 2-s attention catching ends, the system initializes an N-round intensification process, where within each round, 10 randomly-ordered visual stimuli are presented. Each stimulus is the intensification of either one row or one column, and is presented for 100 ms. After a 75 ms inter-stimuli interval, the next stimulus will be presented. Therefore, the time for each round of intensification is 1.675 s. The computer embeds a stimulus code into the ongoing EEG data stream so that a 500 ms EEG epoch starting from each stimulus onset is segmented from the ongoing EEG in a time-lock fashion. For each intensification, the 500 ms EEG epochs acquired from different channels are concatenated to one single vector as
z = [ z 1 ( 1 ) , , z 1 ( N s ) , z 2 ( 1 ) , , z 2 ( N s ) , , z N c ( 1 ) , , z N c ( N s ) ] t
where N c and N s denote the number of channels and the number of samples, respectively, and t denotes the vector transpose. In this study, N s = 125 because sampling frequency is 250 Hz, and N c = 2 (Cz and Pz). After the 10 random-ordered intensifications are presented, this round is over and the next round starts after a pause of 0.5 s. After the N-round intensification process is over, we obtain N vectors as (2) from the same row or column intensification. Averaging the vectors over rounds yields
z r = 1 N j = 1 N z r j , r = 1 , , 5 z c = 1 N j = 1 N z c j , c = 1 , , 5
where z r j R n ( z c j R n ) denotes the vector from the intensification of the rth row (cth column) in the jth round, and n = N c × N s . Among the five average z r vectors, the one from the intensification of the target row is labeled as a positive data (P300), and the remaining four are negative data (non-P300). Here, the target row refers to the row where the target element is located, as illustrated in Figure 5. Similarly, among the five average z c vectors, the one from the intensification of the target column is labeled as a positive data (P300), and the remaining four are labeled as negative data (non-P300). Therefore, two P300 and eight non-P300 data are collected after the N-round intensification process ends. The above N-round intensification process was repeated 40 times, and each time the target element is randomly determined by the computer. Accordingly, some of the elements in the panel serves as the target more than once. Users can take a 10–20 s rest after each process. Finally, 80 P300 and 320 non-P300 data are obtained from each user.

P300 Detector – Kernel FDA Training and Testing

In the training stage, KFDA maps the training data z i R n , i = 1 , , L into a higher dimensional feature space F using a nonlinear mapping φ : z R n φ ( z ) F , where the training data includes P300 and non-P300 ones, and then solves the maximization problem as
max v v t B v v t W v
where
B = 1 L p = 1 2 n p ( 1 n p q = 1 n p φ ( z p q ) ) ( 1 n p r = 1 n p φ ( z p r ) ) t   and   W = 1 L p = 1 2 q = 1 n p φ ( z p q ) φ t ( z p q )
are the inter-class inertia and intra-class inertia, respectively, z p q is the qth training data in the pth class, and n p is the number of training data in the pth class. In this paper, the first and the second classes are defined as the positive (P300) and negative (non-P300) classes, respectively. The matrix W in (5) is in fact a covariance matrix in F, and thus the mapped data in the expression of W need to be centered in advanced [38]. However, the nonlinear mapping is unknown. Baudat et al. have applied kernel tricks to provide a mapped data centering method (see Appendix C of [38] for detailed derivation). Moreover, the maximization problem in (4) is equivalent to the following eigenvalue resolution:
λ W v = B v
The vector v = i = 1 L a i φ ( x i ) is the eigenvector of W 1 B , where a i are the expansion coefficients for v . Performing the eigenvector decomposition on the L × L kernel matrix K = ( K i j ) yields L normalized expansion coefficient vector a for each vector v : a = a / a t K a , where K ( z i ,   z j ) = K i j = φ ( z i ) · φ ( z j ) is the kernel function, and a is the eigenvector of K . The training state of Kernel FDA is over after the L coefficient vectors are computed. In the testing stage, the projection of a test data z onto the ith vector v i is obtained by
x i = v i · φ ( z ) = j = 1 L a j i φ ( z j ) · φ ( z ) = j = 1 L a j i K ( z j , z ) , i = 1 , , L
where a j i is the jth expansion coefficient of v i . By choosing the first d projection values (d < L), a d-dimensional vector x = ( x 1 , , x d ) t R d is formed, which is an EEG feature that will be sent into the SVM classifier. We choose the radius basis function (RBF)
K ( z i , z j ) = exp ( z i z j 2 / 2 σ 2 )
as the kernel function in this paper, where σ is the parameter of the RBF kernel. Since the RBF kernel is used, the space F is of infinite dimension [40].

P300 Detector – SVM Training and Testing

Formulation of SVM (9)–(10) and the kernel function expressed in (8) are also provided in [32]. A set of training data { x i ,   y i } i = 1 L   is given, where x i R d , and y i are class labels being either +1 or −1. In the training stage, SVM finds a separating hyperplane which minimizes the training error and maximize the margin of separation between classes in a kernel-induced feature space by solving the constrained optimization problem,
Minimize   1 2 w 2 + C i = 1 L ξ i subject to   y i ( w t φ ( x i ) + b ) 1 + ξ i 0 ;   ξ i 0 , i
where w is the weight vector of the hyperplane, b is its bias, ξ i are slack variables representing training errors, and C is the penalty weight. The optimal bias b can be computed using the Kuhn-Tucker conditions of (9). In testing stage, the label of a test data x is computed by the decision function:
D ( x ) = i = 1 L α i y i K ( x i , x ) + b
where α i are Lagrange multipliers. If D > 0 , the test data is classified as a P300 data; otherwise, it is classified as non-P300 data. The RBF function in (8) is also used as the kernel for SVM.

P300 Detector – Optimization

The parameters in KFDA that need to be optimized include the number of eigenvectors d and kernel parameter σ (letting σ k = σ ). SVM has also two parameters to optimize, including C and σ (letting σ s = σ ). These parameters are optimized using a grid search and 10-run two-fold cross validation procedure. For each subject, a data set S containing 400 EEG data has been collected, including 80 P300 and 320 non-P300 data. The parameter d should be searched in the range of 1–L. Since two-fold cross validation is used, only half of the set S is used for training. Therefore, L = 200. However, according to our preliminary test, the values of optimal d for all subjects were smaller than 10. When d was larger than 10, the classification accuracies would not change significantly or worsen. Thus, we only search the best d in the range of 1–10; otherwise, the optimization would be computationally expensive. The penalty weight C has three possible values in the experiment, including 10, 100, and 1000. Both σ k and σ s are searched over the set { 2 4 , 2 3 , 2 2 , 2 1 , 1 , 2 1 , 2 2 , 2 3 , 2 4 , 2 5 , 2 6 , 2 7 , 2 8 , 2 9 , 2 10 , 2 11 , 2 12 , 2 13 , 2 14 , 2 15 } , where the size of the set is 20. Therefore, the four parameters ( d , C , σ k , σ s ) have 12,000 possible combinations in total, where 12000 = 10 × 3 × 20 × 20 . For each combination, the following two-fold cross validation of 10 independent runs [40] is performed.
In each run, half of the 400 EEG data in S are randomly selected as the elements of the set S 1 , and the remaining ones form another set, S 2 . In either S 1 or S 2 , the numbers of P300 data and non-P300 data are 40 and 160, respectively. Initially, the set S 1 is used for training the P300 detector, and S 2 is used for testing. Then, S 2 is used for training, and S 1 becomes the test set. A classification rate is computed based on the two testing results. After the 10-run two-fold cross validation procedure is complete, we obtain an average classification rate over the 10 runs for the current parameter combination. The 10-run two-fold cross validation procedure is repeated until all the 12,000 parameter combinations are tested. Finally, the optimal parameter combination gives the highest average classification rate. The optimal parameters for each subject are recorded, and are listed in Table 1. In Section 4, the reported experimental results are the best 10-run two-fold cross validation accuracies.

3.3.2. Online Target Function Detection

When the function selection operates online, a 3-s focus redirection period is performed to allow the user to move his/her focus to the element he/she wants to trigger, which is the target element. As soon as this period ends, the BCI system initiates the N-round intensification process mentioned above to collect online EEG epochs (data). Ten EEG data are obtained after this process, five of them are generated by the intensifications of the five rows, and the other five are from the intensifications of the five columns. The five row-intensification EEG data are fed into the P300 detector for feature extraction and classification, one at a time. Similarly, the five column-intensification EEG data are also fed into the P300 detector for feature extraction and classification, one at a time. The SVM then determines the most probable row and column using the two decision functions:
r * = arg max r = 1 , , 5 { i = 1 L α i y i K ( x r o w ( r ) , x i ) + b } c * = arg max c = 1 , , 5 { i = 1 L α i y i K ( x c o l ( r ) , x i ) + b }
where x r o w ( r ) and x c o l ( r ) are the test EEG data from the intensifications of the rth row and the cth column, respectively. Finally, the intersection of the r t h * row and the c t h * column is estimated as the target element, which is the target element determination.

4. Results and Discussion

In this section, the experimental results of SSVEP and P300 detection are provided in Section 4.1 and Section 4.2, respectively. Finally, an illustrative example is provided in Section 4.2 to show how the developed healthcare BCI systems works online.

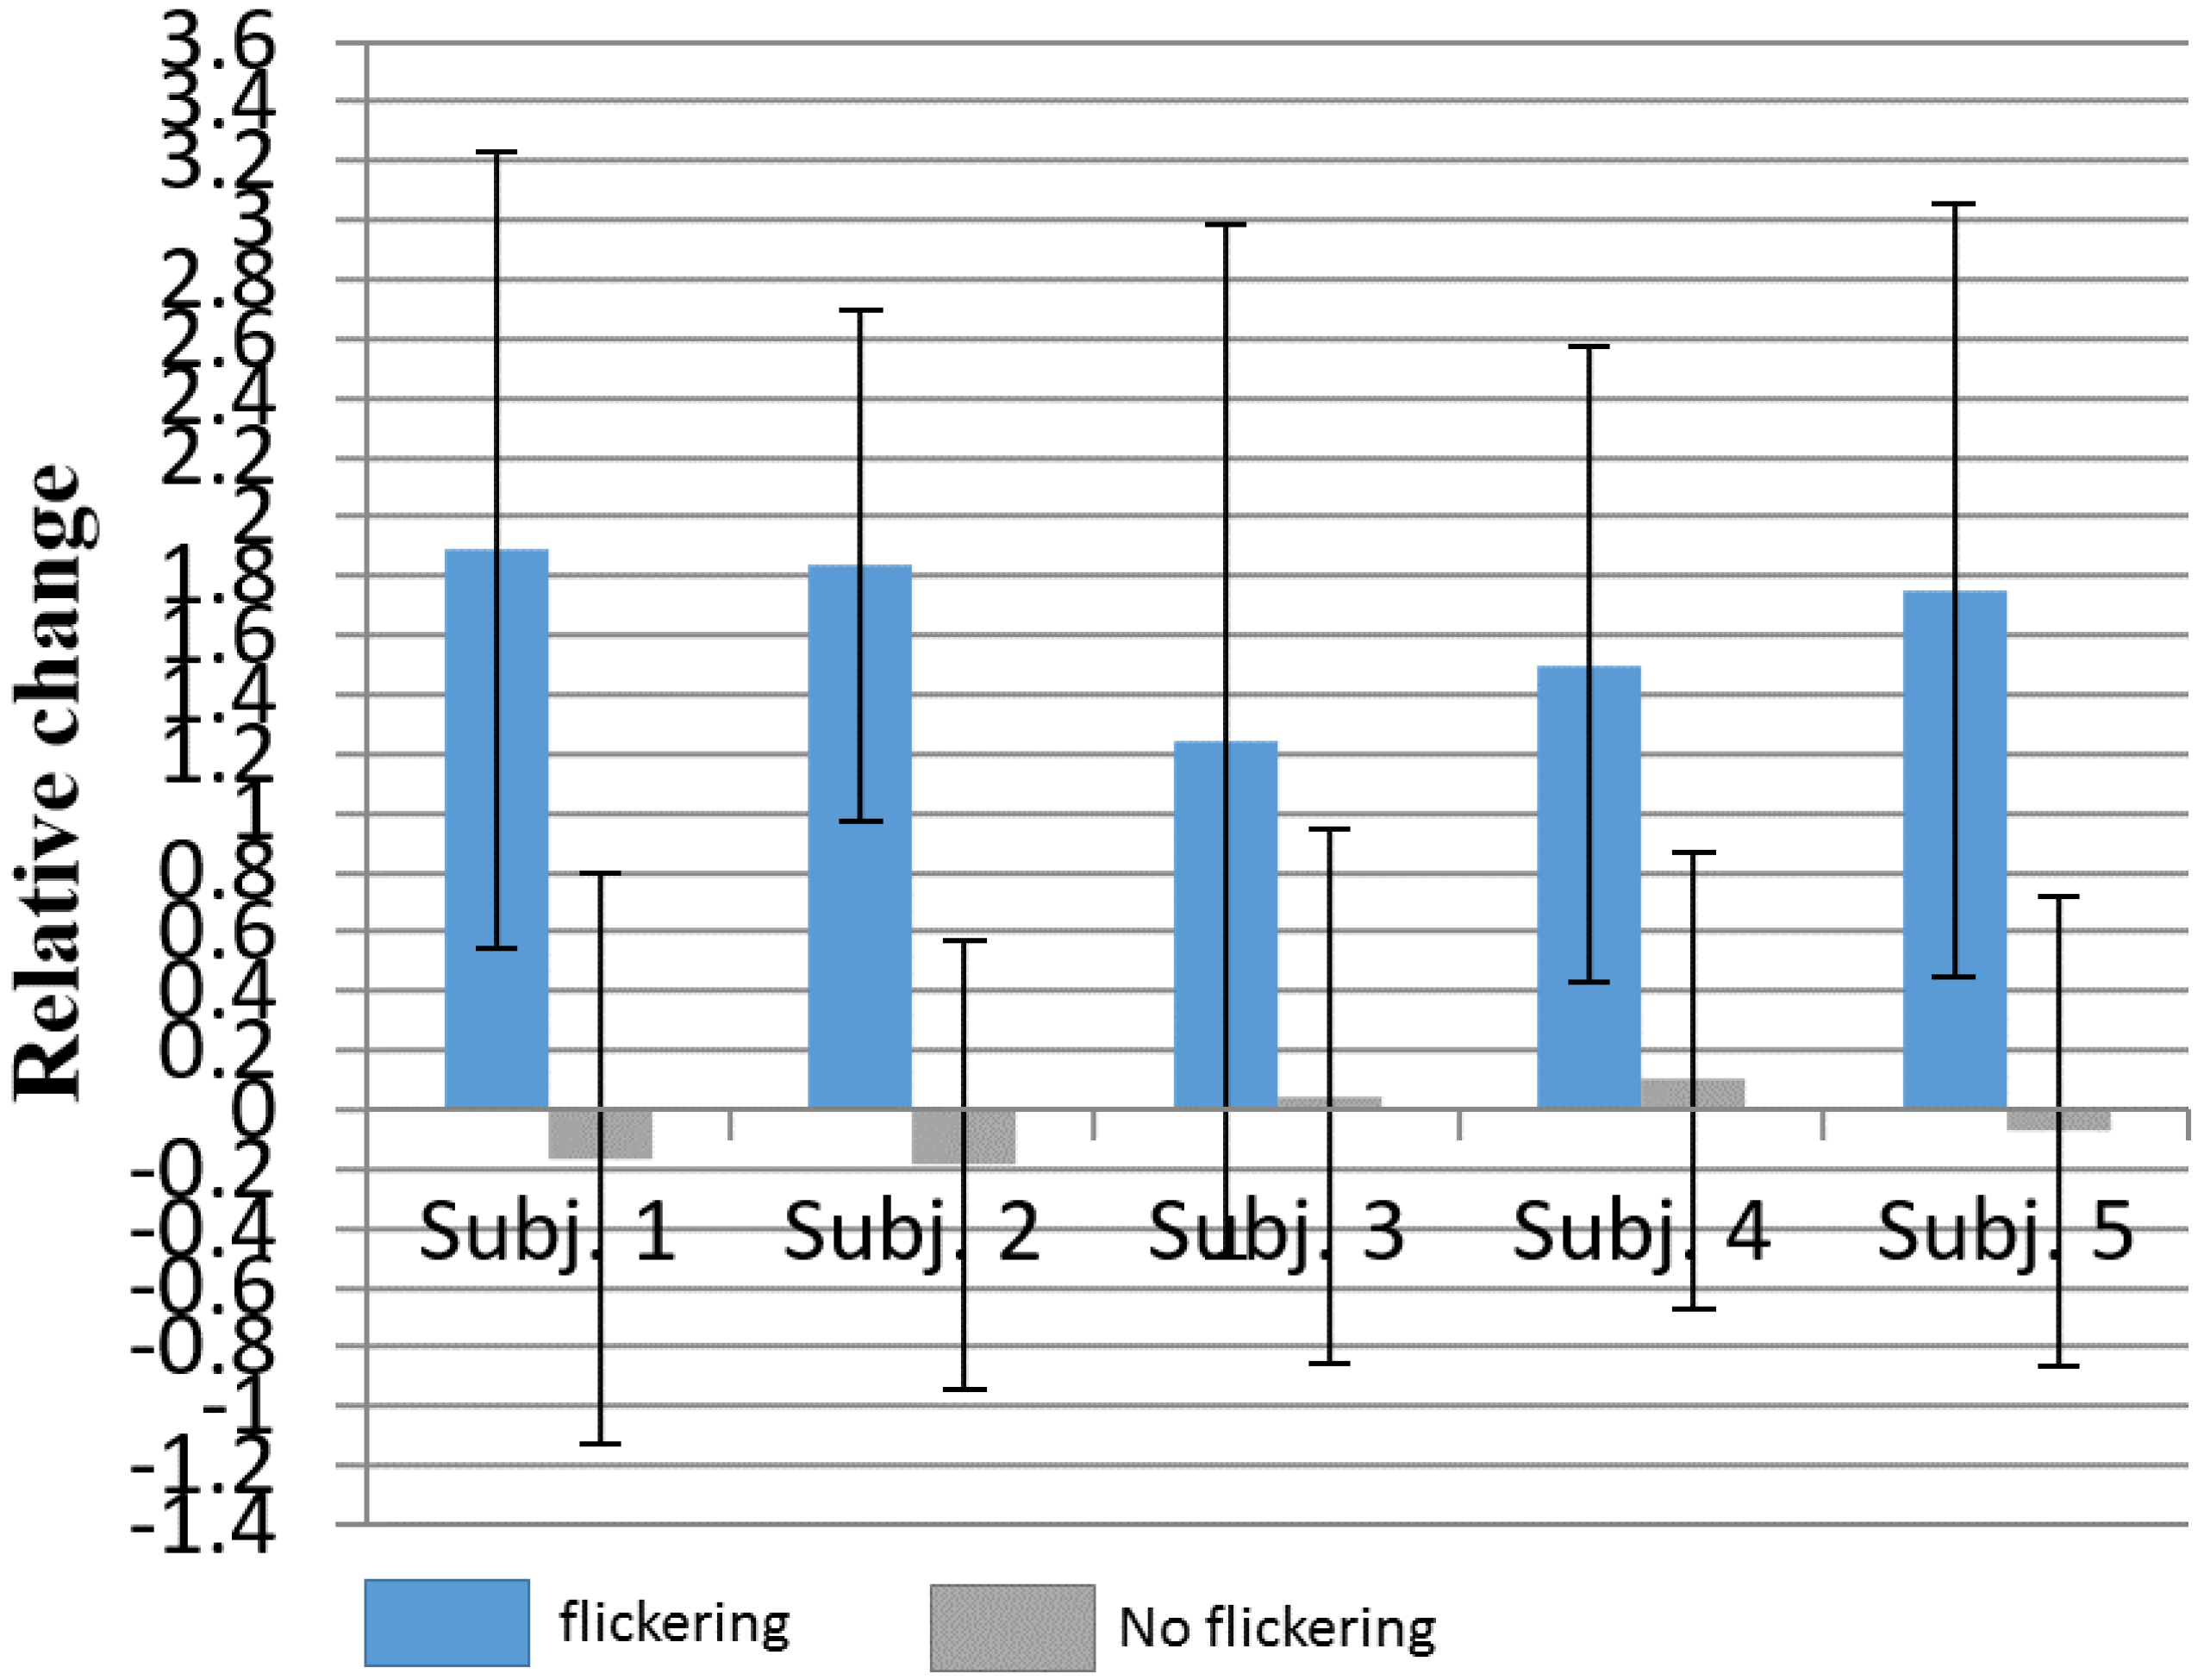
4.1. SSVEP Detection Results

Results are carried on five healthy and young subjects (21–25 y/o) with normal or corrected-to-normal vision. For each subject, we collect 20 3-s EEG signals under flickering and no flicking conditions each, and then compute the RC values of the signals. Table 2 lists the average RC values over the five subjects. It can be observed from this table that the RC values of LED flickering condition are much higher than those of no flickering conditions for every EEG recording channel. Moreover, among the three different channels, the largest RC difference between the two conditions is at Oz. Therefore, it is easy to distinguish SSVEP from non-SSVEP in EEG signals by using RC as the feature and setting an appropriate threshold T. In the following experiments, we set T = 0.6.
Table 3 lists the true positive rate (TPR) and false positive rate (FPR) of the SSVEP detection results at Oz, where TPR refers to the fraction where SSVEPs are classified as the SSVEP class, and the FPR is the fraction where non-SSVEP EEG signals are classified as the SSVEP class. The higher the TPR is, the higher the SSVEP detection accuracy is. According to Table 3, we can see that our BCI system can achieve high SSVEP detection accuracy. For example, both subject 1 and subject 4 achieve a TPR of 100%, and the average TPR is 93%. Moreover, the results in Table 3 are based on the best combinations of flickering frequency and duty cycle listed in Table 4, from which we can observe that the best combinations of the two parameters for the five subjects are different.
On the other hand, the higher the FPR is, the more unstable the switching mode is. If the FPR is high, the healthcare function selection mode is easy to activate even if the subject has no intention to open this mode (i.e., even the subject is not gazing at the flickering LED). According to Table 3, the proposed BCI system achieves a low average FPR of 14%. Among the five subjects, the FPR of subject 2 is the lowest, only 5%. However, the FPRs of both subjects 3 and 4 are relatively high (20%). The plot of the average RC values of the five subjects under flickering and no-flickering conditions is shown in Figure 6. We can observe from this figure that for subject 3 the RC distributions of the two conditions have a large overlap. Nevertheless, the FPR can be further decreased by setting the threshold to a value higher than 0.6. Therefore, when the switching mode is performed online, the threshold could be defined by the user a prior. The experimental results have shown that the simple SSVEP detection strategy adopted in this paper can provide the switching mode with sensitive and stable performance.

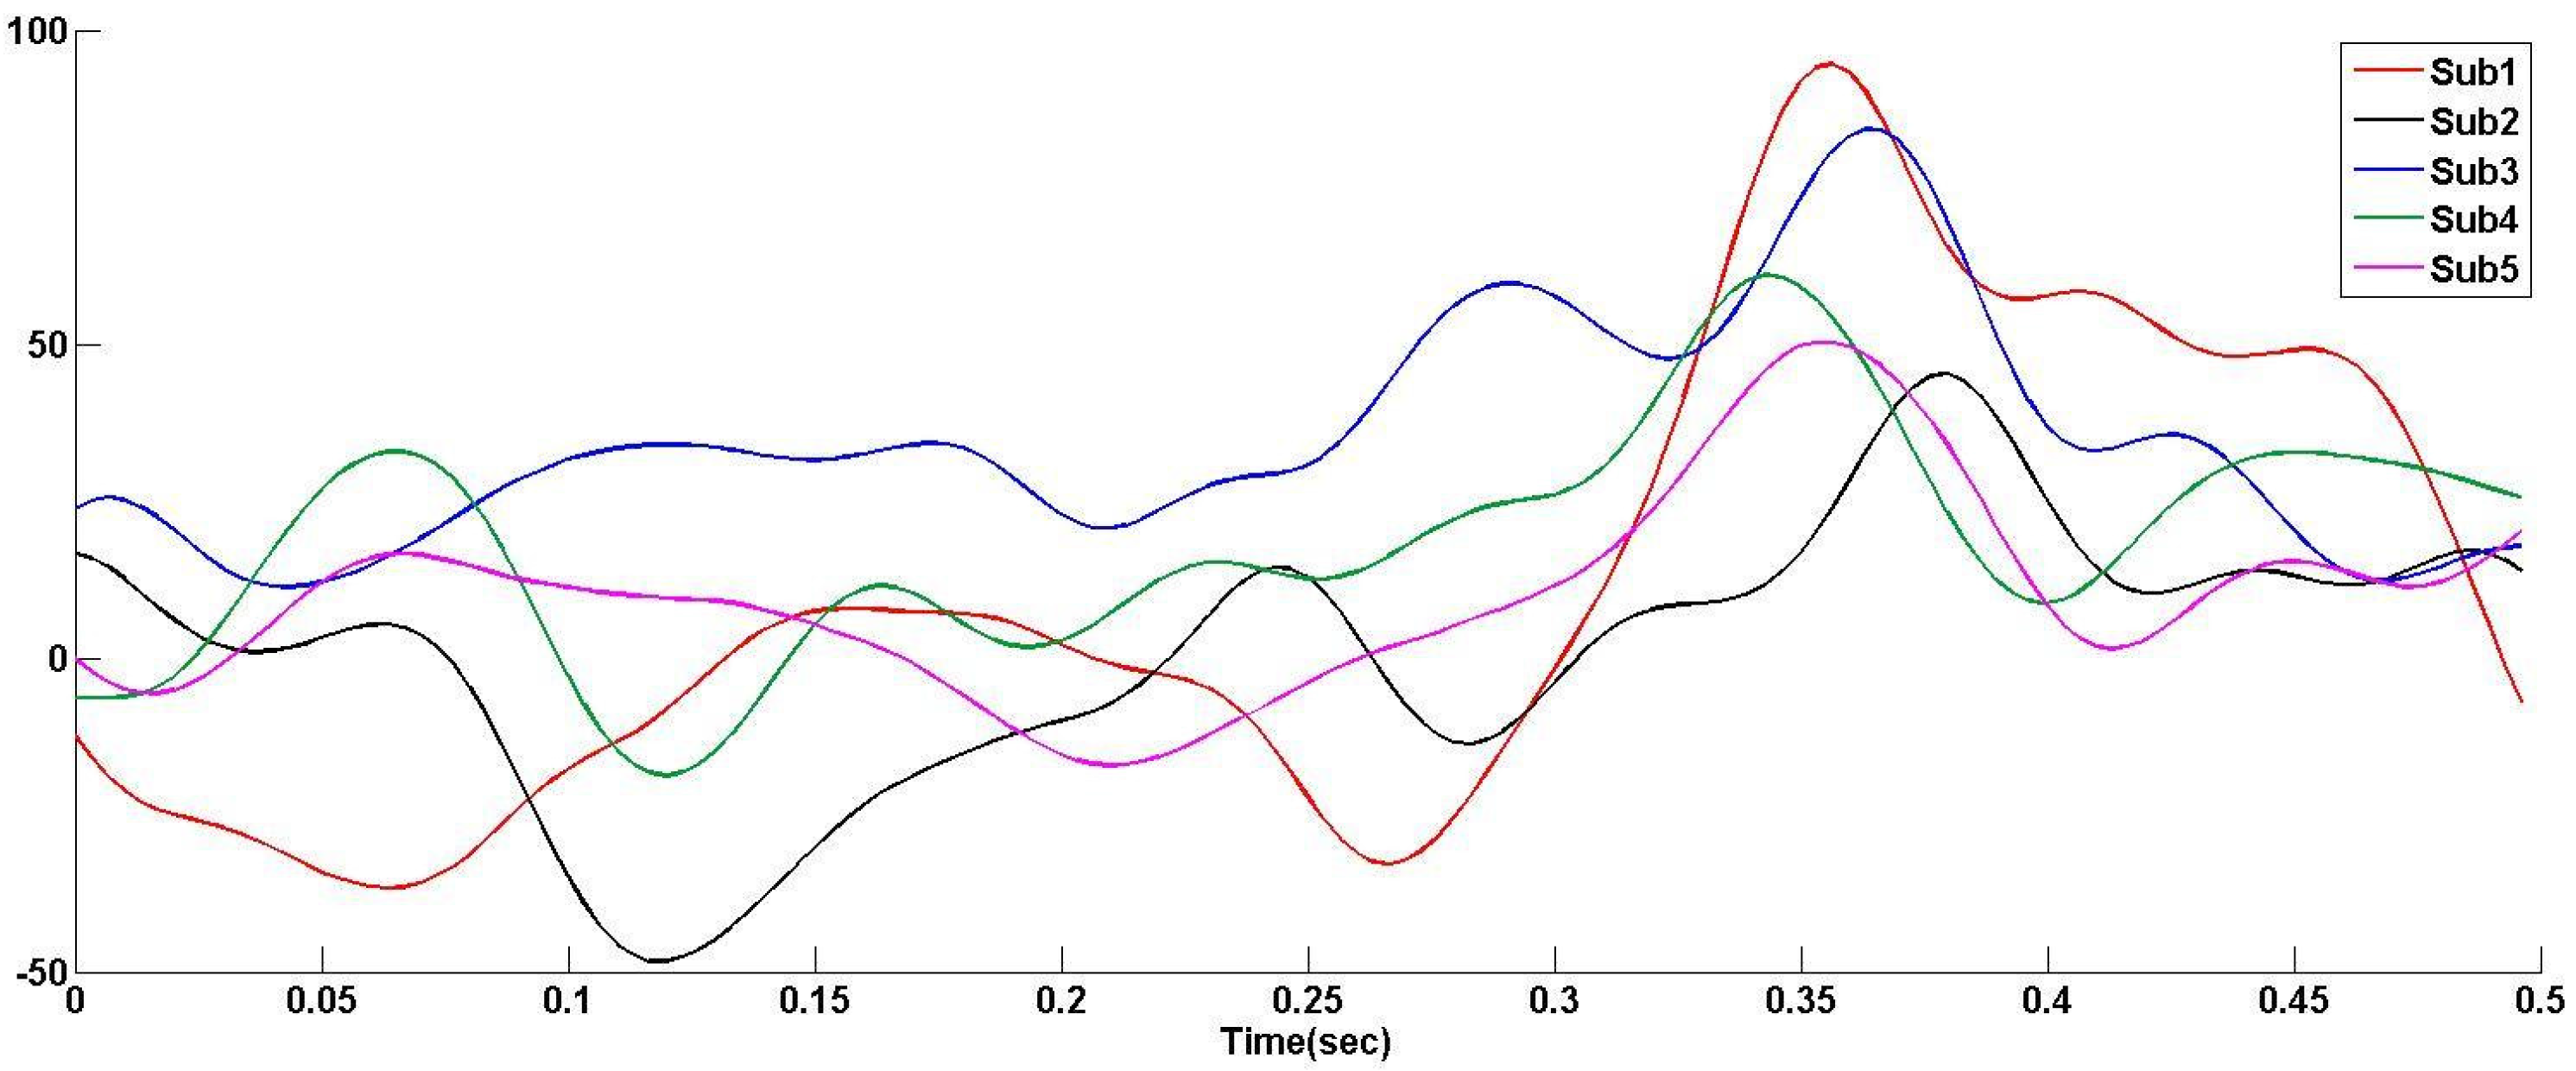
4.2. P300 Detection Results

In this work, two channels are used for detecting P300, including Cz and Pz. P300 potentials of the five subjects are plotted in Figure 7. Classification rate of P300 and non-P300 is an index for evaluating the accuracy of target element detection. Therefore, several methods are compared, including K-neighbor neighbor (K-NN) method, SVM, LDA + SVM, and the proposed P300 detector, Kernel FDA + SVM.
Figure 8 shows the average classification rates (CR) over the five subjects. As can be observed, the classification rates (CR) of all the methods increase with the number of rounds N. The proposed P300 detector outperforms the widely used P300 detector SVM in all cases. When N = 10, the classification rates of K-NN, SVM, LDA + SVM, and Kernel FDA + SVM are 89.1%, 93.1%, 93.6%, and 95.5%, respectively. The classification accuracies of the four methods are all very high as N = 10. However, the BCI system needs to spend 10   ( round ) × 1.675 ( seconds round ) = 16.75 seconds accomplishing the 10-round intensification process for online EEG data collection. A user could therefore feel vision fatigue. To allow the users to feel more comfortable and speed up the online target element detection in the healthcare function selection mode, the number of rounds should be as small as possible in practical use. If N = 2, the two-round intensification process needs only 3.35 s, which is comfortable for a user to concentrate. As N = 2, the classification rate of Kernel FDA + SVM is already above 80% (81.3%), while the one of SVM is only 72.5%. The comparison results have demonstrated that the proposed Kernel FDA + SVM is more suitable than the widely used SVM in P300 detection.

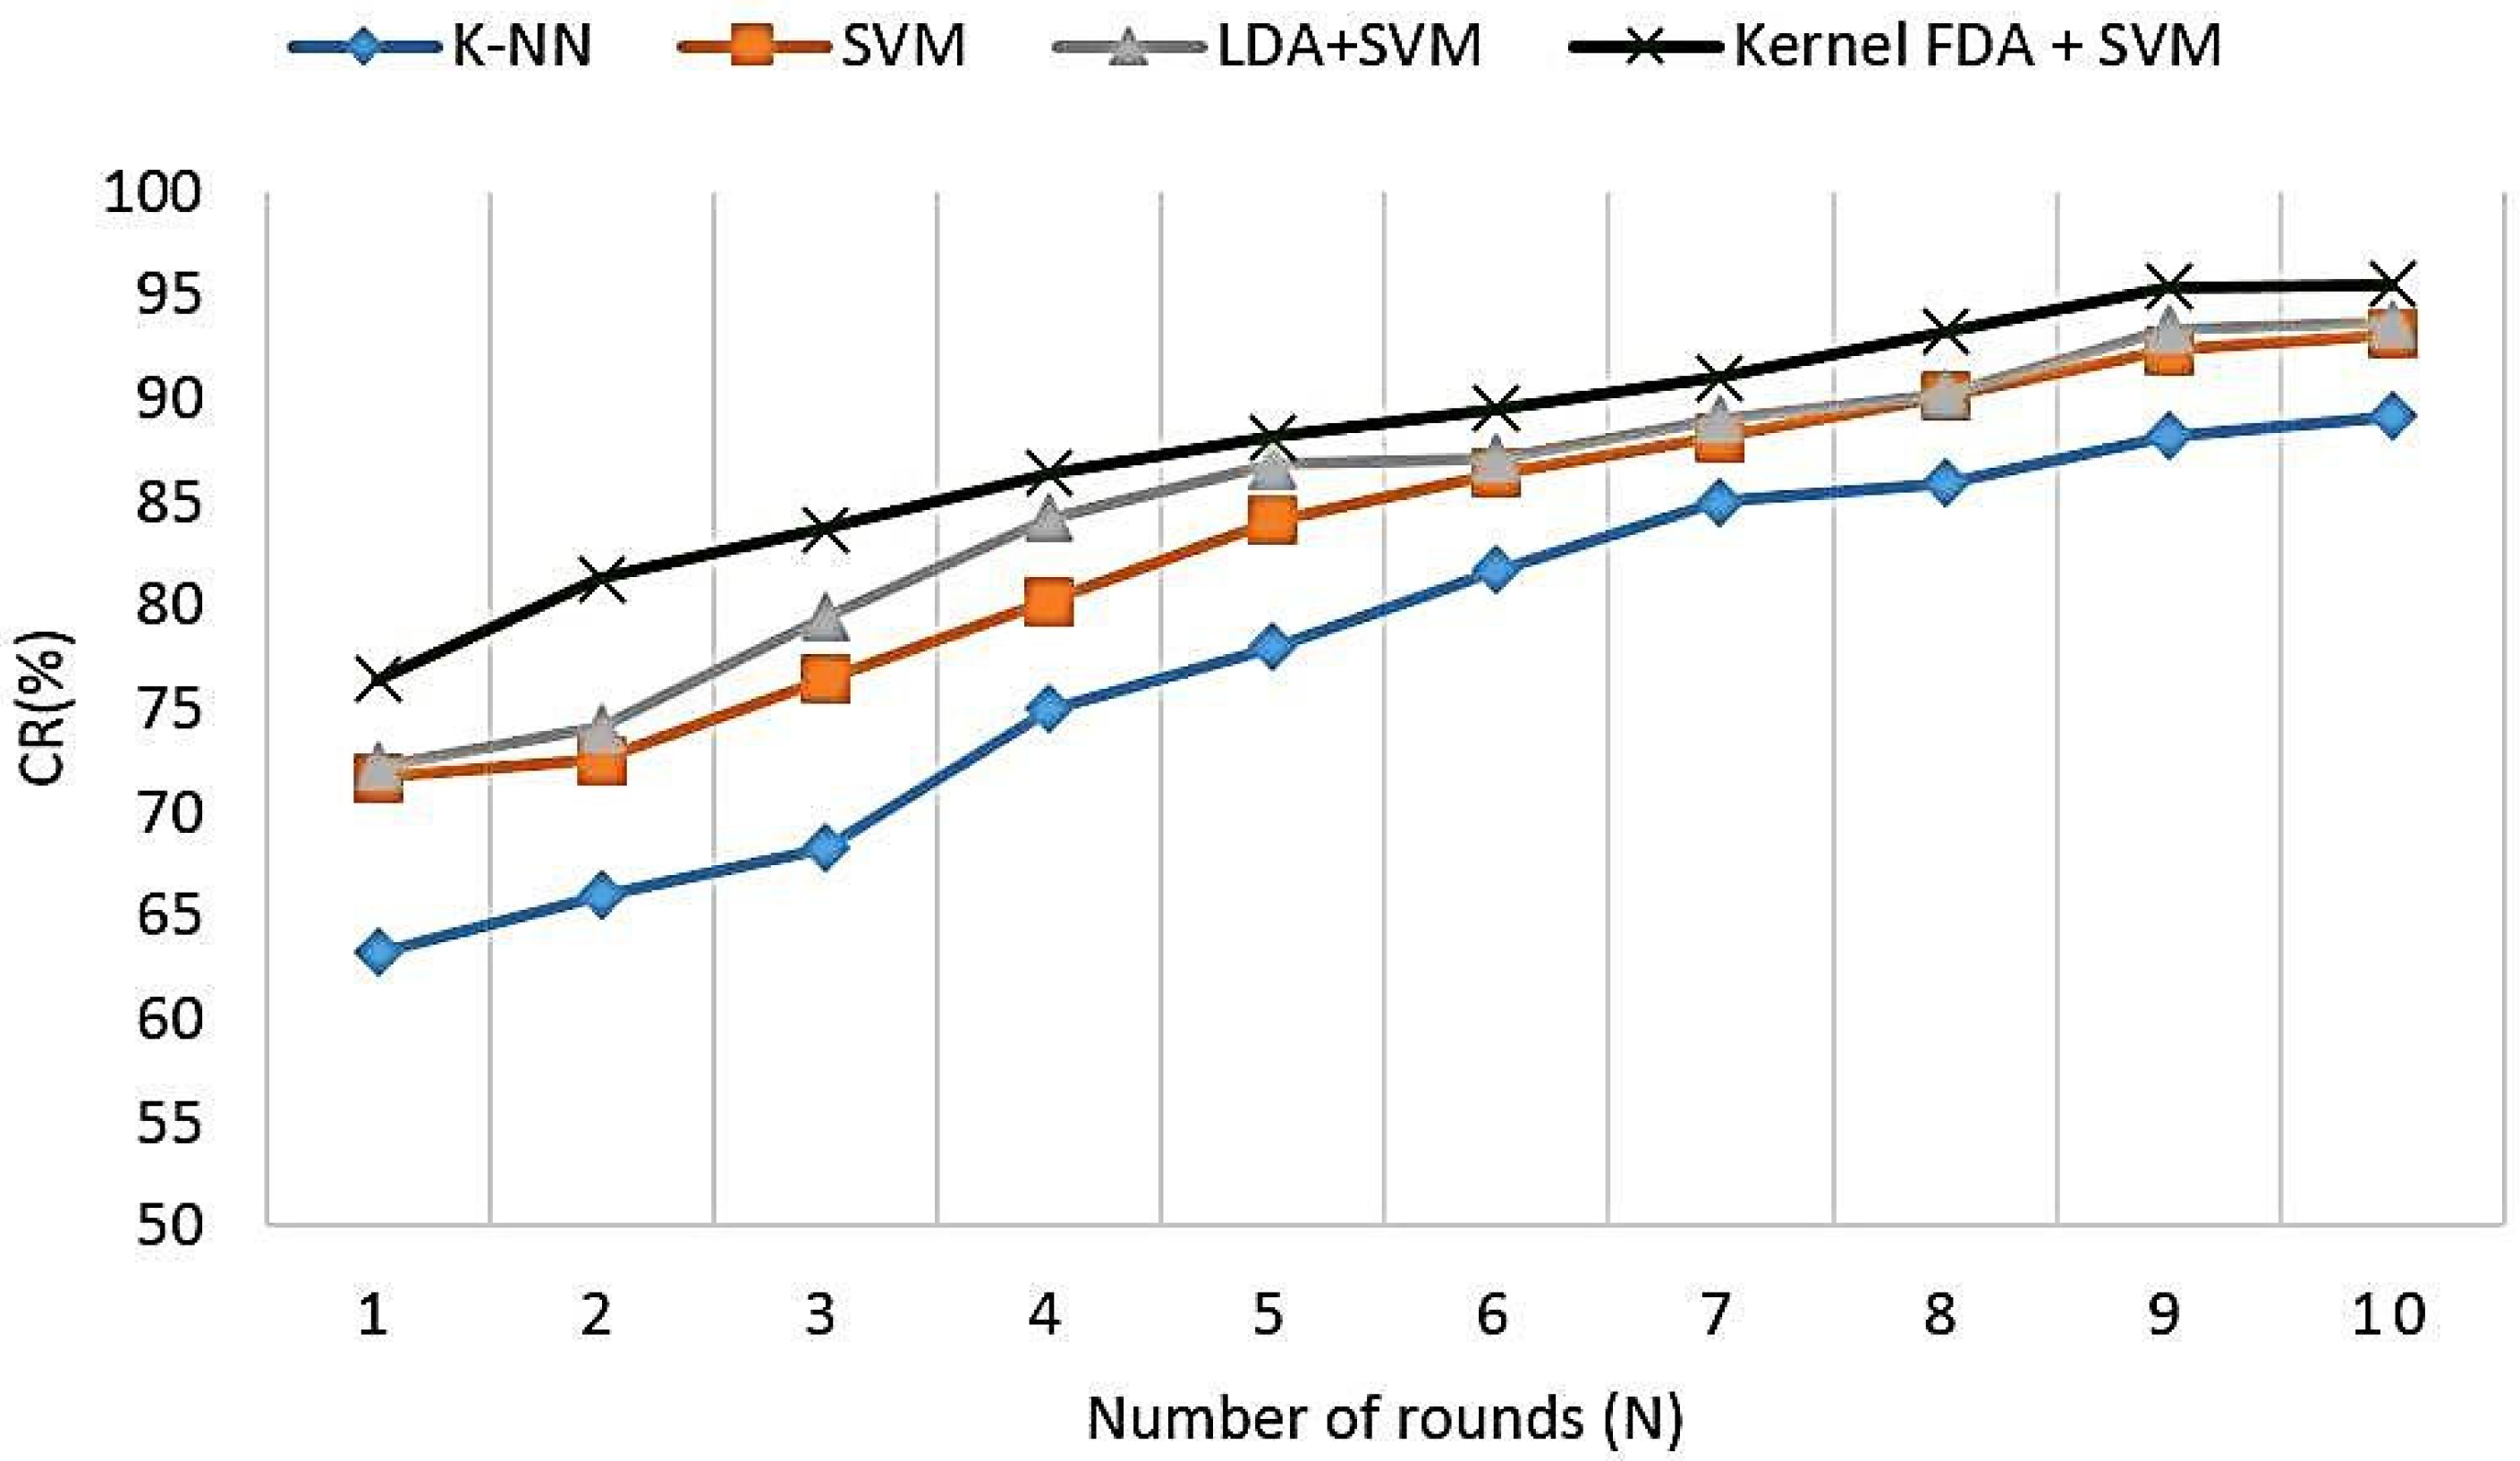
4.3. Comparison with Other P300 Detectors

In this subsection, we further compare the proposed kernel FDA-SVM P300 detector with other commonly used detectors, including LDA (also called Fisher LDA, FLDA) [26], Bayesian LDA (BLDA) [28,29,37], and the gradient boosting with ordinary least squares regression (OLS) algorithm [27]. In the following, we briefly review these methods and then provide the comparison results.

4.3.1. FLDA

The FLDA classifier finds a linear decision boundary having the form of w t   x + b = 0 to separate two classes [26]. The weight vector in FLDA is determined by
w = S w 1 ( m 1 m 2 )
where
S w = k = 1 2 x i C k ( x i m k ) ( x i m k ) t
is the within-class scatter matrix [37], m 1 is the mean of the training data belonging to class 1 (P300 class), m 2 is the mean of the training data belonging to class 2 (non-P300 class), x i s are training data, and C k denotes the kth class. In order to prevent the within-class matrix from suffering the small-sample-size (SSS) problem, i.e., the matrix S w becomes nonsingular and thus its inverse does not exist if the dimension of x i is larger than the number of training data, we add a sufficiently small value to every diagonal element of S w , as suggested in [32]. For an unseen data x , its output can be obtained by the sign of the FLDA decision function
f ( x ) = w t   x + b
where b is a bias which needs to be determined experimentally [26]. The test data x is classified as class 1 if f ( x ) > 0 ; otherwise, it is classified as class 2. In our experiment, the optimal bias b is determined using a grid search and 10-run two-fold cross validation procedure. The best value of b gives the highest average classification rate.

4.3.2. BLDA

The decision function of BLDA has the same form as that of FLDA expressed in Equation (14), but the weight vector w is optimized based on a different approach. The BLDA implemented in our experiment is the same as the one described in [37]. In BLDA, the basic assumption is the regression targets:
y = w t X + n
where y = [ y 1 , y 2 , , y L ] is the regression target vector containing the class labels y i , X = [ x 1 , x 2 , , x L ] is the d × L training data matrix (d and L are the number of features and number of training data, respectively), and n is the noise vector. The likelihood function can be written as
p ( D | β , w ) = ( β 2 π ) L 2 exp ( β 2 w t X y 2 )
where D denotes the pair of ( X , y ) , and β represents the inverse variance of the noise. To perform the Bayesian inference, a prior distribution for the weight vector w needs to be specified. The expression for the prior (also assumed to be Gaussian) is
p ( w | α ) = i = 1 d ( α i 2 π ) 1 2 exp ( 1 2 w t I ( α ) w )
where α i s are the hyperparameters representing the inverse relevance of each feature, and I ( α ) = diag ( α 1 , α 2 , , α d ) is a d   ×   d diagonal matrix. Since both likelihood and prior are Gaussian, the posterior is also Gaussian. The covariance C and the mean m of the posterior are Equations (18) and (19), respectively.
C = β ( β X X t + I ( α ) ) 1
m = β C X y t
The predictive distribution for a new input x is also Gaussian and can be characterized by its mean μ and variance σ 2 :
μ = m t x
σ 2 = 1 β + x t C x
By marginalizing (16), we obtain the likelihood p ( D | β , α ) as
p ( D | β , α ) = p ( D | β , w ) p ( w | α ) d w
which leads to a maximization problem: to find the hyperparameters β and α such that the log likelihood is maximum. The maximum likelihood solution for the hyperparameters can be found with a simple iterative manner [28]. Taking partial derivatives to the log likelihood with respect to α and β, and setting the results to zero yields the upload equations for α and β:
α i = 1 c i i + m i 2   , i = 1 , , d
β = d t r ( X X t C ) + m t X y 2
where c i i s are the diagonal elements of C , m i s are the elements of m , and t r denotes the trace of a matrix. Equations (18), (19), (23), and (24) are performed iteratively until no significant changes of the values of β and α i are observed. The mean of the posterior m expressed in (19) then can be computed using the optimal values of β and α. Finally, the posterior mean m is taken as the optimal value of the weight vector w [37].

4.3.3. Gradient Boosting with OLS

We briefly review this algorithm and its iterative learning procedure (see [27] for detailed derivations). Given a training set { x i R d , i = 1 L } and class labels y i { 0 , 1 } (if the training data x i belongs to P300 class, y i = 1 ; y i = 0 otherwise), where d = N c × N s is the number of features, N c is the number of EEG channels ( N c = 2 because Pz and Cz are recording sites for P300 detection), N s is the number of samples in one 500 ms epoch ( N s = 125 because of 250-Hz sampling rate), the boosting algorithm finds an ensemble of weak classifiers in an iterative manner. The chosen weak classifier is the linear combination of the training data, i.e., f ( x ) = w t x , which is the same as the one in [27]. Let F m denote the ensemble of classifiers after step m. Pseudocode for the gradient boosting with OLS provided in [27] is as follows:
  •  Step 1: Set p 0 ( y i = 1 | x i ) = 0.5 , i = 1 , , L
  •  Step 2: Initialize F 0 ( x i ) = 0 , i = 1 , , L
  •  Step 3: For m = 1 to M do
    a)
    y ˜ i = 2 ( y i p m 1 ( y i = 1 | x i ) ) , i = 1 , , L
    b)
    f m = arg m i n f i = 1 N ( y ˜ i f ( x i ) ) 2
    c)
    γ = arg m a x γ Q ( F m 1 + γ f m )
    d)
    F m = F m 1 + ϵ γ f m
    e)
    Compute p m ( y i = 1 | x i )
    Endfor
In step 3(a) and (e), p m ( y i = 1 | x i ) is computed by the logistic regression model expressed as
p m ( y i = 1 | x i ) = e F m ( x i ) e F m ( x i ) + e F m ( x i )
In step 3(b), the optimal parameters of the weak classifier is obtained by least squares fitting the x i to y ˜ i . In step 3(c), γ represents the relative importance of the weak classifier in the ensemble, and Q denotes the Bernoulli log-likelihood of F m :
Q ( F m ) = log ( i = 1 L p m ( y i = 1 | x i ) y i p m ( y i = 0 | x i ) 1 y i )
During the iteration, this likelihood is maximized by first setting F 0 ( x i ) = 0 in step 1 and successively adding weak classifiers to the ensemble as expressed in step 3(d). To find the best γ, we need to solve the optimization problem in step 3(c). This optimization problem is easy to solve, since the likelihood is a concave function [41]. Therefore, in our experiment, we use a greedy method to find the best γ value in step 3(c). In step 3(d), γ is further shrunk to a smaller value through multiplication with a small ϵ. The shrinking strategy can make the gradient boosting procedure less greedy. Following the same setting in [27], we set ϵ to 0.05. The sub-steps in step 3 is repeated until the number of iterations M is reached. A large value of M results in overfitting, while a too-small value of M may lead to underfitting. We find the optimal M with a grid search method (within the interval of 1–100). The optimal M gives the highest average classification rate of P300 and non-P300 over 10-run two-fold cross validations.

4.3.4. Results

We compare the proposed P300 detector (Kernel FDA+SVM) with other detectors in different numbers of intensification rounds N, and the experimental results are listed in Table 5. The average classification accuracies of K-NN, SVM, and Kernel FDA + SVM are the same as those in Figure 8. In each condition of N, the highest average classification accuracy is marked in bold. It can be observed from Table 5 that kernel FDA + SVM outperforms the widely used FLDA and its extension version BLDA in all cases, i.e., ∀N. It is interesting to further compare FLDA and BLDA. It can be found that BLDA achieves higher accuracies than FLDA for all cases. This comparison demonstrates that BLDA is better than FLDA for P300 detection. Nevertheless, this comparison could be a bit unfair because the within-class scatter matrix in FLDA did suffer from the SSS problem. In the experiment, each data has a dimension of 250 because two EEG channels (Pz and Cz) are used and one 500 ms epoch from each channel has 125 sample points (sampling frequency = 250 Hz). On the other hand, the training data is only 200 in number due to the use of two-fold cross validation (original data size for each subject is 400). Obviously, the number of training data is smaller than the data dimension. To prevent the SSS problem, we add a small value (0.0001) to every diagonal element of the within-class scatter matrix to make the matrix invertible, as mentioned in Section 4.3.1. This simple method, however, is not the best way to address the SSS problem. To improve the classification accuracy of FLDA, more effective solutions to SSS problem should be introduced in the future, such as the direct LDA proposed in [33].
Among the 10 different cases, the results also show that kernel FDA + SVM performs better than BLDA in all cases, and better than gradient boosting with OLS in eight cases (except N = 9 and N = 10). Although the classification accuracies of gradient boosting with OLS are higher than those of kernel FDA + SVM as N = 9 and 10, the differences in the two cases are only 0.2% and 0.1%, respectively. Nevertheless, for a P300-based BCI, a smaller number of intensification rounds is preferred because the smaller the number of rounds, the faster the response of the BCI. When N is lower than 9, it can be seen that the differences are much larger. For example, Kernel FDA + SVM outperforms gradient boosting with OLS by 4.6% when N is 5, which demonstrates that Kernel FDA + SVM is more suitable than the gradient boosting with OLS method for a P300 BCI where a fast response is required.

4.4. Comparison with Other Works

The work of [35] develops a P300 and SSVEP-based BCI speller. Their method detects the target item in the spelling matrix by combining two kinds of stimulation paradigms, including the conventional row/column (RC) P300 and a two-step SSVEP stimulation paradigms. The RC P300 paradigm used in their system follows the oddball paradigm used in [24], i.e., the rows and columns of the stimulation matrix flashed in a random order, one at a time, which is the same as the P300 paradigm used in the function selection mode of our proposed BCI. As for their two-step SSVEP paradigm, all items in the same row flicker at the same frequency in step 1, and those in the same column subsequently flicker at the same frequency in step 2. Finally, the target item in this matrix is estimated by using a maximum-probability estimation (MPE) method to fuse the scores obtained from the RC P300 and the two-step SSVEP paradigms. Therefore, the hybrid BCI of [35] utilizes the P300 and SSVEP fusion method to gain better target item detection accuracy than a pure P300-based BCI, which is the same as the objective of the hybrid BCI in [20] where both P300 and SSVEP paradigms are performed simultaneously to get better detection accuracy than a pure P300-based BCI. Therefore, the SSVEP and P300-based BCIs proposed in [20,35] are based on a parallel architecture, which is different from the proposed BCI.
Our SSVEP and P300-based BCI system is based on a cascade architecture, which is composed of two modes; one is the switching mode and the other is the function selection mode. The function selection mode is initiated only when SSVEP is detected in the switching mode. As soon as the function selection mode is turned on, our designed 5 × 5 healthcare function selection panel matrix starts to flash following the conventional RC P300 paradigm. After the P300 paradigm is over, the proposed P300 detector kernel FDA + SVM determines the target function (i.e., target item) in the healthcare control panel matrix. In other words, although the proposed BCI is also based on SSVEP and P300, the SSVEP is not used for target item detection, but is used for asynchronous control of the function selection mode. Also, by the design of the SSVEP-based switching mode, the users can turn on the function selection mode in a self-paced manner, increasing the usability of the BCI in practical use. In the future, the SSVEP stimulation paradigm used in [20,35] should be introduced to our function selection mode to enhance the accuracy of target function detection.
Ma et al. [36] presented a hybrid human-machine interface (HMI) based on two different type of physiological signals, including EEG and electrooculography (EOG). Their hybrid HMI consists of two modes, EOG mode and EEG mode. In the EOG mode, the HMI can generate four different output commands by using three-channel EOG signals to recognize four kinds of eye movements, including eye blink, wink, gaze, and frown. In the EEG mode, three kinds of ERP components in EEG are extracted as features, including P300, N170, and VPP. Although the HMI of [36] did not use SSVEP to build any communication/control channels, their hybrid HMI system successfully utilizes physiological signal (i.e., EOG by eye movements) other than brain activity (i.e., EEG) to create control channels. The eye-movement detection could also be introduced to our system to provide more communication channels in the future.
P300 detection plays a critical role in our work and the studies of [20,35,36]. In [35], LDA and SVM are adopted as the P300 detectors, and their results show that SVM performs better than LDA. SVM is adopted as the detector in [20], while the detector in [36] is LDA. Our results showed that the proposed P300 detector Kernel FDA + SVM outperforms SVM in all cases in terms of classification accuracy. Additionally, the improvement in classification accuracy is particularly large when the number of intensification rounds is small. The reported results have suggested that Kernel FDA + SVM can serve as a better P300 detector than the widely used LDA and SVM.
The work of [42] develops an independent component analysis (ICA)-based spatial denoising algorithm (SDA) as a preprocessing to enhance the SNR of P300. The SDA method decomposes 14-channel EEG signals into independent components (ICs), and then automatically identifies m P300 ICs (i.e., the ICs accounting for the P300) from the decomposed ICs using an index called integrated distribution strength. The selected P300 ICs are used to reconstruct waves. Other commonly used features including time-domain, frequency-domain, and wavelet features are extracted from the denoised waves. A best feature subset is further determined based on F-score measure, and fed into an SVM classifier for P300 detection. Their results show remarkable P300 classification accuracy of over 95% for single-trial EEG. However, their method requires a certain number of electrodes to run ICA in order to guarantee the efficiency of the SDA. The adaptive nonlinear principal component analysis (ANPCA) [43] and ICA-based method [44] are also blind source separation-based spatial filtering methods to enhance the SNR of P300, and therefore a large number of EEG channels is required (12 for the former and eight for the latter). However, these promising spatial filtering techniques could not be directly applied to our current system because only two electrodes at Pz and Cz are used for P300 detection in our current BCI system. Nevertheless, it can be introduced as a preprocessing step to enhance the SNR of P300 when the number of electrodes in our BCI system increases in the future. Moreover, our experimental results have demonstrated the advantage of the proposed Kernel FDA+SVM P300 detector over the conventional SVM in terms of P300 classification. The proposed detector is a generic model and might be applied to other P300 BCIs to further improve their systems’ P300 detection accuracies.
Gonzalez et al. [45] propose an automatic channel selection algorithm for P300 ERP classification. A multiobjective hybrid real-binary particle swarm optimization (MHPSO) algorithm-based channel selection method, and a Fisher discriminant analysis (FDA) classifier is used for P300 classification. Given a huge number of channels, the MHPSO algorithm is used to optimize the FDA parameters and find a set of fewest EEG channels by maximizing the classification accuracy and minimizing the number of channels simultaneously. Their experiment and analysis are carried out on datasets of auditory ERPs from sound in which the EEG raw data are recoded using 64 EEG channels. Their experimental results show that it is possible to greatly reduce the number of channels necessary for classification without sacrificing the classification accuracy. Also, among the 64 channels, only five channels (Pz, FCz, FC1, FC2, FPz) are most frequently selected by MHPSO. Since the presented work has only two channels, it seems that it is not necessary to apply this powerful channel selection method to our current BCI system. Nevertheless, the MHPSO method in [39] can also be introduced into our BCI system to speed up the parameter optimization. Currently, the parameters of Kernel FDA and SVM are optimized using the grid-searching and cross validation procedures, which is time consuming and the obtained parameter values are not necessarily optimum. In the future, the MHPSO method should be used in our system to automatically find the optimal values of the parameters.

5. Conclusions

In this paper, we have presented a BCI system for healthcare control. The proposed system allows a user to activate the desired functions whenever he/she wants, and the designed healthcare function selection panel implemented by C# program provides the user with 25 different function to choose from. Therefore, the synchronous (self-paced) healthcare BCI can improve the independence of activity of daily life for a wide spectrum of users suffering motor disabilities. Experimental results have demonstrated that the system can achieve high SSVEP detection accuracy with only one channel Oz (94%), and high P300 and non-P300 classification rate using Pz and Cz channels (95.5%). The results also indicated that the proposed P300 detector, Kernel FDA + SVM, outperforms other commonly used methods in terms of P300 and non-P300 classification, such as SVM and LDA. The time from having the intention to turn on the system, i.e., starting to gaze at the LED (3 s), redirecting the user’s focus to a target element (3 s), collecting EEG data online (8.375 s if in five-round intensifications) to activating the target function is only 14.375 s, around 15 s. Therefore, the proposed healthcare BCI system is not only easy to use (only three channels are required), but also can detect the intent of the user accurately and quickly.

Acknowledgments

This work was supported by the Ministry of Science and Technology (MOST), Taiwan R.O.C. under Grant No. 103-2923-E-027-001-MY3.

Author Contributions

The research is completed through collaboration of all authors. Yi-Hung Liu was the team leader of this work who was responsible for coordination, development of core algorithms, designing the framework of the healthcare BCI system, EEG data analysis and paper writing. Shih-Hao Wang and Ming-Ren Hu helped EEG data collection, program coding, implementation of the real-time EEG-based healthcare BCI system, and involved in discussions.

Conflicts of Interest

The authors declare no conflict of interest.

References

  1. Wolpaw, J.R.; Birbaumer, N.; Heetderks, W.J.; McFarland, D.J.; Peckham, P.H.; Schalk, G.; Donchin, E.; Quatrano, L.A.; Robinson, C.J.; Vaughan, T.M. Brain-computer interface technology: A review of the first international meeting. IEEE Trans. Rehabil. Eng. 2000, 8, 164–173. [Google Scholar] [CrossRef] [PubMed]
  2. Wolpaw, J.R.; Birbaumer, N.; McFarland, D.J.; Pfurtscheller, G.; Vaughan, T.M. Brain-computer interfaces for communication and control. Clin. Neurophysiol. 2002, 113, 767–791. [Google Scholar] [CrossRef]
  3. Turnip, A.; Hong, K.-S. Classifying mental activities from EEG-P300 signals using adaptive neural network. Int. J. Innov. Comput. Inf. Control. 2012, 8, 6429–6443. [Google Scholar]
  4. Moghimi, S.; Kushki, A.; Guerguerian, A.M.; Chau, T. A review of EEG-based brain-computer interfaces as access pathways for individuals with severe disabilities. Assist. Technol. 2013, 25, 99–110. [Google Scholar] [CrossRef] [PubMed]
  5. Naseer, N.; Hong, K.-S. fNIRS-based brain-computer interfaces: A review. Front. Hum. Neurosci. 2015, 9, 1–15. [Google Scholar]
  6. Khan, M.J.; Hong, K.-S. Passive BCI based on drowsiness detection: An fNIRS study. Biomed. Opt. Express 2015, 6, 4063–4078. [Google Scholar] [CrossRef] [PubMed]
  7. Weyand, S.; Takehara-Nishiuchi, K.; Chau, T. Weaning off mental tasks to achieve voluntary self-regulatory control of a Near-Infrared Spectroscopy Brain-Computer Interface. IEEE Trans. Neural Syst. Rehabil. Eng. 2015, 23, 548–561. [Google Scholar] [CrossRef] [PubMed]
  8. Khan, M.J.; Hong, M.J.; Hong, K.-S. Decoding of four movement directions using hybrid NIRS-EEG brain-computer interface. Front. Hum. Neurosci. 2014, 8, 1–10. [Google Scholar] [CrossRef] [PubMed]
  9. Hyder, F.; Kida, I.; Behar, K.L.; Kennan, R.P.; Maciejewski, P.K.; Rothman, D.L. Quantitative functional imaging of the brain: Towards mapping neuronal activity by BOLD fMRI. NMR Biomed. 2001, 14, 413–431. [Google Scholar] [CrossRef] [PubMed]
  10. Shulman, R.G.; Rothman, D.L.; Hyder, F. A BOLD search for baseline. Neuroimage 2007, 36, 277–281. [Google Scholar] [CrossRef] [PubMed]
  11. Rebsamen, B.; Guan, C.; Zhang, H.; Wang, C.; Teo, C.; Ang, M.H., Jr.; Burdet, E. A brain controlled wheelchair to navigate in familiar environments. IEEE Trans. Neural Syst. Rehabil. Eng. 2010, 18, 590–598. [Google Scholar] [CrossRef] [PubMed]
  12. Li, Y.; Long, J.; Yu, T.; Yu, Z.; Wang, C.; Zhang, H.; Guan, C. An EEG-based BCI system for 2-D cursor control by combining mu/beta rhythm and P300 potential. IEEE Trans. Biomed. Eng. 2010, 57, 2495–2505. [Google Scholar] [PubMed]
  13. Donchin, E.; Spencer, K.M.; Wijesinghe, R. The mental prosthesis: Assessing the speed of a P300-based brain-computer interface. IEEE Trans. Rehabil. Eng. 2000, 8, 174–179. [Google Scholar] [CrossRef] [PubMed]
  14. Castermans, T.; Duvinage, M.; Petieau, M.; Hoellinger, T.; Saedeleer, C.; Seetharaman, K.; Bengoetxea, A.; Cheron, G.; Dutoit, T. Optimizing the performances of a P300-based brain–computer interface in ambulatory conditions. IEEE J. Emerg. Sel. Top. Circuits Syst. 2011, 1, 566–577. [Google Scholar] [CrossRef]
  15. Ma, R.; Aghasadeghi, N.; Jarzebowski, J.; Bretl, T.; Coleman, T.P. A stochastic control approach to optimally designing hierarchical flash sets in P300 communication prostheses. IEEE Trans. Neural Syst. Rehabil. Eng. 2012, 20, 102–112. [Google Scholar] [PubMed]
  16. Khosrowabadi, R.; Quek, C.; Ang, K.K.; Wahab, A. ERNN: A biologically inspired feedforward neural network to discriminate emotion from EEG signal. IEEE Trans. Neural Netw. Learn. Syst. 2014, 25, 609–629. [Google Scholar] [CrossRef] [PubMed]
  17. Liu, Y.H.; Wu, C.T.; Cheng, W.T.; Hsiao, Y.T.; Chen, P.M.; Teng, J.T. Emotion recognition from single trial EEG based on kernel Fisher’s emotion pattern and imbalanced quasiconformal kernel support vector machine. Sensors 2014, 14, 13361–13388. [Google Scholar] [CrossRef] [PubMed]
  18. Panicker, R.C.; Puthusserypady, S.; Sun, Y. An asynchronous P300 BCI with SSVEP-based control state detection. IEEE Trans. Biomed. Eng. 2011, 58, 1781–1788. [Google Scholar] [CrossRef] [PubMed]
  19. Meng, L.; Jin, J.; Wang, X. A comparison of three electrode channels selection methods applied to SSVEP BCI. IEEE Trans. Biomed. Eng. Inform. 2011, 1, 584–587. [Google Scholar]
  20. Combaz, A.; Van Hulle, M.M. Simultaneous detection of P300 and steady-state visually evoked potentials for hybrid brain-computer interface. PLoS ONE 2015, 10. [Google Scholar] [CrossRef] [PubMed]
  21. Yin, E.W.; Zhou, Z.T.; Jiang, J.; Chen, F.L.; Liu, Y.D.; Hu, D.W. A speedy hybrid BCI spelling approach combining P300 and SSVEP. IEEE Trans. Biomed. Eng. 2014, 61, 473–483. [Google Scholar] [PubMed]
  22. Beverina, F.; Palmas, G.; Silvoni, S.; Piccione, F.; Giove, S. User adaptive BCIs: SSVEP and P300 based interfaces. PsychNol. J. 2003, 1, 331–354. [Google Scholar]
  23. Regan, D. Human Brain Electrophysiology: Evoked Potentials and Evoked Magnetic Fields in Science and Medicine; Elsevier: New York, NY, USA, 1989. [Google Scholar]
  24. Thulasidas, M.; Guan, C.; Wu, J. Robust classification of EEG signal for brain-computer interface. IEEE Trans. Neural Syst. Rehabil. Eng. 2006, 14, 24–29. [Google Scholar] [CrossRef] [PubMed]
  25. Huang, H.P.; Liu, Y.H.; Lin, W.Z.; Kang, Z.H.; Cheng, C.A.; Huang, T.H. Development of a P300 brain–machine interface and design of an elastic mechanism for a rehabilitation robot. Int. J. Autom. Smart Technol. 2015, 5, 91–100. [Google Scholar]
  26. Lenhardt, A.; Kaper, M.; Ritter, H.J. An adaptive P300-based online brain-computer interface. IEEE Trans. Neural Syst. Rehabil. Eng. 2008, 16, 21–130. [Google Scholar] [CrossRef] [PubMed]
  27. Hoffmann, U.; Garcia, G.; Vesin, J.-M.; Diserens, K.; Ebrahimi, T. A boosting approach to p300 detection with application to brain-computer interfaces. In Proceedings of the 2nd International IEEE EMBS Conference on Neural Engineering, Arlington, VA, USA, 16–19 March 2005; pp. 97–100.
  28. Hoffmann, U.; Vesin, J.-M.; Ebrahimi, T.; Diserens, K. An efficient p300-based brain–computer interface for disabled subjects. J. Neurosci. Methods 2008, 167, 115–125. [Google Scholar] [CrossRef] [PubMed]
  29. Rivet, B.; Souloumiac, A.; Attina, V.; Gibert, G. xDAWN algorithm to enhance evoked potentials: application to brain–computer interface. IEEE Trans. Biomed. Eng. 2009, 56, 2035–2043. [Google Scholar] [CrossRef] [PubMed] [Green Version]
  30. Rakotomamonjy, A.; Guigue, V. BCI competition III: Dataset II- ensemble of SVMs for BCI p300 speller. IEEE Trans. Biomed. Eng. 2008, 55, 1147–1154. [Google Scholar] [CrossRef] [PubMed]
  31. Liu, Y.H.; Huang, H.P.; Huang, T.H.; Kang, Z.H.; Teng, J.T. A brain-controlled rehabilitation system with multiple kernel learning. In Proceedings of the IEEE International Conference on Systems, Man, and Cybernetics, Anchorage, AK, USA, 9–12 October 2011.
  32. Liu, Y.H.; Chen, Y.T. Face recognition using total margin-based adaptive fuzzy support vector machines. IEEE Trans. Neural Netw. 2007, 18, 178–192. [Google Scholar] [CrossRef] [PubMed]
  33. Chen, L.F.; Liao, H.-Y.M.; Ko, M.T.; Lin, J.C.; Yu, G.J. A new LDA-based face recognition system which can solve the small sample size problem. Pattern Recognit. 2000, 33, 1713–1726. [Google Scholar] [CrossRef]
  34. Liu, Y.H.; Huang, H.P.; Weng, C.H. Recognition of electromyographic signals using cascaded kernel learning machine. IEEE/ASME Trans. Mechatron. 2007, 12, 253–264. [Google Scholar] [CrossRef]
  35. Yin, E.W.; Zeyl, T.; Saab, R.; Chau, T.; Hu, D.W.; Zhou, Z.T. A hybrid brain-computer interface based on the fusion of P300 and SSVEP scores. IEEE Trans. Neural Syst. Rehabil. Eng. 2015, 23, 693–701. [Google Scholar] [CrossRef] [PubMed]
  36. Ma, J.X.; Zhang, Y.; Cichocki, A.; Matsuno, F. A novel EOG/EEG hybrid human-machine interface adopting eye movements and ERPs: Application to robot control. IEEE Trans. Biomed. Eng. 2015, 62, 876–889. [Google Scholar] [CrossRef] [PubMed]
  37. Panicker, R.C.; Puthusserypady, S.; Sun, Y. Adaptation in P300 brain-computer interfaces: A two-classifier cotraining approach. IEEE Trans. Biomed. Eng. 2010, 57, 2927–2935. [Google Scholar] [CrossRef] [PubMed] [Green Version]
  38. Baudat, G.; Anouar, F. Generalized discriminant analysis using a kernel approach. Neural Comput. 2000, 12, 2385–2404. [Google Scholar] [CrossRef] [PubMed]
  39. Shyu, K.K.; Chiu, Y.J.; Lee, P.L.; Liang, J.M.; Peng, S.H. Adaptive SSVEP-based BCI system with frequency and pulse duty-cycle stimuli tuning design. IEEE Trans. Neural Syst. Rehabil. Eng. 2013, 21, 697–703. [Google Scholar] [CrossRef] [PubMed]
  40. Liu, Y.H.; Liu, Y.C.; Chen, Y.J. Fast support vector data descriptions for novelty detection. IEEE Trans. Neural Netw. 2010, 21, 1296–1313. [Google Scholar] [PubMed]
  41. Friedmann, J.H.; Hastie, T.; Tibshirani, R. Additive logistic regression: A statistical view of boosting. Ann. Statist. 2000, 28, 337–407. [Google Scholar] [CrossRef]
  42. Gao, J.F.; Tian, H.J.; Yang, Y.; Yu, X.L.; Li, C.H.; Rao, N.N. A novel algorithm to enhance P300 in single trials: Application to lie detection using F-Score and SVM. PLoS ONE 2014, 9. [Google Scholar] [CrossRef] [PubMed]
  43. Turnip, A.; Hong, K.-S.; Jeong, M.-Y. Real-time feature extraction of EEG-based P300 using adaptive nonlinear principal component analysis. Biomed. Eng. Online 2011, 10, 1–20. [Google Scholar] [CrossRef] [PubMed]
  44. Xiong, Y.J.; Luo, Y.; Huang, W.T.; Zhang, W.J.; Yang, Y.; Gao, J.F. A novel classification method based on ICA and ELM: A case study in lie detection. Bio-Med. Mater. Eng. 2014, 24, 357–363. [Google Scholar]
  45. Gonzalez, A.; Nambu, I.; Hokari, H.; Wada, Y. EEG channel selection using particle swarm optimization for the classification of auditory event-related potentials. Sci. World J. 2014. [Google Scholar] [CrossRef] [PubMed]
Figure 1. Overview of the proposed healthcare brain-computer interface (BCI) system.
Applsci 06 00142 g001
Figure 2. Healthcare function selection panel designed in this study. Each element of the matrix represent a function frequently performed in daily activities. (a) The panel remains dark in the switching mode; (b) The rows and the columns of the panel are all intensified for 3-s in the focus redirection period of the function selection mode; (c) The second row is being intensified during the online electroencephalography (EEG) epoch acquisition in the function selection mode.
Applsci 06 00142 g002
Figure 3. The Arduino board and the LED lamp used in our system.
Applsci 06 00142 g003
Figure 4. Spectrum of the 3-s EEG signal at Oz of one subject. The LED flickering frequency is 24.39 Hz.
Applsci 06 00142 g004
Figure 5. Illustration of the target rows and columns. If the element surrounded by the yellow box is the target element that a user keeps looking at during the data collection, the first column and the second row are defined as the target column and target row, respectively.
Applsci 06 00142 g005
Figure 6. Plot of average relative change (RC) values and standard deviations of each subject under flashing and no-flashing conditions.
Applsci 06 00142 g006
Figure 7. P300 potentials of five subjects obtained from the EEGs of 10-round intensification process recorded at Pz.
Applsci 06 00142 g007
Figure 8. P300 classification rates of different methods.
Applsci 06 00142 g008
Table 1. Optimal P300 detector parameters for each subject.
SubjectdC σ k σ s
1310024211
2910027213
351002728
44100022211
5710028212
Table 2. Average relative charge (RC) values and standard deviations (Sd) of five subjects under flickering and no flickering conditions.
ChannelFlickeringNo Flickering
Average RCSd Average RCSd
O11.550.61−0.220.34
Oz1.880.67−0.160.48
O21.420.58−0.270.41
Table 3. True positive rate (TPR) and false positive rate (FPR) of steady-state visually evoked potential (SSVEP) detection results at Oz.
ResultsSub1Sub2Sub3Sub4Sub5Average
TPR100%95%75%100%95%93%
FPR10%5%20%20%15%14%
Table 4. Best combination of flickering frequency and duty cycle for each subject.
Best CombinationSub1Sub2Sub3Sub4Sub5
Flickering Frequency (Hz)22.7224.3923.2624.3921.74
Duty Cycle (%)7070301050
Table 5. Comparisons of average classification accuracy between different P300 detectors (in %). K-NN: K-neighbor neighbor; SVM: support vector machine; FLDA: Fisher linear discriminant analysis; BLDA: Bayesian linear discriminant analysis; OLS: ordinary least squares; Kernel FDA: Kernel Fisher’s discriminant analysis.
P300 DetectorsN = 1N = 2N = 3N = 4N = 5N = 6N = 7N = 8N = 9N = 10
K-NN63.266.168.375.078.181.785.085.988.289.1
SVM71.772.576.480.284.186.488.190.192.393.1
FLDA64.165.869.775.377.882.785.487.288.790.3
BLDA68.572.477.280.383.686.487.788.990.592.8
Gradient boosting with OLS72.576.381.782.383.586.389.393.195.695.6
Kernel FDA + SVM76.481.383.786.488.189.591.093.295.495.5

