Viscosity and Waterproofing Performance Evaluation of Synthetic Polymerized Rubber Gel (SPRG) after Screw Mixing


1
School of Architecture, Seoul National University of Science & Technology, 232 Gongneung-ro, Nowon-gu, Seoul 01811, Korea
2
Department of Railway Construction, Graduate School of Railway, Seoul National University of Science and Technology, 232 Gongneung-ro, Nowon-gu, Seoul 01811, Korea
3
Program of Architecture of Convergence Institute of Biomedical Engineering and Biomaterials of Graduate School, Seoul National University of Science and Technology, 232 Gongneung-ro, Nowon-gu, Seoul 01811, Korea
*
Author to whom correspondence should be addressed.
Appl. Sci. 2018, 8(10), 1989; https://0-doi-org.brum.beds.ac.uk/10.3390/app8101989
Submission received: 21 September 2018
/
Revised: 15 October 2018
/
Accepted: 16 October 2018
/
Published: 19 October 2018
(This article belongs to the Section Materials Science and Engineering)
Abstract
:As opposed to asphalt emulsion waterproofing membrane, Synthetic Rubber Polymer Gel (SPRG) waterproofing materials are not heated prior to installation in concrete structures. SPRG materials are typically required to undergo a screw-mixing process to temporarily reduce the high viscosity and facilitate membrane installation on a concrete surface. However, there is no standard regulation on the duration of screw-mixing time during SPRG construction. Reported construction cases indicate that SPRG are left under constant screw mixing and are reused after hours or days of rest without being replaced with fresh products. When installed in this condition, SPRGs are subject to waterproofing performance degradation. In this study, SPRG viscosity properties are measured after five different screw-mixing procedures (no screw mixing, 10, 20, 30 and 60 min) and are set to rest in storage (2 h, 1, 2, 3, and 7 days). Specimens prepared under the respective screw mixing and storage times are evaluated for their changes in waterproofing properties through a series of ISO TS 16774 standard evaluation methods. A correlative comparison of the property evaluation results is presented to provide the changes to SPRG property and waterproofing performance. These results are then used to propose a general guideline for selecting optimal screw-mixing time with respect to maintaining adequate waterproofing performance and the viscosity recovery property of SPRG.
1. Introduction to SPRG Materials and Screw Mixing
1.1. Background
Synthetic polymerized rubber gel (SPRG) is commonly known to have higher adhesion and elongation properties than most conventional waterproofing materials [1]. However, it is difficult to install SPRG-based waterproofing sealants taken directly from factory manufacturing and achieve an evenly distributed application without prior screw mixing. To secure adequate workability, SPRG materials are placed in a screw-mixing apparatus to reduce viscosity [2].
A quality management-related problem is that construction site workers are unaware of the consequences of excessive SPRG screw mixing. Often, workers leave the screw mixer apparatus running throughout the entire daily construction work time [3]. Moreover, in between waterproofing the different sections, unused SPRG that was continuously screw mixed is reused instead of being replaced with fresh products to reduce material costs. If screw mixed for short durations, SPRG can recover to its original physical property with the intended, optimal waterproofing performance. If the screw mixing time is too extended and storage occurs irregularly in between the screw-mixing intervals, the shear stress caused by the rotating extruders can cause permanent physical degradation in SPRG [4]. This study proposes a method to derive a standard screw-mixing time to minimize the degradation of SPRG used for waterproofing in construction sites by comparing the waterproofing performance of the SPRG after being subjected to different screw-mixing times.
1.2. SPRG Material
SPRG is a polymer modified (Styrene-Butadiene-Styrene (SBS) modified) bituminous emulsion specifically designed for waterproofing applications. To constantly maintain a ‘non-curable’ state, SPRG polymers are not completely cross-linked to permanently retain high viscoelasticity throughout their lifetime [5]. This is intended to provide high resistance to long-term physical stress caused by substrate joint movement and hydrostatic pressure, have self-healing properties, and resist deformation due to environmental degradation factors [6].
The SPRG samples used in this study were selected based on the quality performance criteria outlined in the “KS F 4935: 2008 Adhesive Flexible Rubber Asphalt-Based Injection-Type Sealant for Repairing Leaks” test standard. The sample was manufactured by combining process oil and rubber polymer (SBS 501) with bitumen resin compound (AP-3). The compounds were pumped from their respective containers in a colloid mill and mixed. The colloid mill mixing rotation was set to between 1200 and 1300 RPM, and the temperature was set to 160~170 °C. This SPRG sample is capable of being installed as both a base coating material for composite sheet waterproofing membranes and as grout injection repair material for concrete crack repairs, and has an average original viscosity of 3,512,000 cps after the manufacturing process. Refer to Table 1 for the SPRG structural component list and specifications.
1.3. Application Methods/Types and Problems
1.3.1. Grout Injection Application for Concrete Leakage Crack Repair
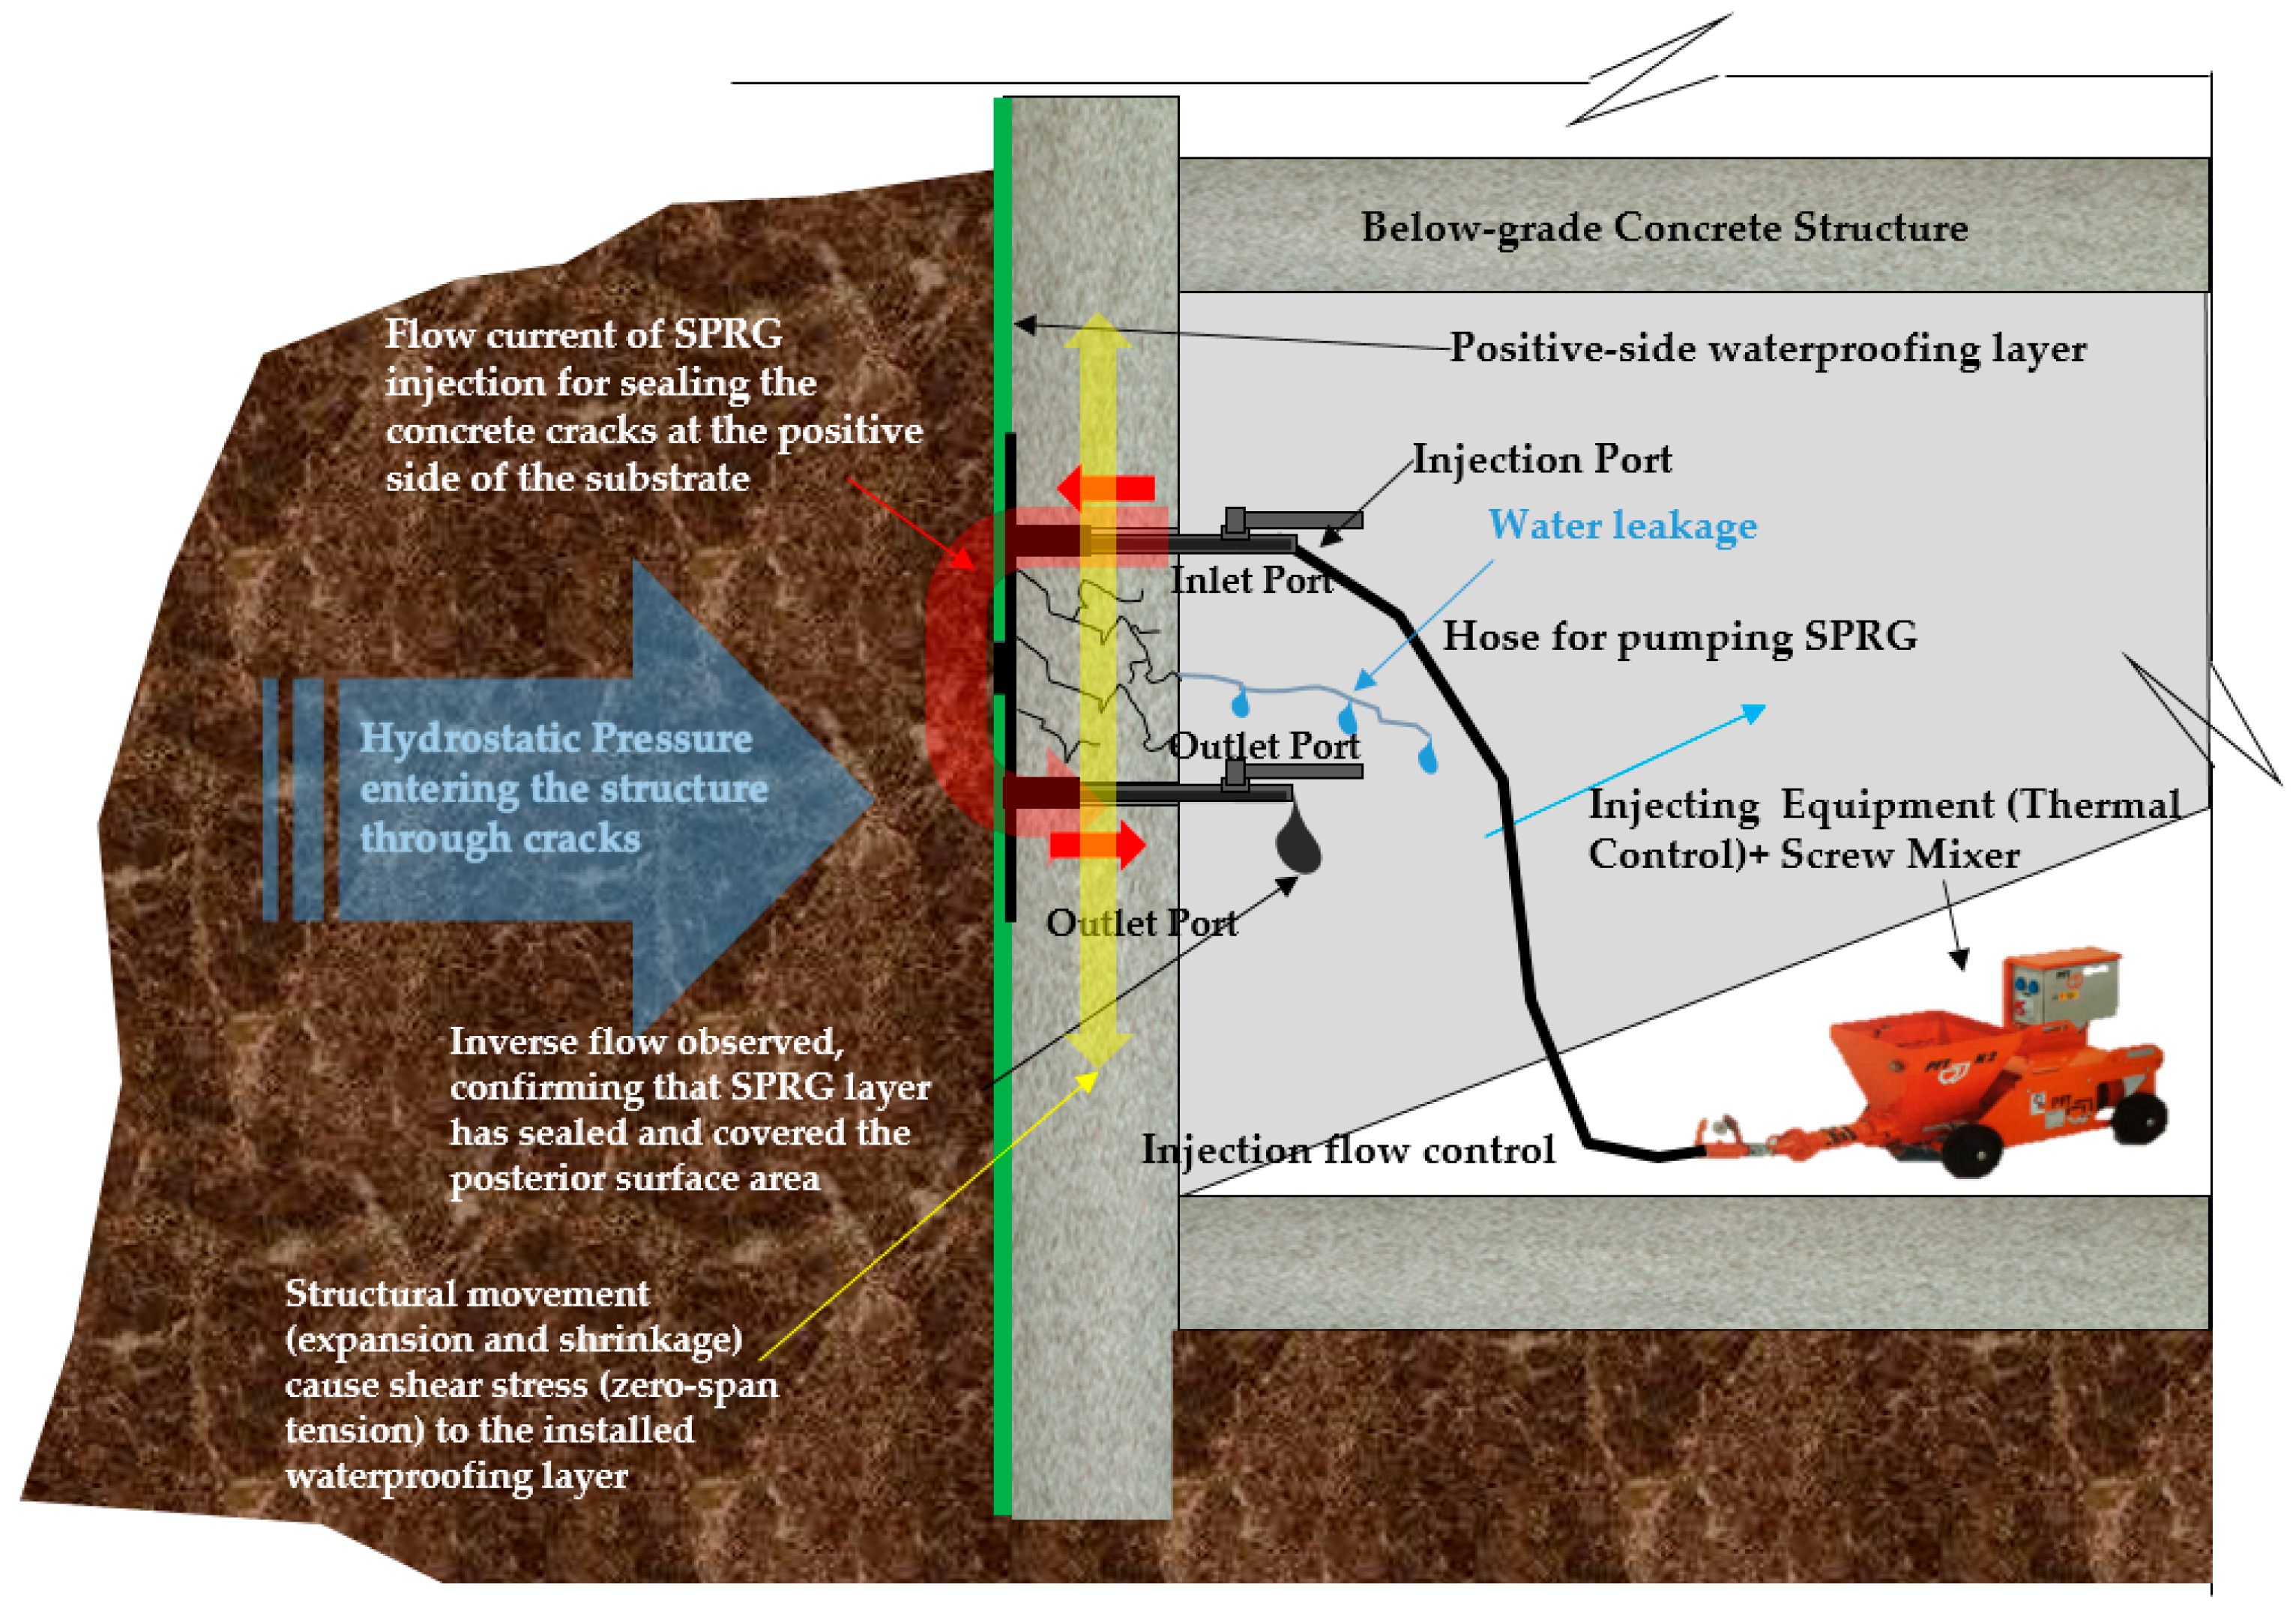
Grout injection-type SPRG systems are installed through a positive side grout injection in leaking concrete structures. The SPRG grout injection repair method is commonly used where the existing waterproofing layer is installed on the positive side of walls, and not easily accessible for repair. Maintenance injection holes are drilled into multiple locations and installed with injection ports, through which the waterproofing gel (SPRG) is injected [7]. The SPRG is dispersed throughout the positive side of the wall due to the injection pressure, forming a reinforcing layer on the existing waterproofing membrane layer and preventing further water leakage [8]. Figure 1 gives an illustration of the grout injection method using SPRG waterproofing material.
1.3.2. 1-Ply or 2-Ply Composite Sheet Membrane Application for Waterproofing
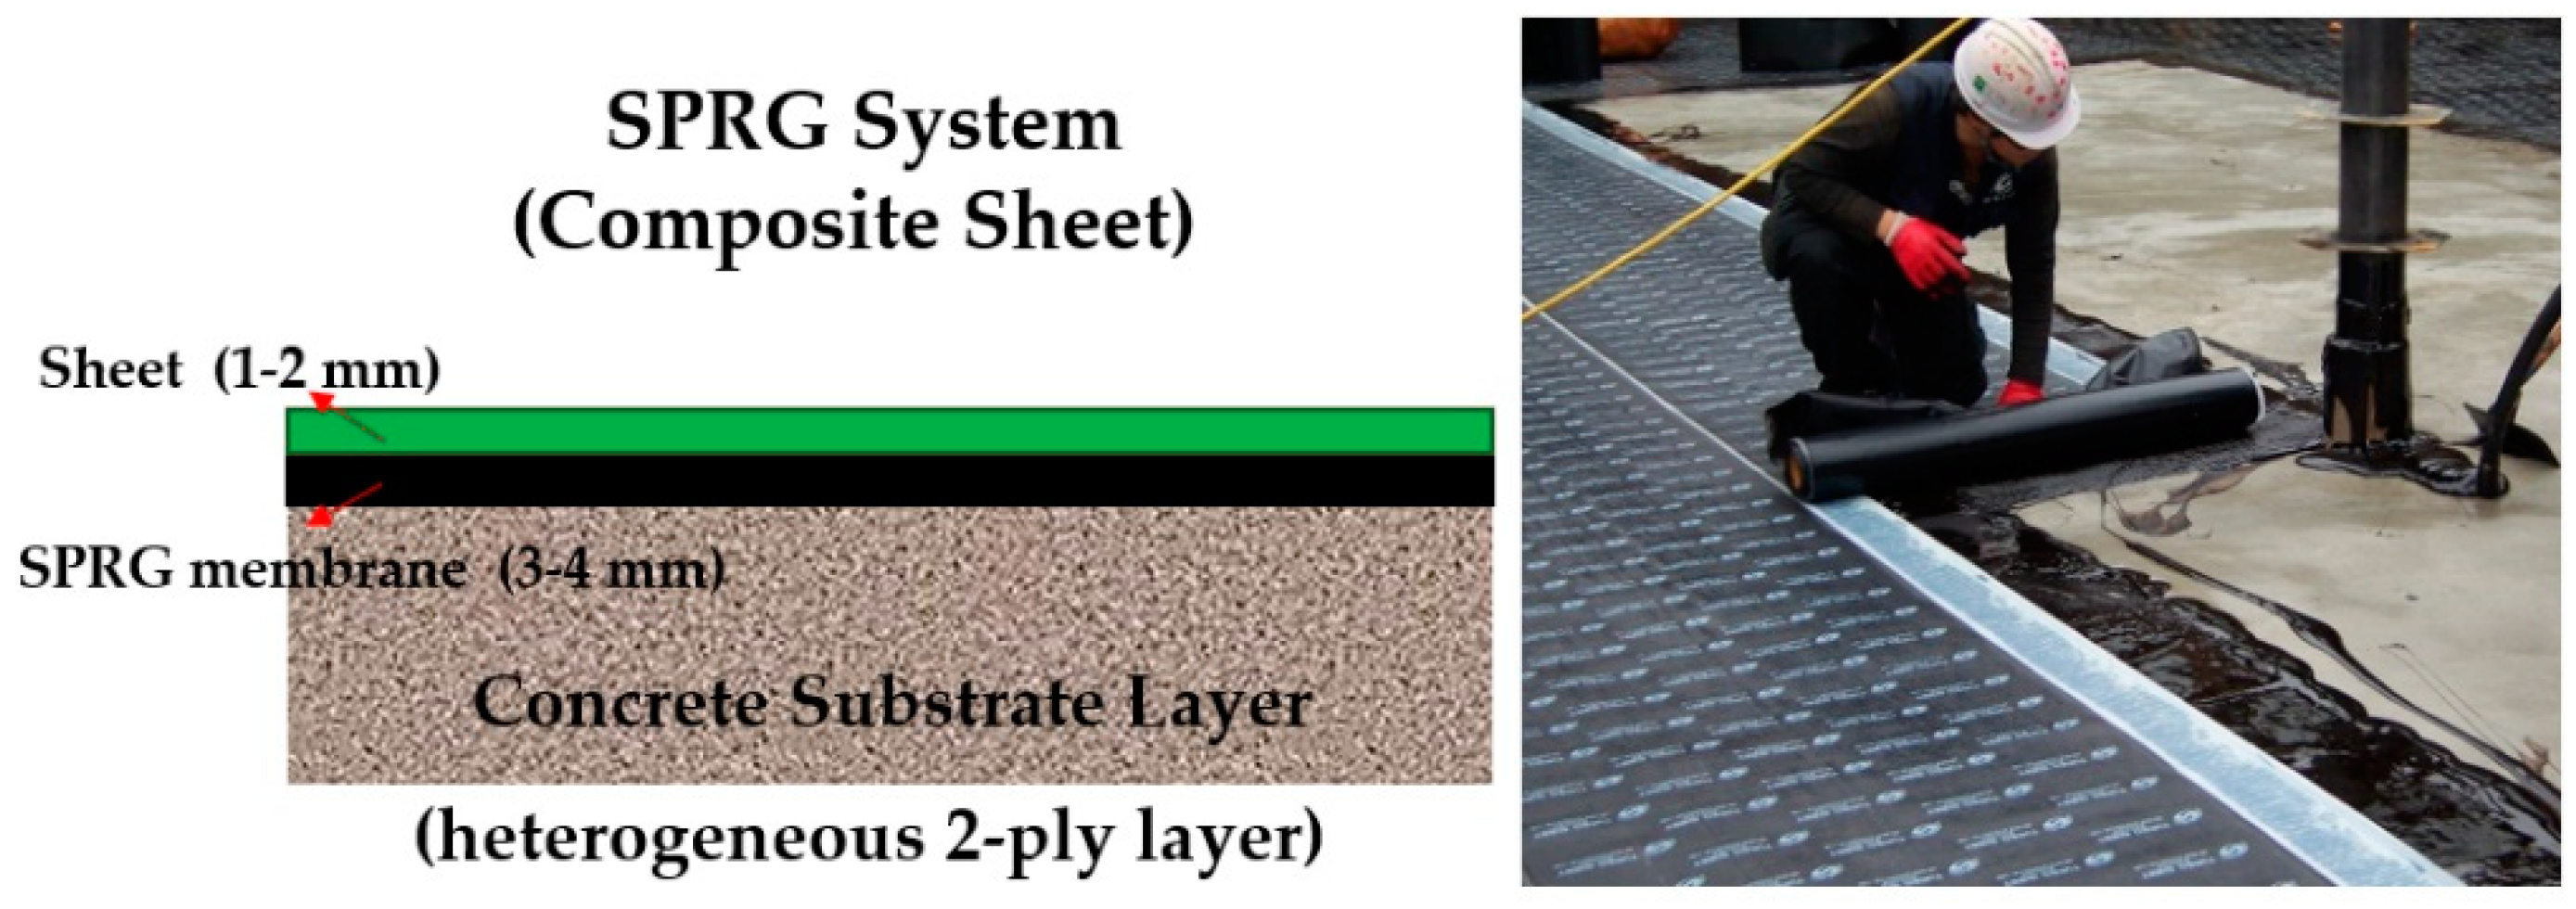
SPRG-based waterproofing membrane sheets are composite (double-ply) waterproofing sheet membranes. Composite SPRG waterproofing sheet membranes are installed by first applying the SPRG directly onto the concrete structures (with or without a primer, depending on the concrete base surface condition), followed by a conventional sheet membrane installed on top of the gel layer. Figure 2 below provides an illustration of the 2-ply composite type of waterproofing sheet systems.
Much like the case with the grout injection-type application, the SPRG membrane layer can be subject to severe degrees of deformation if it is screw mixed for too long. The cohesive bonding of the SPRG can be weakened, which can result in the sheet membrane peeling off due to its own weight during construction [9]. In such cases, the removal and reinstallation of both the SPRG layer and the sheet membrane can extend the construction time and costs [10,11]. The deterioration effects due to excessive screw mixing on the waterproofing performance can reduce the lifetime of SPRG waterproofing systems. This is evidenced mostly by the results of water or SPRG supernatant (oil and minimal filler content) leakage in the concrete structure [12].
1.4. SPRG Degradation Mechanism Caused by Excessive Screw Mixing
Composite SPRG waterproofing membrane installation is commonly conducted through the following two steps: screw mixing is conducted with an extruder apparatus, and spread work, commonly with a long-handled roller. During the second step, the extruder apparatus is constantly left running to ensure subsequent SPRG installation work proceeds without delay and to reduce sequential installation time. On the surface, this result may seem like a positive outcome, but there is a risk of waterproofing performance loss. A simple experiment can be referred to in order to observe the effect of screw-mixing duration on the workability of SPRG. SPRG samples were prepared and the viscosity was measured immediately after the predetermined screw-mixing times. Afterwards, the same sample was installed over a 1 m2 concrete slab surface with a small roller and metallic spatula and the time taken to install a layer of approximately 2 mm thickness was measured. The results of the testing showed that the difference in the installation time was notably reduced in relation to the reduction of the viscosity recovery rate.
The correlation between viscosity reduction and the shortening of the installation time is already a commonly known phenomenon for workers who are familiar with SPRG waterproofing materials, but the consequence of permanent viscosity loss is not a factor that is normally taken into consideration. While the installation mechanism is different in the case of grout injection for repairs, similar results can be expected from excessive screw-mixing time. In order to disclose the potential problems that could ensue due to excessive screw mixing, the respective degradation mechanisms caused by the mechanical strain of the extruder need to be discussed.
1.4.1. Physical Degradation Mechanism
SPRG physical property degradation mechanism can be classified into two types: (1) polymeric crosslink breakage due to shear stress; and (2) particle layer segregation due to emulsion breaking during storage after initial usage. Hooke’s Law explains that the deformation of lightly cross-linked polymeric materials with viscoelastic properties depends on the strain and temperature. Stress (σ) is proportional to strain (ε), which can be expressed with the following equation of Hooke’s Law:
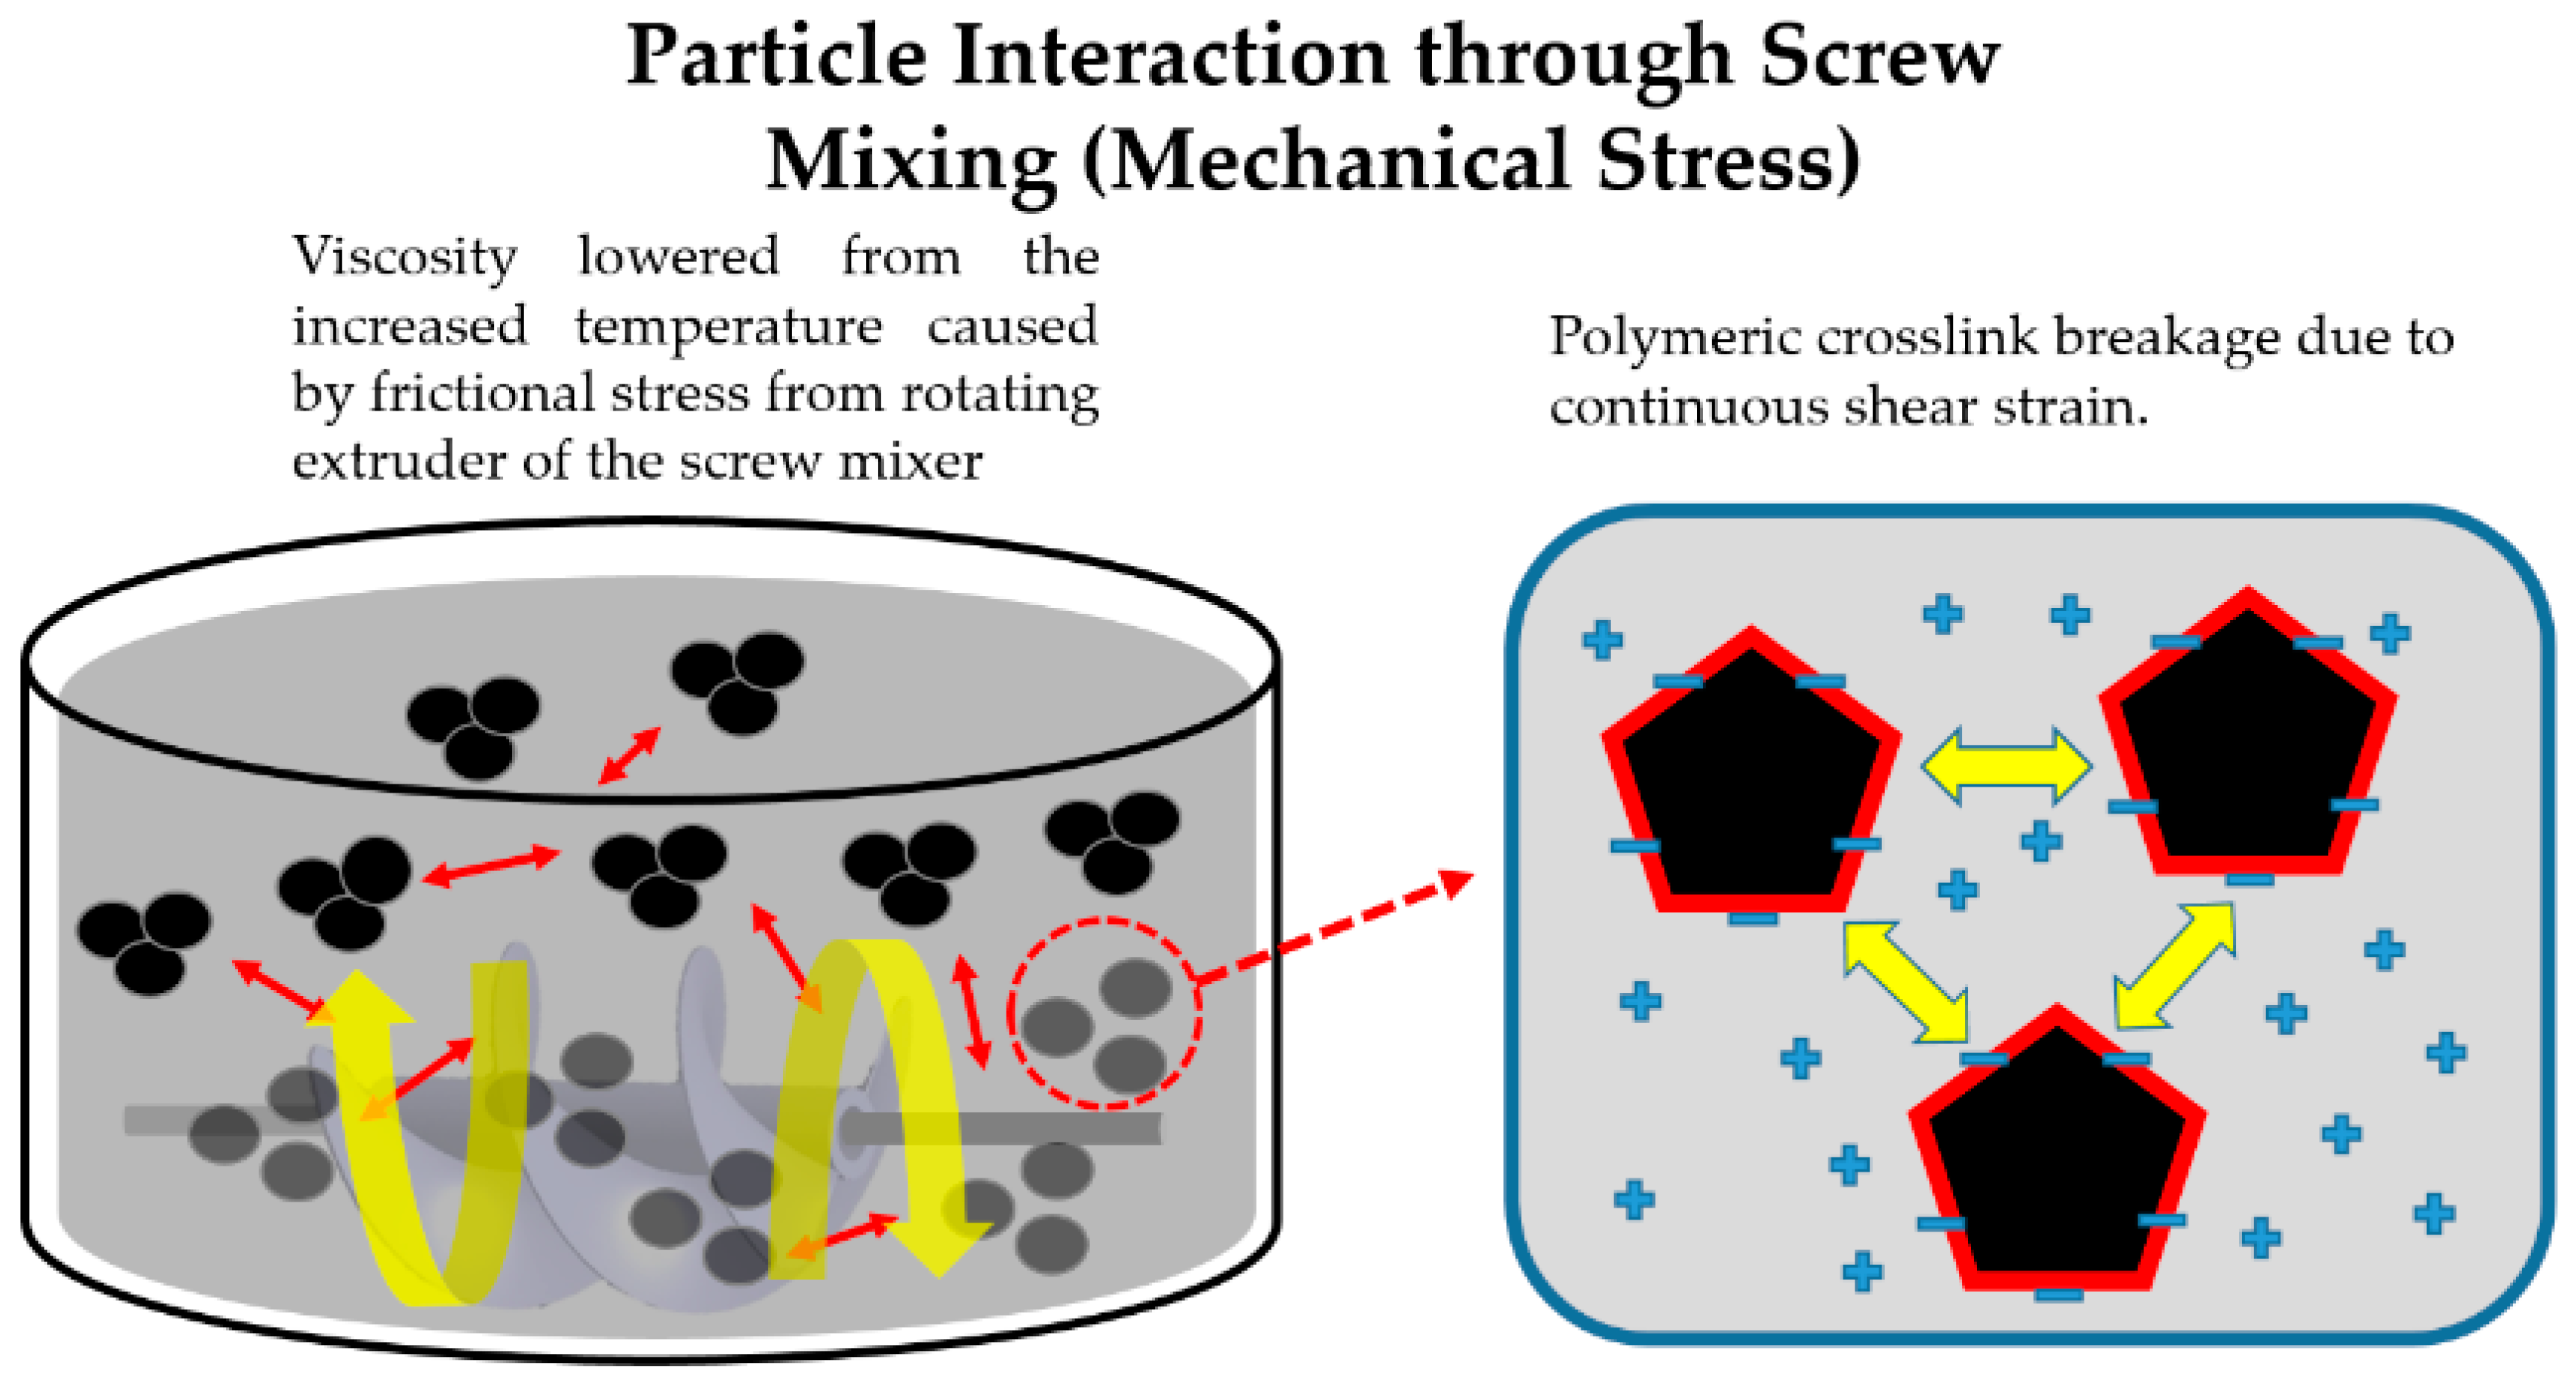
As mentioned in Section 1.2, SPRGs have a naturally weaker polymeric crosslink, and a lower elastic limit as opposed to other types of polymeric rubber type waterproofing materials. Throughout the screw-mixing process, the temperature of SPRG can rise up to 60~70 °C, which causes the viscosity to be reduced to less than a tenth of the original viscosity of the SPRG (Table 2), in accordance with the Arrhenius temperature-viscosity model. In this state, polymer crosslink breakage is induced relatively easily if screw mixing occurs for too long. Figure 4 gives an illustration of this concept.
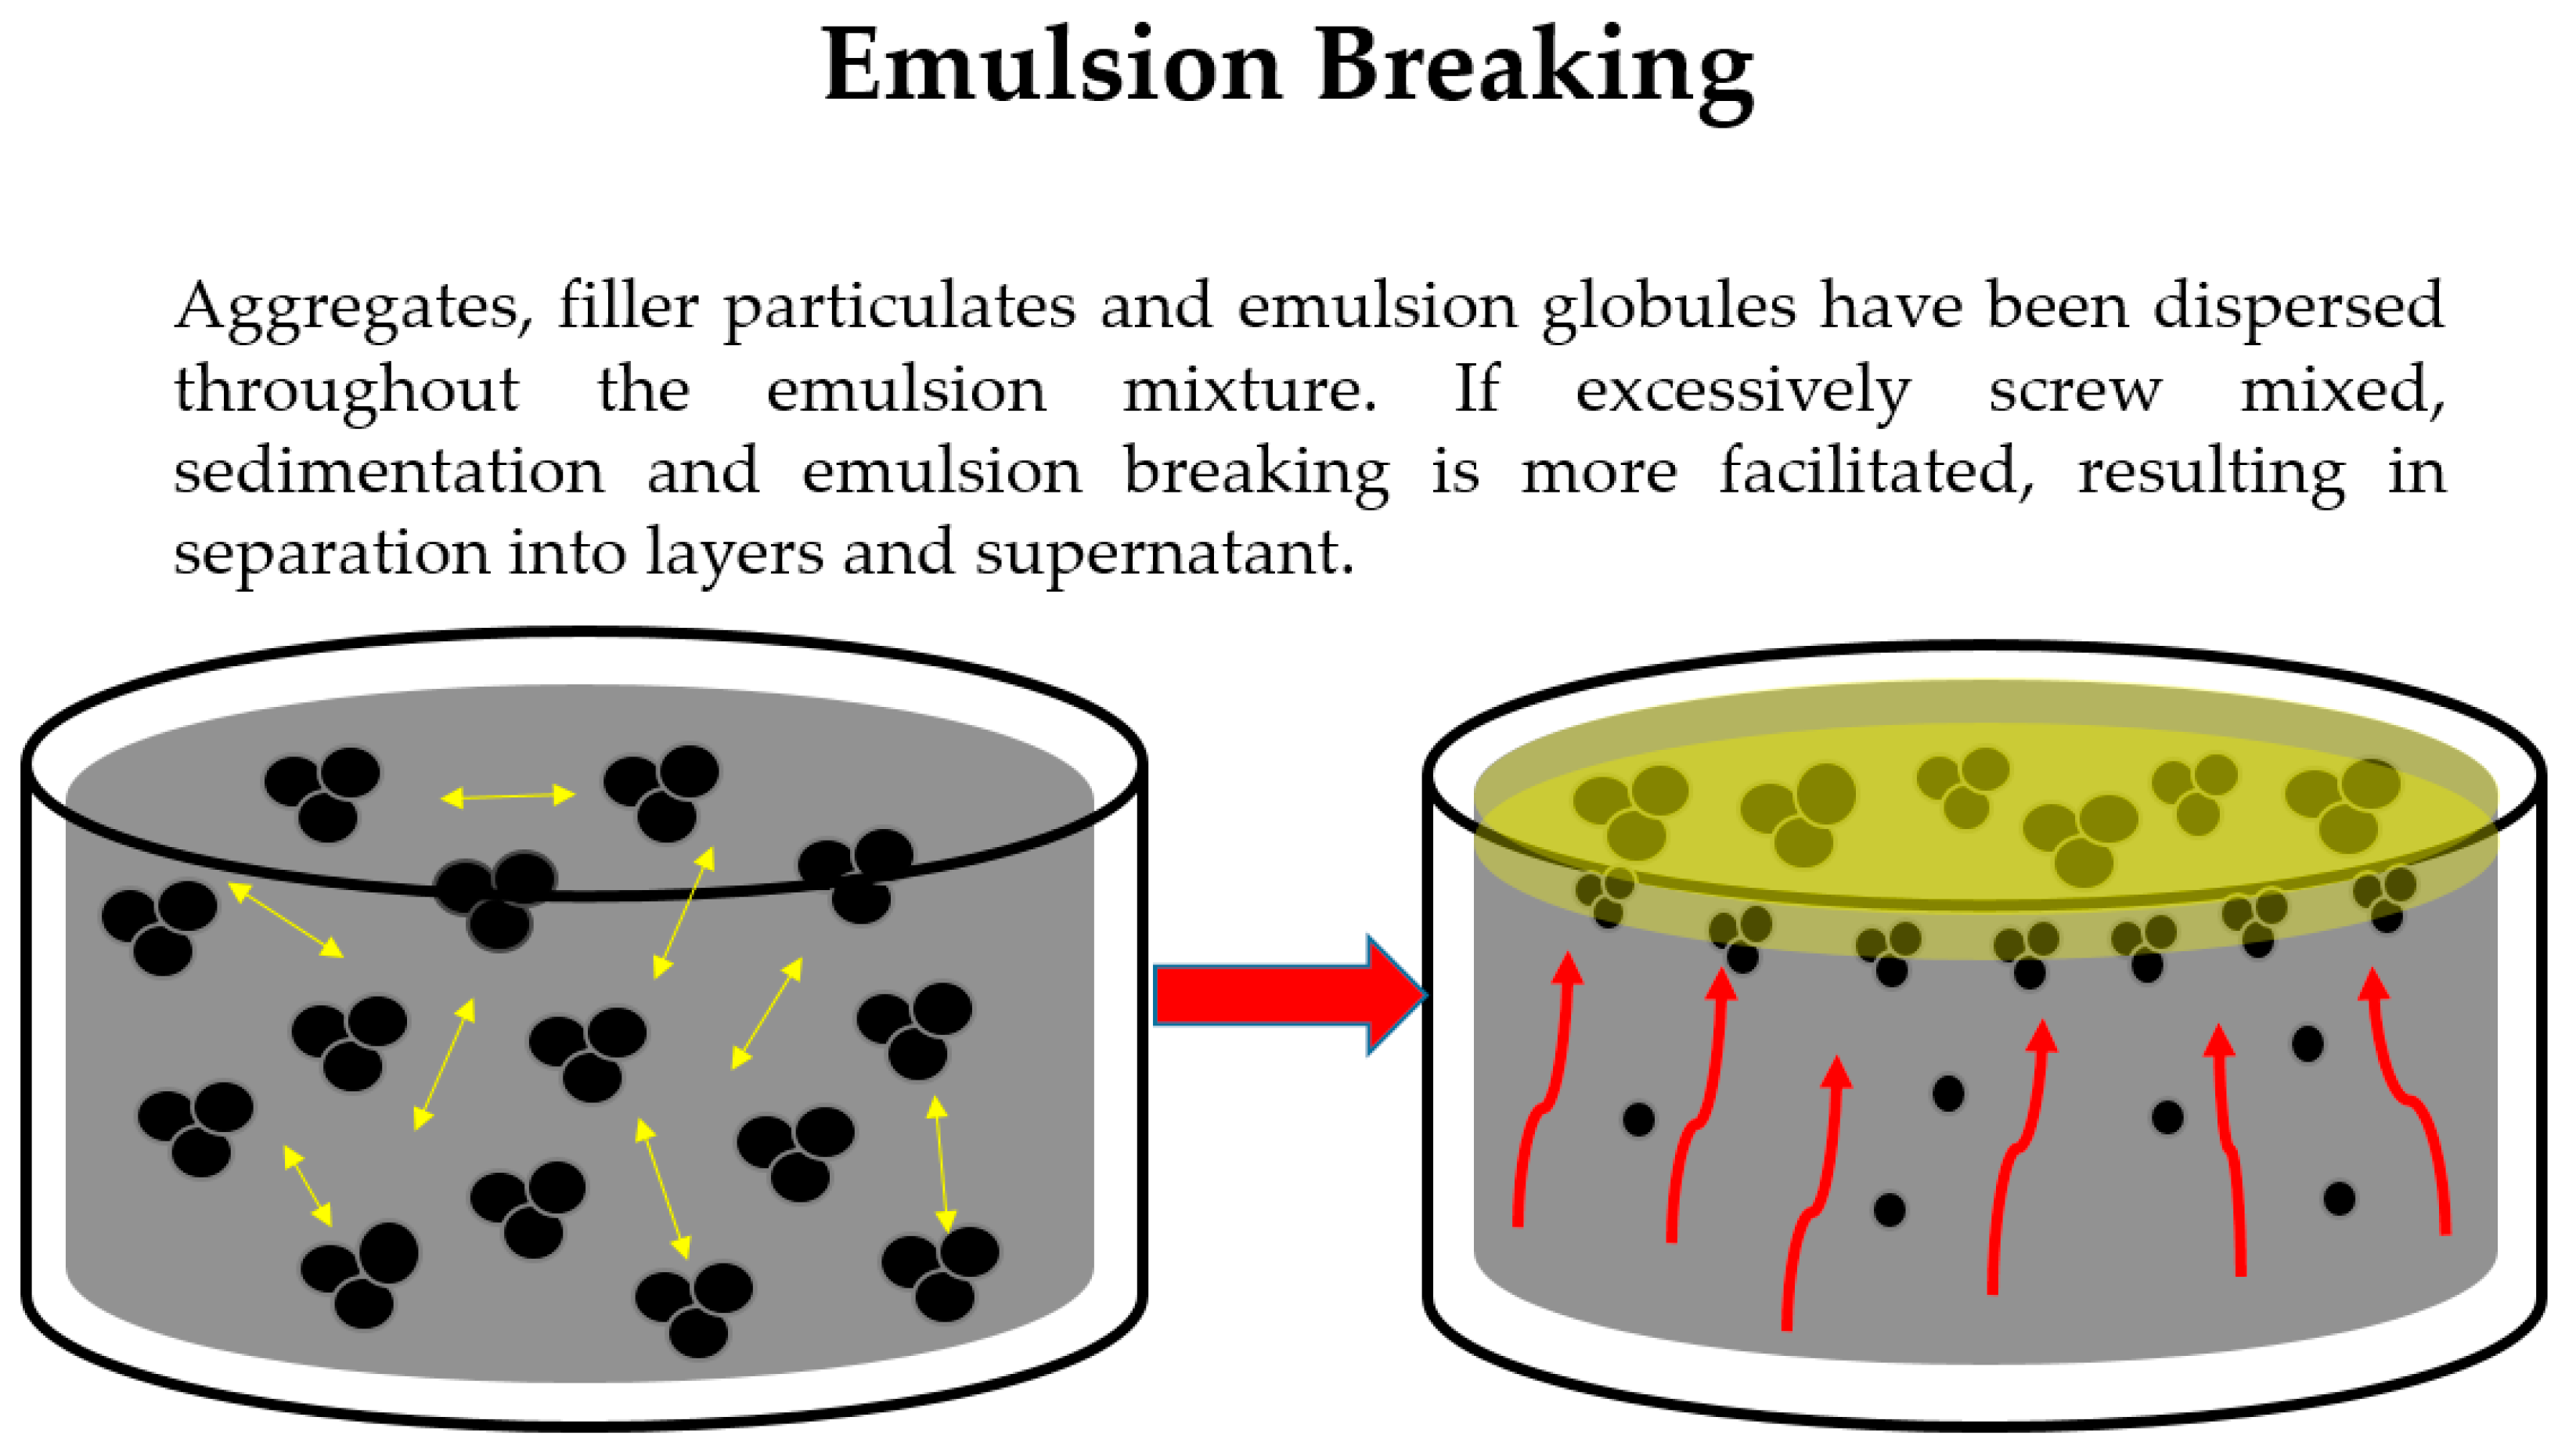
When set to rest after the screw-mixing process, emulsion breaking and sediment layer hardening can occur more easily. Under normal circumstances, bitumen globules form larger particles when the small aggregate particles coalesce with the emulsifier and the binders, making the emulsion structure stable for a predetermined period [12]. When SPRG is screw mixed for too long, however, the emulsifier is dispersed more thoroughly. In this state, a larger amount of emulsifier leaves the emulsion through the supernatant, mostly comprising process oil and a minimal amount of filler ash content [12]. Supernatants have a higher flow velocity with very low viscosity, and are more easily able to flow through concrete cracks and leaks into the concrete interior. With a higher concentration of solvent chemicals that were not able to bind to the aggregates, this type of supernatant leakage can cause economic and environmental hazards [12]. Figure 5 below provides an illustration of this process.
During the construction period when the SPRG is installed onto the concrete surface, oxidation of the binders in the emulsion can also occur and can weaken the physical and chemical polymeric crosslink when exposed to heat, sunlight and oxygen [13]. If the emulsifiers are too dispersed due to excessive screw mixing, the SPRG could lose its self-healing properties as well [14].
If the SPRG is reused after storage following an excessive screw-mixing time, the SPRG may not have recovered its original viscosity, and the waterproofing performance may have been lost beyond recovery. When subject to a minimum duration of screw mixing, the above-mentioned deformation mechanisms may not apply to certain SPRG products, and reuse after different storage periods may even be possible. In this regard, viscosity recovery rate can be possible, but a stable screw-mixing duration threshold is currently undefined. During SPRG construction, screw mixing should be controlled to minimize the material degradation and risks of long-term durability failure.
1.4.2. Effects on Waterproofing Performance and Requirements of New Evaluation Regimes
Conventional performance evaluation methods found in national standard test methods such as American Society for Testing and Materials (ASTM), British Standard European Norm (BS EN), Korean Industrial Standard (KS) or Guo Biao (GB) have limitations on properly disclosing and assessing precise deformation mechanism and SPRG waterproofing performance changes after excessive screw mixing. Measuring only the viscosity change and recovery rate does not provide an indication of the changes in the long-term durability of the waterproofing layer and the expected influence on the waterproofing performance. According to ISO TR 16475 Guidelines for the Repair of Water-Leakage Cracks in Concrete Structures, for sealant type waterproofing membranes used in below-grade concrete structures (such as SPRG that can be used as grout materials or a base coating layer for composite sheet membrane), a qualitative waterproofing performance evaluation after exposure to physical degradation conditioning is required. Based on the degradation mechanism characteristics and the construction environment, the following 4 evaluation regimes were adopted from the related ISO TS 16774 Test methods for Repair Materials for Water-leakage Cracks for Underground Concrete Structures. The reasoning for the selection of the 4 regimes is provided below.
(1) Wash out (material loss) resistance performance
After excessive screw mixing, the rheological property of SPRG is subject to change. Most SPRG type waterproofing materials are thixotropic, and the dispersion of particles and reduced elasticity will increase the relative flow velocity. A higher relative flow velocity means SPRG will spread more as it settles after installation, which can also indicate more exposed surface area for supernatant or dispersed particles of the SPRG being ‘washed away’ (eroded from hydrostatic pressure). This is particularly problematic during the construction period. Due to sudden rainfall or surrounding water in the underground environment, the exposed supernatant could be washed out of the SPRG. From a long-term perspective, this can result in the loss of self-healing or viscoelastic properties due to facilitated demulsification, which results in the waterproofing membrane hardening.
(2) Cohesive stability/Adhesion strength performance
For the same reasons outlined above, in cases where SPRG is installed as a composite sheet membrane, the waterproofing membrane could peel off (cohesive failure) due to the weight of the sheet, slide off due to high temperature in the ambient condition, or fail to adhere to the wet concrete surface.
(3) Hydrostatic pressure resistance performance
While the impermeability properties of the SPRG membrane may be relatively unchanged from screw mixing, it has been documented from case studies that the supernatant can be ‘pushed’ out through concrete cracks due to hydrostatic pressure [12]. The installed waterproofing membrane can also be physically displaced from the high hydrostatic pressure, creating leakage paths between the adhesion interface for water migration.
(4) Hydrostatic pressure resistance after being subject to substrate movement stress performance
From a long-term perspective after construction has been completed, the SPRG membrane will be subjected to cyclic concrete substrate movement. While properly installed SPRG after minimal screw-mixing duration can normally withstand the continued zero-span tensile stress without compromising waterproofing performance, excessively screw-mixed SPRG may have been degraded to a point where it can no longer withstand hydrostatic pressure or substrate movement stress.
Based on the above waterproofing performance degradation and deformation mechanisms, new evaluation criterion was designed for SPRG quality control, and a demonstration evaluation method was conducted.
2. Evaluation and Experimental Methods: SPRG Evaluation Based on Screw-Mixing Time, Storage and Waterproofing Performance Changes
2.1. Evaluation Plan Overview
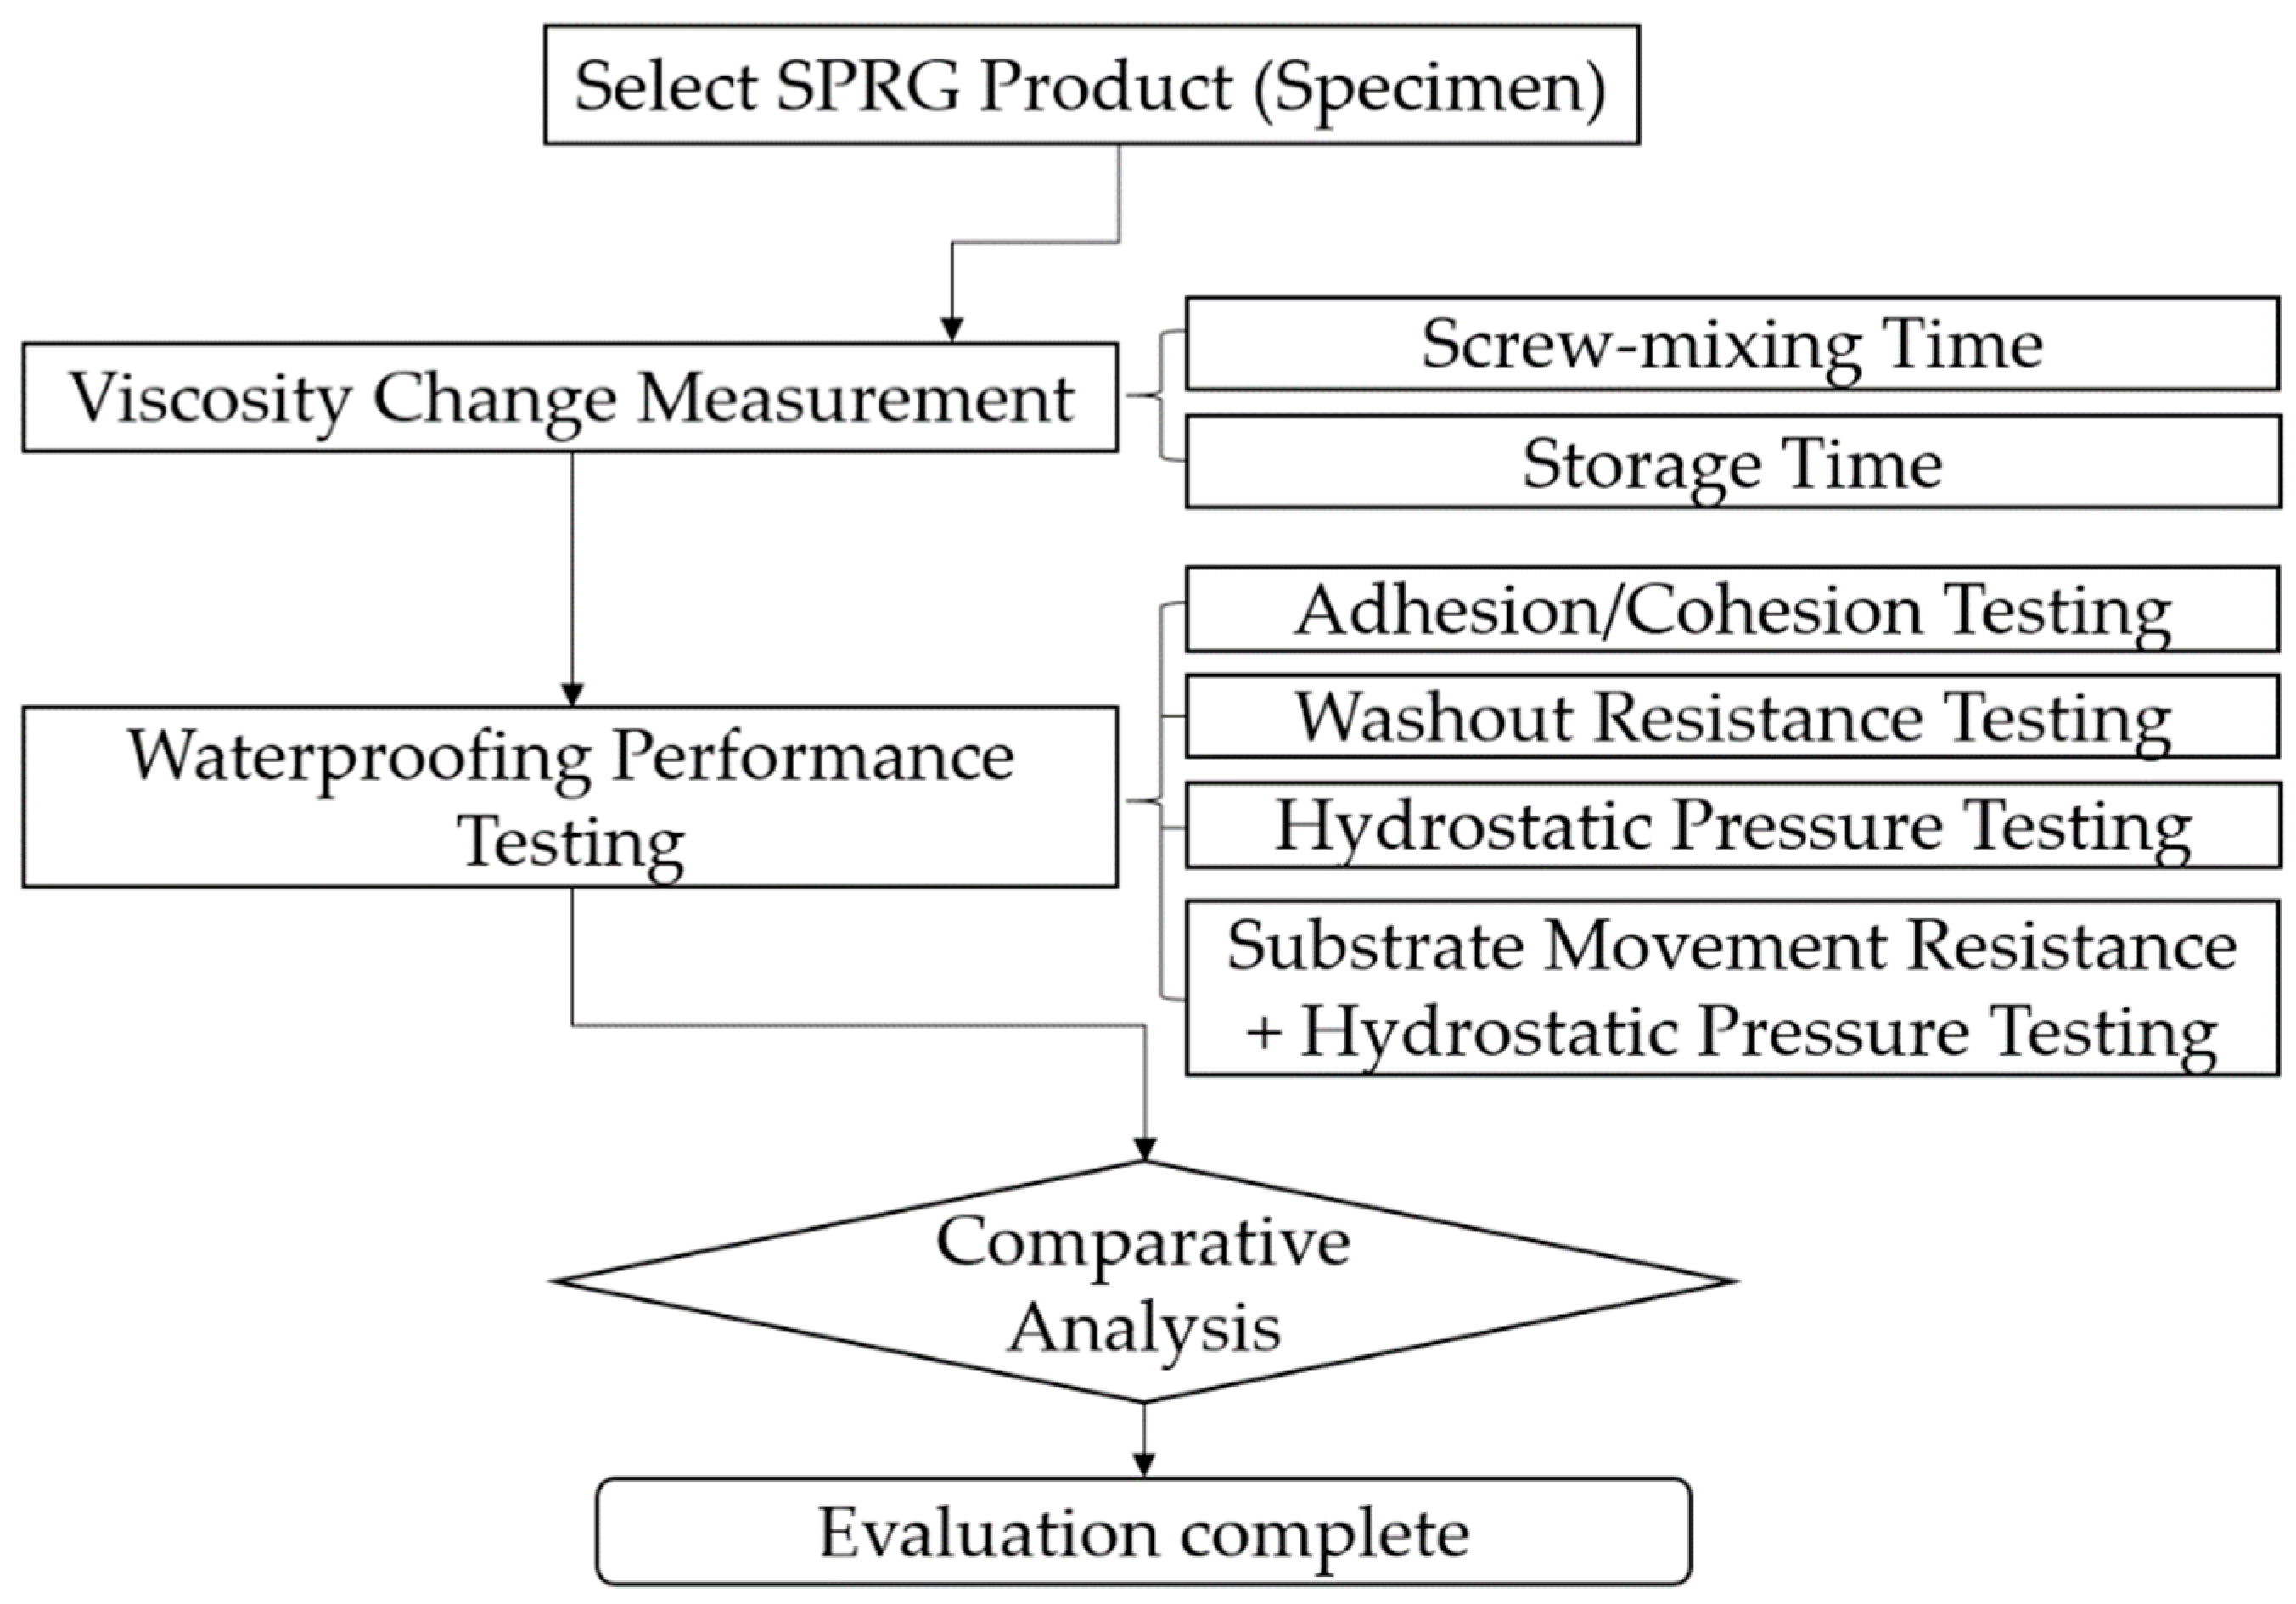
In this study, an evaluation procedure was designed to evaluate SPRG waterproofing property changes based on different screw mixing times and subsequent storage before re-usage in the same construction project. Based on the respective screw-mixing time, the specimen was set to rest for predetermined periods of storage. The viscosity change was measured throughout the daily intervals, and the viscosity loss rate was derived. Once the viscosity of the SPRG sample had been measured at the specific screw-mixing and storage interval, a specimen was made out of the sample to undergo four different waterproofing performance change tests. After the results were obtained from the respective evaluation methods, a comprehensive comparative analysis between specimens subjected to different screw-mixing times was conducted. The flow chart in Figure 6 below gives a general overview of the evaluation procedure.
2.2. Screw-Mixing Method
For the screw-mixing conditioning of the SPRG specimen, a PFT N2 PUMP apparatus was used. The selected SPRG sample for this study commonly uses a PFT N2 PUMP apparatus during concrete structure installation. Table 3 gives the device specifications.
2.3. Viscosity Change Measurement
2.3.1. Screw Mixing and Storage Time Conditions
The screw-mixing time conditions and subsequent storage times are outlined in Table 4. The conditions were selected based on the below-grade construction sites often encountered in Korea. As there are no reliable documented records on the screw-mixing or storage times, it was assumed, for the sake of demonstrating the evaluation method in this study, that the screw-mixing time can reach as long as up to one hour without stopping in between during construction intervals. A non-screw mixed (NSM) conditioned specimen was also included to serve as a reference point for performance comparison criteria. The storage times before reuse were set between daily intervals (hereafter referred to as storage time). A period condition of 2 h was also included as this condition is an estimation of the stop time in between construction work, moving from one site point to another, and a 7-day storage period was also selected for experimental observation purposes. Screw-mixing and storage time conditions were subject to change based on the objectives and requirements of the evaluation. The ambient condition was set to 20 ± 3 °C and at 60 ± 5% relative humidity for all screw-mixing and storage times.
2.3.2. Viscosity Change Measurement Method
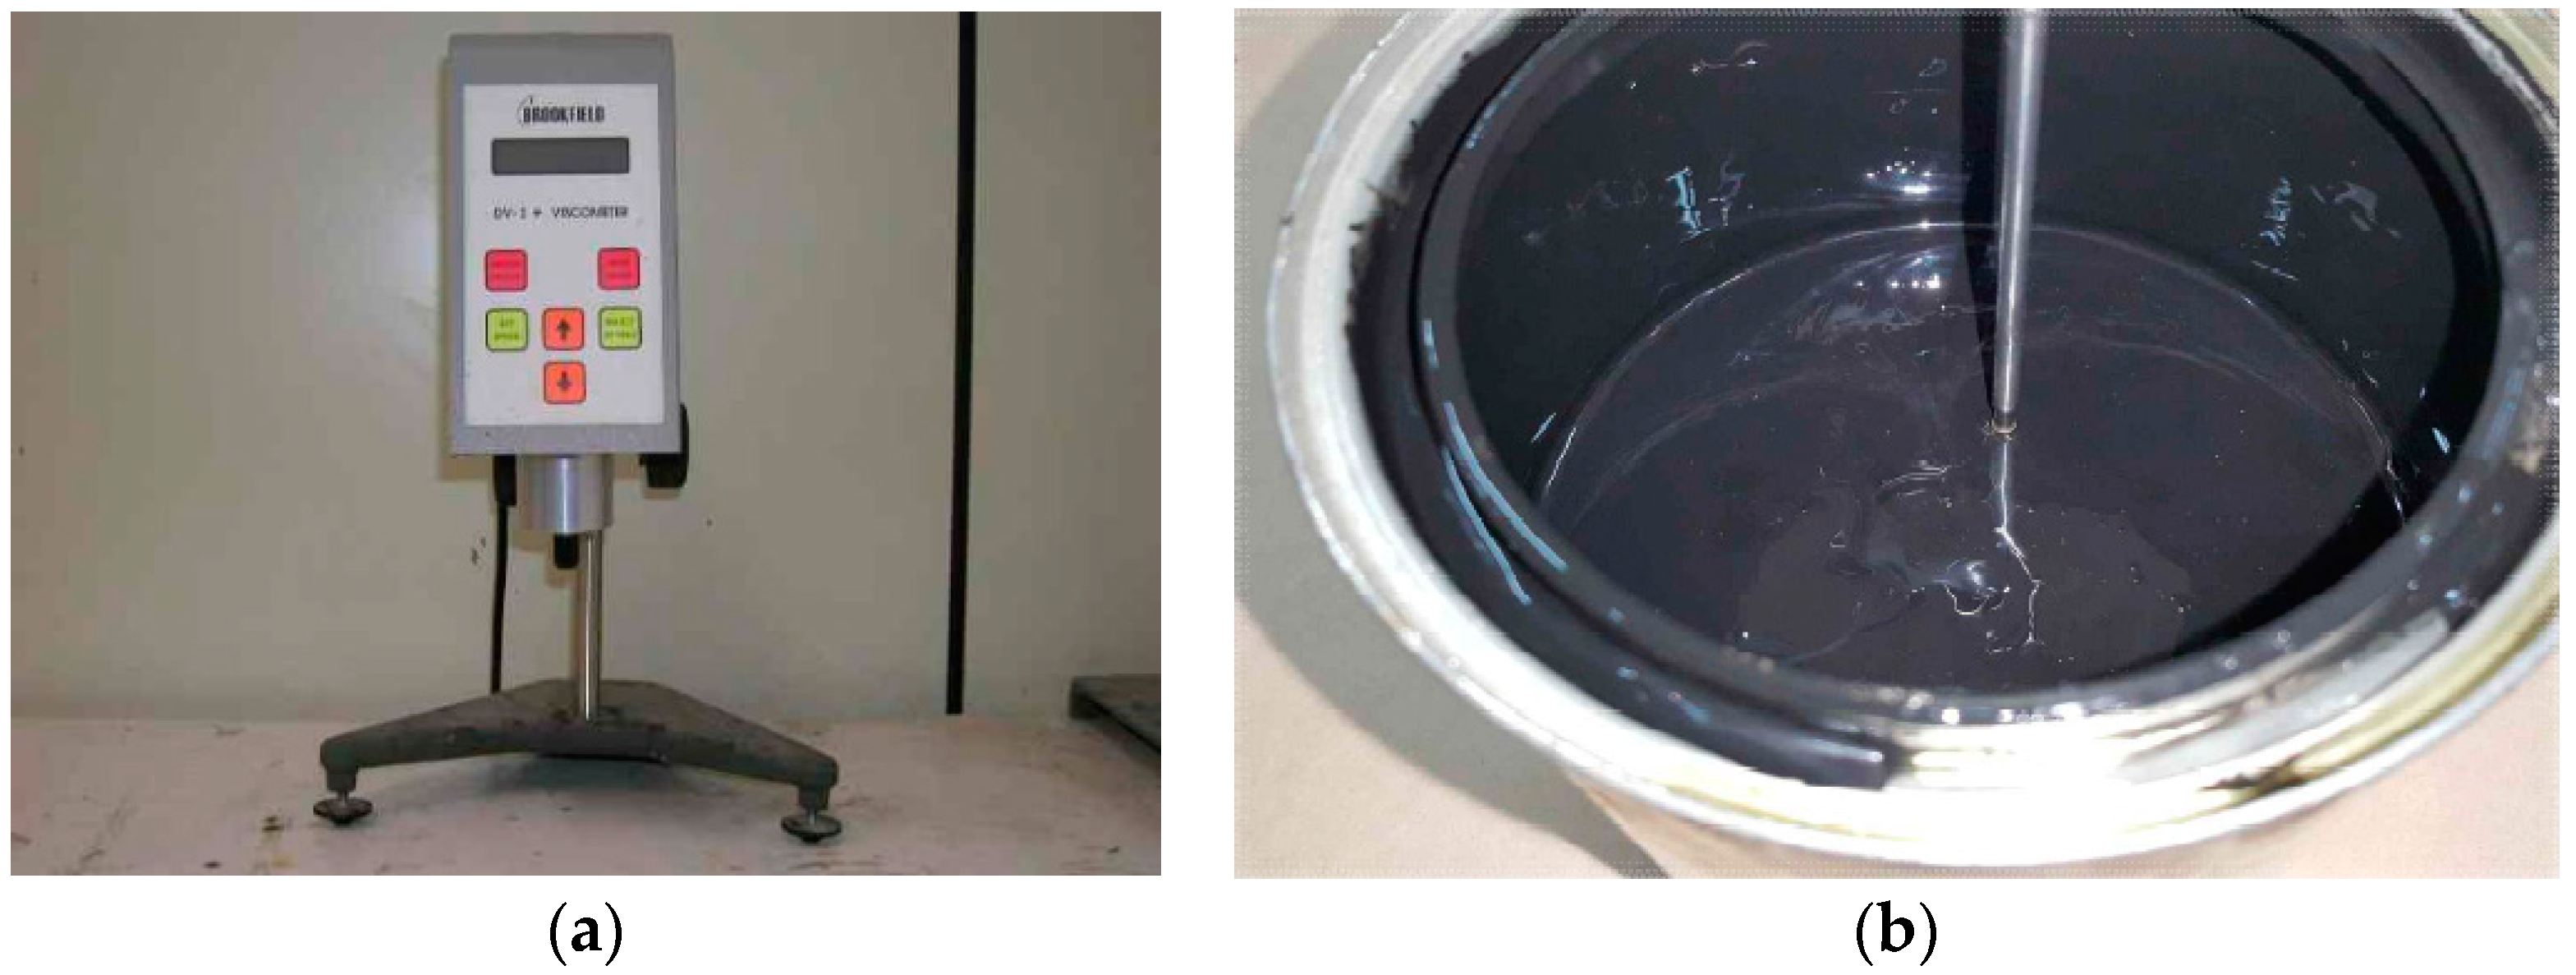
Immediately after the screw-mixing process, and at different storage condition intervals, the viscosity of the SPRG was measured using a Brookfield viscometer in accordance with the method outlined in KS M ISO 2555 plastic-liquid, solid tablet or dispersed phase. A constant amount of sample (approximately 10 kg) of the SPRG sample was placed inside a container and the spindle was placed into the material so that the tip of the spindle was at least 10 mm above the bottom of the container. The spindle was rotated at a rate of 10 min−1. For each sample subjected to a specific screw-mixing time, the sample was measured again after the specified storage time had passed. See Figure 7 below.
2.4. Waterproofing Performance Test Method
Four different test methods were used to assess the waterproofing performance of the SPRGs after the respective screw-mixing and storage times. The each of the four different method’s process and regime are outlined in the following sections below.
2.4.1. Washout Resistance Testing
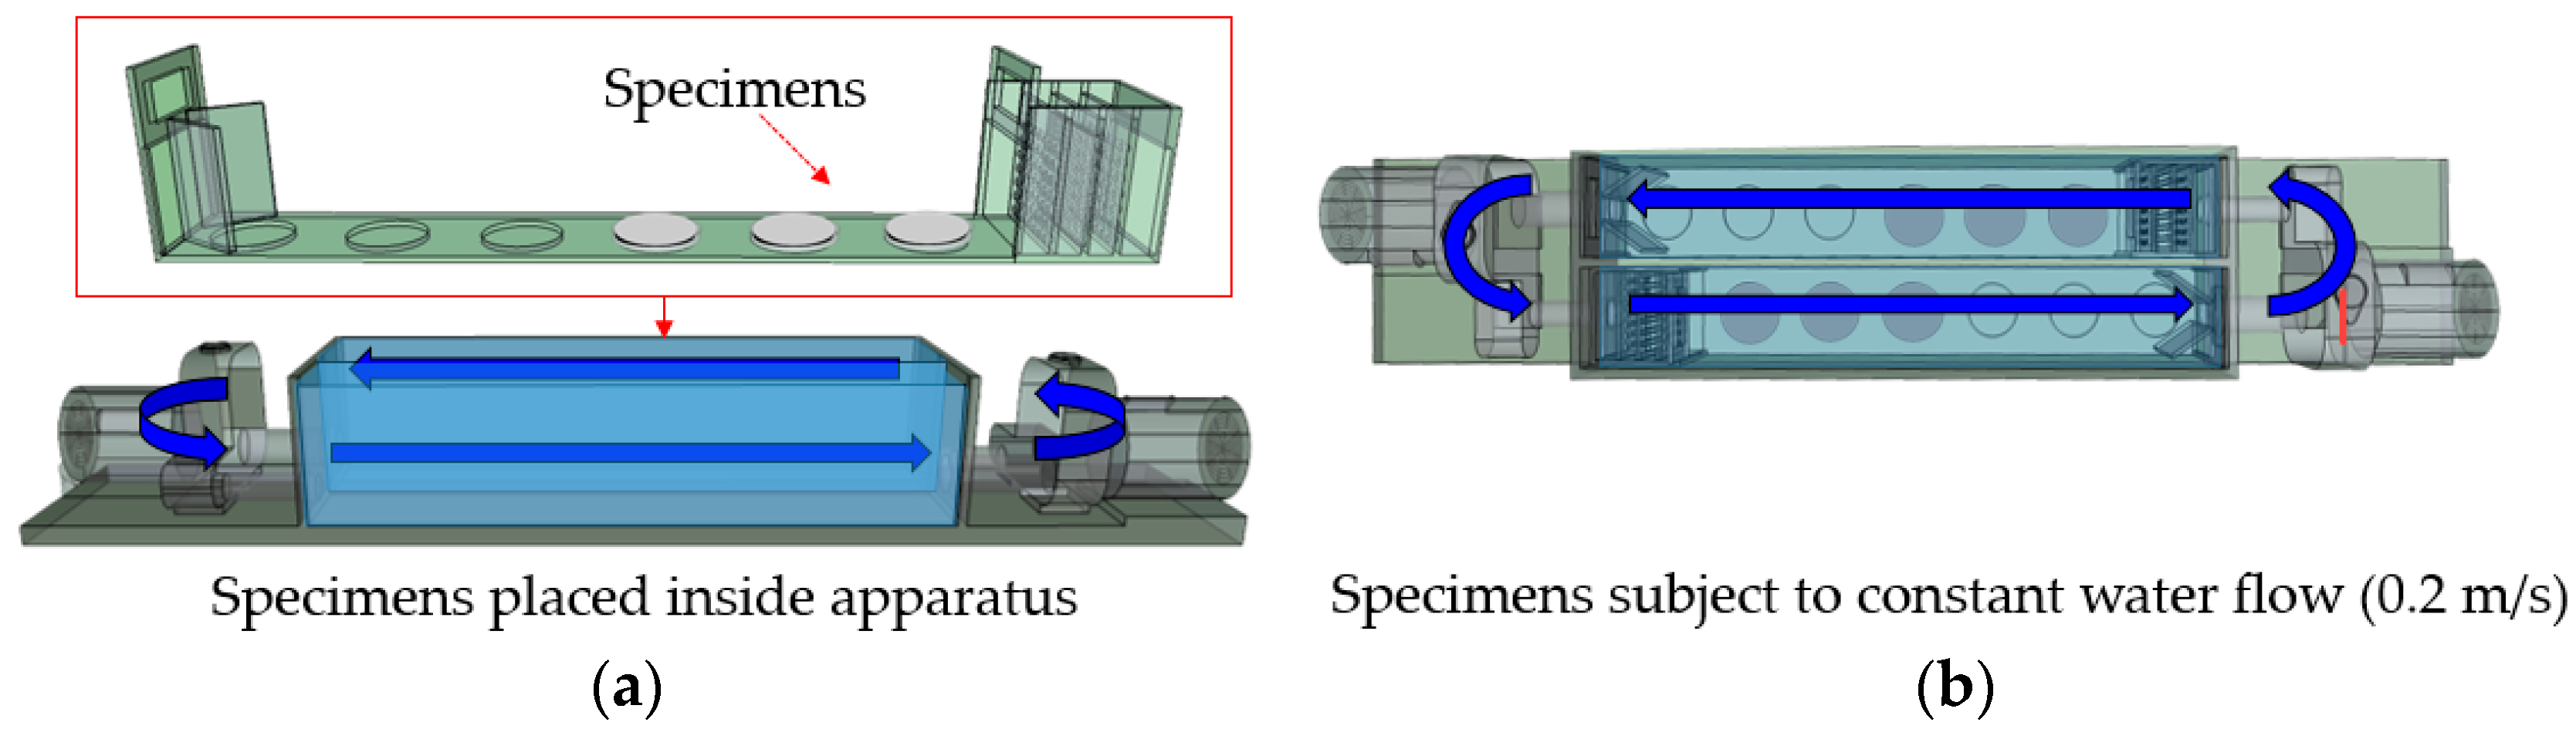
In this evaluation method, a glass petri dish is filled with the SPRG sample. The surface of the SPRG specimen is treated with a trowel or metal spatula to acquire a surface that is as even as possible. The specimens are cured in a test room for a minimum of three days, or for as long as required by the manufacturer’s specifications. The specimen installation process is conducted under normal laboratory ambient conditions, with the temperature set at 20 ± 3 °C and relative humidity of 60 ± 5%. Five sets of 150 ± 1 g of SPRG specimen are placed in a water flow chamber.
The specimens are subjected to 0.2 m/s of cycling water flow for 48 h. Next, the specimens are taken out and placed in a desiccator for four days, until they reach constant mass at 20 ± 3 °C and 60 ± 5% relative humidity. Afterwards, the mass change of the specimen is measured down to 2 decimal places and recorded. For acceptable performance, total mass loss over the evaluation period must be less than 0.1% of the original mass. Figure 8 below provides an illustration of the test procedure.
2.4.2. Cohesion/Adhesion Strength Testing on Wet Substrate Surface
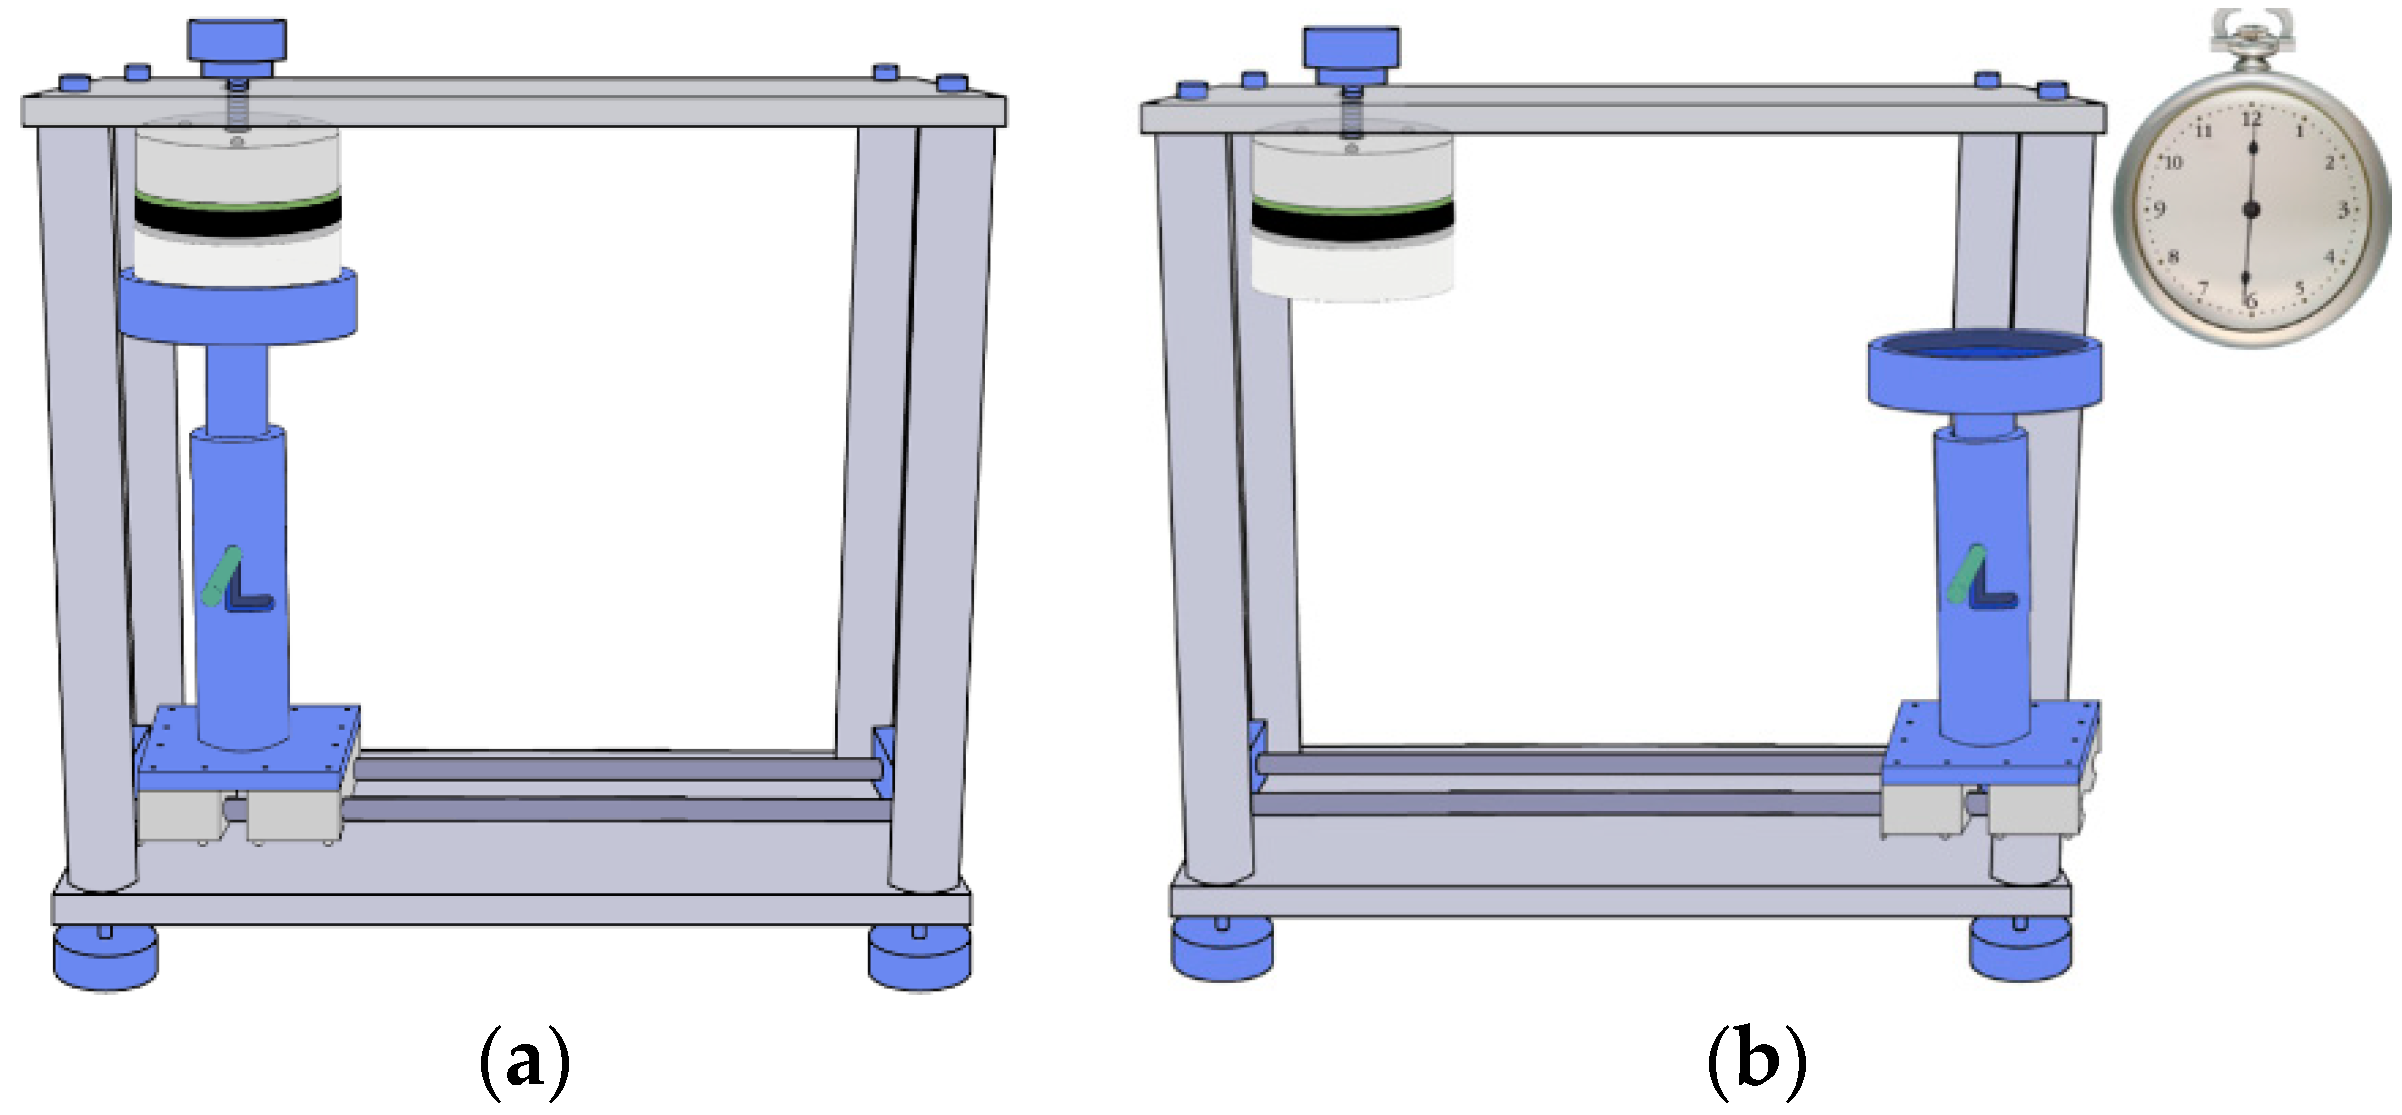
In this evaluation method, five sets of SPRG sample specimens are prepared by injecting the SPRG in between two substrate parts (the substrate parts will henceforth be differentiated as the upper substrate part (USP) and the bottom substrate part (BSP), respectively). Spacers are placed on the spacer holes of the bottom substrate. Next, 3–5 mm layers of mortar are cast (the upper side of the BSP and the bottom side of the USP) and cured for 28 days in a desiccator. Once the mortar layers are cured, the USP is placed on the spacers of the BSP. Next, an acrylic band is placed over the 20 mm gap to prevent repair material overflow during injection. The assembled substrate is submerged in water and the specimen is installed via an injection process. The specimen preparation is conducted under normal laboratory ambient conditions, with the temperature set at 20 ± 3 °C, and relative humidity of 60 ± 5%.
As soon as the setting platform has been removed and the specimen set midair (hanging by the connection to the USP), the duration for which the material can maintain adhesion is measured up to a maximum of 60 s. The interval at which adhesion or cohesion failure of the material occurs is measured and recorded (unit: second). For acceptable performance, adhesive/cohesive bonding should hold for up to 60 s. Figure 9 provides an illustration of the test procedure.
2.4.3. Hydrostatic Pressure Resistance Testing
In this evaluation method, five sets of SPRG sample specimens are prepared by injecting the SPRG in between two substrate parts. Spacers are placed on the spacer holes of the bottom substrate. Next, 3–5 mm layers of mortar are cast (the upper side of the BSP and the bottom side of the USP) and cured for 28 days in a desiccator. Once the mortar layers have been cured, the USP is placed on the spacers of the BSP. Next, the acrylic band is placed over the 20 mm gap to prevent repair material overflow during injection The specimen preparation is conducted under normal laboratory ambient conditions, with the temperature set at 20 ± 3 °C and relative humidity of 60 ± 5%.
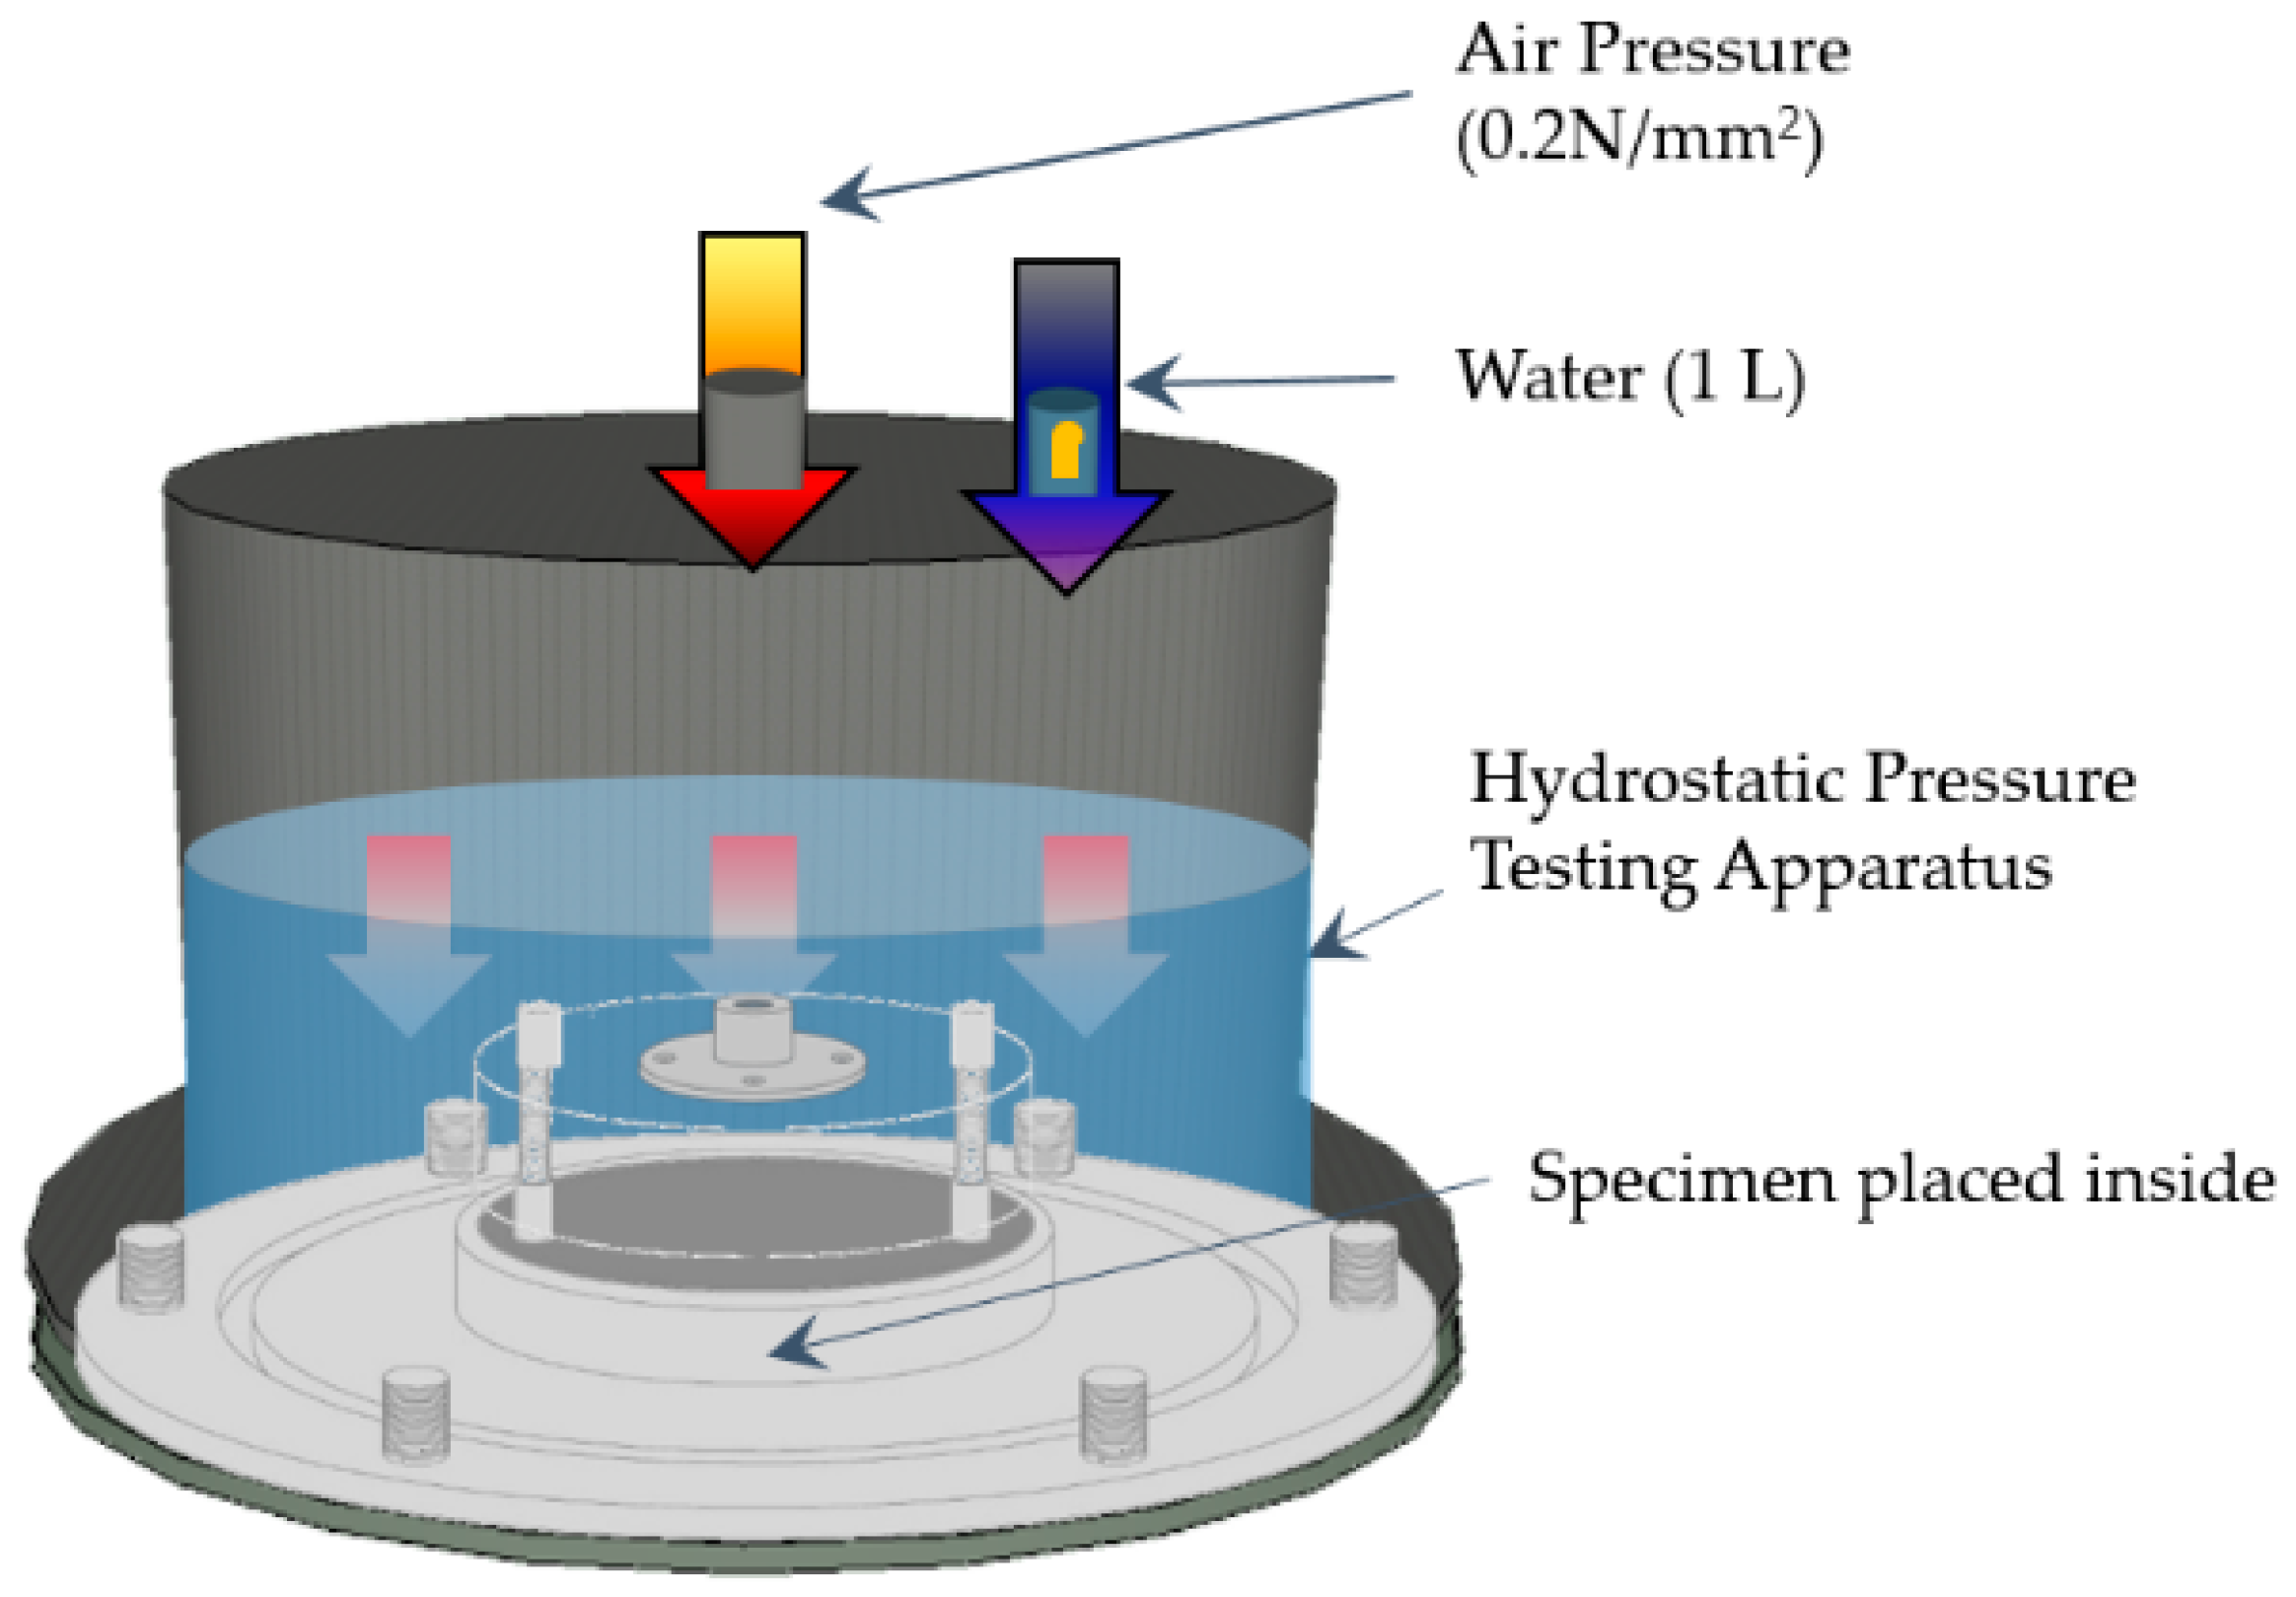
To begin testing, the acrylic band is removed from the specimen, and hydrostatic pressure testing is conducted by placing the SPRG installed specimen inside the permeability testing chamber. The chamber is then filled with 1 L of water. 0.2 N/mm2 air pressure is applied through a pressure inlet located from the pressure inlet on the top of the chamber for 1 h. The time interval at which leakage occurs is measured (unit: minute). Figure 10 below provides an illustration.
2.4.4. Substrate Movement Resistance Testing (Followed by Hydrostatic Pressure Resistance Testing)
In this evaluation method, five sets of SPRG sample specimens are prepared by injecting the SPRG in between two substrate parts. Spacers are placed on the spacer holes of the bottom substrate. Next, 3–5 mm layers of mortar are cast (the upper side of the BSP and the bottom side of the USP) and cured for 28 days in a desiccator. Once the mortar layers have been cured, the USP is placed on the spacers of the BSP. Next, the acrylic band is placed over the 20 mm gap to prevent repair material overflow during injection The specimen preparation is conducted under normal laboratory ambient conditions, with the temperature set at 20 ± 3 °C and relative humidity of 60 ± 5%.
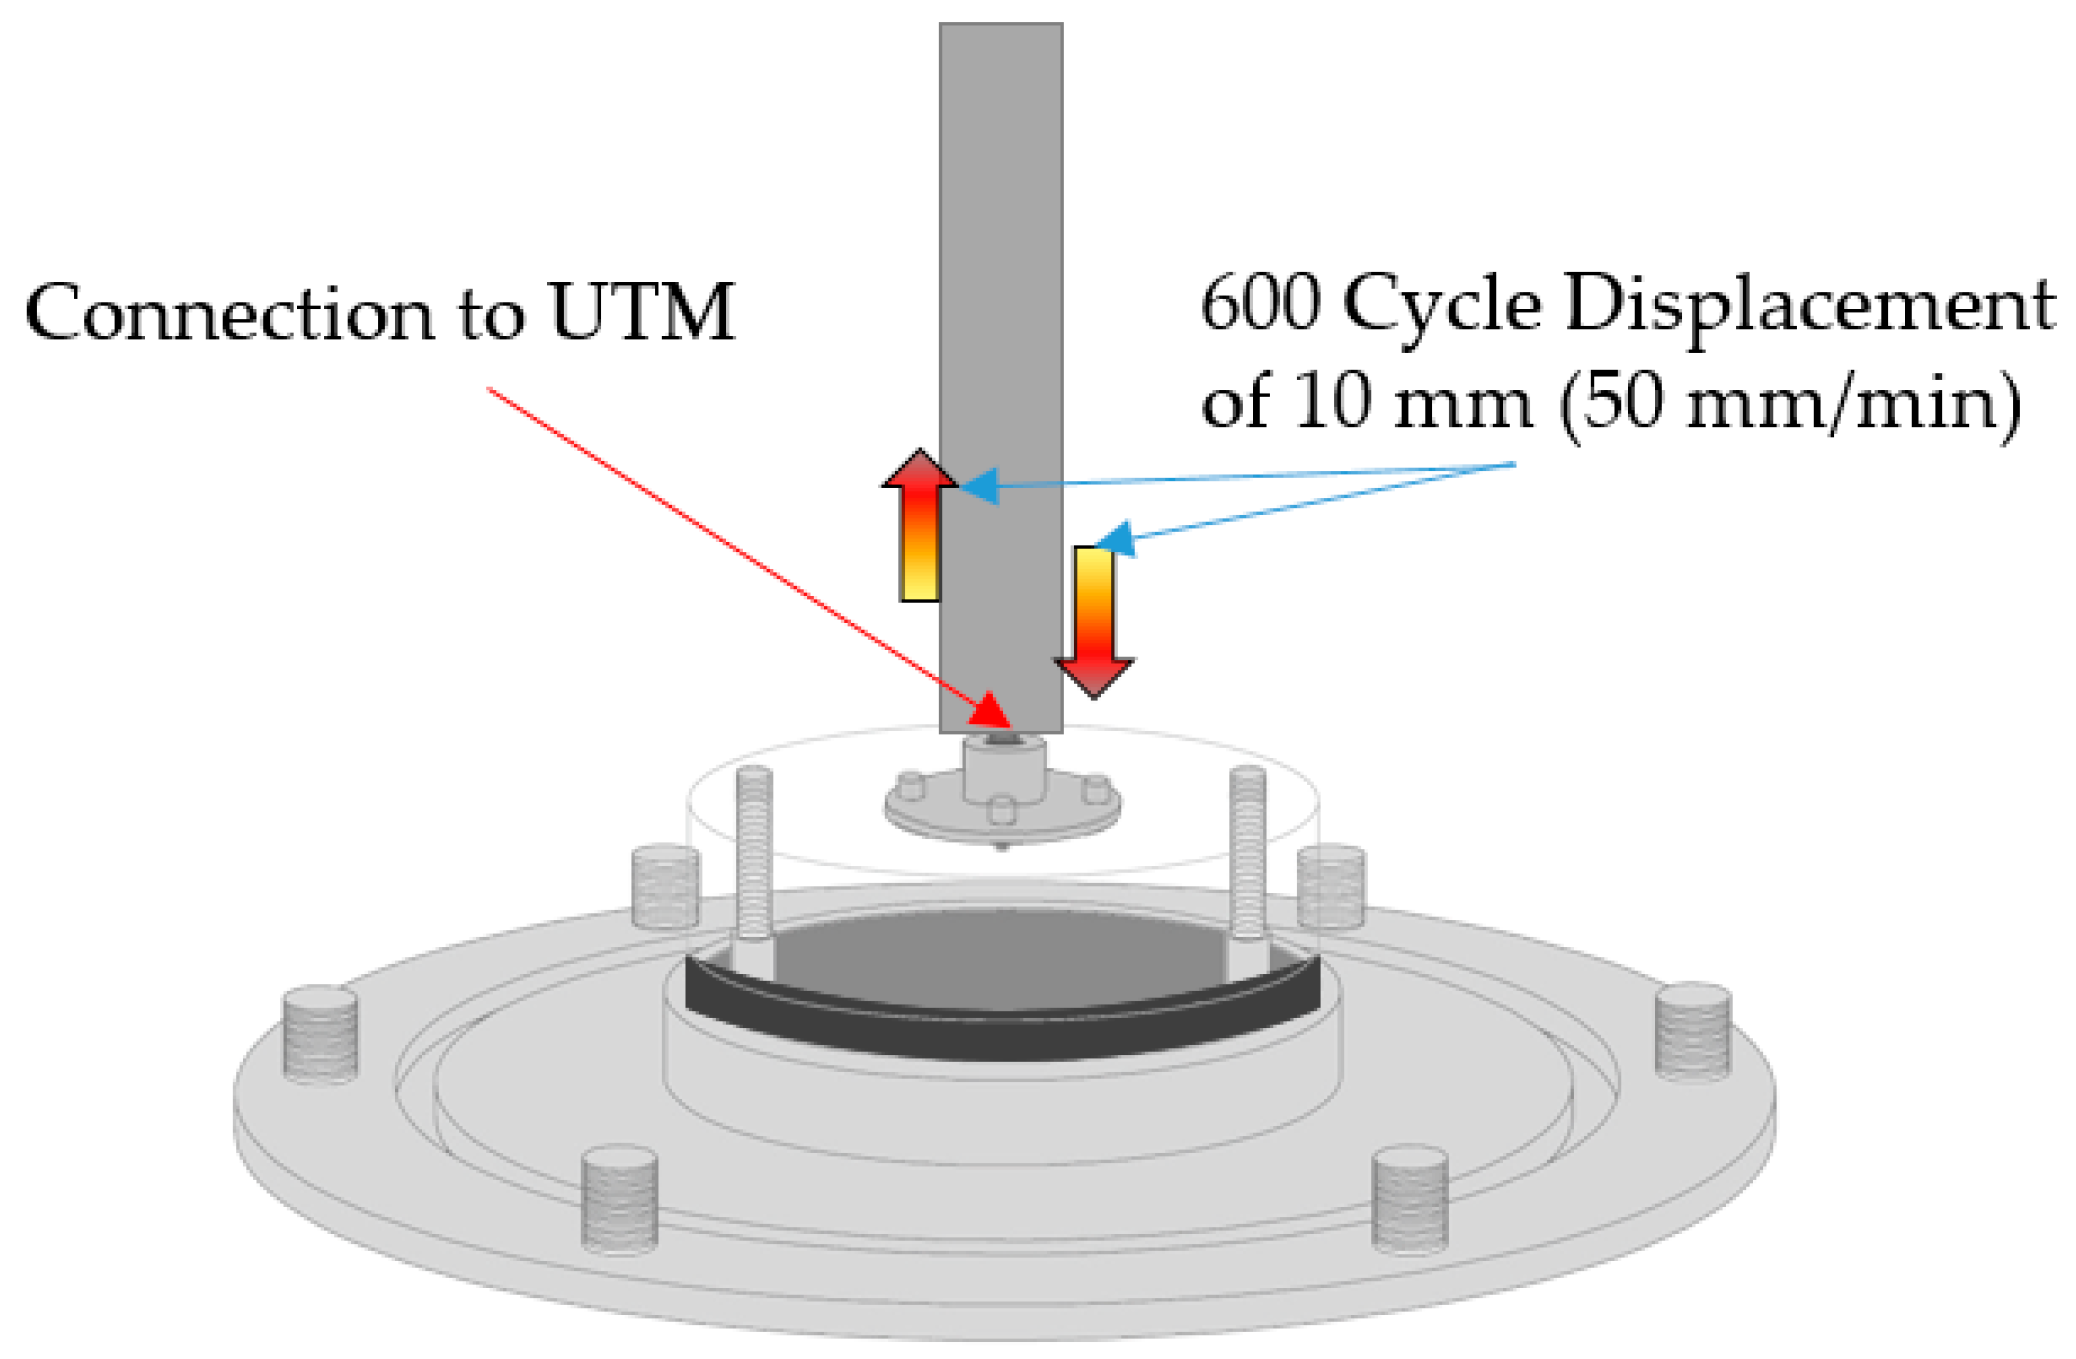
To begin testing, the acrylic band is removed from the specimen, and the specimen is subjected to behavioral movement of 600 movement cycles of 10 mm displacement at a rate of 50 mm/min. Afterwards, the specimen is subjected to hydrostatic pressure testing. Hydrostatic pressure testing is conducted by placing the SPRG installed specimen inside the permeability testing chamber. The chamber is then filled with 1 L of water. Air pressure of 0.2 N/mm2 is applied through a pressure inlet located from the pressure inlet on the top of the chamber for 1 h. The time interval at which leakage occurs is measured in minutes. Figure 11 below provides an illustration.
3. Results and Discussion
3.1. Viscosity Measurement Results
Table 5 shows the viscosity measurements of SPRG samples screw mixed and stored at respective times for predetermined periods (outlined in Table 5). The maximum viscosity of the SPRG evaluated in this study was obtained from the data sheet of the product specification, which was found to be 3,512,000 cps (to be labelled o for future calculation in the upcoming sections below).
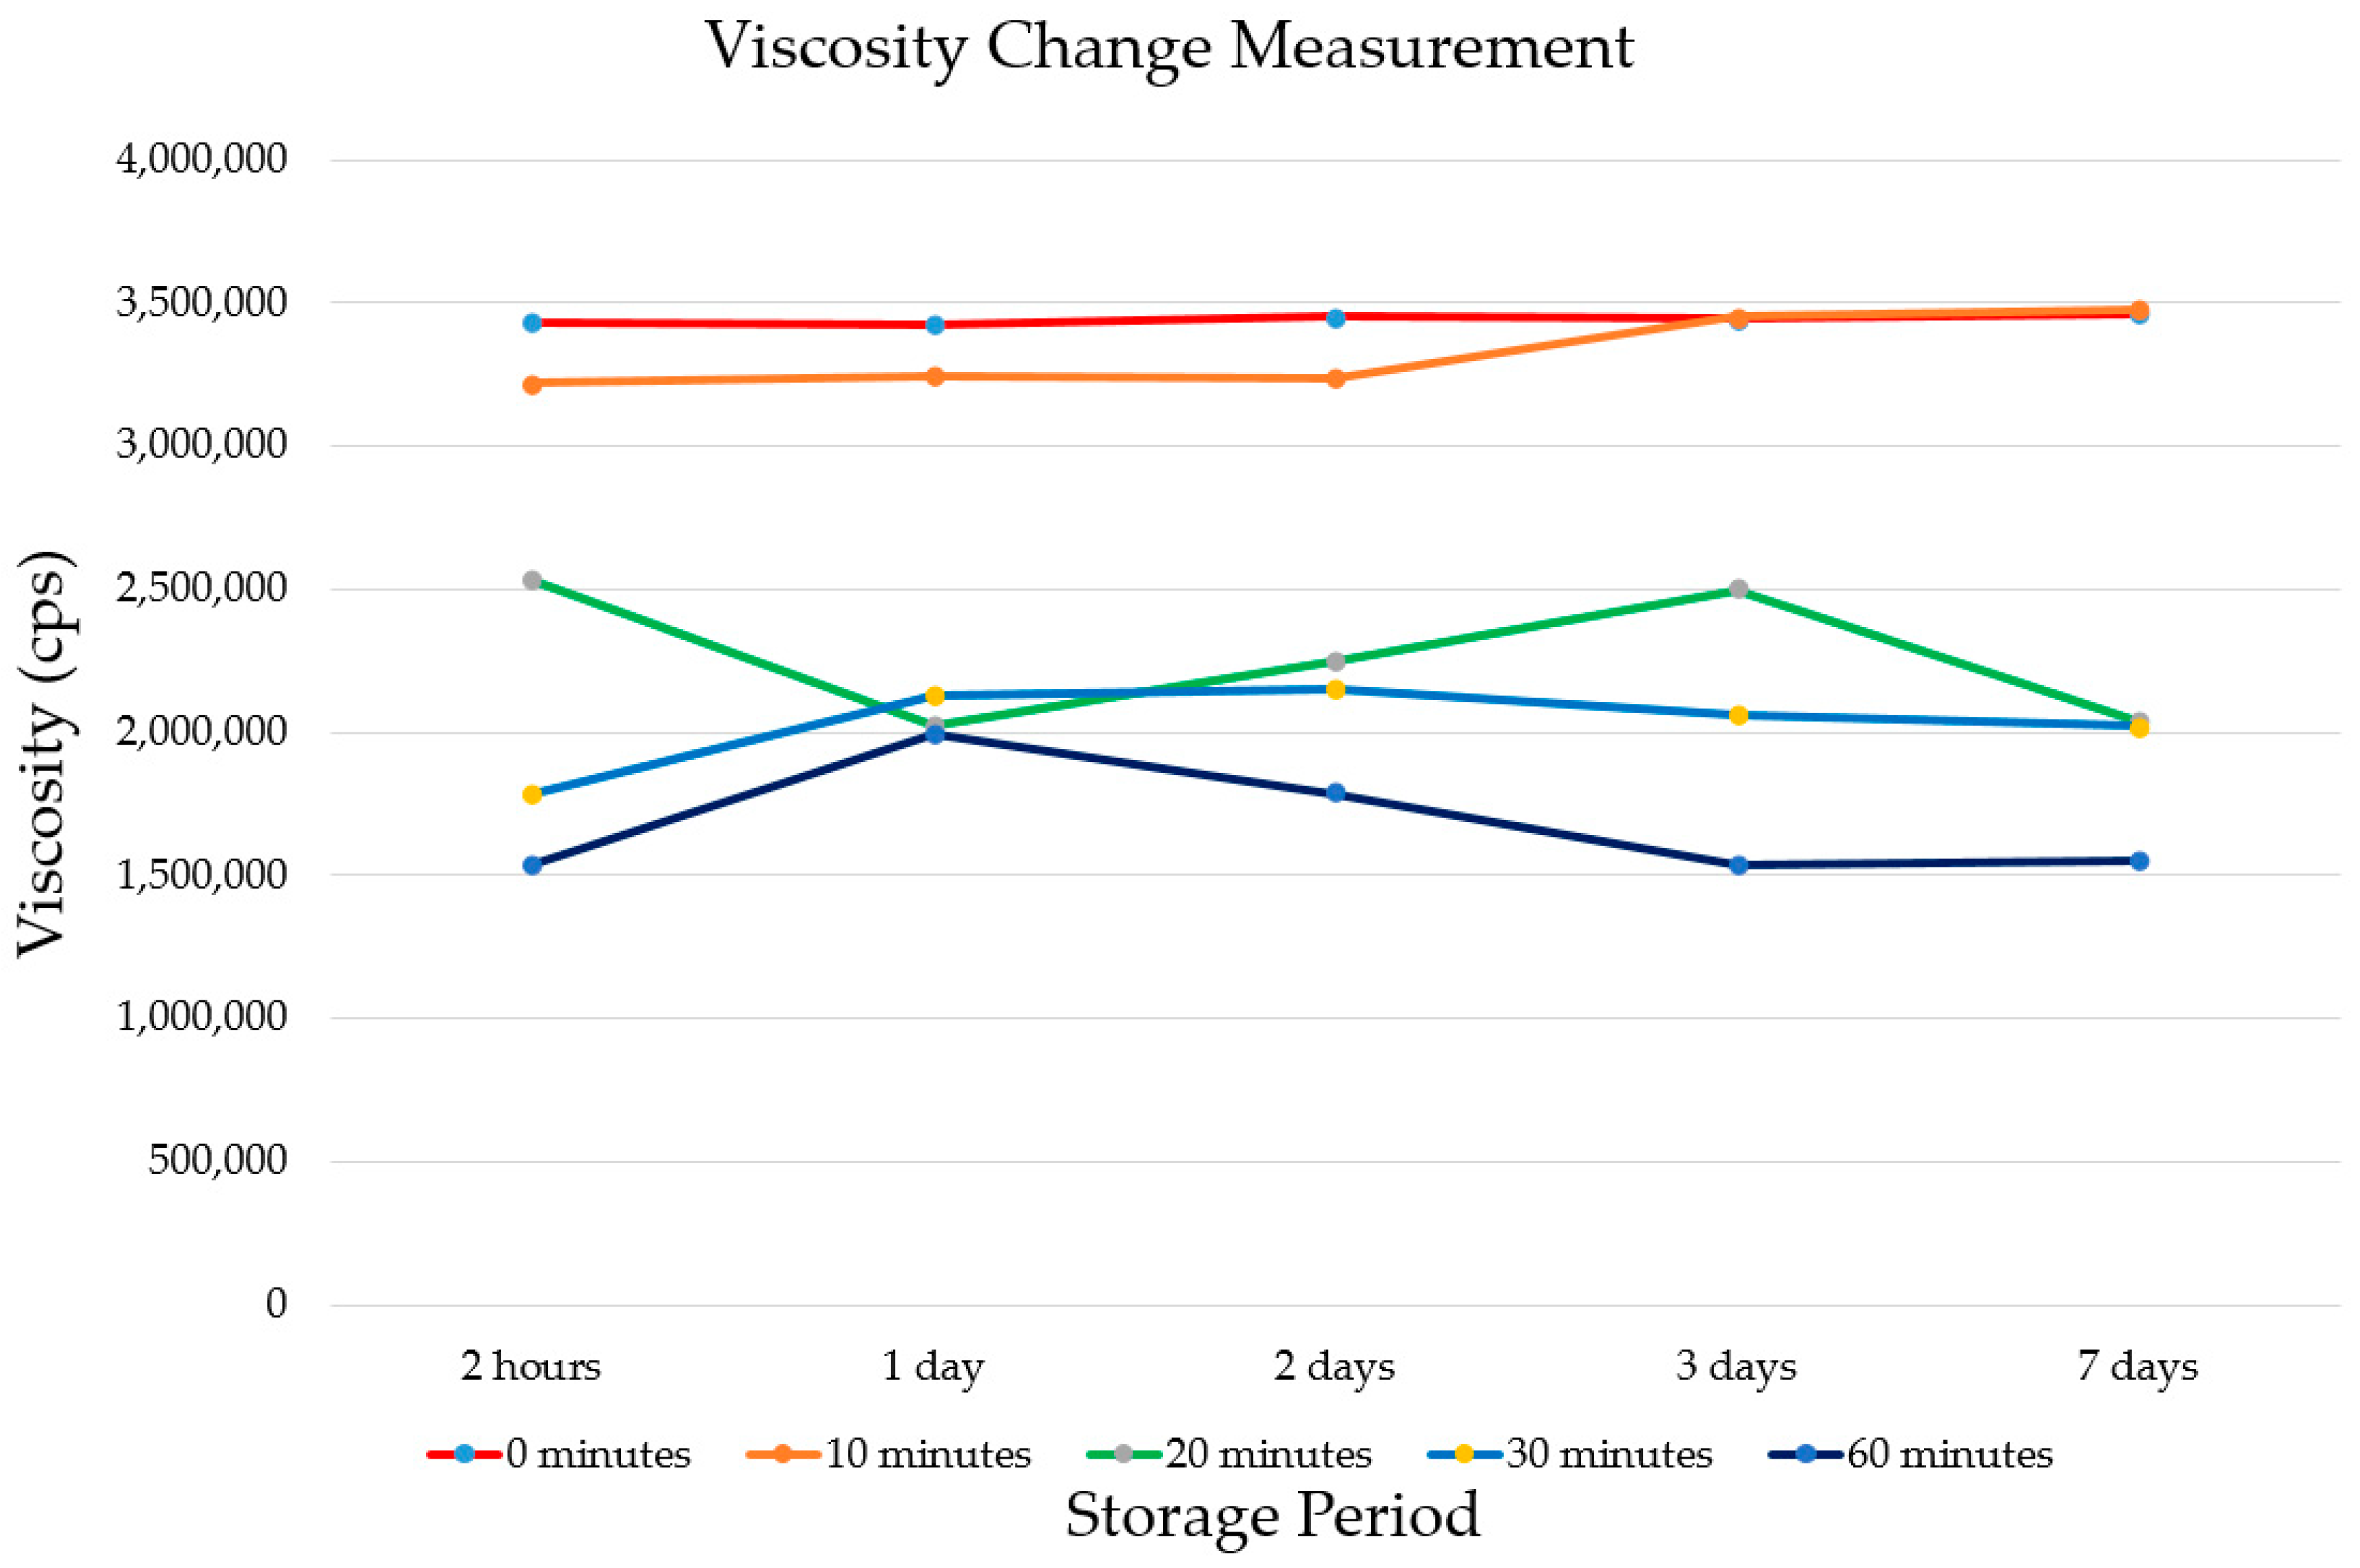
For this SPRG sample, it was shown that after 10 min of screw mixing, an average viscosity change throughout the different storage periods of up to 95% was possible, whereas with samples that were screw mixed for longer than 20 min, the viscosity percentage reached around 65%. For a clearer illustration, refer to the below graph in Figure 12.
3.2. Experimental Results of Waterproofing Performance Evaluation
Table 6 shows the experimental results of the waterproofing performance test methods in accordance with different screw-mixing and storage times. For each of the five specimens, washout resistance (mass lost in grams), cohesion/adhesion strength (seconds), and hydrostatic pressure resistance with and without substrate movement conditioning (minutes) were recorded and averaged, and a total average value was also derived.
For the washout (material loss) resistance performance test results, the SPRG samples satisfied the performance requirement for all screw-mixing and storage duration conditions, but the mass loss increased relative to the increasing screw-mixing duration.
For the washout resistance test method results, performance failure was observed from the 30 min mark through cohesive failure of the SPRG layer. Past the 2 days of storage period, cohesive failure no longer occurred for any specimens. For specimens that were screw mixed for 60 min, performance failure occurred throughout the entire storage time conditioning without signs of recovery.
For the hydrostatic pressure resistance test method results, waterproofing performance failure was apparent from the 20-min mark, showing signs of recovery at the 7 days of storage time interval. Past this point, waterproofing performance failure began to occur throughout the other screw mixing times, but showed minor signs of performance recovery after a longer storage period.
For the substrate movement resistance test method results, waterproofing performance failure was apparent from the 10-min screw-mixing time. Due to the tensile stress from the substrate movement, performance recovery with respect to storage duration was no longer apparent.
3.3. Comparative Evaluation on Change in Waterproofing Performance (Estimation)
Based on the results of the viscosity change measurement throughout the storage period and the waterproofing performance testing results, the loss/failure percentage ratio was calculated and compared for a comprehensive evaluation of the respective performance and property changes due to different screw-mixing and storage times. The ratios were derived using the viscosity change measurement data from Table 5 and the averaged measurements of performance evaluation data in Table 6. The ratios were all calculated such that higher ratios represent higher deformation or deviation from optimal conditions.
3.3.1. Viscosity Loss Ratio Based on the Results of the Viscosity Change Measurements
SPRG viscosity loss ratio is measured using the following equation;
where:
100% − v/o × 100% = Vl
- v: measured viscosity after screw-mixing condition (cps) (value obtained from Table 6).
- o: original viscosity (3,512,000 cps).
- Vl: viscosity loss ratio.
3.3.2. Mass Loss Ratio Based on Washout Resistance Testing Results
The mass loss ratio of the SPRG is measured using the following equation, based on the results of the washout resistance test results:
where:
{w/(150 g × 0.1%)} × 100% = Wl
- w: average mass lost during the water flow cycle (g) (value obtained from Table 6).
- Wl: mass loss ratio.
3.3.3. Failure Ratio Based on Cohesion/Adhesion Strength Testing Results
The adhesion failure ratio of the SPRG is measured using the following equation, based on the results of the cohesion/adhesion strength test:
where:
(60 − ts (seconds))/60 (seconds) × 100% = Tf
- ts: average number of seconds taken before performance failure occurred (value obtained from Table 6)
- Tf: adhesion degradation ratio indicating how quickly material failure occurred.
3.3.4. Failure Ratio Based on Results of Hydrostatic Pressure Resistance Testing Results
The impermeability failure ratio of the SPRG is measured using the following equation, based on the results of the hydrostatic pressure resistance testing:
where:
(60 (minutes) − ti)/60 (minutes) × 100% = Tif
- ti: average number of minutes taken before performance failure occurred during hydrostatic pressure testing (value obtained from Table 6).
- Tif: impermeability degradation ratio indicating how quickly material failure occurred.
3.3.5. Failure Ratio after Substrate Movement Stress Based on Results of Hydrostatic Pressure Resistance Test after Substrate Movement Testing Results
The impermeability failure ratio of the SPRG after substrate movement stress conditioning is measured using the following equation, based on the results of the substrate movement resistance test:
where:
(60 (minutes) − tsm)/60 (minutes) × 100% = Tsmf
- tsm: average number of minutes taken before performance failure occurred during hydrostatic pressure testing after substrate movement stress (value obtained from Table 6).
- Tsmf: adhesion degradation ratio indicating how quickly material failure occurred.
3.4. Evaluation Results of the Failure/Loss Ratios of Respective Performance Criteria of SPRG
A comprehensive representation of the overall changes to the waterproofing performance and property changes to the SPRG when subject to screw mixing and extended storage, and the ratios of the respective performance properties obtained from Section 3.2, Table 6, are outlined below. The failure ratios were calculated from the averaged rate results between the five specimens. The respective failure or loss ratios of viscosity and waterproofing performance were averaged to derive a comprehensive deviancy ratio per screw-mixing time at different storage periods. Table 7, Table 8, Table 9, Table 10 and Table 11 provide details.
With the increase in the screw-mixing time, the percentage of deformation ratio with respect to viscosity and waterproofing performance were also shown to increase. While NSM condition SPRG specimens had the lowest deformation percentage ratio, minimal screw mixing is still required for SPRG to be used in construction sites. Based on the results of this demonstration evaluation, a recommended screw-mixing time of 10-min of less can be proposed.
Next, a set of radar charts in Figure 13 was derived based on the results of the viscosity measurement and the four waterproofing performance test results. In this case, the comparison was derived based on different screw-mixing time conditions, and lines distributed based on different storage conditions, to visually represent the degree of performance recovery of (1) viscosity and (2) waterproofing performance throughout the storage period after screw mixing. The axes of the radar charts were all designated so that higher values represent a greater degree of deviation or deformation for the purpose of a facilitated visual comparison. Each of the performance failure ratios derived from Section 3.2 formed an axis on the radar charts and the values were plotted respectively. Figure 13 provides details.
When visually represented with the radar graphs, the difference in the recovery of viscosity and waterproofing performance was clear between different screw-mixing times throughout the storage periods. In the case of up to 20 min of screw-mixing time, the viscosity and waterproofing performances recovery by the seventh day of storage was fair, as the data on the deviation were closer towards the center of the radar chart. Once the screw-mixing time reaches 60 min, all the property and performance factors are at a significantly higher deviation state. At 60 min of screw mixing: (1) relatively significant deformation and performance degradation is imminent, and (2) repeated screw mixing at any point of the storage time for reuse can result in a risk of even further performance deterioration and waterproofing failure.
4. Conclusions
This study proposes that an optimized screw-mixing time for SPRG waterproofing materials prior to installation is required to prevent property changes, viscosity loss and waterproofing performance failures. While still necessary, if the screw-mixing time and storage for reuse after screw mixing during construction are too long, the performance of the material can be negatively affected. Prioritizing improving the workability or construction efficiency of SPRG should not come at the cost of waterproofing performance. Otherwise, the construction can result in water leakage.
In this regard, the proposed evaluation procedure offers a new way to assess the waterproofing performance deviation of SPRG in relation to the viscosity changes from different screw-mixing and storage times. A comparative assessment of waterproofing performance using the testing regimes outlined in the ISO TS 16774 series showed that screw mixing certainly affected SPRG waterproofing performance. The final radar chart representation of the comparative evaluation data clearly expressed that the recovery of SPRG viscosity and waterproofing performance is also different throughout the different storage times after screw mixing. Based on the requirements of the construction specifications, this evaluation method can provide a guideline as to how to best optimize the screw-mixing time, and a warning of the potential risks of reuse after screw mixing.
Further research is required to improve the reliability and applicability of this evaluation regime, for example by including the changes in construction efficiency in the evaluation criteria. At this point, it is hoped that this study successfully demonstrated that optimized screw-mixing time and storage time needs to be considered in future waterproofing construction using SPRG to achieve stable performance and service life.
Author Contributions
S.K.O. and D.S.A. conceived and designed the experiments; D.S.A., K.H.O. and J.S.P. performed the experiments; D.S.A., K.H.O. analyzed the data; D.S.A. and K.H.O. wrote the paper.
Funding
This research received no external funding.
Acknowledgments
This research was supported by a grant (18RERP-B082204-05) from Residential Environment Research Program funded by Ministry of Land, Infrastructure and Transport of Korean government.
Conflicts of Interest
The authors declare no conflict of interest. The founding sponsors had no role in: the design of the study; the collection, analyses, or interpretation of the data; the writing of the manuscript, or the decision to publish the results.
Abbreviations
| ASTM | American Society for Testing and Materials |
| BS EN | British Standard European Norm |
| BSP | Bottom Substrate Part |
| GB | Guo Biao |
| ISO | International Standard Organization |
| KS | Korean Industrial Standards |
| LH | KOREA LAND & HOUSING CORPORATION |
| NSM | Non-screw mixed |
| RPM | Rotations Per Minute |
| SBS | Styrene-Butadiene-Styrene |
| SMRT | Substrate Movement Resistance Test |
| SPRG | Synthetic Polymer Rubber Gel |
| USP | Upper Substrate Part |
References
- Oh, S.-K.; Shim, J.-S. Maintenance for Leakage due to Cracking in Concrete Structures-Guidelines for Repair of Water-Leakage Cracks in Concrete Structures. J. Korea Concr. Inst. 2011, 23, 47–52. [Google Scholar]
- Park, J.S.; Kim, D.B.; Park, W.G.; Oh, S.K. Analysis on the Causes of the Oil Leakage Phenomenon for Complex Waterproofing Methods of Asphalt Mastic and Modified Asphalt Sheet. J. Korea Inst. Build. Constr. 2018, 18, 337–345. [Google Scholar]
- Ahn, D.-S. A Study on the Physical Properties Change of Synthetic Rubber Polymer Gel by Using Stirring Screw Mixer. Master’s Thesis, Seoul National University of Science and Technology, Seoul, Korea, 2015. [Google Scholar]
- Oh, S.K.; Seo, S.J.; Park, J.S.; Kim, D.B.; Choi, S.Y.; Kim, B.I. A Study on Compatibility between Asphalt Mastic and Poly Urethane Coating Material (Focused on Fatigue Resistance). J. Korea Inst. Build. Constr. 2018, 18, 255–256. [Google Scholar]
- RE-Systems Group Americas. Polymer Rubber Gel Systems. Waterproof Magazine. 2014, pp. 26–29. Available online: https://www.waterproofmag.com/downloads/2014-04/WP_2014-04_Polymer_Rubber.pdf (accessed on 23 August 2018).
- Oh, S.-K.; Lee, J.-H.; Choi, S.-M. An Experimental Study on the Highly Adhesive Composite Waterproofing Sheet using Reclaimed Rubber. J. Archit. Inst. Korea 2014, 16, 279–284. [Google Scholar]
- Oh, S.K.; Lee, J.H.; Song, J.Y.; Kim, S.Y. A Study on the Construction Detail of Waterproofing in Underground of Apartments. J. Korea Inst. Build. Constr. 2017, 17, 215–216. [Google Scholar]
- Seo, W.I.; Kim, S.Y.; Kwak, G.S.; Oh, S.G. A Study on Complex Waterproofing Method Using Part of Joint Water-Tightness Improved Sheet; The Korea Institute of Building Construction: Seoul, Korea, 2004; Volume 7, pp. 1–6. [Google Scholar]
- Im, C.J. Waterproofing Performance Tests for a Composite Waterproofing Method of Asphalt Mastic Film and Sheet. DONG-EUI Inst. Technol. 2000, 26, 53–62. [Google Scholar]
- Rubber Asphalt Sheet Double Waterproofing; LH Guide Specifications 42531; Korea Land & Housing Corporation: Seoul, Korea, 2015.
- Chang, S.-J. Advanced Technology of Waterproofing. J. Archit. Inst. Korea 2005, 49, 57–60. [Google Scholar]
- Park, J.-S.; Kim, D.-B.; Oh, K.-H.; Oh, S.-K. Field Evaluation of Synthetic Polymer Rubber Gel through Filler Content and Oil Leakage Mass Measurement. Appl. Sci. 2018, 8, 896. [Google Scholar] [CrossRef]
- Cho, K.-S.; Park, W.-Y. The rooftop waterproof of public facilities and the study of improvement way—Urethane rubber film waterproof. J. Korean Inst. Build. Constr. 2012, 12, 86–87. [Google Scholar]
- Korea Land & Housing Corporation. Establishment of Measures to Improve Quality of House Waterproofing Methods for Zero Defects in Quality Management; Public Housing Project Office: Seoul, Korea, 2017; pp. 1–3. [Google Scholar]
Figure 1.
Common Synthetic polymerized rubber gel injection in a below-grade concrete structure.

Figure 2.
Separate and integrated 2-ply type SPRG waterproofing systems.

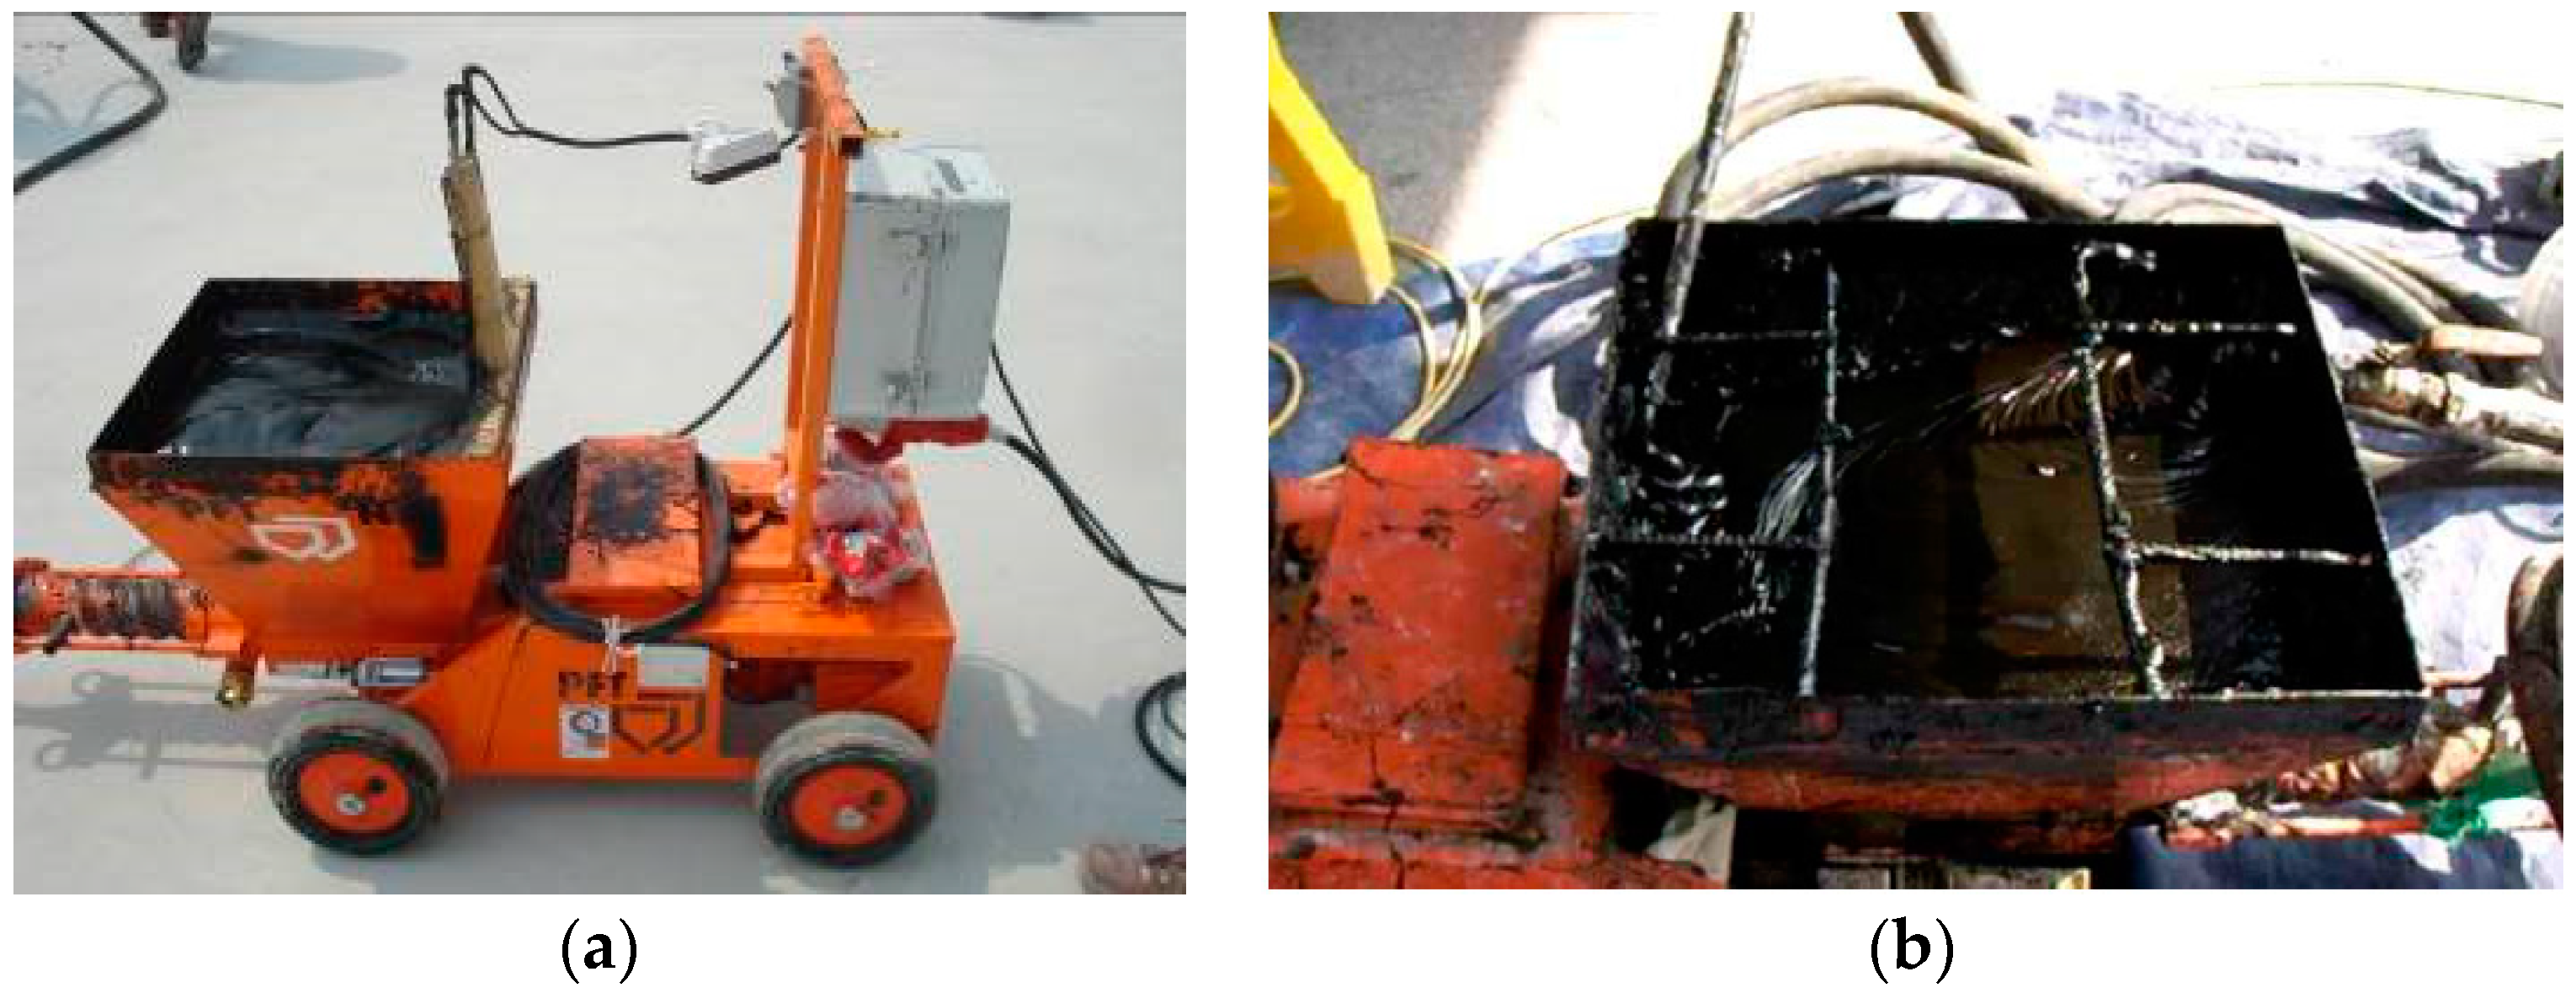
Figure 3.
SPRG Gel screw-mixing process prior to application; (a) screw mixing SPRG; (b) reduced viscosity after mixing.
Figure 3.
SPRG Gel screw-mixing process prior to application; (a) screw mixing SPRG; (b) reduced viscosity after mixing.

Figure 4.
Polymeric degradation due to continuous shear strain of screw-mixing process.

Figure 5.
Property changes in SPRG following the screw-mixing process; facilitated emulsion breaking following filler particle and globule dispersion due to screw mixing.
Figure 5.
Property changes in SPRG following the screw-mixing process; facilitated emulsion breaking following filler particle and globule dispersion due to screw mixing.

Figure 6.
Evaluation procedure flow chart.

Figure 7.
Brookfield viscometer; (a) apparatus; (b) measuring SPRG viscosity.

Figure 8.
Test method apparatus; (a) specimen placement; (b) water flow testing.

Figure 9.
Test method for adhesion on wet substrate; (a) specimen placement; (b) water flow testing.
Figure 9.
Test method for adhesion on wet substrate; (a) specimen placement; (b) water flow testing.

Figure 10.
Hydrostatic pressure testing illustration.

Figure 11.
Illustration of substrate movement resistance testing.

Figure 12.
SPRG viscosity change over different storage periods based on respective screw-mixing time.
Figure 12.
SPRG viscosity change over different storage periods based on respective screw-mixing time.

Figure 13.
Radar charts for comparative evaluation of overall waterproofing performance; (a) results for no screw mixing; (b) results for 10 min of screw mixing; (c) results for 20 min of screw mixing; (d) results for 30 min of screw mixing; (e) results for 60 min of screw mixing.
Figure 13.
Radar charts for comparative evaluation of overall waterproofing performance; (a) results for no screw mixing; (b) results for 10 min of screw mixing; (c) results for 20 min of screw mixing; (d) results for 30 min of screw mixing; (e) results for 60 min of screw mixing.


Table 1.
Synthetic polymerized rubber gel structural component list and specifications.
| Material | Specific Gravity (g/mL) | Original Viscosity (cps) (20 °C, Sp. 6) | Composition | |
|---|---|---|---|---|
| Component Name/Type | Percentage Weight Ratio (%) | |||
| SPRG | 1.1 | 3,512,000 | Asphalt (bitumen) | 10~30 |
| Process oil | 10~40 | |||
| Asphalt modifier | 1~10 | |||
| Heat resistant stiffener | 1~10 | |||
| Adhesion adjuvant | 2~20 | |||
| Inorganic filler | 10~20 | |||
| Admixture for reducing flow rate | 10~20 | |||
| Recycled waste tire | 1~10 | |||
| Solubility modifier | 0.3~5 | |||
| Amphipathic adhesion adjuvant | 1~5 | |||
| Strength adjuvant | 1~5 | |||
Table 2.
Typical SPRG structural component list.
| Screw Mixing Time (min) | Time Taken to Install 2 mm Thickness over 1 m2 Surface (min) | Viscosity Measurement Immediately After Screw Mixing (cps) | Viscosity After 2 h of Rest (cps) | Viscosity Lost (Max Viscosity: 3,512,000 cps) (%) |
|---|---|---|---|---|
| 10 | 31 | 20,000 | 3,400,000 | 5 |
| 11 | 30 | 22,000 | 3,500,000 | 1 |
| 12 | 32 | 20,000 | 3,400,000 | 5 |
| 13 | 31 | 20,000 | 3,200,000 | 9 |
| 14 | 30 | 19,000 | 3,400,000 | 5 |
| 15 | 32 | 19,000 | 3,200,000 | 9 |
| 16 | 29 | 20,000 | 3,000,000 | 16 |
| 17 | 22 | 15,000 | 2,400,000 | 32 |
| 18 | 26 | 14,000 | 2,400,000 | 32 |
| 19 | 24 | 13,000 | 2,200,000 | 38 |
| 20 | 25 | 14,000 | 2,500,000 | 29 |
| 30 | 21 | 13,000 | 1,800,000 | 49 |
| 60 | 19 | 14,000 | 1,500,000 | 58 |
Table 3.
SPRG Screw-Mixing Apparatus Specifications.
| Illustration | Voltage | Speed | Flow Rate | Mass | Transportable Distance | |
|---|---|---|---|---|---|---|
 | 380 V or 4 KW | 280 RPM | Max. 22 L/min | 107 kg | Vertical: 30 m | Horizontal: 50 m |
Table 4.
Screw-mixing and storage time conditions.
| Stress Conditioning | Duration (Time) | ||||
|---|---|---|---|---|---|
| Step 1. Screw Mix Time (min) | NSM | 10 | 20 | 30 | 60 |
| Step 2. Storage Time before Reuse | 2 h | 1 day | 2 days | 3 days | 7 days |
Table 5.
Viscosity measurement in accordance with predetermined screw-mixing and storage times.
| Original Viscosity (a. cps) (o) | Screw Mixing Time (min) | Viscosity Measurement at Different Storage Period Intervals (cps) | Average Viscosity over 7 Day Period | |||||
|---|---|---|---|---|---|---|---|---|
| 2 h | 1 Day | 2 Days | 3 Days | 7 Days | Viscosity (cps) | cps/o cps (%) | ||
| 3,512,000 cps | NSM 1 | 3,431,000 | 3,421,000 | 3,452,000 | 3,443,000 | 3,461,000 | 3,441,000 | 98 |
| 10 | 3,221,000 | 3,241,000 | 3,236,000 | 3,451,000 | 3,479,000 | 3,326,000 | 95 | |
| 20 | 2,531,000 | 2,024,000 | 2,248,000 | 2,498,000 | 2,038,000 | 2,268,000 | 65 | |
| 30 | 1,784,000 | 2,131,000 | 2,152,000 | 2,064,000 | 2,021,000 | 2,030,000 | 58 | |
| 60 | 1,540,000 | 1,993,000 | 1,787,000 | 1,538,000 | 1,553,000 | 1,682,000 | 48 | |
1 NSM: Non-screw mixed.
Table 6.
Waterproofing performance testing results based on different screw-mixing times over predetermined storage periods.
Table 6.
Waterproofing performance testing results based on different screw-mixing times over predetermined storage periods.
| Test Method | Storage Time | Screw Mix Time Per Specimen | |||||||||||||||||||||||||||||
|---|---|---|---|---|---|---|---|---|---|---|---|---|---|---|---|---|---|---|---|---|---|---|---|---|---|---|---|---|---|---|---|
| No Screw Mixing | 10 min | 20 min | 30 min | 60 min | |||||||||||||||||||||||||||
| A | B | C | D | E | Avg | A | B | C | D | E | Avg | A | B | C | D | E | Avg | A | B | C | D | E | Avg | A | B | C | D | E | Avg | ||
| Washout Resistance (g) | 2 h | 0.01 | 0.03 | 0.00 | 0.00 | 0.07 | 0.02 | 0.00 | 0.01 | 0.02 | 0.03 | 0.00 | 0.01 | 0.00 | 0.08 | 0.02 | 0.00 | 0.07 | 0.03 | 0.11 | 0.08 | 0.13 | 0.10 | 0.07 | 0.10 | 0.12 | 0.22 | 0.17 | 0.09 | 0.11 | 0.14 |
| 1 day | 0.00 | 0.00 | 0.04 | 0.02 | 0.11 | 0.03 | 0.02 | 0.01 | 0.00 | 0.00 | 0.07 | 0.02 | 0.04 | 0.00 | 0.04 | 0.02 | 0.00 | 0.02 | 0.06 | 0.08 | 0.12 | 0.11 | 0.09 | 0.09 | 0.11 | 0.16 | 0.14 | 0.10 | 0.12 | 0.13 | |
| 2 days | 0.10 | 0.00 | 0.06 | 0.00 | 0.07 | 0.05 | 0.05 | 0.07 | 0.05 | 0.00 | 0.04 | 0.04 | 0.10 | 0.09 | 0.06 | 0.02 | 0.07 | 0.07 | 0.12 | 0.14 | 0.18 | 0.13 | 0.12 | 0.14 | 0.12 | 0.21 | 0.06 | 0.14 | 0.11 | 0.13 | |
| 3 days | 0.08 | 0.02 | 0.03 | 0.10 | 0.03 | 0.05 | 0.07 | 0.00 | 0.04 | 0.02 | 0.08 | 0.04 | 0.08 | 0.04 | 0.00 | 0.10 | 0.03 | 0.05 | 0.08 | 0.12 | 0.14 | 0.05 | 0.16 | 0.11 | 0.11 | 0.24 | 0.08 | 0.14 | 0.15 | 0.14 | |
| 7 days | 0.04 | 0.10 | 0.00 | 0.10 | 0.03 | 0.05 | 0.01 | 0.05 | 0.04 | 0.06 | 0.07 | 0.05 | 0.10 | 0.03 | 0.04 | 0.02 | 0.05 | 0.05 | 0.06 | 0.08 | 0.07 | 0.10 | 0.09 | 0.08 | 0.09 | 0.11 | 0.14 | 0.07 | 0.12 | 0.11 | |
| Avg.(w) | 0.05 | 0.03 | 0.03 | 0.04 | 0.06 | 0.04 | 0.03 | 0.03 | 0.03 | 0.02 | 0.05 | 0.03 | 0.06 | 0.05 | 0.03 | 0.03 | 0.04 | 0.04 | 0.09 | 0.10 | 0.13 | 0.10 | 0.11 | 0.11 | 0.11 | 0.19 | 0.12 | 0.11 | 0.12 | 0.13 | |
| Cohesion/Adhesion Strength (S) | 2 h | 60 | 60 | 60 | 60 | 60 | 60 | 60 | 60 | 60 | 60 | 60 | 60 | 60 | 60 | 60 | 60 | 60 | 60 | 22 | 35 | 37 | 41 | 32 | 33 | 12 | 27 | 11 | 15 | 16 | 16 |
| 1 day | 60 | 60 | 60 | 60 | 60 | 60 | 60 | 60 | 60 | 60 | 60 | 60 | 60 | 60 | 60 | 60 | 60 | 60 | 29 | 54 | 26 | 47 | 36 | 38 | 11 | 8 | 9 | 16 | 10 | 11 | |
| 2 days | 60 | 60 | 60 | 60 | 60 | 60 | 60 | 60 | 60 | 60 | 60 | 60 | 60 | 60 | 60 | 60 | 60 | 60 | 60 | 60 | 60 | 60 | 60 | 60 | 21 | 15 | 24 | 17 | 8 | 17 | |
| 3 days | 60 | 60 | 60 | 60 | 60 | 60 | 60 | 60 | 60 | 60 | 60 | 60 | 60 | 60 | 60 | 60 | 60 | 60 | 60 | 60 | 60 | 60 | 60 | 60 | 23 | 16 | 21 | 24 | 29 | 23 | |
| 7 days | 60 | 60 | 60 | 60 | 60 | 60 | 60 | 60 | 60 | 60 | 60 | 60 | 60 | 60 | 60 | 60 | 60 | 60 | 60 | 60 | 60 | 60 | 60 | 60 | 16 | 18 | 21 | 15 | 17 | 17 | |
| Avg (ts) | 60 | 60 | 60 | 60 | 60 | 60 | 60 | 60 | 60 | 60 | 60 | 60 | 60 | 60 | 60 | 60 | 60 | 60 | 46 | 54 | 49 | 54 | 50 | 50 | 17 | 17 | 17 | 17 | 16 | 17 | |
| Hydrostatic Pressure Resistance (min) | 2 h | 60 | 60 | 60 | 60 | 60 | 60 | 60 | 60 | 60 | 60 | 60 | 60 | 49 | 28 | 31 | 26 | 38 | 34 | 12 | 21 | 8 | 2 | 6 | 10 | 0 | 5 | 0 | 2 | 12 | 4 |
| 1 day | 60 | 60 | 60 | 60 | 60 | 60 | 60 | 60 | 60 | 60 | 60 | 60 | 33 | 42 | 37 | 26 | 37 | 35 | 26 | 19 | 48 | 0 | 9 | 20 | 6 | 0 | 9 | 0 | 0 | 3 | |
| 2 days | 60 | 60 | 60 | 60 | 60 | 60 | 60 | 60 | 60 | 60 | 60 | 60 | 60 | 43 | 38 | 24 | 39 | 41 | 11 | 17 | 24 | 42 | 7 | 20 | 11 | 0 | 24 | 6 | 14 | 11 | |
| 3 days | 60 | 60 | 60 | 60 | 60 | 60 | 60 | 60 | 60 | 60 | 60 | 60 | 36 | 47 | 42 | 35 | 29 | 39 | 12 | 60 | 35 | 7 | 37 | 30 | 27 | 32 | 0 | 15 | 37 | 22 | |
| 7 days | 60 | 60 | 60 | 60 | 60 | 60 | 60 | 60 | 60 | 60 | 60 | 60 | 60 | 60 | 60 | 60 | 60 | 60 | 36 | 21 | 47 | 32 | 26 | 32 | 39 | 60 | 44 | 0 | 26 | 34 | |
| Avg. (ti) | 60 | 60 | 60 | 60 | 60 | 60 | 60 | 60 | 60 | 60 | 60 | 60 | 48 | 44 | 42 | 34 | 41 | 49 | 19 | 28 | 32 | 17 | 17 | 22 | 17 | 19 | 15 | 5 | 18 | 15 | |
| Hydrostatic Pressure Resistance after Substrate Movement (min) | 2 h | 60 | 60 | 60 | 60 | 60 | 60 | 56 | 60 | 43 | 52 | 60 | 54 | 16 | 21 | 17 | 0 | 23 | 15 | 18 | 6 | 14 | 4 | 26 | 14 | 0 | 0 | 0 | 0 | 0 | 0 |
| 1 day | 60 | 60 | 60 | 60 | 60 | 60 | 42 | 60 | 39 | 16 | 48 | 41 | 0 | 0 | 5 | 29 | 0 | 7 | 32 | 0 | 20 | 13 | 22 | 17 | 0 | 12 | 0 | 26 | 0 | 8 | |
| 2 days | 60 | 60 | 60 | 60 | 60 | 60 | 60 | 60 | 13 | 47 | 60 | 48 | 37 | 18 | 40 | 13 | 46 | 31 | 36 | 22 | 24 | 45 | 27 | 31 | 0 | 60 | 0 | 0 | 0 | 12 | |
| 3 days | 60 | 60 | 60 | 60 | 60 | 60 | 37 | 49 | 45 | 36 | 60 | 45 | 19 | 60 | 7 | 56 | 32 | 35 | 45 | 19 | 0 | 11 | 12 | 17 | 0 | 0 | 0 | 0 | 0 | 0 | |
| 7 days | 60 | 60 | 60 | 60 | 60 | 60 | 60 | 54 | 60 | 50 | 26 | 50 | 47 | 60 | 60 | 60 | 0 | 45 | 22 | 46 | 2 | 33 | 40 | 29 | 0 | 0 | 0 | 35 | 14 | 10 | |
| Avg.(tsm) | 60 | 60 | 60 | 60 | 60 | 60 | 51 | 57 | 40 | 40 | 51 | 48 | 24 | 32 | 26 | 32 | 20 | 27 | 31 | 19 | 12 | 21 | 25 | 22 | 0 | 14 | 0 | 12 | 3 | 6 | |
Table 7.
Estimation of the deviancy from the expected performance of SPRG (2 h storage).
| Degradation Factors | Ratio per Screw Mixing Time (%) | ||||
|---|---|---|---|---|---|
| NSM | 10 min | 20 min | 30 min | 60 min | |
| Viscosity loss ratio (Vl) | 2 | 8 | 2 | 49 | 56 |
| Mass loss ratio (Wl) | 13 | 7 | 20 | 67 | 93 |
| Adhesion failure ratio (Tf) | 0 | 0 | 0 | 45 | 73 |
| Impermeability failure ratio (Tif) | 0 | 1 | 43 | 83 | 93 |
| Impermeability failure ratio after SMRT 1 (Tsmf) | 0 | 10 | 75 | 77 | 100 |
| Averaged deviancy from expected performance | 3 | 5.2 | 33.2 | 64.2 | 83 |
1 Substrate movement resistance testing.
Table 8.
Estimation of the deviancy from the expected performance of SPRG (1 day storage).
| Degradation Factors | Ratio per Screw Mixing Time (%) | ||||
|---|---|---|---|---|---|
| NSM | 10 min | 20 min | 30 min | 60 min | |
| Viscosity loss ratio (Vl) | 3 | 8 | 42 | 39 | 43 |
| Mass loss ratio (Wl) | 2 | 13 | 13 | 60 | 87 |
| Adhesion failure ratio (Tf) | 0 | 0.5 | 2.5 | 37 | 82 |
| Impermeability failure ratio (Tif) | 0 | 0 | 42 | 67 | 95 |
| Impermeability failure ratio after SMRT 1 (Tsmf) | 0 | 32 | 88 | 72 | 87 |
| Averaged deviancy from expected performance | 1 | 10.7 | 37.5 | 55 | 78.8 |
1 Substrate movement resistance testing.
Table 9.
Estimation of the deviancy from the expected performance of SPRG (2 days storage).
| Degradation Factors | Ratio per Screw Mixing Time (%) | ||||
|---|---|---|---|---|---|
| NSM | 10 min | 20 min | 30 min | 60 min | |
| Viscosity loss ratio (Vl) | 2 | 8 | 36 | 39 | 49 |
| Mass loss ratio (Wl) | 33 | 27 | 47 | 93 | 87 |
| Adhesion failure ratio (Tf) | 0 | 1 | 1 | 0 | 72 |
| Impermeability failure ratio (Tif) | 0 | 1.5 | 32 | 67 | 82 |
| Impermeability failure ratio after SMRT 1 (Tsmf) | 0 | 20 | 48 | 48 | 80 |
| Averaged deviancy from expected performance | 7 | 11.5 | 32.8 | 49.4 | 74 |
1 Substrate movement resistance testing.
Table 10.
Estimation of the deviancy from the expected performance of SPRG (3 days storage).
| Degradation Factors | Ratio per Screw Mixing Time (%) | ||||
|---|---|---|---|---|---|
| NSM | 10 min | 20 min | 30 min | 60 min | |
| Viscosity loss ratio (Vl) | 2 | 2 | 29 | 41 | 56 |
| Mass loss ratio (Wl) | 34 | 27 | 33 | 73 | 93 |
| Adhesion failure ratio (Tf) | 0 | 1.5 | 1.5 | 0 | 62 |
| Impermeability failure ratio (Tif) | 0 | 1 | 35 | 50 | 63 |
| Impermeability failure ratio after SMRT 1 (Tsmf) | 0 | 25 | 42 | 72 | 100 |
| Averaged deviancy from expected performance | 7.2 | 11.3 | 28.1 | 47.2 | 74.8 |
1 Substrate movement resistance testing.
Table 11.
Estimation of the deviancy from the expected performance of SPRG (7 days storage).
| Degradation Factors | Ratio per Screw Mixing Time (%) | ||||
|---|---|---|---|---|---|
| NSM | 10 min | 20 min | 30 min | 60 min | |
| Viscosity loss ratio (Vl) | 1 | 1 | 42 | 42 | 56 |
| Mass loss ratio (Wl) | 32 | 33 | 33 | 53 | 73 |
| Adhesion failure ratio (Tf) | 0 | 2 | 2 | 0 | 72 |
| Impermeability failure ratio (Tif) | 0 | 2 | 0 | 47 | 43 |
| Impermeability failure ratio after SMRT 1 (Tsmf) | 0 | 17 | 25 | 52 | 83 |
| Averaged deviancy from expected performance | 6.6 | 11 | 20.4 | 38.8 | 65.4 |
1 Substrate movement resistance testing.
© 2018 by the authors. Licensee MDPI, Basel, Switzerland. This article is an open access article distributed under the terms and conditions of the Creative Commons Attribution (CC BY) license (http://creativecommons.org/licenses/by/4.0/).
Share and Cite
MDPI and ACS Style
Ahn, D.S.; Oh, K.H.; Park, J.S.; Oh, S.K. Viscosity and Waterproofing Performance Evaluation of Synthetic Polymerized Rubber Gel (SPRG) after Screw Mixing. Appl. Sci. 2018, 8, 1989. https://0-doi-org.brum.beds.ac.uk/10.3390/app8101989
AMA Style
Ahn DS, Oh KH, Park JS, Oh SK. Viscosity and Waterproofing Performance Evaluation of Synthetic Polymerized Rubber Gel (SPRG) after Screw Mixing. Applied Sciences. 2018; 8(10):1989. https://0-doi-org.brum.beds.ac.uk/10.3390/app8101989
Chicago/Turabian StyleAhn, Dong Soo, Kyu Hwan Oh, Jin Sang Park, and Sang Keun Oh. 2018. "Viscosity and Waterproofing Performance Evaluation of Synthetic Polymerized Rubber Gel (SPRG) after Screw Mixing" Applied Sciences 8, no. 10: 1989. https://0-doi-org.brum.beds.ac.uk/10.3390/app8101989
Note that from the first issue of 2016, this journal uses article numbers instead of page numbers. See further details here.