Article

Co-Occurrence Network of High-Frequency Words in the Bioinformatics Literature: Structural Characteristics and Evolution

School of Maritime Economics and Management, Dalian Maritime University, Dalian 116026, China
*
Author to whom correspondence should be addressed.
Submission received: 11 September 2018 / Revised: 8 October 2018 / Accepted: 19 October 2018 / Published: 20 October 2018
(This article belongs to the Special Issue Applied Sciences Based on and Related to Computer and Control)

Abstract

:

Featured Application

Mining valuable knowledge in the literature helps to save time for readers to understand the content and direction of the literature quickly.

Abstract

The subjects of literature are the direct expression of the author’s research results. Mining valuable knowledge helps to save time for the readers to understand the content and direction of the literature quickly. Therefore, the co-occurrence network of high-frequency words in the bioinformatics literature and its structural characteristics and evolution were analysed in this paper. First, 242,891 articles from 47 top bioinformatics periodicals were chosen as the object of the study. Second, the co-occurrence relationship among high-frequency words of these articles was analysed by word segmentation and high-frequency word selection. Then, a co-occurrence network of high-frequency words in bioinformatics literature was built. Finally, the conclusions were drawn by analysing its structural characteristics and evolution. The results showed that the co-occurrence network of high-frequency words in the bioinformatics literature was a small-world network with scale-free distribution, rich-club phenomenon and disassortative matching characteristics. At the same time, the high-frequency words used by authors changed little in 2–3 years but varied greatly in four years because of the influence of the state-of-the-art technology.

1. Introduction

Biotechnology science has led to biological information research in twenty-first century. Biological information improves the level of biological intelligence with the help of information technology. A large number of related articles have been published in this field as it is one of the most concerned research areas. Biological research results and findings are recorded in various forms of literature [1]. More than 1 million articles are included in PubMed each year since 2011, which can be accessed by searching on the website (https://0-www-ncbi-nlm-nih-gov.brum.beds.ac.uk/pubmed). Consequently, how to quickly collect the literature and use knowledge discovery and data mining methods to identify future research hotspots has become an urgent issue in scientific investigations. For example, many countries carry a high cancer burden, and comprehensive cancer nursing has become increasingly complicated and difficult [1]. Segregating the vast number of existing articles will help to identify the cause and effect of cancer and achieve the goal of preventing cancer.
The theory of complex networks has been widely applied in many fields [2,3,4,5,6,7,8,9,10,11,12,13,14,15,16,17,18,19,20]. First, a social network is its most classical application. For instance, the relationship among people or networks by on-line detection can be found [2,3,4,5], the impact of disaster on social networks [6], the trade-off between social utility and economic performance [7], the intention to migrate [8,9], and unifying aging and frailty [10]. Second, it is also used in other networks [11,12,13], for example, traffic networks [11,12] and metro networks [13]. Co-word analysis is a direction for applying complex networks in text mining [14]. Many articles have reported on the application of co-word analysis to the biological literature. For example, a text and co-word matrix composed of 40 high-frequency words and 2945 articles was constructed and the proposed cancer immunotherapy made use of the immune system for treating cancer [14]. At the same time, complex networks, such as knowledge network, social networks, shipping network, traffic network, have been widely used in daily life, analysing the structural characteristics of the networks, and providing inspiration for work and life. Zarandi [15] proposed a novel Community Detection Algorithm based on Structural Similarity executed in two consecutive phases. İlhan [16] proposed a novel framework that examined various structural features of the network and detected the most prominent subset of community features to predict the future direction of community evolution. Zhao [17] featured several significant findings. The evolution of the knowledge flow network of a strategic alliance could produce a bifurcation phenomenon composed of saddle-node bifurcation and trans-critical bifurcation. Knowledge-embedded resource allocation was the most effective in improving the knowledge flow rate of networks and could further supply ample impetus for evolution. The aforementioned findings were beneficial for understanding the key problems of each resource allocation model and the evolution of strategic alliance in knowledge flow networks. Li [18] investigated that the evolution of the network structure in TFP-glass with increasing temperature to explore the plausible mechanism. The dissociation of the network structure in TFP-glass, which could be observed in all TFP-glass samples synthesized under different conditions, was believed to be the reason for the temperature-dependency of the interfacial interaction. The mechanism underlying the dissociation was thoroughly investigated using two-dimensional infrared spectroscopy, dynamic rheological analysis and XRD. Yang [19] mainly explored the discussion network and its structural evolution based on an empirical study of a famous online discussion that happened in China in 2008 and found that the scale growth of the network had an S shape, the degree distribution represented the power law in the first halfway, and the network showed a degree of disassortative characteristic. Wang [20] referred to the analysis ideas and methods of complex networks, used the standardized Laplace matrix and K-means clustering method to divide the gene regulatory network into multiple communities, and demonstrated the gene interactions within each community and among communities.
The map of scientific knowledge is one of the hottest research methods in the field of international scientific metrology. It combines the citation analysis and visualization technology in scientific metrology to realize the effective use of information and further generate new knowledge. The relationship of co-occurrence is one of the most important aspects in the map of scientific knowledge. It has already been widely used in text mining [21], social network analysis [22], environmental analysis [23], and so forth. It is also applied in the field of biology to solve all kinds of related problems. For example, Kamneva [24] predicted co-occurrence between reference genomes from two 16S-based ecological datasets. Wang, et al. [25,26] analysed the Protein Domain Co-occurrence Network for predicting protein and domain functions. Li, et al. [27] showed that the signatures of ARG and MRG co-occurrence were much more frequent and the co-occurrence structures in the habitat divisions were significantly different, which could be attributed to their distinct gene transfer potentials. However, a few studies focused on the hot or high-frequency words in the biological literature.
In this study, the co-occurrence word method (one of the most popular methods for the scientific knowledge map) was mainly adopted to analyse 242,891 articles from 47 top bioinformatics journals during 2013–2018. The hot words of the related subjects and contents in the field of biological information could be accurately expressed and identified, the relationship among the subjects could be analysed, and then the co-occurrence network of high-frequency words could be constructed using the words and terms appearing in the same-subject articles. Subsequently, the structural characteristics and evolution rules of the network were analysed, and the hot research trends in the field of bioinformatics were concluded. Python was used to accomplish the experimental process and Gephi (an open-source and free software on https://gephi.org/)to achieve the visualization of results.

2. Methods

2.1. Datasets

Journals on bioinformatics are so vast in number that analysing all of them was difficult. Therefore, only those journals that included Mathematical and Computational Biology, Biochemistry and Molecular Biology, Biotechnology and Applied Microbiology, and Multidisciplinary Science were chosen in this study from PubMed and Letpub. Finally, 47 journals were selected, and their names, IF, rank, areas and publishers are given in Table 1.
A total of 242,891 articles were chosen from these journals during the last five years (2013–2018) to identify the recent research hotspots in the bioinformatics literature. A co-occurrence network of bioinformatics high-frequency words based on these 242,891 articles was constructed, and its process is given in Figure 1.

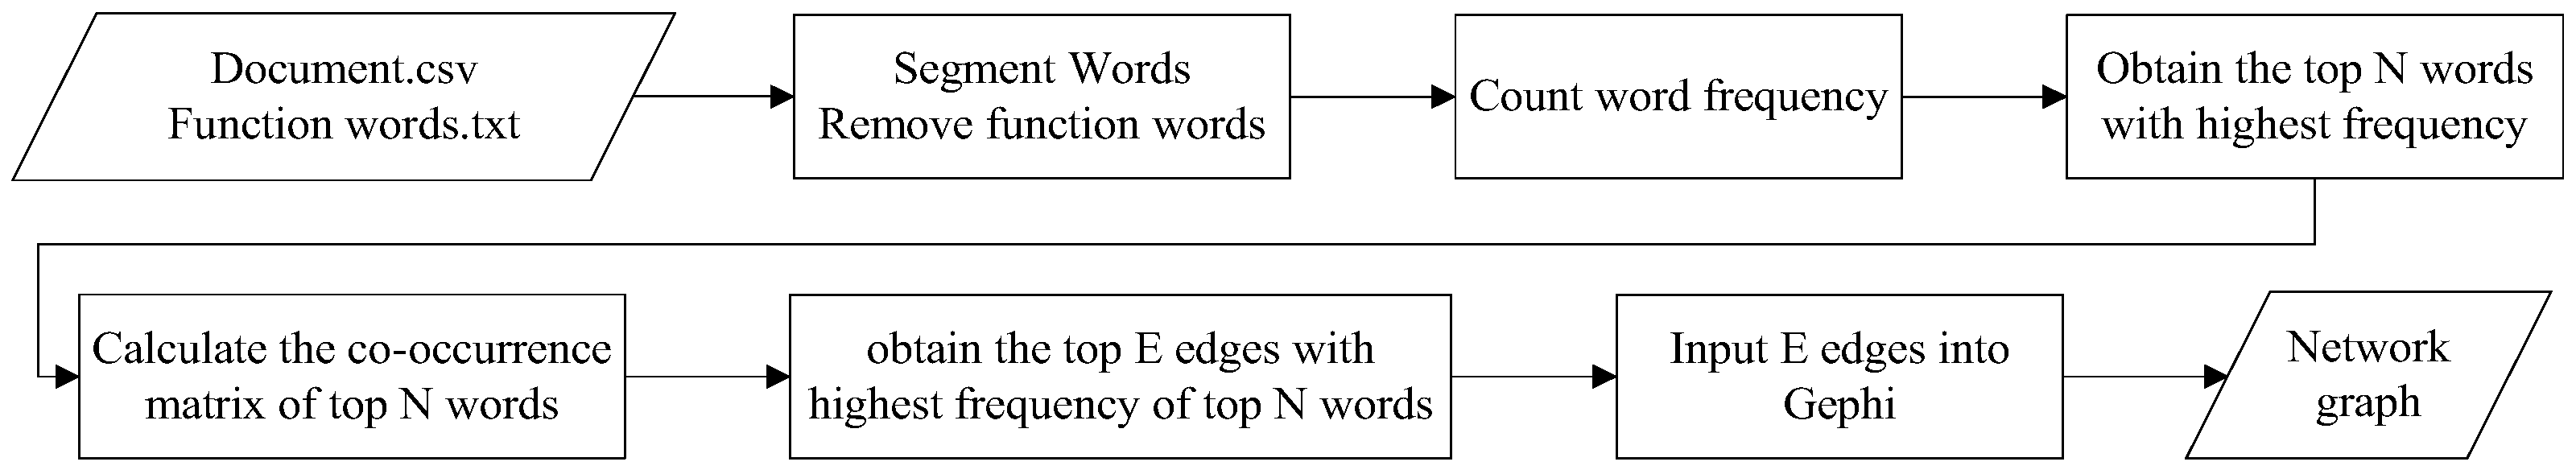
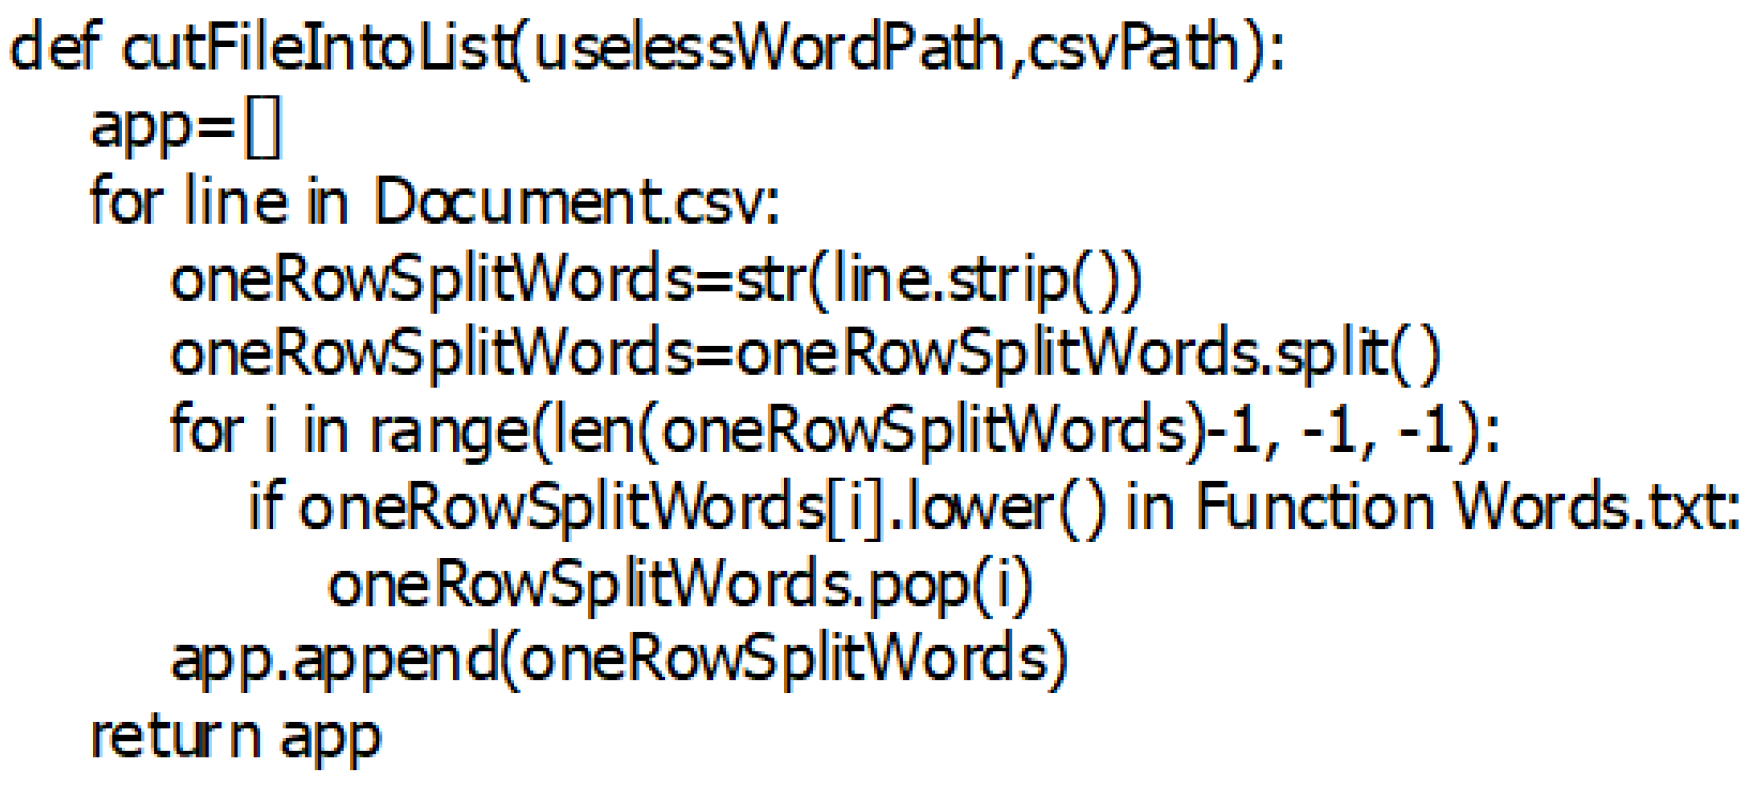
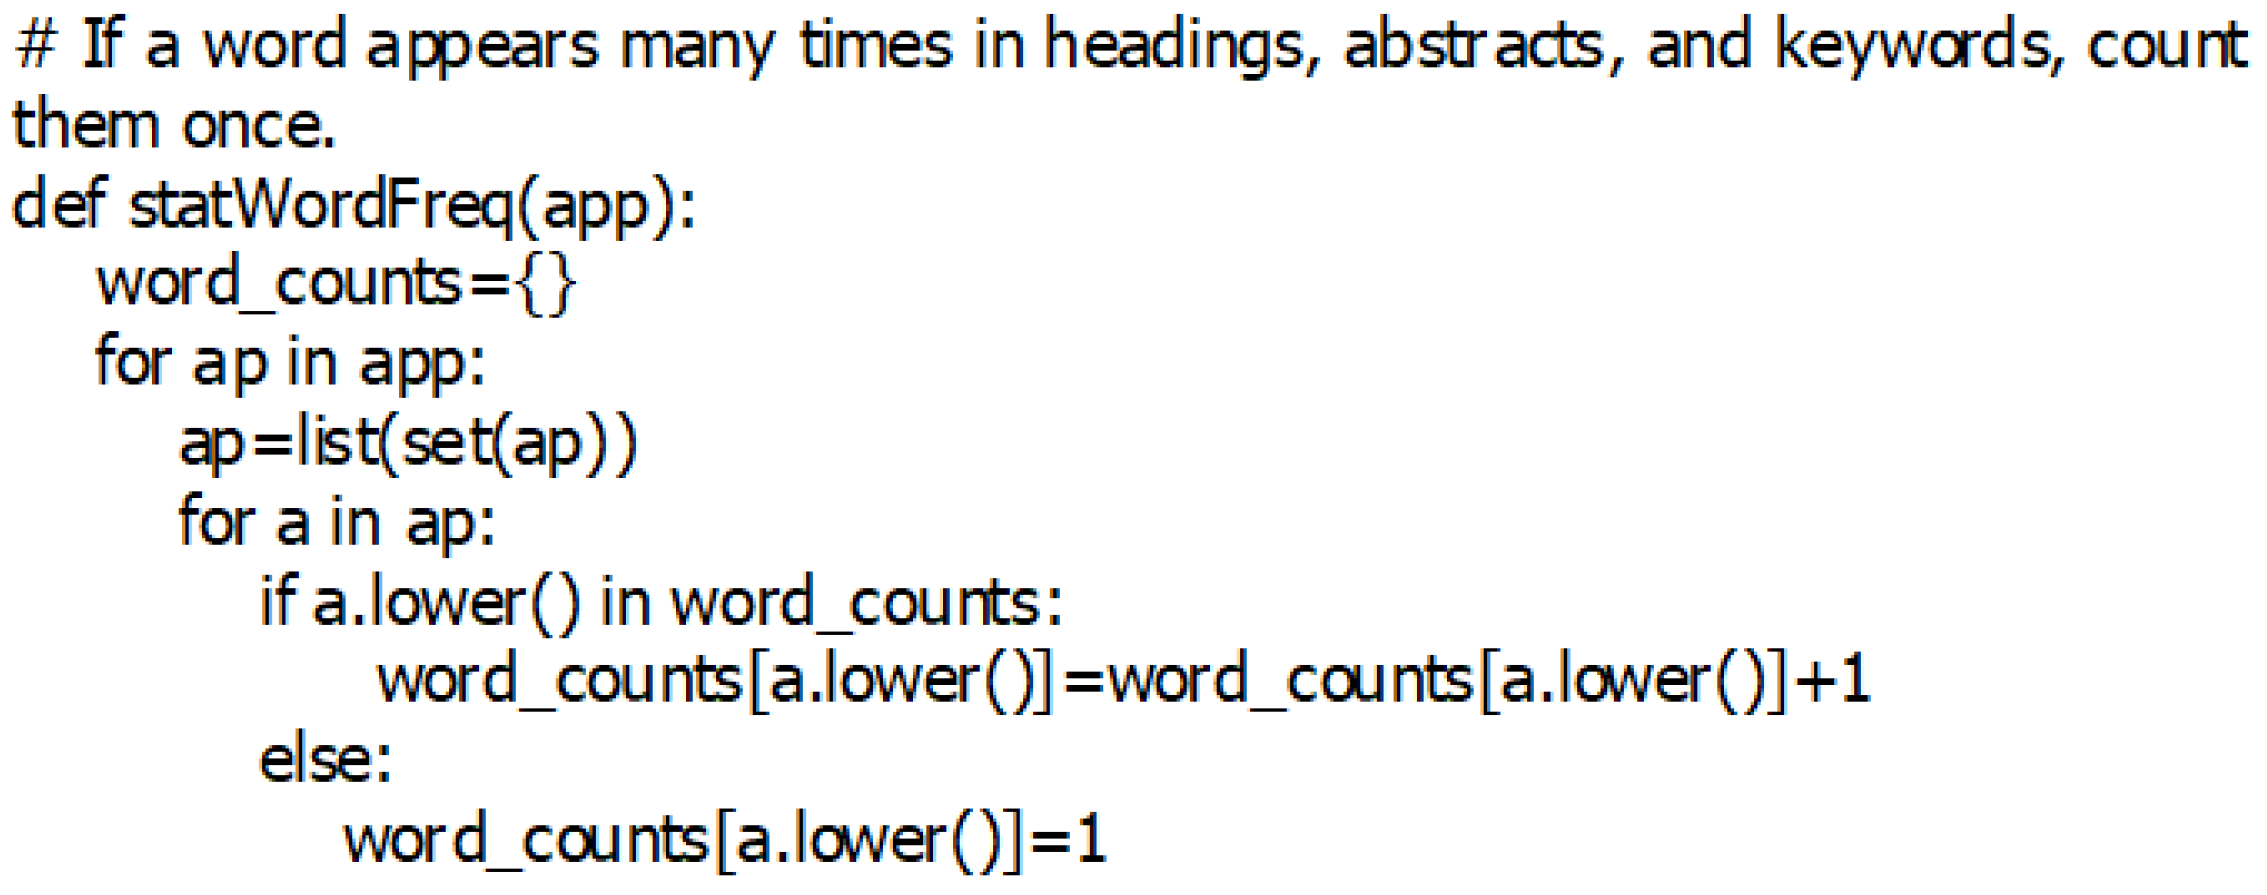
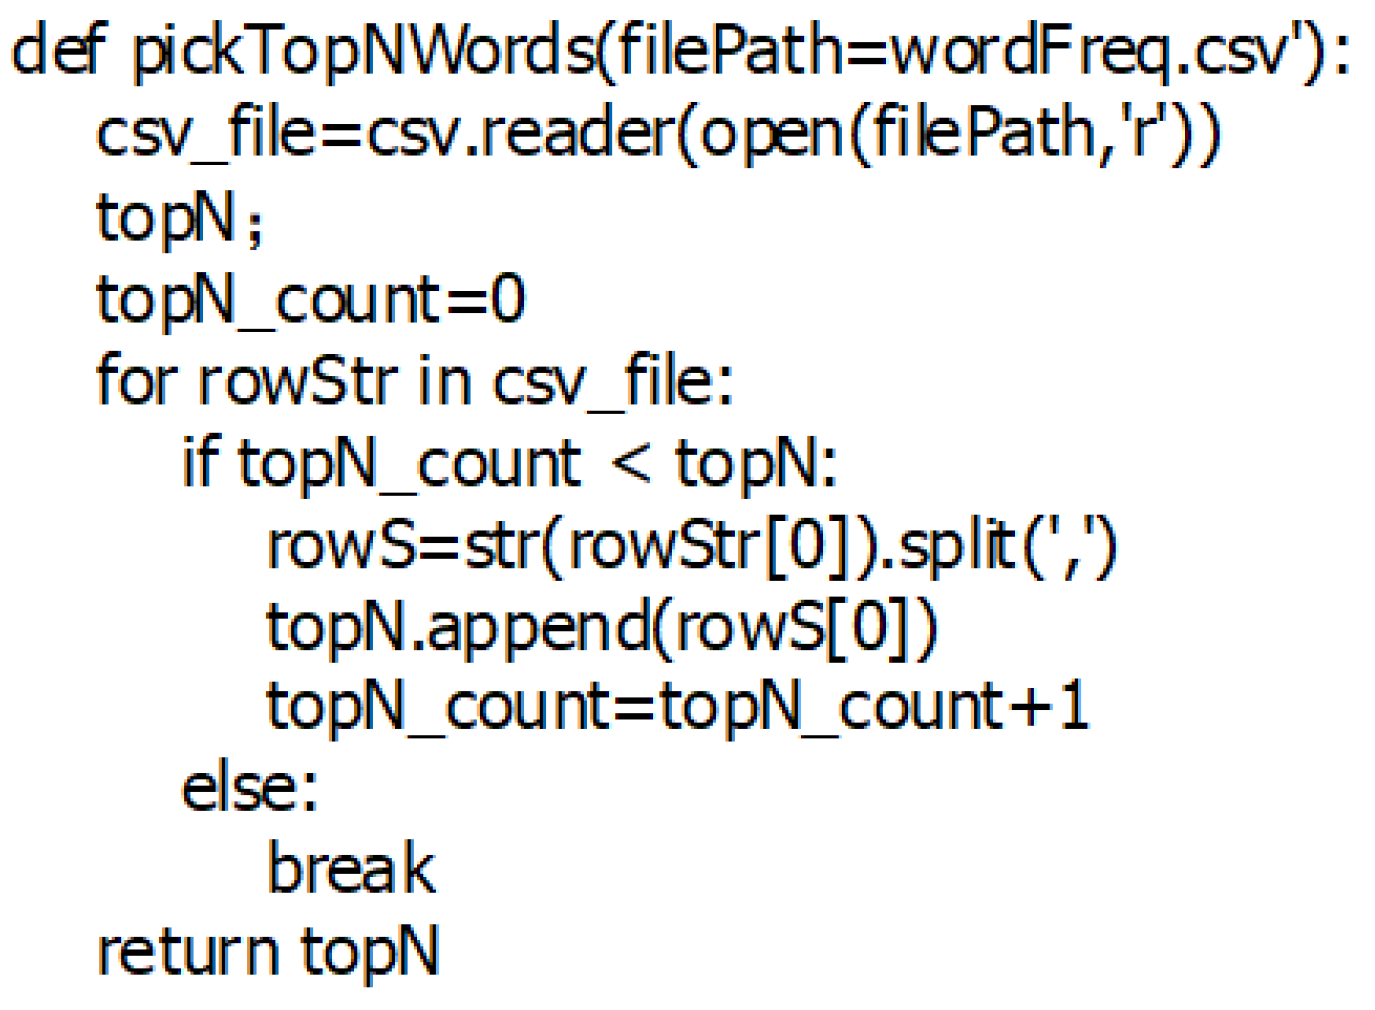
2.2. Word Segmentation and High-Frequency Words

An article usually comprises several thousand words (as in this study), and the efficiency of analysing words of all 242,891 articles was quite slow. Therefore, the subjects, including the title, summary, and key words of the article, were analysed instead of the full text of the article. Then, subjects were split into words by space and the sequence of words was recorded to express the article. Next, the function words, such as articles, prepositions, conjunctions and other words without practical significance were removed. The pseudocode of this section is shown in Figure A1, Figure A2 and Figure A3 in Appendix A. ci presents the ith word and ni is its frequency. Then, the probability of ci appearing in the subjects of the whole N articles was calculated using pi = ni/N. Next, words were sorted by frequency (or probability) in a descending order, which ensured ninj for ∀i < j (equivalent to pipj). The number of high-frequency word K was set, which meant that the top K words were K high-frequency words.

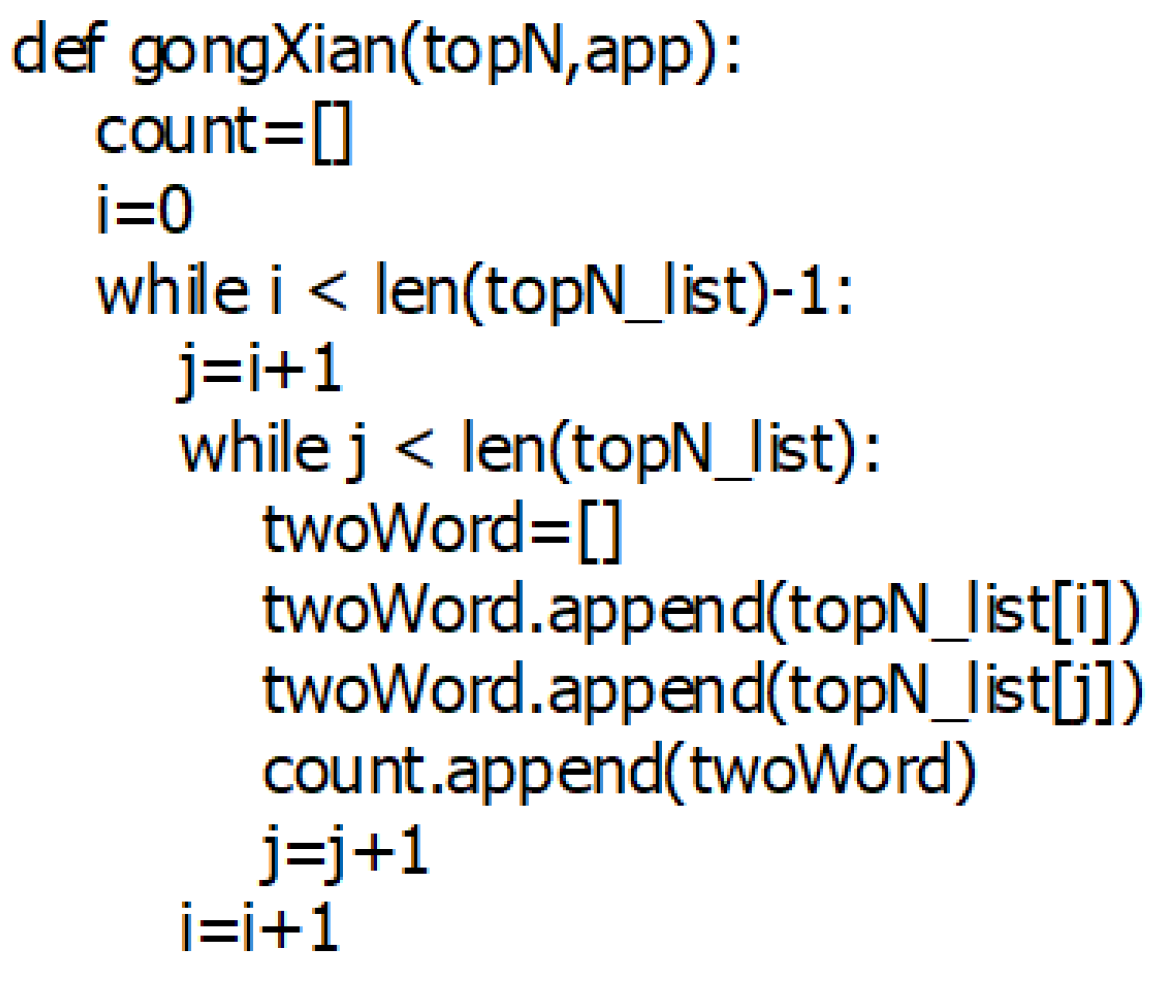
2.3. High-Frequency Word Co-Occurrence Matrix and Co-Occurrence Network

Let eij be the number of any two high-frequency words ci and cj in the same subject among all N article subjects. The co-occurrence relationship between any two high-frequency words was expressed by mutual information in information theory (pseudocode shown in Figure A4), describing the degree of association between these two words. The following formula was used for calculation (1).
I i , j = log 2 P i , j P i P j
where P i , j represents the probability of co-occurrence of ci and cj, P i indicates the probability of occurrence of ci, and P j indicates the probability of occurrence of cj. The larger the value of I i , j , the greater the co-occurrence degree of ci and cj. The matrix ( I i , j )K × K is a high-frequency co-occurrence matrix (considering the symmetric relation, I i , j = I j , i , and the matrix ( I i , j )K × K can also be expressed as a triangular or lower triangular matrix).
The main reason for choosing mutual information instead of selecting the number of frequent words could be analysed by the following process, assuming 10,000 articles, and the frequency of high-frequency words c1 and c2 as n1 = 8000 (p1 = 0.8), n2 = 7000 (p2 = 0.7), respectively. The number of co-occurrence of c1 and c2 was 5000 (p1,2 = 0.5), and mutual information was I1,2 = −0.36. The frequency of high-frequency words c3 and c4 was n3 = 5000 (p3 = 0.5), n4 = 5000 (p4 = 0.5), respectively, the number of co-occurrence of c3 and c4 was 4500 (p3,4 = 0.45), and the mutual information is I3,4 = 0.85. Although the co-occurrence of c3 and c4 was relatively small, c3 and c4 almost always appeared at the same time. Therefore, they were considered to be in a co-occurrence relationship. Additionally, the association rules [28] were algo used to obtain the co-occurrence relationship among high-frequency words.

2.4. Average Path Length

The average path length of a network is the average value of the shortest path length between any two nodes in the network, which was calculated using Equation (2):
L = i j d i j N ( N 1 )
where d ij is the number of edges between high-frequency word nodes i and j. The clustering coefficient of the network is the average of clustering coefficient of all nodes in the network defined as follows:
C = 1 N Σ i N i k i ( k i 1 ) / 2
where ki is the degree of node i, and Ni is the number of edges among ki neighbour nodes.

2.4.1. Rich-Club Coefficient

The rich-club coefficient is defined as follows:
φ ( k ) = 2 E > k N > k ( N > k 1 )
where N > k ( N > k 1 ) /2 represents the maximum possible number of edges among nodes with degree more than k.

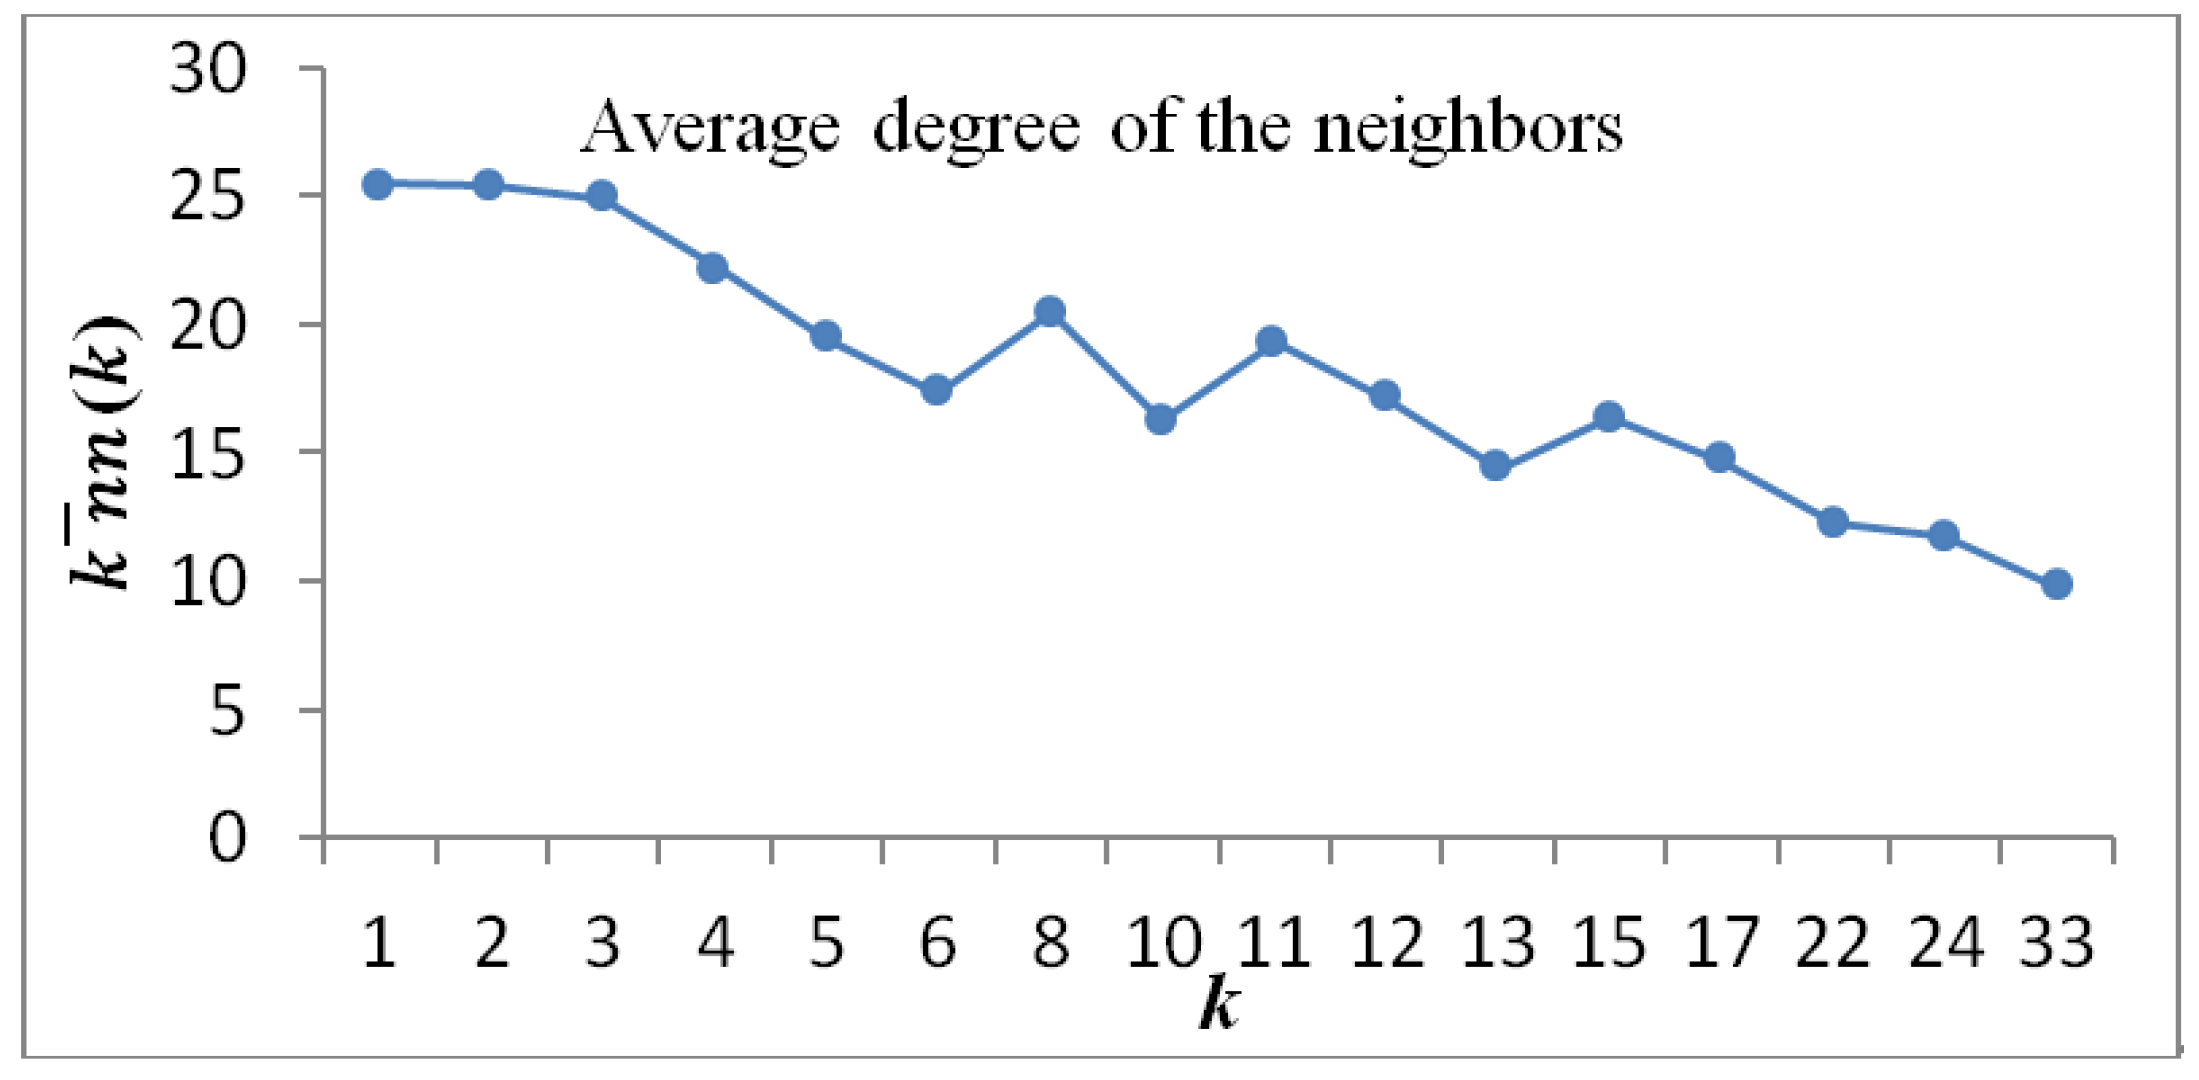
2.4.2. Neighbour Average Degree

The neighbour average degree of node i was calculated using Equation (5):
k n n ( i ) = 1 k i Σ j ϵ N i k j
where Ni is the set of neighbours of node i. The average degree of neighbours of these nodes with same degree k was statistically averaged, which was the number of nodes in the network with moderate k. If the value of k ¯ n n ( k ) increased with the increase of k, high-connectivity nodes were easy to connect with other high-connectivity nodes and the network was assortative network. Vice versa, if the value of k ¯ n n ( k ) increased with the decrease of k, the network performance was the disassortative network.

3. Results and Discussion

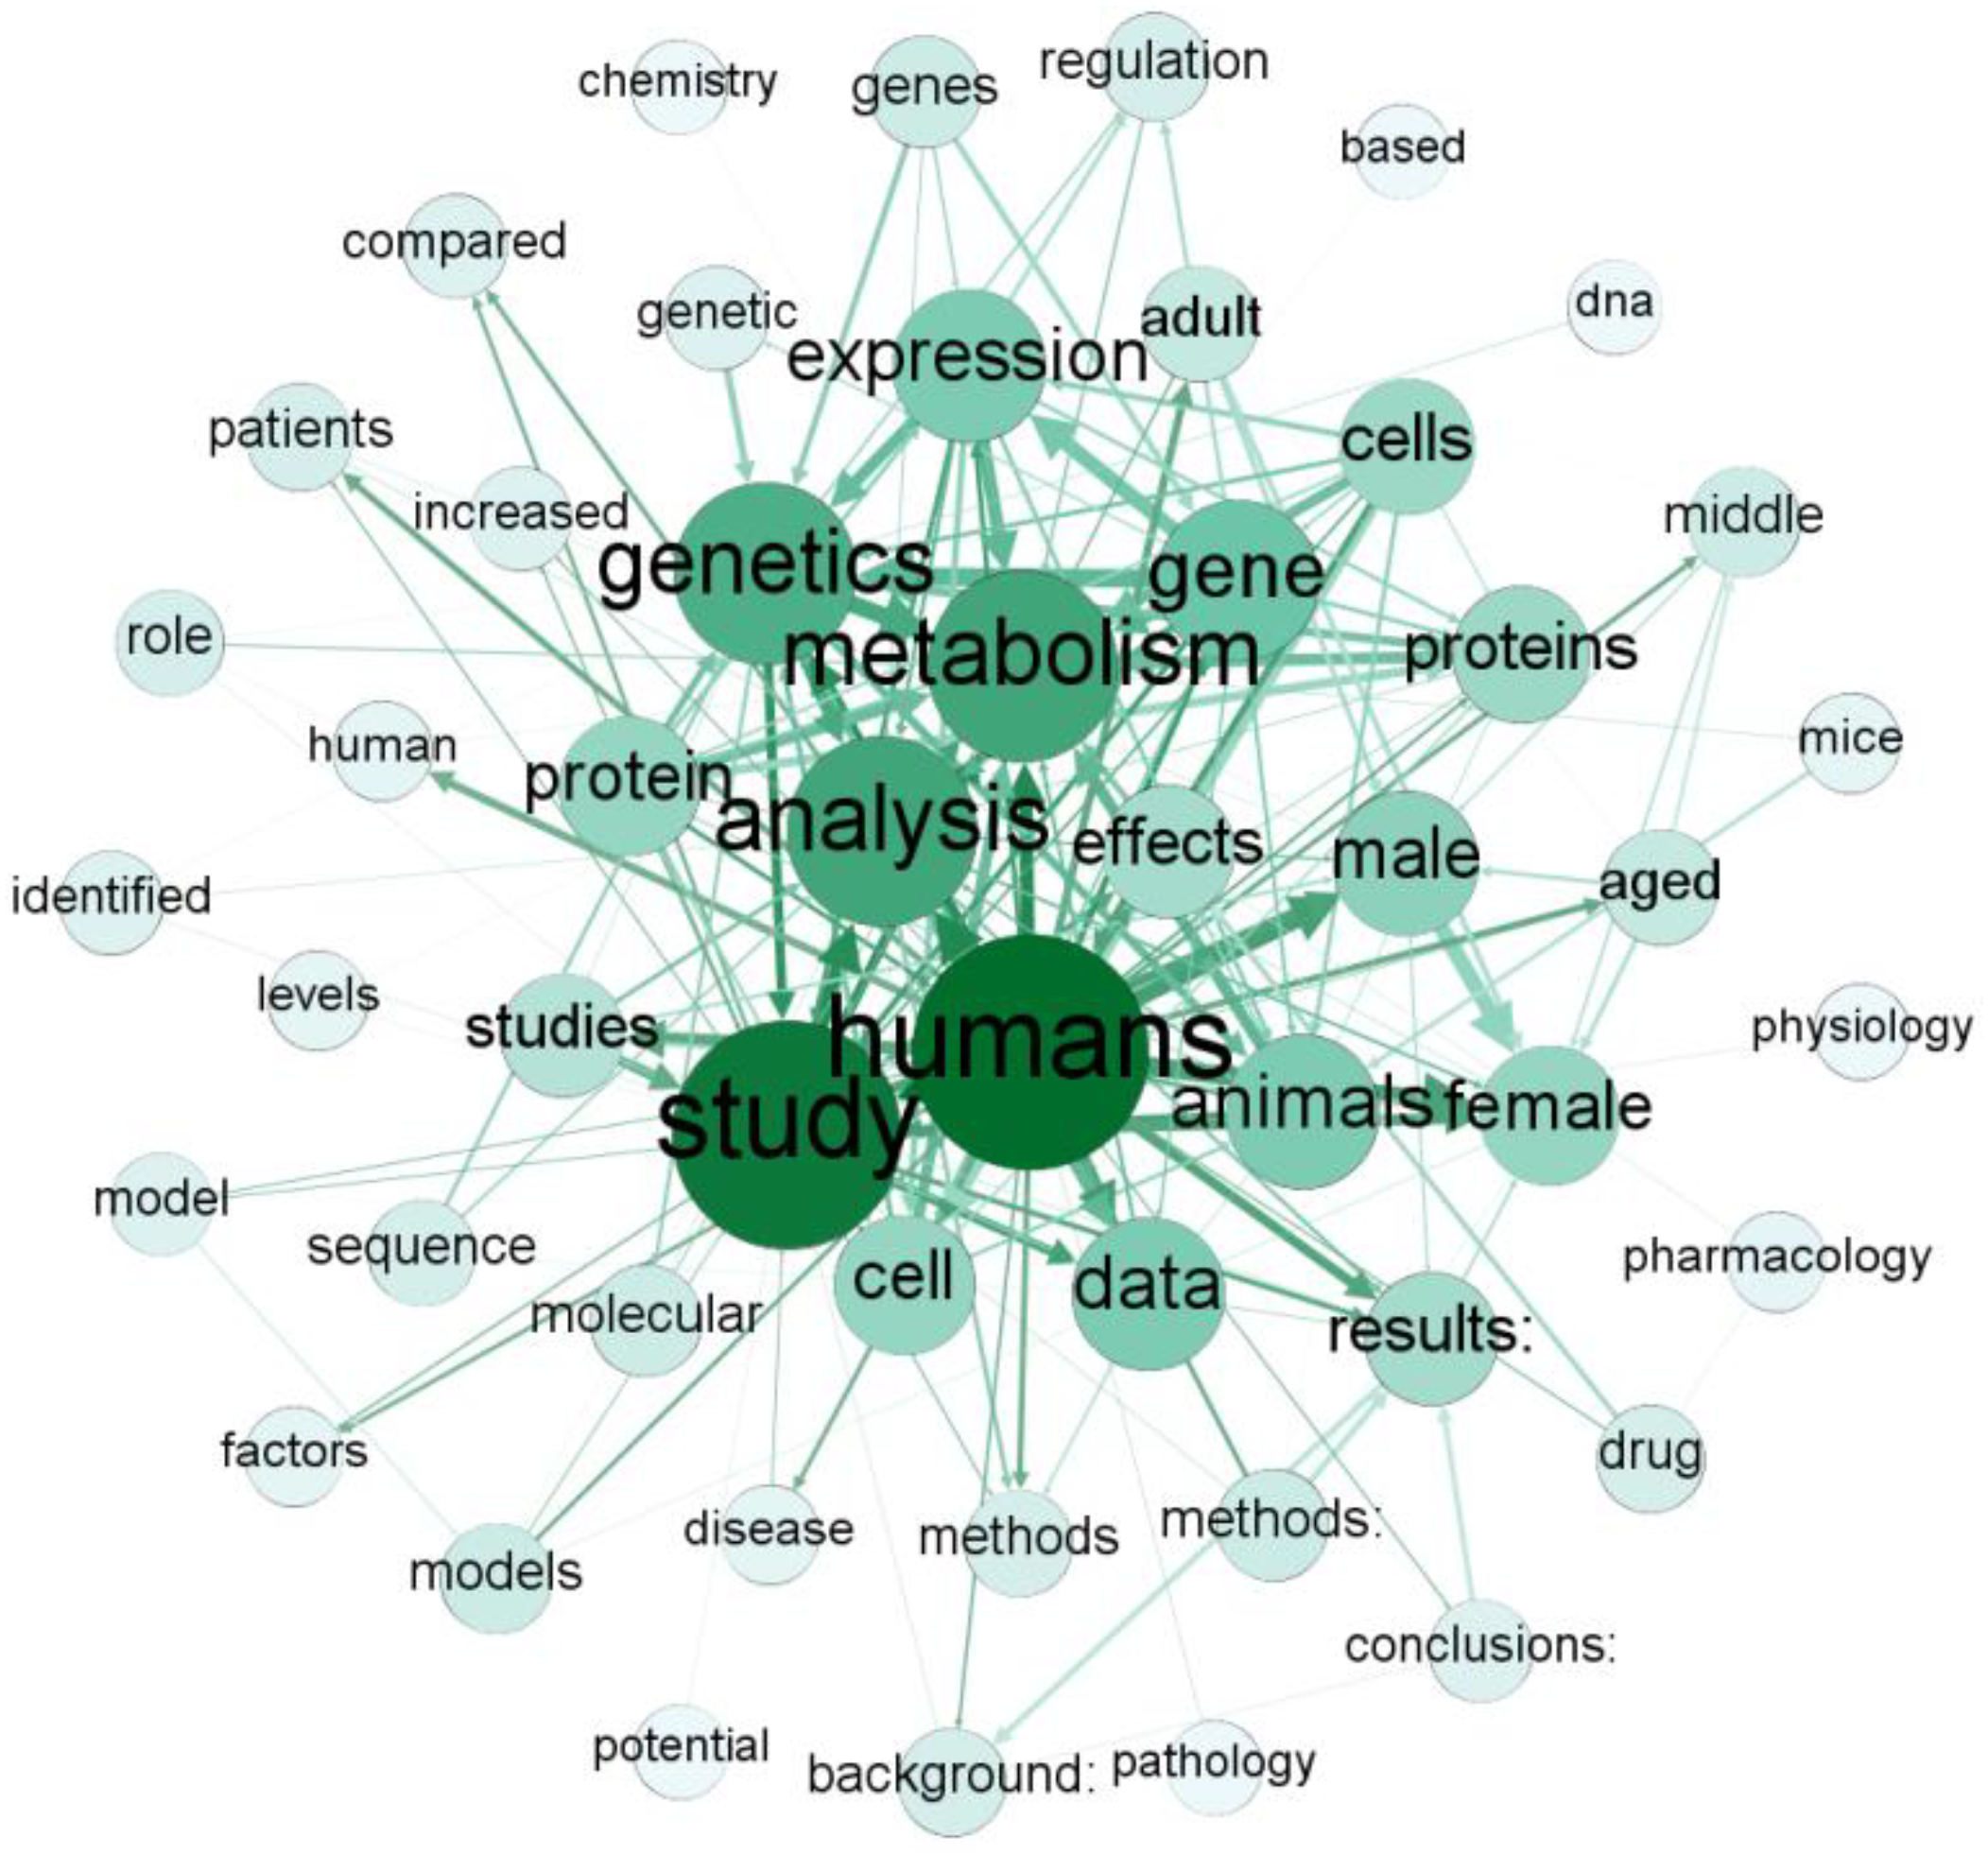
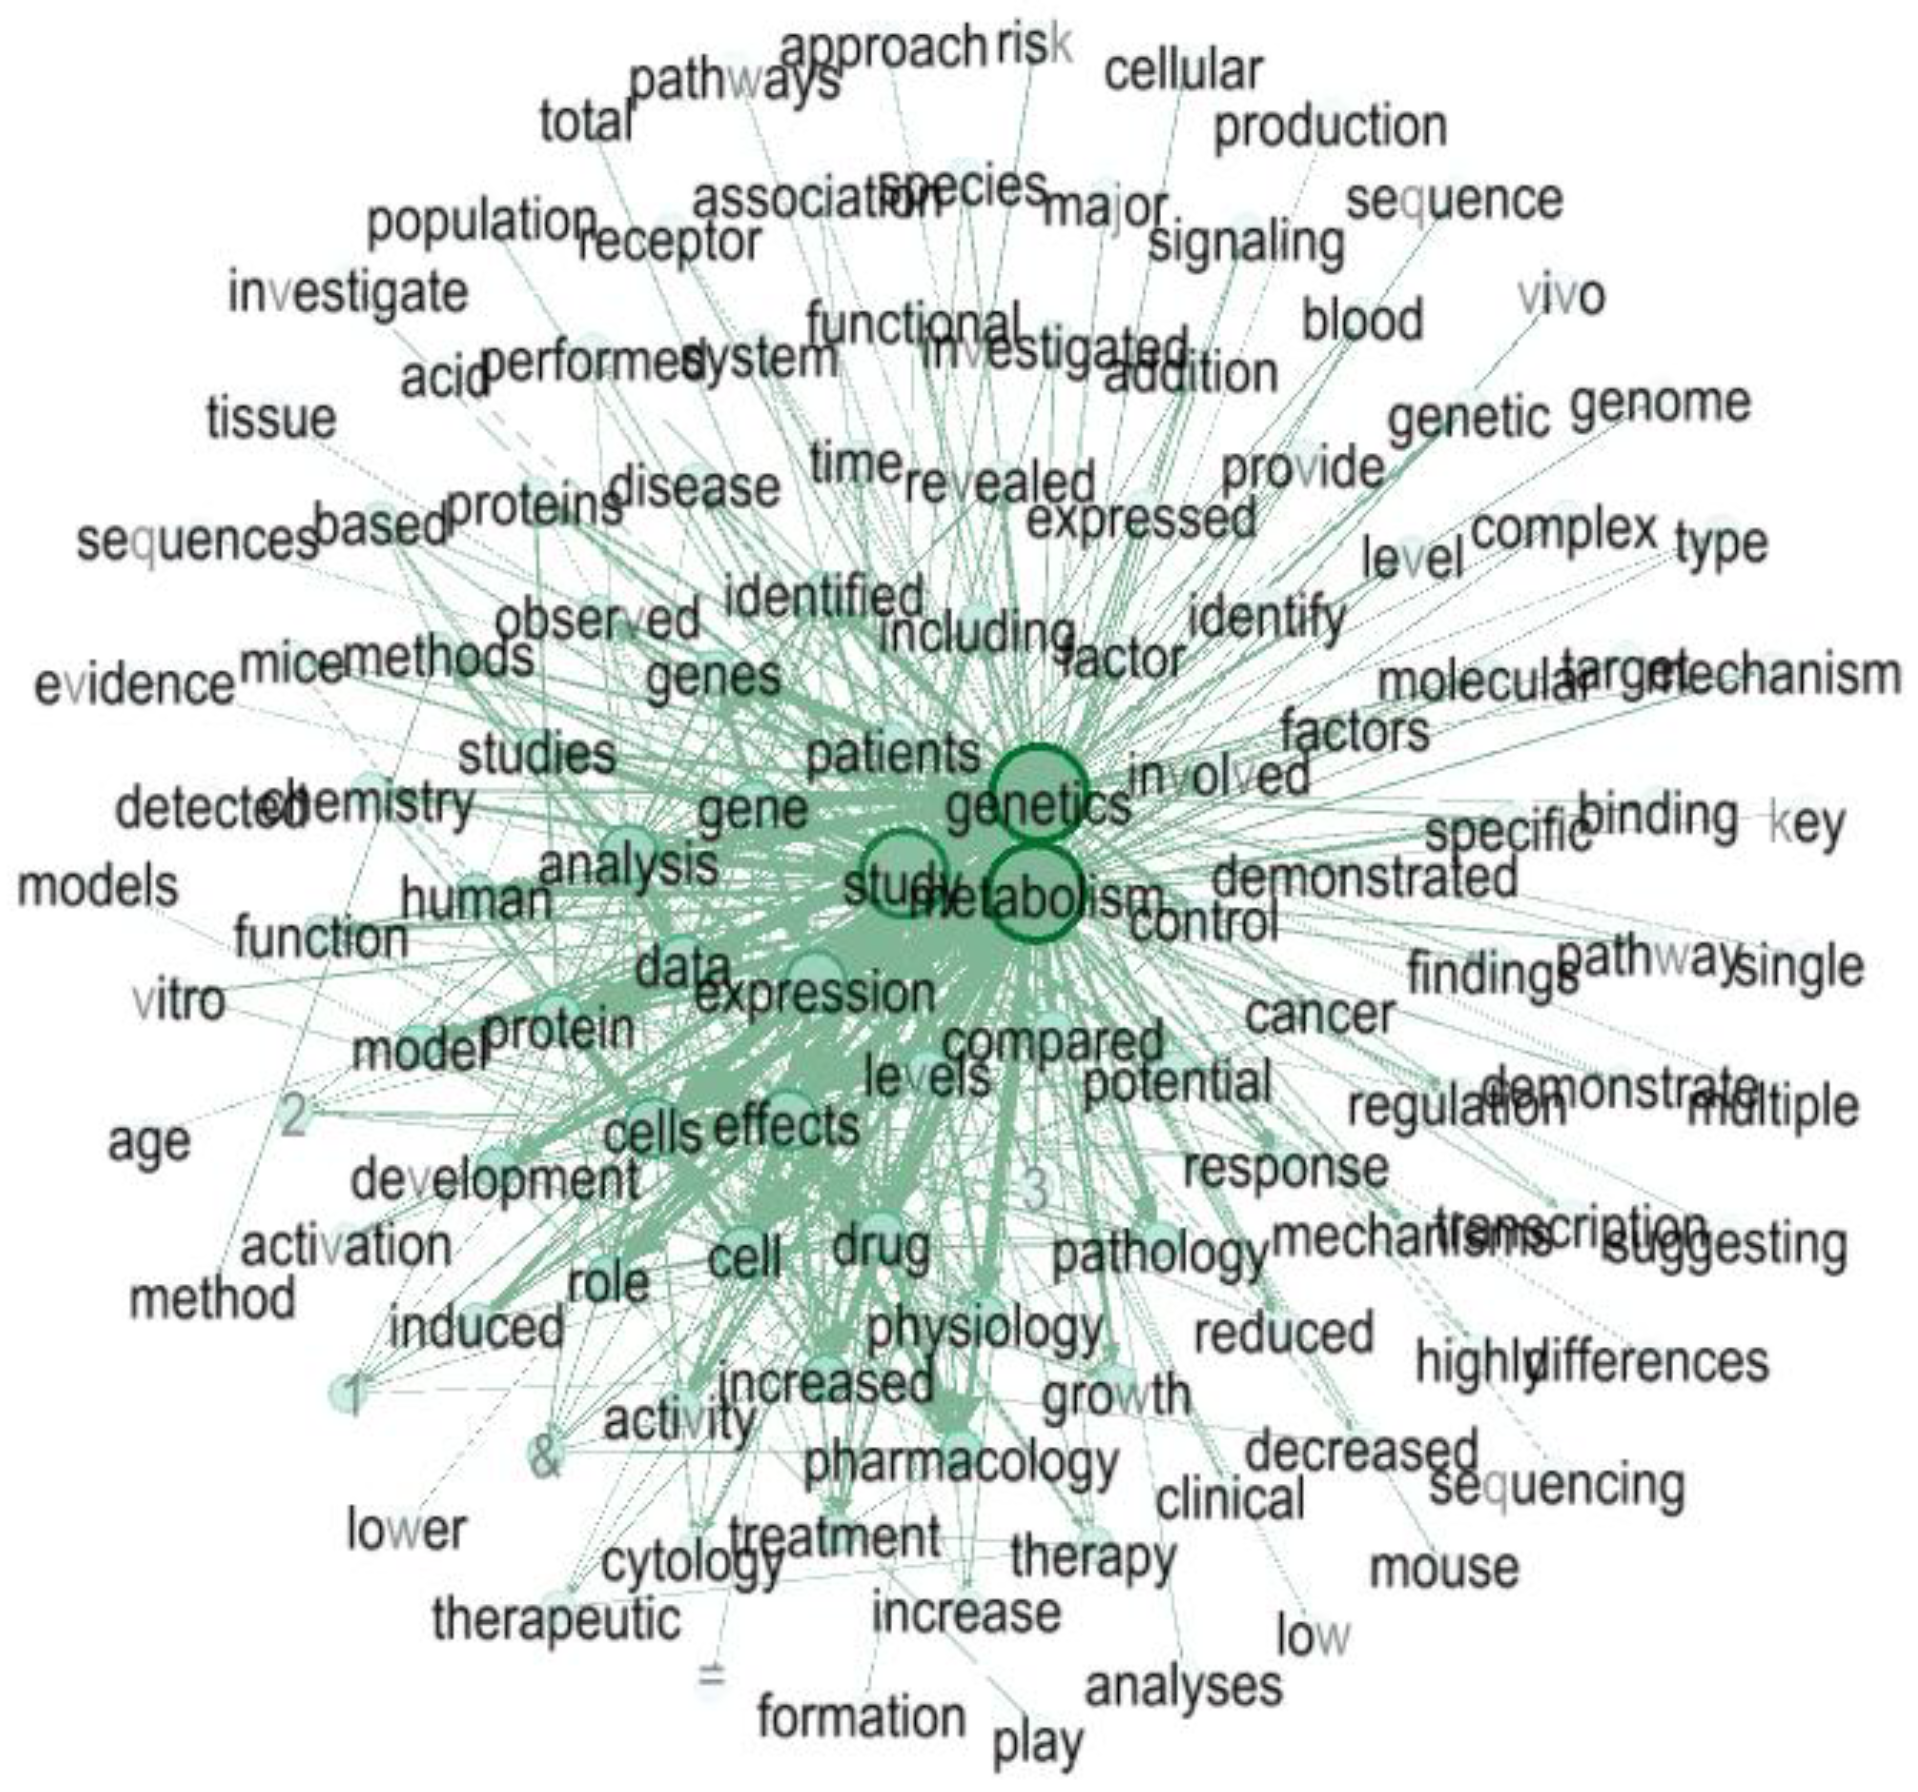
3.1. Co-Occurrence Network of High-Frequency Words in the Bioinformatics Literature

According to the co-occurrence matrix and the arrangement of mutual information in a descending order, the threshold of the co-occurrence of high-frequency words was the value of E, and the top E co-occurrence of high-frequency words was considered as the number of edges. The high-frequency words related to these E edges were nodes, and the network formed by these high-frequency words and edges was the co-occurrence network of high-frequency words. In this study, without loss of generality, K and E were chosen to be 500 and 200, respectively. The reasons were as follows: (1) If the value of K was increased and the value of E (e.g., K = 1000, E = 200) was fixed, the co-occurrence network remained unchanged; (2) If the value of E was increased and the value of K (e.g., K = 500, E = 500) was fixed, the newly added nodes had little influence on the structural characteristics of the network; (3) If the values of both K and E (e.g., K = 1000, E = 500) were increased, the nodes and their edges were too many to clearly display in the network (shown in Figure A5). Therefore, the 500 high-frequency words with the most frequent occurrences were chosen. The maximum 200 mutual information among these 500 high-frequency words were 200 edges, and the high-frequency words related to these 200 edges were nodes. Finally, the co-occurrence network of high-frequency words was obtained, as shown in Figure 2.
In Figure 2, the size of the node indicates the value of the node degree, which means the number of neighbor nodes connected to this node directly; only 50 nodes were from the top 200 edges among the top 500 high-frequency words.
The topological structure of the co-occurrence network of the high-frequency words in bioinformatics articles is shown in Figure 2. In this network, a node represents a high-frequency word in all bioinformatics articles. An edge represents the co-occurrence relationship between two high-frequency words appearing in the subject of the same article simultaneously. The node degree is one of the key indicators to measure the node’s importance in the network. Nodes with a large degree are often considered as high-connectivity nodes or hub nodes.
Generally, N is assumed to be the number of nodes in the co-occurrence network of high-frequency words, and the co-occurrence relationship of the high-frequency words as a binary adjacency matrix A(N,N). If a co-occurrence relationship exists between two high-frequency words i and j, the value of element aij is 1, otherwise its value is 0. A(N,N) is a symmetric matrix and can be used to calculate the structural characteristics of the network, such as the shortest path, network density, degree distribution, clustering coefficient, community structure, rich club, matching form, and so forth.

3.2. Small-World Network Characteristics

Many real-world networks exhibit the structural characteristics of small-world network. Compared with the same-scale random network, it has a similar average path length and higher clustering coefficient [29]. According to the aforementioned, the number N of nodes in the co-occurrence network of high-frequency words in bioinformatics literature in Figure 2 was 50. The average path length of the network was 1.9 and the clustering coefficient was 0.363. Compared with the corresponding random networks, the co-occurrence network of the high-frequency words of the bioinformatics literature had the same level of average path length and higher level of clustering coefficient, implying a clear small-world phenomenon. The results showed that any two high-frequency words of bioinformatics literature were connected at most by another high-frequency word. More than half of high-frequency words had a direct co-occurrence relationship with each other, indicating a clear co-occurrence relationship among high-frequency words of the bioinformatics literature.
According to the small-world characteristics of the co-occurrence network of high-frequency words in the bioinformatics literature, any two high-frequency words have a direct or indirect co-occurrence relationship. The information in Figure 2 can provide readers or researchers with certain searching suggestions. For example, if a researcher wants to query the literature related to “genetics”, the platform should also automatically recommend the literature related to the high-frequency words “protein” and “metabolism” which have a direct co-occurrence relationship with “genetics”.

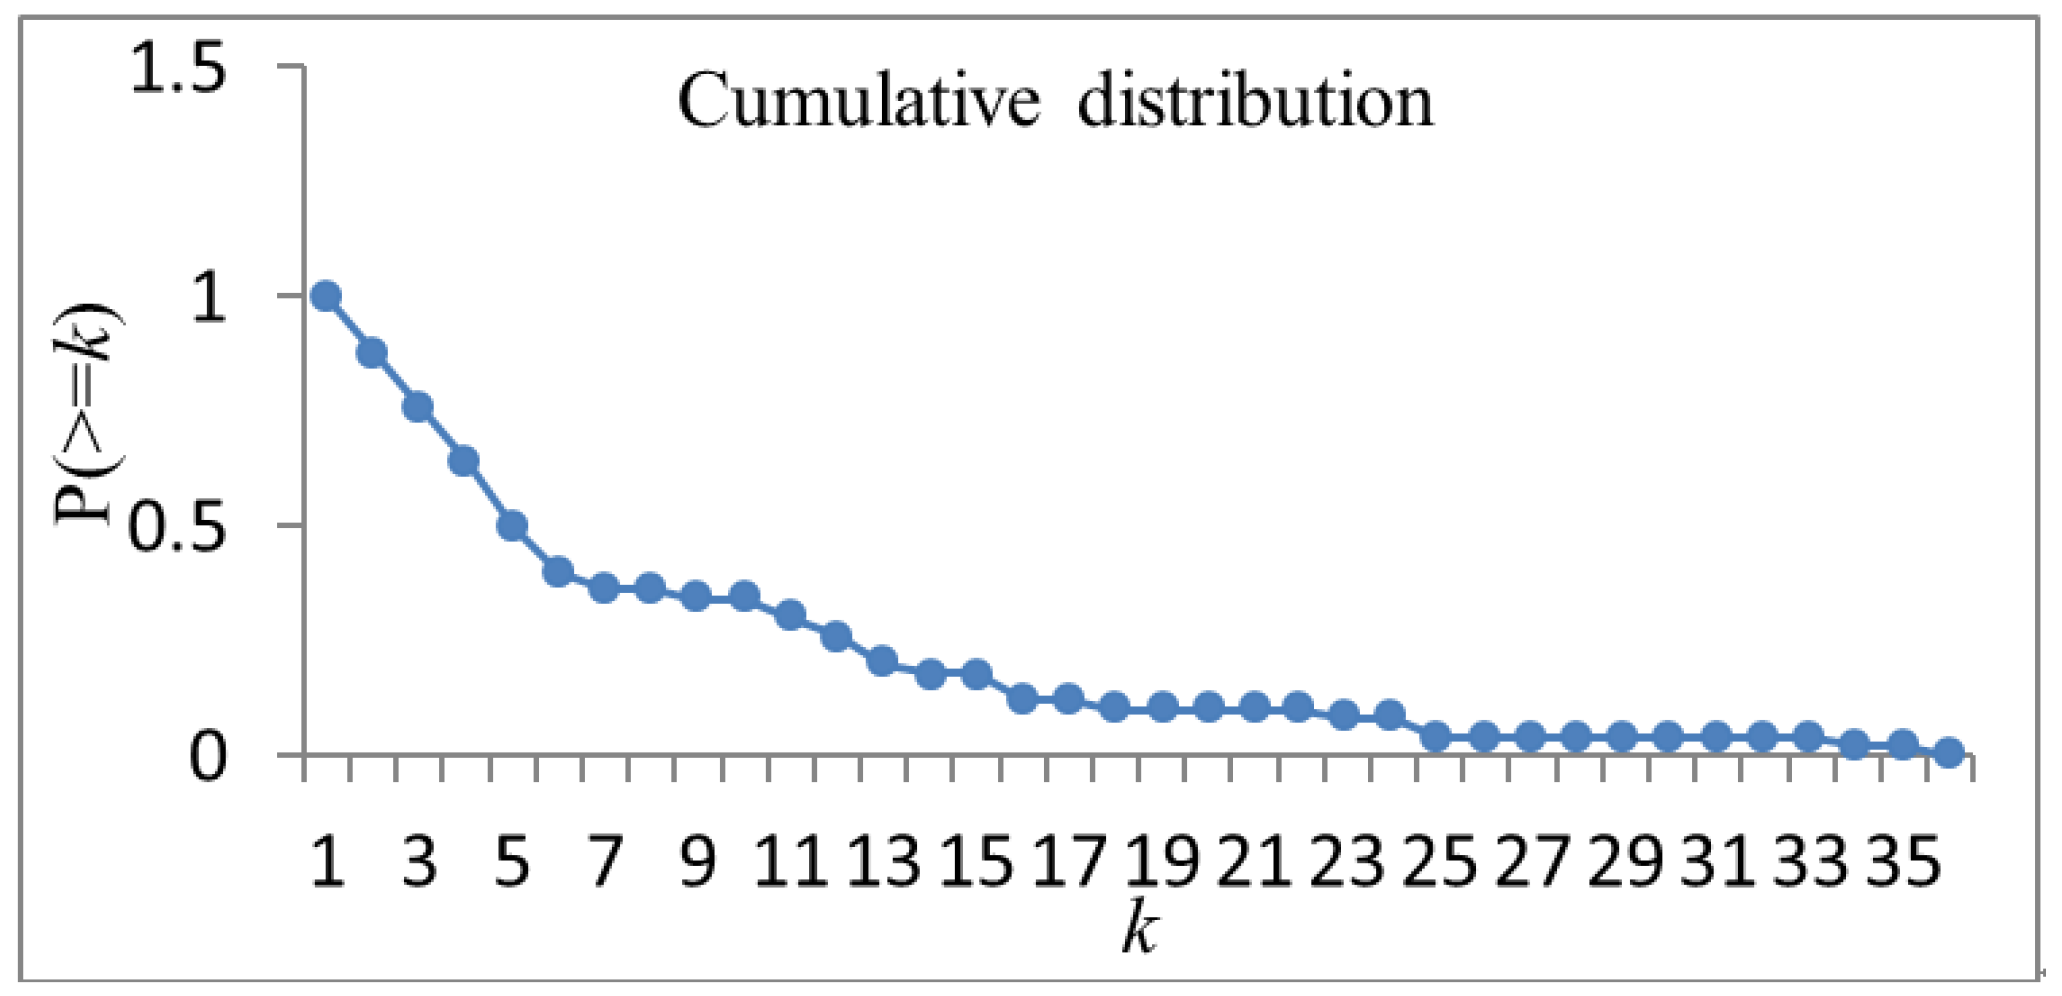
3.3. Degree Distribution Characteristics

The degree distribution is one of the most important indicators for describing the characteristics of the complex network structure. In the existing literature, P(k) (the distribution function of node degree) or P(≥k) (that of the cumulative degree) was used to describe the degree distribution characteristics of nodes. The former P(k) is the ratio of the number of nodes with degree k in the complex network to the number of total nodes. The latter P(≥k) is the ratio of the number of nodes with degrees greater than or equal to k in the complex network to the number of total nodes. Empirical studies show that a large number of real-world complex networks are characterized by three types of degree distribution of nodes: scale-free properties, wide-scale properties, and single-scale properties. The cumulative distribution was used in this study to describe the degree distribution characteristics of the co-occurrence network of high-frequency words in the bioinformatics literature. The cumulative distribution of network in Figure 2 is shown in Figure 3.
Figure 3 shows that the cumulative degree distribution curve seems to decline faster at the first stage and slower at the second stage with the increasing of the degree k, indicating that the node degree of the network was scale-free. The scale-free characteristics showed that the connectivity of a small number of nodes in the network were quite large (with a large number of connections), which had a leading role in the operation of the network while most of the nodes had small connections (only a small number of connections).

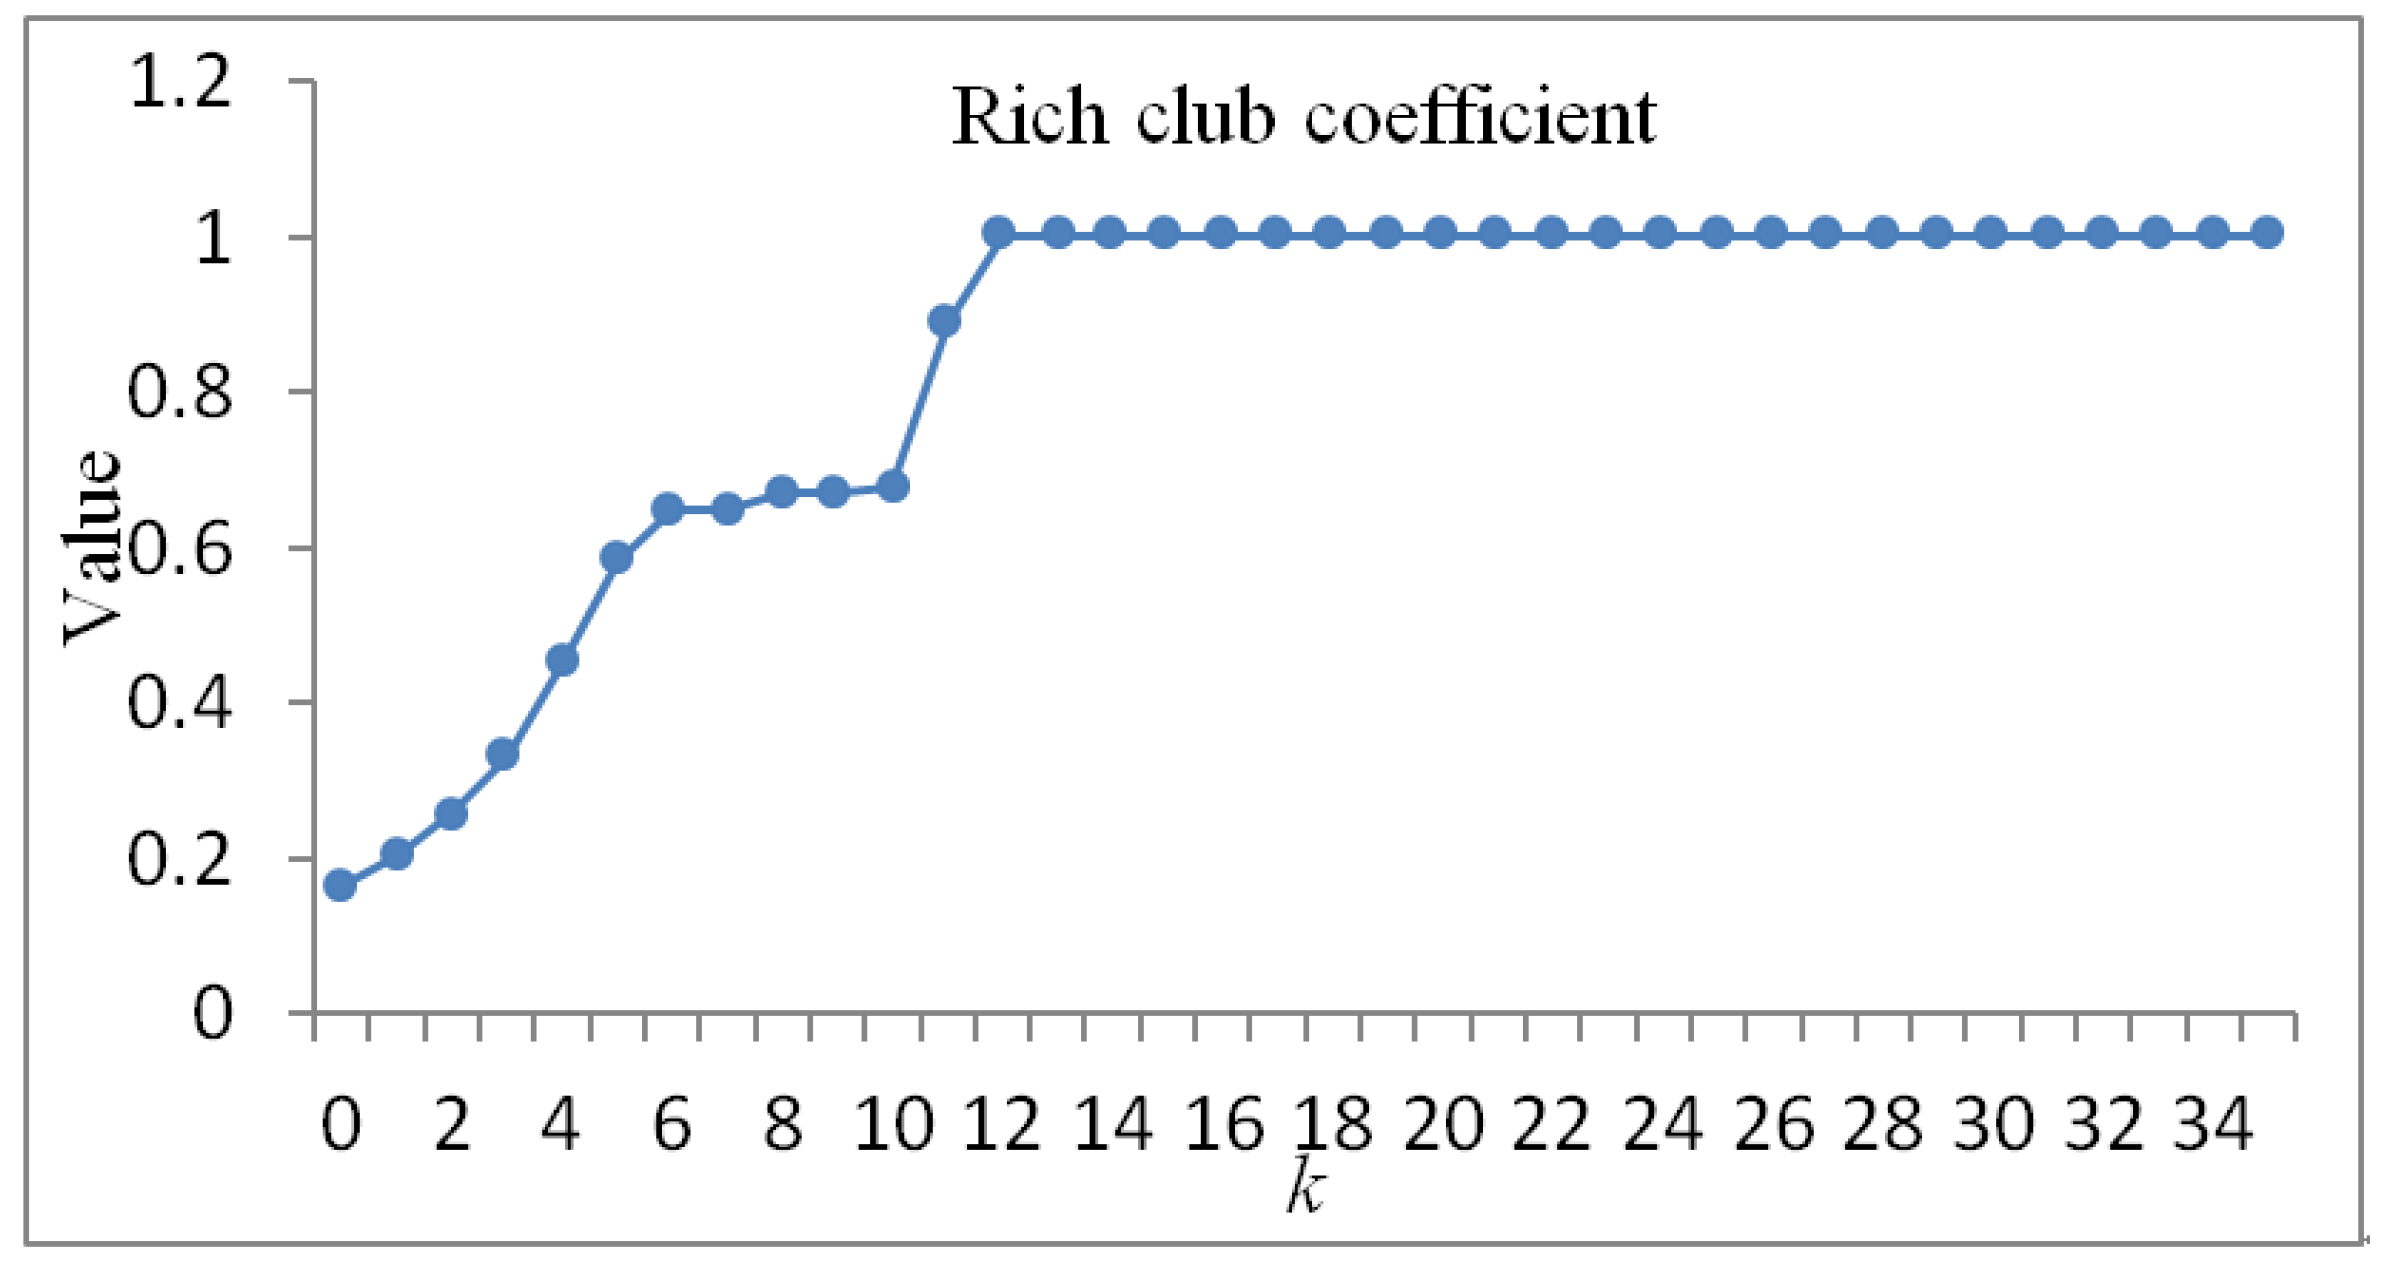
3.4. Rich-Club Phenomenon Characteristics

The rich-club phenomenon refers to the close connection between the more connected nodes (hub nodes) in the network and the formation of a core team in the network, which can be measured using the rich-club coefficient φ ( k ) [30]. E>k denotes the number of connections among nodes whose degrees are larger than k in the network.
The rich-club coefficient of the co-occurrence network of high-frequency words in bioinformatics literature is shown in Figure 4. The coefficient increased with the increase in the node degree k, implying that the connection degree among hub nodes was larger than that among other nodes, and formed a rich club. At the same time, it showed that the nodes with degree greater than 10 formed a fully connected graph. The rich-club phenomenon of the network showed that the words in the club ere the core of the network, which controlled the composition of the high-frequency word nodes in the whole network.

3.5. Matching form Characteristics

The matching form described the relationship between the node degree and the neighbour node degree of the network [31,32,33]. Figure 5 shows the relationship between the node degree and the neighbour node degree of the co-occurrence network of high-frequency words in the bioinformatics literature. The network was a mixed network. The result showed that the node with high connectivity was easy to connect with the node with low connectivity in the co-occurrence network of high-frequency words in the bioinformatics literature. Meanwhile, this showed that new words tended to connect words with high connectivity in the process of network generation and evolution.

3.6. Evolution of the Co-Occurrence Network of High-Frequency Words in the Bioinformatics Literature

The use of high-frequency words in the existing 242,891 articles divided by year, including 41,457 articles in 2013, 42,049 articles in 2014, 43,114 articles in 2015, 45,257 articles in 2016, 60,404 articles in 2017, and 10,610 articles in 2018, was analysed to trace the changing trend of high-frequency words in the bioinformatics literature. Setting K = 500, and E = 200, the co-occurrence network of high-frequency words in the bioinformatics literature from 2013 to 2018 was obtained, as shown in Figure 6.
Figure 6 showed that the changes in two consecutive years were relatively small. For example, a little change was observed in terms of high-frequency words in the bioinformatics literature during 2013 and 2014, and hub nodes in both years were “metabolism”, “study”, “genetic”, and so forth. However, from 2015 to 2016, the word “analysis” became increasingly important. The analysis of the reasons indicated that the application of big data to solve practical problems has become more common, which was well reflected in the bioinformatics research and literature. From 2013 to 2015, three most important nodes were identified. However, there was only one most important node during 2016–2018, implying that, recently, more attention was paid to academic research and analysis in the bioinformatics literature instead of focusing on metabolism and genetics.

4. Conclusions

Based on the complex network theory, the association of high-frequency words in the bioinformatics literature was abstracted into a network, indicating that the high-frequency words of subjects in bioinformatics literature were taken as nodes, and the co-occurrence relationships of high-frequency words were selected as edges. The co-occurrence network of high-frequency words in the bioinformatics literature was constructed. Additionally, the structural characteristics and evolution laws of the bioinformatics literature were analysed. The main conclusions were summarized as follows:
  • The co-occurrence network of high-frequency words in bioinformatics literature is a small world network. The co-occurrence relationship between any two high-frequency words needed to be transferred at most once, and more than half of the high-frequency words in the bioinformatics literature had direct co-occurrence relationships.
  • The degree distribution of the co-occurrence network of high-frequency words in the bioinformatics literature was scale-free, and the connectivity of a small number of nodes in the network was large, which had a leading role in the network. On the contrary, the connectivity of most nodes was small, indicating that the factors explored by the authors of the bioinformatics literature were more concentrated.
  • The co-occurrence network of high-frequency words in the bioinformatics literature had the rich-club phenomenon. The high-frequency words in the club were the core words in the bioinformatics literature and they expressed the author’s attention to the bioinformatics literature.
  • The co-occurrence network of high-frequency words in the bioinformatics literature had the characteristics of disassortative network. High-connectivity nodes were easily connected to nodes with low connectivity.
  • The analysis on the evolution of the co-occurrence network of high-frequency words in the bioinformatics literature revealed that the high-frequency words in the bioinformatics literature changed little in 2–3 years. However, the state-of-the-art technology was introduced gradually with time. Consequently, the authors’ wording also changed, such as passion for big data and data analysis.

Author Contributions

Conceptualization: T.L. and J.B.; methodology: T.L.; validation: J.B., X.Y. and Q.L.; formal analysis: T.L.; investigation: Q.L.; resources: J.B.; data curation: T.L.; writing—original draft preparation: T.L.; writing—review and editing: T.L.; visualization: X.Y.; supervision: Y.C.; project administration: T.L.; funding acquisition: T.L.

Funding

This research was funded by the National Natural Science Foundation of China, grant number 71271034, the National Social Science Foundation of China, grant number 15CGL031, the Fundamental Research Funds for the Central Universities, grant numbers 3132016306 and 3132018160, the Program for Dalian High Level Talent Innovation Support, grant number 2015R063, the National Natural Science Foundation of Liaoning Province, grant number 20180550307, and the National Scholarship Fund of China for Studying Abroad.

Acknowledgments

We are deeply grateful to the anonymous referees and to the editors for their suggestion and help in significantly improving the article.

Conflicts of Interest

The authors declare no conflict of interest.

Appendix A

Figure A1. Pseudocode of segmenting words.
Applsci 08 01994 g0a1
Figure A2. Pseudocode of counting word frequency.
Applsci 08 01994 g0a2
Figure A3. Pseudocode of obtaining high-frequency words.
Applsci 08 01994 g0a3
Figure A4. Pseudocode of obtaining high-frequency words.
Applsci 08 01994 g0a4
Figure A5. Co-occurrence network of high-frequency words within the bioinformatics literature (K = 1000, E = 500).
Applsci 08 01994 g0a5

References

  1. Zhang, X.C.; Huang, D.S.; Li, F. Cancer nursing research output and topics in the first decade of the 21st century: Results of a bibliometric and co-word cluster analysis. Asian Pac. J. Cancer Prev. 2011, 12, 2055–2058. [Google Scholar] [PubMed]
  2. Kendrick, L.; Musial, K.; Gabrys, B. Change point detection in social networks—Critical review with experiments. Comput Sci. Rev. 2018, 29, 1–13. [Google Scholar] [CrossRef]
  3. Bahri, L.; Carminati, B.; Ferrari, E. Decentralized privacy preserving services for online social networks. Online Soc. Netw. Media 2018, 6, 18–25. [Google Scholar] [CrossRef]
  4. Bidarta, C.; Degenne, A.; Grossetti, M. Personal networks typologies: A structural approach. Soc. Netw. 2018, 54, 1–11. [Google Scholar] [CrossRef]
  5. Houston, J.F.; Lee, J.; Suntheim, F. Social networks in the global banking sector. J. Account. Econ. 2018, 65, 237–269. [Google Scholar] [CrossRef]
  6. Kim, J.; Hastak, M. Social network analysis: Characteristics of online social networks after a disaster. Int. J. Inf. Manag. 2018, 38, 86–96. [Google Scholar] [CrossRef]
  7. Growieca, K.; Growiec, J.; Kaminski, B. Social network structure and the trade-off between social utility and economic performance. Soc. Netw. 2018, 55, 31–46. [Google Scholar] [CrossRef]
  8. Manchin, M.; Orazbayev, S. Social networks and the intention to migrate. World Dev. 2018, 109, 360–374. [Google Scholar] [CrossRef]
  9. Ye, W. The rich-club phenomenon of China’s population flow network during the country’s spring festival. Appl. Geogr. 2018, 96, 77–85. [Google Scholar]
  10. Rutenberg, A.D.; Mitnitski, A.B.; Farrell, S.G.; Rockwood, K. Unifying aging and frailty through complex dynamical networks. Exp. Gerontol. 2018, 107, 126–129. [Google Scholar] [CrossRef] [PubMed]
  11. Shanmukhappa, T.; Iwh, H.; Chi, K.T. Spatial analysis of bus transport networks using network theory. Phys. A 2018, 502, 295–314. [Google Scholar] [CrossRef]
  12. Xu, X.; Chen, A.; Jansuwan, S.; Yang, C.; Ryu, S. Transportation network redundancy: Complementary measures and computational methods. Transp. Res. Part B 2018, 114, 68–85. [Google Scholar] [CrossRef]
  13. Zhang, J.; Wang, S.; Wang, X. Comparison analysis on vulnerability of metro networks based on complex network. Phys. A 2018, 496, 72–78. [Google Scholar] [CrossRef]
  14. Lu, K.; Yu, S.; Yu, M. Bibliometric analysis of tumor immunotherapy studies. Med. Sci. Monit. 2018, 24, 3405–3414. [Google Scholar] [CrossRef] [PubMed]
  15. Zarandi, F.D.; Rafsanjani, M.K. Community detection in complex networks using structural similarity. Phys. A 2018, 503, 882–891. [Google Scholar] [CrossRef]
  16. İlhan, N.; Öğüdücü, Ş.G. Feature identification for predicting community evolution in dynamic social networks. Eng. Eng. Appl. Artif. Intell. 2016, 55, 202–218. [Google Scholar] [CrossRef]
  17. Zhao, J. Research on the characteristics of evolution in knowledge flow networks of strategic alliance under different resource allocation. Expert Syst. Appl. 2018, 98, 242–256. [Google Scholar]
  18. Li, H. The evolution of the network structure in tin-fluoro-phosphate glass with increasing temperature. J. Non-Cryst. Solids 2018, 492, 84–93. [Google Scholar] [CrossRef]
  19. Yang, Y.; Chen, Q.; Liu, W. The structural evolution of an online discussion network. Phys. A 2010, 389, 5871–5877. [Google Scholar] [CrossRef]
  20. Wang, X.S.; Yang-Yang, G.U.; Cheng, Y.H. Construction of delay gene regulatory network based on complex network. Acta Electron. Sin. 2010, 38, 2518–2522. [Google Scholar]
  21. Van Rijsbergen, C.J. A theoretical basis for the use of co-occurrence data in information retrieval. J. Doc. 1977, 33, 106–119. [Google Scholar] [CrossRef]
  22. Mika, P. Ontologies are us: A unified model of social networks and semantics. Web Semant: Sci. Serv. Agents Word Wide Web 2007, 5, 522–536. [Google Scholar] [CrossRef]
  23. Barberán, A.; Bates, S.T.; Casamayor, E.O.; Fierer, N. Using network analysis to explore co-occurrence patterns in soil microbial communities. ISME J. 2012, 6, 343–351. [Google Scholar] [CrossRef] [PubMed] [Green Version]
  24. Kamneva, O.K. Genome composition and phylogeny of microbes predict their co-occurrence in the environment. PLoS Comput. Biol. 2017, 13, e1005366. [Google Scholar] [CrossRef] [PubMed]
  25. Wang, Z.; Cao, R.Z.; Cheng, J.L. Three-level prediction of protein function by combining profile-sequence search, profile-profile search, and domain co-occurrence networks. BMC Bioinf. 2013, 14 (Suppl. 3), S3. [Google Scholar] [CrossRef]
  26. Wang, Z.; Zhang, X.C.; Le, M.H.; Xu, D.; Stacey, G.; Cheng, J.L. A protein domain co-occurrence network approach for predicting protein function and inferring species phylogeny. PLoS ONE 2011, 6, e17906. [Google Scholar] [CrossRef] [PubMed]
  27. Li, L.G.; Xia, Y.; Zhang, T. Co-occurrence of antibiotic and metal resistance genes revealed in complete genome collection. ISME J. 2017, 11, 651–662. [Google Scholar] [CrossRef] [PubMed]
  28. Li, T.Y.; Li, F.; Chen, Y.; Lv, X.N. Fast clustering for sparse network of retail products associated big data. Control Decis. 2018, 33, 1117–1122. [Google Scholar]
  29. Watts, D.J.; Strogatz, S.H. Collective dynamics of ‘small-world’ networks. Nature 1998, 393, 440–442. [Google Scholar] [CrossRef] [PubMed]
  30. Zhou, S.; Mondragón, R.J. The rich-club phenomenon in the internet topology. IEEE Commun. Lett. 2004, 8, 180–182. [Google Scholar] [CrossRef]
  31. Newman, M.E.J. The structure and function of complex networks. SIAM Rev. 2003, 45, 167–256. [Google Scholar] [CrossRef]
  32. Liu, Y.S.; Zeng, X.; He, Z.; Zou, Q. Inferring microRNA-disease associations by random walk on a heterogeneous network with multiple data sources. IEEE/ACM Trans. Comput. Biol. Bioinf. 2016, 14, 905–915. [Google Scholar] [CrossRef] [PubMed]
  33. Li, P.; Guo, M.; Wang, C.; Liu, X.; Zou, Q. An overview of SNP interactions in genome-wide association studies. Briefings Funct. Genomics 2015, 14, 143–155. [Google Scholar] [CrossRef] [PubMed]
Figure 1. Process of constructing the co-occurrence network of high-frequency words.
Applsci 08 01994 g001
Figure 2. Co-occurrence network of high-frequency words within the bioinformatics literature (K = 500, E = 200).
Applsci 08 01994 g002
Figure 3. Cumulative distribution of the co-occurrence network of high-frequency words.
Applsci 08 01994 g003
Figure 4. Rich-club coefficient.
Applsci 08 01994 g004
Figure 5. Average degree of the neighbours.
Applsci 08 01994 g005
Figure 6. Changing trends of the co-occurrence network of high-frequency words in the bioinformatics literature from 2013 to 2018 with K = 500, E = 200. Figure 6 contained six graphs, which were listed by year: (a) 2013, (b) 2014, (c) 2015, (d) 2016, (e) 2017, and (f) 2018.
Applsci 08 01994 g006
Table 1. Periodical list.
NoJournal NameIF (5 Year)RankArea(s)Press
1Algorithms for Molecular Biology1.617JCR4Mathematical and Computational BiologyBiomed Central Ltd.
2Analytical Biochemistry2.160JCR3Biochemistry and Molecular BiologyElsevier Sci Ltd.
3Bioinformatics8.561JCR2Mathematical and Computational BiologyOxford Univ Press
4Biosystems1.460JCR4Mathematical and Computational BiologyElsevier Sci Ltd.
5BMC Bioinformatics3.114JCR3Mathematical and Computational BiologyBiomed Central Ltd.
6BMC Biology7.436JCR1BiologyBiomed Central Ltd.
7BMC Genomics4.257JCR2Biotechnology and Applied MicrobiologyBiomed Central Ltd.
8BMC Systems Biology2.505JCR3Mathematical and Computational BiologyBiomed Central Ltd.
9Briefings in Bioinformatics7.065JCR1Biochemical Research MethodsOxford Univ Press
10Bulletin of Mathematical Biology1.536JCR4BiologySpringer
11Computational Biology and Chemistry1.345JCR4BiologyElsevier Sci Ltd.
12Computers in Biology and Medicine2.168JCR3Engineering, BiomedicalElsevier Science Bv Science Ltd.
13EURASIP Journal on Bioinformatics and Systems Biology Mathematical and Computational BiologySpringer Heidelberg
14Journal of Biomedical Semantics1.883JCR3Mathematical and Computational BiologySpringer Nature
15Gene3.286JCR3Genetics and HeredityElsevier Science Bv
16Genome Biology16.497JCR1Biotechnology and Applied MicrobiologyBiomed Central Ltd.
17IEEE/ACM Transactions on Computational Biology and Bioinformatics2.064JCR3EngineeringIEEE Computer Soc
18IET Systems Biology0.972JCR4Mathematical and Computational BiologyInst Engineering Technology
19In Silico Biology BiochemistryIOS Press
20International Journal of Data Mining and Bioinformatics0.585JCR4Mathematical and Computational BiologyInderscience Enterprises Ltd.
21Chemical Biology and Drug Design2.404JCR3Biochemistry and Molecular BiologyWiley-Blackwell Publishing
22Acta Biotheoretica0.907JCR4Mathematical and Computational BiologySpringer
23International Journal of Functional Informatics and Personalized Medicine Biomedical SciencesInderscience Enterprises Ltd.
24International Journal of Molecular Sciences3.878JCR3Biochemistry and Molecular BiologyMdpi
25Journal of Bioinformatics and Computational Biology0.959JCR4Mathematical and Computational BiologyWorld Scientific Publishing Co Pte Ltd.
26Journal of Biological Systems0.686JCR4Mathematical and Computational BiologyWorld Scientific Publishing Co Pte Ltd.
27Journal of Biomedical Informatics3.120JCR3Medical InformaticsAcademic Press Inc Elsevier Science
28Journal of Biomolecular Structure and Dynamics2.443JCR3Biochemistry and Molecular BiologyAdenine Press
29Journal of Computational Biology3.118JCR4Mathematical and Computational BiologyMary Ann Liebert Inc
30Journal of Computational Neuroscience1.763JCR4Mathematical and Computational BiologySpringer
31Journal of Integrative Bioinformatics Biomedicine And BiotechnologyImbio Association
32Journal of Theoretical Biology1.980JCR3Mathematical and Computational BiologyElsevier Science Ltd.
33Mathematical Biosciences1.617JCR4Mathematical and Computational BiologyElsevier Science Inc
34Mathematical Biosciences and Engineering1.260JCR4Mathematical and Computational BiologyAmer Inst Mathematical Sciences
35Methods3.936JCR2Biochemistry and Molecular BiologyAcademic Press Inc Elsevier Science
36Molecular Biosystems2.838JCR3Biochemistry and Molecular BiologyRoyal Soc Chemistry
37Nature Communications13.691JCR1Multidisciplinary SciencesNature Publishing Group
38Nucleic Acids Research10.235JCR1Biochemistry and Molecular BiologyOxford Univ Press
39Online Journal of Bioinformatics Computational BiologyOnline Journal Of Bioinformatics
40PeerJ2.469JCR3Multidisciplinary SciencesPeerj, Inc.
41PLoS Computational Biology4.834JCR2Mathematical and Computational BiologyPublic Library Science
42Plos One 3.352JCR3Multidisciplinary SciencesPublic Library Science
43Protein and peptide letters1.052JCR4Biochemistry and Molecular BiologyBentham Science Publ Ltd.
44Scientific Reports4.609JCR3Multidisciplinary SciencesSpringer Nature
45Source Code for Biology and Medicine BioinformaticsSpringer Nature
46StaProteins: Structure, Function and Bioinformatics2.328JCR3Biochemistry and Molecular BiologyWiley-Liss
47Statistical Applications in Genetics and Molecular Biology1.104JCR4Mathematical and Computational BiologyDe Gruyter

