Article

Mono- and Bi-Molecular Adsorption of SF6 Decomposition Products on Pt Doped Graphene: A First-Principles Investigation

1
School of Electrical Engineering, Guangxi University, Nanning 530004, China
2
School of Electrical Engineering, Wuhan University, Wuhan 400044, China
3
State Key Laboratory of Power Transmission Equipment & System Security and New Technology, Chongqing University, Chongqing 400044, China
*
Author to whom correspondence should be addressed.
Submission received: 25 September 2018 / Revised: 17 October 2018 / Accepted: 19 October 2018 / Published: 22 October 2018
(This article belongs to the Section Nanotechnology and Applied Nanosciences)

Abstract

:
Based on the first-principles of density functional theory, the SF6 decomposition products including single molecule (SO2F2, SOF2, SO2), double homogenous molecules (2SO2F2, 2SOF2, 2SO2) and double hetero molecules (SO2 and SOF2, SO2 and SO2F2, SOF2 and SO2F2) adsorbed on Pt doped graphene were discussed. The adsorption parameters, electron transfer, electronic properties and energy gap was investigated. The adsorption of SO2, SOF2 and SO2F2 on the surface of Pt-doped graphene was a strong chemisorption process. The intensity of chemical interactions between the molecule and the Pt-graphene for the above three molecules was SO2F2 > SOF2 > SO2. The change of energy gap was also studied and according to the value of energy gap, the conductivity of Pt-graphene before and after adsorbing different gas molecules can be evaluated.

1. Introduction

SF6 gas has been widely used in gas insulated switch-gear (GIS) because of its excellent insulation and arc extinguishing performance but long-term operation experience shows that different degrees of partial discharge (PD) will occur in GIS equipment due to inherent defects or some new insulation problems [1,2,3,4]. With the increase of running time, these defects develop further, which may eventually lead to serious insulation problems of GIS equipment, resulting in irreparable losses. The energy produced by the discharge causes SF6 to decompose into SF4, SF3, SF2 and other low-fluorine sulfides when the discharge continues. Some of the low-fluorine sulfides react with trace amounts of water and oxygen in GIS equipment to form SO2F2, SOF2, H2S and SO2 [5,6]. Many scholars have shown that by detecting the content of these characteristic decomposition products, the severity of insulation defects in GIS can be judged to a certain extent, and insulation accidents can be prevented. Therefore, the detection of SF6 decomposition component content has important research significance and application value.
Graphene, a typical two-dimensional carbon nanomaterial composed of sp2 hybrid orbital carbon atoms, was first discovered in 2004. Due to its excellent mechanical, electrical, optical and thermal properties, it has led extensive research in many fields such as electronics, energy, biological and chemical sensors [7,8,9]. In 2007, graphene was first used as a sensing material and showed selectivity for typical small molecule gases [10]. Since then, its excellent sensing performance has attracted a lot of attention. The micro gas sensor made of graphene has the advantages of low operating temperature, high sensitivity and small size. In recent years, some scholars have made great progress in this field, using graphene as a sensitive material to detect H2, NH3, NO2 and other gases. This provides a new idea for the detection of SF6 decomposition products. Gas sensors based on intrinsic graphene have less response to various SF6 decomposition products and poor recovery and selectivity. In order to improve the gas sensitivity of graphene, the preparation of graphene-based composites can significantly improve the gas sensitivity of SF6 decomposition products, including sensitivity, response speed and recovery characteristics [11].
Nowadays, theoretical evaluation of 2D materials based on ab initial study has been widely developed. The gas sensing properties evaluated by first-principles method was an effective way to exploit high selectivity new gas sensing materials or new modified method to the surface of materials, especially for 2D graphene like materials [12,13]. To obtain the 2D material with global minimum total energy or to get the adsorption structure with the global minimum total energy rather than the local minimum, several initial structures should be considered and several optimized structures were obtained. By comparing the final total energy or other physical properties, the final structure of materials or adsorption structure can be obtained [14,15]. It has been proved that single-layer graphene without any defects has very week chemical interactions with most of the gas molecules [16]. To enhance the interactions between the adsorbed gas molecule and the surface of graphene, introducing transition metal or noble metal was proved to be an effective way by theoretical evaluation. Doping Fe atom or Pt atom can obviously enhance the chemical interactions between single and double layered graphene with CO, NO, SO2 and HCN [17]. Especially for Pt atom or nanoclusters, they can bring many active sites on the surface of graphene as well as provide many adsorption sites for gas molecules. As a result, the structure, electronic properties and gas adsorption behavior of Pt decorated or doped graphene has been systematically studied using quantum chemistry methods. The decoration of Pt adatom on graphene surface can apparently elevate the adsorption energy and electron transfer with not only inorganic small molecules (such as SO2, O3, NO, H2S), but also organic molecule (such as C2H2, C2H4, CH3OH and C2H5OH) [18,19,20,21,22,23]. Because of the excellent adsorption and gas sensing properties of Pt-graphene, in this work, we discussed the adsorption behavior of several kinds of SF6 decomposition products on the surface of Pt doped graphene, we carried out the ab initial study with the density functional theory calculation including the adsorption energy, adsorption distance, electron transfer and electronic properties. Considering the probable appearance of several kinds of gas molecules on the surface, we further discussed the co-adsorption of two gas molecules with the same type or different type. The study can provide a guiding effect for Pt doped graphene based gas sensor used in field of detecting SF6 decomposition products in electrical engineering.

2. Method

The adsorption of three kinds of SF6 decomposition products (SO2, SOF2 and SO2F2) on the surface of Pt-graphene was all carried out in Dmol3 package [24,25]. The generalized gradient approximation (GGA) with the Perdew-Burke-Ernzerhof function (PBE) was used in considering of the exchange-correlation functional [26]. The basis set chosen for this study was the double numerical plus polarization (DNP) and considering that Pt is a heavy element, the DFT semi-core pseudopotential (DSSP) was selected. To make a good description of long range vdW force, the DFT-D method was chosen force [27]. The cutoff radius for all atom in all structures was set as 5 Å. All the geometric optimizations were set of 1 × 10⁻⁵ Ha energy convergence, 0.002 Ha/Å force convergence, and 0.005 Å displacement convergence between the two iteration steps. The k-point sample of Monkhorst-Pack grid was set as 6 × 6 × 1 when carrying out geometric optimization as well as the calculations of electronic properties [28]. The Gaussian smearing was 0.005 Ha.
A 6 × 6 × 1 graphene supercell including 72 C atoms was first built with height of 15 Å vacuum region. To build the structure of Pt doped graphene, one C atom was substituted by one Pt atom and then the geometric optimization using the convergence criteria above. Finally, the structure of one Pt doped graphene was obtained. For gas adsorption on the surface, one or two gas molecules were placed above the Pt atom and then the final structures were also obtained by fully geometric optimization.
The adsorption energy of one or two gas molecules on the surface of Pt-graphene is:
Δ E a d s = E ( m o l e c u l e P t g r a p h e n e ) E ( P t g r a p h e n e ) E ( m o l e c u l e )  
where Emolecule-Pt-graphene, EPt-graphene and Emolecule are the calculated total energy of gas molecules/Pt-graphene adsorption structure, Pt-graphene surface before adsorption and gas molecules before adsorption. The charge transfer was based on Mulliken method [29]. The electron transfer is calculated as:
Q T = Q 1 Q 0  
where Q1 and Q0 represent the carried charge of adsorbed gas molecules and isolated gas molecules. The carried charge of isolated gas molecule is zero and when QT is negative, gas molecule obtains electrons and when QT is positive, gas molecule acts as electron donor.
The energy gap of the structure reflects the difficulty level of electron transition from the highest occupied molecular orbital (HOMO) to the lowest unoccupied molecular orbital (LUMO). The smaller value indicates the easier process of electron transferring from the valence band to the conduction band resulting in large conductance. The value of energy gap Eg is defined as:
E g = | E H O M O E L U M O |  
We also calculated the density of states of adsorption structures in this study.

3. Results and Discussion

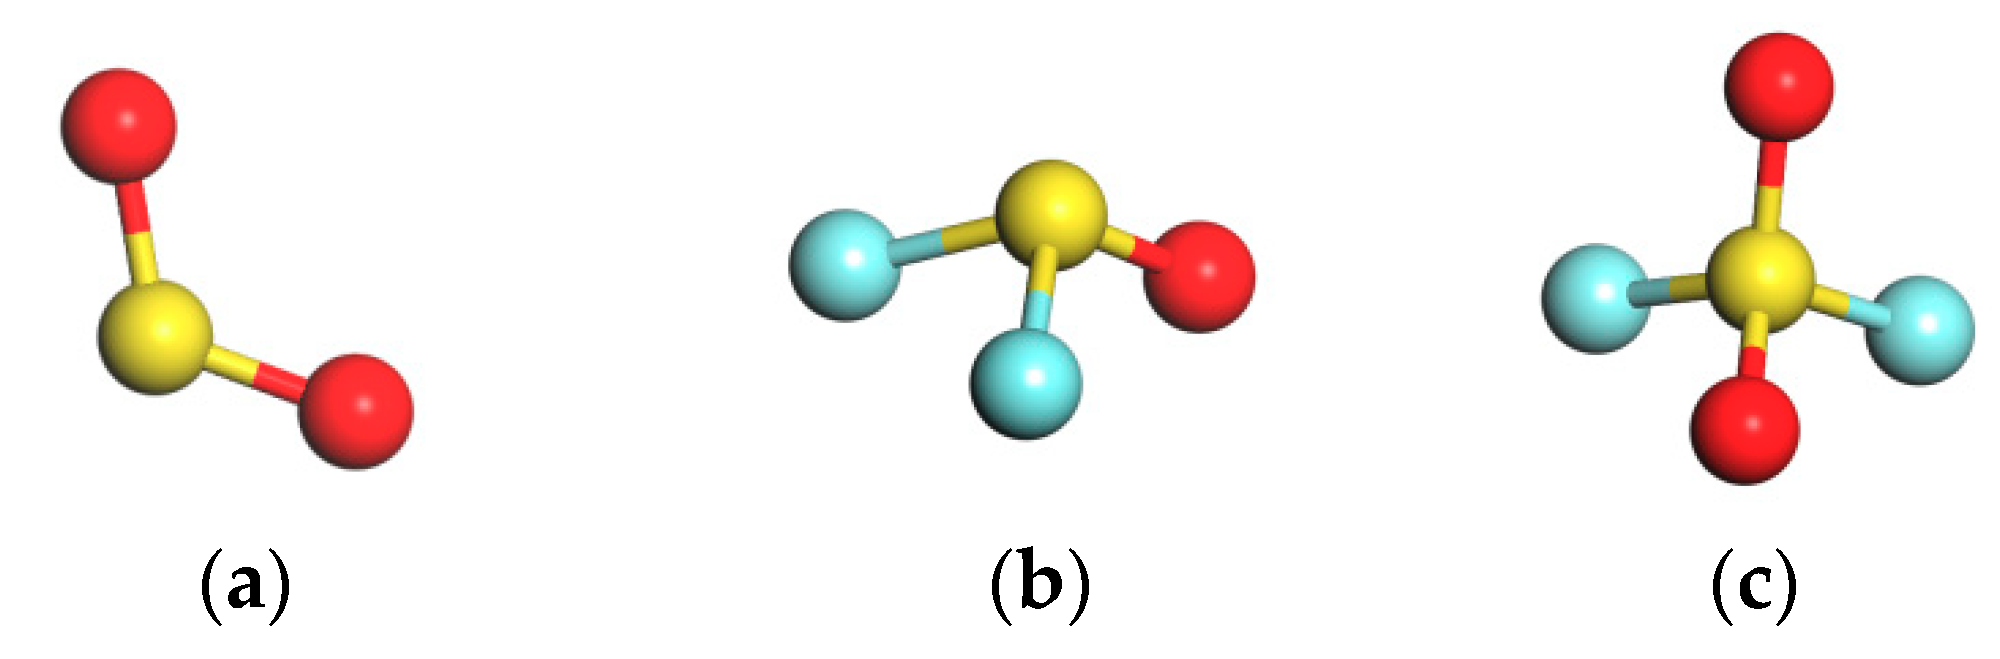
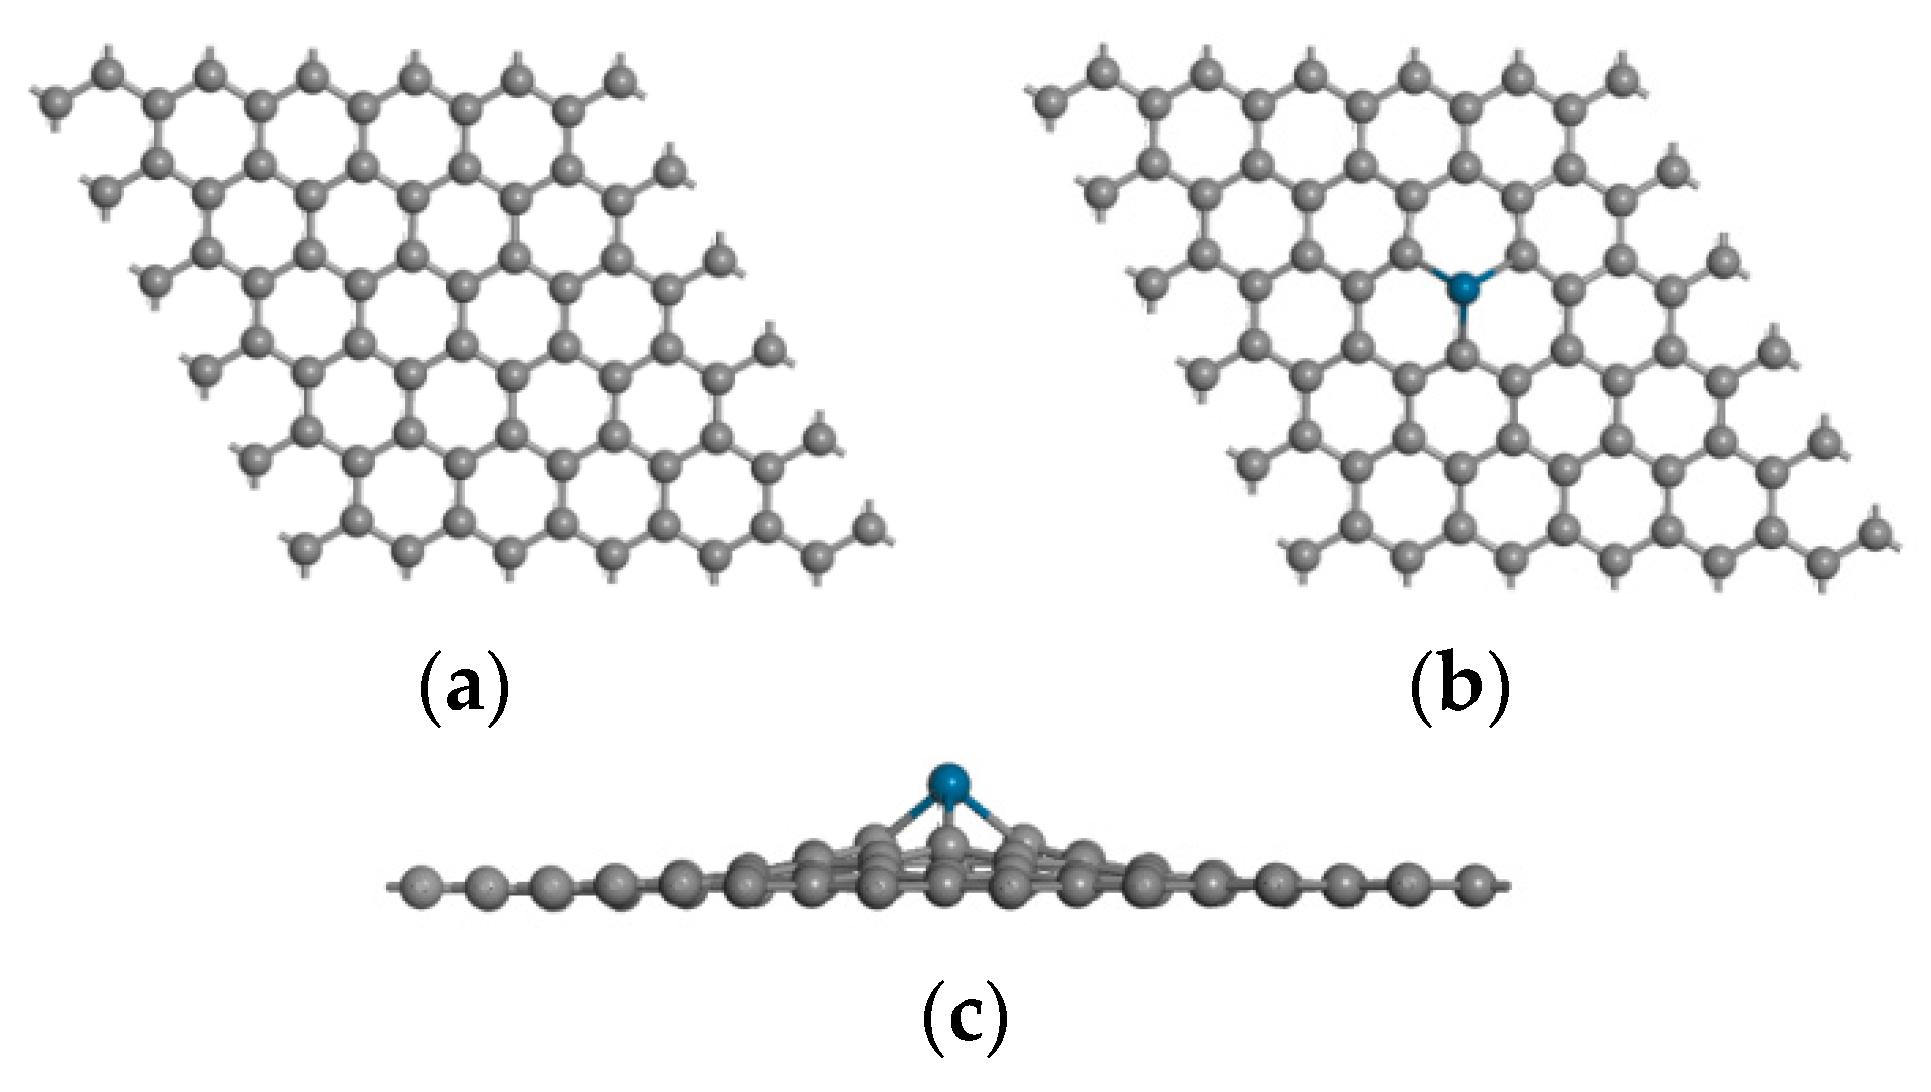
3.1. Structure of SF6 Decomposition Products and Pt-Graphene

At the Materials Visualizer module, three kinds of SF6 decomposition gas molecule models were constructed and after fully geometric structure optimization, three energetically stable structures were obtained. The stable structures of SO2, SOF2 and SO2F2 gas molecules are shown in Figure 1a–c the geometric parameters of these three gas molecules are listed in Table S1. The parameters obtained by this model are in good agreement with those obtained by other researchers [30].
The Pt atom does not change the overall two-dimensional planar structure of graphene, but forms a local sp3 hybridization near the Pt atom and protrudes to the plane of the C atom, as shown in Figure 2. The Pt atom forms covalent bonds with three adjacent C atoms. The length of the covalent bonds of C-Pt atoms is 1.956 Å. Therefore, the formation of local sp3 configuration of Pt atoms can be further determined. Similar doping configurations have been demonstrated in graphene doped with other metal elements (Pd, Mn, Au, etc.) [31,32]. At present, there is basically a consensus that the local sp3 hybridization is the correct configuration for the theoretical study of metal doped graphene. The detailed geometric parameters of Pt-graphene are listed in Table S2.

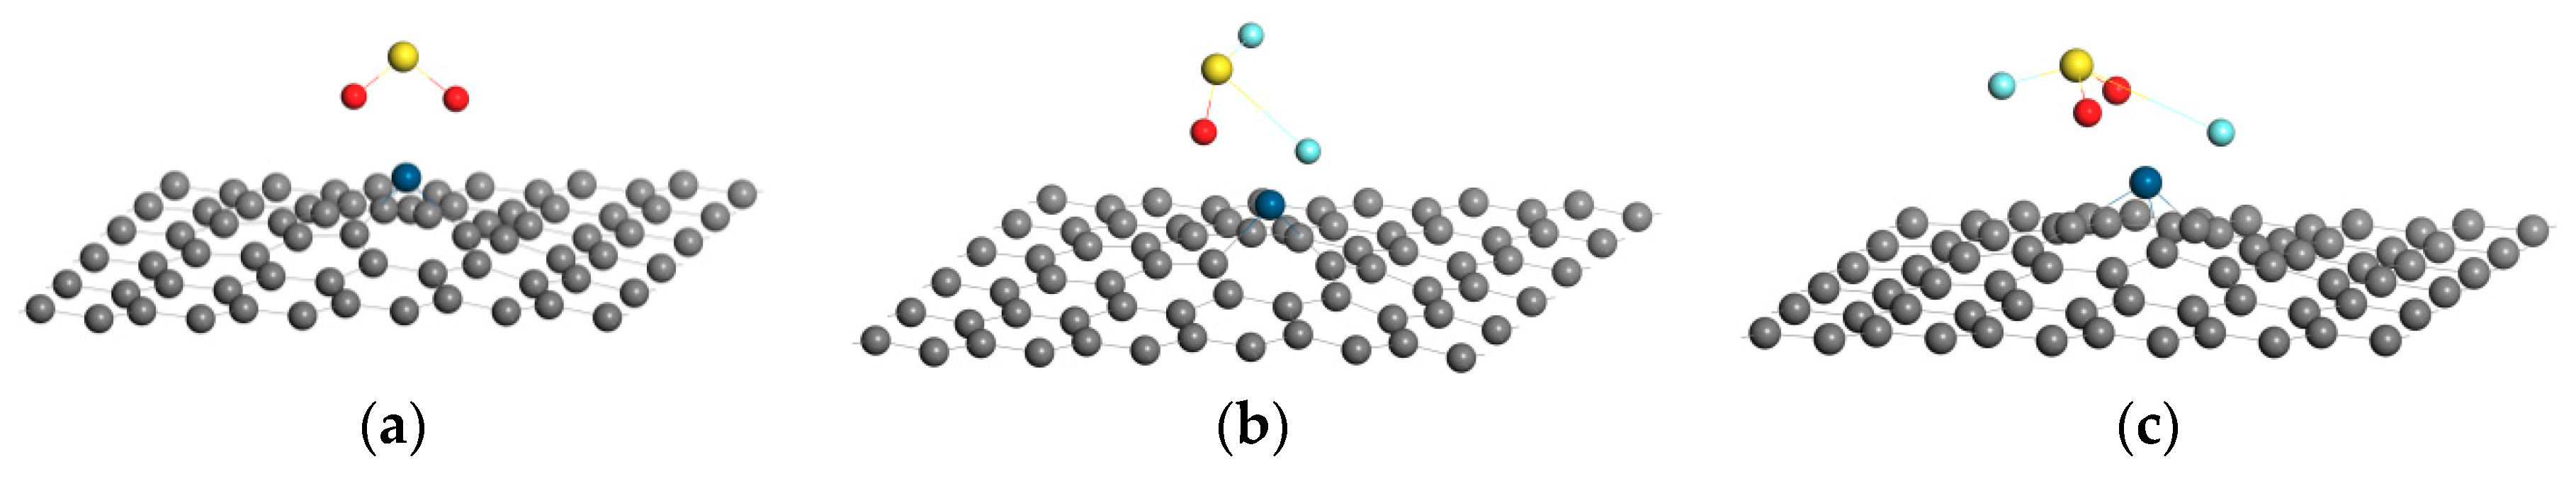
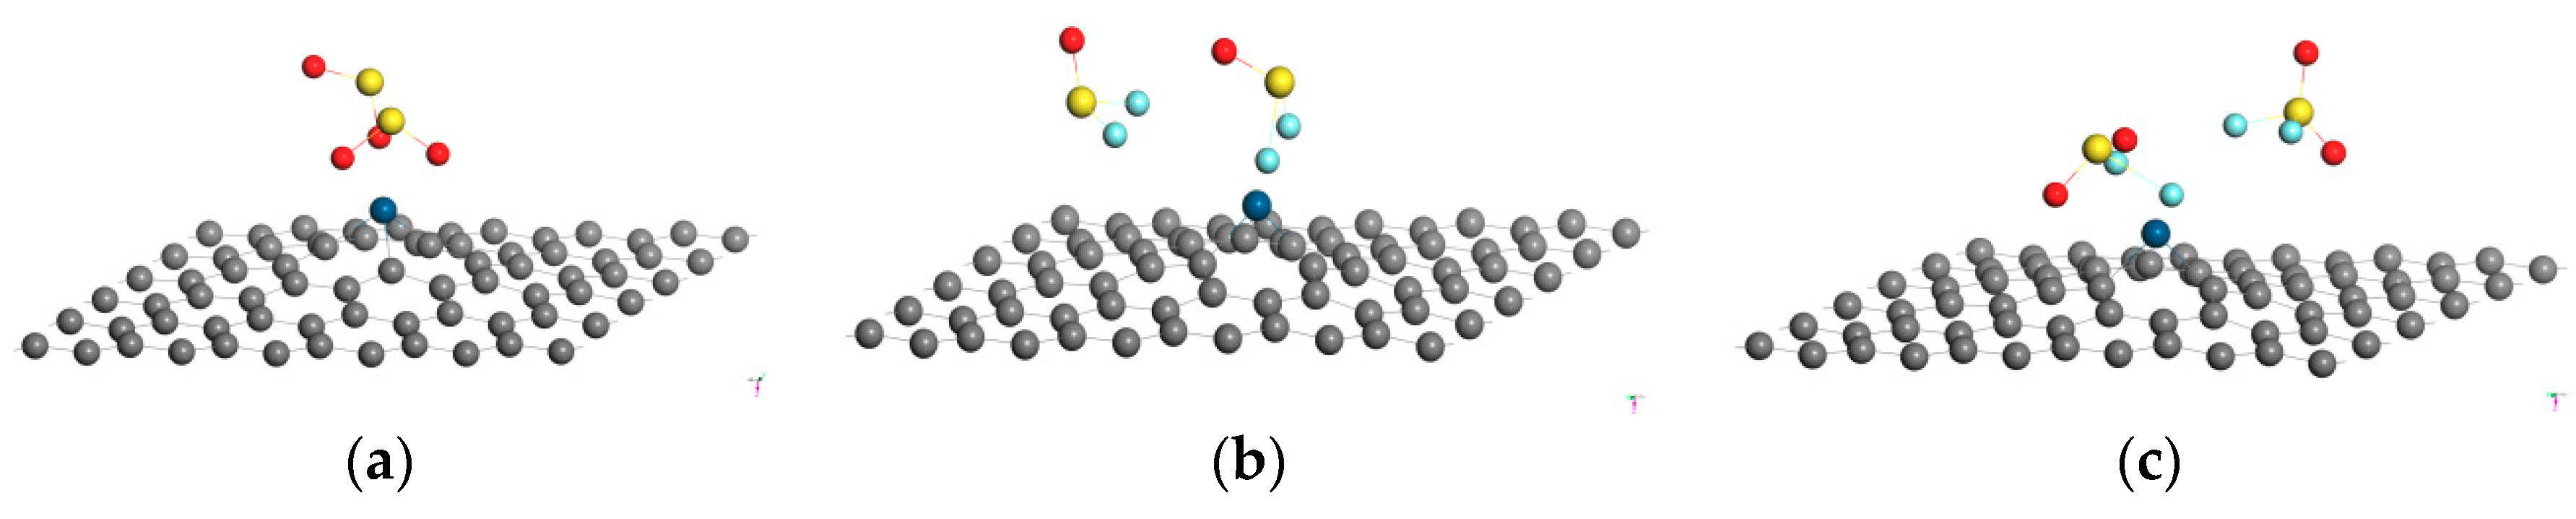
3.2. Adsorption of Single Molecule, Double Molecules on Pt-Graphene

In this section, based on the first-principles density functional theory, the adsorption properties of SO2, SOF2 and SO2F2 on Pt-doped graphene were studied systematically. The adsorption structure, adsorption energy and charge transfer were calculated and analyzed in detail. The modification mechanism of Pt-doped graphene and the gas-sensing response mechanism of SO2, SOF2 and SO2F2 were evaluated. We have obtained several adsorption structures with the local minimum total energy. By comparing the adsorption energy, we only chose the structure with the maximum adsorption energy for further analysis including structure parameters and electronic properties. All the adsorption structures with the local minimum adsorption energy are shown in Figures S1–S3.

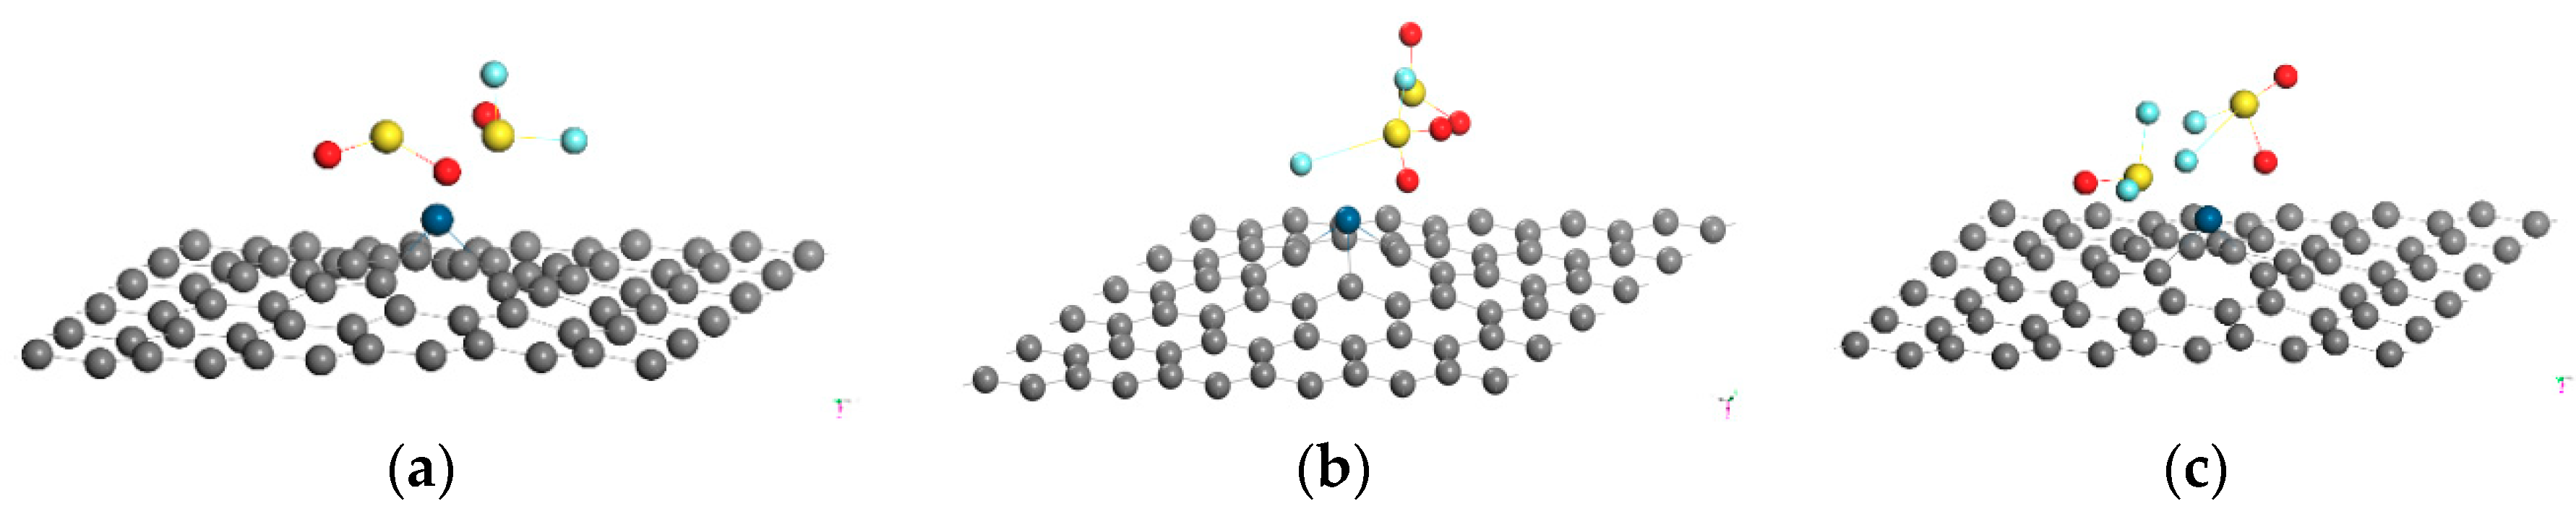
3.2.1. Analysis of Adsorption Structures and Electronic Properties

After optimizing the adsorption structures, the gas molecules were relaxed to various positions on the Pt-graphene surface. The adsorption of single and multiple gas molecules were both studied. In order to obtain the most stable adsorption structure of each gas molecule, we simulated the adsorption structure at different adsorption angles and distances. The most stable structures are shown in Figure 3, Figure 4 and Figure 5. In order to analyze the adsorption properties, as shown in Table 1, the binding energies Eads, charge transfer QT and adsorption distance D for different gas adsorption structures are shown. D represents the closest distance between the gas molecules and the surface of the Pt-graphene, where D1 and D2 represent the distances of the different gas molecules from the Pt nanoparticles, respectively. Similarly, QT1 and QT2 represent charge transfer between two different gas molecules and the surface, respectively. Eads is the adsorption energy, and negative values indicate that the adsorption is exothermic and the reaction can occur spontaneously.
The adsorption parameters and structures of single SO2, SOF2 and SO2F2 molecules adsorbed on graphene are shown in Table 1 and Table S3 and Figure 3a–c. The O atom of SO2 is the closest to the Pt atom. Since the electronegativity of O atom is strong, the adsorption distance is 2.261 Å. The S atom is far from the surface of Pt doped graphene because it establishes a stable covalent bond with O atom and it is difficult to interact with Pt atoms. The structure of SO2 remains almost unchanged during the adsorption process, and the S-O bond length of SO2 itself is gradually extended from 1.480 Å to 1.581 Å, indicating that a new Pt-O bond may be formed during the interaction between SO2 and Pt-doped graphene, resulting in the stretching of S-O bond of SO2 itself. When a SOF2 gas molecule or a SO2F2 molecule is close to Pt-graphene, the length of the S-F1 bond of the adsorbed SOF2 molecule is extended to 2.966 Å, and the length of the S-F2 bond of the SO2F2 molecule is extended to 3.434 Å, indicating that the S-F bond may have been broken. According to Figure 3b,c, the broken F atom tends to form a new bond with the Pt atom. The distance between the two atoms is 2.012 Å and 2.029 Å. At the same time, the S atom tends to form a Pt-S bond with the Pt atom. In order to explore the strength of adsorption, the adsorption energies under various conditions were discussed. It can be seen from Table 1 that the adsorption of SO2F2 gas molecules is the strongest, because the adsorption energy is −2.429 eV. The adsorption of SO2 on the Pt-doped graphene surface is lower than that of the SO2F2. The adsorption of SOF2 and Pt doped graphene is the weakest because the adsorption energy is −1.254 eV. The charge transfer quantities of SO2, SOF2 and SO2F2 molecules with Pt-doped graphene surface as shown in Table 1 are −0.412 e, −0.679 e and −0.981 e. The charge transfer quantities Q in all three cases are negative. It is shown that electrons transfer from Pt doped graphene surface to gas molecule during the adsorption process. The gas molecules SO2F2, SO2 and SOF2 all show the characteristics of electron acceptor.
The adsorption results for double gas molecules are shown in Table 1 and Table S4 and Figure 4a–c. Similar to the adsorption of a single SO2 molecule, the SO bond length in two SO2 gas molecules is extended from 1.480 Å to 1.498 Å (O1-S), 1.561 Å (O2-S), 1.565 Å (O3-S), 1.561. Å (O4-S). Referring to Figure 4, the interaction between the Pt-doped graphene and the double-SO2 gas molecules may respectively form a new Pt-O bond, which leads to the stretching of the S-O bond of SO2. During the adsorption of double SOF2 molecules, the bond length of one SOF2 gas molecule is unchanged, while the S-F bond length of another SOF2 molecule is extended to 3.027 (S-F1), 1.801 (S-F2). This indicates that an S-F bond has broken during the adsorption process. It is also shown that only one SOF2 gas molecule in the double SOF2 gas molecule interacts with the surface of Pt-doped graphene, and the adsorption distances are 2.008 Å and 3.806 Å, respectively. Similarly, according to SO2F2 adsorption, one SO2F2 molecule is deformed into one SO2 and two fluorine atoms are adsorbed on the Pt atom, and the S-F bond length is extended to 2.343 (S-F1), 3.384 (S-F2). The bond length of another SO2F2 gas molecule is unchanged, and the adsorption distance from the Pt atom is 3.422 Å. That is to say, Pt doped graphene adsorbs one of the double SO2F2 molecules on the surface, and the two S-F bonds were broken during the adsorption process. It can be seen from Table 1 that the adsorption energies of two-gas molecules 2SO2, 2SOF2, 2SO2F2 and Pt-doped graphene are −2.223 eV, −0.934 eV and −2.159 eV, respectively. Compared with adsorbing a single gas molecule, the adsorption properties of two gas molecules have not changed, and both belong to chemical adsorption. Since a Pt atomic site can interact with two SO2 gas molecules, the adsorption energy is increased and nearly doubled. Charge transfer QT of 2SO2, 2SOF2, 2SO2F2 with Pt doped graphene surfaces are −0.665 e, −0.662 e and −1.088 e, respectively. Similar to the charge transfer amount of single molecule adsorption, the charge transfer amount QT of all three cases is negative. It indicates that during the adsorption process, electrons are transferred from the Pt-doped graphene surface to the gas molecules, and the gas molecules SO2, SOF2 and SO2F2 shows the characteristics of the electron acceptor.
In Table 1 and Table S5 and Figure 5a–c are the adsorption parameters and adsorption structures of Pt-graphene adsorbed double hetero-gas molecules. When the mixed gas SO2 and SOF2 is adsorbed on Pt-graphene, the S-O bond length in the SO2 gas molecule is extended from 1.480 Å to 1.501 Å (O1-S) and 1.589 Å (O2-S), respectively. Similar to the adsorption of single and double SO2 processes in Figure 3a and Figure 4a, the interaction of Pt-doped graphene with SO2 gas molecules may form a new Pt-O bond that leads to the stretching of the S-O. However, the molecular structure of SOF2 did not change, and the adsorption distance was 2.486 Å. Conversely, for the adsorption of SO2 and SO2F2 mixed gas on Pt-graphene in Figure 5b, the molecular structure of SO2 gas is unchanged, the S atom is close to the Pt metal atom, the adsorption distance is 3.983 Å, and the S-F bond length of SO2F2 was extended to 2.975 Å. Therefore, SO2F2 gas molecules breaks into a F atom and a SO2F piece adsorbed on the Pt-graphene surface. In the case of adsorbing SOF2 and SO2F2 in Figure 5c, a F atom is decomposed and adsorbed on the Pt atom. The SOF2 molecule is far from Pt-graphene and is 4.143 Å away from the surface. The adsorption energies of the three mixed gases, SO2 and SOF2, SO2 and SO2F2 and SOF2 and SO2F2 are −1.431 eV, −2.198 eV and −2.306 eV. The charge transfer amount QT of SO2 and SO2F2 and SOF2 and SO2F2 with Pt-doped graphene surface is −0.039 e, −0.544 e and −0.047 e, −0.994 e for every gas molecule. It is shown that in the adsorption process, electrons are transferred from the surface of Pt-doped graphene to gas molecules, and the gas molecules SO2, SOF2 and SO2F2 all exhibit the characteristics of electron acceptors. The amount of charge transfer after adsorption of SO2 and SOF2 mixed gas is −0.321 e, 0.127 e, indicating that electrons are transferred from the surface of Pt-doped graphene to SOF2 to SO2 gas molecules, and SO2 is an electron acceptor but the SOF2 is an electron donor.

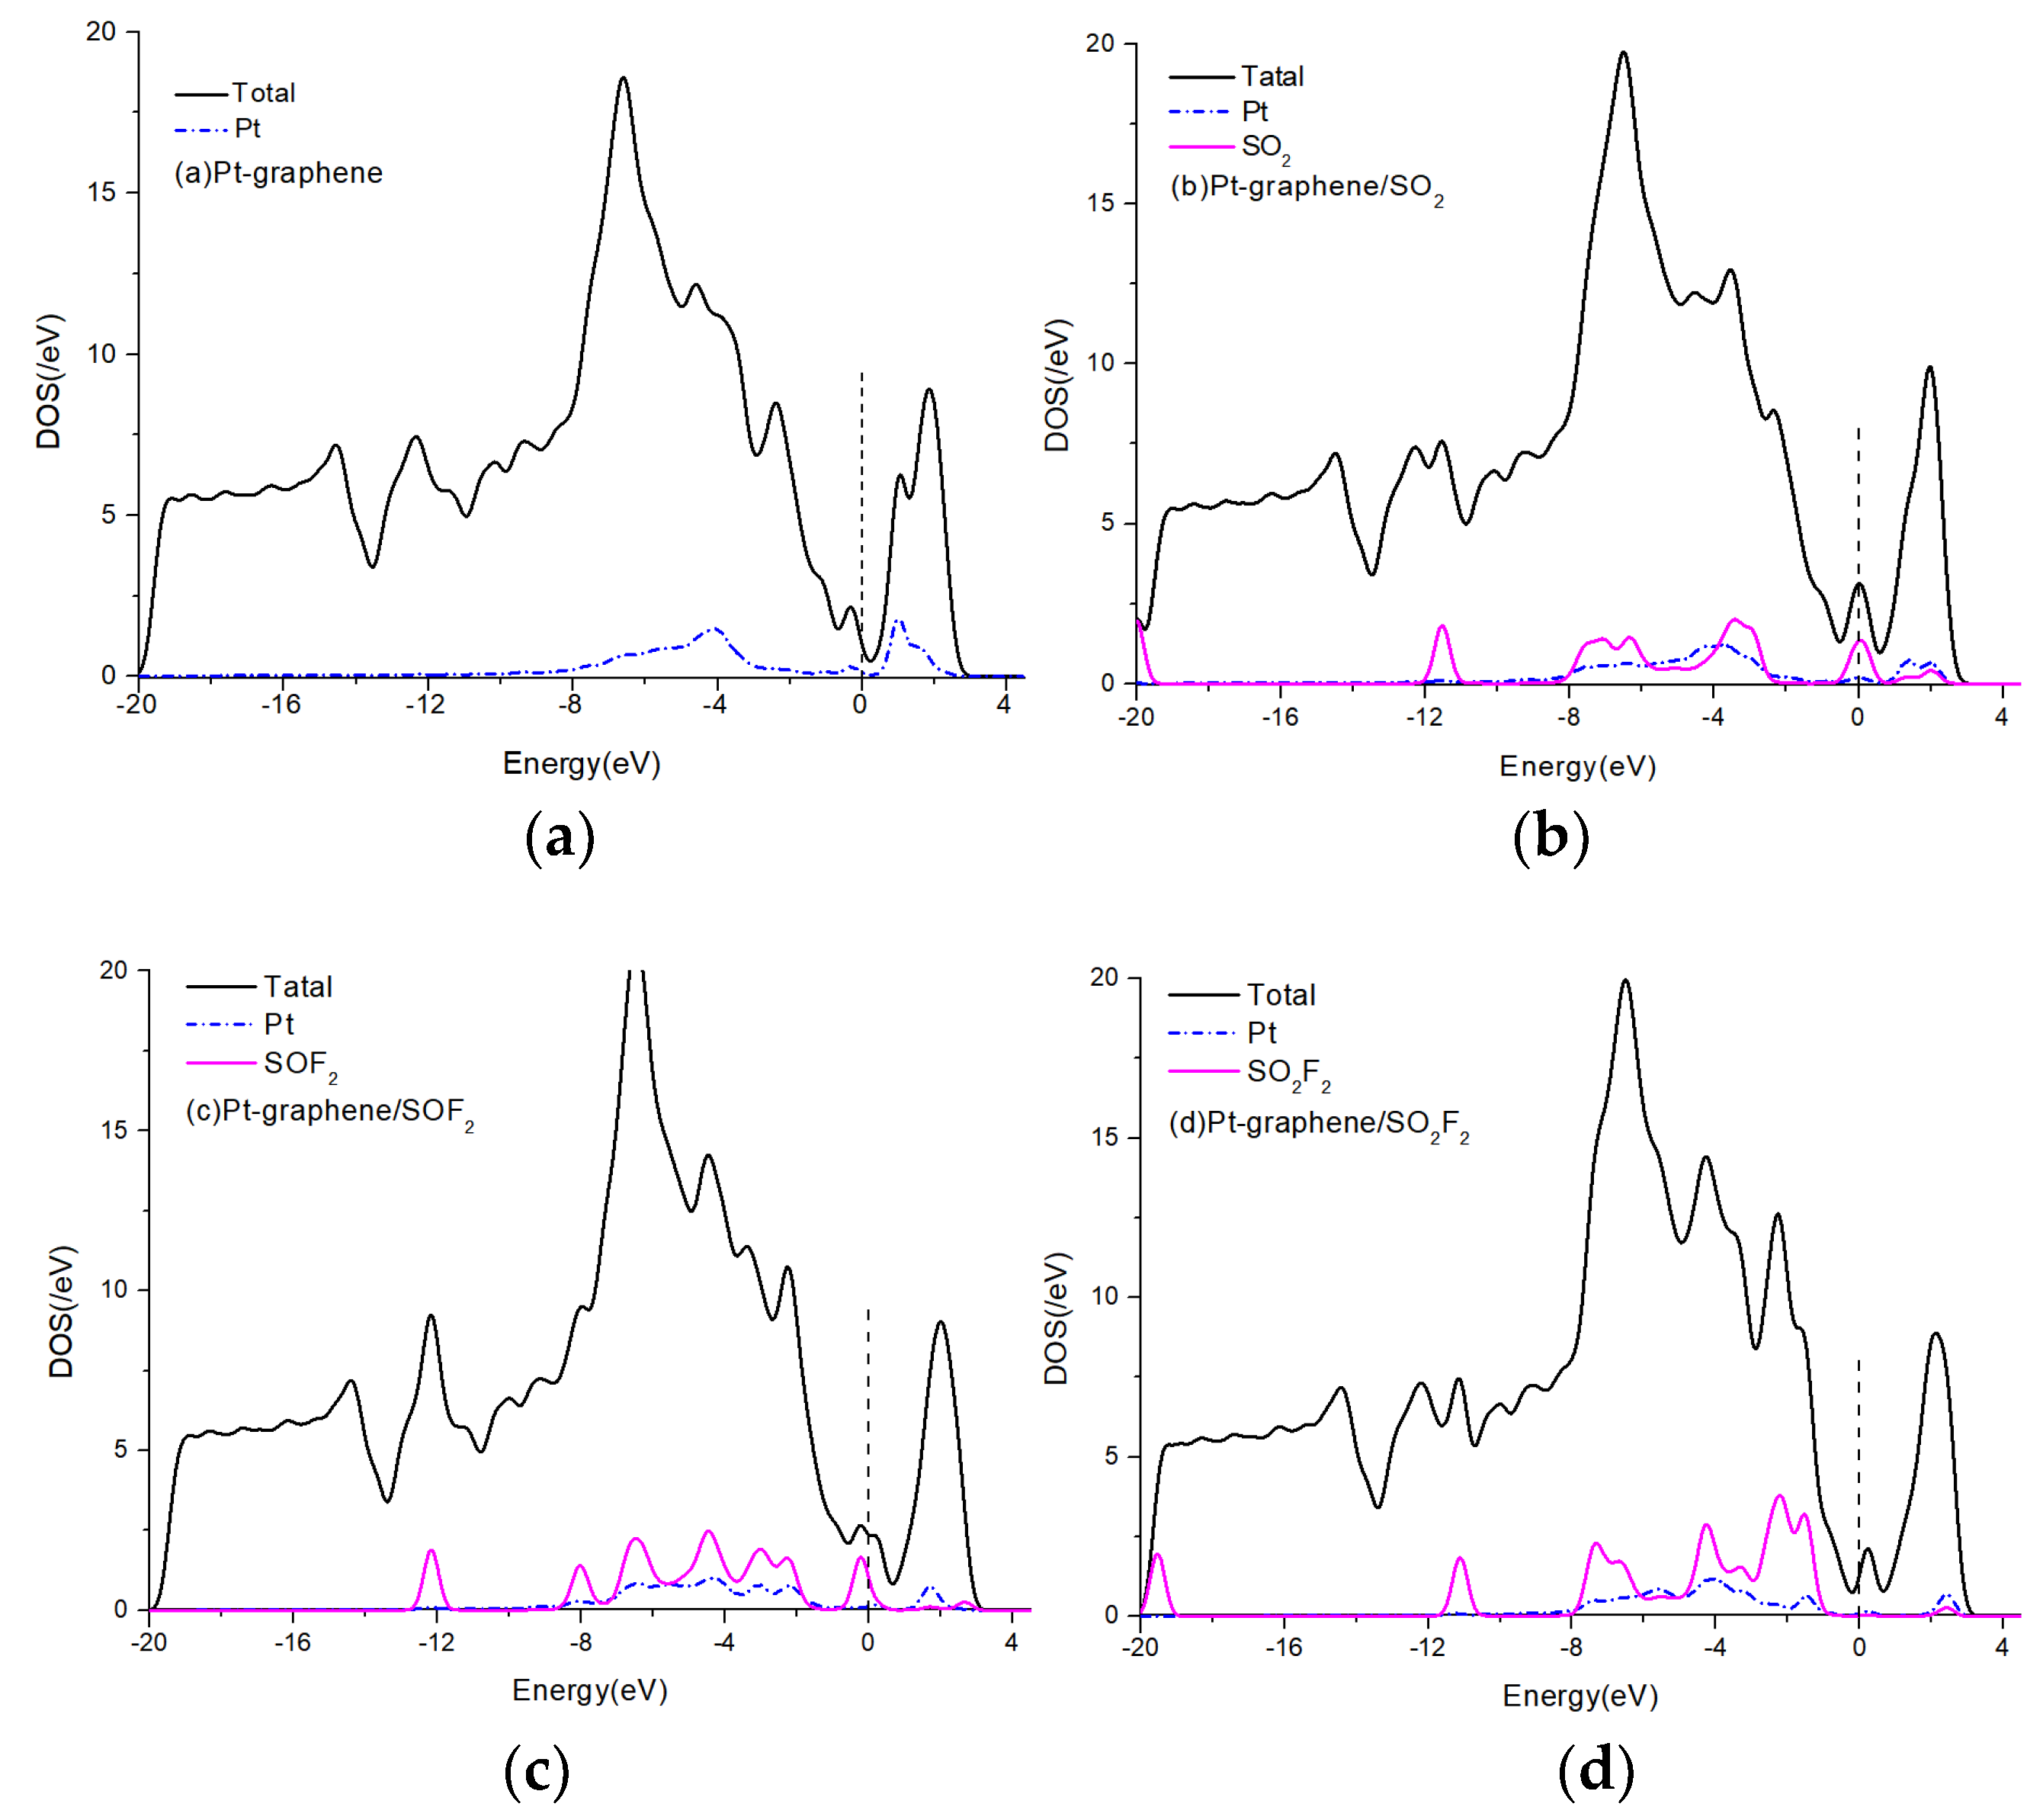
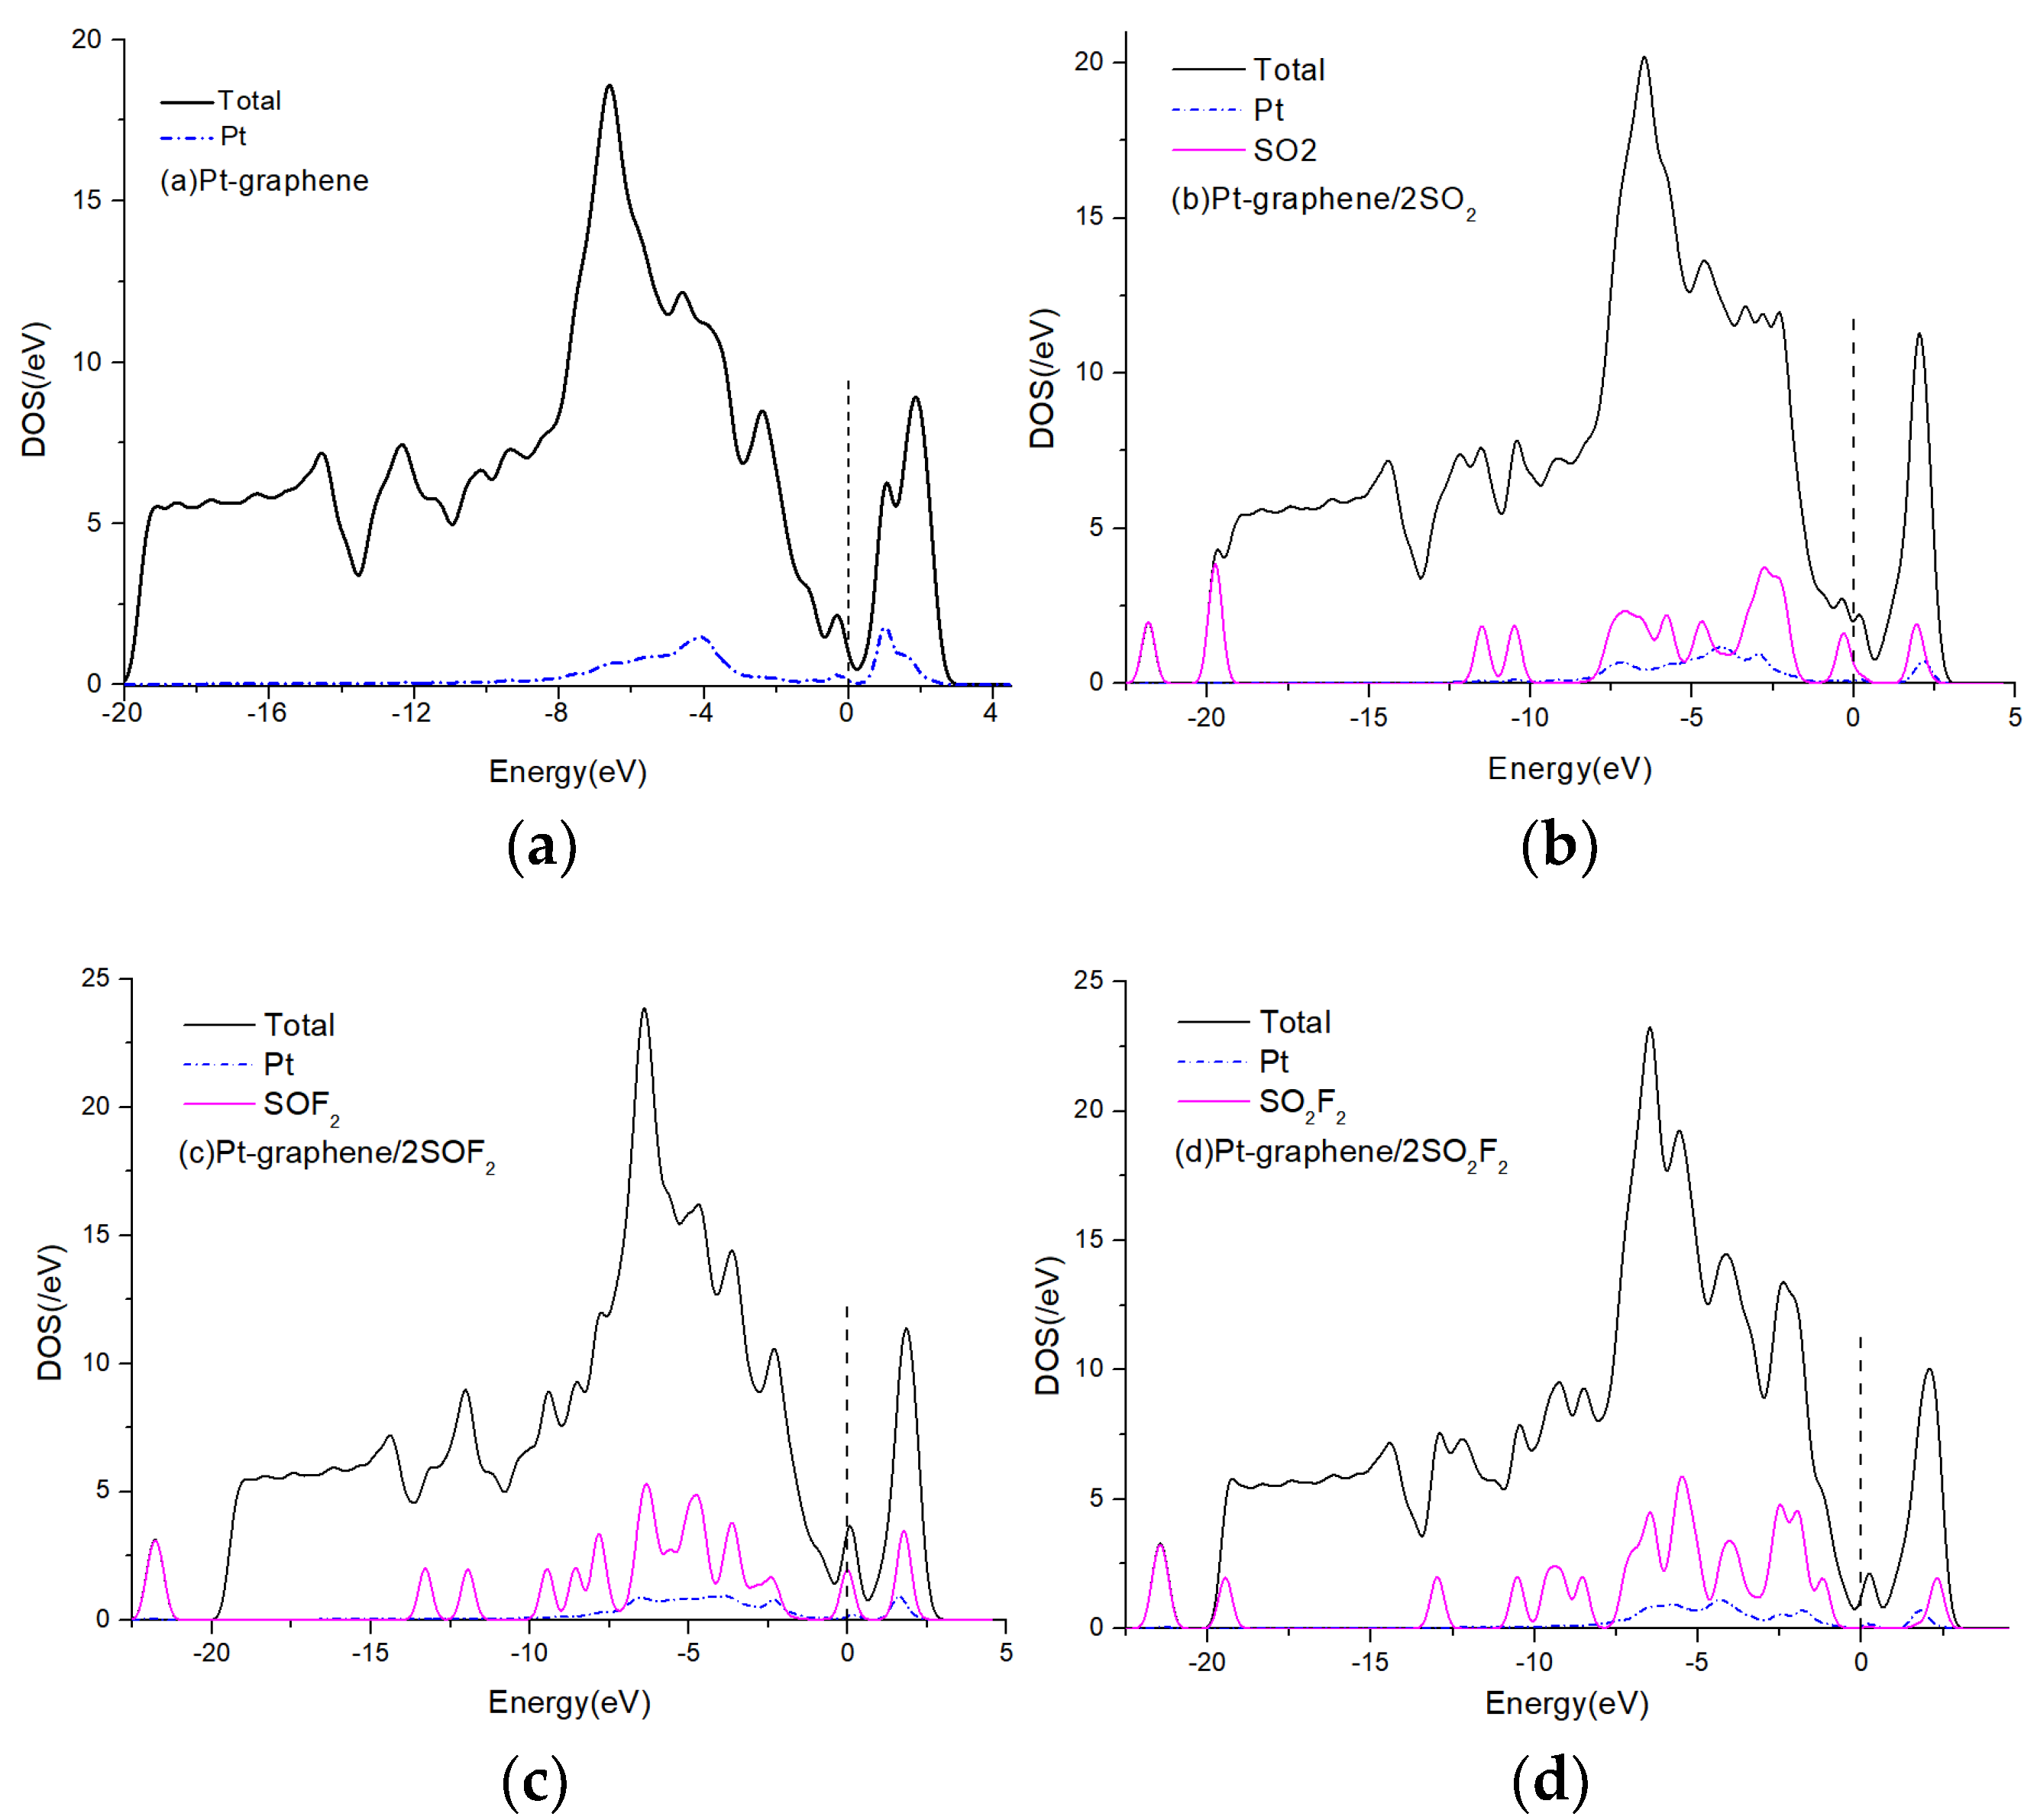
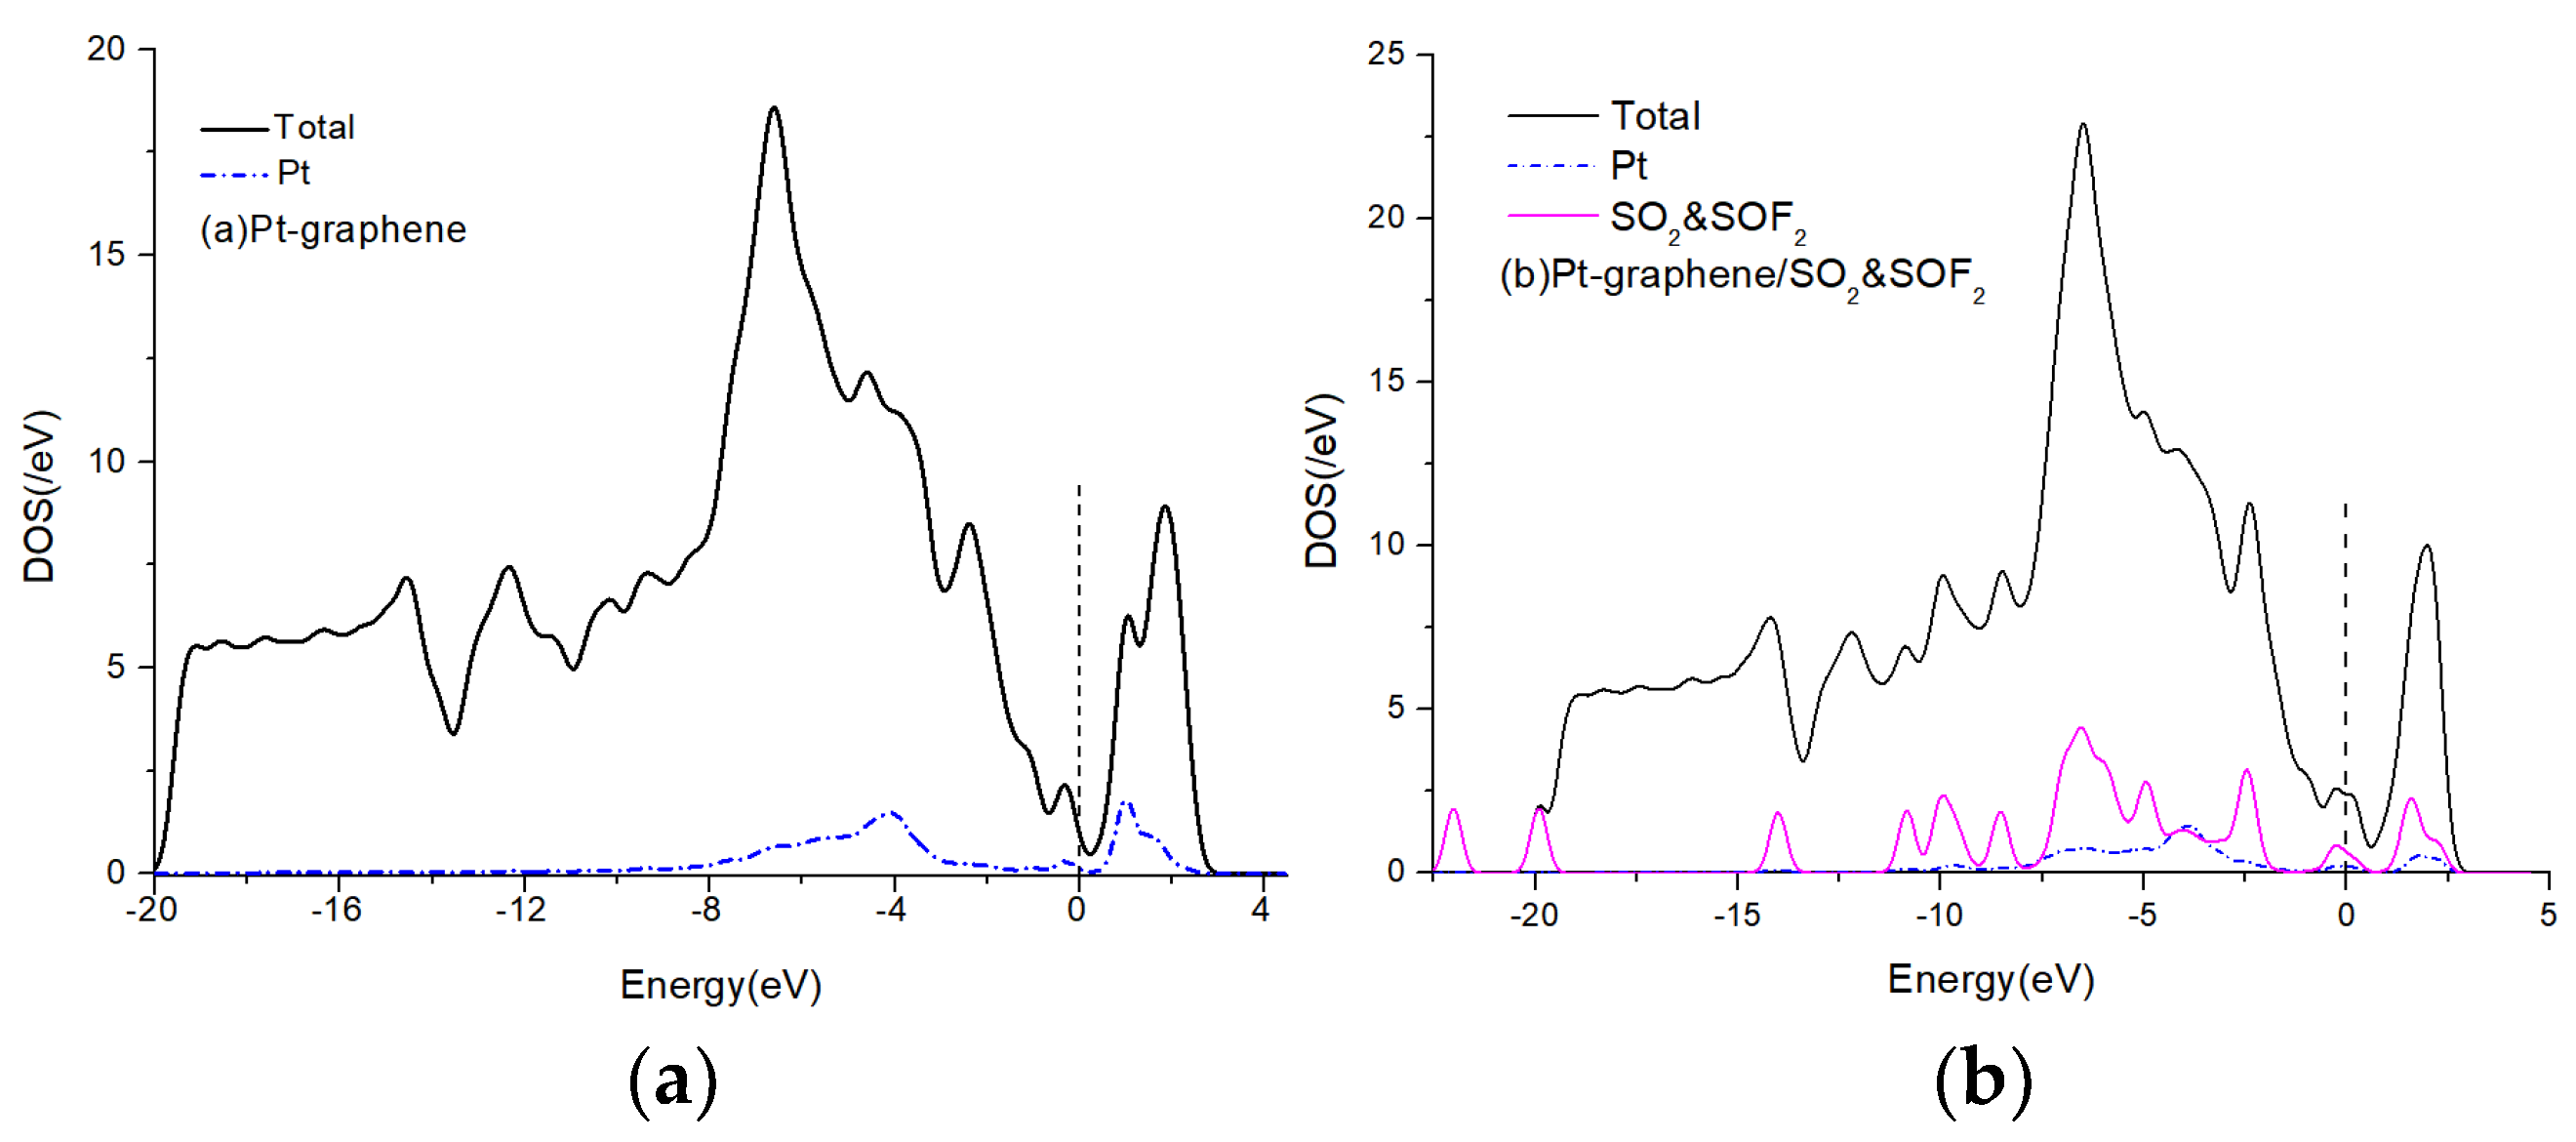
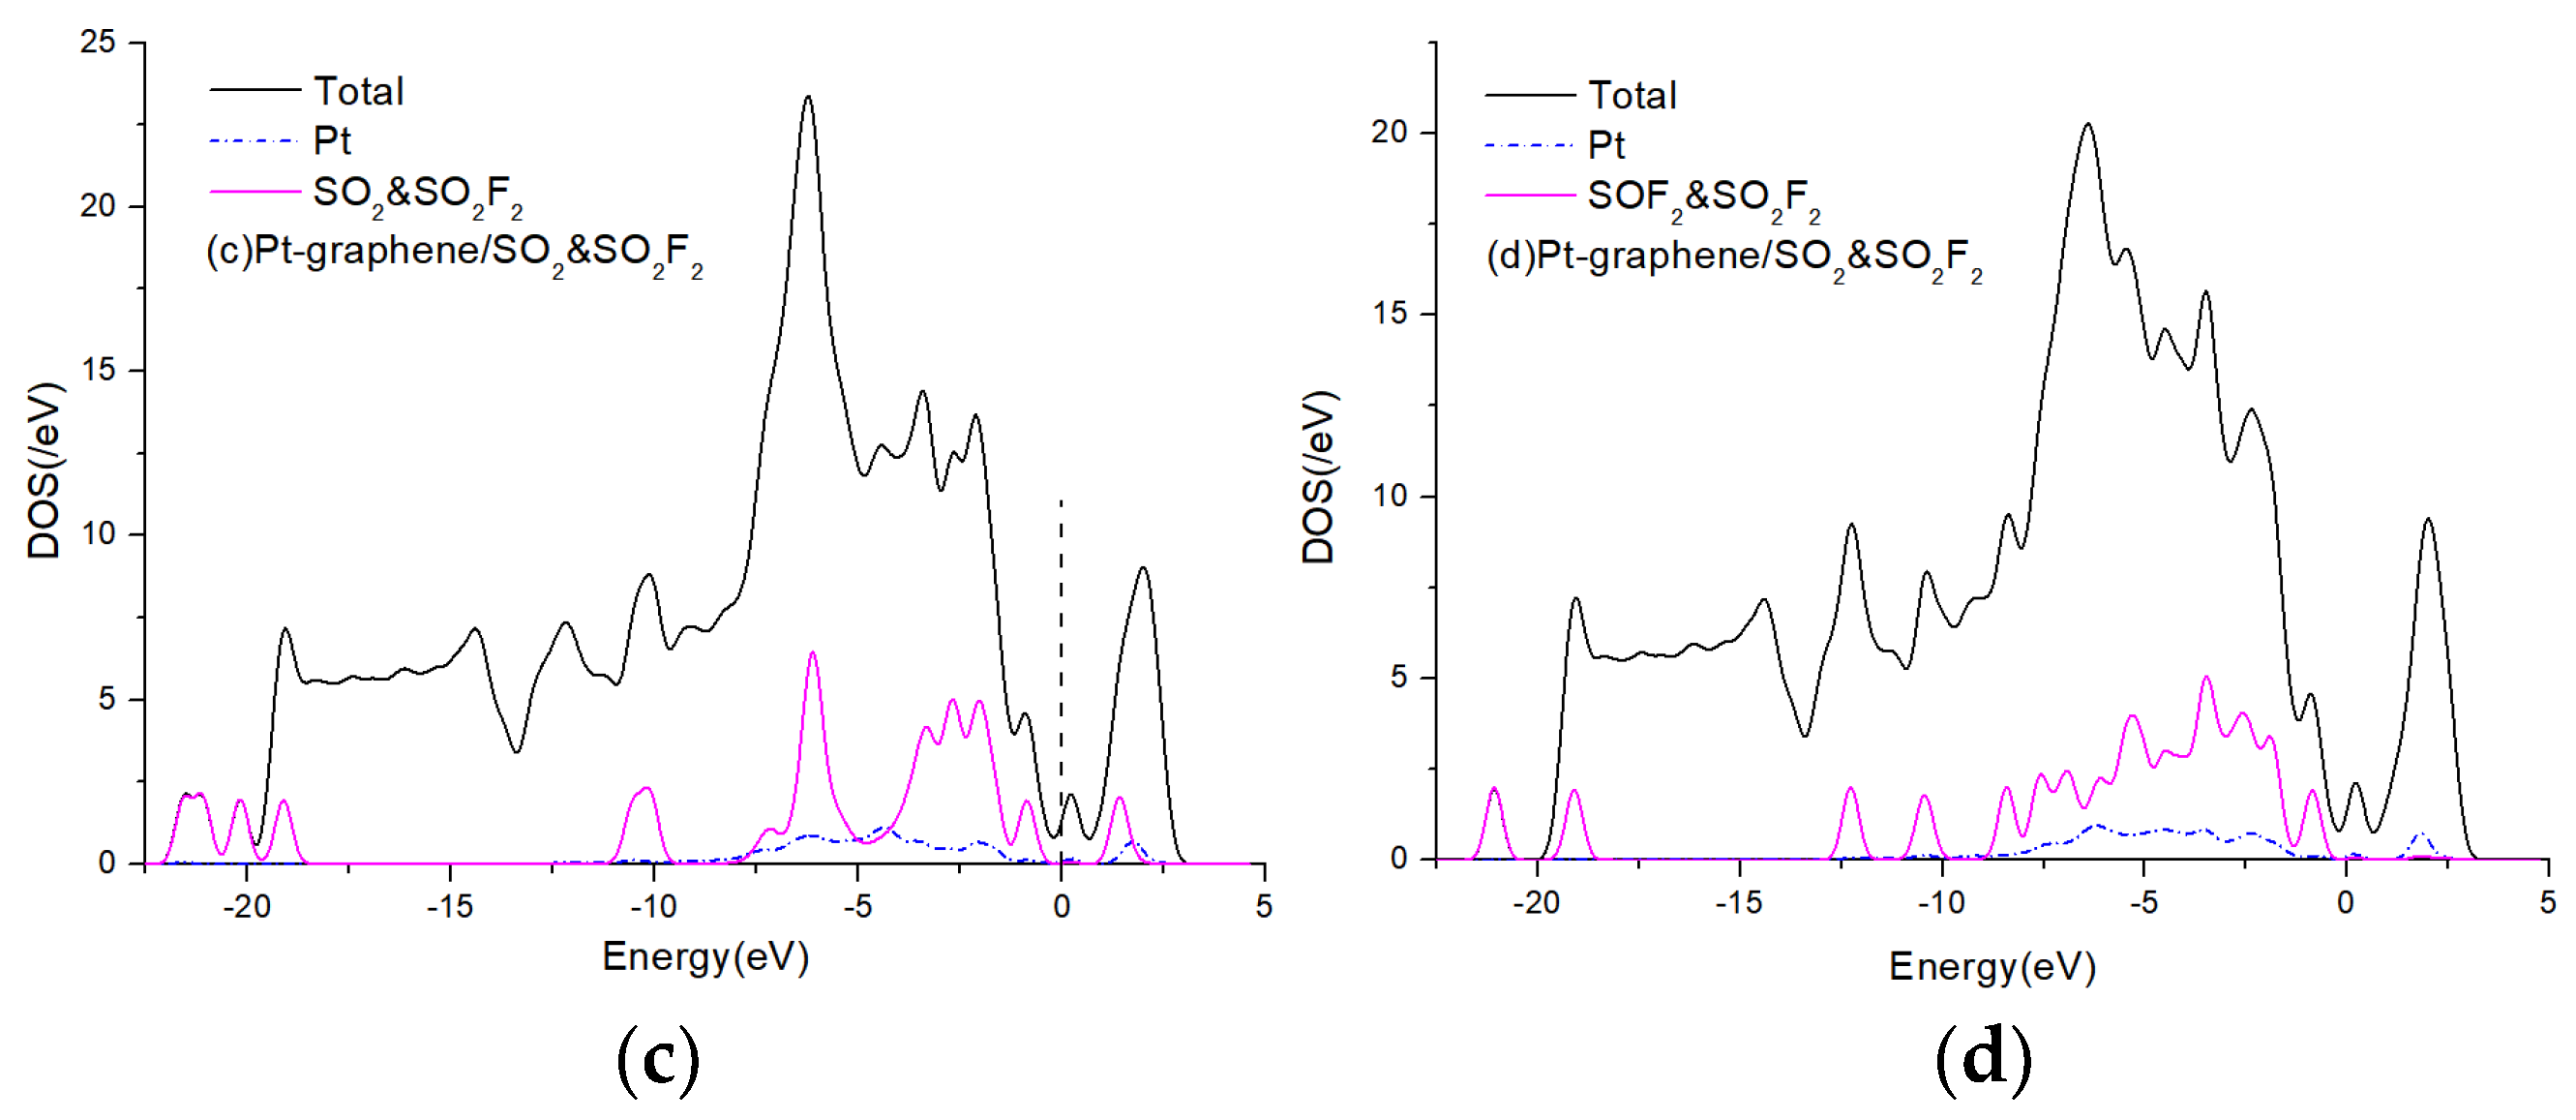
3.2.2. Analysis of Electronic Density of States

In this section, we analyze the electronic density of states (DOS) of individual gas molecules SO2, SOF2 and SO2F2. The DOS diagrams of Pt-graphene are shown in Figure 6, Figure 7 and Figure 8, which confirms that the system modified by Pt atom has good conductivity. Comparing with Figure 6a, b the DOS at Fermi level increased significantly after SO2 adsorption, which is attributed to the increase of the carrier number after SO2 adsorption. As shown in Figure 6c, the DOS of the system adsorbed SOF2 increases slightly below the Fermi level, but the DOS above the Fermi level is unchanged. The DOS at the Fermi level also increase. For a single SO2F2 adsorption (Figure 6d), DOS on the left side of Fermi level increases, but DOS on the right-side decreases, and there is no significant change at Fermi level.
In fact, the decomposition products present in the SF6 insulating device is a mixed gas. Therefore, the adsorption of multiple gas molecules was considered in this study. Due to the limited adsorption capacity of a single Pt-doped graphene, the adsorption of two gas molecules is sufficient to analyze the adsorption of multiple gas molecules.
Firstly, the adsorption characteristics of adsorbed double gas molecules are discussed. The comparison of DOS before and after adsorbing gas molecules is shown in Figure 7. Two SO2 adsorbed on Pt-graphene active sites at the same time enhances the molecular movement between Pt-graphene and adsorbing gas. Comparing with Figure 7a, b DOS has been improved in all energy distribution regions. Although the DOS curve lower than Fermi level changes little, the DOS higher than Fermi level increases. When two identical SOF2 and SO2F2 molecules interact with Pt-graphene, the DOS near the Fermi level increases. As can be seen in Figure 7c, the DOS after adsorption of SOF2 is significantly increased at the Fermi level, and as shown in Figure 7d, the DOS at the Fermi level is increased after the adsorption of SO2F2.
In the case of a mixed gas decomposed in the SF6 insulation equipment, in addition to the above-mentioned double gas adsorption, the Pt-graphene surface also adsorbs different gas molecules. According to the DOS shown in Figure 8, compared with the adsorption of single and double gas molecules, the change of DOS is significantly different, and all DOS diagrams close to the Fermi level are increased, and the overall DOS obviously moves to the right which is attributed to the change of Fermi-level compared to the bare Pt-graphene. It means that the conductivity decreases significantly. When SO2 and SOF2 interact with Pt-graphene, the SOF2 molecule leaves the Pt-graphene surface according to the structure discussed above. Comparing SO2 and SOF2 adsorbed DOS (Figure 8b) compared with DOS single SO2 adsorption, we found that DOS changes showed the same growth trend due to the key role of SO2 adsorption. For the adsorption of SOF2 and SO2F2 as the structure shown in Figure 8d, only the fractured fluorine atom and one SOF2 contribute to the change of conductivity. In the process of adsorption, SO2F2 molecules are away from the surface of graphene, and only one F atom forms a chemical bond with Pt atoms. The increase of DOS below the Fermi level mainly comes from the contribution of F atoms adsorption.

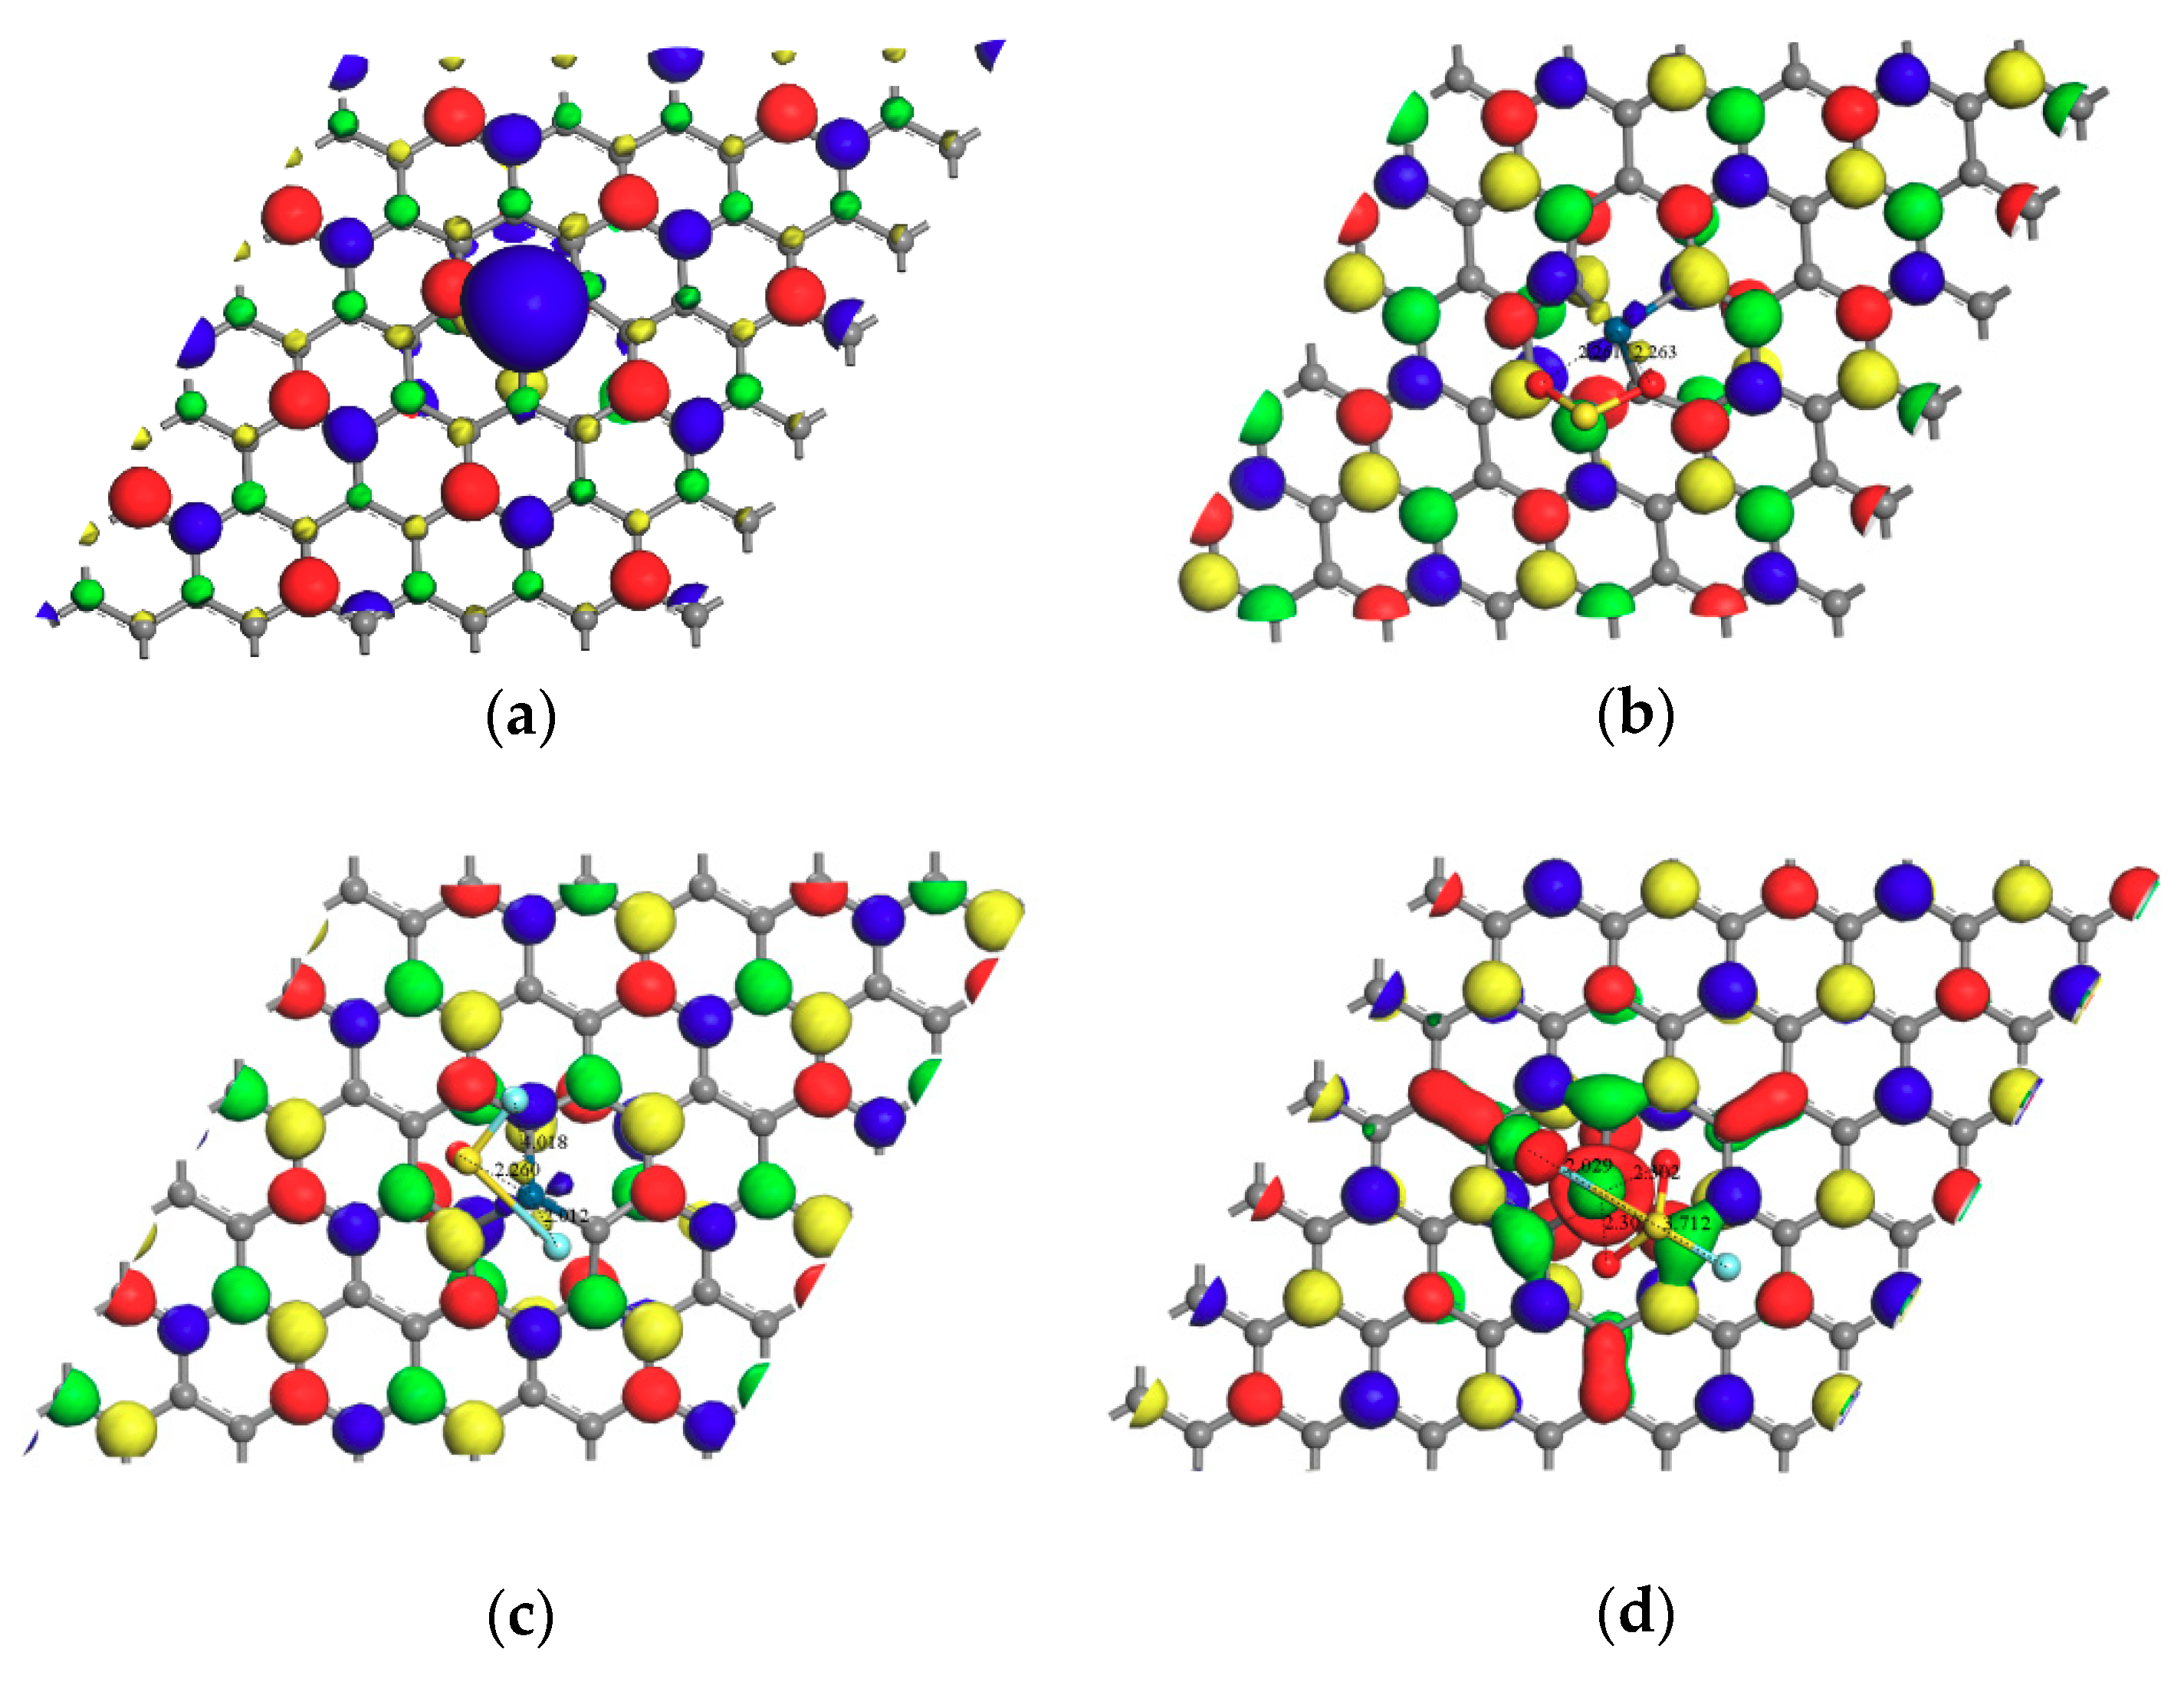
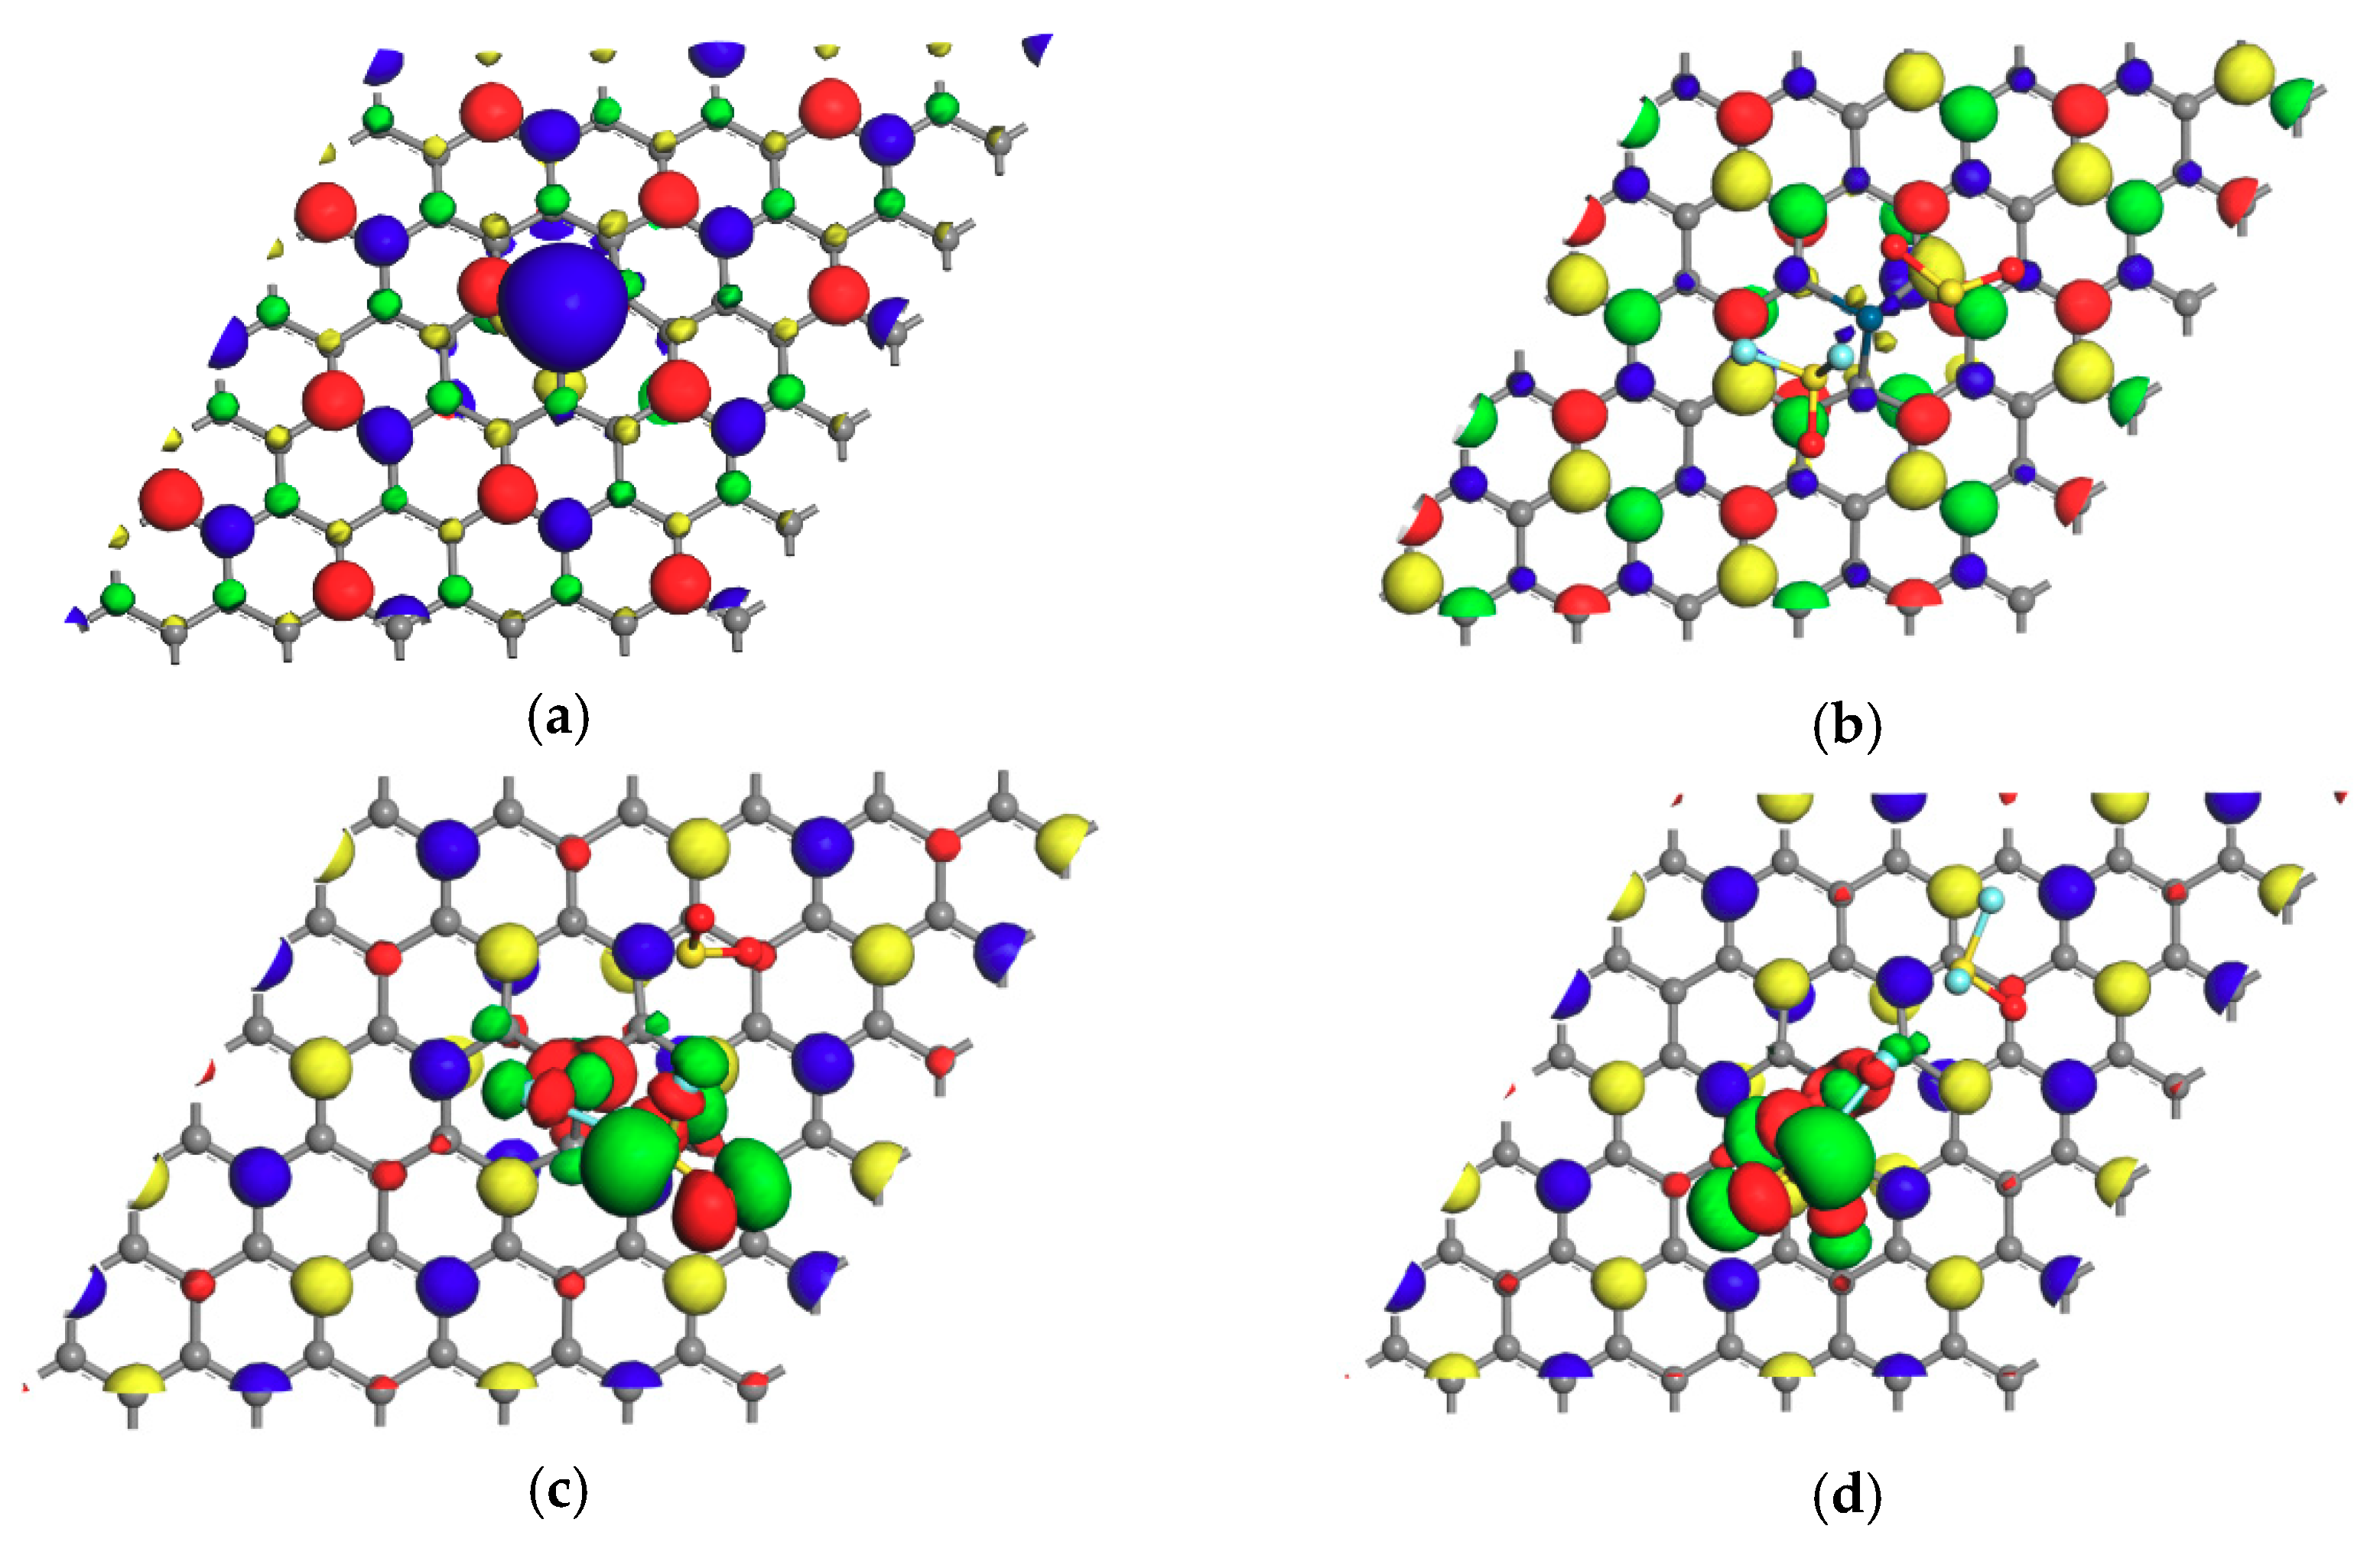
3.2.3. Analysis of Frontier Molecular Orbital

The HOMO, LUMO and the value of Eg of the system after adsorbing a single gas molecule are shown in Table 2. It was found that Eg increased to some extent during all the adsorption processes. Before Pt-graphene adsorbed gas molecules, HOMO and LUMO were mainly distributed at Pt atoms and their opposite sides (Figure 9a). The corresponding energy gap width Eg was 0.28 eV. As shown in Figure 9b, after adsorption of SO2, the HOMO and LUMO were slightly transferred to the SO2 adsorption site, and more uniformly distributed on the surface of Pt-graphene. Eg increases to 0.601 eV. We estimate that with the increase of Eg leads to the slightly decreased conductivity of the system. When a single SOF2 molecule is adsorbed on Pt-graphene, it is not much different from the adsorption of SO2, and the Eg is increased to 0.667 eV. There was almost no change in HOMO. The SOF piece causes change in LUMO. For SO2F2 adsorption, the Eg value is 0.716 eV, and HOMO and LUMO were significantly reduced. The HOMO and LUMO adsorption configurations of Pt-graphene adsorbed SO2F2 are shown in Figure 9d. There are few orbits around the adsorbed SO2F2.
The HOMO, LUMO and Eg of the system after adsorption of mixed gas molecules are shown in Table 3. The HOMO and LUMO distribution (Figure 10b) has been extended to the adsorbed SO2 and SOF2 molecule, and the Eg is broadened to 0.564 eV. Therefore, we evaluate that the effect of SO2 and SOF2 adsorption slightly increases the conductivity of Pt-graphene. Although the SO2F2 molecule is too far away to affect the frontier molecular orbital (Figure 10c), the adsorbed SO2 increasing the HOMO and LUMO distribution to change the system conductivity. For the HOMO and LUMO distributions of SOF2-SO2F2 adsorption shown in Figure 10d, part of the HOMO is distributed on the bonded F surface and one SOF2 molecule, and LUMO is uniformly distributed on the C atom as compared with before adsorption. In addition, with Eg rising to 0.706 eV, HOMO and LUMO mainly distribute around F-Pt bond and SOF2 molecule.

4. Conclusions

For the adsorption of a single gas molecule, Pt-doped graphene has strong interactions with SO2, SOF2 and SO2F2. For SO2 adsorption, the energy gap width Eg decrease, which may result in the decrease of conductivity of the system. Compared with SO2, the Eads for single SOF2 adsorption was slightly smaller, but the QT was slightly larger and the Eg was also slightly higher, which proved that SOF2 brings the smallest chemical interactions but still leads to the decrease of the conductivity. The adsorption of SO2F2 is a strong chemisorption process and moreover, the bonds in gas molecule tend to be broken. The adsorption of SO2F2 also brings conductivity decrease. For the adsorption of double gas molecules, the increase in the number of molecules does not obviously change the chemical interactions to some gas molecule but may have very small interactions with the second adsorbed molecule. When adsorbing double SO2, the adsorption energy and charge transfer amount are significantly increased compared with single gas molecules, but those of the adsorption of 2SOF2 and 2SO2F2 had not change. For the adsorption of two different gas molecules, the interactions are quite different with one molecule adsorption and the conductivity decreases to varying degrees and the distribution of HOMO, LUMO orbitals transfer around the gas molecule with different degrees and the value of Eg experience different changes.

Supplementary Materials

The following are available online at https://0-www-mdpi-com.brum.beds.ac.uk/2076-3417/8/10/2010/s1, Figure S1: Adsorption structure and adsorption energy comparison of single molecule adsorbed on Pt-graphene. Figure S2: Adsorption structure and adsorption energy comparison of double SO2, SOF2 and SO2F2 adsorbed on Pt-graphene. Figure S3: Adsorption structure and adsorption energy comparison of double double foreign molecules adsorbed on Pt-graphene. Table S1: Cartesian coordinates of SO2, SOF2 and SO2F2. Table S2: Cartesian coordinates of graphene and Pt-graphene. Table S3: Cartesian coordinates of single molecule adsorbed on Pt-graphene. Table S4: Cartesian coordinates of double molecule (2SO2, 2SOF2, 2SO2F2) adsorbed on Pt-graphene. Table S5: Cartesian coordinates of double molecule (SO2& SOF2, SO2& SO2F2, SOF2& SO2F2) adsorbed on Pt-graphene

Author Contributions

S.S. and X.Z. proposed the project and revised the manuscript. Y.W. and D.C. contributed to the theoretical simulation and analyzed the simulation results. All authors read and approved the final manuscript.

Funding

The authors are very grateful to the support by the Natural Science Foundation of the Guangxi Province (No. 2016GXNSFAA380327). This work is also supported by the National Natural Science Foundation of China under Grant 51777144.

Conflicts of Interest

The authors declare no conflict of interest.

References

  1. Chu, F.Y. SF6 decomposition in gas-insulated equipment. IEEE Trans. Electr. Insul. 1986, EI-21, 693–725. [Google Scholar] [CrossRef]
  2. Xie, Q.; Cheng, S.; Lü, F.; Li, Y. Location of partial discharge in transformer oil using circular array of ultrasonic sensors. IEEE Trans. Dielectr. Electr. Insul. 2013, 20, 1683–1690. [Google Scholar] [CrossRef]
  3. Liu, Y.W.; Wu, L.Y.; Gong, Y.P. Investigation on SF6 Decomposition Products in GIS and Affecting Factors. Power Syst. Technol. 2009, 5, 015. [Google Scholar]
  4. Okabe, S.; Kaneko, S.; Minagawa, T.; Nishida, C. Detecting characteristics of SF6 decomposed gas sensor for insulation diagnosis on gas insulated switchgears. IEEE Trans. Dielectr. Electr. Insul. 2008, 15, 251–258. [Google Scholar] [CrossRef]
  5. Tang, J.; Liu, F.; Zhang, X.; Meng, Q.; Zhou, J. Partial discharge recognition through an analysis of SF6 decomposition products part 1: Decomposition characteristics of SF6 under four different partial discharges. IEEE Trans. Dielectr. Electr. Insul. 2012, 19, 29–36. [Google Scholar] [CrossRef]
  6. Tang, J.; Liu, F.; Meng, Q.; Zhang, X.; Tao, J. Partial discharge recognition through an analysis of SF6 decomposition products part 2: Feature extraction and decision tree-based pattern recognition. IEEE Trans. Dielectr. Electr. Insul. 2012, 19, 37–44. [Google Scholar] [CrossRef]
  7. Sun, P.; Wang, K.; Zhu, H. Recent Developments in Graphene-Based Membranes: Structure, Mass-Transport Mechanism and Potential Applications. Adv. Mater. 2016, 28, 2287–2310. [Google Scholar] [CrossRef] [PubMed]
  8. Huang, X.; Yin, Z.; Wu, S.; Qi, X.; He, Q.; Zhang, Q.; Zhang, H. Graphene-based materials: Synthesis, characterization, properties, and applications. Small 2011, 7, 1876–1902. [Google Scholar] [CrossRef] [PubMed]
  9. Zhang, H.; Li, F.; Liu, K. Research Progress in Gas Sensitivity of Graphene. Mater. Rev. 2012, S2, 39–43. [Google Scholar]
  10. Schedin, F.; Geim, A.K.; Morozov, S.V.; Hill, E.W.; Blake, P.; Katsnelson, M.I.; Novoselov, K.S. Detection of individual gas molecules adsorbed on graphene. Nat. Mater. 2007, 6, 652–655. [Google Scholar] [CrossRef] [PubMed] [Green Version]
  11. Chu, J.; Wang, X.; Wang, D.; Yang, A.; Lv, P.; Wu, Y.; Rong, M.; Gao, L. Highly selective detection of sulfur hexafluoride decomposition components H2S and SOF2 employing sensors based on tin oxide modified reduced graphene oxide. Carbon 2018, 135, 95–103. [Google Scholar] [CrossRef]
  12. Zhang, Y.H.; Chen, Y.B.; Zhou, K.G.; Liu, C.H.; Zeng, J.; Zhang, H.L.; Peng, Y. Improving gas sensing properties of graphene by introducing dopants and defects: A first-principles study. Nanotechnology 2009, 20, 185504. [Google Scholar] [CrossRef] [PubMed]
  13. Beheshtian, J.; Peyghan, A.A.; Noei, M. Sensing behavior of Al and Si doped BC3 graphenes to formaldehyde. Sens. Actuators B Chem. 2013, 181, 829–834. [Google Scholar] [CrossRef]
  14. Xiao, H.; Shi, X.; Zhang, Y.; Li, M.; Liao, X.; Chen, X. Predicting a two-dimensional P2S3 monolayer: A global minimum structure. Comput. Mater. Sci. 2018, 155, 288–292. [Google Scholar] [CrossRef]
  15. Xiao, H.; Shi, X.; Liao, X.; Zhang, Y.; Chen, X. Prediction of a two-dimensional S3N2 solid for optoelectronic applications. Phys. Rev. Mater. 2018, 2, 024002. [Google Scholar] [CrossRef]
  16. Leenaerts, O.; Partoens, B.; Peeters, F.M. Adsorption of H2O, NH3, CO, NO2, and NO on graphene: A first-principles study. Phys. Rev. B 2008, 77, 125416. [Google Scholar] [CrossRef]
  17. Tang, Y.; Liu, Z.; Shen, Z.; Chen, W.; Ma, D.; Dai, X. Adsorption sensitivity of metal atom decorated bilayer graphene toward toxic gas molecules (CO, NO, SO2 and HCN). Sens. Actuators B Chem. 2017, 238, 182–195. [Google Scholar] [CrossRef]
  18. Shokuhi Rad, A. DFT study of nitrous oxide adsorption on the surface of Pt-decorated graphene. Phys. Chem. Res. 2016, 4, 619–626. [Google Scholar]
  19. Rad, A.S.; Abedini, E. Chemisorption of NO on Pt-decorated graphene as modified nanostructure media: A first principles study. Appl. Surf. Sci. 2016, 360, 1041–1046. [Google Scholar] [CrossRef]
  20. Rad, A.S. Adsorption of C2H2 and C2H4 on Pt-decorated graphene nanostructure: Ab-initio study. Synth. Met. 2016, 211, 115–120. [Google Scholar] [CrossRef]
  21. Rad, A.S. Density functional theory study of the adsorption of MeOH and EtOH on the surface of Pt-decorated graphene. Phys. E Low-Dimens. Syst. Nanostruct. 2016, 83, 135–140. [Google Scholar] [CrossRef]
  22. Rad, A.S.; Zareyee, D. Adsorption properties of SO2 and O3 molecules on Pt-decorated graphene: A theoretical study. Vacuum 2016, 130, 113–118. [Google Scholar]
  23. Chen, D.; Zhang, X.; Tang, J.; Fang, J.; Li, Y.; Liu, H. Adsorption and dissociation mechanism of SO2 and H2S on Pt decorated graphene: A DFT-D3 study. Appl. Phys. A 2018, 124, 404. [Google Scholar] [CrossRef]
  24. Delley, B. An all-electron numerical method for solving the local density functional for polyatomic molecules. J. Chem. Phys. 1990, 92, 508–517. [Google Scholar] [CrossRef]
  25. Delley, B. From molecules to solids with the DMol3 approach. J. Chem. Phys. 2000, 113, 7756–7764. [Google Scholar] [CrossRef]
  26. Perdew, J.P.; Burke, K.; Ernzerhof, M. Generalized gradient approximation made simple. Phys. Rev. Lett. 1996, 77, 3865. [Google Scholar] [CrossRef] [PubMed]
  27. Grimme, S. Semiempirical GGA-type density functional constructed with a long-range dispersion correction. J. Comput. Chem. 2006, 27, 1787–1799. [Google Scholar] [CrossRef] [PubMed]
  28. Monkhorst, H.J.; Pack, J.D. Special points for Brillouin-zone integrations. Phys. Rev. B 1976, 13, 5188. [Google Scholar] [CrossRef]
  29. Mulliken, R.S. Electronic population analysis on LCAO–MO molecular wave functions. I. J. Chem. Phys. 1955, 23, 1833–1840. [Google Scholar] [CrossRef]
  30. Fu, Y.; Yang, A.; Wang, X.; Murphy, A.B.; Li, X.; Liu, D.; Wu, Y.; Rong, M. Theoretical study of the neutral decomposition of SF6 in the presence of H2O and O2 in discharges in power equipment. J. Phys. D Appl. Phys. 2016, 49, 385203. [Google Scholar] [CrossRef]
  31. Zhang, X.; Yu, L.; Gui, Y.; Hu, W. First-principles study of SF6 decomposed gas adsorbed on Au-decorated graphene. Appl. Surf. Sci. 2016, 367, 259–269. [Google Scholar] [CrossRef]
  32. Del Castillo, R.M.; Sansores, L.E. Study of the electronic structure of Ag, Au, Pt and Pd clusters adsorption on graphene and their effect on conductivity. Eur. Phys. J. B 2015, 88, 248. [Google Scholar] [CrossRef]
Figure 1. Geometric structures after optimization: (a) SO2 molecule; (b) SOF2 molecule; (c) SO2F2 molecule. (Yellow = Sulfur; Red = Oxygen; Cyan = Fluorine, the labels are also applied to the following figures.).
Applsci 08 02010 g001
Figure 2. Geometric structures after optimization: (a) Int-graphene; (b) Top view of Pt-graphene; (c) Side view of Pt-graphene. (Grey = Carbon; Dark blue = Platinum, the labels are also applied to the following figures.).
Applsci 08 02010 g002
Figure 3. The adsorption structures for single SO2, SOF2 and SO2F2 adsorption on Pt-graphene. (a) SO2; (b) SOF2; (c) SO2F2.
Applsci 08 02010 g003
Figure 4. The adsorption structures for double SO2, SOF2 and SO2F2 adsorption on Pt-graphene. (a) 2SO2; (b) 2SOF2; (c) 2SO2F2.
Applsci 08 02010 g004
Figure 5. The adsorption structures for double foreign SO2, SOF2 and SO2F2 adsorption on Pt-graphene. (a) SO2 and SOF2; (b) SO2 and SO2F2; (c) SOF2 and SO2F2.
Applsci 08 02010 g005
Figure 6. The change of density of states (DOS) (a) before and after (b) single SO2, (c) single SOF2 and (d) single SO2F2 adsorption on Pt-graphene.
Applsci 08 02010 g006
Figure 7. The change of DOS (a) before and after (b) double SO2, (c) double SOF2 and (d) double SO2F2 adsorption on Pt-graphene.
Applsci 08 02010 g007
Figure 8. The change of DOS (a) before and after (b) SO2 & SOF2, (c) SO2 & SO2F2 and (d) SOF2 & SO2F2 adsorption on Pt-graphene.
Applsci 08 02010 g008aApplsci 08 02010 g008b
Figure 9. Distribution of HOMO (red-green) and LUMO (blue-yellow) (a) before and after (b) single SO2, (c) single SOF2 and (d) single SO2F2 adsorption on Pt-graphene.
Applsci 08 02010 g009
Figure 10. Distribution of HOMO (red-green) and LUMO (blue-yellow) (a) before and after (b) SO2 & SOF2, (c) SO2 & SO2F2 and (d) SOF2 & SO2F2 adsorption on Pt-graphene.
Applsci 08 02010 g010
Table 1. Adsorption energy (Eads), charge transfer (QT) and binding distance (D) from adsorbed gas molecules to Pt-graphene.
SystemEads (eV)QT1 (eV)QT2 (eV)D1 (Å)D2 (Å)Bond Length (Å)
SO2−1.358−0.412 2.261 1.581 (O1-S), 1.582 (O2-S)
SOF2−1.254−0.679 2.012 2.966 (S-F1), 1.688 (S-F2), 1.550 (O-S)
SO2F2−2.429−0.981 2.029 3.434 (S-F2), 1.727 (S-F1), 1.542 (O2-S), 1.542 (O1-S)
2SO2−2.223−0.665 2.303 (Pt-O(front SO2))2.256 (Pt-O(second SO2))1.498 (O1-S), 1.561 (O2-S), 1.565 (O3-S), 1.561 (O4-S)
2SOF2−0.934−0.622 2.008 (Pt-F(right SOF2))3.806 (Pt-F(left SOF2))1.675 (S-F1), 1.670 (S-F2), 1.460 (O-S),
3.027 (S-F1), 1.801 (S-F2), 1.503 (O-S)
2SO2F2−2.159−1.088 2.009 (Pt-F(left SO2F2)3.422 (Pt-F(right SO2F2))2.343 (S-F1), 3.384 (S-F2), 1.492 (O1-S), 1.486 (O2-S)
1.606 (S-F3), 1.610 (S-F4), 1.441 (O3-S), 1.445 (O4-S)
SO2&SOF2−1.431−0.321 (SO2)0.127 (SOF2)2.246 (Pt-O(SO2))2.486 (Pt-S(SOF2))1.501 (O1-S), 1.589 (O2-S)
1.643 (S-F1), 1.661 (S-F2), 1.455 (O-S)
SO2&SO2F2−2.198−0.039 (SO2)−0.544 (SO2F2)3.983 (Pt-S(SO2))2.011 (Pt-F(SO2F2))1.480 (O1-S), 1.486 (O2-S)
2.975 (S-F2), 1.763 (S-F1), 1.586 (O2-S), 1.483 (O1-S)
SOF2&SO2F2−2.306−0.047 (SOF2)−0.994 (SO2F2)4.143 (Pt-S(SOF2))2.031 (Pt-F(SO2F2))1.662 (S-F1), 1.688 (S-F2), 1.465 (O-S)
3.143 (S-F2), 1.764 (S-F1), 1.585 (O2-S), 1.482 (O1-S)
Table 2. Highest occupied molecular orbital (HOMO), lowest unoccupied molecular orbital (LUMO), Eg before and after adsorption of single SO2, SOF2, SO2F2 by Pt-graphene.
SystemLUMO (eV)HOMO (eV)Eg (eV)
Pt-graphene−3.798−4.2290.489
Pt-graphene/SO2−4.105−4.7060.601
Pt-graphene/SOF2−4.218−4.8840.667
Pt-graphene/SO2F2−4.330−5.0460.716
Table 3. HOMO, LUMO, Eg before and after adsorption of double foreign SO2, SOF2, SO2F2 by Pt-graphene.
SystemLUMOHOMOEg (eV)
graphene−3.798−4.2290.489
Pt-graphene/SO2& SOF2−4.279−4.8430.564
Pt-graphene/SO2& SO2F2−4.645−5.3490.704
Pt-graphene/SOF2&SO2F2−4.607−5.3140.706

