Article

An Enhanced Mobility and Temperature Aware Routing Protocol through Multi-Criteria Decision Making Method in Wireless Body Area Networks

1
Department of Computer Science and Engineering, Chungnam National University, Daejeon 34134, Korea
2
College of Technological Innovation, Zayed University, Abu Dhabi 999041, UAE
3
Department of Informatics, Gyeongsang National University, Jinju 52828, Korea
4
Department of Computer and Software Technology, University of Swat, Mingora 19130, Pakistan
*
Author to whom correspondence should be addressed.
Submission received: 13 September 2018 / Revised: 2 November 2018 / Accepted: 10 November 2018 / Published: 14 November 2018
(This article belongs to the Special Issue Body Area Networks)

Abstract

:
In wireless body area networks, temperature-aware routing plays an important role in preventing damage of surrounding body tissues caused by the temperature rise of the nodes. However, existing temperature-aware routing protocols tend to choose the next hop according to the temperature metric without considering transmission delay and data loss caused by human posture. To address this problem, multiple research efforts exploit different metrics such as temperature, hop count and link quality. Because their approaches are fundamentally based on simple computation through weighted factor for each metric, it is rarely feasible to obtain reasonable weight value through experiments. To solve this problem, we propose an enhanced mobility and temperature-aware routing protocol based on the multi-criteria decision making method. The proposed protocol adopts the analytical hierarchy process and simple additive weighting method to assign suitable weight factors and choose the next hop while considering multiple routing criteria. Simulation results are presented to demonstrate that the proposed protocol can efficiently improve transmission delay and data loss better than existing protocols by preventing the temperature rise on the node.

1. Introduction

A Wireless Body Area Network (WBAN) consists of intelligent and low-power computing devices that are used to collect patients’ vital signs for real-time diagnosis and remote health monitoring. These devices forward the collected information to a central sink node that forwards it to a medical server. Unlike the typical Wireless Sensor Networks (WSN), there are several routing issues in WBAN due to its stringent requirements [1]. For example, the main objective of routing protocol in a WSN is to minimize the routing overhead and maximize throughput. On the other hand, in WBAN, it is more important to reduce energy consumption because sensor devices have limited resources in terms of battery capacity, transmission power and memory. In addition, since WBAN collects physical data of the human body, it is also important to reduce packet loss and transmission delay.
One of the important challenges in WBANs is the temperature rise of each device. When computing and traffic forwarding are concentrated on a specific device, the temperature of the device rises sharply which leads to damage of surrounding body tissues. To address this problem, multiple researchers have proposed several temperature-aware routing protocols. For example, TARA is one of the first protocols that considers nodes’ temperature when selecting the next hop [2]. In TARA, the temperature of the nodes using the pennes bio heat equation [3] is estimated and used for next hop selection in a way that the neighbor with the lowest temperature is chosen until the data packet reaches its destination. However, there is a high possibility that a packet may go through many intermediate nodes until it arrives at its destination. ALTR [4] takes the same mechanism as TARA, but Shortest Hop Routing (SHR) algorithm is performed whenever the hop count field of a packet header exceeds the pre-defined threshold. On the other hand, HPR [5] forwards the data packet to a neighbor with the smallest number of hop count to the destination. However, if the temperature of the selected node exceeds the pre-defined threshold, instead a neighbor with the lowest temperature is selected as the next hop. However, since all these mentioned approaches simply consider one hop information for temperature, many packets return to the previous node. To solve this problem, Enhanced Temperature-aware Routing Protocol (ETARP) [6] exploits two hops ahead scheme. The two hops ahead algorithm contributes to selecting the proper path at an earlier time in a way that it can observe the hot spot region in advance by calculating the temperature cost, which includes the temperature of its two hop neighbors. As described earlier, lots of research has been proposed to address the temperature rise of the node, however, their approaches naturally cause other problems such as delay or loss of data because they assume fixed network topology. This implies that dynamic network topology changes caused by movement of human posture are not taken into account in the previous work.
To mention the technical issues in the dynamic topology, B. Kim et al. presented research challenges for mobility support in a WBAN [7]. The authors of [8] proposed a temperature-aware routing protocol called M-ATTEMPT that considers the mobility of a human body. The network topology of M-ATTEMPT is based on the tree structure that is rebuilt by a node’s joining to the new parent node whenever a node changes its location. In addition, each node can simply prevent its temperature rise by disconnecting with all links from its neighbors when the node’s temperature reaches the threshold. On the other hand, Mobility and Temperature-aware Routing (MTR) [9] utilizes the mobility of the human body in the routing process. When the temperature of all neighboring nodes exceeds the pre-defined threshold, a mobile node attached to the arms and legs is selected as a next hop in order to forward the data packet to the sink directly by adapting the store and carry scheme. Otherwise, all packets are forwarded to a neighboring node with the lowest temperature. However, the data packet may go through many intermediate nodes in case the mobile nodes are not available. This is mainly because hop count metric is not considered in the routing process. To solve this problem, Forwarder based Temperature-aware Routing (FTAR) has been proposed recently. It selects a mobile node which is the most likely to be connected to a sink node as a forwarder. However, in situations where a mobile node is not available, both hop count and temperature metric are used to select the next hop. Similarly, Mobility and Temperature-aware Routing Protocol (MTARP) [10] selects the best next hop while considering three routing metrics such as hop count, temperature, and link quality at the same time. These metrics are used to formulate routing cost by multiplying the metrics and pre-defined weighted factor. Once the routing cost is calculated, the next hop selection is performed by selecting a neighbor node which has the highest routing cost.
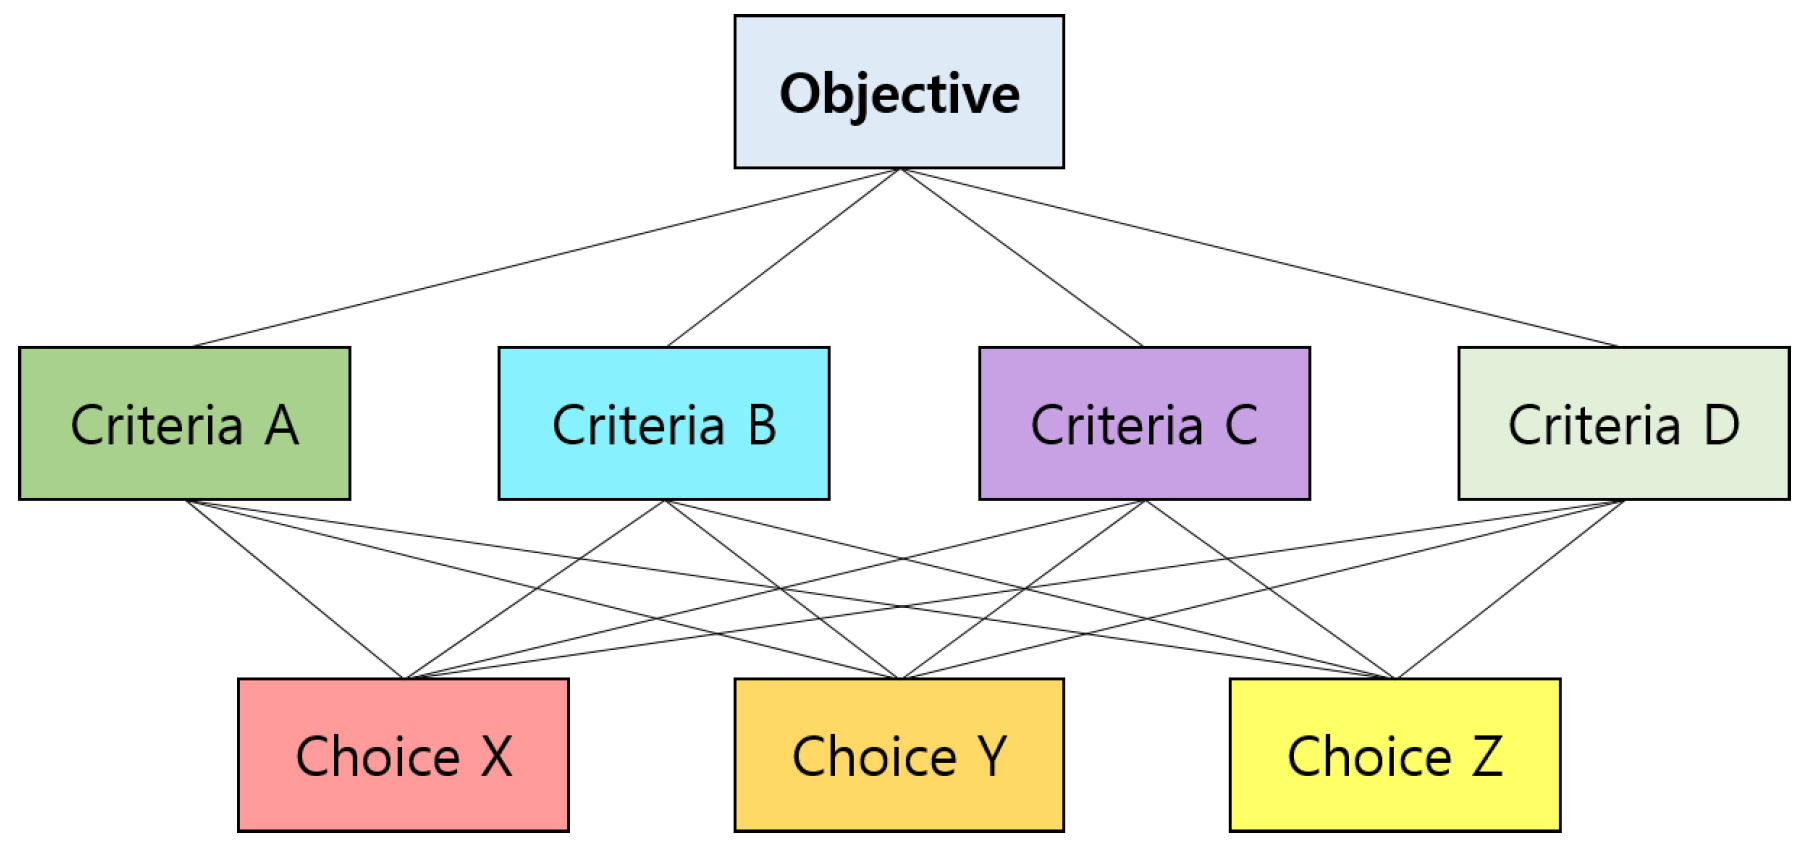
However, the previous approaches have limitations in terms of adaptability, i.e., they exploit a heuristic weighted factor for calculating a routing cost. Especially, since they set the highest weight for the hop count metric, it is hard to prevent packet loss or temperature rise efficiently. Therefore, a logical approach is required to determine the weight of each routing metric where the routing metrics are not correlated to each other. To achieve this goal, we propose an enhanced version of MTARP based on the Multi-Criteria Decision Making (MCDM) method by exploiting Analytic Hierarchy Process (AHP) and Simple Additive Weight (SAW) methods. These methods provide a flexible decision making process for next hop selection by considering various factors at the same time. In order to select the best next hop, we take three routing metrics: hop count, temperature and link quality. Furthermore, these metrics are the criterions for the AHP and SAW methods. Moreover, the simulation results are given to demonstrate that the proposed scheme reveals the better performance than MTARP in the aspects of number of hot spots, packet delivery ratio and end-to-end delay.
The main contributions of this paper are summarized below.
  • Unlike the previous temperature routing protocols, our study incorporates three metrics: hop count, temperature, and link quality in the routing process to prevent the packet loss and transmission delay due to body movements.
  • To analyze the influence of the temperature rise of sensor nodes on the network parameters such as packet delivery ratio and end-to-end delay, we logically determine the relative weights between the proposed metrics using AHP and SAW methods.
  • Since the problem of optimization of the number of hot spots, real-time transmission, and reliability depends on the WBAN applications, we determine the relative weights among the proposed metrics differently depending on the type of applications such as common medical sensors, critical medical sensors.
The rest of paper is organized as follows. Section 2 describes the related work. In Section 3, the MCDM methods used in our study are described. In Section 4, we describe the proposed protocol. A performance evaluation is conducted in Section 5. Finally, Section 6 concludes our work.

2. Related Work

The authors of [2] proposed the first temperature-aware routing protocol for WBAN. In TARA, a data packet is forwarded to a neighbor node with the lowest temperature until it is delivered to a sink node. However, if the temperature of a neighbor node with the lowest temperature exceeds threshold, the data packet is sent back to the node that had forwarded the data packet previously. Thus, TARA leads to the temperature rise of many intermediate nodes because a packet might have to go through them until it arrives at its destination. To overcome this problem, ALTR [4] has been proposed. In ALTR, the data packet is forwarded to a neighbor node with the lowest temperature in normal condition. Otherwise, it is forwarded to a neighbor node with the smallest number of hops to the destination when the hop count of the packet header exceeds the pre-defined threshold. Similarly, HPR [5] selects a neighbor node with the smallest number of hops as a next hop. On the other hand, it selects a neighbor node with the lowest temperature when the temperature of the selected node is greater than the pre-defined threshold. Unlike the previous approaches that consider neighbor nodes’ temperature only, ETARP [
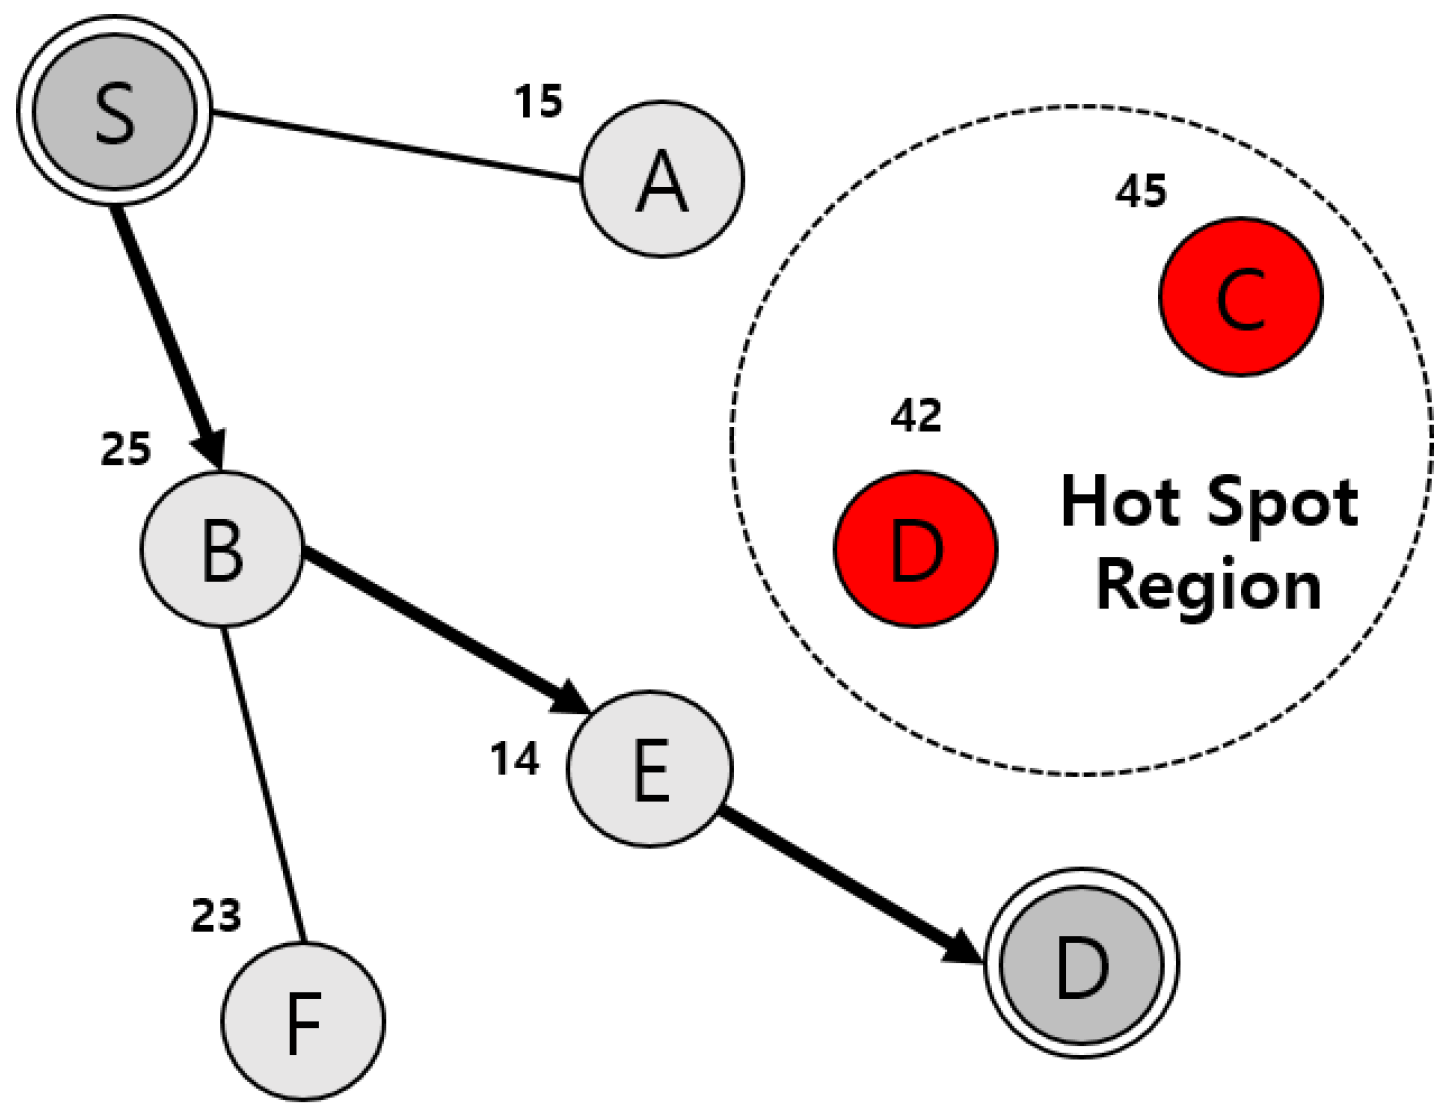
6] exploits the two hops ahead scheme while considering the short distance between each node and a sink. For example, as shown in Figure 1, the previous works take node A as a next hop because it has a lower temperature than B. However, all packets forwarded to node A cannot forward any more because both node C and D are hot spots now. To avoid this situation, MTARP takes the neighbor nodes’ temperature cost within its two as well as one hop. As a result, node B is selected as a next hop because the temperature cost of node B including the temperature of its two hop neighbors is lower than node A.
However, previous temperature-aware routing protocols did not support QoS requirements. TMQoS [11] integrates the QoS support issue with temperature-awareness in the routing process. TMQoS classifies the data packet into four types according to the importance of data, and creates different routing paths using cross-layer framework module such as temperature module, reliability module, and delay module. TLQoS [12] also uses a cross-layer framework like TMQoS, but it is based on the greedy forwarding algorithm that selects the neighboring node with the greatest routing cost as the next hop, rather than generating the routing path according to the data types. TTRP [13] provides reliable and secure data transmission. To avoid malicious node, it calculates the trust value by counting the total number of forwarded packets and actual received packets. The routing cost is calculated by adding the weighted trust value and the weighted temperature of the node.
However, previous approaches have problems such as long delay or lots of packet loss because they do not consider the dynamic network topology changes caused by human posture.
As alternative scheme for dynamic topology, M-ATTEMPT [8] has been proposed to address the dynamic network topology changes in WBAN. In M-ATTEMP, the tree is constructed according to a node’s joining or departure whenever a person changes his/her gesture. Furthermore, in the case that a node’s temperature approaches the pre-defined threshold, all nodes prevent its temperature rise by disconnecting all links with neighbor nodes during the next few rounds until the temperature turns normal. However, this approach has a problem because a node’s function cannot be performed when a node disconnects all links with neighbor nodes. On the other hand, MTR [9] utilizes the movements of the human body in the routing process. MTR defines two types of nodes: mobile node and static node. The mobile is attached to arms and legs while the static node is fixed body parts with no mobility. When the temperature of all neighboring static nodes exceeds the pre-defined threshold, a mobile node is selected as a next hop in order to forward the data to the sink node directly by adapting store and carry scheme. MTR uses routing cost P that is calculated by multiplying pre-defined weighted factor and connection time between a source node and a mobile node. It is to prevent the data loss caused by movement of the mobile node. Figure 2 illustrates the routing process in MTR. If source node A is surrounded by hot spots, node A forwards the packet to mobile node B, and then node B stores the packet in its buffer until it is connected to the sink. Otherwise, all packets from node A are forwarded to a static node with lowest temperature. However, the store and carry scheme has a drawback in that the emergency sensor data may be delayed if it is delivered by a mobile node.
To solve this problem, FTAR has been proposed. FTAR is a forwarder based temperature-aware routing protocol that supports multiple traffic transmission. FTAR categorizes the data into normal and critical data. In order to forward normal data, each source nodes select a mobile node which is the most likely to be connected to the sink as a forwarder. To select a forwarder among neighboring mobile nodes, FTAR uses T o t a l C o n n e c t e d T i m e ( T C T ) which means duration time in which a mobile node was connected to the sink. However, if there are no mobile nodes, normal data is forwarded to the node with the lowest temperature. On the other hand, critical data is forwarded to the node with the smallest number of hops in order to reduce the end-to-end delay. Similarly, MTARP [10] selects the best next hop while considering three metrics such as hop count, temperature, link quality at the same time. The hop count denotes the number of hops to the sink while the temperature is the temperature of a neighbor node. Moreover, the link quality represents the signal power received from a neighbor node. These metrics are used to compute link cost between a source node and a neighbor node at time t. However, since the link cost is simply calculated by multiplying the metrics and pre-defined weighted factor, the impact of these factors is not explored well. In addition, these approaches cannot guarantee good performances because they set the highest weight to the hop count metric or exploit a heuristic or constant weighted factor for calculating a routing cost. As a result, they lead to packet loss, long end-to-end delay and average temperature rise in networks. Based on this analysis, a logical approach is required to determine the weight of each metric in a reasonable way because the metrics are not correlated to each other.
Other QoS aware routing protocols for WBANs have been proposed in [14,15,16,17]. LAEEBA [14] and CO-LAEEBA [15] were introduced to support reliable transmission and efficient energy consumption by using the multiple metrics such as residual energy and path loss rate. On the other hand, ARBA [16] uses residual energy and bandwidth as routing metrics to enhance bandwidth utilization and network lifetime. V. Ayatollahitafti et al. [17] provide the energy efficient next hop selection algorithm, and the algorithm uses the hop count and link cost function to satisfy QoS requirements such as lower delay and reliable transmission.
To address the above-mentioned limitations, we propose an Enhanced version of MTARP (EMTARP) based on the MCDM method while considering the hop count, temperature and link quality.

3. Multi-Criteria Decision Making (MCDM) Method

3.1. Analytic Hierarchy Process (AHP)

The AHP [18] is one of MCDM methods that was originally developed by Prof. Thomas L. Saaty. The AHP is supposed to calculate the weights of the multiple criteria according to its relative importance to optimize decision making considering qualitative, quantitative and conflicting factors. The main benefits of using AHP are as given below
  • In AHP, the importance of each criterion becomes clear because the objective of decision is organized into a hierarchical structure.
  • The inconsistency between alternatives can be checked through AHP.
  • There is no bias in the decision making.
Our protocol adopts the AHP approach to calculate the weight of proposed metrics. In order to determine the weights of them, the AHP uses the judgments of decision makers to form a decomposition of criteria into hierarchies.
Figure 3 shows the AHP hierarchy model. The objective of decision making is represented at the top of the hierarchy model. The below level of hierarchy model consists of multiple criteria taken into account as decision factors. The bottom level includes the set of neighbor nodes as decision alternatives.
Once the hierarchy model is constructed, the decision maker has to construct a pairwise comparison matrix in order to determine the relative importance among the decision factors. The pairwise comparison matrix is represented as a square matrix C given by [18],
C = C i j n n = C 11 C 12 C 13 C 21 C 22 C 23 C 31 C 32 C 33
where C i j indicates the relative importance between decision factor i and j. The decision maker determines the relative importance according to Table 1 [18]. For example, the row 1 column 2 of the matrix is filled with 5 if decision factor 1 is more strongly important than decision factor 2. In the opposite case, the row 1 column 2 of the matrix is filled with 1/5.

3.2. Simple Additive Weighting (SAW)

We can obtain the weights of each criteria using the AHP. However, the AHP does not use the value from actual measurement in the decision making process. Since our protocol needs to calculate a single routing cost, we need an additional method to normalize the actual value. To achieve this, we use the SAW method [19] with AHP. The objective of the SAW method is to calculate the weighted sum of performance ratings on each alternative. The SAW method performs the following two steps.
  • The first step is to evaluate the alternatives. Given the neighbor table as shown in Table 2, we must evaluate whether each criterion should be minimized or maximized to obtain a high rating. In this example, we assume that C 1 and C 2 should be minimized, and C 3 should be maximized.
  • The second step is to construct a normalized decision matrix. To do this, both C 1 and C 2 are normalized as [19],
    e i j = M i n ( C i j ) C i j
    where e i j is the normalized value corresponding to row i and column j. The M i n ( C i j ) indicates the minimum value of C i j . On the other hand, C 3 is normalized as [19],
    e i j = C i j M a x ( C i j )
    where the M a x ( C i j ) denotes the maximum value of C i j . The results of normalization are shown in Table 3.

4. EMTARP: System Model and Protocol Description

4.1. System Assumption

We assume that all nodes have the same transmission range and energy level initially. The maximum transmission range of a node is assumed to be r, and the maximum transmit power of a node cannot exceed the range of r considering the limited battery capacity of the WBAN device. We define two types of nodes: a static node and mobile node. The static node represents a node which is attached to the human body with no movements, and the mobile node represents a node which is attached to arms and legs. We construct a network with N sensor nodes and one sink node. Each sensor node is responsible for forwarding the data packet collected by itself or received from neighbor nodes to the sink node.

4.2. Proposed Routing Metrics

The detailed description of routing metrics at node i is as follows.
  • I d i : Unique identifier of node i.
  • H i : Number of hop count of node i to the sink node. This value is updated by exchanging the H E L L O packet with neighbor node.
  • T e m p i : Normalized temperature of node i. This value is computed by Equation (4) where T t h denotes the allowed threshold of the temperature [20] while T i does current temperature of node i. Note that we use the pennes bio heat equation [3] used in TARA [2] in order to estimate the current temperature T i . The main reason for the temperature rise is radio signals generated via wireless communication [21]. Since the radio signals generate electric and magnetic fields, which lead to radiation absorption, Specific Absorption Rate (SAR) is used in the pennes bio heat equation. Therefore, it is important to limit the number of wireless communications of a node which will reach the temperature threshold.
    T e m p i = T t h T i T t h
  • L i n k i , j : Normalized link quality between node i and j which was carried by H E L L O packet. This value is computed by Equation (5) where R S S I m i n indicates the minimum signal strength for packet transmission.
    L i n k i , j = R S S I i , j R S S I m i n R S S I i , j

4.3. Operation of EMTARP

The network topology is changed frequently by mobile nodes, and each node broadcasts a H E L L O packet in each time interval t in order to update the network topology. The H E L L O packet includes its own routing information: i d , H, T e m p , L i n k . When a node receives a H E L L O packet from its neighbor node, it creates or updates its neighbor table with the information in H E L L O packet. I d denotes a unique number of a node while H does the hop count to the sink node. T e m p denotes the temperature of a node and L i n k denotes the link quality which means signal strength when the H E L L O packet is received.

4.3.1. Description of Calculating Routing Cost

The following example illustrates the procedures for calculating routing cost as well as the next hop decision making process using the AHP and SAW method. As we described before, we first need to determine the pairwise comparison matrix to calculate the weights of each metric. The pairwise comparison matrix used in this example is given as
H T e m p L i n k H t e m p l i n k ( 1 1 / 3 1 / 2 3 1 2 2 1 / 2 1 )
After the pairwise comparison matrix is determined, the next step is to compute the priority vector, which is the normalized eigen vector of the matrix. In order to obtain an eigen vector, we need to normalize the pairwise comparison matrix as follows [18],
C i j ¯ = C i j i = 1 n C i j
The eigen vector of decision factor i is obtained as [18],
v i = j = 1 n C i j ¯ n
where v i is the priority vector of decision factor i. Equation (9) shows the result of calculations. The result column indicates the priority vector of each decision factor. As shown in Equation (9), the priority vector of T e m p is the highest. This means decision factor T e m p performs a major role in the multi-criteria decision making process.
H T e m p L i n k R e s u l t H t e m p l i n k ( 1 1 / 3 1 / 2 3 1 2 2 1 / 2 1 ) ( 0.164 0.539 0.297 )
However, the pairwise comparison matrix may not be consistent because it is determined by the decision maker’s judgments. Thus, Ratio Consistency ( C R ) is a parameter used for checking whether the pairwise comparison matrix is determined properly or not. The C R is obtained as [18],
C R = C I R I
where R I is the random index proposed by Oakridge laboratory and these values are shown in Table 4. C I is the consistency index; this value is calculated as [18],
C I = λ m a x n n 1
where
λ m a x = j = 1 n ( v j i = 1 n X i j )
The C R 0.1 indicates that the pairwise comparison matrix is consistent. Otherwise, the decision maker must re-define the pairwise comparison matrix.
In this example, we give more relative importance to t e m p metric than other metrics because the main objective of the proposed protocol is to prevent the temperature rise of the node. The l i n k metric is considered as the second important criteria while the H metric is the least important criteria. Note that, the eigen vector denotes the weight of criteria so the sum of eigen vectors must be 1.0. Once the weights of the metrics are calculated, the next step is to normalize the actual value using the SAW method. The neighbor table used in this example is given below in Table 5.
In the given neighbor table, we have to evaluate whether the metrics should be minimized or maximized to get a high rating. In the proposed protocol, both H metric and T e m p metric should be minimized according to Equation (2), and the L i n k should be maximized according to Equation (3). Table 6 shows the results of normalization.
Once the normalization of each value is finished, the next step is to construct a weighted normalized decision matrix. The weighted normalized value is obtained as,
W i j = e i j v i
where W i j denotes the weighted normalized value. The e i j denotes the normalized value of each alternative and the v i is the weight of criteria i as shown in Equation (9). Table 7 shows the weighted normalized decision matrix.
The final step is to select the best alternative. We can simply calculate the final score and rating by adding the weighted normalized value of each criteria. Table 8 shows the final score and rating, and we can judge that N2 is the best alternative.

4.3.2. Next Hop Selection Algorithm

The main component of the proposed protocol is the next hop selection scheme. Actually, the next hop selection scheme does not require complicated algorithms. According to Algorithm 1, each node selects the best next hop based on the routing cost. At line 6, the next hop which has the highest routing cost is selected, such as greedy forwarding. The routing cost is calculated in the C o s t F u n c t i o n , and it requires three routing metrics: H i , T i , L i n k i . The objective of this function is to find the best next hop considering multiple metrics, and it computes a single routing cost. The detailed procedures for calculating routing cost are described in the above subsection.
Algorithm 1 Next hop selection process
 1: H i = Hop count from node i to destination
 2: T i = Normalized temperature of node i
 3: L i n k i = Normalized link quality between a source node and node i
 4: C o s t F u n c t i o n = A Function to compute a routing cost using MCDM method
 5: for i 1 , n do
 6:   N e x t H o p a r g M a x i n ( C o s t F u n c t i o n ( H i , T i , L i n k i ) )
 7: end for

5. Performance Evaluation

5.1. Simulation Environment

We evaluate the performance of two protocols: MTARP and EMTARP, using the network simulator OPNET modeler version 18.7. Even though M-ATTEMPT and MTARP are the only comparative protocols with EMTARP in the aspects of mobility and temperature aware properties, the comparison with M-ATTEMPT is not observed since MTARP shows better performance than M-ATTEMPT already. The simulation parameters are summarized in Table 9. The network size is set to 2 m × 2 m. The number of nodes constituting the network is 25, the number of mobile nodes is 10, and the number of sinks is 1. All nodes are deployed in the network while considering the human body. Moreover, the sink is placed at the center of the network. The transmission range of nodes is set to 30 cm. The temperature estimation model of TARA is used to estimate the temperature of nodes. The temperature threshold is set to 43 °C [20]. We define a node which exceeds the threshold as a hot spot. The mobile node moves every 3 s as to describe slow walking. HELLO packets are propagated to neighboring nodes every 5 s. We performed the simulation 100 times with 95% confidence interval.

5.2. Simulation Scenario

In order to compare the performance of two protocols, we observe three performance metrics: the packet delivery ratio, the end-to-end delay, and the hot spot ratio. We simulate these protocols under two different scenarios in order to study the efficiency of the MCDM method. Each scenario is described below.
  • Scenario 1 (case 1): In this scenario, the network consists of common medical sensors such as temperature and blood pressure sensors. Therefore, it is most important to prevent the temperature rise of the nodes rather than guarantee the low end-to-end delay and the high reliability. Given this fact, the pairwise comparison matrix can be determined as below.
    H T e m p L i n k R e s u l t H t e m p l i n k ( 1 1 / 4 1 / 2 4 1 3 2 1 / 3 1 ) ( 0.137 0.623 0.240 )
    In the above matrix, we determined the scales using Table 1 in order to set the weight of T e m p to be highest. Note that, in Table 1, number 4 denotes “moderately to strong” and number 3 denotes “moderate importance”.
  • Scenario 2 (case 2): In this scenario, the network consists of critical medical sensors such as Electromyography, Electroencephalography, and Electrocardiography sensors. Thus, it is necessary to prevent the delay and loss of data in the forwarding process. Based on this, we set the pairwise comparison matrix as follows.
    H T e m p L i n k R e s u l t H t e m p l i n k ( 1 1 / 2 1 / 3 2 1 1 3 1 1 ) ( 0.170 0.387 0.443 )
    Unlike scenario 1, we set the scale of l i n k to be highest in order to increase the reliability of the transmission. It may be noted that number 2 denotes “equally to moderately” and number 1 denotes “equal importance” as shown in Table 1. In addition, we set the scale of l i n k and t e m p as “equal importance” so as not to neglect preventing the temperature rise.

5.3. Simulation Results

5.3.1. Hot Spot Ratio

In this simulation, we evaluate the hot spot ratio of two protocols varying traffic bit rate and hello packet interval. Hot sport ratio indicates how many nodes among all nodes become hot spots during simulation. The purpose of this simulation is to measure how effectively comparative protocols can prevent the temperature rise while maintaining the other performance metrics: packet delivery ratio and end-to-end delay. Thus, it is important to determine the weight of the temperature metric efficiently to prevent the performance degradation of other metrics.
As illustrated in Figure 4a, the hot spot ratios of two protocols gradually increase as traffic bit rate increases. Even though two protocols perform load distribution based on the temperature of neighbor node, there are some performance differences. Especially, the hot spot ratio of MTARP becomes higher and higher as the traffic bit rate increases. The reason is that each source node tries to forward the data packet to a node which locates near to the destination rather than a node with lower temperature. It is brought that the weight of the hop count metric is higher than other metrics. On the other hand, if the temperature of the node with lower hop count is high, it will not be selected as a next hop. However, higher traffic load makes it difficult to prevent the temperature rise of the node with lower hop count.
On the other hand, EMTARP determines the relative importance of the temperature metric according to the type of nodes constituting the network. From Figure 4, we can observe that the hot spot ratio of case 1 is lower than case 2 because the weight of the temperature metric is higher than that of case 2. Based on this result, it is required to increase the relative importance of the temperature metric if we want to prevent the temperature rise of the node. However, the objective of our protocol is to improve the overall performances by determining the relative importance of the metrics efficiently. Especially, if the network consists of critical medical sensors, we have to increase the weight of the link metric to prevent the packet loss due to node movement. However, the hot spot ratio may affect the packet delivery ratio and end-to-end delay because the number of available routing paths decrease as the number of hot spot increases. These side effects are described together in the following subsection.
In addition, the hello packet interval also affects the hot spot ratio. In Figure 4b, we can see that all comparative protocols show the best performance when the hello packet interval is set to 5 s. Since the neighbor table is frequently updated as the hello packet interval is shorter, it is advantageous to be sensitive to the temperature rise of the neighbor node. However, as mentioned before, since the temperature rise of the node is most influenced by radio signals, the hot spot ratio increases as the hello packet is transmitted frequently. On the other hand, if the hello packet interval is set to long, it is difficult to respond quickly to the temperature rise of the neighbor node, so that the hot spot ratio increases gradually.

5.3.2. Packet Delivery Ratio

In the previous subsection, we argued that hot spot ratio will affect packet delivery ratio because the number of available routing paths decreases as the hot spot ratio increases. Especially, since the number of nodes constituting WBAN is very small, the influence of hot spot ratio on the packet delivery ratio will be great.
Table 10 illustrates the packet loss ratio with increasing traffic bit rate. Obviously, case 2 of EMTARP shows the best performance in Figure 5a because the weight of link metric is higher than other metrics. More specifically, if the selected next hop moves out the transmission range of the source node, MAC layer could not receive any ACK for the retransmissions. This implies that the retry counts for packet will reach limitation of MAC. Since both MTARP and case 1 of EMTARP try to forward the data packet to the node with lower hop count or lower temperature, the performance is lower than in case 2 of EMTARP. However, it is notable that the ratio of no available node sharply increases as the traffic bit rate increases in case 2 of EMTARP. The reason is that the traffic load will be concentrated on the stable node as the traffic bit rate increases so the node becomes a hot spot quickly and the number of available routing paths becomes insufficient. As a result, the performances of case 1 and case 2 do not show great difference even though the weight of link metric in case 2 is the highest. Figure 5c supports this claim that as the hot spot ratio increases, the number of available nodes and the packet delivery ratio decrease together.
In addition, the hello packet interval affects the packet delivery ratio. In Figure 5b, we can see the best performance when the hello packet interval is set to 5 s. Since we set the mobility interval to 3 s, even if the hello packet interval is set to 5 s, it is unlikely that the node set to the next hop will move out of the communication range of the source node. Therefore, frequent sending of unnecessary hello messages leads to an increase in the hot spot ratio, which degrades performance. On the other hand, as the hello packet interval increases, the node selected as a next hop can move out of the transmission boundary of the source node because the node moves more frequently than the neighbor table update rate.

5.3.3. End-To-End Delay

The hot spot ratio also affects the end-to-end delay because the processing delay will increase on a specific node as the number of available paths decreases. In this simulation, we set the data processing rate as 15,000 bits per second considering the limited hardware performance of WBAN devices.
As shown in Figure 6a, the end-to-end delay is higher as the traffic bit rate increases. MTARP shows the best performance since it has the highest weight of hop count, however, the performance of two protocols does not reveal great difference. The reason is related to the hot spot ratio. Since the MTARP tries to forward the data packet to the node with lower hop count, the node becomes a hot spot quickly. Accordingly, as the number of available routing paths decreases, the load distribution will not be achieved efficiently. Therefore, the data processing delay gradually increases as the traffic bit rate increases. Figure 6c shows the performance change with hot spot ratio. It should be noted that the performance difference of the comparative protocols is not large when the hot spot ratio is the same. The reason is that, even though the weight of hop count of MTARP is higher than other protocols, the load distribution over temperature is not good.
The hello packet interval also affects the end-to-end delay. Figure 6b shows that when the hello packet interval is set low, the processing delay increases because the hello packet is transmitted frequently. However, if the hello packet interval is set high, the end-to-end delay due to retransmission increases because the position change of the node cannot be recognized quickly.
In conclusion, we can reduce the end-to-end delay by increasing the weight of hop count metric. However, the actual performance is not great because the data processing delay will increase when the traffic load is concentrated on the node with lower hop count. In addition, additional performance degradation occurs when the hot spot ratio increases because it is hard to perform load distribution as the number of available routing paths decreases. Therefore, we have to consider the temperature rise of the node more significant than the hop count metric.

6. Conclusions

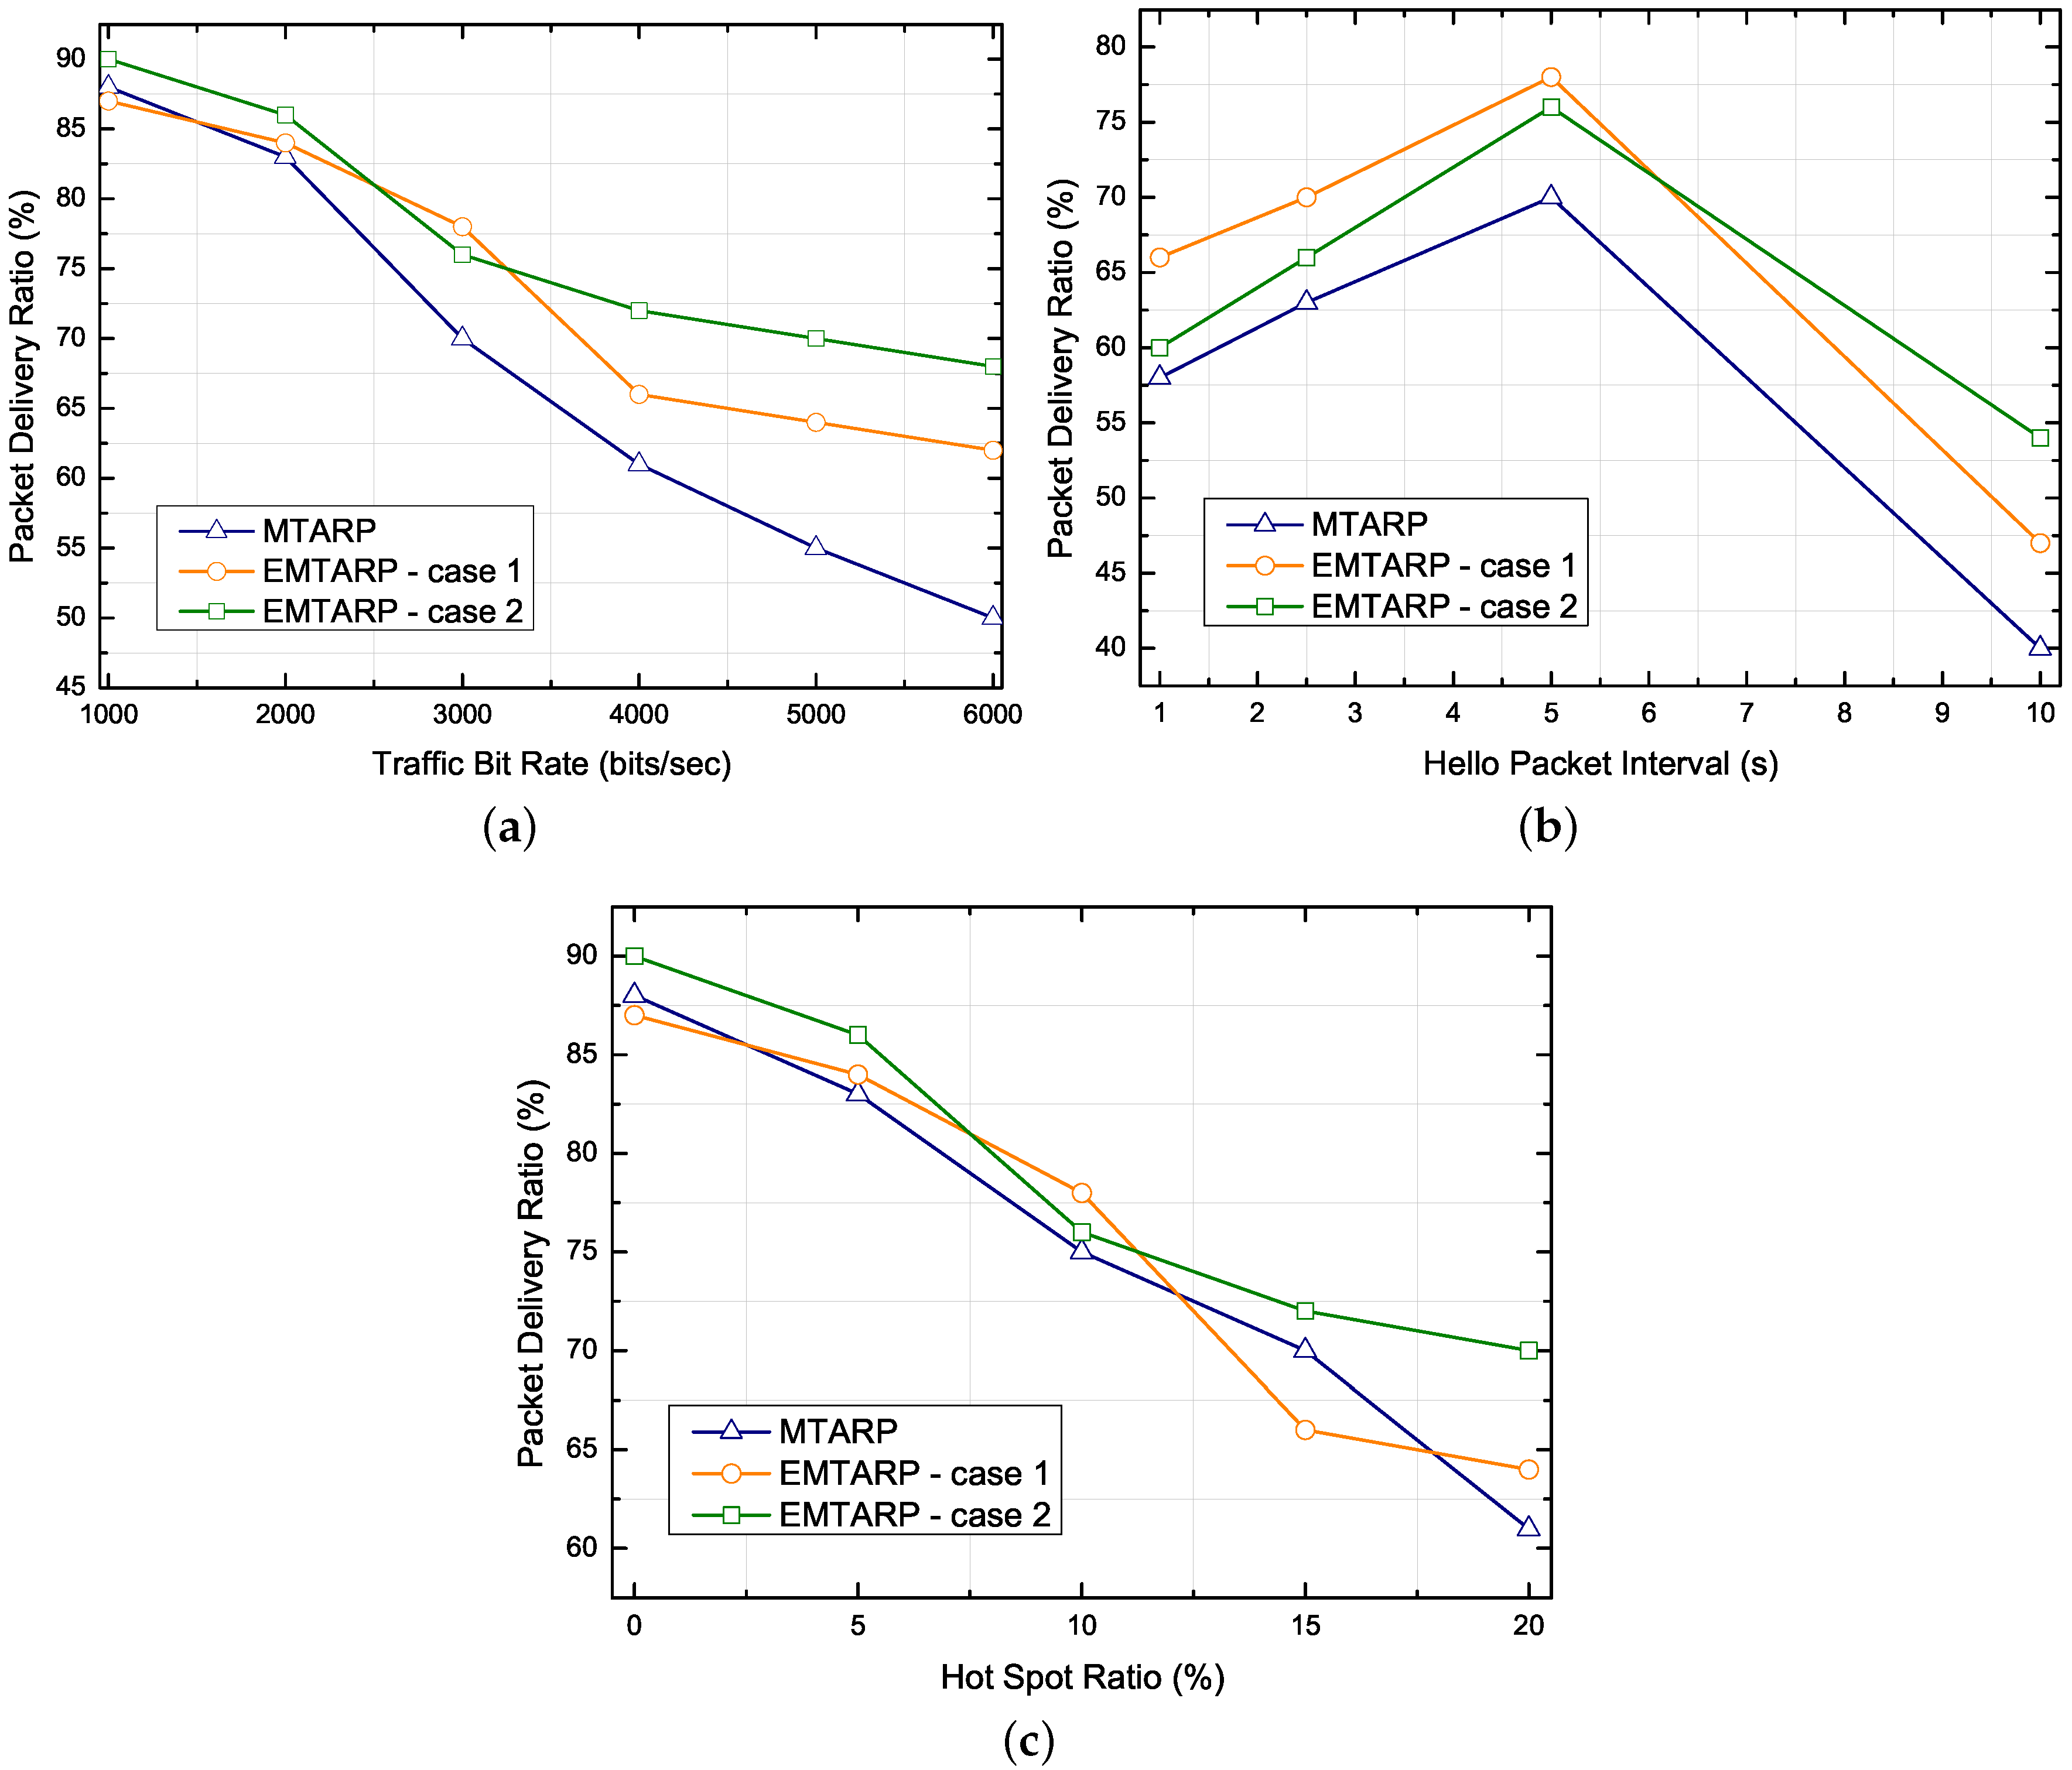
In this paper, we propose an enhanced mobility and temperature-aware routing protocol based on the MCDM method to improve network performance by adjusting the weights of each routing metric. In the proposed scheme, we exploit three routing metrics such as hop count, temperature and link quality and calculate the weights of each metric using AHP. In addition, we studied a weighted sum of performance ratings on each alternative using the SAW method. The simulation is carried out under two scenarios to prove that the MCDM method can achieve good performance while considering transmission delay and data loss. The simulation results conclude that the proposed protocol shows better performance than previous studies in terms of hot spot ratio and packet delivery ratio because our study sets the relative importance of each metric’s flexibly according to the applications.
In the future, we will determine the scale of proposed metrics dynamically to adapt the network conditions. Although AHP is a logical way to help the relative importance of alternatives, there are irregularities in ranking because the decision maker determines the relative importance between alternatives. In addition, the irregularities in ranking depend on the conditions of the future because the actual value of alternatives changes over time. To make a good decision, we will study dynamic decisions in our future work.

Author Contributions

B.-S.K., S.U., K.H.K. and K.-I.K. contributed to protocol design and detailed algorithm. B.S. and F.A.-O. contributed to the performance analysis.

Funding

This research was supported by Basic Science Research Program through the National Research Foundation of Korea funded by the Ministry of Education (2018R1D1A1B07043731). In addition, this work was supported by Zayed University Research Office, Research Cluster Project #R18027 and by Human Resources Program in Energy Technology of the Korea Institute of Energy Technology Evaluation and Planning (KETEP), granted financial resource from the Ministry of Trade, Industry & Energy, Republic of Korea (No. 20174030201440).

Conflicts of Interest

The authors declare no conflict of interest.

References

  1. Ullah, S.; Higgins, H.; Braem, B.; Latre, B.; Blondia, C.; Moerman, I.; Saleem, S.; Rahman, Z.; Kwak, K.S. A comprehensive survey of wireless body area networks. J. Med. Syst. 2012, 36, 1065–1094. [Google Scholar] [CrossRef] [PubMed] [Green Version]
  2. Tang, Q.; Tummala, N.; Gupta, S.K.; Schwiebert, L. TARA: Thermal-aware routing algorithm for implanted sensor networks. In International Conference on Distributed Computing in Sensor Systems; Springer: Berlin/Heidelberg, Germany, 2005; pp. 206–217. [Google Scholar]
  3. Pennes, H.H. Analysis of tissue and arterial blood temperatures in the resting human forearm. J. Appl. Physiol. 1948, 1, 93–122. [Google Scholar] [CrossRef] [PubMed]
  4. Bag, A.; Bassiouni, M.A. Energy efficient thermal aware routing algorithms for embedded biomedical sensor networks. In Proceedings of the 2006 IEEE International Conference on Mobile Adhoc and Sensor Systems (MASS), Vancouver, BC, Canada, 9–12 October 2006; pp. 604–609. [Google Scholar]
  5. Bag, A.; Bassiouni, M.A. Hotspot preventing routing algorithm for delay-sensitive biomedical sensor networks. In Proceedings of the IEEE International Conference on Portable Information Devices 2007 PORTABLE07, Orlando, FL, USA, 25–29 March 2007; pp. 1–5. [Google Scholar]
  6. Kim, B.S.; Kim, K.I.; Shah, B. An Enhanced Temperature Aware Routing Protocol in Wireless Body Area Networks. In Proceedings of the 2018 IEEE 42nd Annual Computer Software and Applications Conference (COMPSAC), Tokyo, Japan, 23–27 July 2018; pp. 789–790. [Google Scholar]
  7. Kim, B.S.; Kim, K.H.; Kim, K.I. A survey on mobility support in wireless body area networks. Sensors 2017, 17, 797. [Google Scholar] [CrossRef] [PubMed]
  8. Javaid, N.; Abbas, Z.; Fareed, M.; Khan, Z.; Alrajeh, N. M-ATTEMPT: A new energy-efficient routing protocol for wireless body area sensor networks. Procedia Comput. Sci. 2013, 19, 224–231. [Google Scholar] [CrossRef]
  9. Kim, B.S.; Kang, S.; Lim, J.; Kim, K.H.; Kim, K.I. A mobility-based temperature-aware routing protocol for wireless body sensor networks. In Proceedings of the 2017 International Conference on Information Networking (ICOIN), Da Nang, Vietnam, 11–13 January 2017; pp. 63–66. [Google Scholar]
  10. Kim, B.S.; Kim, K.H.; Shah, B.; Kim, K.I. Mobility and Temperature Aware QoS Routing Protocol in Wireless Body Area Networks. In Proceedings of the 2017 International Conference on Computational Science and Computational Intelligence (CSCI), Las Vegas, NV, USA, 14–16 December 2017. [Google Scholar]
  11. Monowar, M.M.; Mehedi Hassan, M.; Bajaber, F.; Hamid, M.A.; Alamri, A. Thermal-aware multiconstrained intrabody QoS routing for wireless body area networks. Int. J. Distrib. Sens. Netw. 2014, 10, 676312. [Google Scholar] [CrossRef]
  12. Monowar, M.M.; Bajaber, F. On designing thermal-aware localized QoS routing protocol for in-vivo sensor nodes in wireless body area networks. Sensors 2015, 15, 14016–14044. [Google Scholar] [CrossRef] [PubMed]
  13. Bhangwar, A.R.; Kumar, P.; Ahmed, A.; Channa, M.I. Trust and Thermal Aware Routing Protocol (TTRP) for Wireless Body Area Networks. Wirel. Pers. Commun. 2017, 97, 349–364. [Google Scholar] [CrossRef]
  14. Ahmed, S.; Javaid, N.; Akbar, M.; Iqbal, A.; Khan, Z.A.; Qasim, U. LAEEBA: Link aware and energy efficient scheme for body area networks. In Proceedings of the 2014 IEEE 28th International Conference on Advanced Information Networking and Applications, Victoria, BC, Canada, 13–16 May 2014; pp. 435–440. [Google Scholar]
  15. Ahmed, S.; Javaid, N.; Yousaf, S.; Ahmad, A.; Sandhu, M.M.; Imran, M.; Khan, Z.A.; Alrajeh, N. Co-LAEEBA: Cooperative link aware and energy efficient protocol for wireless body area networks. Comput. Hum. Behav. 2015, 51, 1205–1215. [Google Scholar] [CrossRef]
  16. Ababneh, N.; Timmons, N.; Morrison, J. A cross-layer QoS-aware optimization protocol for guaranteed data streaming over wireless body area networks. Telecommun. Syst. 2015, 58, 179–191. [Google Scholar] [CrossRef]
  17. Ayatollahitafti, V.; Ngadi, M.A.; bin Mohamad Sharif, J.; Abdullahi, M. An efficient next hop selection algorithm for multi-hop body area networks. PLoS ONE 2016, 11, e0146464. [Google Scholar] [CrossRef] [PubMed]
  18. Saaty, T.L. Decision-making with the AHP: Why is the principal eigenvector necessary. Eur. J. Oper. Res. 2003, 145, 85–91. [Google Scholar] [CrossRef]
  19. Afshari, A.; Mojahed, M.; Yusuff, R.M. Simple additive weighting approach to personnel selection problem. Int. J. Innov. Manag. Technol. 2010, 1, 511. [Google Scholar]
  20. Greenhalgh, D.G.; Lawless, M.B.; Chew, B.B.; Crone, W.A.; Fein, M.E.; Palmieri, T.L. Temperature threshold for burn injury: An oximeter safety study. J. Burn Care Rehabil. 2004, 25, 411–415. [Google Scholar] [CrossRef] [PubMed]
  21. Movassaghi, S.; Abolhasan, M.; Lipman, J.; Smith, D.; Jamalipour, A. Wireless body area networks: A survey. IEEE Commun. Surv. Tutor. 2014, 16, 1658–1686. [Google Scholar] [CrossRef]
Figure 1. Next hop selection in the two hops ahead algorithm.
Applsci 08 02245 g001
Figure 2. Next hop selection in Mobility and Temperature-aware Routing (MTR).
Applsci 08 02245 g002
Figure 3. Analytic Hierarchy Process (AHP) hierarchy model.
Applsci 08 02245 g003
Figure 4. Performance comparison for difference traffic bit rate and hello packet interval. (a) Impact of varying traffic bit rate on hot spot ratio, (b) Impact of varying hello packet interval on hot spot ratio.
Applsci 08 02245 g004
Figure 5. Performance comparison for difference traffic bit rate, hello packet interval and hot spot ratio. (a) Impact of varying traffic bit rate on PDR, (b) Impact of varying hello packet interval on PDR, (c) Impact of hot spot ratio on PDR.
Applsci 08 02245 g005
Figure 6. Performance comparison for difference traffic bit rate, hello packet interval and hot spot ratio. (a) Impact of varying traffic bit rate on end-to-end delay, (b) Impact of varying hello packet interval on end-to-end delay, (c) Impact of hot spot ratio on end-to-end delay.
Applsci 08 02245 g006
Table 1. Scales for pairwise comparison matrix.
AHP Scale ( C ij )RatingReciprocal
Equal importance11/9
Equally to moderately21/8
Moderate importance31/7
Moderately to strong41/6
Strong importance51/5
Strongly to very strong61/4
Very strong importance71/3
Very strong to extremely81/2
Extreme importance91
Table 2. Example of a neighbor table.
Alternative C 1 C 2 C 3
N1132340.8
N272030.4
N392700.5
N4163000.5
Table 3. Example of a normalized decision matrix.
Alternative C 1 C 2 C 3
N10.5380.8671
N2110.500
N30.7770.7510.625
N40.4370.6760.625
Table 4. Random index (RI).
n1, 2345678910
RI00.580.901.121.241.321.411.451.49
Table 5. Neighbor table.
IdHTempLink
N1423.40.6
N2233.20.4
N3321.10.5
N4428.91.0
Table 6. Normalized decision matrix.
IdHTempLink
N10.5000.9010.600
N210.6350.400
N30.66610.500
N40.5000.7301.000
Table 7. Example of a weighted normalized decision matrix.
AlternativeHTempLink
N10.0820.4850.178
N20.1640.3420.118
N30.1090.5390.148
N40.0820.3930.297
Table 8. Final score and rating.
IdHTempLinkFinal ScoreRating
N10.0820.4850.1780.7453
N20.1640.3420.1180.6244
N30.1090.5390.1480.7961
N40.0820.3930.2970.7722
Table 9. Simulation Parameters.
ParametersValues
Simulation time1800 s
Network size2 m × 2 m
Number of nodes30
Number of mobile nodes10
Number of traffic source5
Number of sink1
Data processing rate15,000 bits/s
Transmission range30 cm
Traffic modelIP traffic flow
MAC802.15.4
Mobility modelRandom waypoint
Pause time3 s
HELLO packet timer5 s
Temperature threshold43 °C
Table 10. The reasons for packet loss varying traffic bit rate.
ProtocolTraffic Bit Rate (bits/s)No Available Node (%)Retry Threshold Exceeded (%)
MTARP10000100
MTARP20001387
MTARP30001783
MTARP40002575
MTARP50003268
MTARP60004060
EMTARP-case 110000100
EMTARP-case 120001090
EMTARP-case 130001486
EMTARP-case 140002080
EMTARP-case 150002674
EMTARP-case 160003466
EMTARP-case 210000100
EMTARP-case 220001486
EMTARP-case 230002080
EMTARP-case 240002674
EMTARP-case 250003466
EMTARP-case 260004654

