Progressive Collapse Analysis of SRC Frame-RC Core Tube Hybrid Structure

1
School of Urban Construction, Yangtze University, Jingzhou 434023, China
2
School of Civil Engineering and Mechanics, Huazhong University of Science and Technology, Wuhan 430074, China
3
Wuhan Construction Engineering Group CO., LTD, Wuhan 430056, China
*
Author to whom correspondence should be addressed.
Appl. Sci. 2018, 8(11), 2316; https://0-doi-org.brum.beds.ac.uk/10.3390/app8112316
Submission received: 25 October 2018
/
Revised: 13 November 2018
/
Accepted: 15 November 2018
/
Published: 20 November 2018
(This article belongs to the Special Issue Computational Methods for Fracture)
Abstract
:Steel reinforced concrete (SRC) frame-reinforced concrete (RC) core tube hybrid structures are widely used in high-rise buildings. Focusing on the progressive collapse behavior of this structural system, this paper presents an experiment and analysis on a 1/5 scaled, 10-story SRC frame-RC core tube structural model. The finite element (FE) model developed for the purpose of progressive collapse analysis was validated by comparing the test results and simulation results. The alternate load path method (APM) was applied in conducting nonlinear static and dynamic analyses, in which key components including columns and shear walls were removed. The stress state of the beams adjacent to the removed component, the structural behavior including inter-story drift ratio and shear distribution between frame and tube were investigated. The demand capacity ratio (DCR) was applied to evaluate the progressive collapse resistance under loss of key components scenarios. The results indicate that the frame and the tube cooperate in a certain way to resist progressive collapse. The core tube plays a role as the first line of defense against progressive collapse, and the frame plays a role as the second line of defense against progressive collapse. It is also found that the shear distribution is related to the location of the component removed, especially the corner column and shear walls.
1. Introduction
Compared with traditional structural systems composed of steel or reinforced concrete members, steel reinforced concrete (SRC) frame-reinforced concrete (RC) core tube hybrid structure has a better combination of small sectional dimensions, higher strength, higher rigidity and resistance to corrosion, abrasion and fire. The SRC columns and RC core tube are rigidly connected by steel beams and composite floors. Benefiting from this connection and high stiffness of the core tube, most of the shear force caused by the horizontal load is assumed to be resisted by the core tube, and the lateral deformation can be restricted to an acceptable level. The vertical load of the building and partial overturning moment aroused by horizontal load is undertaken by the frame. Moreover, with the stiffness and resistance degeneration of the core tube under a strong earthquake, the frame will play the role of the second line of defence to resist shear force and avoid collapse. Hence, as a suitable and economical structure form of high-rise buildings, it is widely applied in the US, China, and Japan, especially in earthquake prone regions.
Due to the advantages of concrete-encased composite structure [1], there are extensive studies [2,3,4,5,6] focusing on its seismic performance. The research on progressive collapse has become of increasing interest in recent years, especially since the World Trade Center towers collapse following the terrorist attacks of 11 September 2001. The progressive collapse of a structure can be caused by the failure of structural components under unexpected loads including, car accidents, earthquakes, or explosions and so on. [7]. To study the response of structures under extreme conditions such as explosions and fire, some research has been carried out. A new analysis method for the progressive collapse analysis of a structure with consideration of both the non-zero initial condition and existing damage in structural members [8], and a new finite element model was proposed as a feasible tool to evaluate the fire response of composite floor systems [9]. Recently, the alternate load path method (APM) recommended by the current codes and manuals of practice [10,11] for anti-collapse design and analysis has been popular. The alternate load path method is easy to implement. In this method, the robustness of a structure is evaluated through removal of the key vertical components to determine whether the local damage may be absorbed by the remaining structural members and whether the structural system can bridge over the removed components.
In the literature, there have been extensive experimental studies focusing on progressive collapse behavior of reinforced concrete frame and steel frame structures subjected to the loss of key components [12,13,14,15,16,17]. The compressive arch action and catenary action were clearly observed in the experiments. Due to exorbitant cost and safety issues, numerical simulations are preferred for studying the progressive collapse resistance of structures [18,19,20,21,22,23], in which nonlinear static and dynamic analyses had been conducted [24,25,26,27,28,29].
As the two main components resisting the horizontal force aroused by earthquake, the frame and the core tube operate cooperatively with different stiffness. An unequal distribution of shear in the two components is produced and will affect the behavior of building structures against progressive collapse. To effectively prevent earthquake-induced structural collapse it is necessary to study a widely used structural system in high-rise buildings, SRC frame-RC core tube hybrid structures, focusing on progressive collapse behavior. Nevertheless, to date, limited related experimental and analysis work has been carried out on this particular structural system.
Based on the experiment recommend by reference [6], using the general purpose finite element package OpenSees [30,31], a numerical model is first developed in this paper which enables the non-linear progressive collapse analysis of high rise building. The proposed numerical model was validated by a pseudo-static test. The alternate load path method was applied in conducting nonlinear static and dynamic analyses, and robustness was studied under column and shear wall removal scenarios. The model accurately displayed the overall behavior, including inter-story drift ratio and shear distribution under sudden loss of key components and seismic waves input, which provided important information for additional design guidance on progressive collapse for the SRC frame-RC core tube hybrid structures.
2. Experiment Program
2.1. Details of Specimen
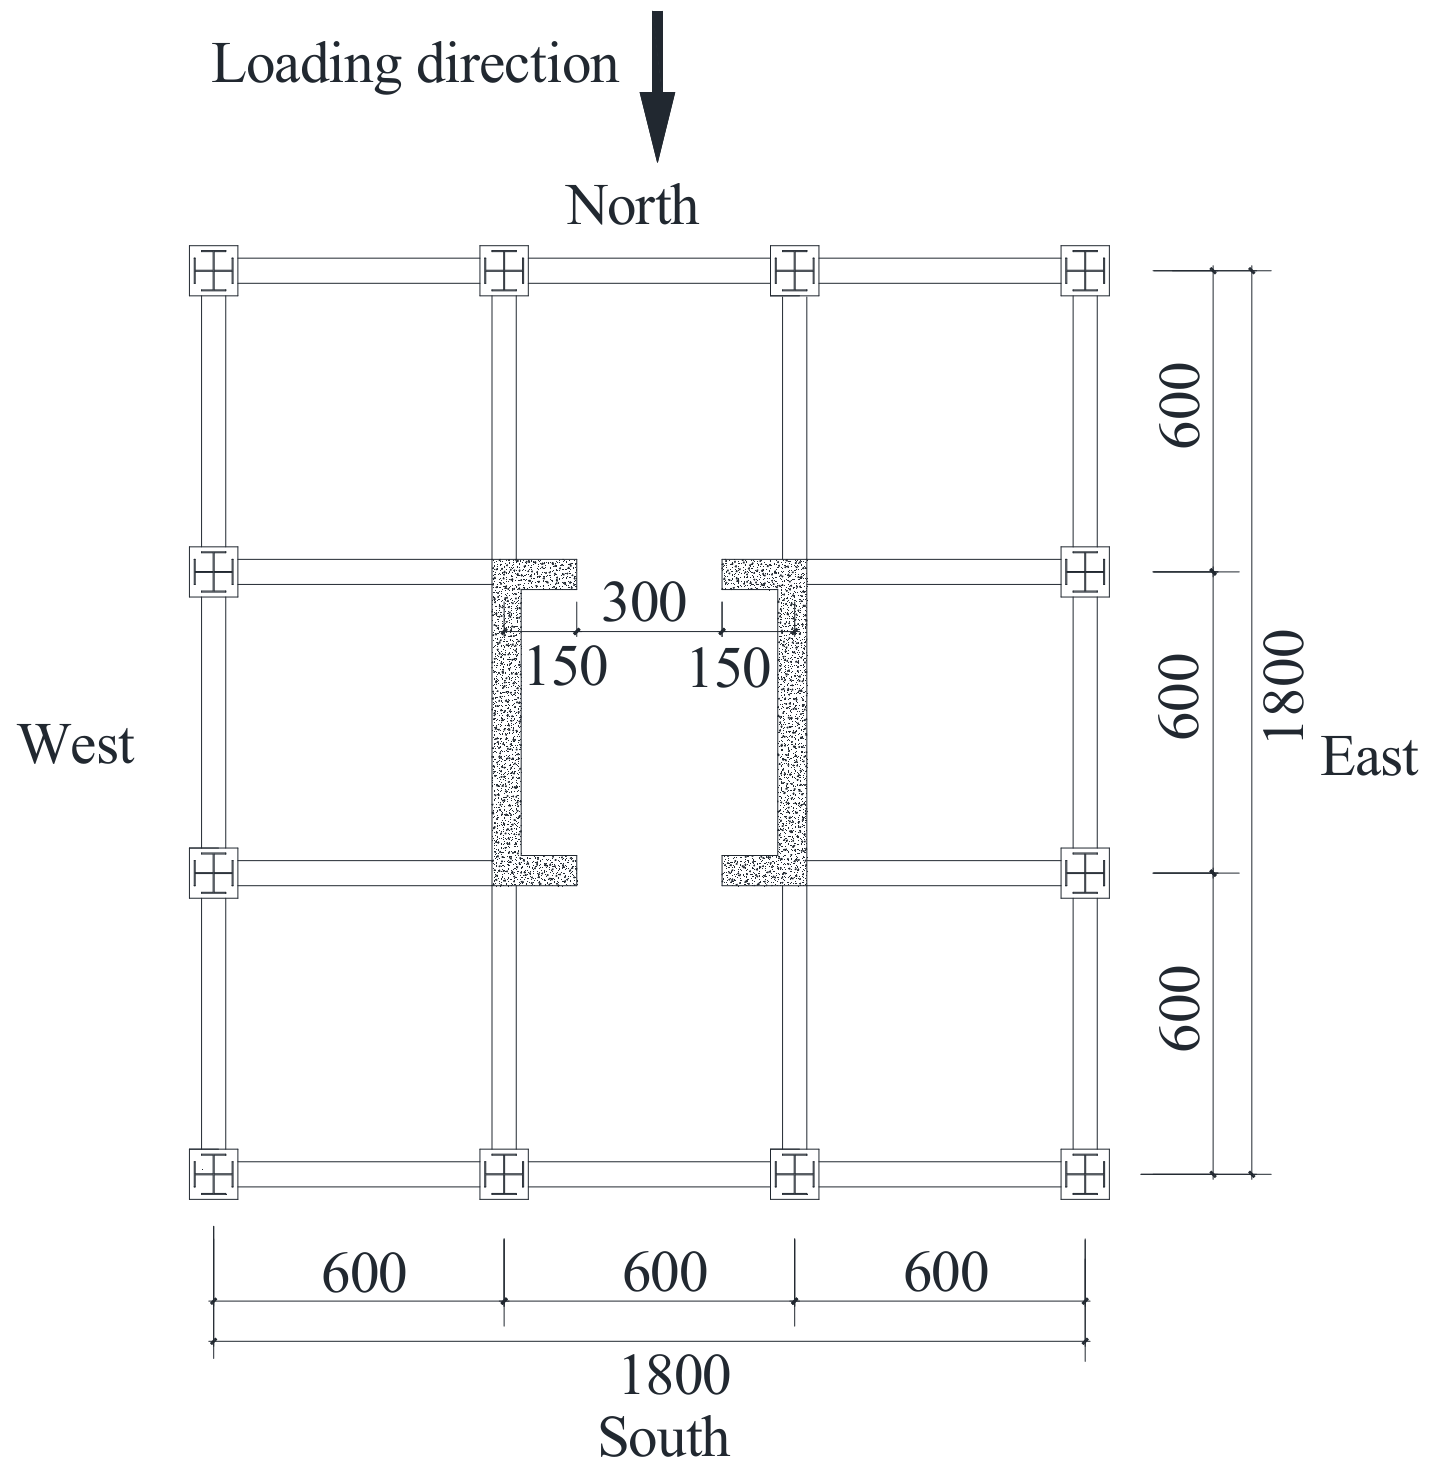
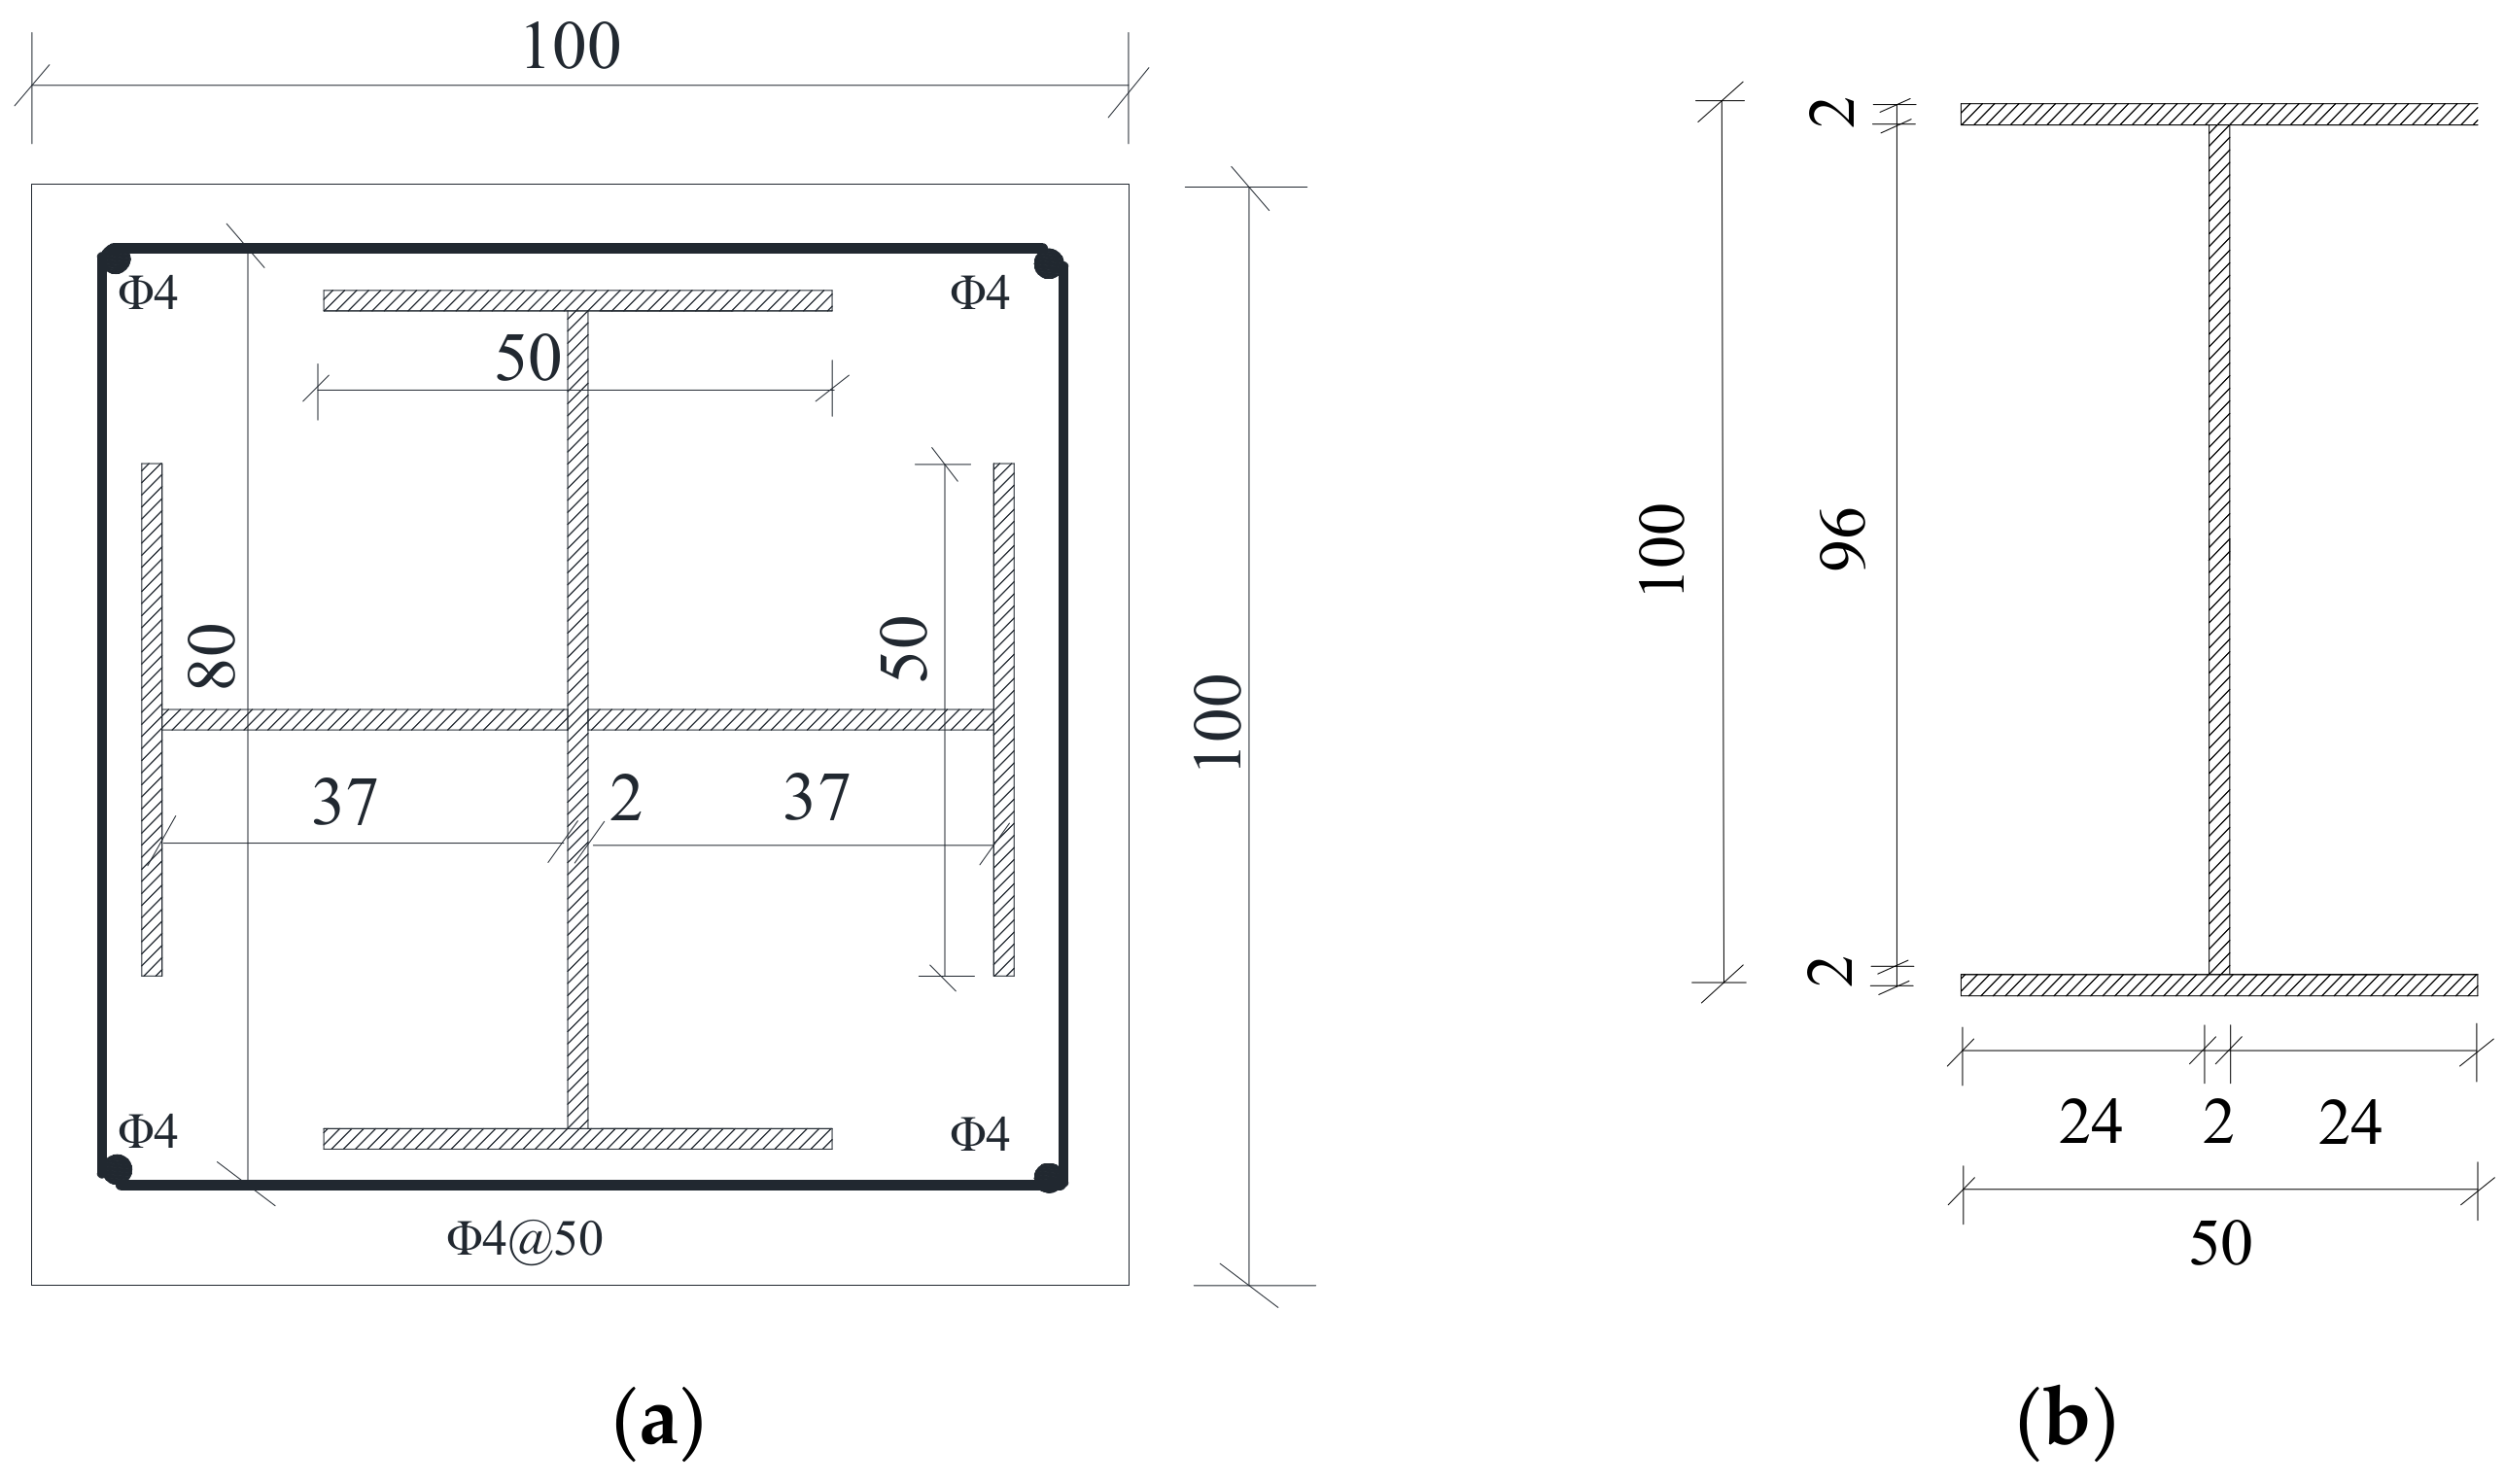
Based on the currently design codes and specifications in China [32,33,34], a 1/5 scaled, 10-story prototype building was designed and built [6]. The plane layout is shown in Figure 1, the dimension and reinforcement of core tube, columns and beams is shown in Figure 2 and Figure 3. The properties of concrete and steel are listed in Table 1 and Table 2. The similarity ratios of properties (elastic modulus, stress and strain) of concrete and steel are 1, which means the specimen and the prototype are in an equal strain state. So, the failure mode of specimen can truly reflect that of the prototype.
2.2. Test Setup and Procedure
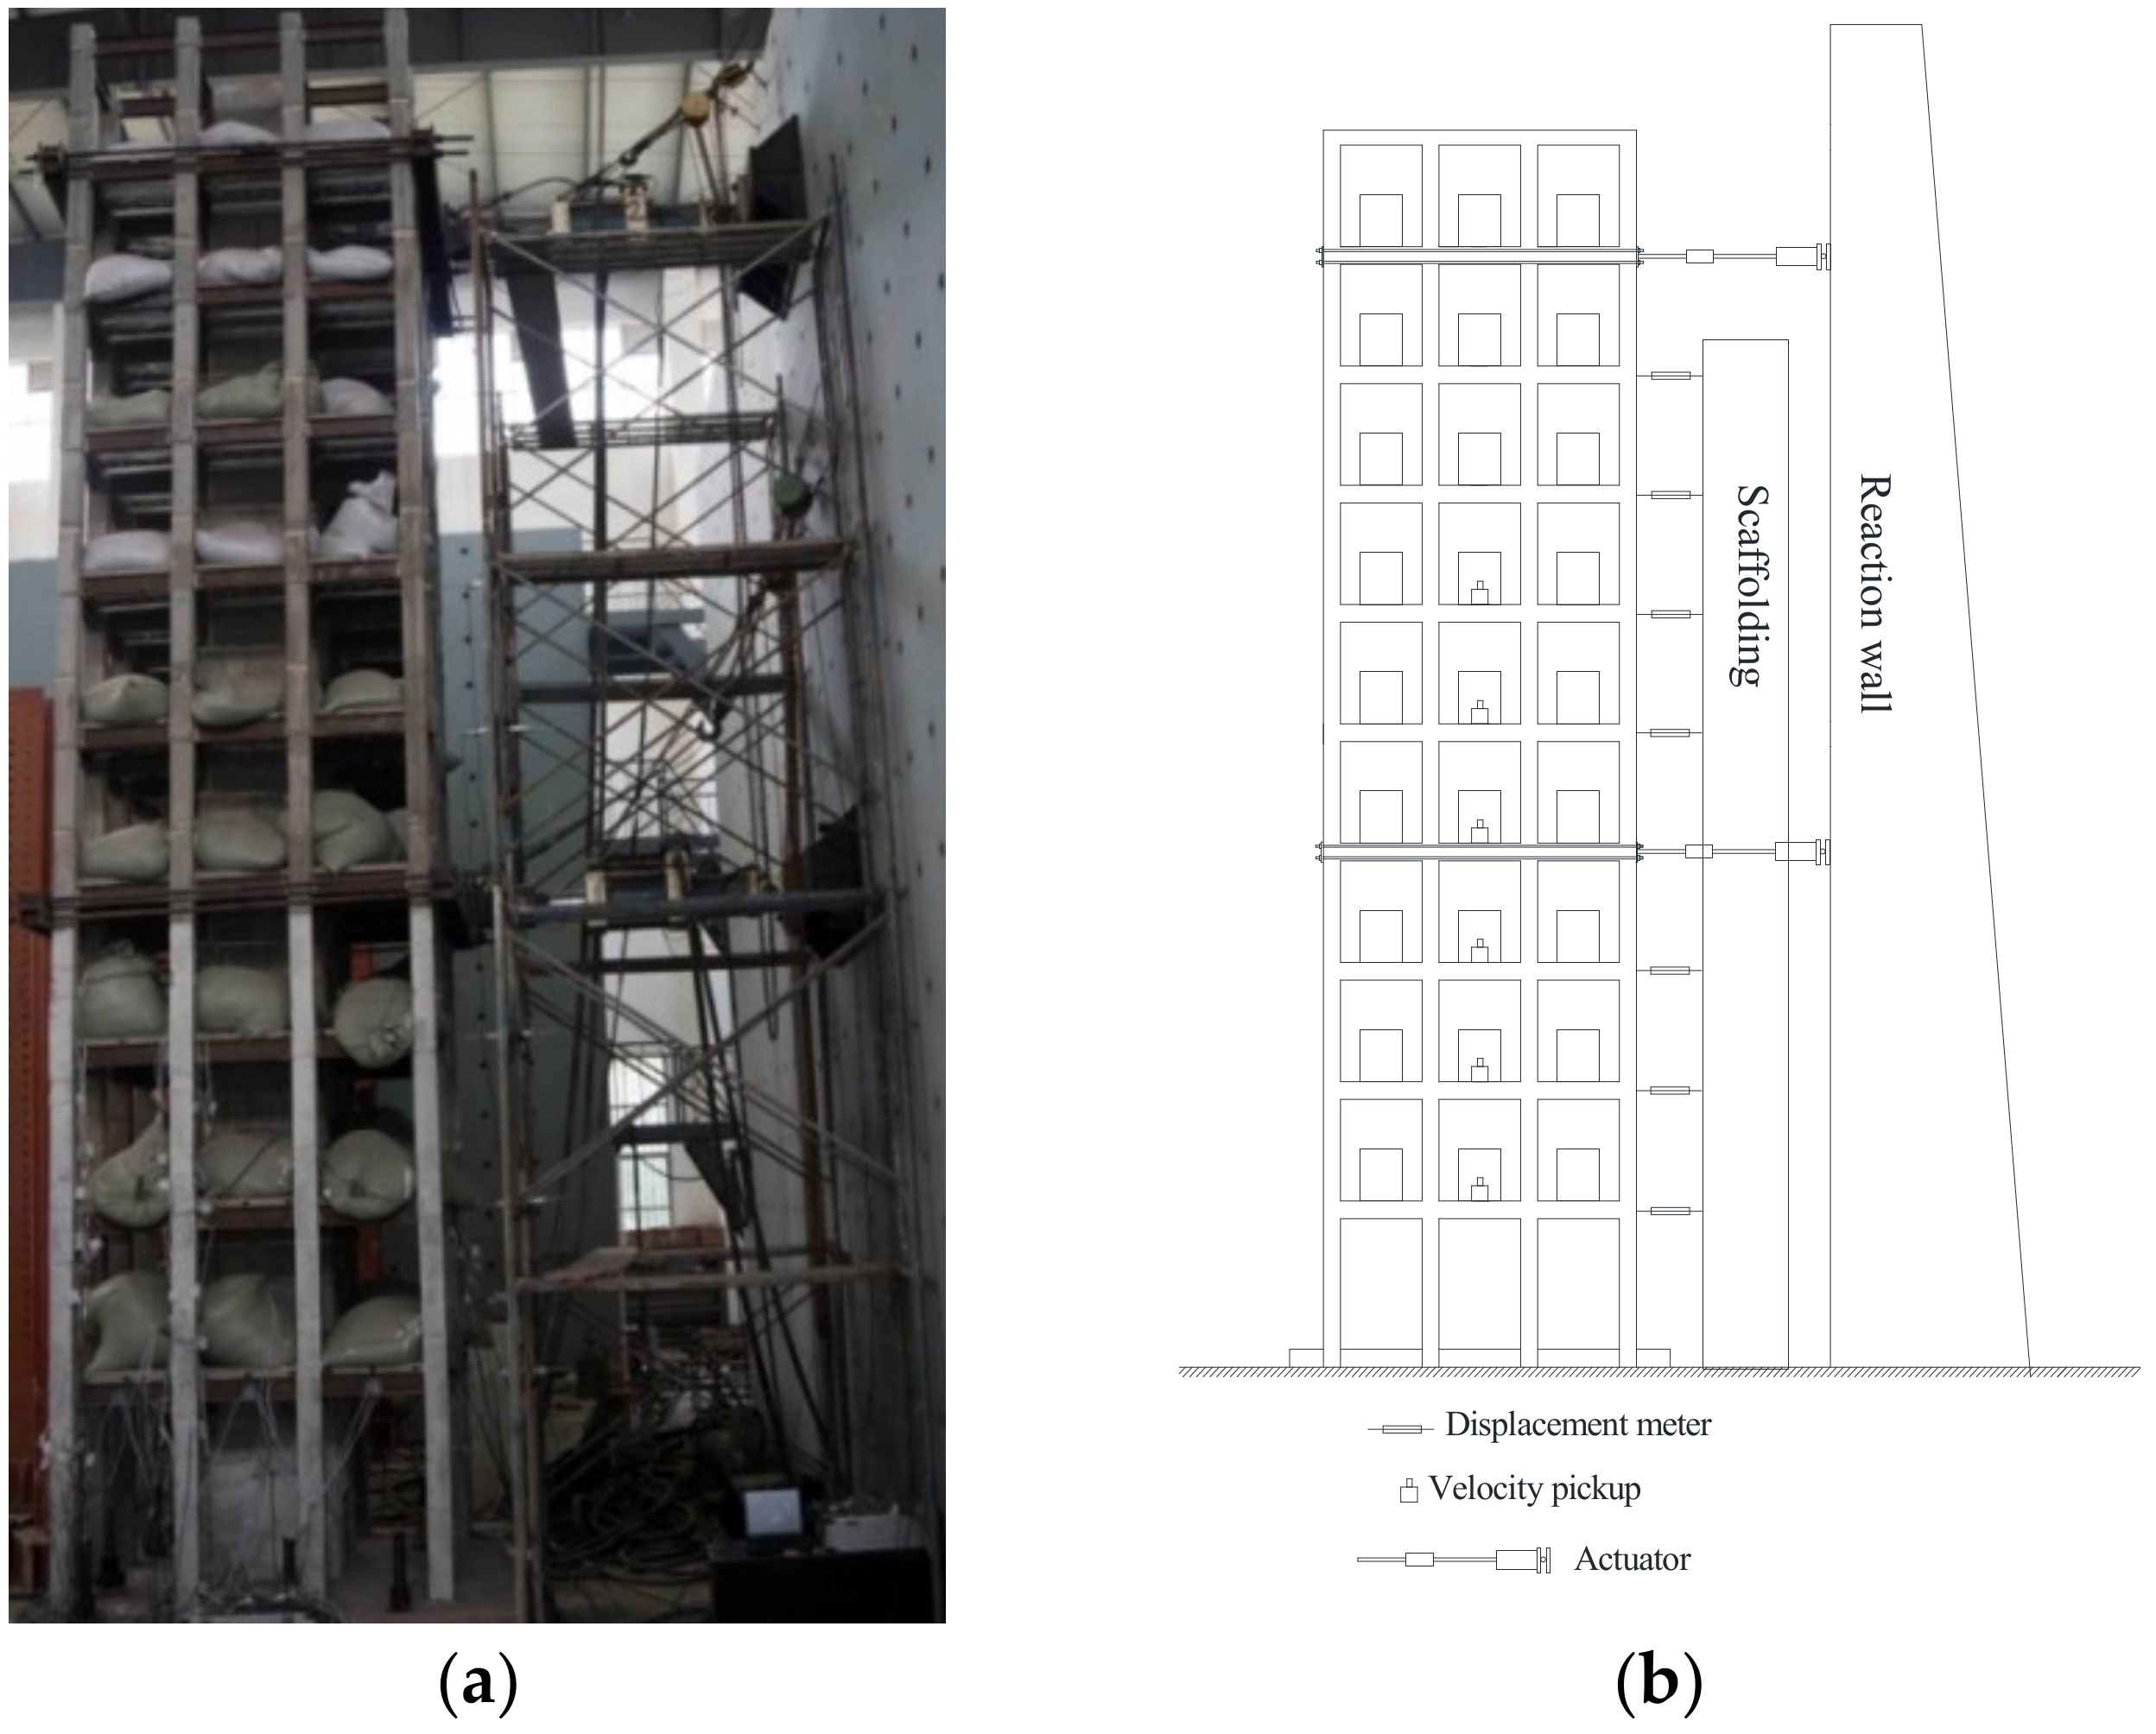
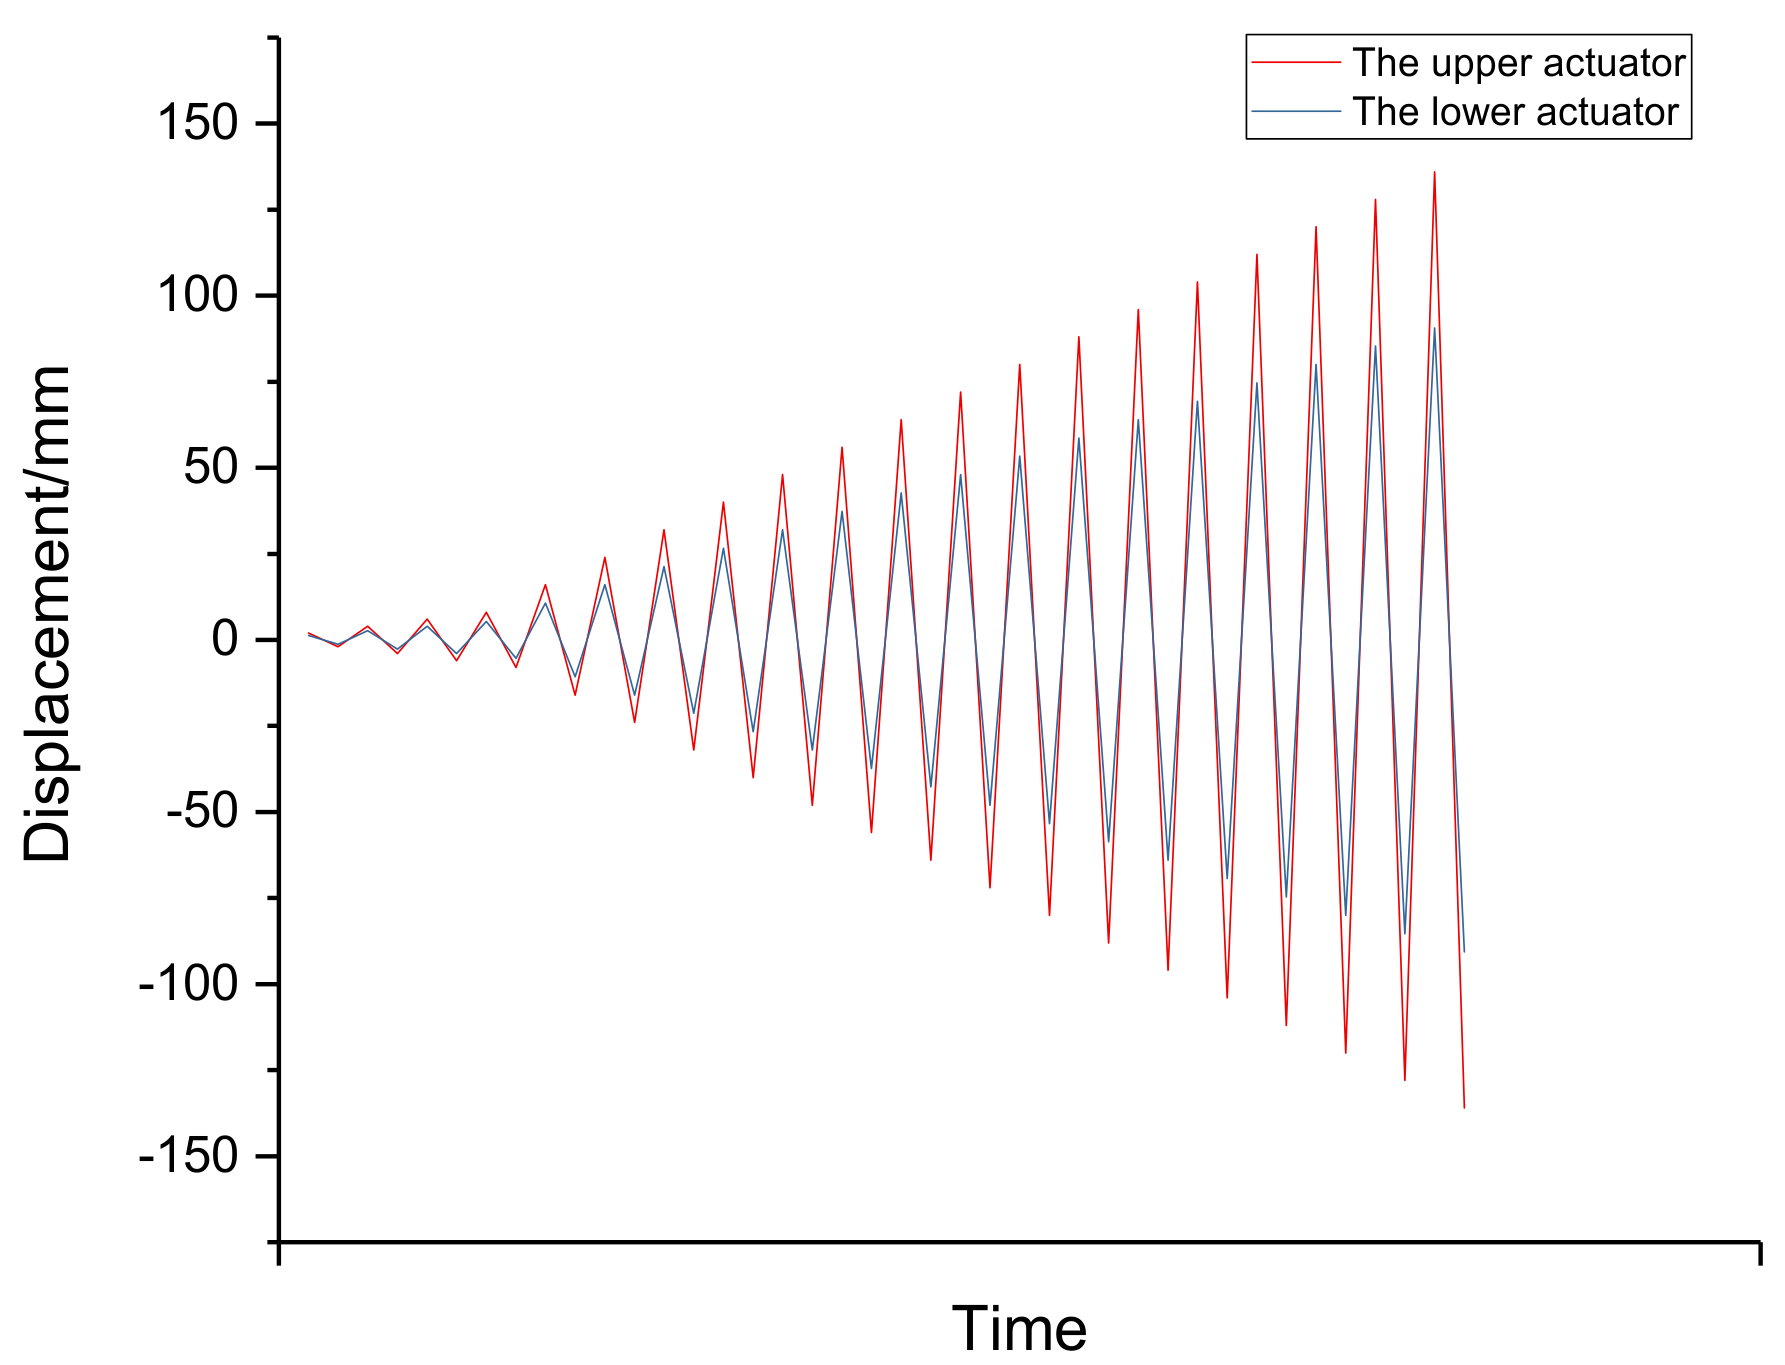
The test setup is shown in Figure 4. By controlling displacement, a pseudo static horizontal cyclic loading scheme was implemented in this test. The lateral load was applied by two hydraulic servo actuators at 4th and 9th floor respectively. Mode-superposition response spectrum method was adopted to control the amplitude of displacement and finally Δ9/Δ4 = 1.5:1. The vertical load was applied by sandbags on the floors. Based on the Load Code for the Design of Building Structures (GB50009-2012) [35], it was necessary to take the weight of infill walls into account, and the live load and dead load were taken as 2.0 kN/m2 and 1.6 kN/m2 respectively. The history of the loading program is shown in Figure 5.
2.3. Test Results
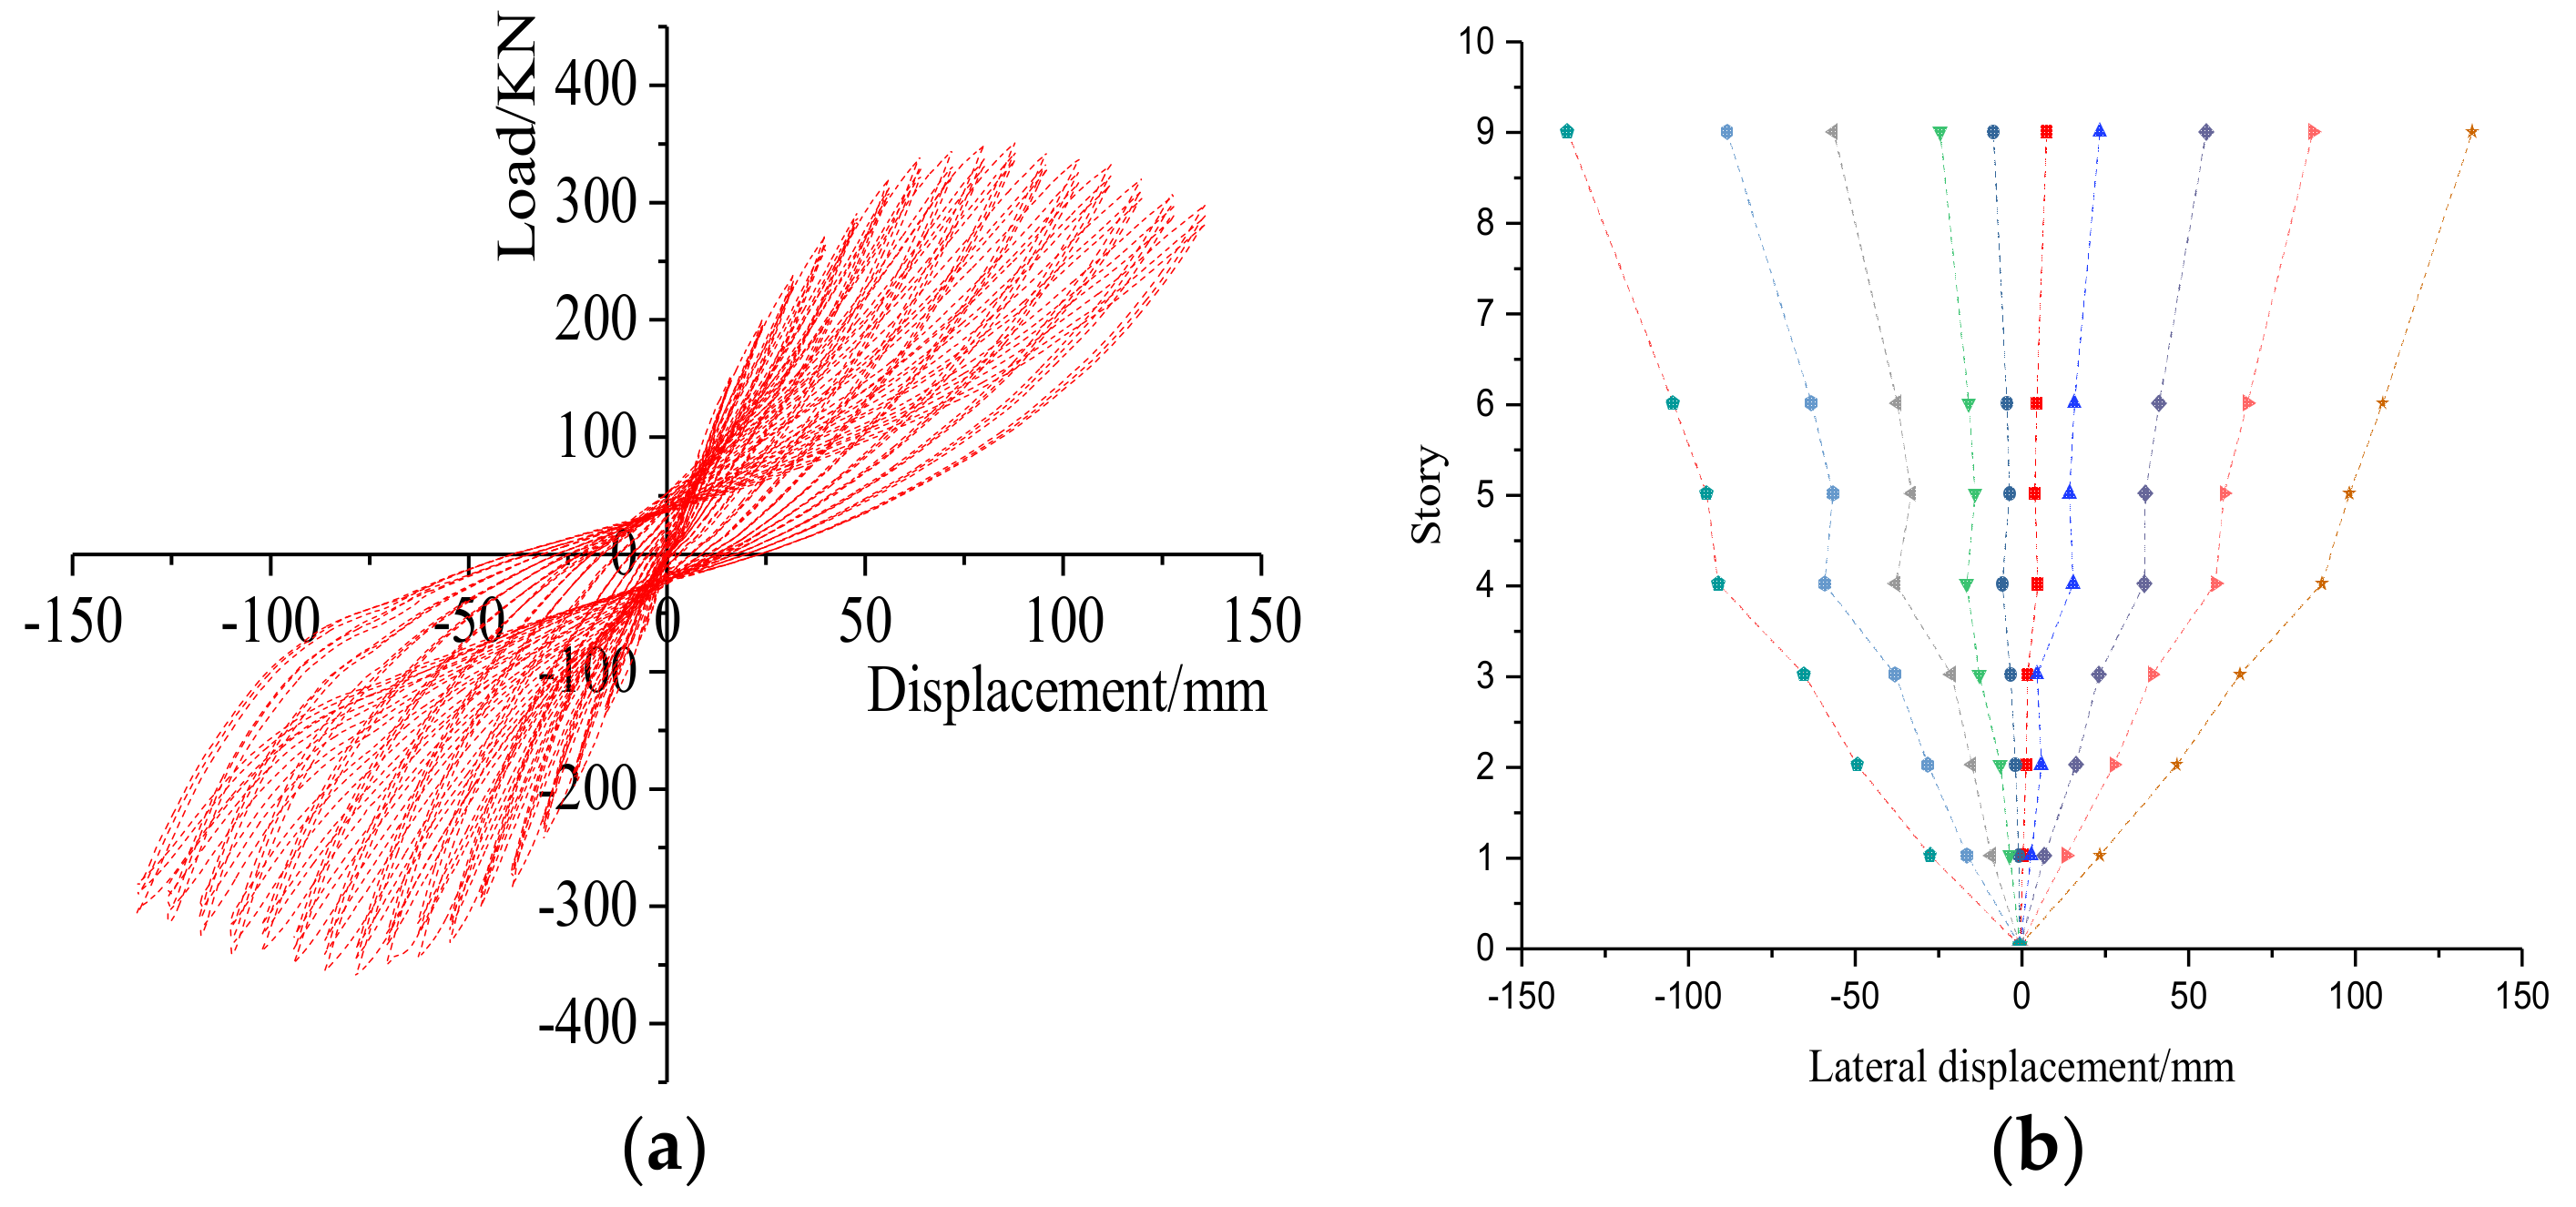
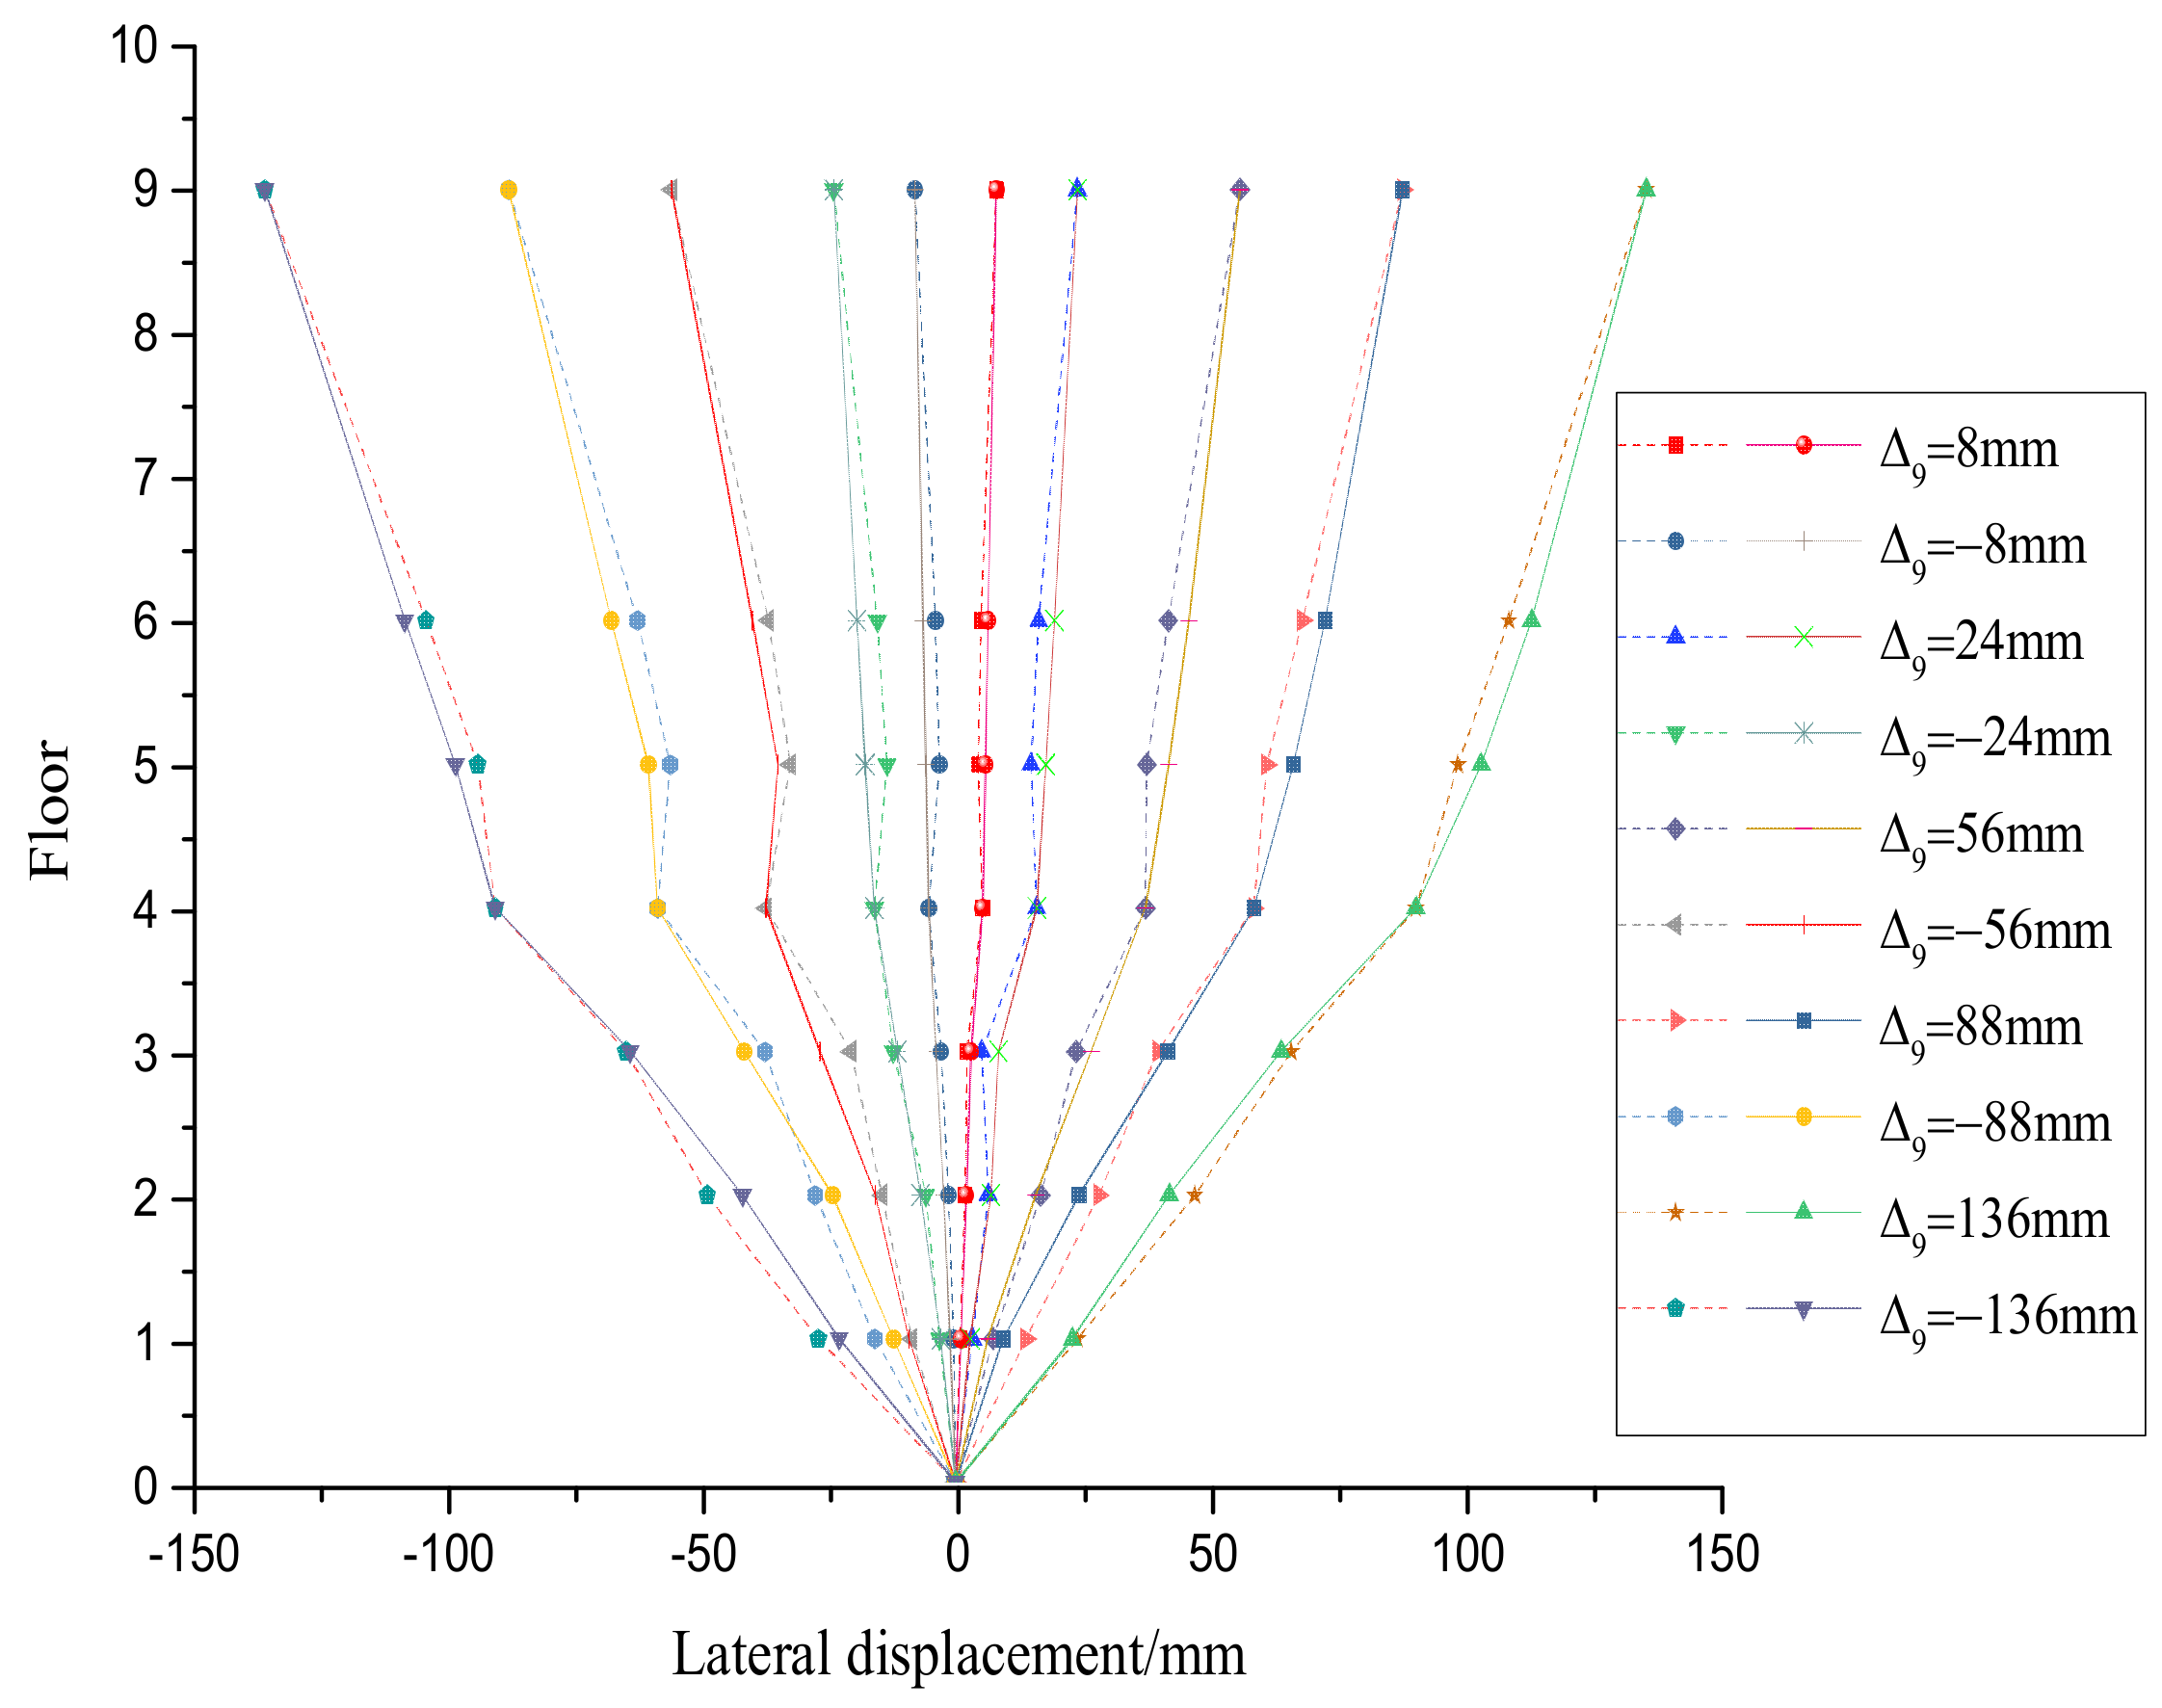
Figure 6a shows the hysteretic curve of the test results, which is the relationship of the building base shear and the displacement at the top loading point. The curve is full and in a spindle shape, the yielding, limiting and failure stages are obvious. Figure 6b shows the test value of lateral displacement at the 1st, 2nd, 3rd, 4th, 5th, 6th and 9th floor when the top displacements are 8 mm, 24 mm, 56 mm, 88 mm and 136 mm respectively. During the experiment, the dynamic characteristics were measured and the details were introduced in reference [6]. Table 3 shows the test value of frequencies of the first five vibration modes at the initial and failure states.
3. Finite Element Model
3.1. Constitutive Model of Materials
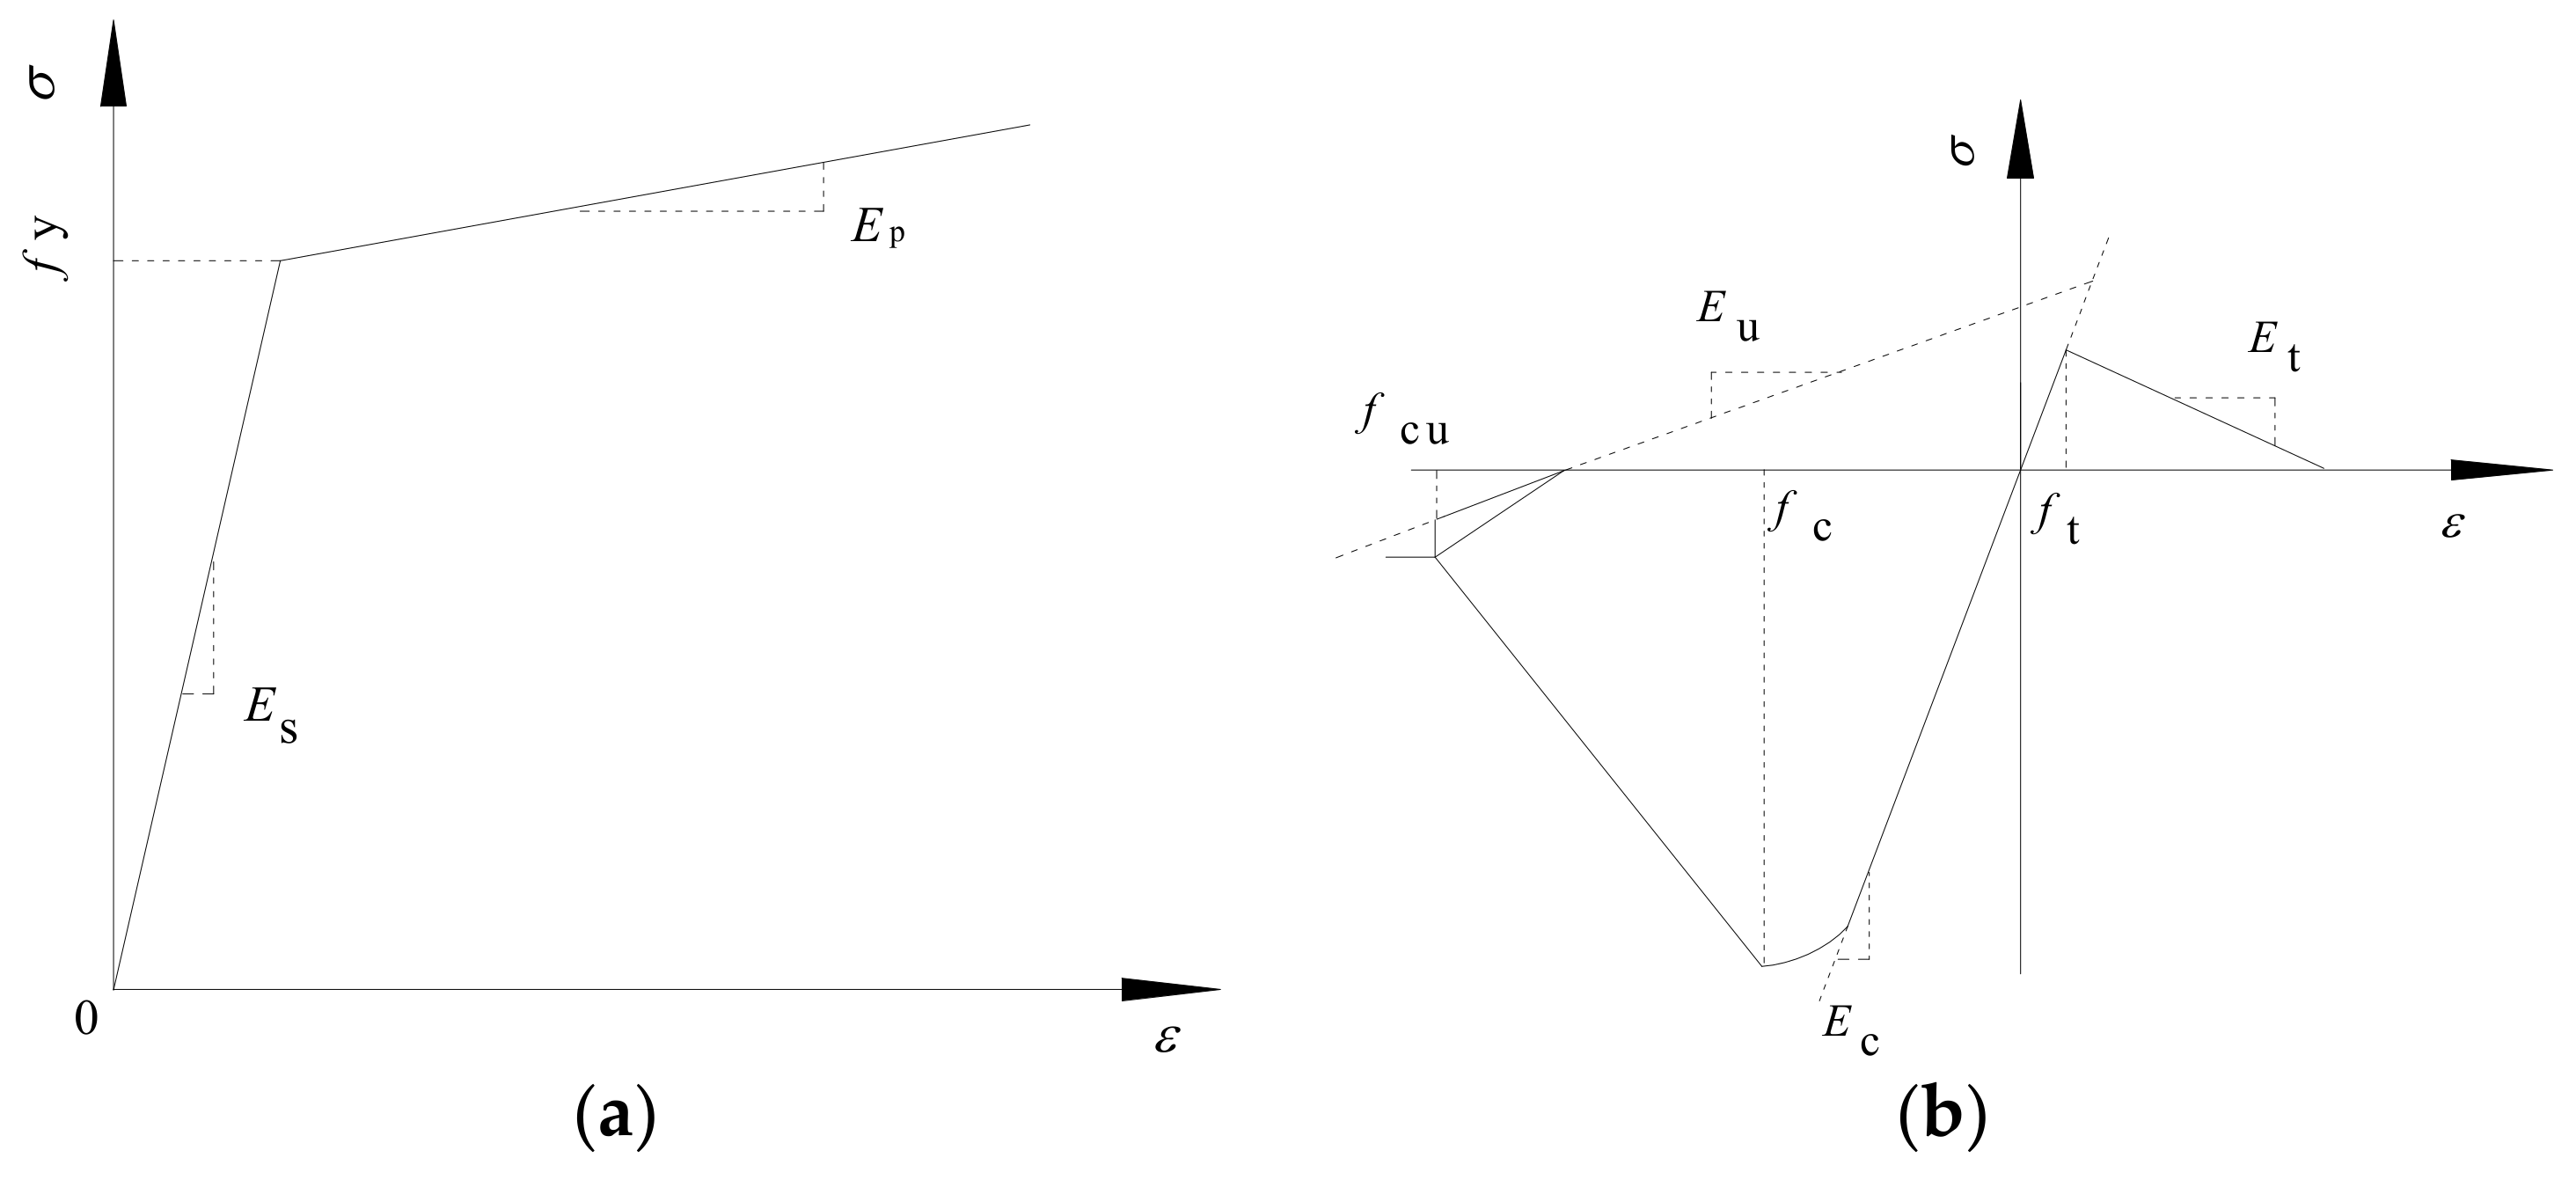
In general, bilinear stiffness degeneration behavior is employed to simulate the cumulative damage of structure [36,37]. In this paper, stiffness degeneration of materials are defined in the finite element (FE) model to simulate the cumulative damage of structure. Constitutive model curves of steel and concrete are shown in Figure 7a,b [6], respectively. In Figure 7a, the stress–strain curve exhibits two stages, including elastic and hardening stages. Es is modulus of elasticity, fy is yield strength, and Ep is hardening modulus. In Figure 7b, the constitutive model of concrete is based on the Kent-Park model [38], both unconfined and confined concrete fibers in this constitutive model consider tensile strength with linear degeneration. fc, Et, ft, and Eu are ultimate compressive strength, rigidity after cracking, ultimate tensile strength, unloading rigidity. The calculating formula is expressed as below:
where, ε, Z, ε50u, ε50h, ρs, B and Sh are the concrete strain, the slope of the descending branch of the stain-stress curve, the stain at 0.5fc, the strain increase of confined concrete over unconfined concrete at 0.5fc, the ratio of stirrup, width of concrete core area and the spacing of stirrup, respectively.
3.2. Elements and Boundary Condition
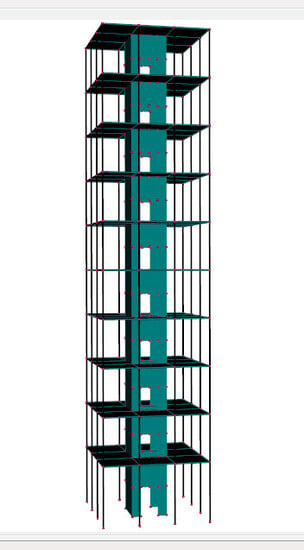
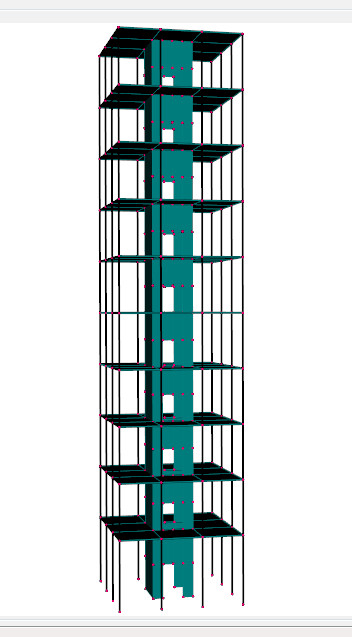
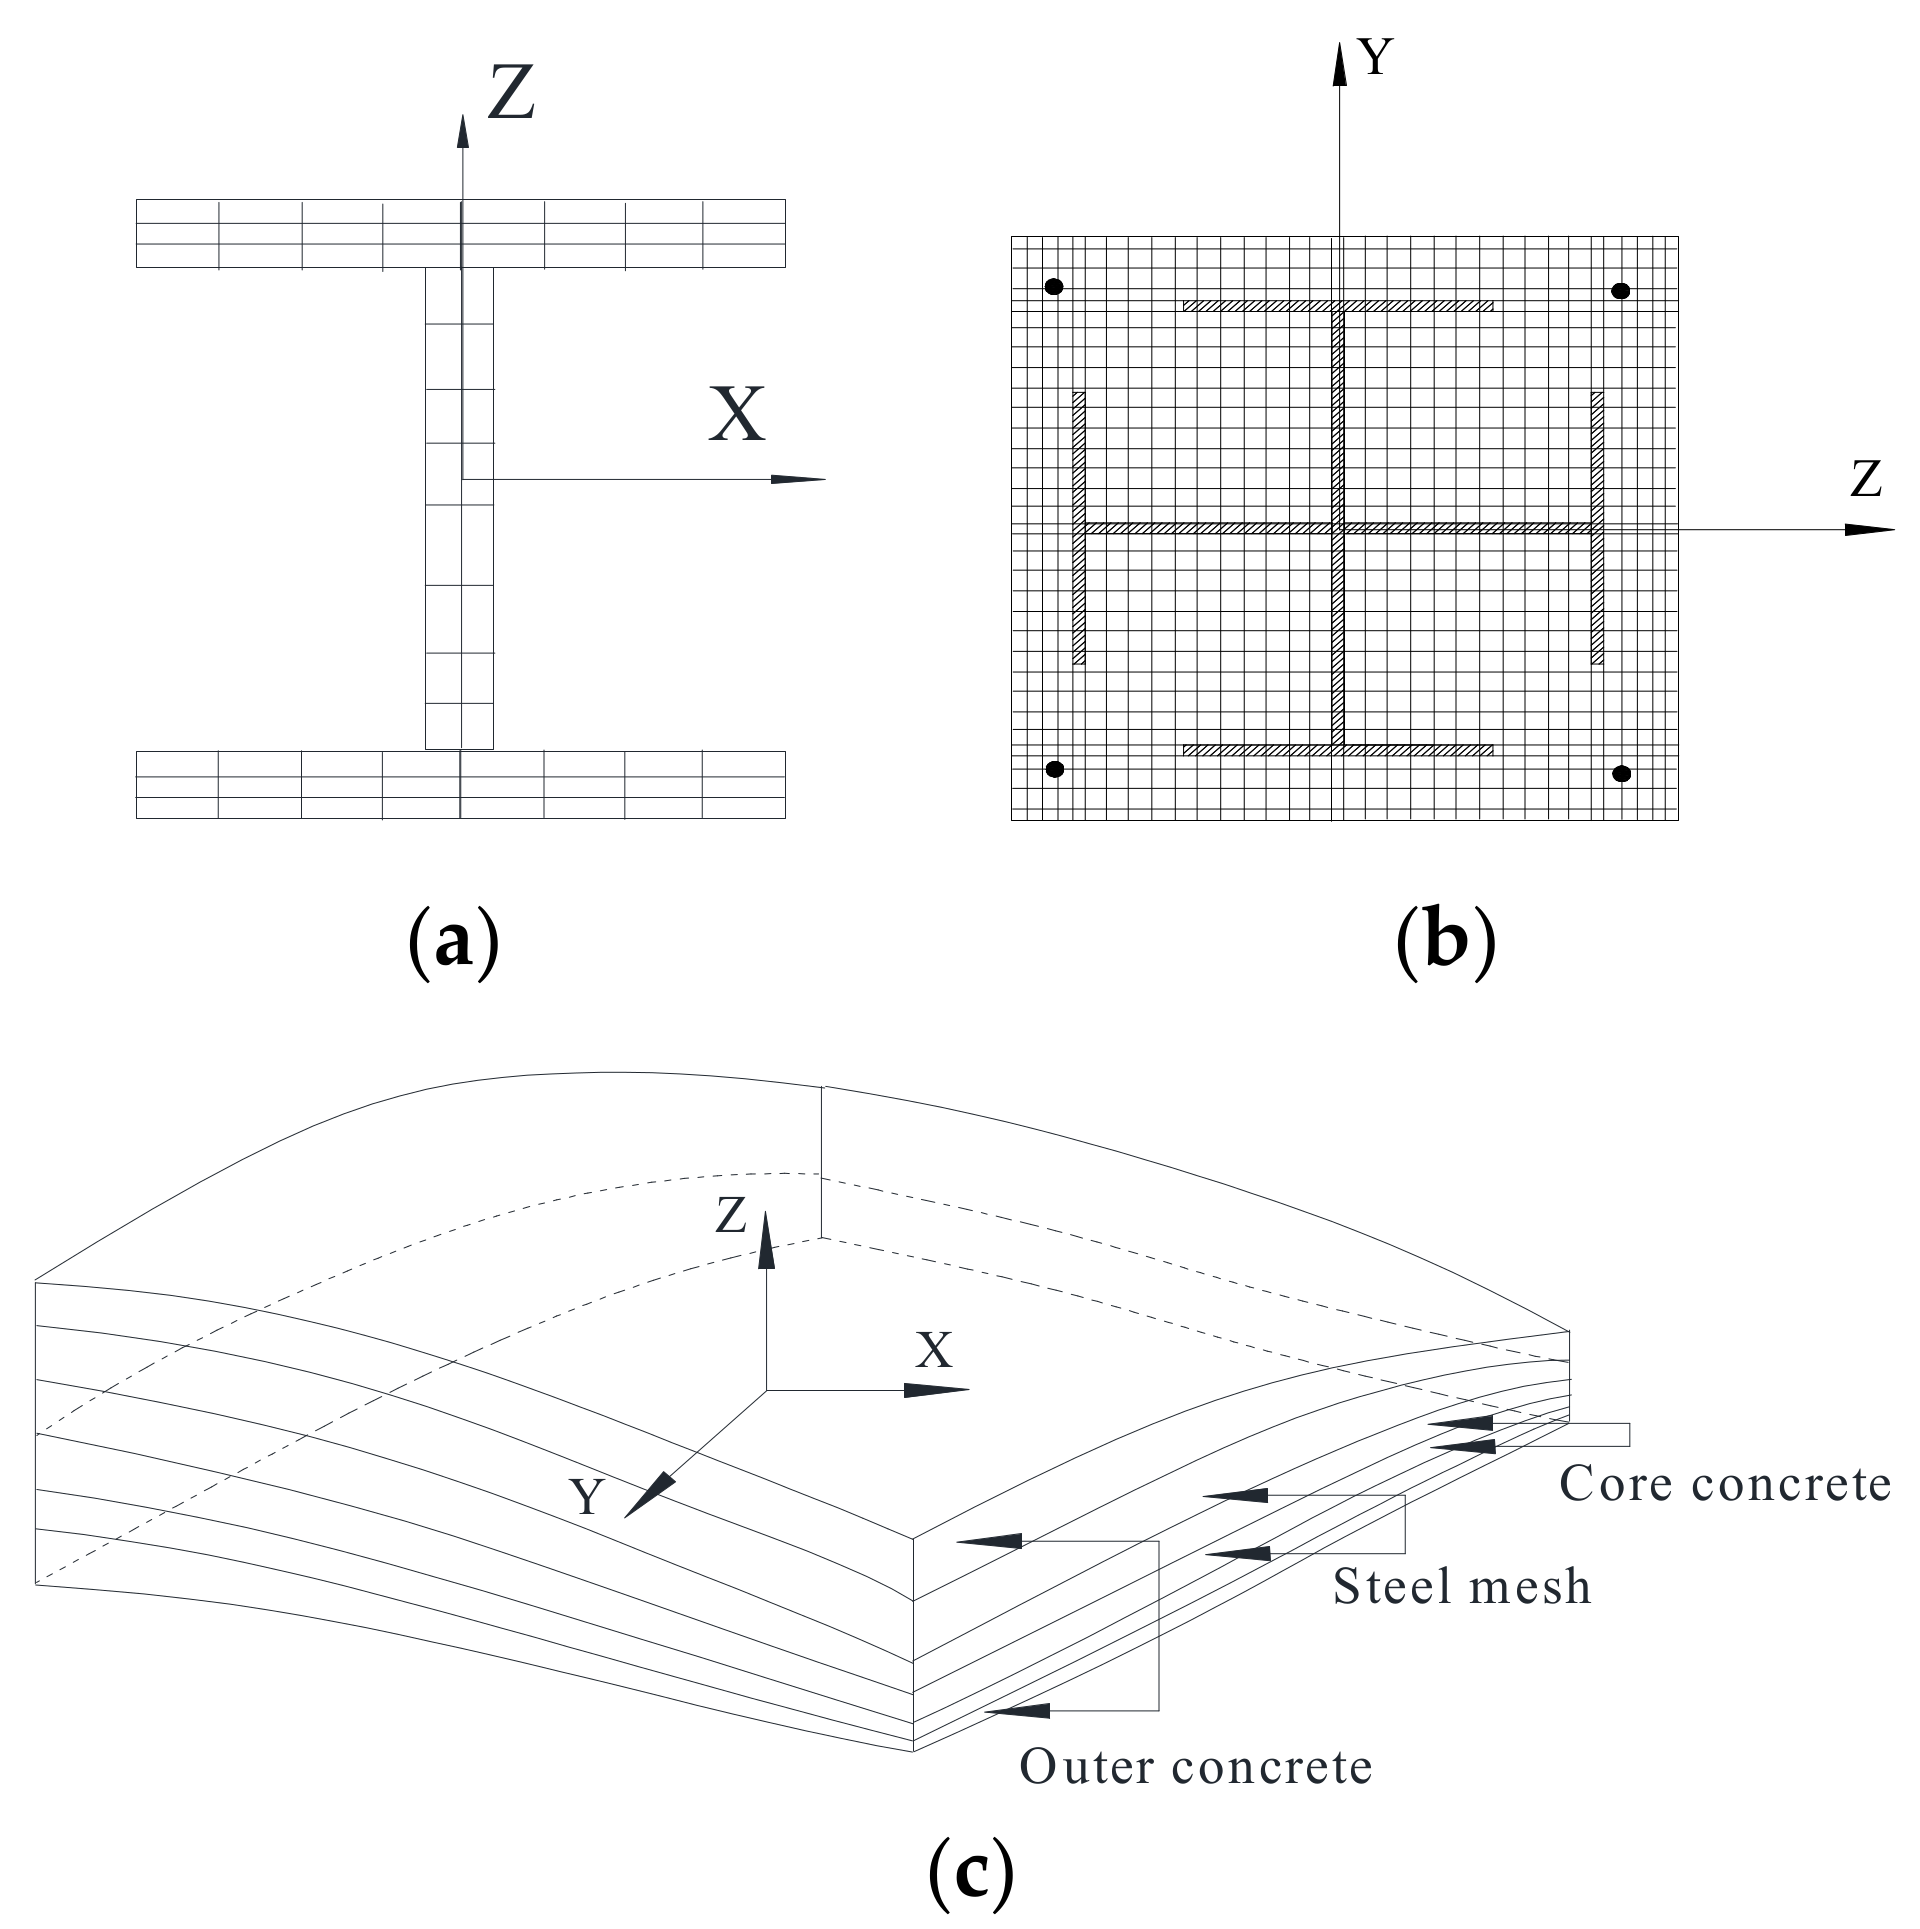
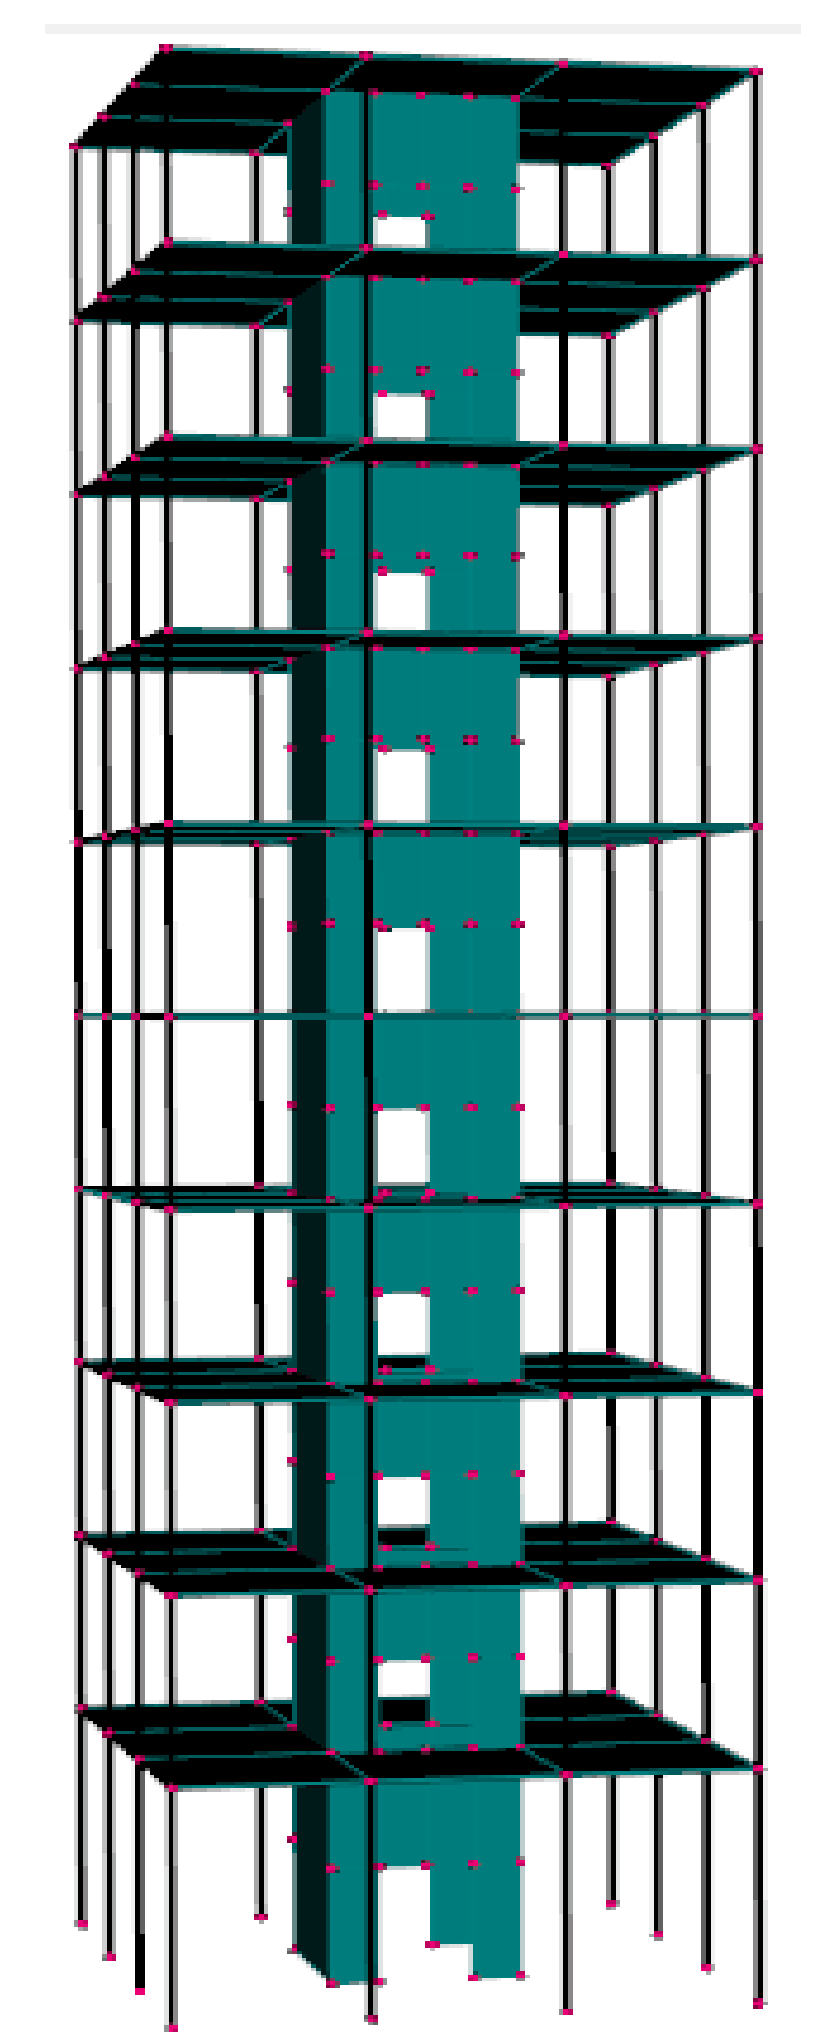
The element types “dispBeamColumn” and “LayeredShell” are employed to divide the cross section of members into units with a certain number. According to the variation positions of concrete and steel in the specimen, the fibers at corresponding positions can be defined with different constitutive models. The cross sections of different members are shown in Figure 8. And the view of the FE model is shown in Figure 9.
Vertical load was applied to the corresponding node. Horizontal load was controlled by displacement referring to the experiment. Based on the experimental conditions, the bottom of the tube and column were defined as fixed, and displacement of nodes on the other same floor was defined as coupled. The mass proportional damping was defined as 0.05.
3.3. Validation of the FE Model
The model size, section dimensions, loading and boundary conditions are exactly replicated in the experiment [6]. The test results are provided in this section. To validate the proposed FE model, simulation and test results are compared focusing on hysteretic curve, skeleton curve, bearing capacity, deformation and dynamic characteristics.
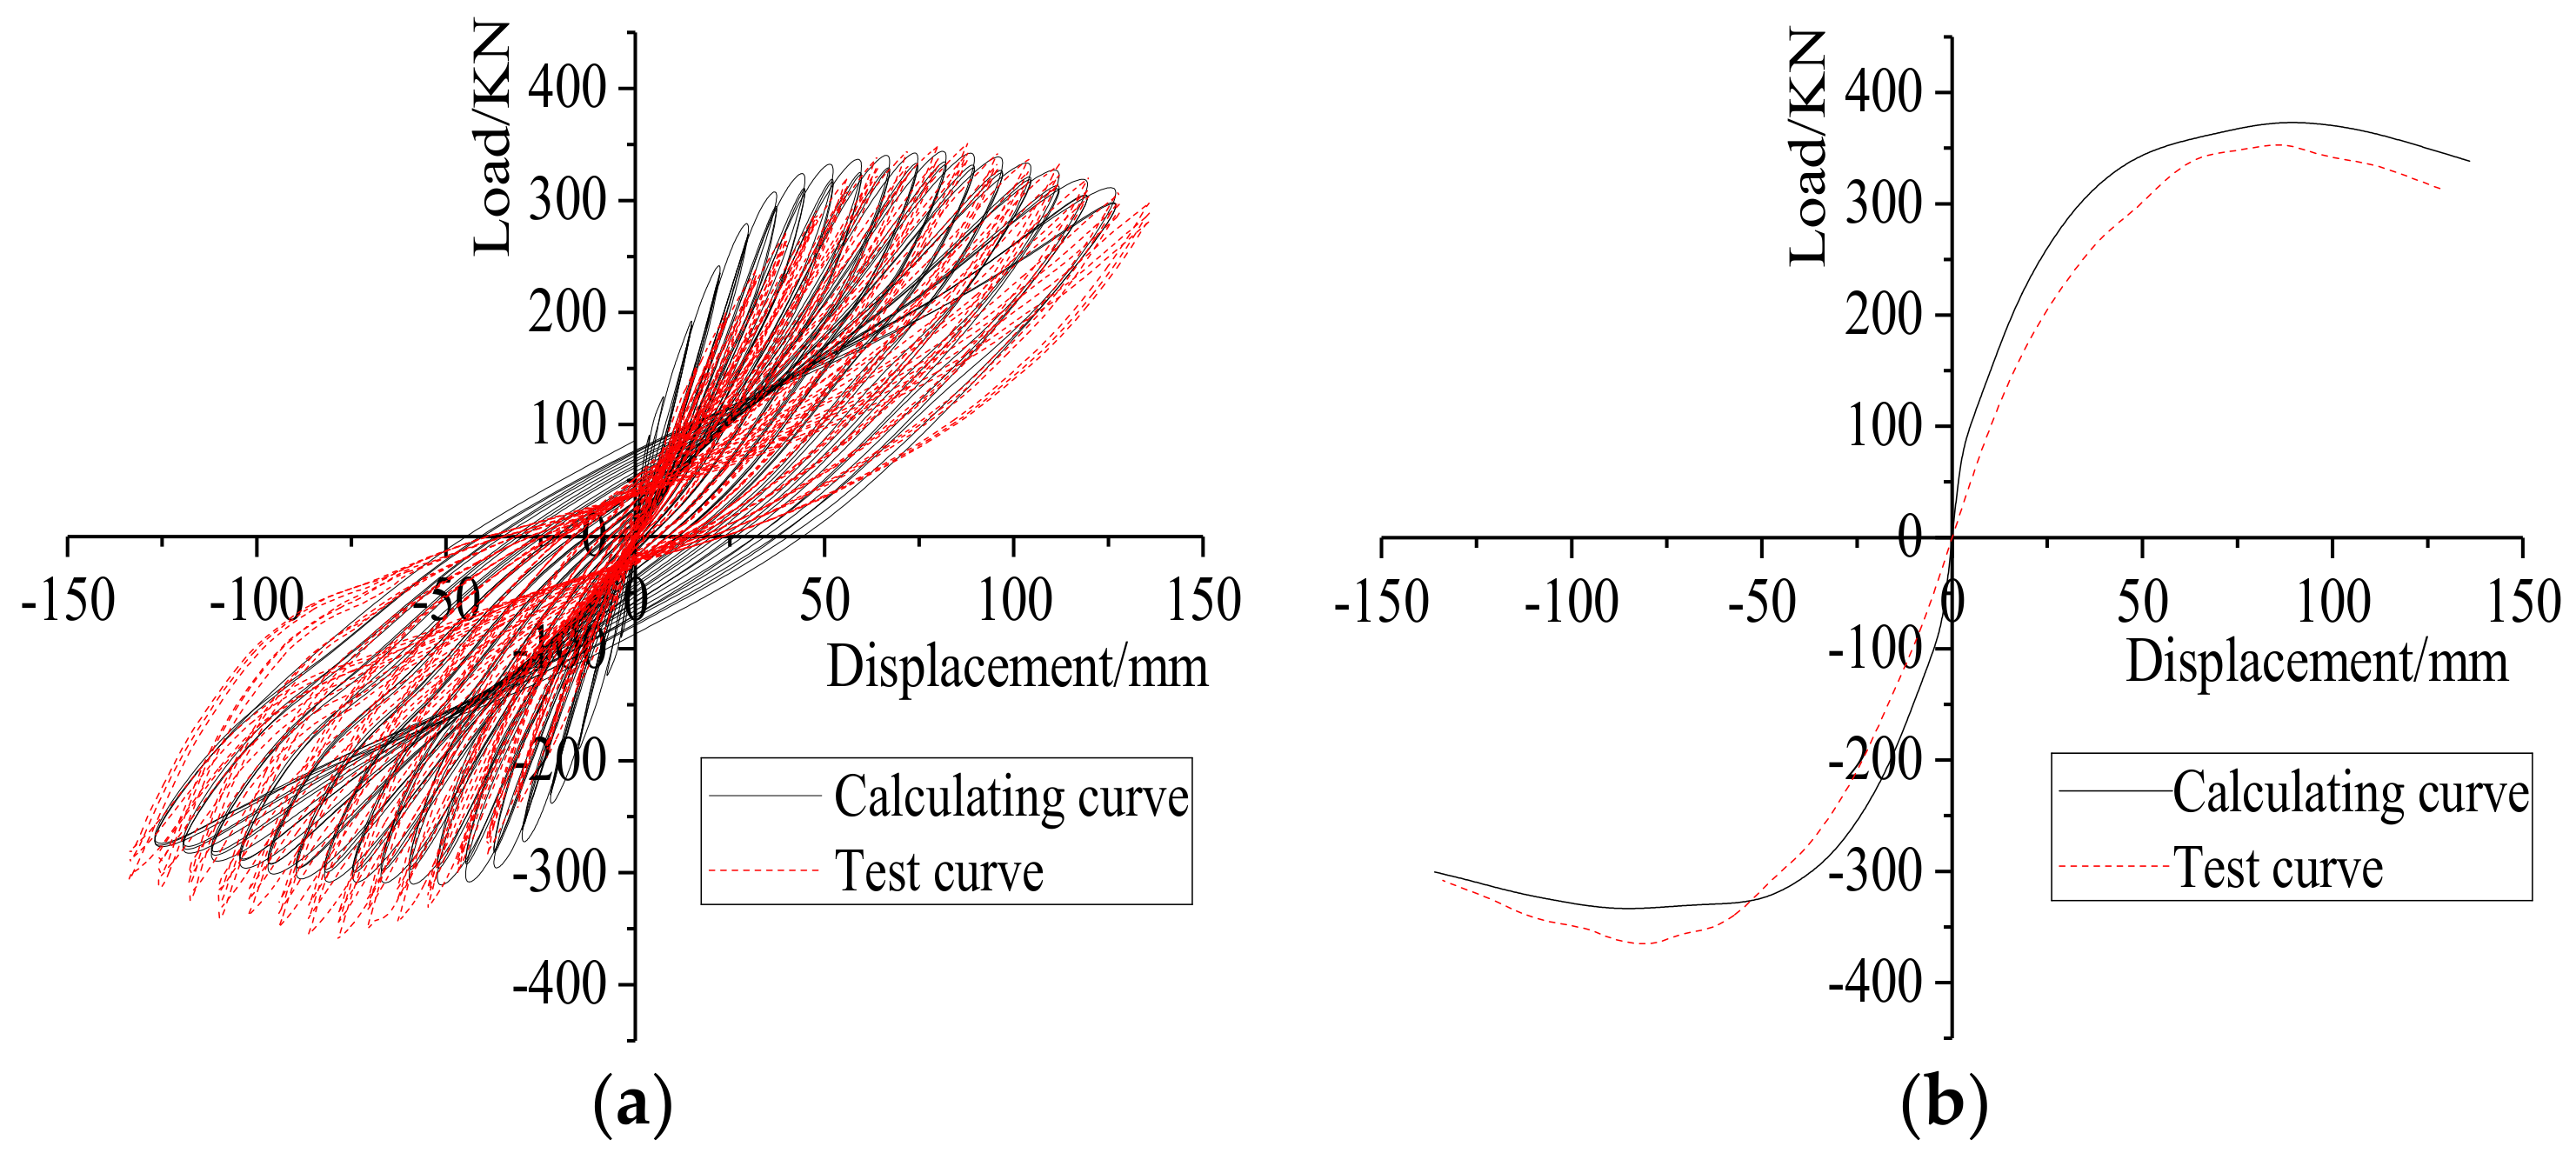
In Figure 10a, the calculating and the test curves are both full and in spindle shaped, the yielding, limiting and failure stages are obvious. In Figure 10b, the calculating and the test curves are consistent in elastic-plastic segment and degenerate segment. Table 4 shows the characteristic values at yielding, limiting, and failure stages. It can be seen that the calculation results are consistent with the test.
Figure 11 shows a comparison of lateral displacement at the 1st, 2nd, 3rd, 4th, 5th, 6th and 9th floors resulting from test and simulation. The dotted line is the test value and the solid line is the simulation value. It can be seen that structural deformation resulting from the two approaches are in a good agreement when the top displacements are 8 mm, 24 mm, 56 mm, 88 mm and 136 mm respectively.
Table 5 shows the frequencies of the first five vibration modes at the initial and failure state. It can be seen that the natural frequency of structure decreases along with damage accumulation, and that the absolute errors between calculating results and test results is within 5%.
4. Progressive Collapse Analysis
4.1. Basic Principle
As stated above, the alternate path method (APM) proposed by General Services Administration (GSA) [10] is applied to assess the potential for progressive collapse by a certain acceptance criteria. As stated in GSA, the demand-capacity ratio (DCR) of adjacent components is applied to evaluate whether progressive collapse occurs as after the failure of critical component.
The component removal is conducted using element-killing technology. The DCR under various cases is assessed using nonlinear static and dynamic analysis. The nonlinear static analysis can be used to simulate the removal scenario induced by triggering events, such as explosions and vehicle accidents. The nonlinear dynamic analysis can be used to simulate the building subjected to an earthquake with failure of critical components. The maximum forces and displacements for each member are recorded. In static analysis, the critical component is removed primarily, and then the analysis goes on to evaluate the structural performance. If the structure is stable, the dynamic analysis will continue based on the static analysis, a seismic wave will be input to the model with critical component removal. The dynamic effects are considered through load-increase factors. For the ground key components loss, load combination was employed as follows:
where Equation (5) is for nonlinear static analysis, Equation (6) is for nonlinear dynamic analysis. DL and LL are dead load and live load respectively.
Load = 2(DL + 0.25 LL)
Load = DL + 0.25 LL
Based on GSA, DCR is a ratio defined as internal force QUD of a component after the removal of key component to the ultimate internal force QCE of the component. The DCR values are calculated as Equation (7). As specified by GSA, the progressive collapse would not occur, as the DCR is smaller than 2; besides the progressive collapse of the structure will occur.
4.2. Seismic Input for Nonlinear Dynamic Analysis
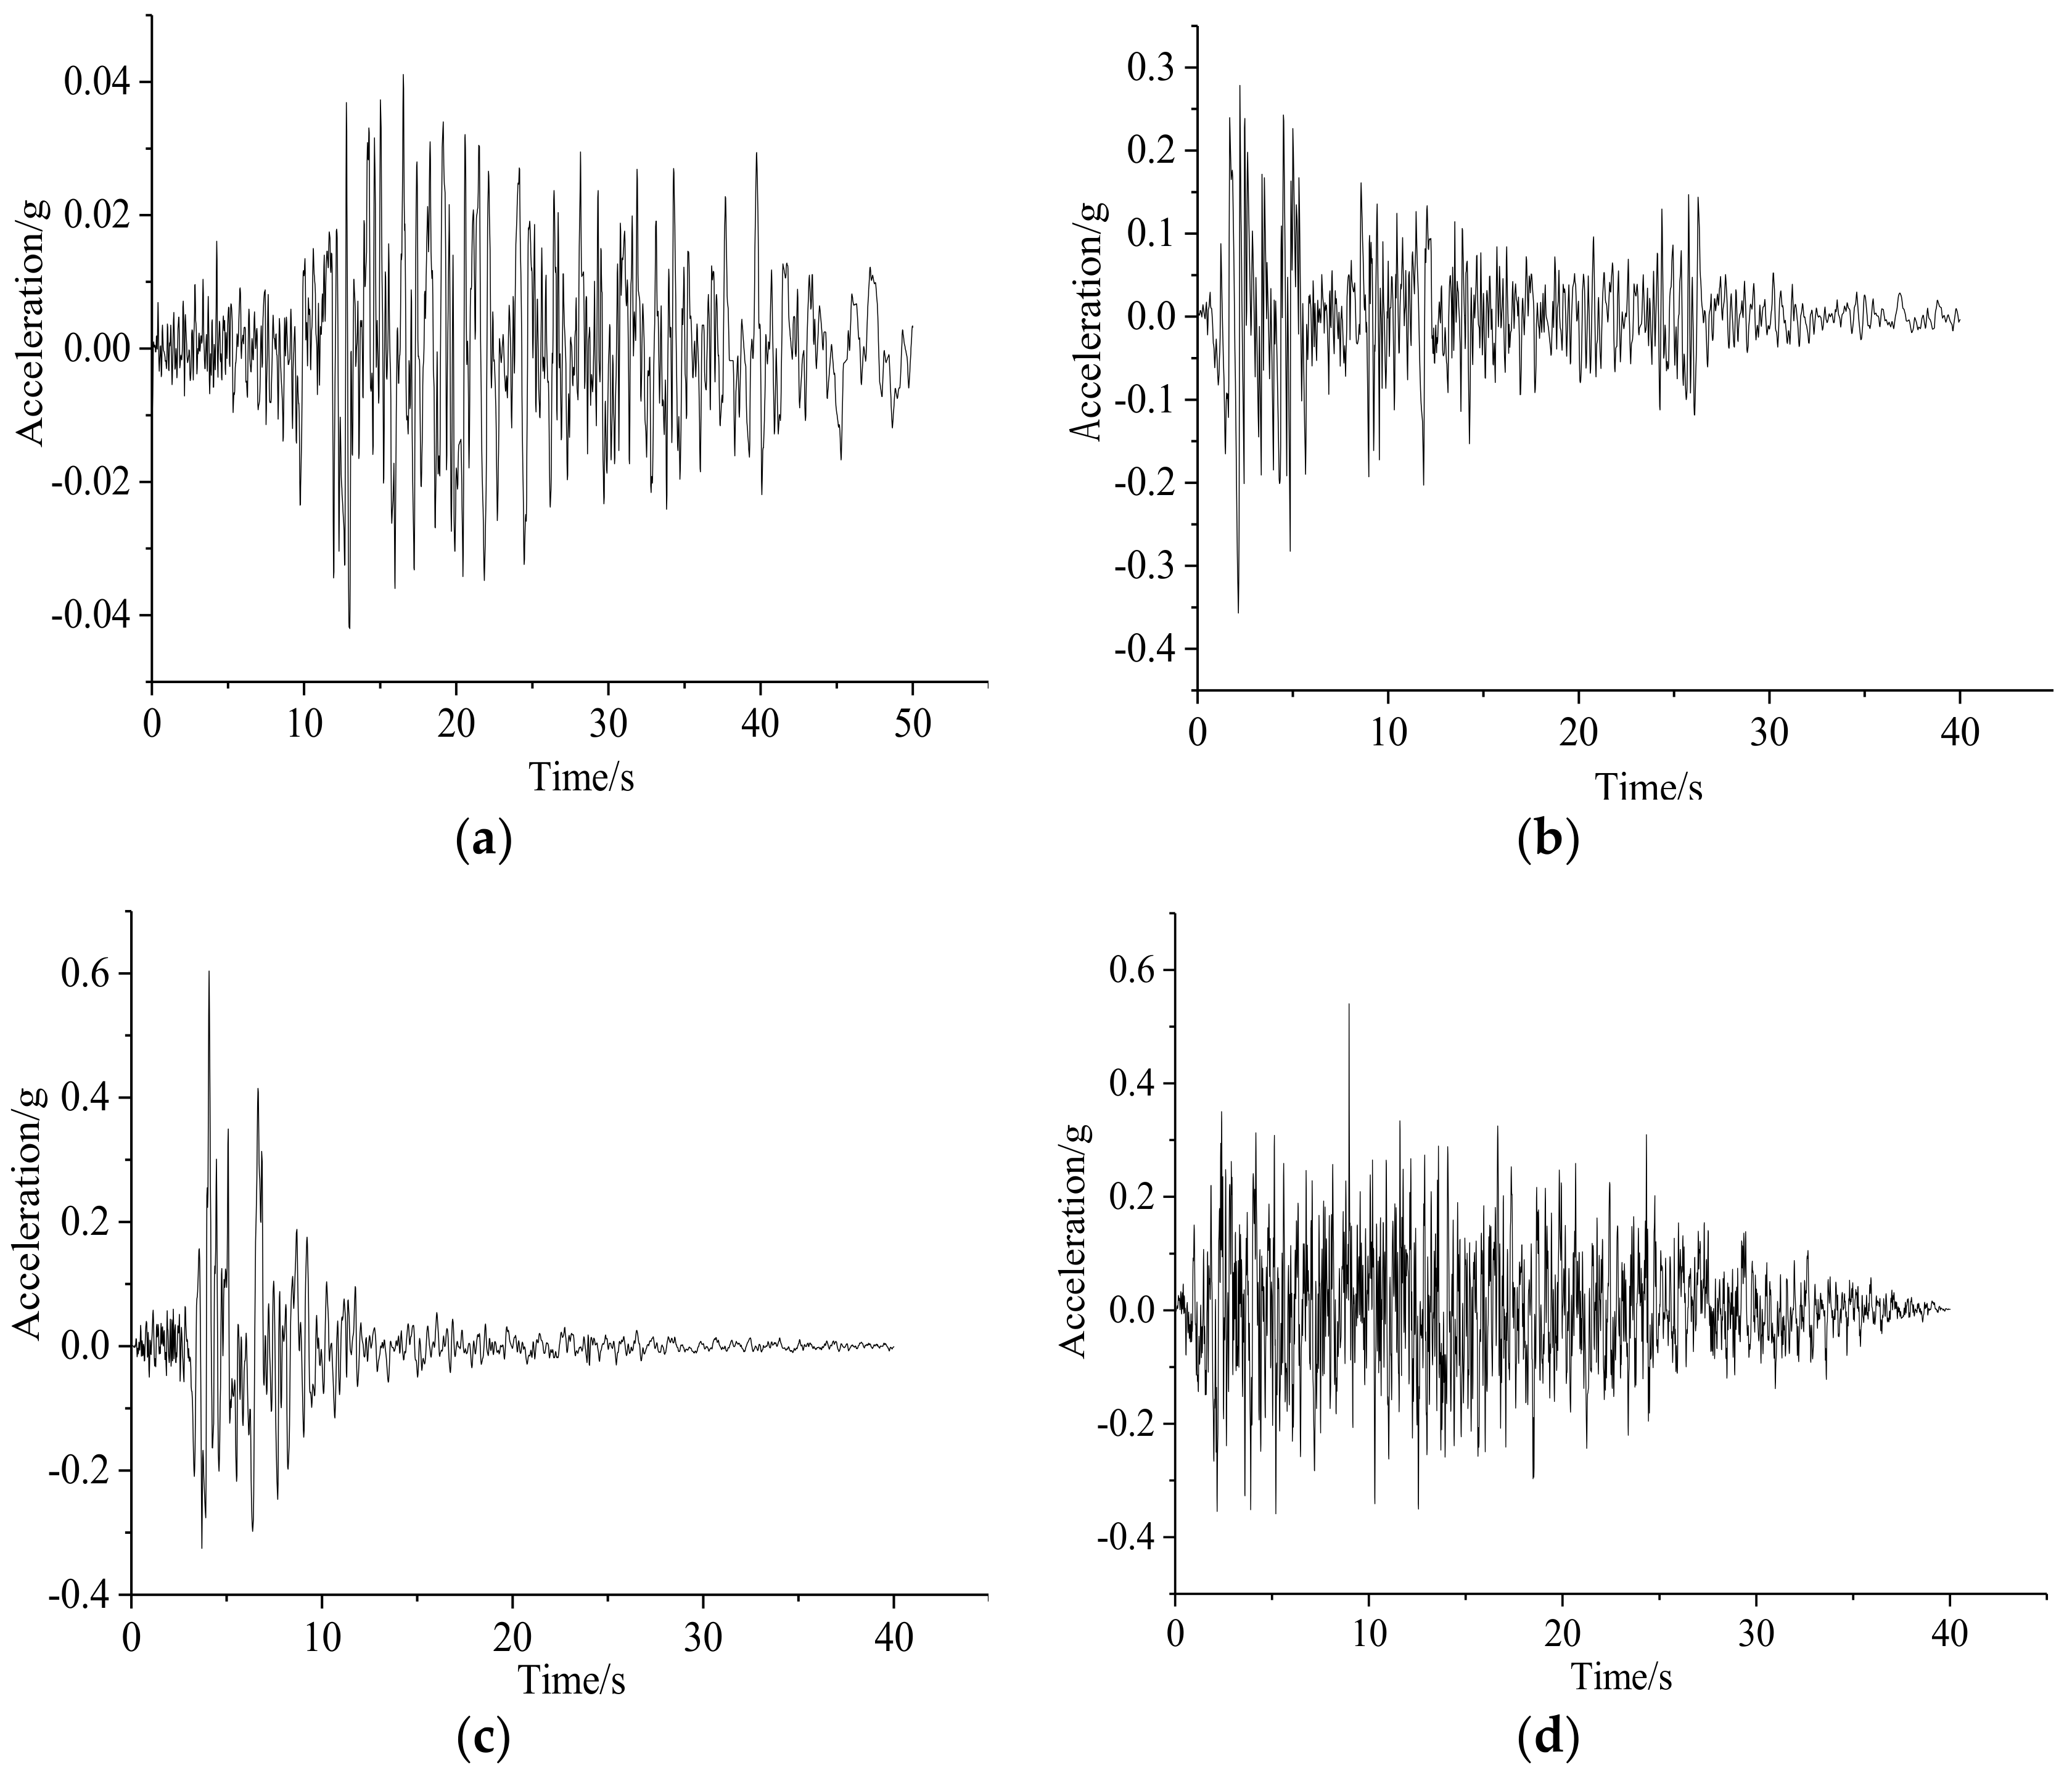
To assure the accuracy of numerical analysis, the HOLLYWOOD, ELCENTRO and NRIGDE seismic waves are selected to represent the various level of earthquake intensity, including frequent earthquake, fortification earthquake and rare earthquake. Moreover, an artificial wave is also selected. The peak ground acceleration (PGA) of each seismic wave is listed in Table 6, and acceleration-time curves are shown in Figure 12.
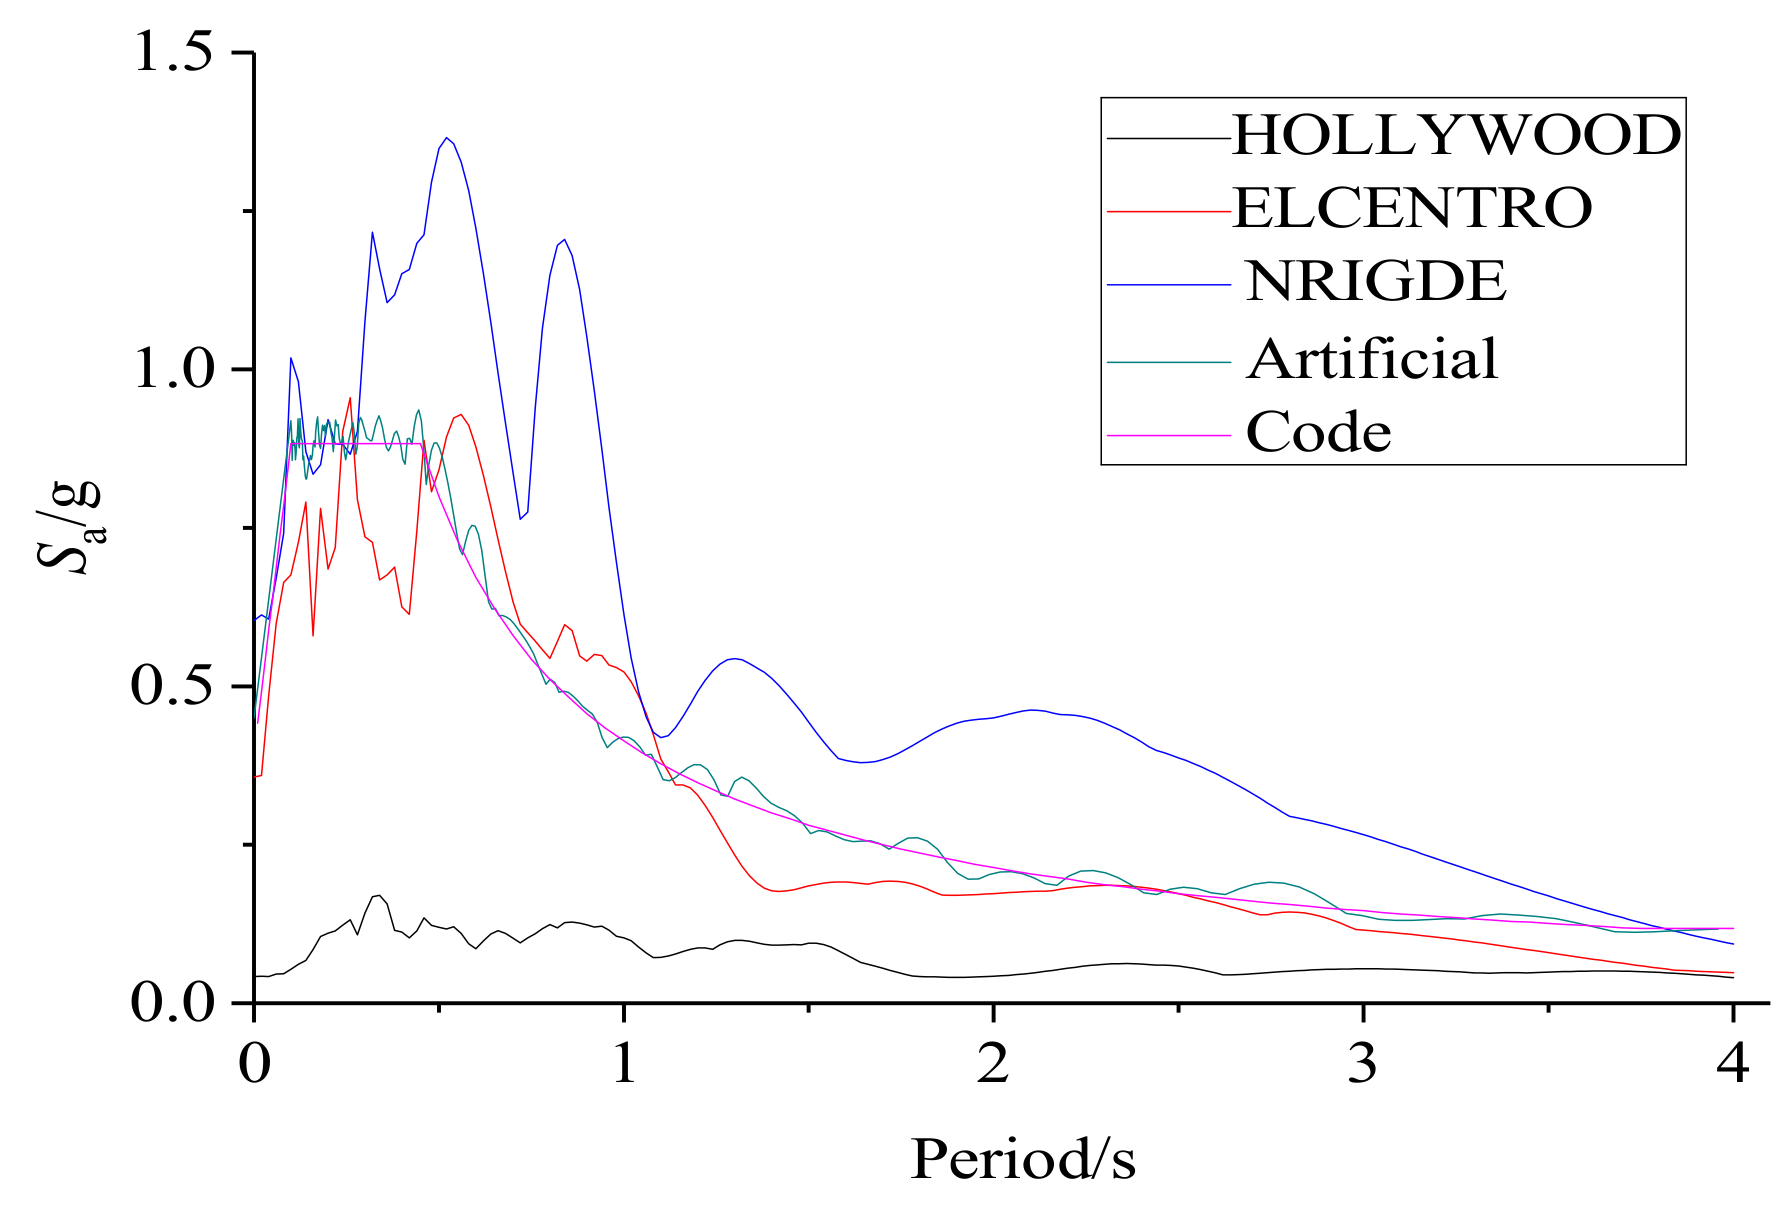
Figure 13 shows response spectra of these seismic waves and design response spectrum specified by Chinese code (GB 50011-2001) [33]. When the PGA does not meet the specification, modification should be performed by the equation given below:
where, a(t) is initial time-history relationship of acceleration, |A|max is PGA of seismic wave, a′(t) is modified time-history relationship of acceleration, is the modified result, taken as Table 7.
4.3. Progressive Collapse Cases
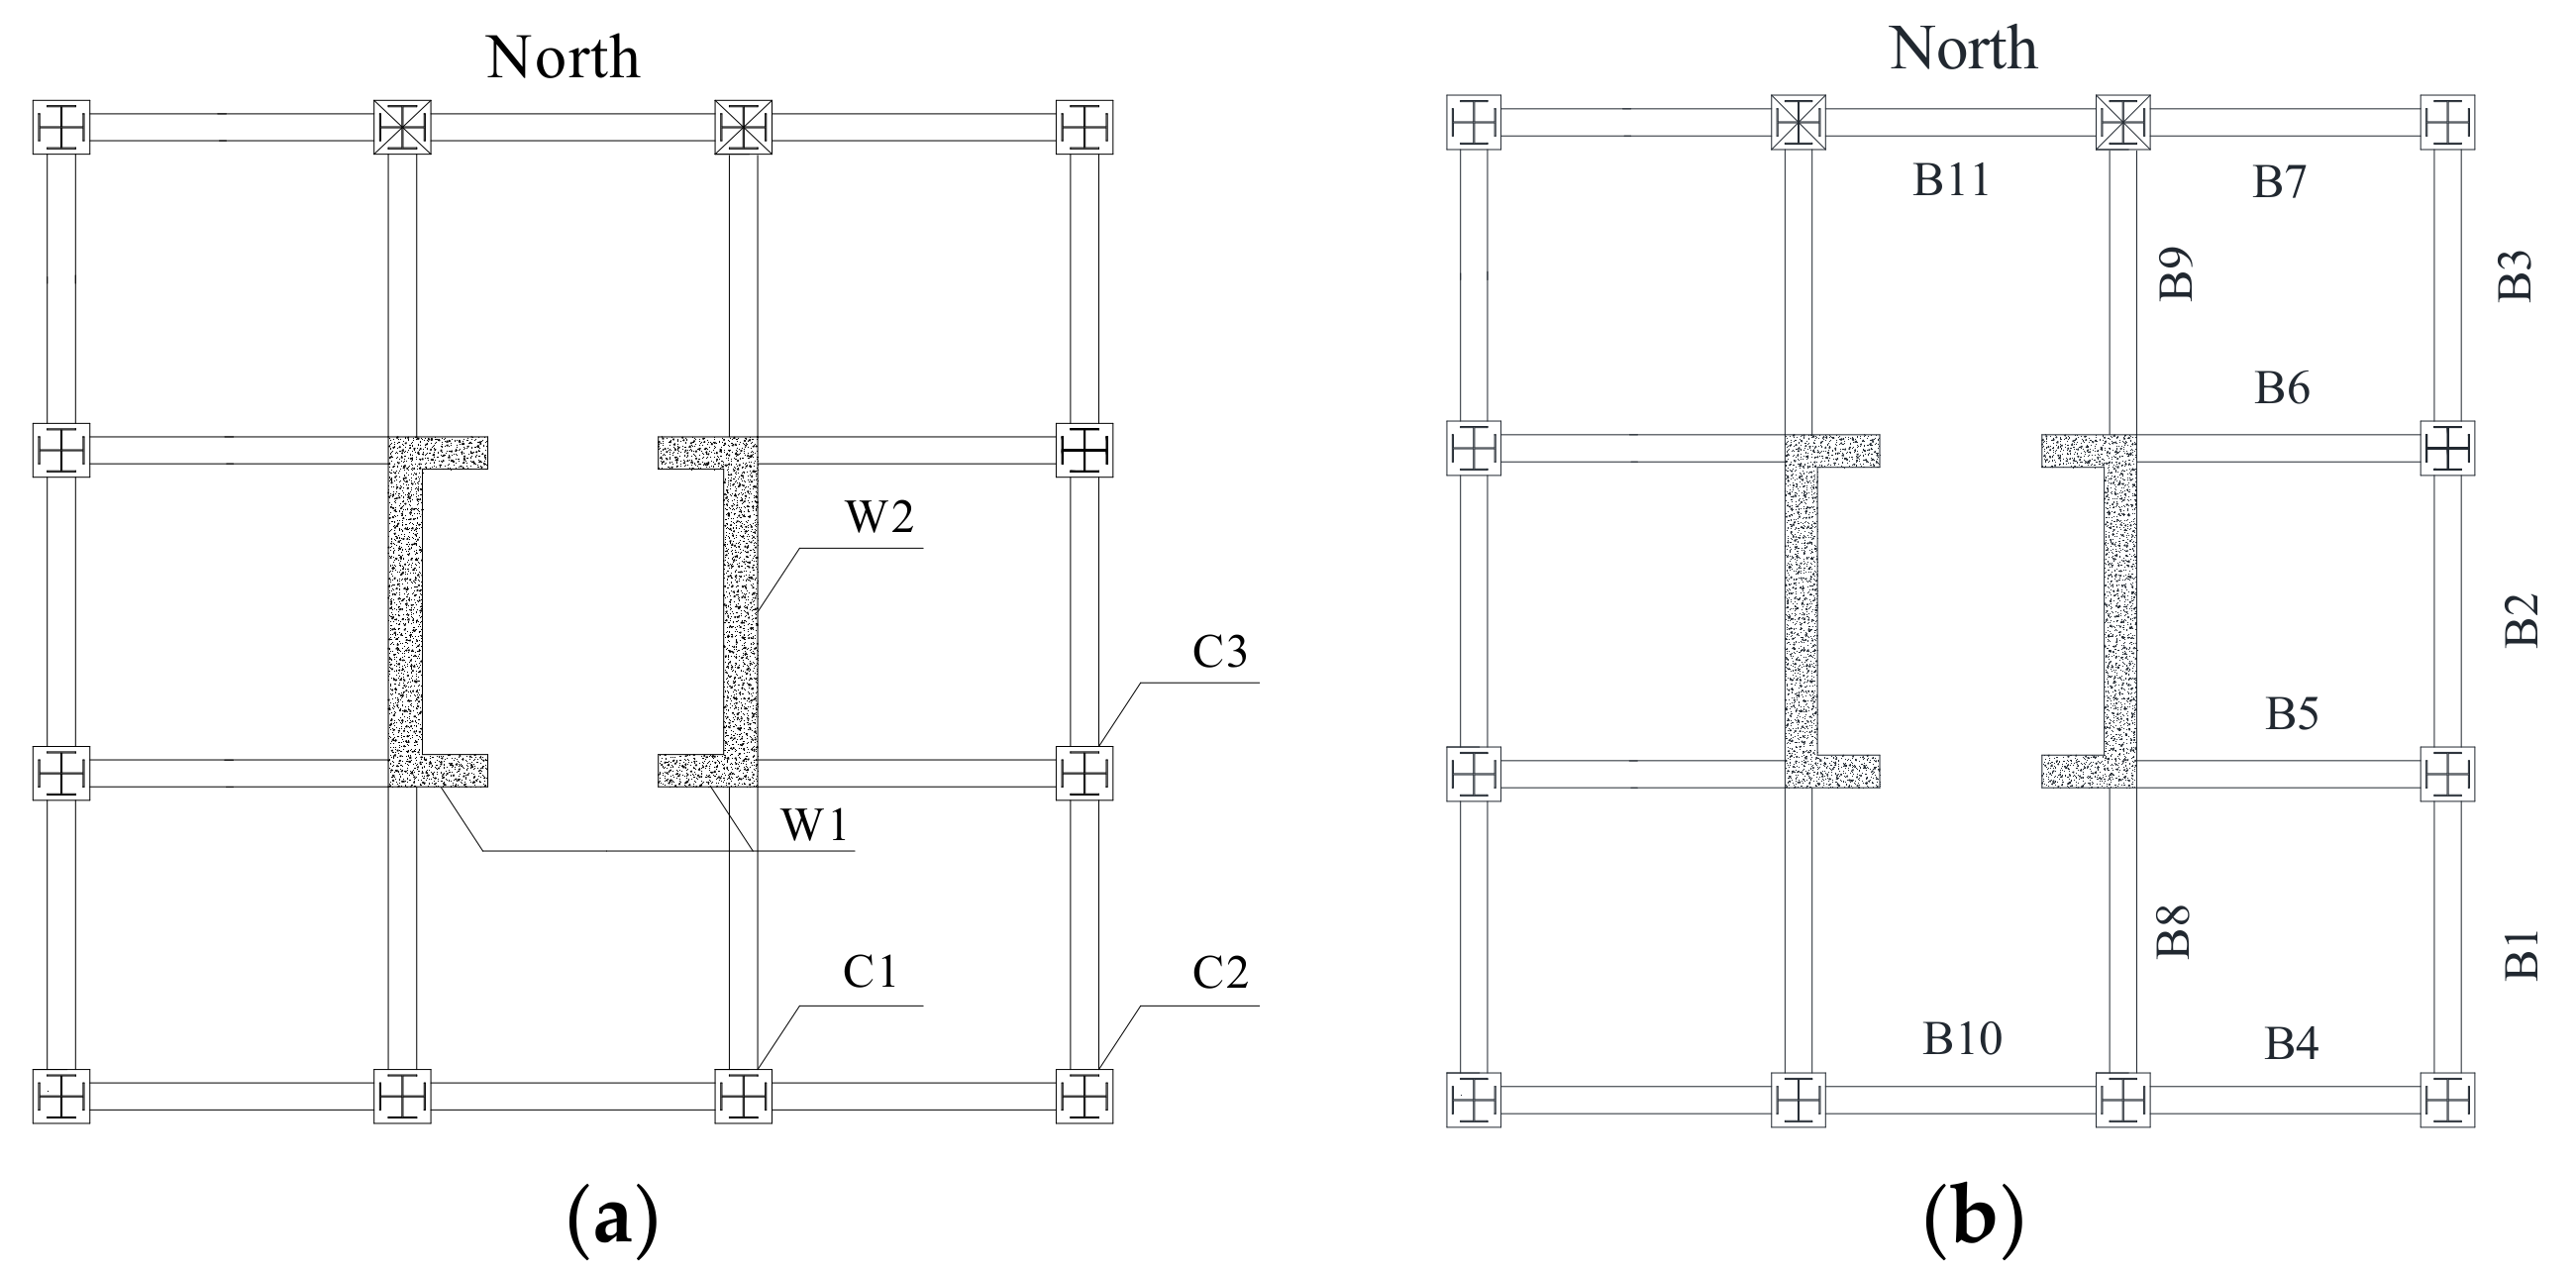
Table 8 shows the list of analysis cases considered together with the components that are forcibly removed. Due to the symmetry of the cross section of the structure, 5 key components were assumed to be removed. These critical components are side columns C1 and C3, corner column C2, shear walls W1 and W2 at the first floor. Figure 14a,b show the location of these critical components and adjacent beams. To illustrate the analysis method clearly and facilitate analysis of data, case 1 is discussed in detail while discussion of the other cases is relatively concise.
4.4. Nonlinear Static Analysis
4.4.1. Case 1—Column C1 at Ground Floor Removed
For case 1, the ground columns C1 as shown in Figure 14 were suddenly removed (Case 1 in Table 8). Table 9 shows force condition of beams adjacent to C1. It can be seen that the maximum DCR value is 0.86, far less than 2.0. The DCRs of B8 and B10 are larger than the DCR of B4. This result may be caused by the different locations. Compared with the locations of B4, B8 and B10 are closer to the core tube. When column C1 is removed, the load is transferred to B4 by the portion of 20.06%, to B8 by the portion of 45.23% and to B10 by the portion of 34.71%.
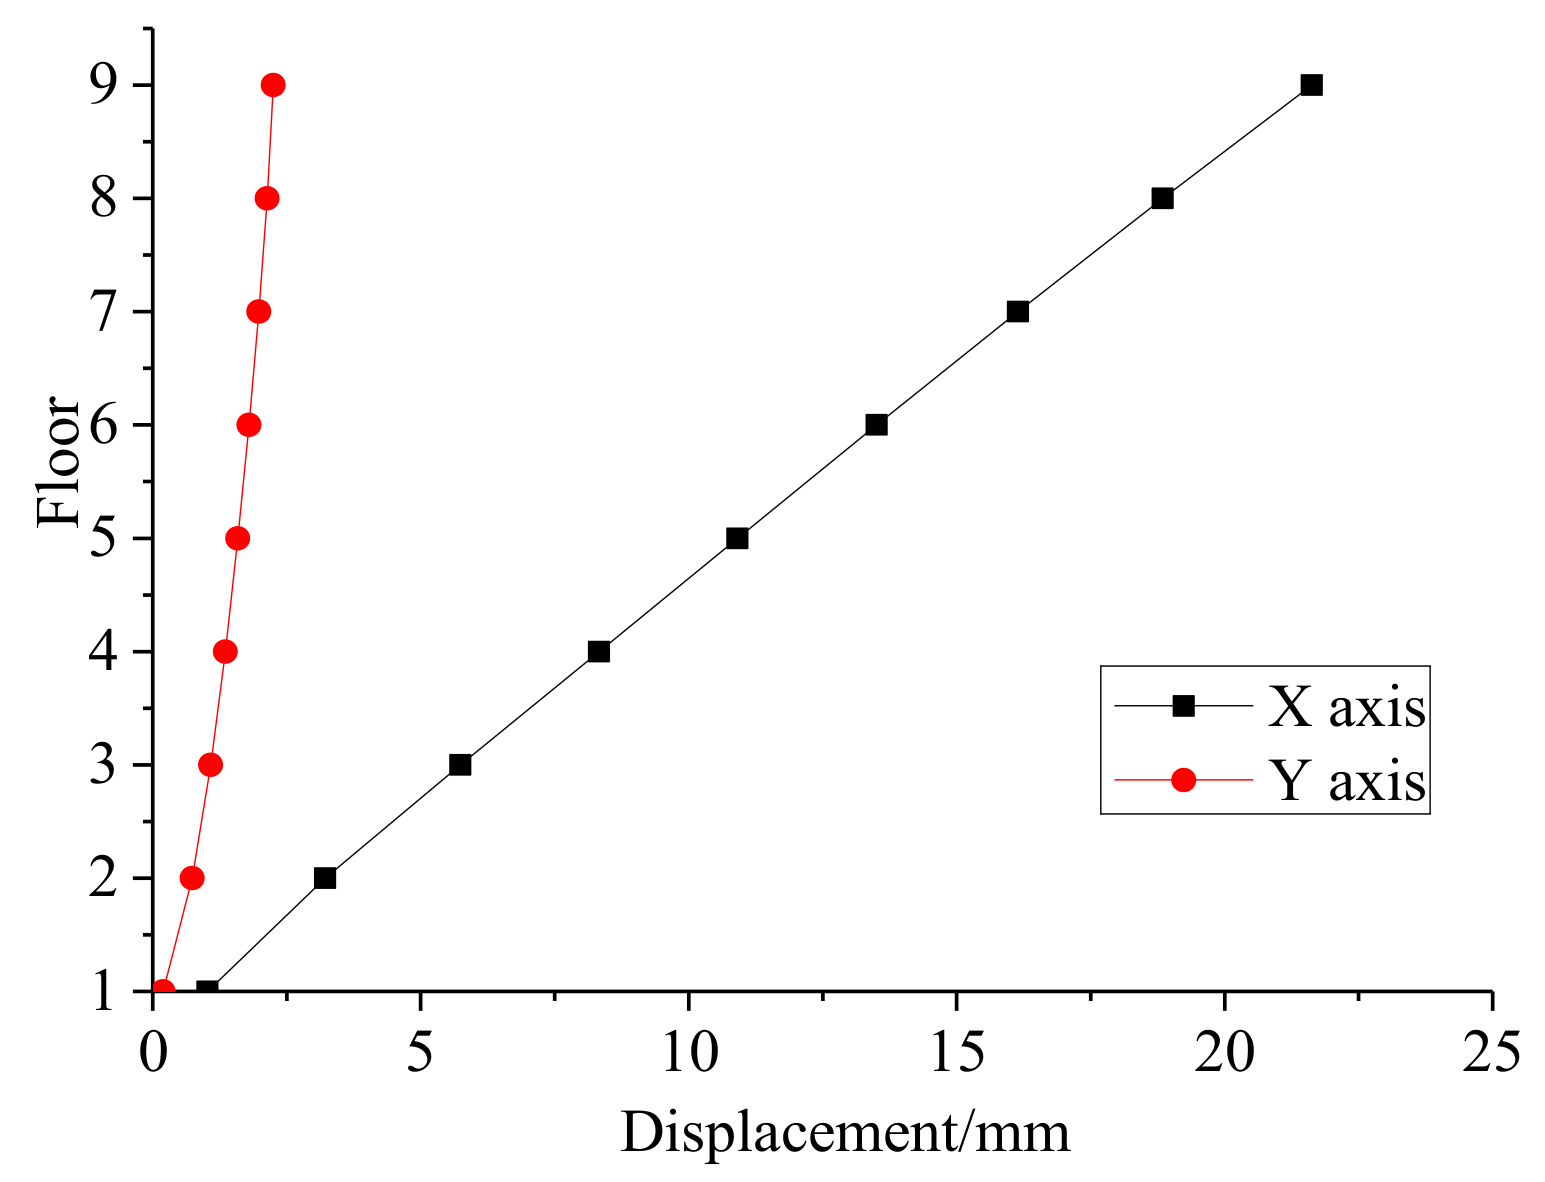
Figure 15 shows the lateral displacement of the structure. X-axis is west-east direction, Y-axis is south-north direction. It can be seen that the lateral displacement along the X-axis is larger, and the maximum displacement is 24.5 mm. Moreover, the maximum inter-story displacement angle θmax is far smaller than the limited value 1/800 in Chinese specification (GB50009-2001) [35]. These results indicate that the progressive collapse will not occur under the loss of C1 scenario.
4.4.2. The Results from Case 2 to Case 5
Table 10 shows the force condition of beams under the other cases. It can be seen that the DCRs are less than 2.0. Due to the structural symmetry, the difference between the DCRs of B1 and B4 is small in case 2. In case 3, the DCR of B5 is larger than the DCRs of B1 and B2. Similar to the case 1, B5 is closer to the core tube than B1 and B2, and the more load is transferred to B5 by the portion of 48.77% while the load is transferred to B1 and B2 by the portion of 20.02% and 32.21% respectively. In case 4 and case 5, B5 and B8 are directly linked to the core tube. Due to the structural symmetry, there is a small difference between the DCRs of B5 and B8, and the DCR of B5 is larger than the DCR of B8 in case 4, but the relationship is reversed in case 5. From the results of the above cases, it can be seen that the closer to the core tube, the more affected the beam gets.
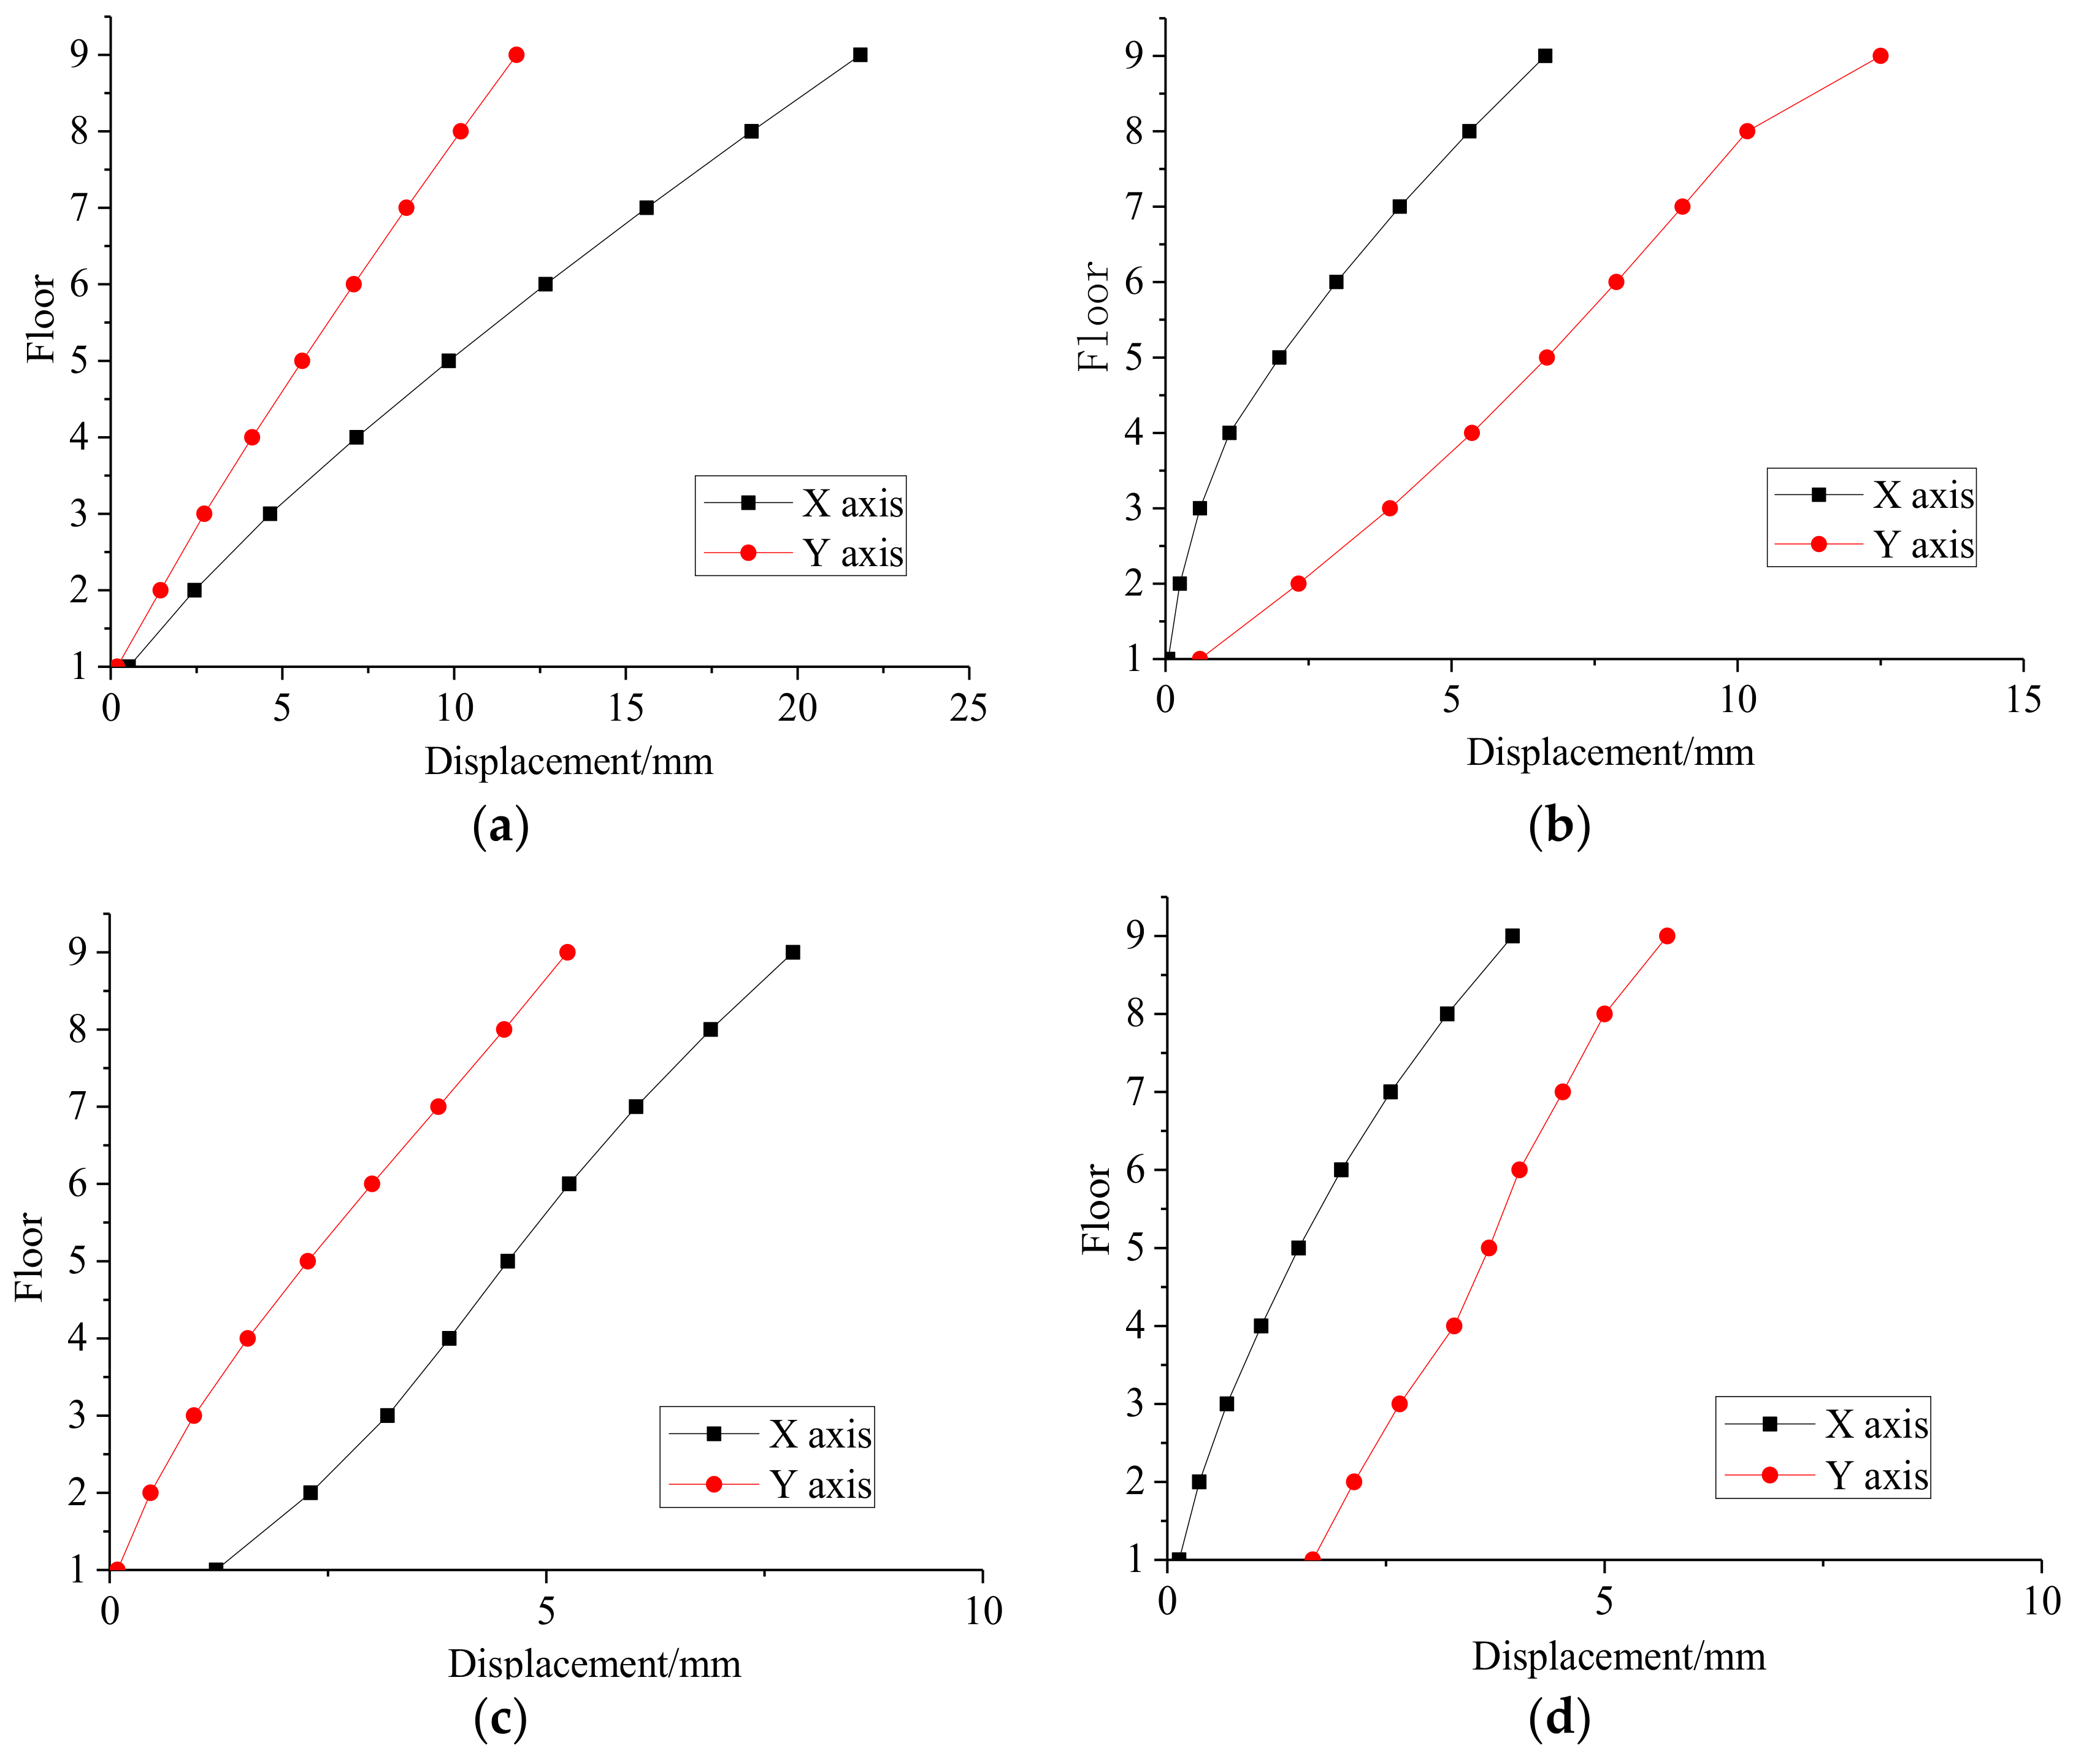
Figure 16 shows the lateral displacement of the structure in different case. The maximum displacements are 22.5 mm, 12.50 mm, 7.80, 5.70 mm respectively. Moreover, the θmax is still smaller than the specified limitation. From case 1 to case 5, in terms of the number, the displacements of 9th floor are the maximum, the maximum displacements and the difference between the maximum value in X-axis and Y-axis showing a decreasing trend. In cases 1, 2 and 4, the maximum values on the X-axis are larger than that on the Y-axis. This means that the removal of C1, C2 and W1 make the ability of structure to resist deformation weaker mostly in X direction. On the contrary, in cases 3 and 5, the removal of C3 and W2 make the ability of structure to resist deformation weaker mostly in Y direction.
4.5. Nonlinear Dynamic Analysis
4.5.1. Case 1—Column C1 at Ground Floor Removed
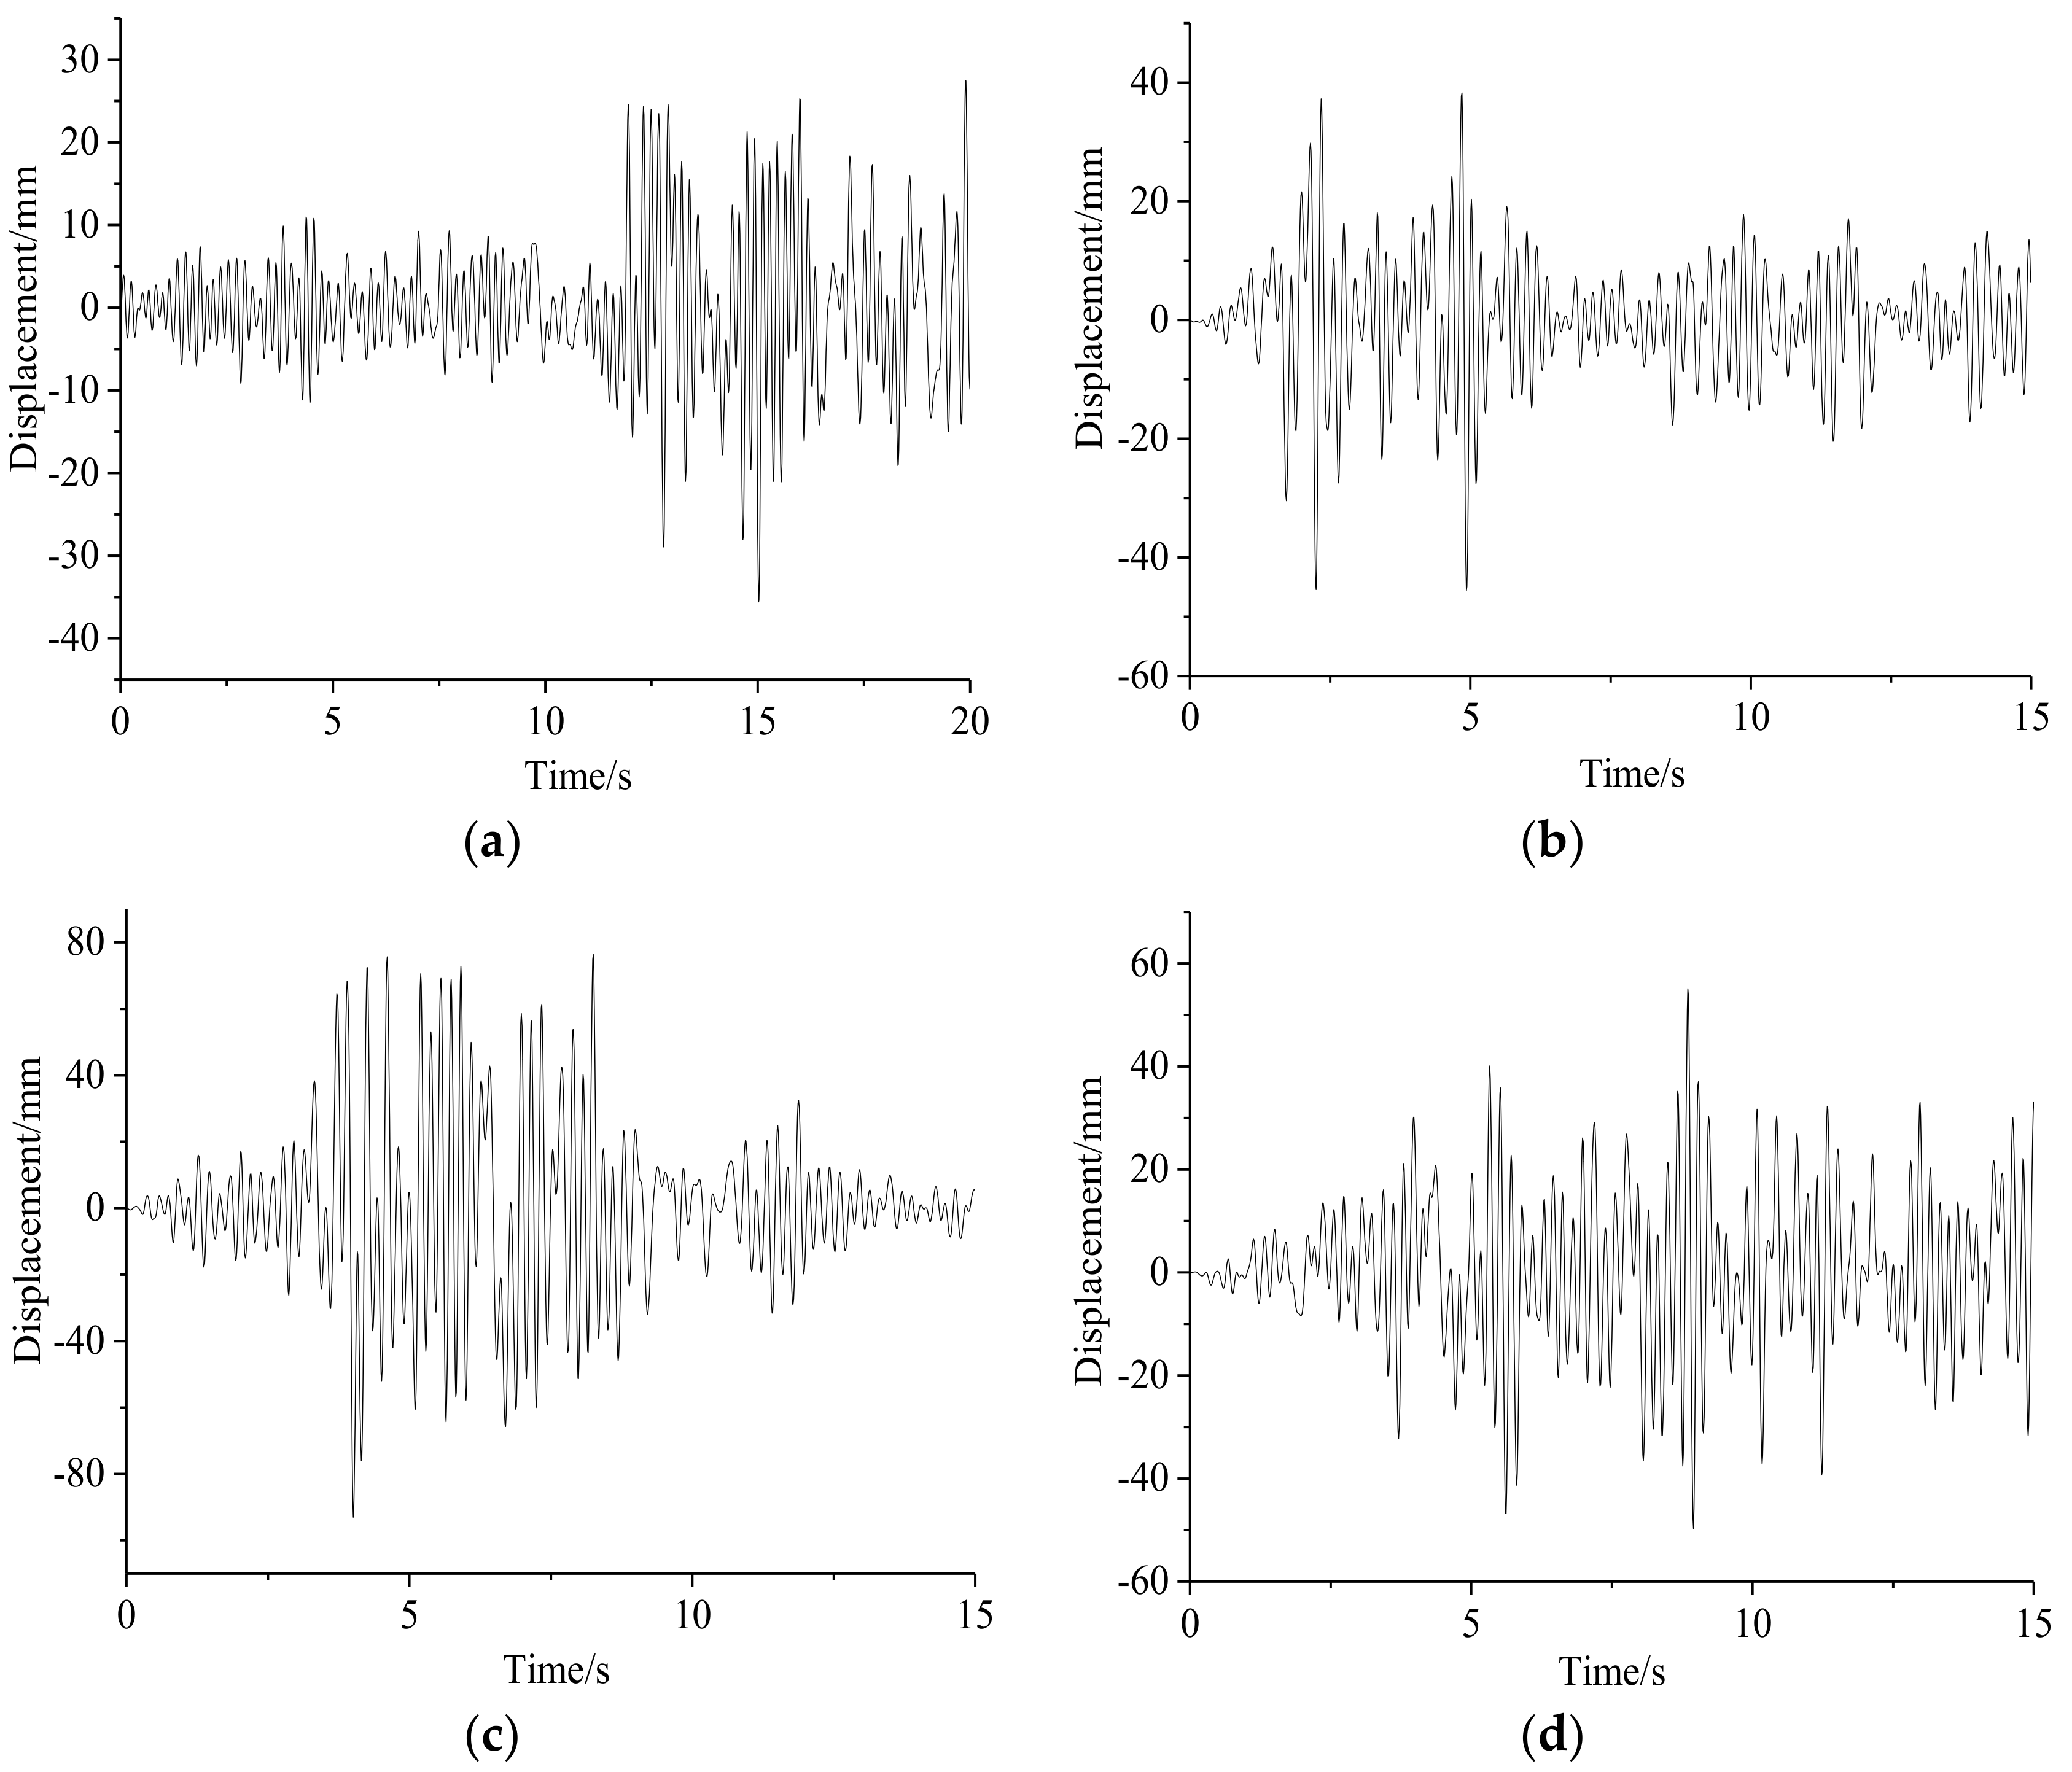
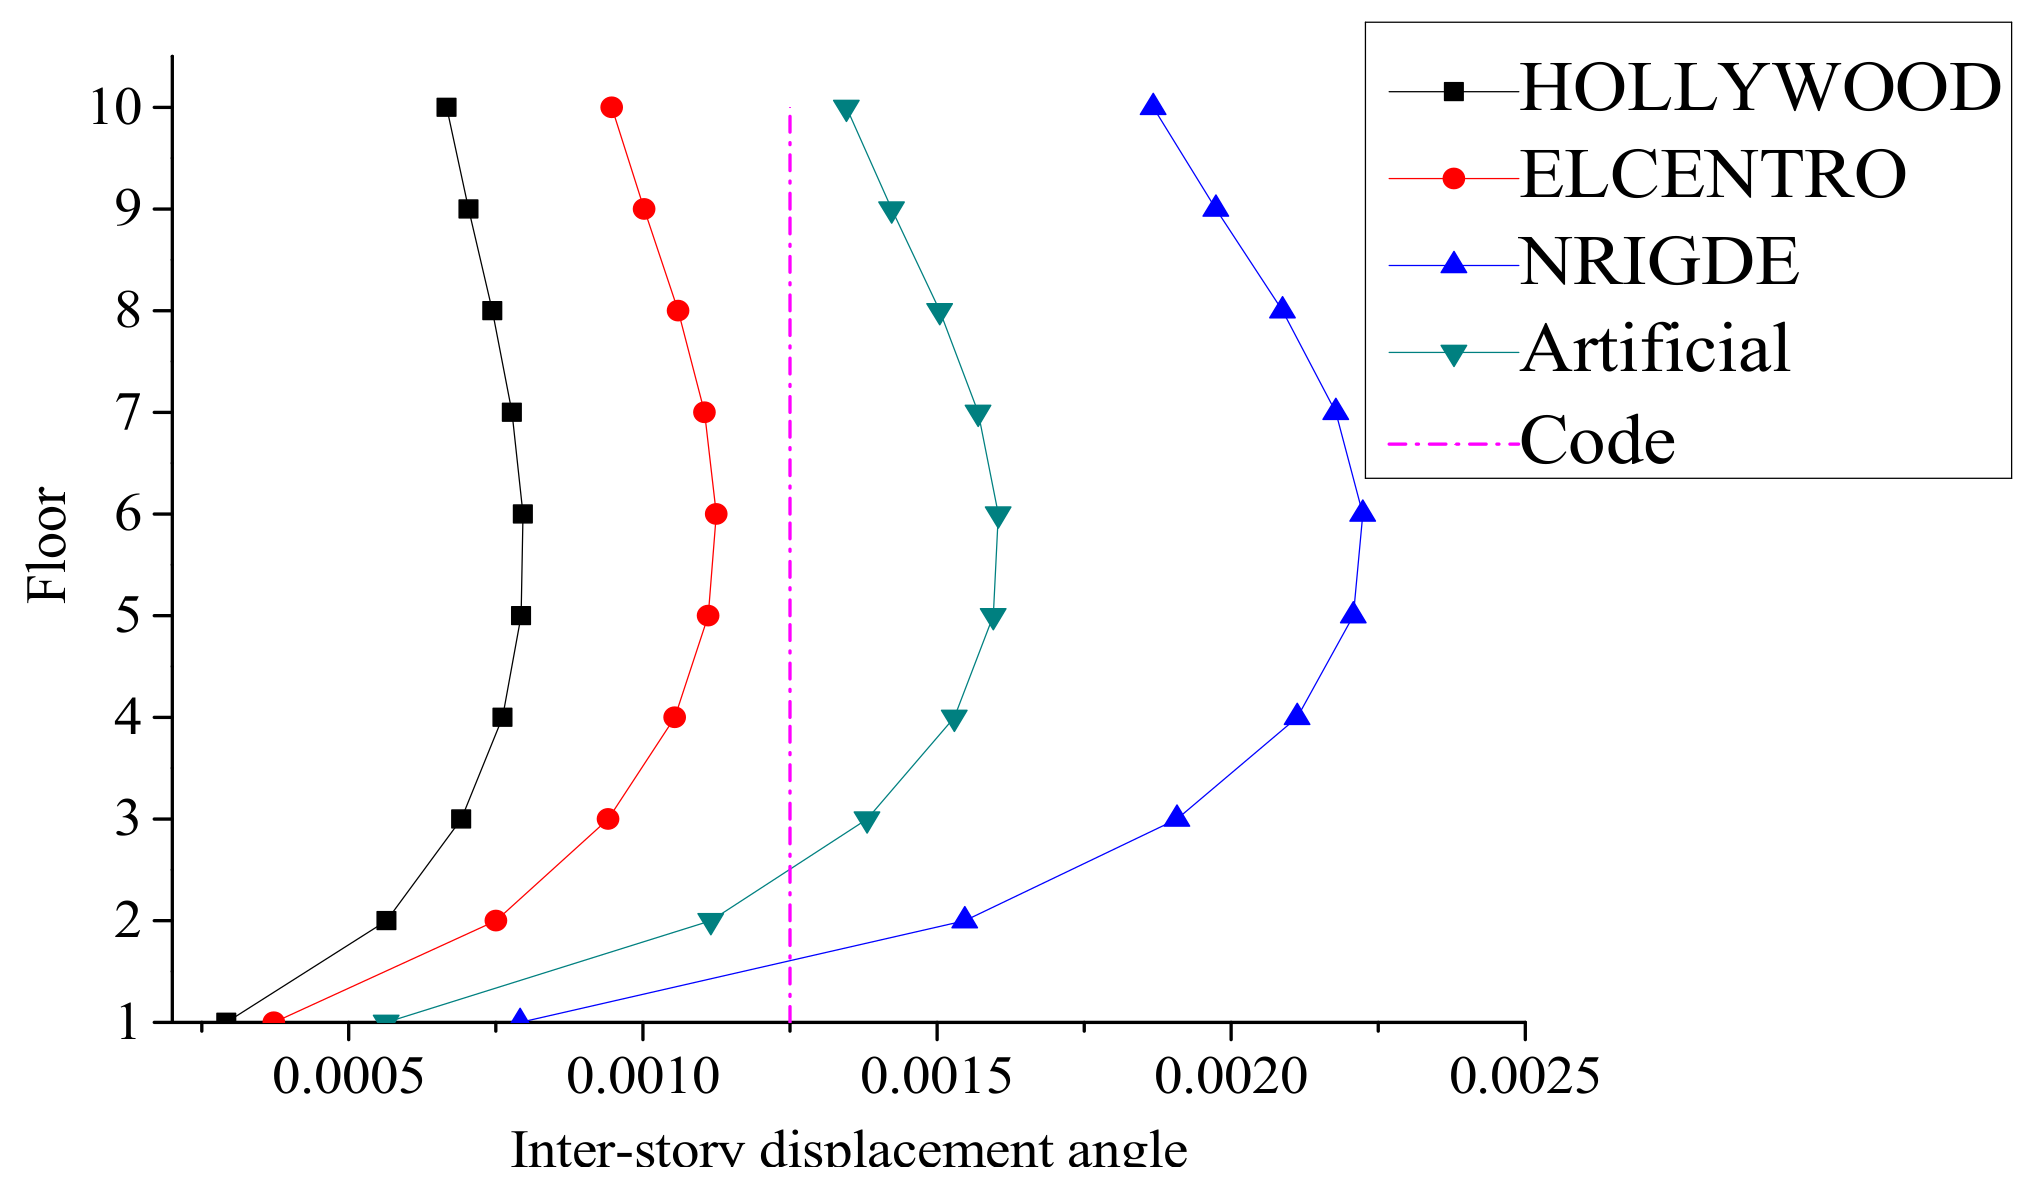
The nonlinear dynamic analysis is to simulate the structure under earthquake action with critical component removal. Under the influences of different seismic waves, the displacement-time curves of the top floor are shown in Figure 17, the inter-story displacement angles θ of structure are shown in Figure 18. It can be seen the maximum inter-story displacement angle θmax is located at the 6th floor when subjected to HOLLYWOOD and ELCENTRO waves, and the value is within the code limitation. When subjected to NRIDGE and artificial waves, the value reached 0.0016 and 0.0022, which exceed the specified limitation.
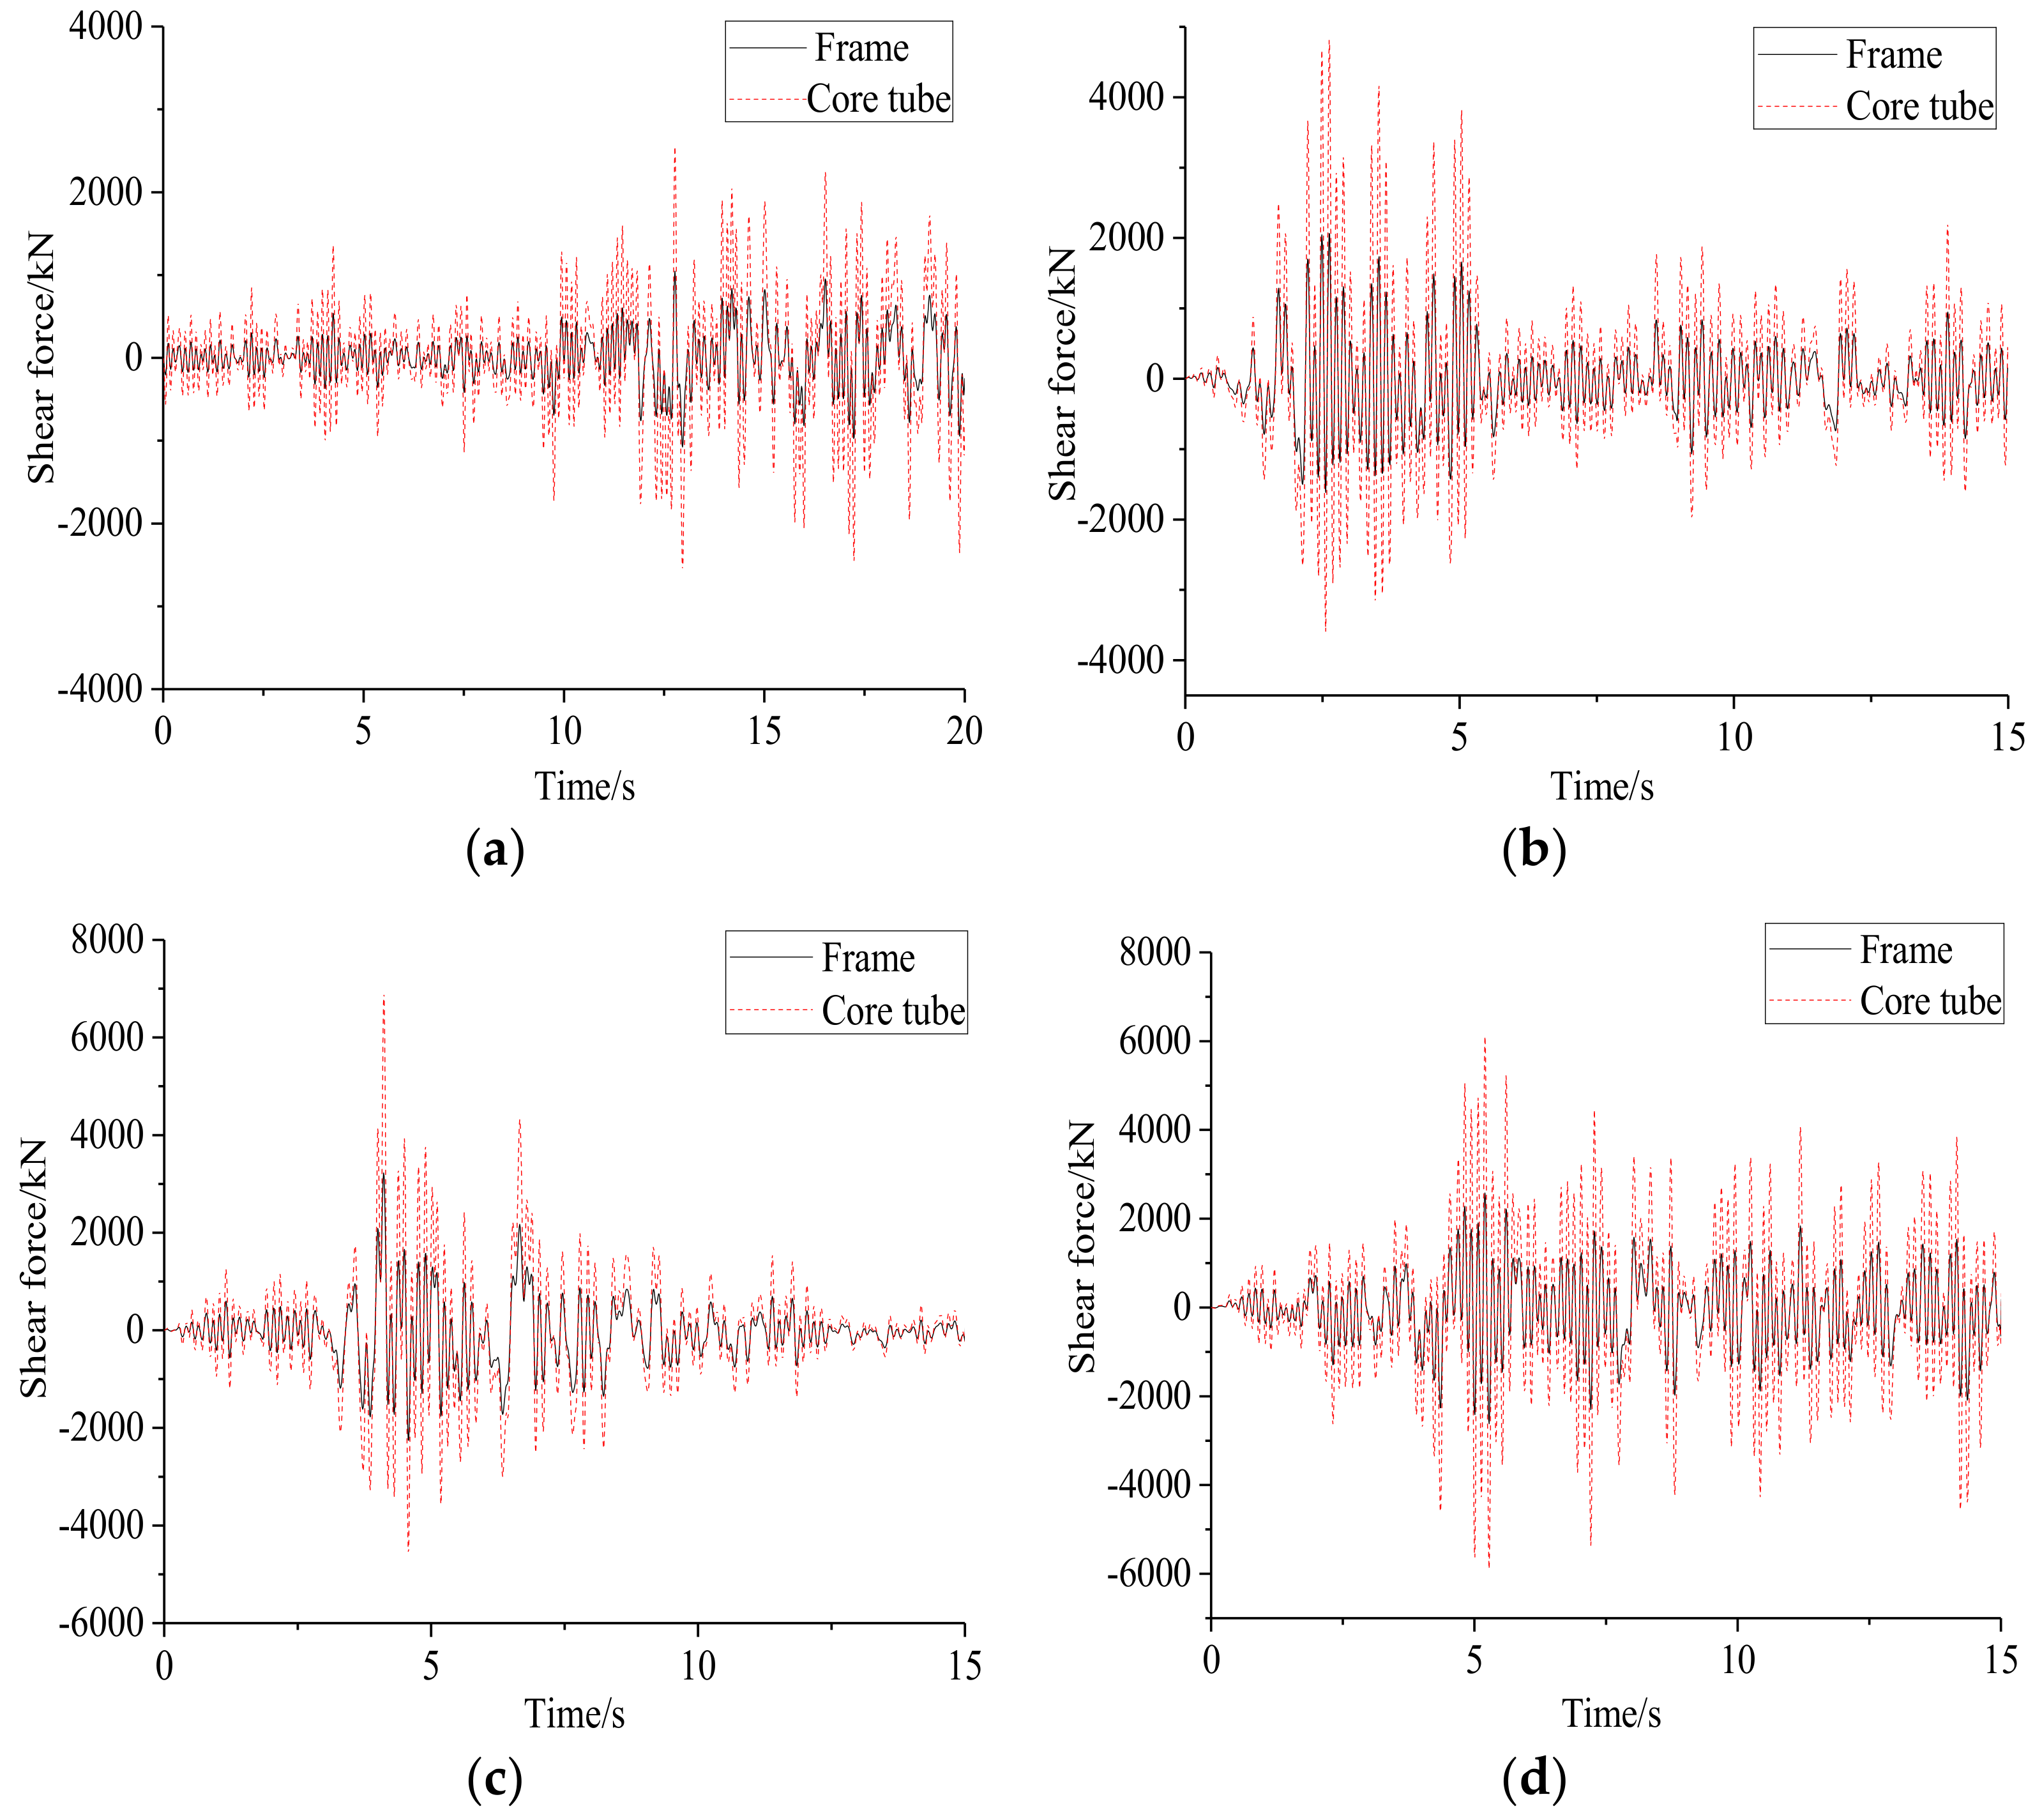
Figure 19 shows shear distribution between the ground frame and core tube. At the initial stage, the shear ratios of frame to core tube under HOLLYWOOD, ELCENTRO, NRIGDE and artificial seismic waves are 1:3.29, 1:3.17, 1:3.01, and 1:2.96 respectively. The core tube is responsible for the majority of the lateral load. With the stiffness degradation of the core tube, the shear ratios of frame to core tube change to 1: 2.35, 1:2.28, 1:2.18, and 1:2.14 respectively. It means that the core tube plays a role as the first line of defense against lateral load, and the frame plays a role as the second line of defense against lateral load.
Table 11 shows force condition of beams adjacent to C1 after the sudden failure of C1 under earthquake action. The maximum DCR value of the beams is smaller than 2.0 in the cases of HOLLYWOOD and ELCENTRO seismic waves. In the cases of NRIGDE and Artificial seismic wave, the maximum DCR value of B8 and B10 are 2.92 and 3.04, greater than 2.0. That is to say, the progressive collapse will not occur under the failure of the C1 scenario when subjected to the frequent earthquake or fortification earthquake, but it will occur when subjected to the rare earthquake. Compared to Table 9 in nonlinear static analysis, the loads transferred to B4 and B10 are increased while the load transferred to B8 is reduced. The reason for these changes is the frame has played a greater role of defense against the earthquake load.
4.5.2. The Results from Cases 2 to Case 5
Table 12 shows the θmax of structure. It can be seen, when the structure is subjected to the same seismic wave, the θmax in case 3 is smaller than other cases. Compared to case 4, the horizontal displacement of structure becomes obviously smaller in case 5.
Table 13 shows the shear distribution between the frame and core tube. It is obvious that the core tube is responsible for more shear than the frame. It obviously increases the shear the frame bears in the cases of shear wall removal. That means the shear is redistributed, the core tube plays a role as the first line of defense against lateral load, and the frame plays a role as the second line of defense against lateral load. Compared to the shear distribution between the ground frame and core tube in case 1, it can be found that the portion of shear assumed by the frame in case 5 is more than double of it in case 1.
Table 14 shows force condition of beams. Compared to Table 10 in nonlinear static analysis, DCRs of the corresponding component in nonlinear dynamic analysis become obviously larger. With increasing earthquake intensity, the DCR under the failure of W2 is larger than 2.0, even in the frequent earthquake. DCR under the failure of W1 and W2 is larger than DCR under the failure of columns. Compared to the failure of C1, the DCR of adjacent beams becomes obviously larger under the failure of C2. That is to say, the failure of the corner column is more likely to cause progressive collapse of the structure than failure of side column. Moreover, the DCRs of adjacent beams under the failure of C1 are obviously larger than that under the failure of C3. That is to say, the failure of side columns is more likely to cause progressive collapse of structure. Compared to the failure of W1, DCRs of adjacent beams become obviously larger under the failure of W2. The failure of shear wall without opening is more likely to cause progressive collapse. Compared to Table 10 in nonlinear static analysis, in terms of cases 2, 4 and 5, due to the structural symmetry, the change of load transfer is not obvious. However, it is obvious for case 3, similar to case 1, the loads transferred to B1 and B2 are increased while the load transferred to B5 is reduced.
5. Conclusions
In this paper, a 3-D finite element model was first built with the OpenSees software to simulate the behavior of SRC frame-RC core tube hybrid buildings under sudden component removal. The method and principle for the modeling techniques and progressive analysis are described in detail. The model also incorporates non-linear material characteristics and non-linear geometric behavior. A 1/5 scaled, 10-story 3-bay model was built for the validation of the proposed modeling method. The numerical results are presented and compared to experimental data, a good agreement is obtained. Using the proposed model, the progressive collapse analysis under loss of key components and seismic waves input were conducted. The following conclusions can be drawn within the limitation of the current study presented in this paper.
Even though the progressive collapse is a rare event when subjected to only the loss of a column or shear wall, the possibility of progressive collapse should not be neglected. When the seismic wave was entered into the component removed model, especially the model under the loss of shear wall scenario, DCR of the adjacent beams significantly increased. For the SRC frame-RC core tube hybrid structure, the possibility of progressive collapse increases with the increase of earthquake intensity, especially under the loss of shear wall scenario.
In this paper, the portion of shear assumed by the frame in case 5 is more than double of that in case 1 under a seismic wave. A loss of the W5 seriously weakened the carrying capacity of the core tube. Under the same general conditions, removal of a shear wall is the most likely to cause progressive collapse, and then next likely is removal of a corner column, and lastly removal of a side column. In addition, removal of a shear wall without opening is more likely to cause progressive collapse than the shear wall with opening.
When subjected to the loss of component and earthquake, the internal forces will be redistributed between the frame and core tube and the frame is responsible for more load. The concept of multi-lines of seismic defense is reflected in SRC frame-RC core tube hybrid buildings. The core tube plays a role as the first line of defense against progressive collapse, the second line of collapse resistance is provided by the frame.
Author Contributions
All authors substantially contributed to this work. W.X. and X.C. were the scientific coordinator of the research, designed the experimental campaign and analyzed the results. Y.X. supervised all the research and revised the results. Y.C. and X.L. contributed on the experimental tests. All authors helped with the writing of the paper and give final approval of the version to be submitted and any revised versions.
Funding
The research presented in this paper was funded by Natural Science Foundation of Hubei Province of China (Grant No. 2016CFB604), Natural Science Foundation of China (Grant Nos. 51108041, 51378077), Science Foundation of the Education Department of Hubei Province of China (Grant No. D20161305), and it is grateful for their support.
Acknowledgments
It is very grateful for the supports from Lei Zeng.
Conflicts of Interest
The authors declare no conflict of interest.
References
- Zeng, L.; Parvasi, S.M.; Kong, Q.; Huo, L.; Lim, I.; Li, M.; Song, G. Bond slip detection of concrete-encased composite structure using shear wave based active sensing approach. Smart. Mater. Struct. 2015, 24, 125026. [Google Scholar] [CrossRef]
- Xu, C.H.; Zeng, L.; Zhou, Q.; Tu, X.; Wu, Y. Cyclic performance of concrete-encased composite columns with t-shaped steel sections. Int. J. Civ. Eng. 2015, 13, 456–467. [Google Scholar]
- Xiao, Y.F.; Zeng, L.; Cui, Z.K.; Jin, S.Q.; Chen, Y.G. Experimental and analytical performance evaluation of steel beam to concrete-encased composite column with unsymmetrical steel section joints. Steel Compos. Struct. 2017, 23, 17–29. [Google Scholar] [CrossRef]
- Xue, J.; Lavorato, D.; Bergami, A.; Nuti, C.; Briseghella, B.; Marano, G.; Ji, T.; Vanzi, I.; Tarantino, A.; Santini, S. Severely Damaged Reinforced Concrete Circular Columns Repaired by Turned Steel Rebar and High-Performance Concrete Jacketing with Steel or Polymer Fibers. Appl. Sci. 2018, 8, 1671. [Google Scholar] [CrossRef]
- Fiore, A.; Marano, G.C.; Laucelli, D.; Monaco, P. Evolutionary modeling to evaluate the shear behavior of circular reinforced concrete columns. Adv. Civ. Eng. 2014, 2014, 169–182. [Google Scholar] [CrossRef]
- Zeng, L.; Xiao, Y.; Chen, Y.; Jin, S.; Xie, W.; Li, X. Seismic Damage Evaluation of Concrete-Encased Steel Frame-Reinforced Concrete Core Tube Buildings Based on Dynamic Characteristics. Appl. Sci. 2017, 7, 314. [Google Scholar] [CrossRef]
- Tavakoli, H.R.; Afrapoli, M.M.; Tavakoli, H.R. Robustness analysis of steel structures with various lateral load resisting systems under the seismic progressive collapse. Eng. Fail. Anal. 2018, 83, 88–101. [Google Scholar] [CrossRef]
- Shi, Y.C.; Li, Z.X.; Hao, H. A new method for progressive collapse analysis of RC frames under blast loading. Eng. Struct. 2010, 32, 1691–1703. [Google Scholar] [CrossRef]
- Kodur, V.K.; Naser, M.; Pakala, P.; Varma, A. Modeling the response of composite beam–slab assemblies exposed to fire. J. Constr. Steel Res. 2013, 80, 163–173. [Google Scholar] [CrossRef]
- General Services Administration. Progressive Collapse Analysis and Design Guidelines for New Federal Office Buildings and Major Modernization Projects; General Services Administration: Washington, DC, USA, 2003. [Google Scholar]
- Department of Defense. Unified Facilities Criteria: Design of Buildings to Resist Progressive Collapse; UFC 4-023-03; Department of Defense: Washington, DC, USA, 2013. [Google Scholar]
- Li, H.; Cai, X.; Zhang, L.; Zhang, B.; Wang, W.; Li, H. Progressive collapse of steel moment-resisting frame subjected to loss of interior column: Experimental tests. Eng. Struct. 2017, 150, 203–220. [Google Scholar] [CrossRef]
- Forquin, P.; Chen, W. An experimental investigation of the progressive collapse resistance of beam-column RC sub-assemblages. Constr. Build. Mater. 2017, 152, 1068–1084. [Google Scholar] [CrossRef]
- Song, B.I.; Sezen, H. Experimental and analytical progressive collapse assessment of a steel frame building. Eng. Struct. 2013, 56, 664–672. [Google Scholar] [CrossRef]
- Guo, L.; Gao, S.; Fu, F.; Wang, Y. Experimental study and numerical analysis of progressive collapse resistance of composite frames. J. Constr. Steel Res. 2013, 89, 236–251. [Google Scholar] [CrossRef] [Green Version]
- Lu, X.; Lin, K.; Li, Y.; Guan, H.; Ren, P.; Zhou, Y. Experimental investigation of RC beam-slab substructures against progressive collapse subject to an edge-column-removal scenario. Eng. Struct. 2017, 149, 91–103. [Google Scholar] [CrossRef]
- Wang, T.; Chen, Q.; Zhao, H.; Zhang, L. Experimental study on progressive collapse performance of frame with specially shaped columns subjected to middle column removal. Shock Vib. 2016, 2016, 7956189. [Google Scholar] [CrossRef]
- Cosgun, T.; Sayin, B. Damage assessment of RC flat slabs partially collapsed due to punching shear. Int. J. Civ. Eng. 2017, 16, 725–737. [Google Scholar] [CrossRef]
- Lima, C.; Martinelli, E.; Macorini, L.; Izzuddin, B.A. Modelling beam-to-column joints in seismic analysis of RC frames. Earthq. Struct. 2017, 12, 119–133. [Google Scholar] [CrossRef]
- Boonmee, C.; Rodsin, K.; Sriboonma, K. Gravity load collapse behavior of nonengineered reinforced concrete columns. Adv. Civ. Eng. 2018, 2018, 9450978. [Google Scholar] [CrossRef]
- Zhang, Q.; Li, Y. The performance of resistance progressive collapse analysis for high-rise frame-shear structure based on opensees. Shock Vib. 2017, 2017, 3518232. [Google Scholar] [CrossRef]
- Li, S.; Shan, S.; Zhai, C.; Xie, L. Experimental and numerical study on progressive collapse process of rc frames with full-height infill walls. Eng. Fail. Anal. 2016, 59, 57–68. [Google Scholar] [CrossRef]
- Tavakoli, H.R.; Hasani, A.H. Effect of Earthquake characteristics on seismic progressive collapse potential in steel moment resisting frame. Earthq. Struct. 2017, 12, 529–541. [Google Scholar]
- Eskandari, R.; Vafaei, D.; Vafaei, J.; Shemshadian, M.E. Nonlinear static and dynamic behavior of reinforced concrete steel-braced frames. Earthq. Struct. 2017, 12, 191–200. [Google Scholar] [CrossRef]
- Elshaer, A.; Mostafa, H.; Salem, H. Progressive collapse assessment of multistory reinforced concrete structures subjected to seismic actions. KSCE J. Civ. Eng. 2017, 21, 184–194. [Google Scholar] [CrossRef]
- Ferraioli, M. Dynamic increase factor for nonlinear static analysis of rc frame buildings against progressive collapse. Int. J. Civ. Eng. 2017, 1–23. [Google Scholar] [CrossRef]
- Ellobody, E.; Young, B. Numerical simulation of concrete encased steel composite columns. J. Constr. Steel Res. 2011, 67, 211–222. [Google Scholar] [CrossRef]
- Weng, J.; Tan, K.H.; Lee, C.K. Adaptive superelement modeling for progressive collapse analysis of reinforced concrete frames. Eng. Struct. 2017, 151, 136–152. [Google Scholar] [CrossRef]
- Adom-Asamoah, M.; Banahene, J.O. Nonlinear seismic analysis of a super 13-element reinforced concrete beam-column joint model. Earthq. Struct. 2016, 11, 905–924. [Google Scholar] [CrossRef]
- Psyrras, N.K.; Sextos, A.G. Build-x: Expert system for seismic analysis and assessment of 3d buildings using opensees. Adv. Eng. Softw. 2018, 116, 23–35. [Google Scholar] [CrossRef]
- Lu, X.; Xie, L.; Guan, H.; Huang, Y.; Lu, X. A shear wall element for nonlinear seismic analysis of super-tall buildings using opensees. Finite Elem. Anal. Des. 2015, 98, 14–25. [Google Scholar] [CrossRef]
- China Academy of Building Research. Code for Design of Steel Structure; China Architecture & Building Press: Beijing, China, 2010. [Google Scholar]
- China Academy of Building Research. Code for Seismic Design of Buildings; China Architecture & Building Press: Beijing, China, 2010. [Google Scholar]
- China Academy of Building Research. Technical Specification for Concrete Structures of Tall Building; China Architecture & Building Press: Beijing, China, 2010. [Google Scholar]
- China Academy of Building Research. Load Code for the Design of Building Structures; China Architecture & Building Press: Beijing, China, 2012. [Google Scholar]
- Luco, N.; Bazzurro, P.; Cornell, C.A. Dynamic versus static computation of the residual capacity of a mainshock-damaged building to withstand an aftershock. In Proceedings of the 13th World Conference on Earthquake Engineering, Vancouver, BC, Canada, 1–6 August 2004. [Google Scholar]
- Li, Q.; Ellingwood, B.R. Performance evaluation and damage assessment of steel frame buildings under main shock–aftershock earthquake sequences. Earthq. Eng. Struct. D 2010, 36, 405–427. [Google Scholar] [CrossRef]
- Kent, D. Flexural members with confined concrete. J. Struct. Div. 1971, 97, 1969–1990. [Google Scholar]
Figure 1.
Plan arrangement (units: mm).

Figure 2.
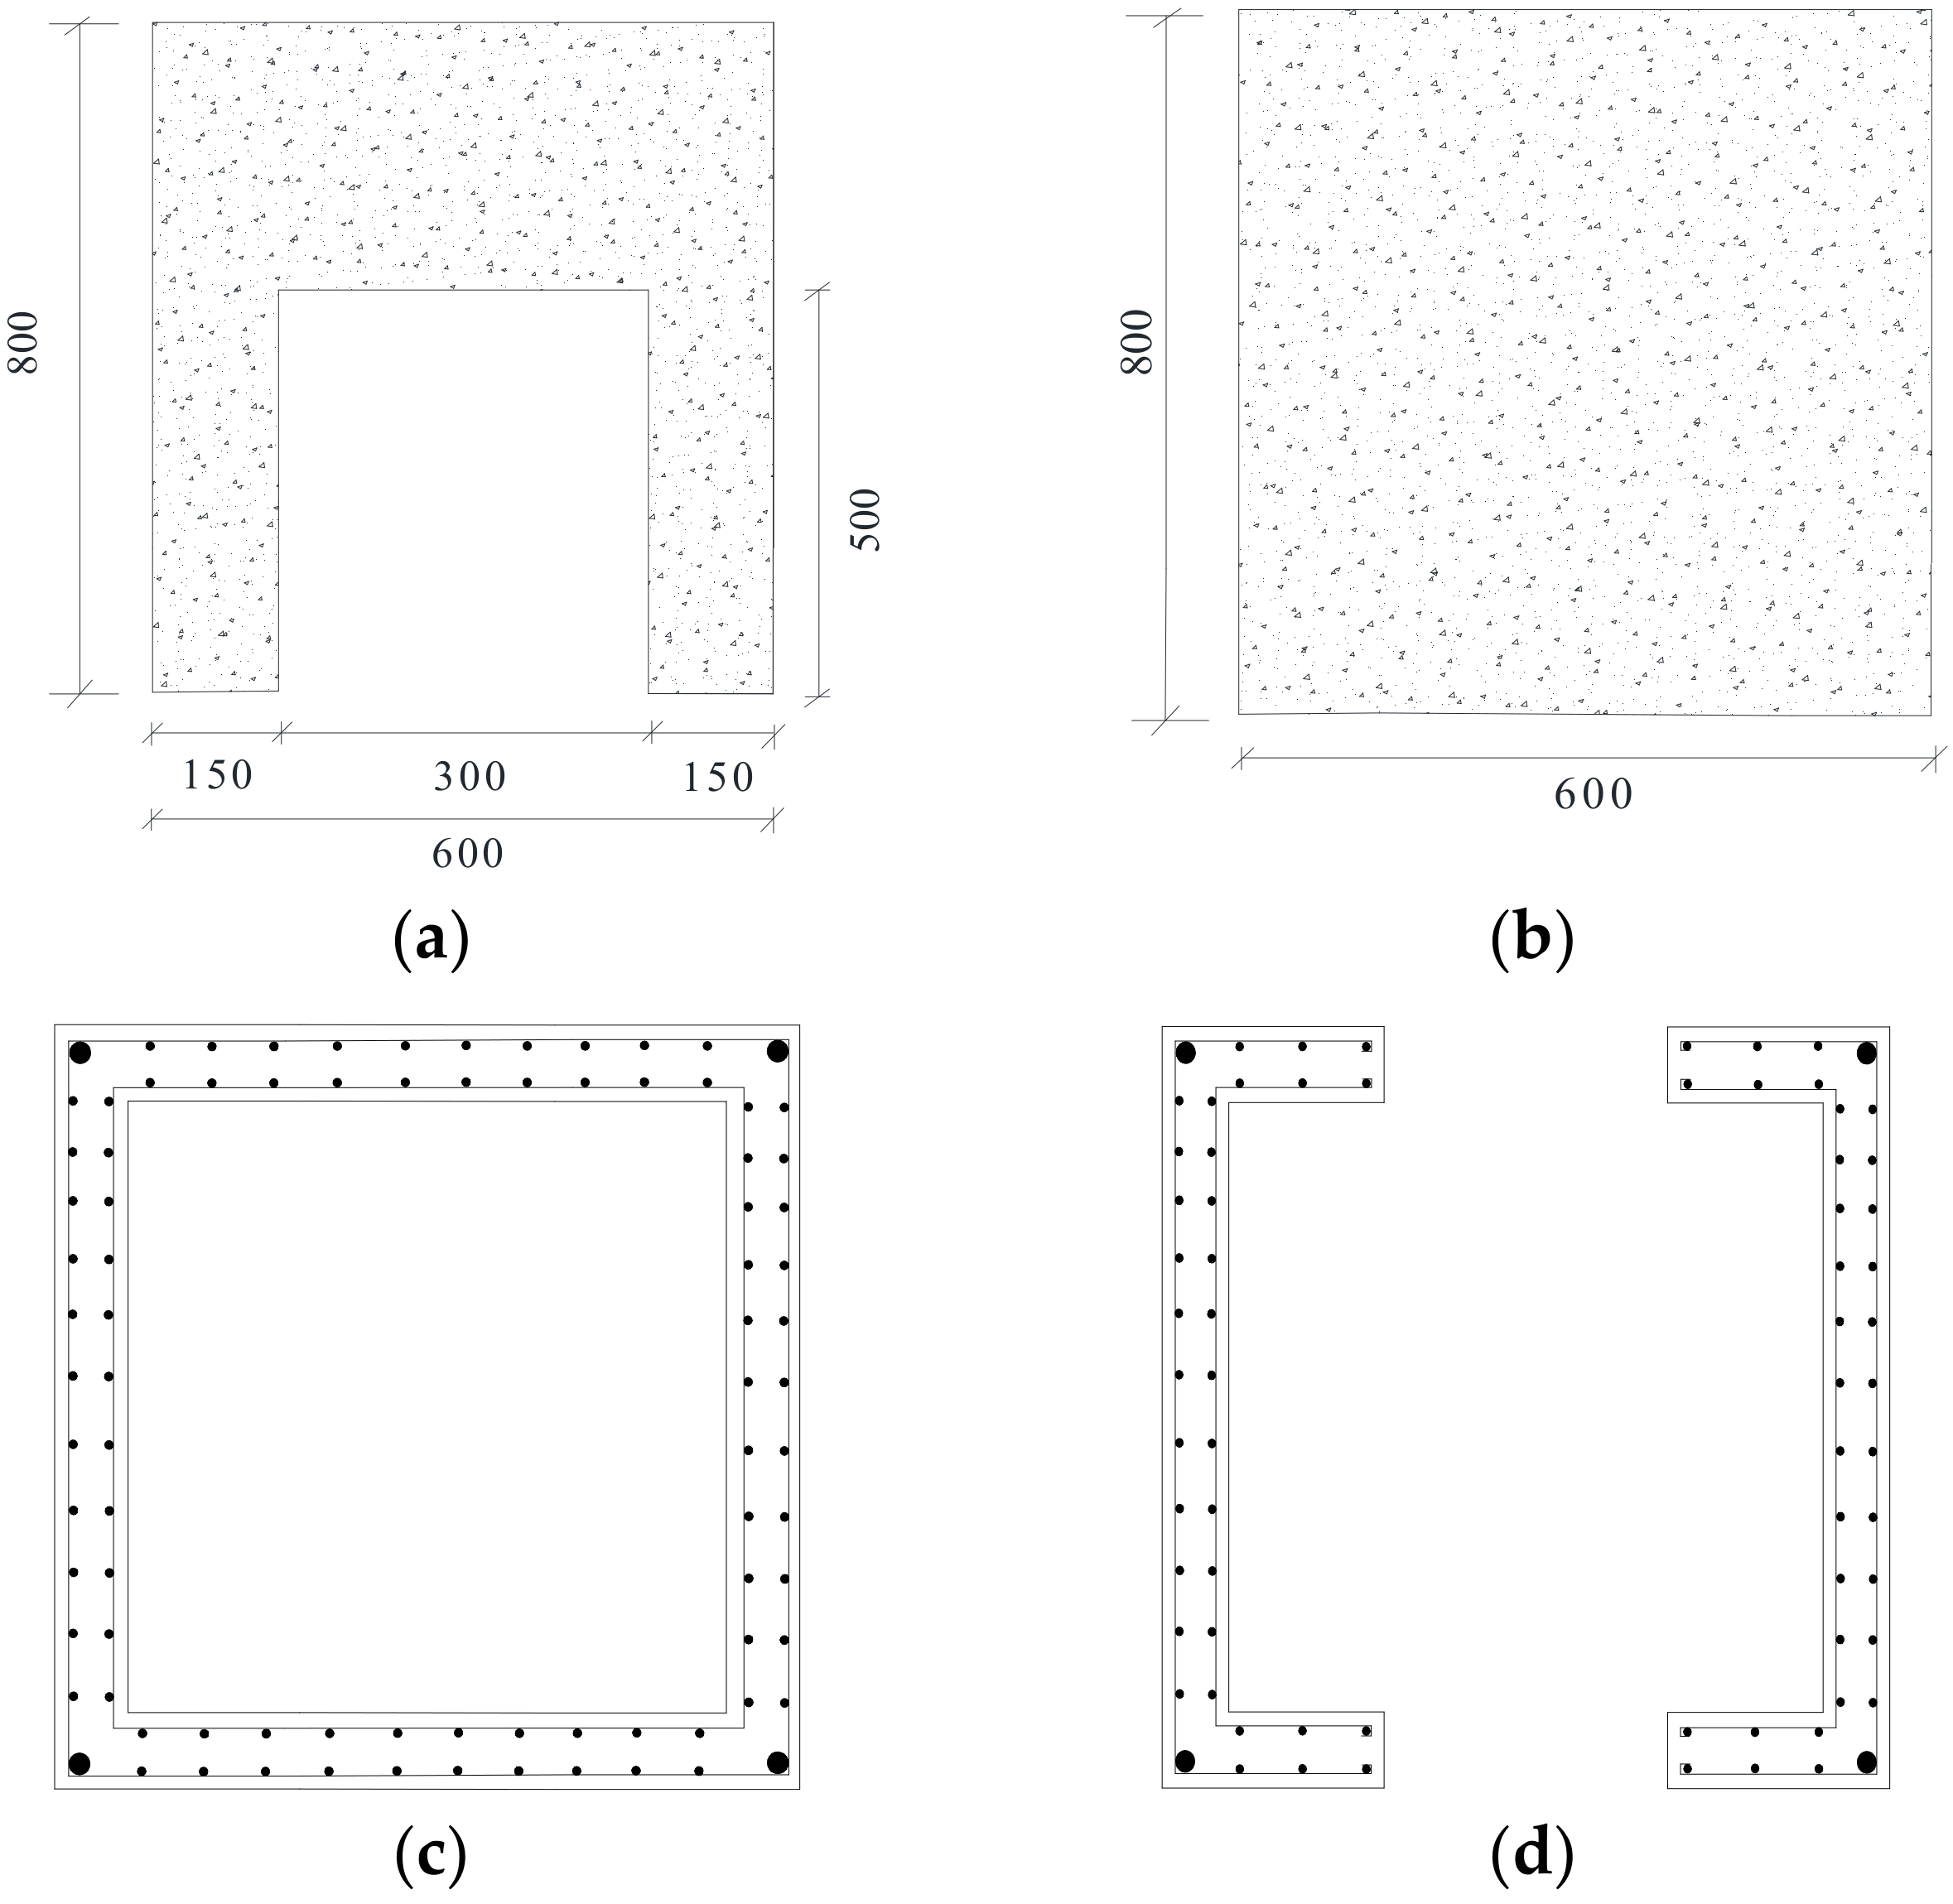
Details of core tube: (a) the south and north shear wall, (b) the west and east shear wall, (c) the reinforcement in the shear wall and (d) the reinforcement in the opening. (units: mm).
Figure 2.
Details of core tube: (a) the south and north shear wall, (b) the west and east shear wall, (c) the reinforcement in the shear wall and (d) the reinforcement in the opening. (units: mm).

Figure 3.
Details of components: (a) steel reinforced concrete (SRC) column and (b) steel beam. (units: mm).
Figure 3.
Details of components: (a) steel reinforced concrete (SRC) column and (b) steel beam. (units: mm).

Figure 4.
Test setup: (a) Test specimen and (b) Arrangement of instruments.

Figure 5.
History of loading program.

Figure 6.
Test results: (a) The hysteretic curve and (b) lateral displacement.

Figure 7.
Constitutive model of materials: (a) constitutive model of steel and (b) constitutive model of concrete.
Figure 7.
Constitutive model of materials: (a) constitutive model of steel and (b) constitutive model of concrete.

Figure 8.
Fiber sections: (a) beam, (b) column and (c) wall and floor.

Figure 9.
The finite element (FE) model.

Figure 10.
Comparison of hysteretic and skeleton curves: (a) Hysteretic curve and (b) Skeleton curve.
Figure 10.
Comparison of hysteretic and skeleton curves: (a) Hysteretic curve and (b) Skeleton curve.

Figure 11.
Comparison of lateral displacement.

Figure 12.
Acceleration-time curves: (a) HOLLYWOOD, (b) ELCENTRO, (c) NRIGDE and (d) artificial wave.
Figure 12.
Acceleration-time curves: (a) HOLLYWOOD, (b) ELCENTRO, (c) NRIGDE and (d) artificial wave.

Figure 13.
Response spectra of seismic waves.

Figure 14.
Location of members at the first floor: (a) location of key components and (b) location of the adjacent beams.
Figure 14.
Location of members at the first floor: (a) location of key components and (b) location of the adjacent beams.

Figure 15.
Displacement of structure in case 1.

Figure 16.
Displacement of structure in (a) case 2, (b) case 3, (c) case 4 and (d) case 5.

Figure 17.
Displacement-time curve of top under different seismic wave in case 1: (a) HOLLYWOOD, (b) ELCENTRO, (c) NRIGDE and (d) Artificial wave.
Figure 17.
Displacement-time curve of top under different seismic wave in case 1: (a) HOLLYWOOD, (b) ELCENTRO, (c) NRIGDE and (d) Artificial wave.

Figure 18.
Inter-story displacement angle in case 1.

Figure 19.
Shear distribution of bottom under different seismic wave in case 1: (a) HOLLYWOOD, (b) ELCENTRO, (c) NRIGDE and (d) Artificial wave.
Figure 19.
Shear distribution of bottom under different seismic wave in case 1: (a) HOLLYWOOD, (b) ELCENTRO, (c) NRIGDE and (d) Artificial wave.


Table 1.
Properties of Concrete.
| Concrete Strength Grade | Concrete Compressive Strength/MPa | Elastic Modulus/MPa |
|---|---|---|
| C40 | 41.5 | 3.03 × 10⁴ |
Table 2.
Properties of steel.
| Material | Yield Strength/MPa | Ultimate Strength/MPa | Elastic Modulus/MPa |
|---|---|---|---|
| Φ4 bar | 305 | 424 | 2.1 × 10⁵ |
| Steel plate | 327 | 463 | 2.0 × 10⁵ |
Table 3.
Test value of frequencies.
| Vibration Modes | Initial State | Failure State |
|---|---|---|
| Test Value/Hz | Test Value/Hz | |
| 1 | 5.94 | 3.26 |
| 2 | 18.98 | 6.22 |
| 3 | 25.13 | 15.96 |
| 4 | 37.93 | 31.82 |
| 5 | 50.03 | 42.01 |
Table 4.
Comparison of characteristic value.
| Load | Direction | Test Value/kN | Calculating Value/kN | Absolute Error/% |
|---|---|---|---|---|
| Py | Positive | 238.49 | 256.72 | 7.64 |
| Negative | −243.52 | −251.89 | 3.43 | |
| Pmax | Positive | 351.72 | 373.69 | 6.24 |
| Negative | −356.12 | −333.91 | 6.23 | |
| Pu | Positive | 308.47 | 338.44 | 9.72 |
| Negative | −304.96 | −300.55 | 1.44 |
where, Py, Pmax and Pu are yield strength, ultimate strength and failure strength respectively.
Table 5.
Comparison of frequencies.
| Vibration Modes | Initial State | Failure State | ||||
|---|---|---|---|---|---|---|
| Test Value/Hz | Calculating Value/Hz | Absolute Error/% | Test Value/Hz | Calculating Value/Hz | Absolute Error/% | |
| 1 | 5.94 | 5.86 | 1.31 | 3.26 | 3.35 | 2.73 |
| 2 | 18.98 | 18.13 | 4.50 | 6.22 | 6.01 | 3.23 |
| 3 | 25.13 | 23.97 | 4.60 | 15.96 | 15.25 | 4.47 |
| 4 | 37.93 | 36.47 | 3.87 | 31.82 | 32.47 | 2.06 |
| 5 | 50.03 | 48.43 | 3.20 | 42.01 | 40.85 | 2.76 |
Table 6.
PGA of seismic waves.
| Number | Seismic Wave | PGA/g |
|---|---|---|
| 1 | HOLLYWOOD | 0.041 |
| 2 | ELCENTRO | 0.278 |
| 3 | NRIGDE | 0.603 |
| 4 | Artificial wave | 0.540 |
Table 7.
/Gal of seismic waves.
| Earthquake Intensity | 7 | 8 | 9 |
|---|---|---|---|
| Frequently occurring | 35 | 70 | 140 |
| Moderate | 107 | 215 | 429 |
| Rarely expected | 220 | 400 | 620 |
Table 8.
Progressive analysis cases.
| Case | 1 | 2 | 3 | 4 | 5 |
|---|---|---|---|---|---|
| Removed component | C1 | C2 | C3 | W1 | W2 |
Table 9.
Force condition of beams in case 1.
| Case | Beam Number | Direction | Bending Moment/kN·m | Portion (%) | Average Value (%) | DCR |
|---|---|---|---|---|---|---|
| 1 (C1) | B4 | Positive | 110.00 | 15.69 | 20.06 | 0.23 |
| Negative | −202.50 | 24.43 | 0.42 | |||
| B8 | Positive | 280.00 | 39.92 | 45.23 | 0.58 | |
| Negative | −418.75 | 50.53 | 0.86 | |||
| B10 | Positive | 311.25 | 44.39 | 34.71 | 0.64 | |
| Negative | −207.50 | 25.04 | 0.43 |
Table 10.
Force condition of beams in cases 2, 3, 4 and 5.
| Case | Beam Number | Direction | Bending Moment/kN·m | Portion (%) | Average Value (%) | DCR |
|---|---|---|---|---|---|---|
| 2 (C2) | B1 | Positive | 213.75 | 33.79 | 50 | 0.44 |
| Negative | −428.75 | 66.21 | 0.88 | |||
| B4 | Positive | 418.75 | 67.39 | 50 | 0.86 | |
| Negative | −207.50 | 32.61 | 0.43 | |||
| 3 (C3) | B1 | Positive | 206.25 | 22.39 | 20.02 | 0.42 |
| Negative | −88.75 | 17.66 | 0.18 | |||
| B2 | Positive | 313.75 | 34.06 | 32.21 | 0.64 | |
| Negative | −142.50 | 28.36 | 0.29 | |||
| B5 | Positive | 401.25 | 43.55 | 48.77 | 0.82 | |
| Negative | −271.25 | 53.98 | 0.55 | |||
| 4 (W1) | B5 | Positive | 347.50 | 46.41 | 47.10 | 0.71 |
| Negative | −380.00 | 47.80 | 0.78 | |||
| B8 | Positive | 401.25 | 53.59 | 52.90 | 0.82 | |
| Negative | −415.00 | 52.20 | 0.85 | |||
| 5 (W2) | B5 | Positive | 497.50 | 55.43 | 56.59 | 1.02 |
| Negative | −440.00 | 57.74 | 0.90 | |||
| B8 | Positive | 400.00 | 44.57 | 43.41 | 0.82 | |
| Negative | −322.50 | 42.26 | 0.66 |
Table 11.
Force condition of beams in case 1.
| Case | Beam Number | Seismic Wave | Average Bending Moment/kN·m | Portion (%) | DCR |
|---|---|---|---|---|---|
| 1 (C1) | B4 | HOLLYWOOD | 457.50 | 27.98 | 0.94 |
| ELCENTRO | 558.75 | 23.99 | 1.15 | ||
| NRIGDE | 885.00 | 23.30 | 1.82 | ||
| Artificial wave | 763.75 | 22.36 | 1.57 | ||
| B8 | HOLLYWOOD | 555.00 | 33.95 | 1.14 | |
| ELCENTRO | 900.00 | 38.65 | 1.79 | ||
| NRIGDE | 1440.00 | 37.91 | 2.92 | ||
| Artificial wave | 1347.50 | 39.46 | 2.77 | ||
| B10 | HOLLYWOOD | 622.50 | 38.07 | 1.28 | |
| ELCENTRO | 870.00 | 37.36 | 1.87 | ||
| NRIGDE | 1473.75 | 38.79 | 3.04 | ||
| Artificial wave | 1303.75 | 38.18 | 2.68 |
Table 12.
The maximum inter-story displacement angle in cases 2, 3, 4 and 5.
| Case | Seismic Wave | θmax |
|---|---|---|
| 2 (C2) | HOLLYWOOD | 0.00078 |
| ELCENTRO | 0.00108 | |
| NRIGDE | 0.00206 | |
| Artificial wave | 0.00149 | |
| 3 (C3) | HOLLYWOOD | 0.00076 |
| ELCENTRO | 0.00105 | |
| NRIGDE | 0.00199 | |
| Artificial wave | 0.00142 | |
| 4 (W1) | HOLLYWOOD | 0.00077 |
| ELCENTRO | 0.00101 | |
| NRIGDE | 0.00209 | |
| Artificial wave | 0.00151 | |
| 5 (W2) | HOLLYWOOD | 0.00074 |
| ELCENTRO | 0.00093 | |
| NRIGDE | 0.00192 | |
| Artificial wave | 0.00136 |
Table 13.
Shear distribution in cases 2, 3, 4 and 5.
| Case | Seismic Wave | Shear Distribution |
|---|---|---|
| 2 (C2) | HOLLYWOOD | 1:1.76 |
| ELCENTRO | 1:2.19 | |
| NRIGDE | 1:2.01 | |
| Artificial wave | 1:2.17 | |
| 3 (C3) | HOLLYWOOD | 1:1.81 |
| ELCENTRO | 1:2.03 | |
| NRIGDE | 1:2.05 | |
| Artificial wave | 1:2.19 | |
| 4 (W1) | HOLLYWOOD | 1:1.37 |
| ELCENTRO | 1:1.61 | |
| NRIGDE | 1:1.47 | |
| Artificial wave | 1:1.59 | |
| 5 (W2) | HOLLYWOOD | 1:1.23 |
| ELCENTRO | 1:1.58 | |
| NRIGDE | 1:1.44 | |
| Artificial wave | 1:1.56 |
Table 14.
Force condition of beams in cases 2, 3, 4 and 5.
| Case | Beam Number | Seismic Wave | Average Bending Moment/kN·m | Portion (%) | DCR |
|---|---|---|---|---|---|
| 2 (C2) | B1 | HOLLYWOOD | 748.75 | 48.74 | 1.54 |
| ELCENTRO | 885.00 | 51.12 | 1.82 | ||
| NRIGDE | 1576.25 | 49.03 | 3.24 | ||
| Artificial wave | 1445.00 | 48.31 | 2.97 | ||
| B4 | HOLLYWOOD | 787.50 | 51.26 | 1.62 | |
| ELCENTRO | 846.25 | 48.88 | 1.74 | ||
| NRIGDE | 1638.75 | 50.97 | 3.37 | ||
| Artificial wave | 1546.25 | 51.69 | 3.18 | ||
| 3 (C3) | B1 | HOLLYWOOD | 365.00 | 25.44 | 0.75 |
| ELCENTRO | 447.50 | 22.13 | 0.92 | ||
| NRIGDE | 730.00 | 23.86 | 1.5 | ||
| Artificial wave | 627.50 | 22.70 | 1.29 | ||
| B2 | HOLLYWOOD | 622.50 | 43.38 | 1.28 | |
| ELCENTRO | 870.00 | 43.02 | 1.79 | ||
| NRIGDE | 1245.00 | 40.69 | 2.56 | ||
| Artificial wave | 1090.00 | 39.44 | 2.24 | ||
| B5 | HOLLYWOOD | 447.50 | 31.18 | 0.92 | |
| ELCENTRO | 705.00 | 34.86 | 1.45 | ||
| NRIGDE | 1085.00 | 35.46 | 2.23 | ||
| Artificial wave | 1046.25 | 37.86 | 2.15 | ||
| 4 (W1) | B5 | HOLLYWOOD | 602.50 | 48.20 | 1.24 |
| ELCENTRO | 782.50 | 40.94 | 1.61 | ||
| NRIGDE | 1426.25 | 47.90 | 2.93 | ||
| Artificial wave | 1196.25 | 46.68 | 2.46 | ||
| B8 | HOLLYWOOD | 647.50 | 51.80 | 1.33 | |
| ELCENTRO | 1128.75 | 59.06 | 2.32 | ||
| NRIGDE | 1551.25 | 52.10 | 3.19 | ||
| Artificial wave | 1366.25 | 53.32 | 2.81 | ||
| 5 (W2) | B5 | HOLLYWOOD | 715.00 | 47.59 | 1.47 |
| ELCENTRO | 1026.25 | 44.52 | 2.11 | ||
| NRIGDE | 1502.50 | 46.33 | 3.09 | ||
| Artificial wave | 1430.00 | 50.87 | 2.94 | ||
| B8 | HOLLYWOOD | 787.50 | 52.41 | 1.62 | |
| ELCENTRO | 1278.75 | 55.48 | 2.63 | ||
| NRIGDE | 1740.00 | 53.67 | 3.58 | ||
| Artificial wave | 1381.25 | 49.13 | 2.84 |
© 2018 by the authors. Licensee MDPI, Basel, Switzerland. This article is an open access article distributed under the terms and conditions of the Creative Commons Attribution (CC BY) license (http://creativecommons.org/licenses/by/4.0/).
Share and Cite
MDPI and ACS Style
Chen, X.; Xie, W.; Xiao, Y.; Chen, Y.; Li, X. Progressive Collapse Analysis of SRC Frame-RC Core Tube Hybrid Structure. Appl. Sci. 2018, 8, 2316. https://0-doi-org.brum.beds.ac.uk/10.3390/app8112316
AMA Style
Chen X, Xie W, Xiao Y, Chen Y, Li X. Progressive Collapse Analysis of SRC Frame-RC Core Tube Hybrid Structure. Applied Sciences. 2018; 8(11):2316. https://0-doi-org.brum.beds.ac.uk/10.3390/app8112316
Chicago/Turabian StyleChen, Xingxing, Wei Xie, Yunfeng Xiao, Yiguang Chen, and Xianjie Li. 2018. "Progressive Collapse Analysis of SRC Frame-RC Core Tube Hybrid Structure" Applied Sciences 8, no. 11: 2316. https://0-doi-org.brum.beds.ac.uk/10.3390/app8112316
Note that from the first issue of 2016, this journal uses article numbers instead of page numbers. See further details here.