Article

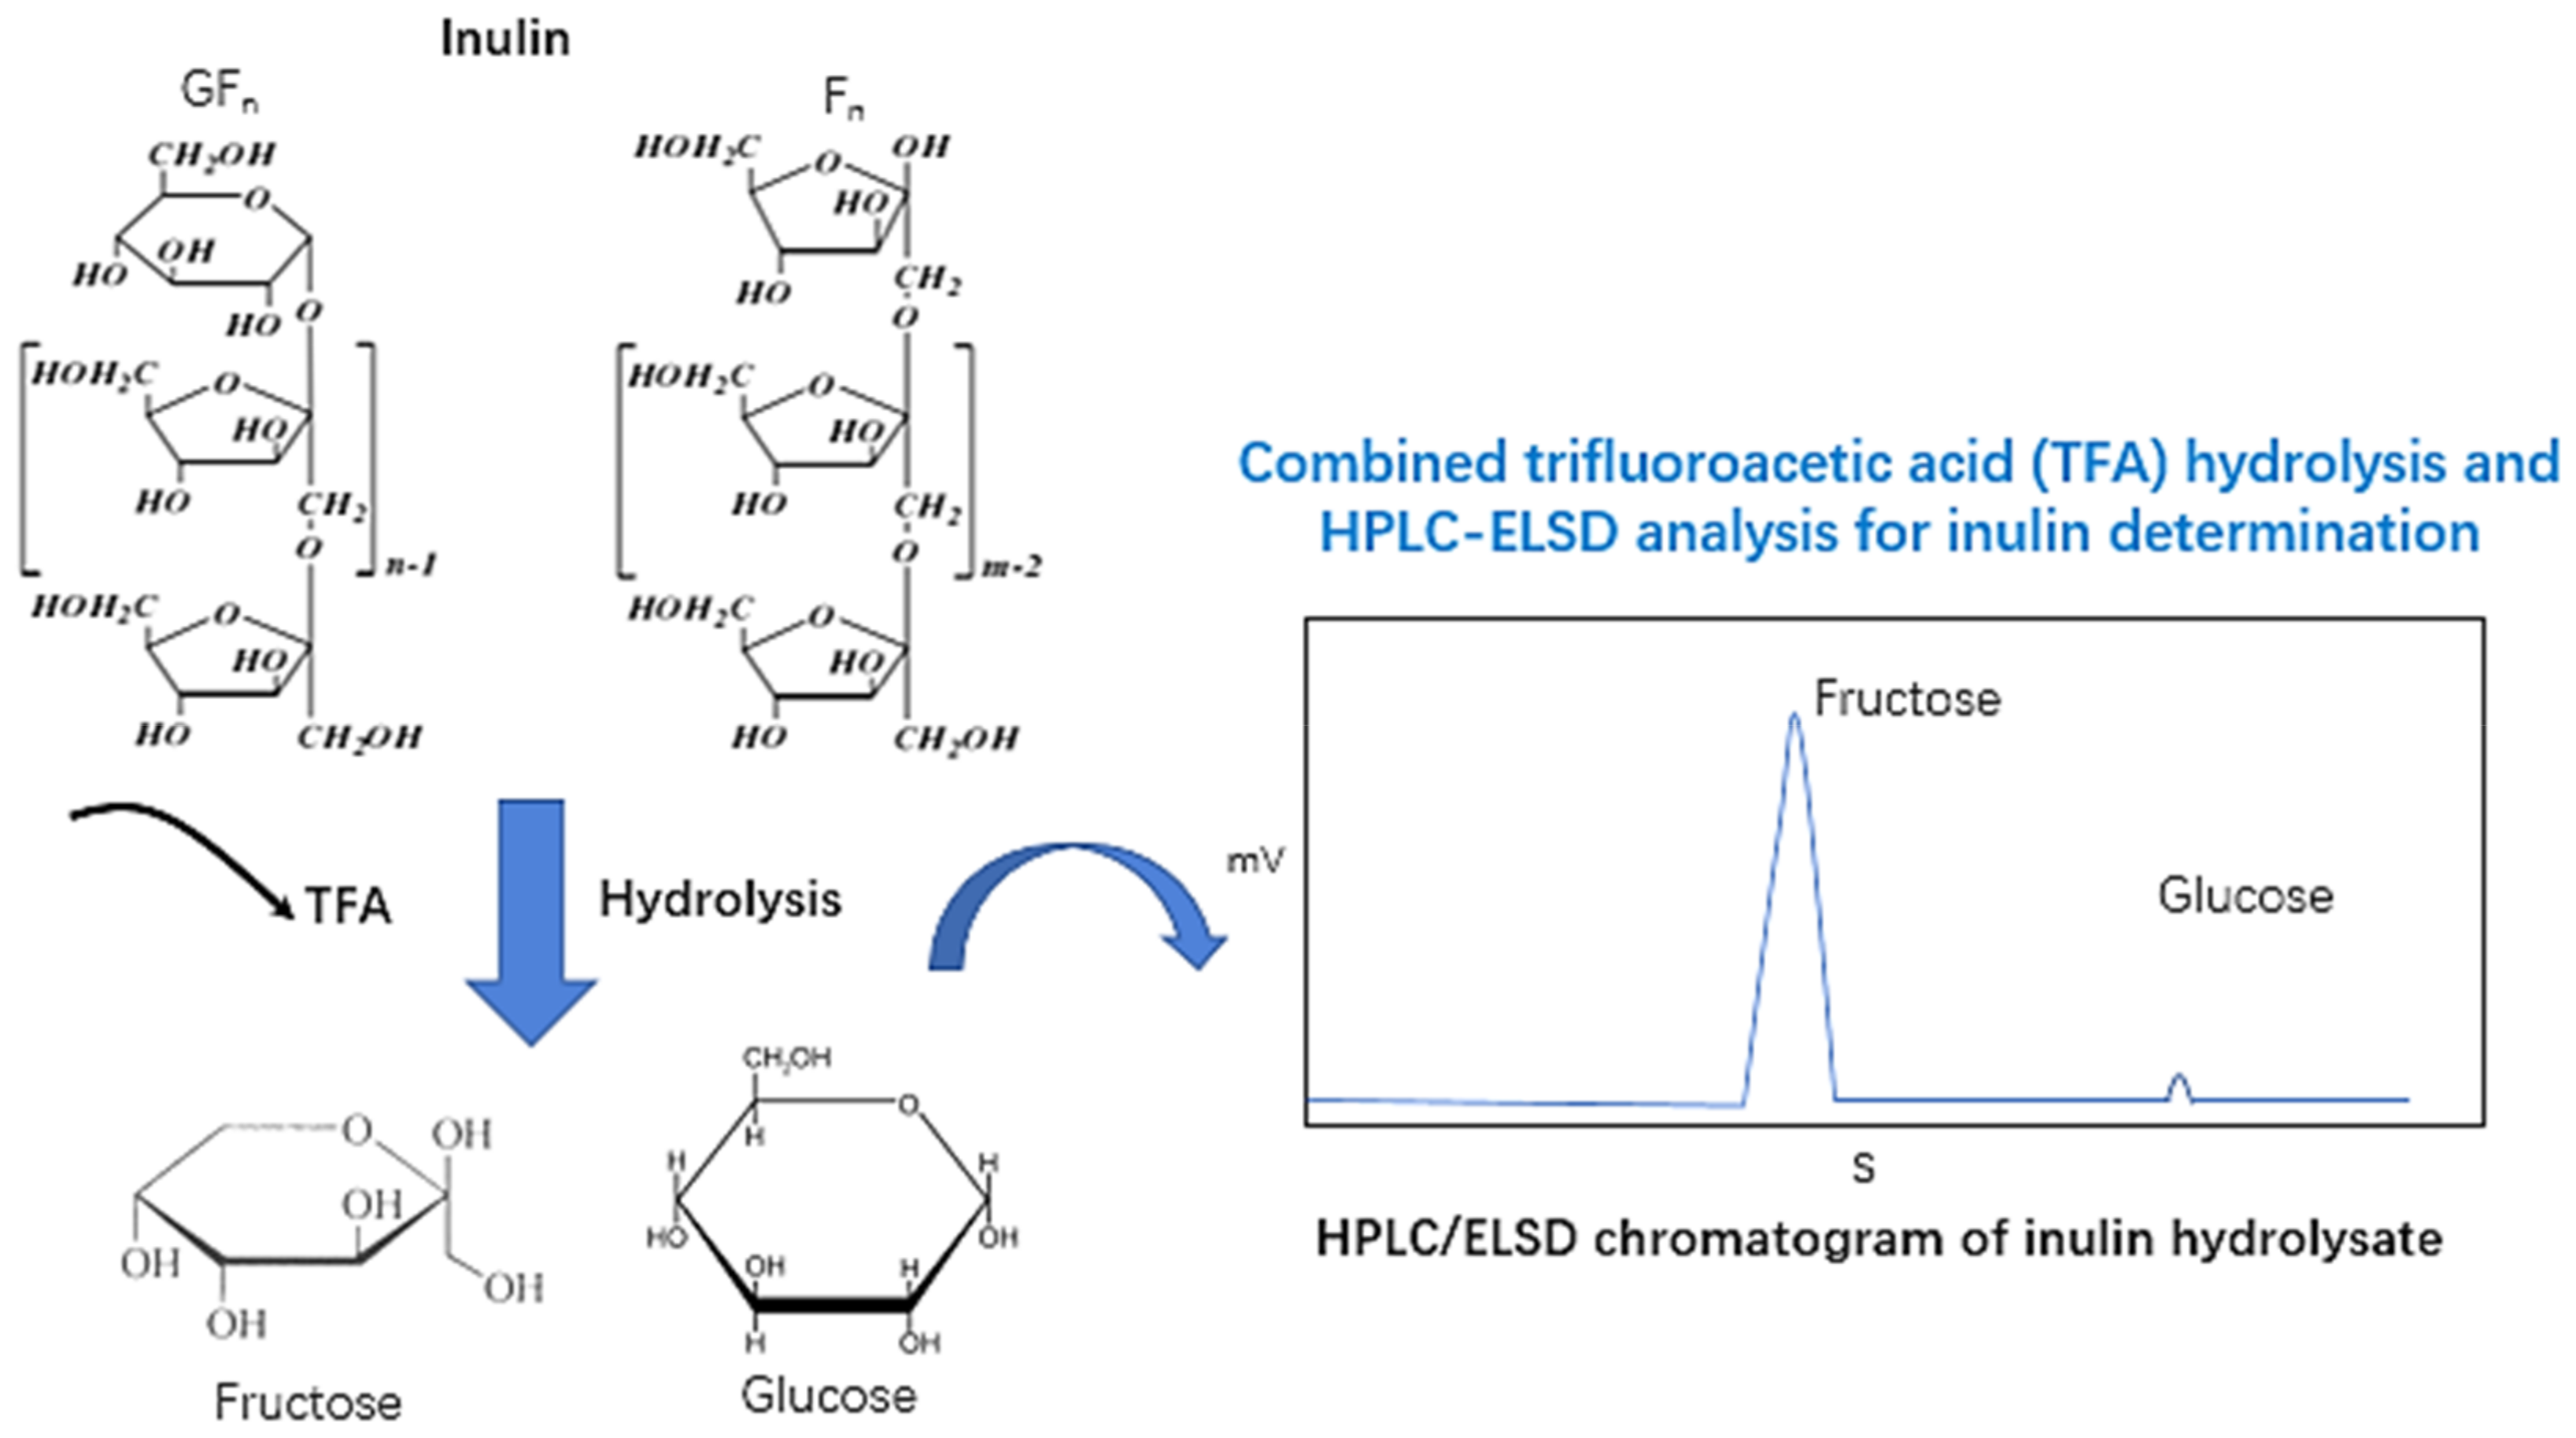
Development of a Combined Trifluoroacetic Acid Hydrolysis and HPLC-ELSD Method to Identify and Quantify Inulin Recovered from Jerusalem artichoke Assisted by Ultrasound Extraction

1
College of Food Science and Engineering, Wuhan Polytechnic University, Wuhan 430023, China
2
Nutrition and Food Science Area, Preventive Medicine and Public Health, Food Science, Toxicology and Forensic Medicine Department, Faculty of Pharmacy, Universitat de València, Avda. Vicent Andrés Estellés, s/n, 46100 Burjassot, Spain
*
Authors to whom correspondence should be addressed.
Submission received: 26 March 2018 / Revised: 12 April 2018 / Accepted: 2 May 2018 / Published: 3 May 2018
(This article belongs to the Special Issue Acoustic and Hydrodynamic Effects in Food Processing)

Abstract

:

Featured Application

Due to the growing importance of inulin in food industry, it is of paramount importance to have appropriate techniques to extract this compound from plant food materials, wastes and by-products. Moreover, using simple, reliable and fast identification and quantification methods in order to verify manufacturer’s information and for quality control purposes, is also of great interest. Therefore, in the present work, a combined trifluoroacetic acid assisted hydrolysis and high performance liquid chromatography equipped with evaporative light scattering detector technique was developed and validated in order to identify and quantify the amount of inulin extracted assisted by ultrasound processing from Jerusalem artichoke root slices as a model plant food matrix.

Abstract

Over the last years, inulin, a fructan mixture consisting of oligosaccharides and polysaccharides, has attracted more and more attention from both food industry and researchers, due to its unique functional properties as a natural resource. Therefore, there is an increased interest in the extraction and quantification of inulin for its valorization from inulin rich plants, wastes and by-products. In this work, ultrasonic treatment was applied for inulin extraction, observing a great impact of extraction temperature and ultrasonic power on the inulin content in the obtained extracts. A combined process including trifluoroacetic acid (TFA)-assisted hydrolysis and analysis with high performance liquid chromatography equipped with evaporative light scattering detector (HPLC-ELSD) was developed to quantify inulin content. The effect of hydrolysis parameters was investigated, obtaining the optimal conditions after using TFA at a concentration of 1 mg/mL, hydrolysis temperature of 90 °C, and hydrolysis duration of 60 min. The good linearity (>0.995), precision, recovery (100.27%), and stability obtained during the validation process showed that this developed method allows the quantification of total inulin content in the samples analyzed. This combined method may also contribute to the investigation of the functional properties of inulin (e.g., as prebiotic).

1. Introduction

Inulin is a kind of mixture consisting of oligosaccharides and polysaccharides. Inulin structure can be divided into two types: (1) mainly Fn type, which consists of β(2→1) fructosyl-fructose links [1]; and (2) eventually GFn type with a glucose unit at the end of fructan chain [2]. Although inulin exists in several plants, such as garlic, onion, asparagus leeks, and banana, the ideal raw materials for industrial inulin production are mainly chicory root and Jerusalem artichoke root [3,4].
Nowadays, inulin has attracted more and more attention from both food industry and researchers due to its unique functional properties as a natural resource. In food industry, inulin has been widely used for production of healthier products based on its potential as fat replacer since it has similar technological functions and sensory characteristics compared to animal fat or oil [5,6]. Moreover, inulin with high degree of polymerization (DP) can be used as texture modifier, due to its lower solubility and enhanced viscosity [7,8]. Apart from food applications, inulin has been recently investigated to produce biofuels, thus having the potential for saving non-renewable fossil fuels. For example, inulin can be hydrolyzed by exo-inulinase, thus removing the terminal fructose residues from the non-reducing end of the inulin molecule and producing fructose and glucose, which can be easily converted into ethanol by S. cerevisiae [9].
Due to its wide applications and important functions, both inulin extraction and quantification are essential for inulin-rich plants valorization and its functional properties investigation. Among various extraction intensification methods, ultrasound assisted extraction (UAE) has been reported as an efficient tool to recover valuable compounds from plants, mainly due to the cavitational effect generated by the ultrasonic waves [10,11,12]. Previous studies showed that UAE effectively enhanced polysaccharide, polyphenol and pigments extraction from plant food matrices, wastes and by-products [10,11,12].
Since inulin is a mixture of molecules with different DP, no single method provides a complete and quantitative analysis of all its forming compounds. Normally, inulin content determination requires a first step of hydrolyzing inulin long chains to fructose and glucose by chemical and enzymatical methods, followed by fructose and glucose analysis [4,13,14].
From a literature review, it was observed that several techniques are available for the analysis of inulin. For instance, enzyme-assisted hydrolysis of inulin, for quantification, is one of the most commonly used methods. In this line, Khuenpet et al. [15] determined inulin content extracted from Jerusalem artichoke by using Megazyme fructan assay kit, according to AOAC Method 999.03 and AACC-32.32. Inulin was mainly hydrolyzed to d-fructose and d-glucose with a mixture of highly purified endo- and exo-inulinases. Then, d-fructose and d-glucose were measured with a p-hydroxybenzoic acid hydrazide (PAHBAH) method. Zhu et al. [16] applied inulinase and novozyme to hydrolyze inulin from chicory for its quantification. From these studies, it was concluded that enzyme-assisted hydrolysis techniques present some important benefits as they are not time consuming and can be used under mild reaction conditions. However, the main drawback is their high cost.
On the other hand, other several methods consisting of the hydrolysis of inulin using chemical reagents have also been widely used. Wei et al. [4] determined inulin content by evaluating the difference between total carbohydrates and reducing sugars. Total carbohydrates were determined using the phenol-sulfuric acid method [17], and the reducing sugars were determined by the dinitrosalicylic acid method [18]. This method was applied by several researchers to quantify inulin in chicory [19] and Jerusalem artichoke [20] extracts, due to its easy operation and the use of economic reagents. However, the use of phenol and sulfuric acid is potentially dangerous for operators. Another possible alternative is to use trifluoroacetic acid (TFA), which presents lower acidity compared to sulfuric acid, and is also able to hydrolyze inulin and fructan molecules [21].
Chromatographic methods are widely adapted for quantification of chemical or biochemical substances because of its high precision and stability compared to colorimetric methods. After hydrolysis of all fructans to fructose and glucose, inulin quantification can be completed by measuring these sugars by high-performance anion-exchange chromatography with pulsed amperometric detection (HPAEC–PAD) and high-performance liquid chromatography with refractometer detection (HPLC–RI) [21]. High performance liquid chromatography (HPLC) equipped with evaporative light scattering detector (ELSD) is widely used for quantification of sugar in samples [22,23]. However, to the best of our knowledge, there are no reports in the available literature evaluating the application of HPLC-ELSD method for inulin determination.
Therefore, the aim of this work was to extract inulin assisted by UAE and to establish an inulin determination method based on the combination of TFA-assisted inulin hydrolysis and HPLC-ELSD analysis. The influence of the main extraction parameters such as ultrasound power and extraction temperature, were also studied. The effects of the hydrolysis parameters were evaluated to obtain the optimal hydrolysis conditions. In addition, the validation (linearity, precision, recovery, and stability) of this combined method was carried out.

2. Materials and Methods

2.1. Ultrasound Assisted Inulin Extraction

Ultrasound-assisted extraction of inulin was performed using an ultrasonic processor FS-250N (Sonxi Ultrasonic Instrument, Shanghai, China) equipped with a sonotrode of 0.6 cm in diameter and wave amplitude of 60 μm. Forty grams of fresh Jerusalem artichoke root slices and 200 g of de-ionized were placed into a 500 mL beaker for inulin extraction. The ultrasonic treatment power varied from 60 to 150 W, with a frequency of 20 kHz. The extraction temperature varied from 25 to 70 °C. After 90 min extraction, the extract was centrifuged, pre-filtered through a mesh to remove pulps, and then stored at the temperature of −20 °C until needed for analysis. The inulin content (mg/mL) in the extracts was determined as follows:
I n u l i n   c o n t e n t = M a s s   o f   i n u l i n i n   e x t r a c t M a s s   o f   e x t r a c t

2.2. Inulin Analysis

2.2.1. Inulin Hydrolysis

Approximately 4.5 mg of inulin powder (Sigma Aldrich, St. Louis, MO, USA) were placed in a glass bottle, after the addition of 3 mL of TFA, the bottle was sealed using alcohol blowtorch, and then placed under a fixed temperature to carry out inulin hydrolysis (Figure 1). To obtain the optimal hydrolysis conditions, different tests were performed, where the TFA concentration varied from 0.5 to 1.5 mol/L, the hydrolysis temperature varied from 80 to 100 °C and the hydrolysis duration varied from 30 to 90 min. In the hydrolysis process, protic acid (TFA in this study) was used to catalyze the cleavage of glycosidic bond of inulin molecular via a nucleophilic substitution reaction, leading to decomposition of inulin to fructose and glucose. For each test, the fructose content in the hydrolysates was analyzed by HPLC-ELSD to evaluate the hydrolysis efficiency.

2.2.2. Removal of TFA

The hydrolysates obtained under the optimal hydrolysis conditions were mixed with 20 mL of methanol and then taken to rotary evaporation at 40 °C, 250 rpm for 20 min to remove the remaining TFA. After liquid phase evaporation, 10 mL of deionized water were added to solve the solid phase, which contained the fructose.

2.2.3. HPLC-ELSD Analysis

A Waters 1525 series liquid chromatographic system was coupled with an Evaporative Light Scattering Detector (ELSD, Alltech 3300, Nicholasville, KY, USA). A PrevailTM Carbohydrate ES column (250 mm × 4.6 mm, 5 µm, Grace, Columbia, MD, USA) was used. The sample was pre-filtered with a 0.45 µm membrane before injection. The volume of the sample injected was 20 mL (filling the loop completely). The chromatographic separation was achieved with a mobile phase of acetonitrile–water (75:25, v/v). The flow rate was set at 1.0 mL/min, and the temperature of the column was set at 35 °C. The evaporation temperature of the ELSD was set at 45 °C with a gas flow of 2.0 L/min. Peak areas were used for quantitative analysis. d-fructose with purity of 99% (Aladdin, Shanghai, China) was used as standard. Calibration curves were obtained by preparing five concentrations of fructose in water ranging from 0.20 to 0.60 mg/mL.

3. Results and Discussion

To evaluate the effects of ultrasound-assisted extraction (UAE) on inulin recovery from Jerusalem artichoke roots, firstly, the appropriate method for inulin identification and quantification was optimized and validated (Section 3.1, Section 3.2, Section 3.3, Section 3.4 and Section 3.5).

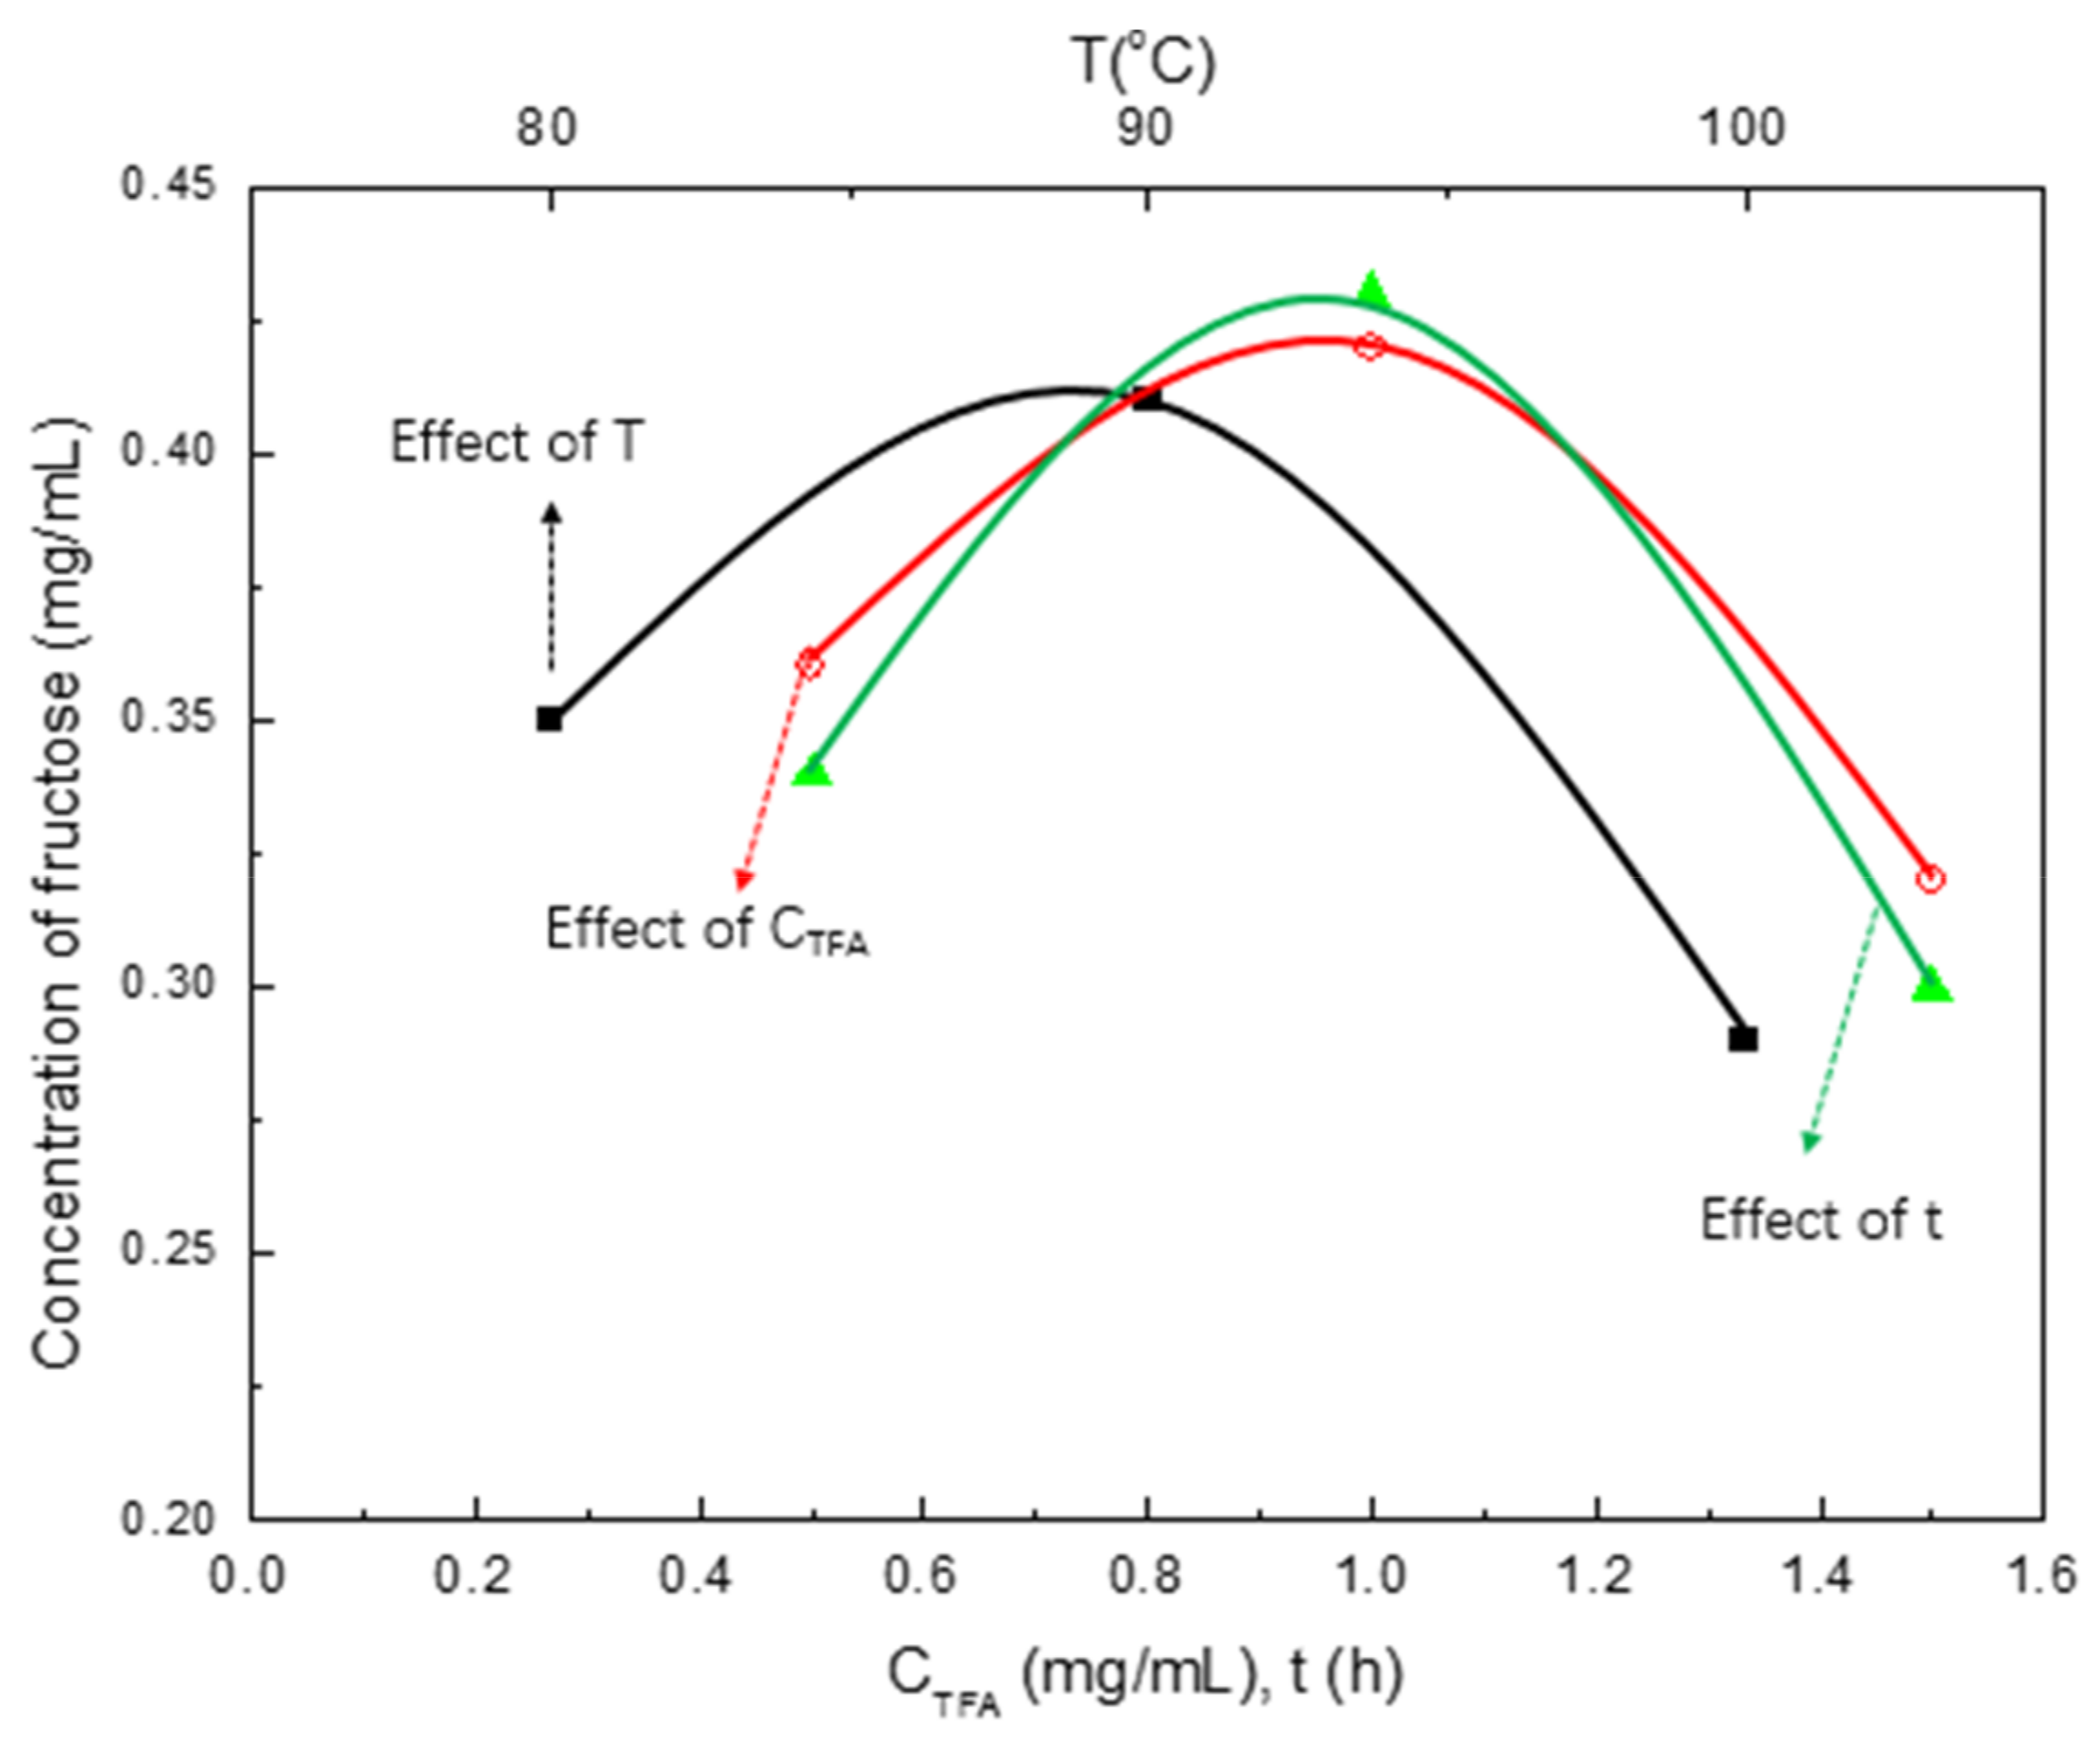
3.1. Effect of Hydrolysis Conditions
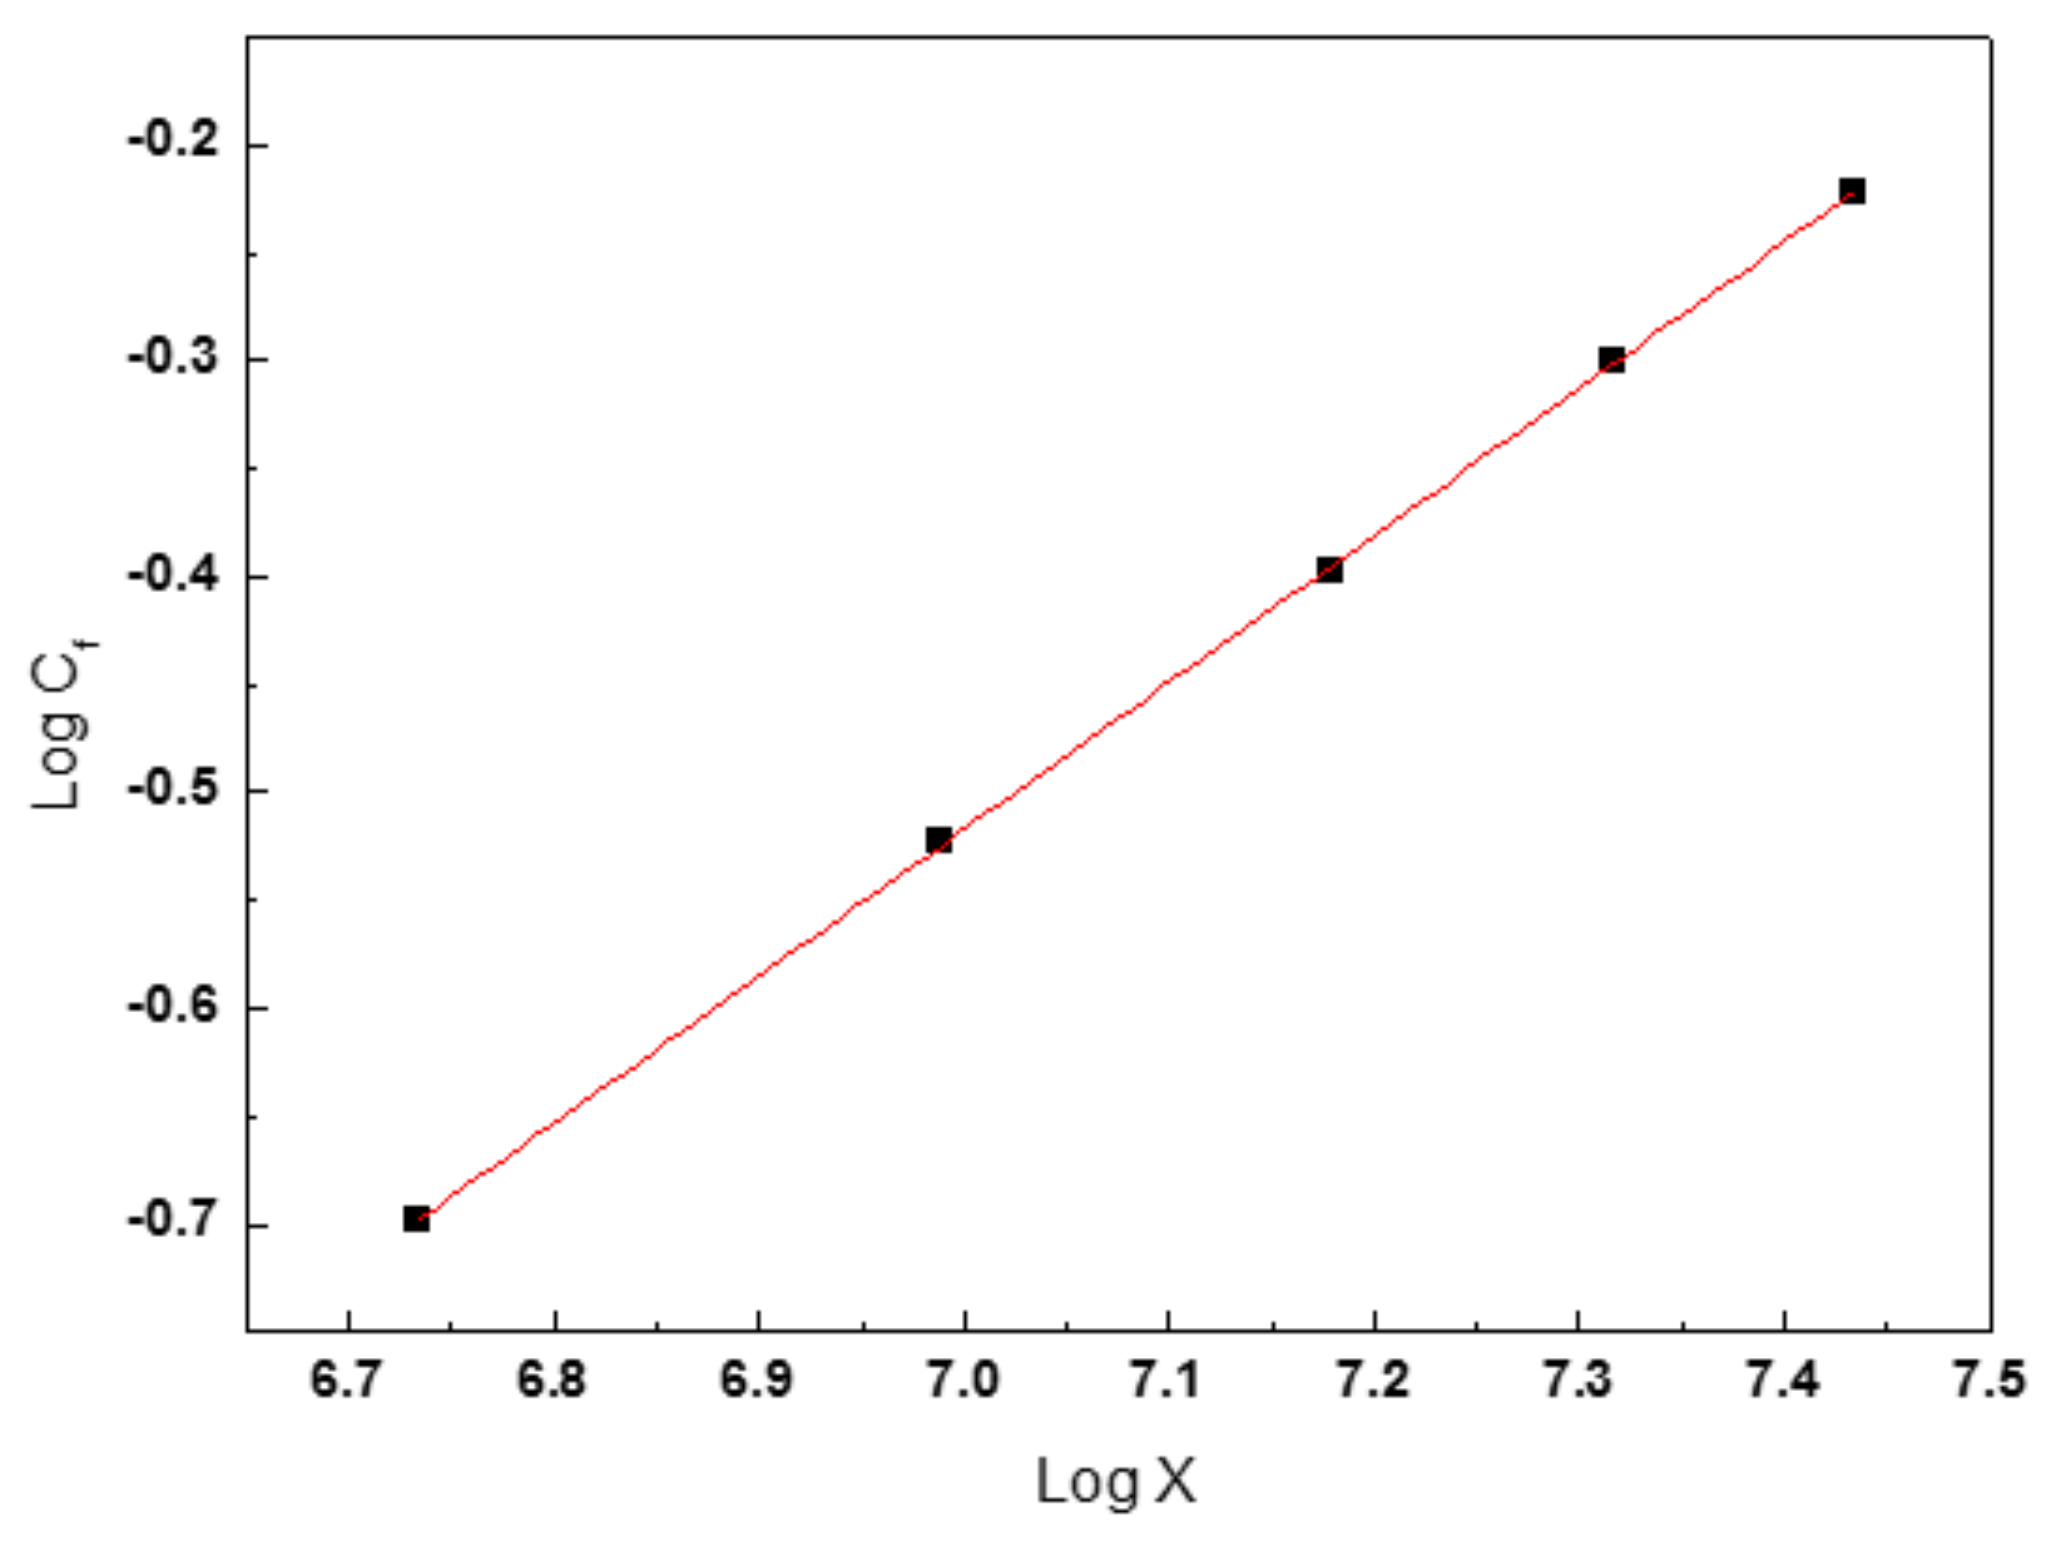
The effects of temperature (80–100 °C), TFA concentration (0.5–1.5 mg/mL), and hydrolysis time (30–90 min) on hydrolysis efficiency were investigated. As shown in Figure 2, fructose concentration increased with hydrolysis temperature from 80 to 90 °C. However, the fructose concentration decreased when higher temperatures (>90 °C) were used, mainly due to fructose decomposition [24]. Updating of TFA concentration from 0.5 to 1 mg/mL facilitated the hydrolysis reaction, while more TFA also led to fructose decomposition [25]. A similar trend was also observed for hydrolysis time, presenting a decrease in fructose concentration of hydrolysates after prolonged reaction time (>60 min). Thus, the optimal hydrolysis parameters applied for this study were: hydrolysis temperature 90 °C, TFA concentration 1 mg/mL, and hydrolysis time of 60 min.

3.2. Linearity

The HPLC/ELSD method was developed using an external standardization with d-fructose as standard. Because ELSD resulted in a non-linear response, the calibration curve was plotted in Log/Log scale (as shown in Figure 3). The linearity of the response was acceptable in the range between 0.2 and 0.6 mg/mL. More precisely, the measurement of goodness-of-fit (r2) was higher than 0.995 (slope of the calibration curve was found at 0.681 with intercept of −5.282).

3.3. Precision

To study the intraday precision of the proposed method, six replicates of the same hydrolysate, obtained after using the optimal hydrolysis conditions with the same HPLC conditions, were injected and evaluated. The precision was expressed as the mean relative standard deviation (RSD%), being 1.11% (Table 1), thus indicating a good precision of the proposed method. Considering the literature, RSD% values for precision lower than 5% are acceptable.

3.4. Recovery

The standard addition method was used to measure the recovery of the analysis. Three levels of standard concentrations of fructose were added to a known mass sample, and the entire procedure starting from hydrolysis process was applied. Then, they were injected by triplicate into the column. As shown in Table 2, the recoveries of the samples after the addition of 1.0, 2.0 and 3.0 mL of fructose solution at 0.40 mg/mL were 101.53%, 99.44% and 99.81%, respectively. The mean recovery obtained was 100.27% with RSD of 1.11%. These results indicated a good recovery of the proposed method for inulin or fructose determination.

3.5. Stability of the Hydrolysate

To evaluate the stability of the hydrolysate, 4.5 mg of inulin sample were hydrolyzed according to the optimal hydrolysis conditions. Then, the injection of hydrolysate to HPLC column was carried out at 1-h interval for 4 h. The peak area was calculated for stability analysis. Results of the stability tests of the hydrolysate are presented in Table 3. The peak areas varied from 12,456,068 to 12,736,946 mv.s within 4 h. The mean fructose concentration of the hydrolysate was 0.3995 mg/mL and the RSD was 0.78%, thus indicating that the hydrolysates obtained under the proposed hydrolysis conditions are stable in HPLC determination.

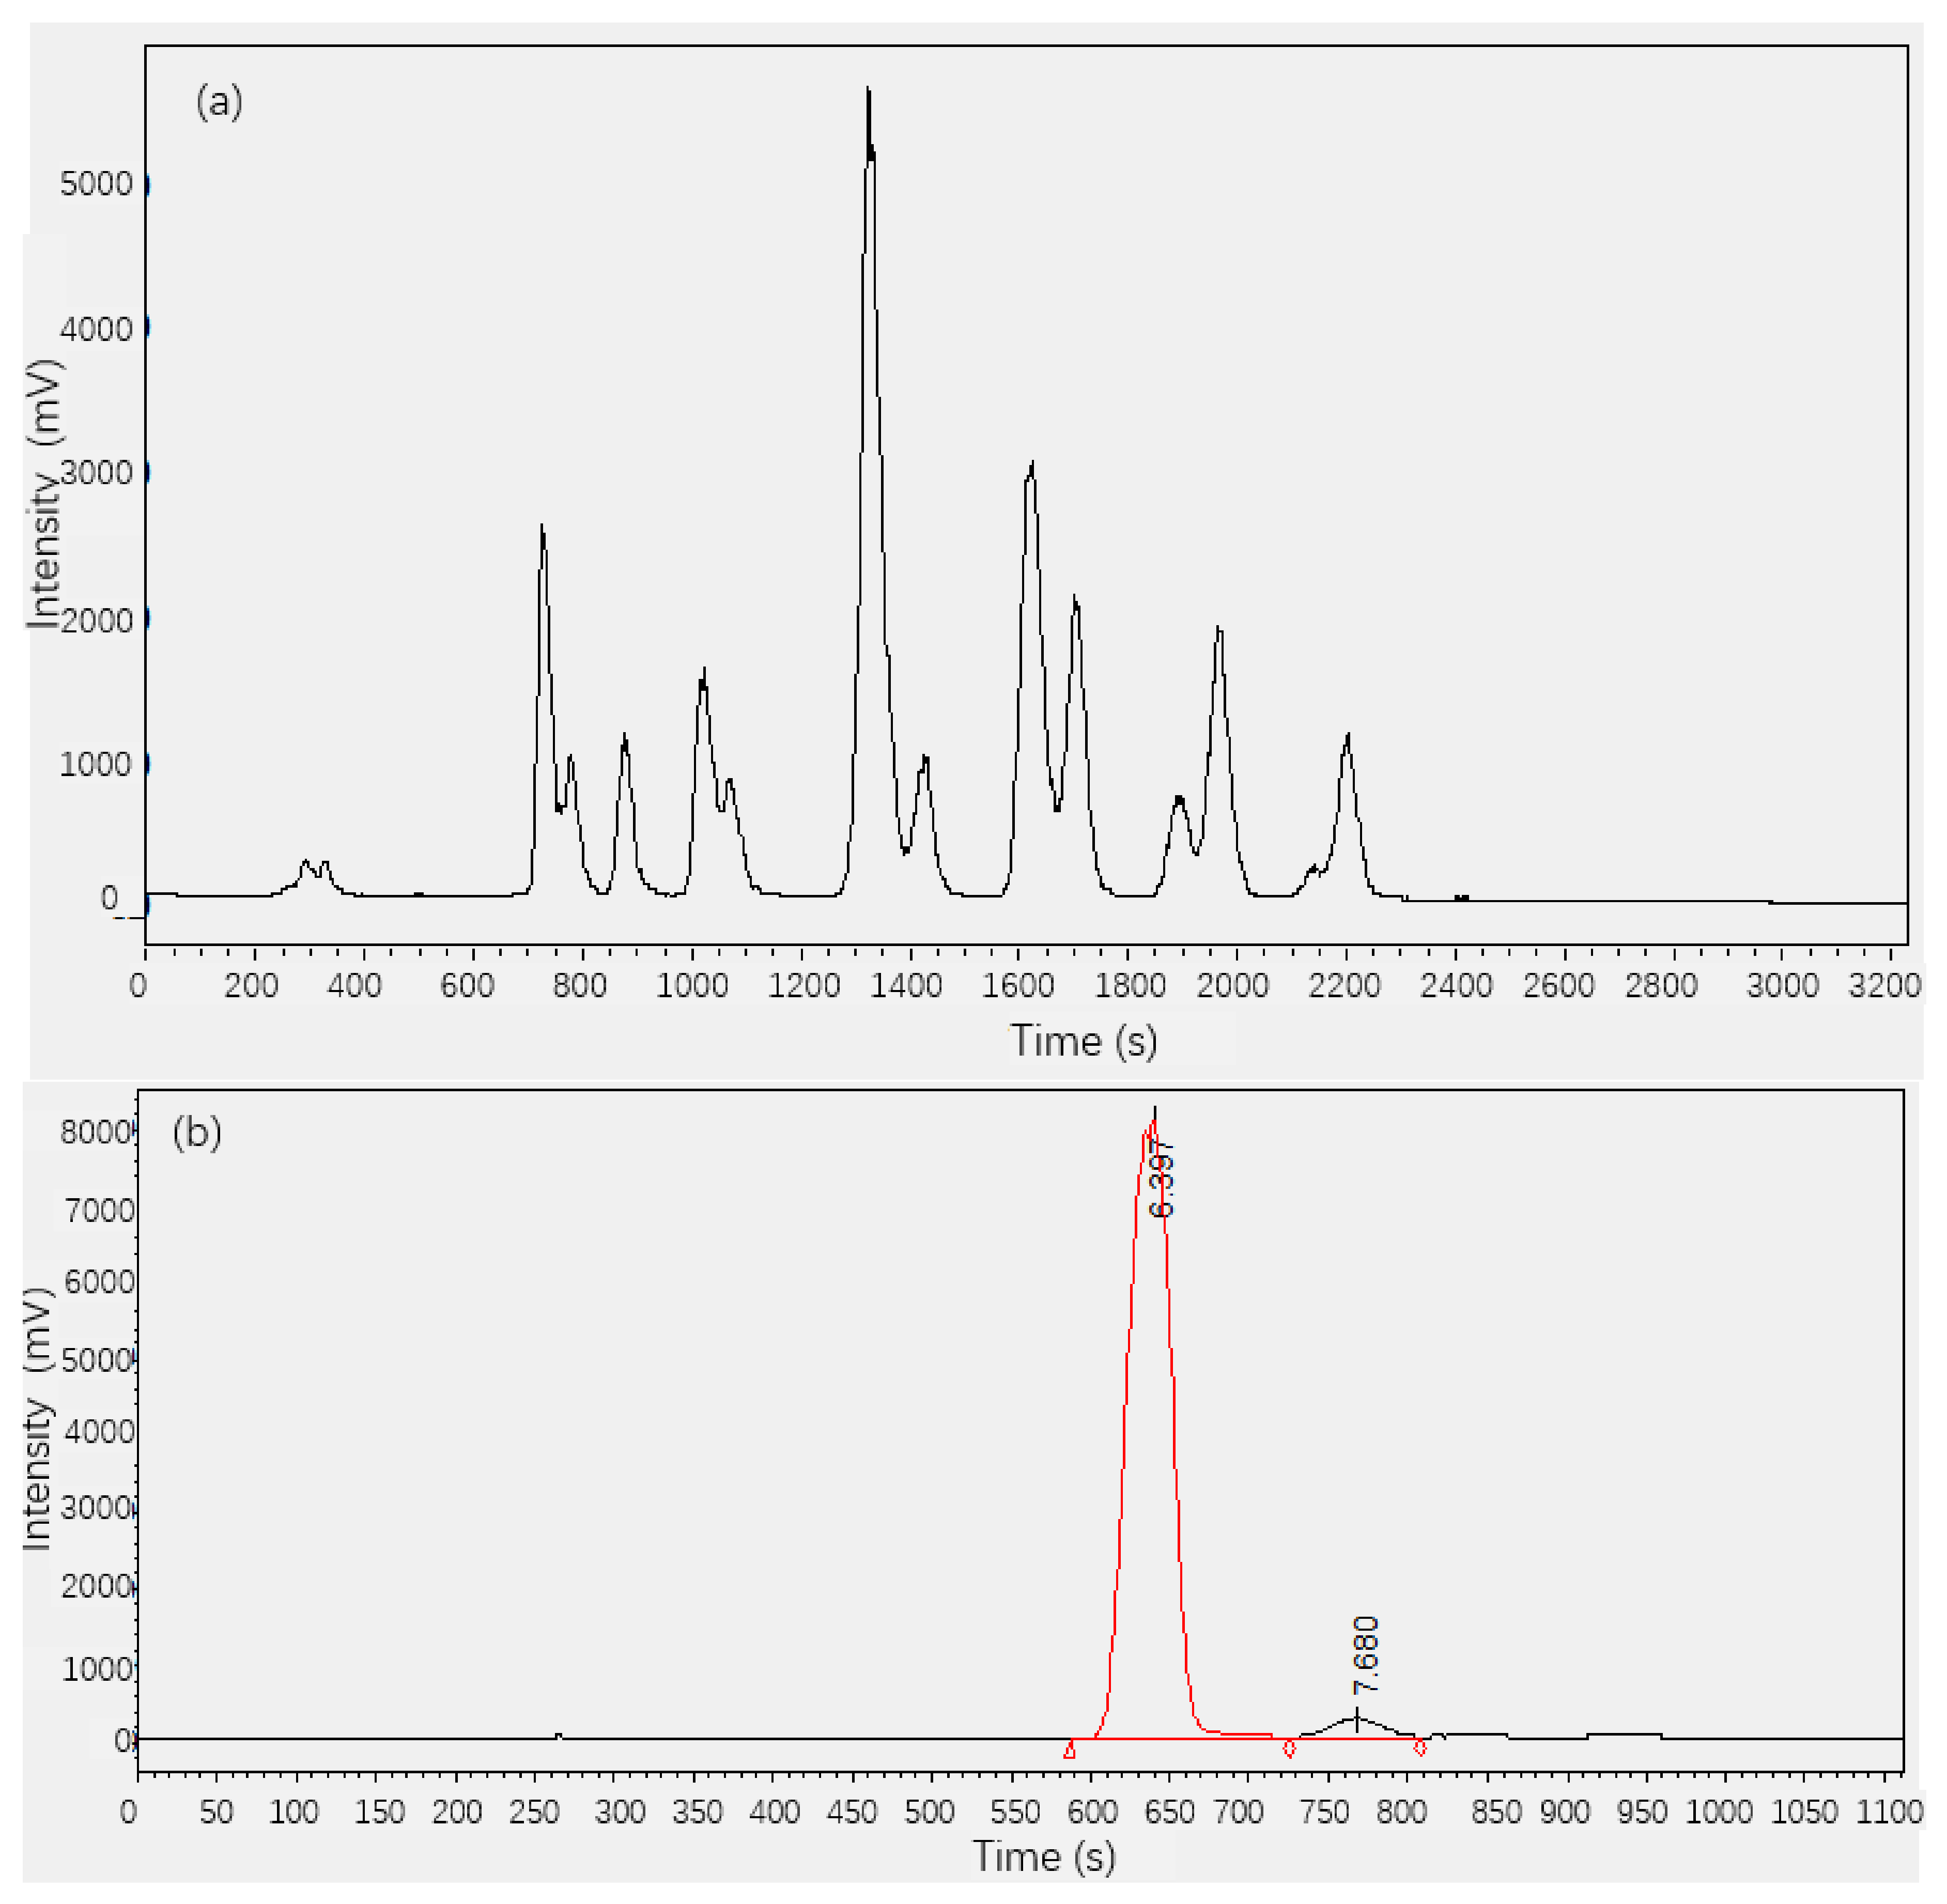
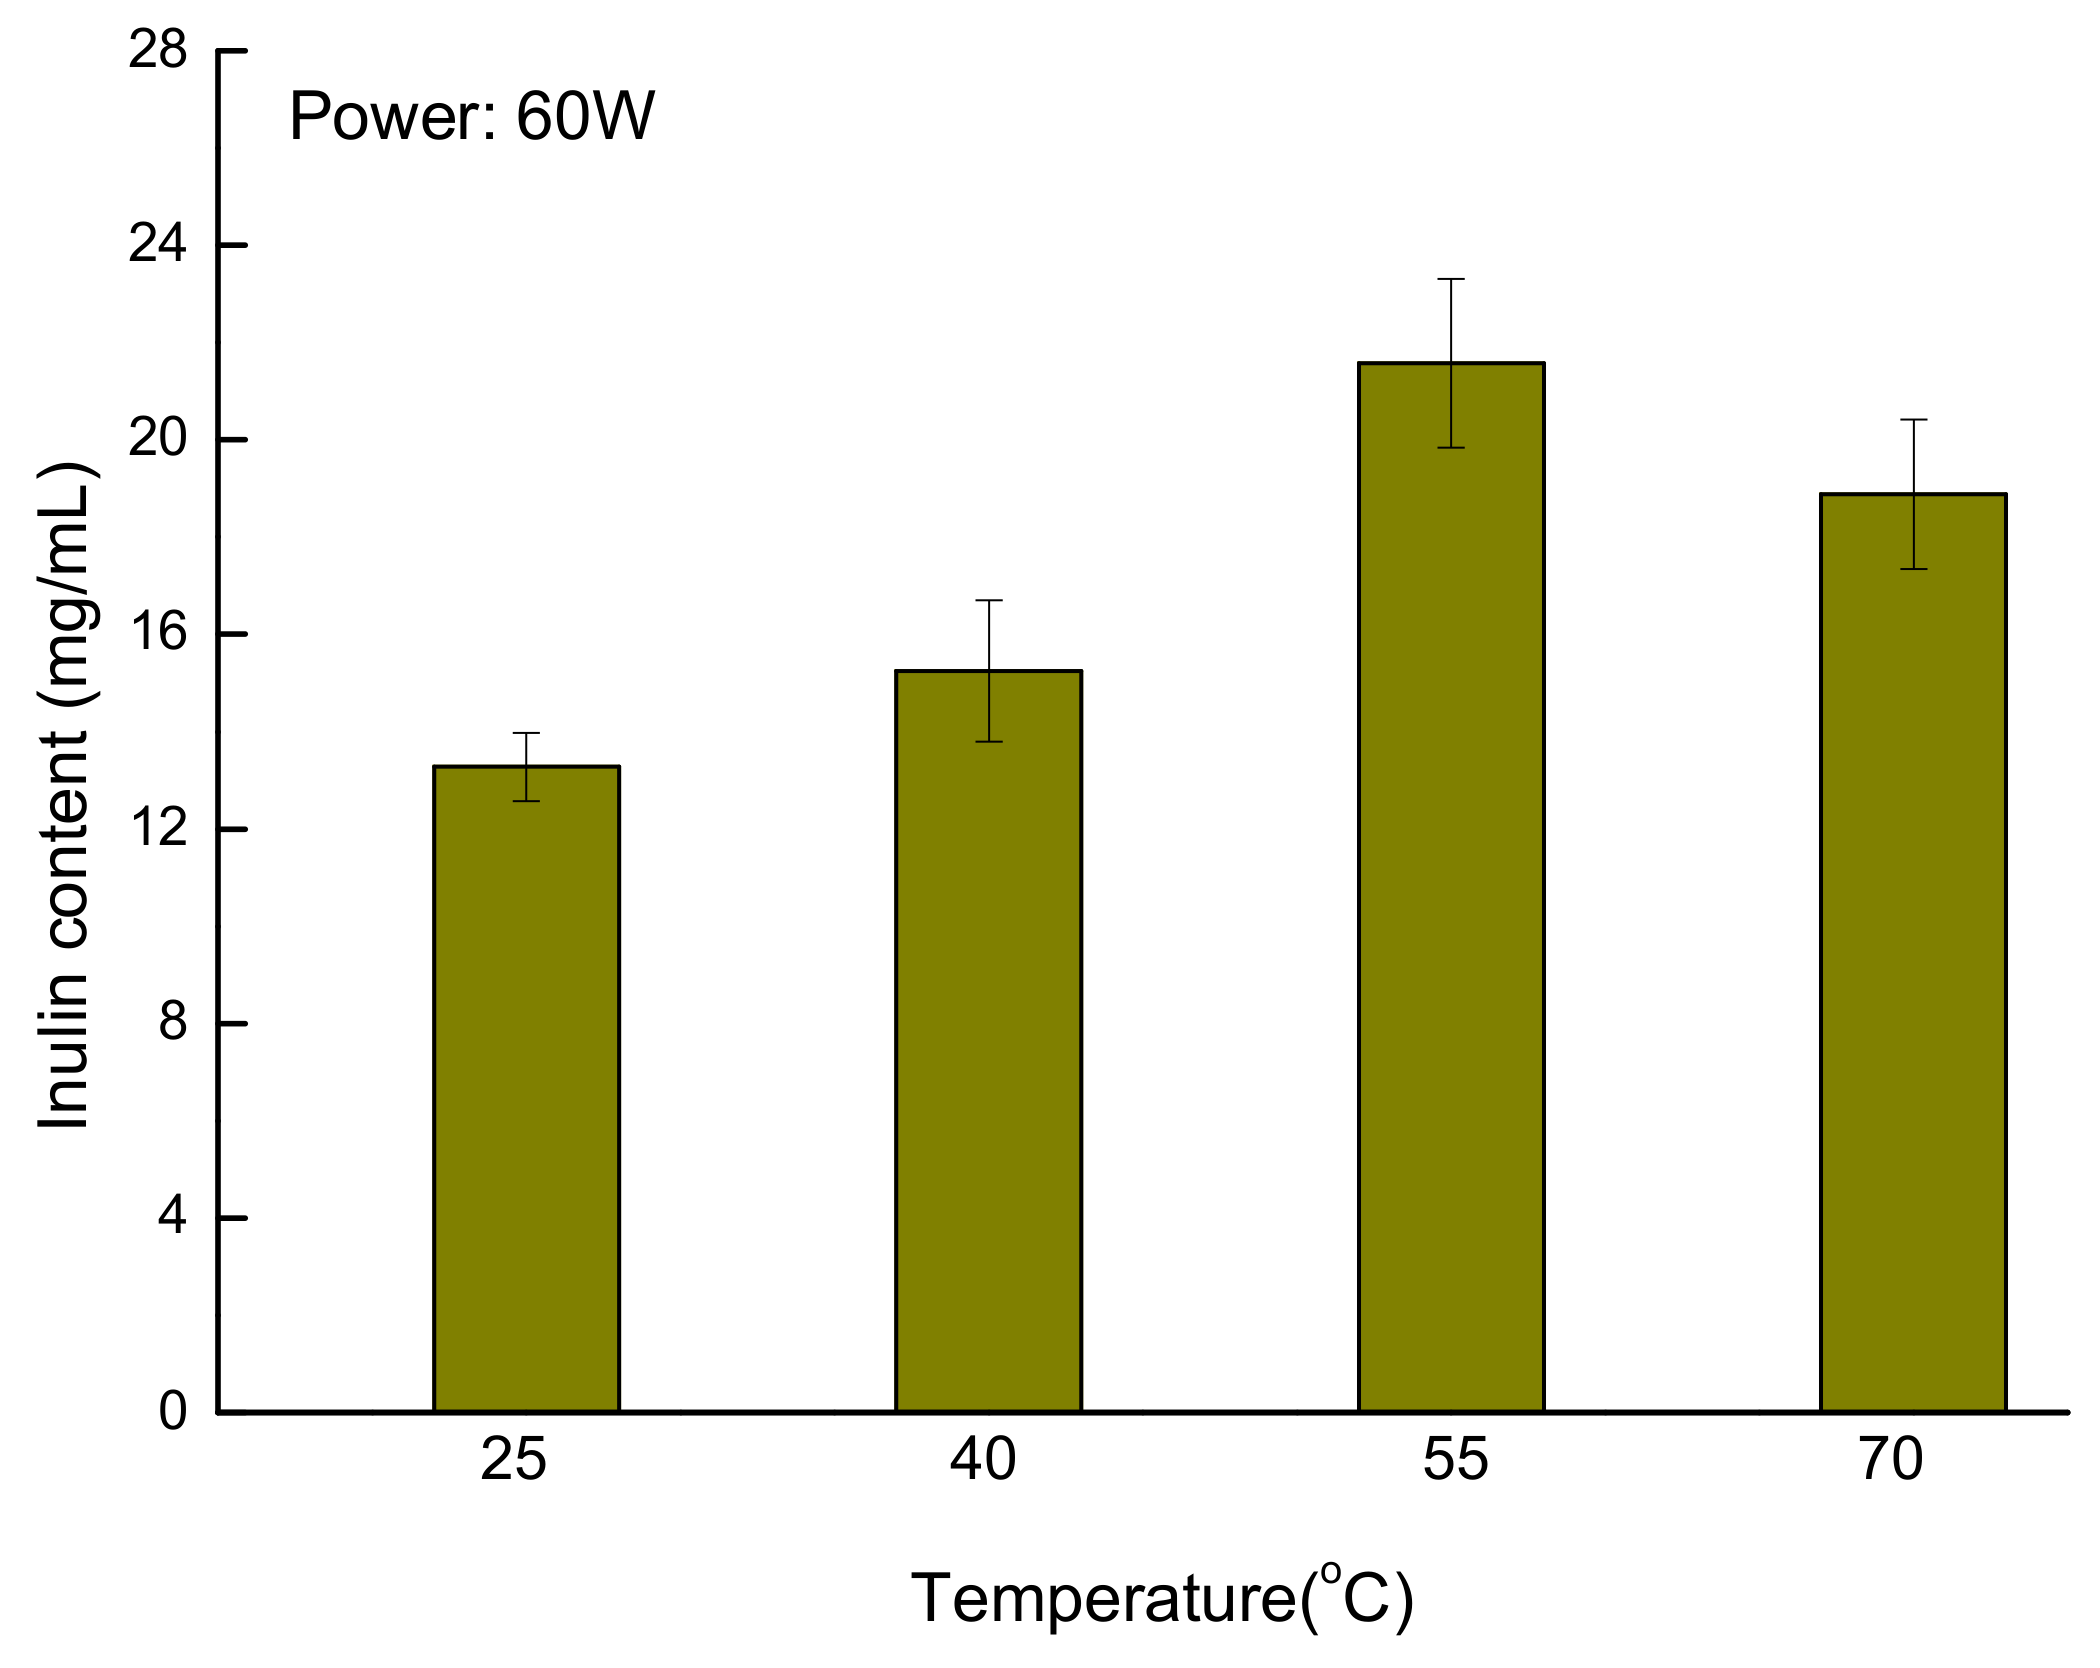
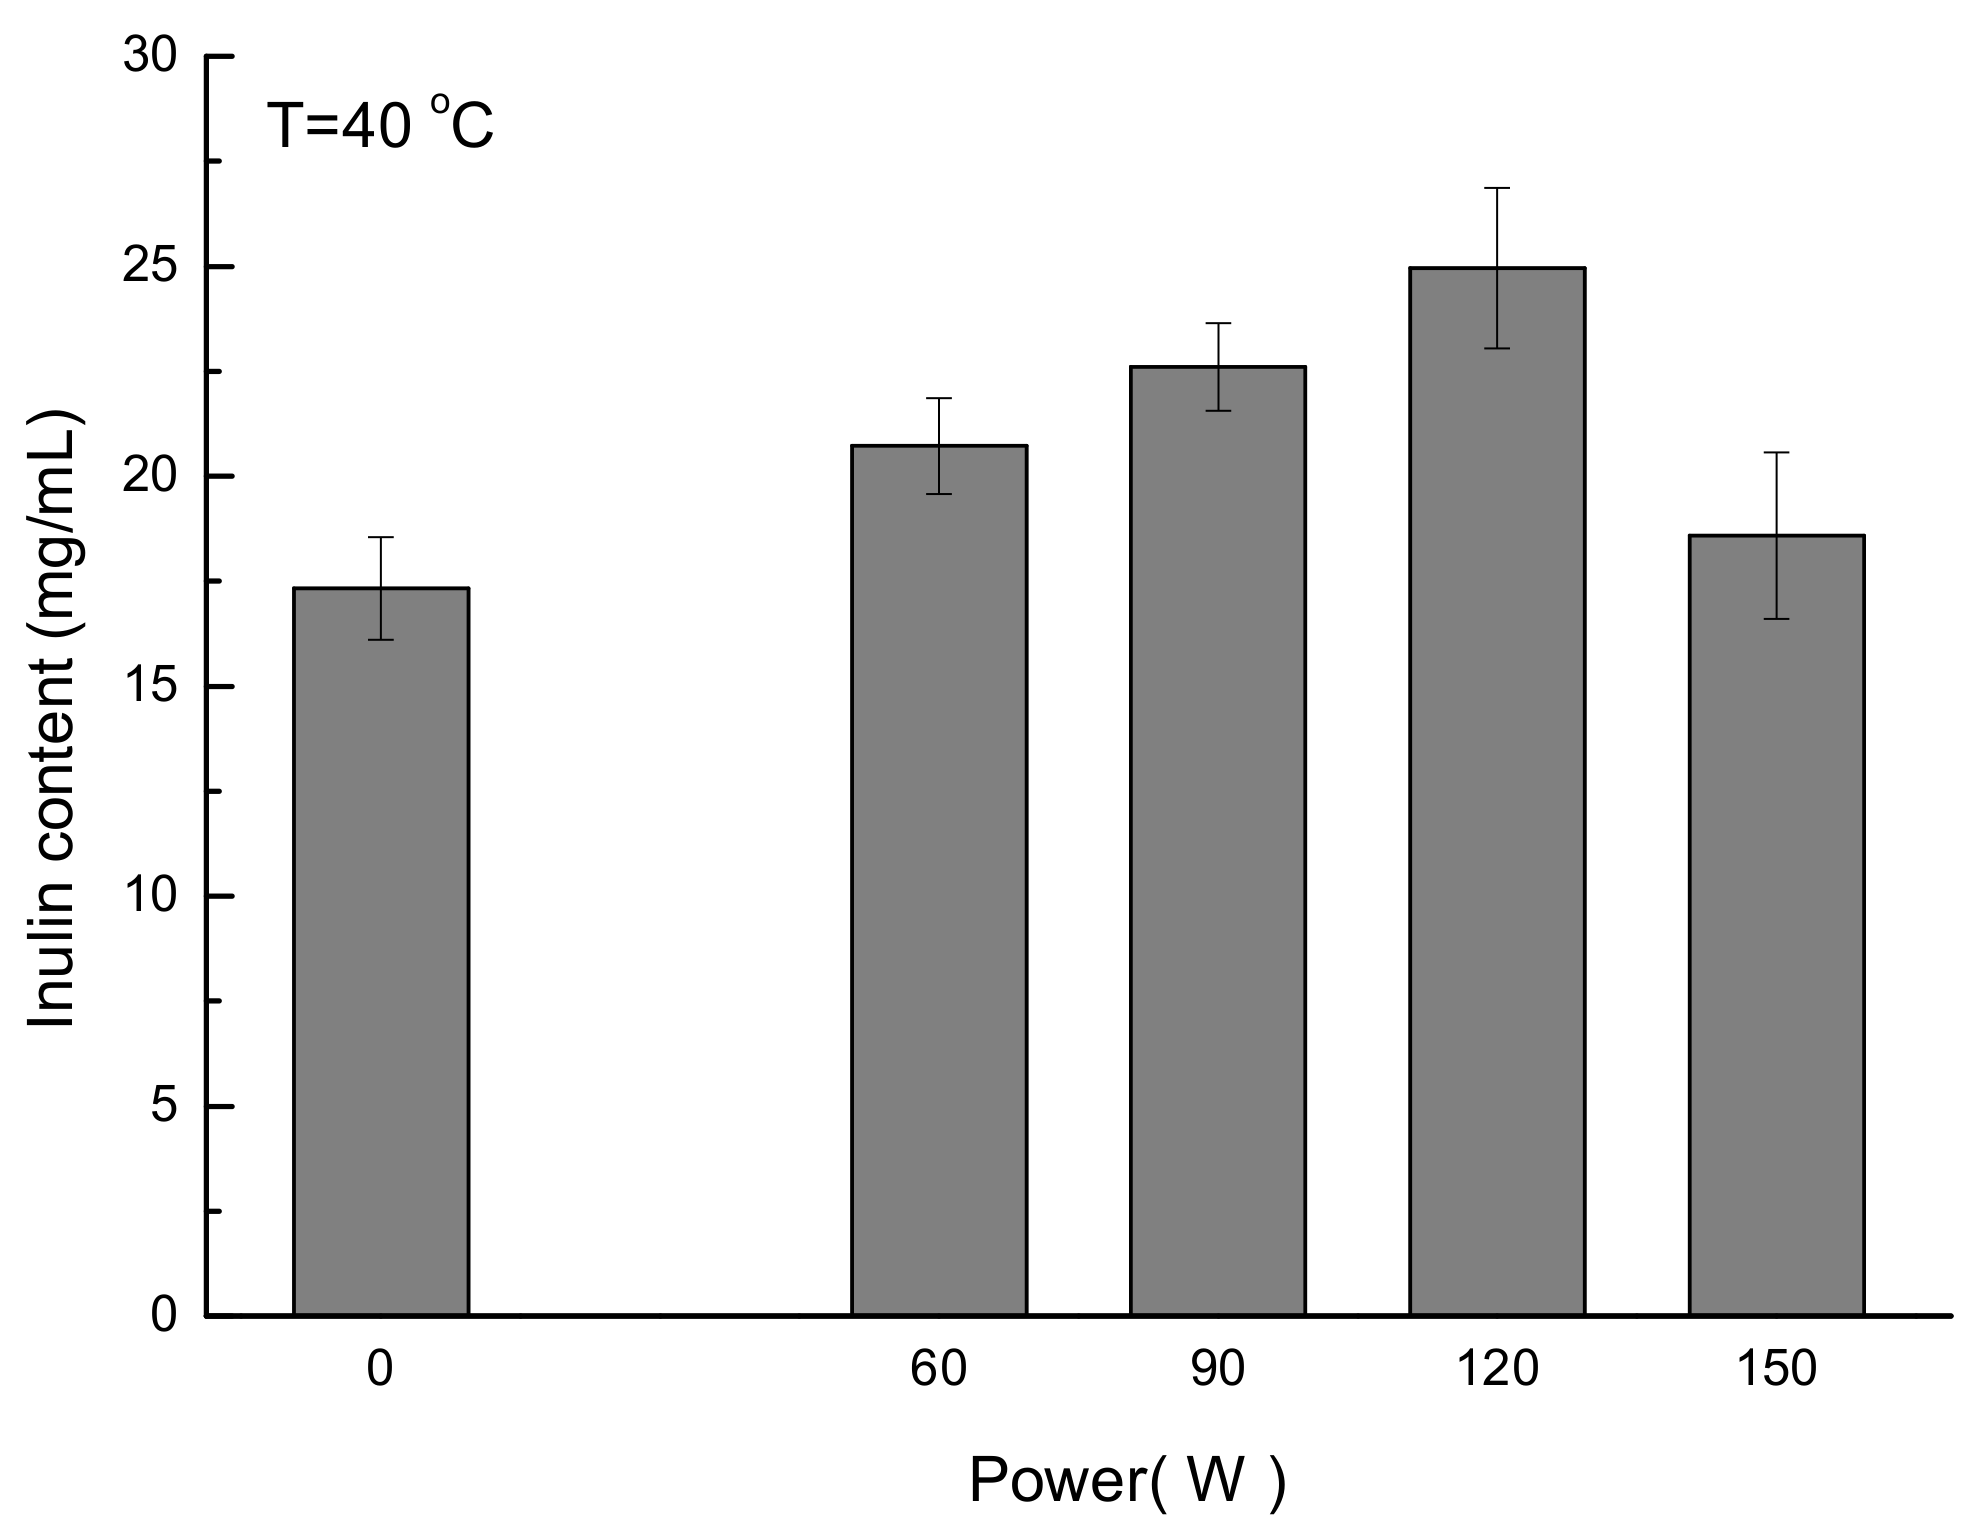
3.6. Application of the New Developed Method for Quantification of Inulin from Jerusalem artichoke Root

By using extracts from UAE, HPLC-ELSD analysis was carried out: (i) without using TFA-assisted hydrolysis (Figure 4a); and (ii) applying the newly developed method consisting of specific hydrolysis for pretreatment (Figure 4b). In Figure 4, it is obvious that TFA-assisted hydrolysis prior to HPLC-ELSD analysis allowed the complete hydrolysis of all the fructans contained in Jerusalem artichoke root to fructose (peak at 6.397 min in Figure 4b) or glucose (peak at 7.680 min in Figure 4b), thus improving total inulin identification and quantification compared to the method without TFA-assisted hydrolysis.
Inulin content was determined using a standard curve to evaluate the UAE process. The effect of extraction temperature on inulin content in the extracts is presented in Figure 5. Inulin content was significantly increased from 13.3 to 22 mg/mL with rising temperature from 20 to 55 °C. However, further increase of extraction temperature did not lead to better inulin extraction. The same trend was previously observed when other authors evaluated UAE of inulin from Jerusalem artichoke tube powder. These authors observed the maximal inulin extraction yield at 77 °C [4]. This may be due to the modification of tissue structure at higher temperature, or a potential modification in the structure of the molecules with different degree of polymerization which constitute inulin complex.
On the other hand, the effect of ultrasonic power is displayed in Figure 6. The benefit of ultrasonic treatment is noticeable when the inulin content of the extracts obtained with and without ultrasonic treatment was compared. Due to more intense cavitational effect, an increased inulin content was found in the extracts obtained when ultrasonic power was 120 W compared to 60 W, obtaining the optimal inulin content (25 mg/mL) at 120 W. However, when ultrasonic power was increased up to 150 W, the inulin content decreased. This fact can be attributed to changes in tissue structure under high ultrasonic power treatment and/or modification in the inulin-related compounds due to the cavitational effect generated by the ultrasonic waves under these conditions, making the identification of inulin difficult.

4. Conclusions

A combined process including TFA-assisted hydrolysis and HPLC-ELSD analysis was developed to quantify inulin content from Jerusalem artichoke root after ultrasound-assisted extraction. The effect of hydrolysis conditions was evaluated and the optimal parameters obtained were: hydrolysis temperature of 90 °C, TFA concentration of 1 mg/mL, and hydrolysis duration of 60 min. The advanced method exhibited good linearity, precision, and recovery, as well as sufficient stability, allowing the quantification of total inulin content in solid or liquid samples. With this established method, the inulin content in the extracts obtained in the present study was quantified. After evaluating the effects of extraction temperature and ultrasonic power, the optimal ultrasound-assisted extraction conditions were achieved when extraction temperature of 55 °C and ultrasonic powder of 120 W were used. This study may contribute to further valorization of inulin rich plant and investigation of functional properties of inulin (e.g., as prebiotic).

Author Contributions

S.L. and F.J.B. conceived and designed the experiments; Q.W. and F.Y. performed the experiments; Q.W. analyzed the data; Z.Z. and J.H. contributed with reagents/materials/analytical tools; and S.L. wrote the paper.

Acknowledgments

The authors acknowledge the financial support of National Natural Science Foundation of China (21506166); “Chutian Scholar Plan” and “One Hundred-Talent Program” of Hubei province, China; the “Scientific Research Foundation for the Returned Overseas Chinese Scholars” from State Education Ministry of China, Scientific Research Starting Foundation (2014847) of Wuhan Polytechnic University; Hubei Key Laboratory for Processing and Transformation of Agricultural Products (Wuhan Polytechnic University); and Key Laboratory for Deep Processing of Major Grain and Oil, Ministry of Education, China.

Conflicts of Interest

The authors declare no conflict of interest. The founding sponsors had no role in the design of the study; in the collection, analyses, or interpretation of data; in the writing of the manuscript, and in the decision to publish the results.

References

  1. Waterhouse, A.L.; Chatterton, N.J. Glossary of fructan terms. In Science and Technology of Fructans; CRC Press: Boca Raton, FL, USA, 1993; pp. 1–7. [Google Scholar]
  2. López-Molina, D.; Navarro-Martínez, M.D.; Rojas-Melgarejo, F.; Hiner, A.N.P.; Chazarra, S.; Rodríguez-López, J.N. Molecular properties and prebiotic effect of inulin obtained from artichoke (Cynara scolymus L.). Phytochemistry 2005, 66, 1476–1484. [Google Scholar] [CrossRef] [PubMed]
  3. Zhu, Z.; He, J.; Liu, G.; Barba, F.J.; Koubaa, M.; Ding, L.; Bals, O.; Grimi, N.; Vorobiev, E. Recent insights for the green recovery of inulin from plant food materials using non-conventional extraction technologies: A review. Innov. Food Sci. Emerg. 2016, 33, 1–9. [Google Scholar] [CrossRef]
  4. Wei, L.; Wang, J.; Zheng, X.; Teng, D.; Yang, Y.; Cai, C.; Feng, T.; Zhang, F. Studies on the extracting technical conditions of inulin from Jerusalem artichoke tubers. J. Food Eng. 2007, 79, 1087–1093. [Google Scholar]
  5. Arcia, P.; Costell, E.; Tárrega, A. Inulin blend as prebiotic and fat replacer in dairy desserts: Optimization by response surface methodology. J. Dairy Sci. 2011, 94, 2192–2200. [Google Scholar] [CrossRef] [PubMed]
  6. Bayarri, S.; Chuliá, I.; Costell, E. Comparing λ-carrageenan and an inulin blend as fat replacers in carboxymethyl cellulose dairy desserts. Rheological and sensory aspects. Food Hydrocoll. 2010, 24, 578–587. [Google Scholar] [CrossRef] [Green Version]
  7. Wada, T.; Sugatani, J.; Terada, E.; Ohguchi, M.; Miwa, M. Physicochemical characterization and biological effects of inulin enzymatically synthesized from sucrose. J. Agric. Food Chem. 2005, 53, 1246–1253. [Google Scholar] [CrossRef] [PubMed]
  8. Meyer, D.; Bayarri, S.; Tárrega, A.; Costell, E. Inulin as texture modifier in dairy products. Food Hydrocoll. 2011, 25, 1881–1890. [Google Scholar] [CrossRef]
  9. Chi, Z.-M.; Zhang, T.; Cao, T.-S.; Liu, X.-Y.; Cui, W.; Zhao, C.-H. Biotechnological potential of inulin for bioprocesses. Bioresour. Technol. 2011, 102, 4295–4303. [Google Scholar] [CrossRef] [PubMed]
  10. Zhu, Z.; Guan, Q.; Koubaa, M.; Barba, F.J.; Roohinejad, S.; Cravotto, G.; Yang, X.; Li, S.; He, J. HPLC-DAD-ESI-MS2 analytical profile of extracts obtained from purple sweet potato after green ultrasound-assisted extraction. Food Chem. 2017, 215, 391–400. [Google Scholar] [CrossRef] [PubMed]
  11. Zhu, Z.; Wu, Q.; Di, X.; Li, S.; Barba, F.J.; Koubaa, M.; Roohinejad, S.; Xiong, X.; He, J. Multistage recovery process of seaweed pigments: Investigation of ultrasound assisted extraction and ultra-filtration performances. Food Bioprod. Process. 2017, 104, 40–47. [Google Scholar] [CrossRef]
  12. Chen, G.; Kan, J. Ultrasound-assisted extraction, characterization, and antioxidant activity in vitro and in vivo of polysaccharides from chestnut rose (Rosa roxburghii tratt) fruit. J. Food Sci. Technol. 2018, 55, 1083–1092. [Google Scholar] [CrossRef] [PubMed]
  13. Zhu, Z.; Bals, O.; Grimi, N.; Ding, L.; Vorobiev, E. Better damage of chicory tissue by combined electroporation and ohmic heating for solute extraction. Food Bioprod. Process. 2015, 94, 248–254. [Google Scholar] [CrossRef]
  14. Zhu, Z.; Bals, O.; Grimi, N.; Vorobiev, E. Pilot scale inulin extraction from chicory roots assisted by pulsed electric fields. Int. J. Food Sci. Technol. 2012, 47, 1361–1368. [Google Scholar] [CrossRef]
  15. Khuenpet, K.; Fukuoka, M.; Jittanit, W.; Sirisansaneeyakul, S. Spray drying of inulin component extracted from Jerusalem artichoke tuber powder using conventional and ohmic-ultrasonic heating for extraction process. J. Food Eng. 2017, 194, 67–78. [Google Scholar] [CrossRef]
  16. Zhu, Z.; Bals, O.; Grimi, N.; Ding, L.; Vorobiev, E. Qualitative characteristics and dead-end ultrafiltration of chicory juice obtained from pulsed electric field treated chicories. Ind. Crop. Prod. 2013, 46, 8–14. [Google Scholar] [CrossRef]
  17. Dubois, M.; Gilles, K.A.; Hamilton, J.K.; Rebers, P.A.; Smith, F. Colorimetric method for determination of sugars. Anal. Chem. 1956, 28, 350–356. [Google Scholar] [CrossRef]
  18. Miller, G.L. Use of dinitrosalicylic acid reagent for determination of reducing sugar. Anal. Chem. 1959, 31, 426–428. [Google Scholar] [CrossRef]
  19. Glibowski, P.; Wasko, A. Effect of thermochemical treatment on the structure of inulin and its gelling properties. Int. J. Food Sci. Technol. 2008, 43, 2075–2082. [Google Scholar] [CrossRef]
  20. Li, W.; Zhang, J.; Yu, C.; Li, Q.; Dong, F.; Wang, G.; Gu, G.; Guo, Z. Extraction, degree of polymerization determination and prebiotic effect evaluation of inulin from Jerusalem artichoke. Carbohydr. Polym. 2015, 121, 315–319. [Google Scholar] [CrossRef] [PubMed]
  21. Lopes, S.M.; Krausová, G.; Rada, V.; Gonçalves, J.E.; Gonçalves, R.A.; de Oliveira, A.J. Isolation and characterization of inulin with a high degree of polymerization from roots of Stevia rebaudiana (bert.) Bertoni. Carbohydr. Res. 2015, 411, 15–21. [Google Scholar] [CrossRef] [PubMed]
  22. Ma, C.; Sun, Z.; Chen, C.; Zhang, L.; Zhu, S. Simultaneous separation and determination of fructose, sorbitol, glucose and sucrose in fruits by HPLC–ELSD. Food Chem. 2014, 145, 784–788. [Google Scholar] [CrossRef] [PubMed]
  23. Shanmugavelan, P.; Kim, S.Y.; Kim, J.B.; Kim, H.W.; Cho, S.M.; Kim, S.N.; Kim, S.Y.; Cho, Y.S.; Kim, H.R. Evaluation of sugar content and composition in commonly consumed korean vegetables, fruits, cereals, seed plants, and leaves by HPLC-ELSD. Carbohydr. Res. 2013, 380, 112–117. [Google Scholar] [CrossRef] [PubMed]
  24. Wang, X.X. Study on hydrolysis technology of chicory inulin. J. Anhui Agric. Sci. 2008, 36, 8874–8875. [Google Scholar]
  25. Fan, Y.; Xing, S. Kinetics of acid-hydrolysis of inulin under atmospheric pressure. Guangzhou Chem. 1999, 4. Available online: http://en.cnki.com.cn/Article_en/CJFDTOTAL-GZHX199904005.htm (accessed on 26 March 2018). (In Chinese).
Figure 1. Schematic presentation of combined trifluoroacetic acid hydrolysis and HPLC-ELSD analysis for inulin determination.
Applsci 08 00710 g001
Figure 2. Effect of trifluoroacetic acid (TFA) concentration (CTFA), hydrolysis time (t) and hydrolysis temperature (T) on fructose concentration in hydrolysates.
Applsci 08 00710 g002
Figure 3. Log Cf versus Log X for linearity presentation. Cf (mg/mL) is the concentration of fructose, and X (mv.s) is the peak area of HPLC-ELSD analysis.
Applsci 08 00710 g003
Figure 4. HPLC-ELSD for: Jerusalem artichoke root extract (a); and hydrolysate of Jerusalem artichoke root extract with developed method in this study (b).
Applsci 08 00710 g004
Figure 5. Inulin content versus extraction temperature. Ultrasonic power was 60 W.
Applsci 08 00710 g005
Figure 6. Inulin content versus ultrasonic power (W). Extraction temperature was 40 °C.
Applsci 08 00710 g006
Table 1. Precision of the combined method consisting of trifluoroacetic (TFA) hydrolysis and HPLC-ELSD analysis for inulin quantification (n = 6).
AnalysisConcentration of Fructose (mg/mL)Mean Concentration (mg/mL)RSD (%)
10.40110.39731.11
20.4032
30.3980
40.3927
50.3971
60.3921
RSD: relative standard deviation.
Table 2. Recovery values obtained for the method consisting of a combined trifluoroacetic acid (TFA) hydrolysis and HPLC-ELSD analysis for inulin quantification.
Fructose Level (mL)Recovery (%)Mean Recovery (%)RSD (%)
1.0101.53100.271.11
2.099.44
3.099.81
RSD: relative standard deviation.
Table 3. Stability of method.
Time (h)01234
Concentration of Fructose (mg/mL)0.40110.39800.39500.40050.4031
RSD (%)0.78
RSD: relative standard deviation.

