Degradation of Diallyl Phthalate (DAP) by Fenton Oxidation: Mechanistic and Kinetic Studies


1
Department of Chemistry, Faculty of Sciences of Gabes, University of Gabes, Gabes 6072, Tunisia
2
Department of Chemistry and Earth Sciences, College of Arts and Sciences, Qatar University, P.O. Box 2713, Doha, Qatar
3
Materials Science and Technology Program, College of Arts and Sciences, Qatar University, P.O. Box 2713, Doha, Qatar
*
Author to whom correspondence should be addressed.
Appl. Sci. 2019, 9(1), 23; https://0-doi-org.brum.beds.ac.uk/10.3390/app9010023
Submission received: 5 December 2018
/
Revised: 18 December 2018
/
Accepted: 19 December 2018
/
Published: 21 December 2018
(This article belongs to the Special Issue Innovative Water and Wastewater Treatment Technologies for Supporting Global Sustainability)
Abstract
:In this work, the degradation and mineralization of Diallyl Phthalate (DAP) in water by Fenton oxidation was investigated. The effects of different experimental parameters including the initial pH, the hydrogen peroxide (H2O2) dose, the catalyst (Fe2+) dose, the iron source, and the DAP concentration on the rate and the yield of DAP degradation by Fenton oxidation were evaluated. DAP and its intermediates were quantified by high performance liquid chromatography (HPLC) analysis and the measurement of total organic carbon (TOC) during Fenton oxidation. The results obtained confirmed that hydroxyl radicals (HO•) generated from Fenton’s reaction were capable of completely eliminating DAP from water. Fenton oxidation of 100 mg/L DAP aqueous solution at pH = 3.2 required 1000 mg/L H2O2 and 50 mg/L Fe2+. Under these conditions, more than TOC removal exceeded 95% after 300 min Fenton oxidation. The competition kinetics method was used to determine an absolute rate constant of 7.26.109 M−1 s−1 for the reaction between DAP and HO• radicals. HPLC analysis showed that phthalic acid, 1,2-dihydroxybenzene, 1,2,4-trihydroxybenzene, maleic acid, formic acid and oxalic acid were the main intermediates formed during DAP degradation. Accordingly, a simple DAP degradation mechanism by the Fenton reaction was proposed. These promising results proved the potential of Fenton oxidation as a cost-effective method for the decontamination of wastewaters containing phthalates.
1. Introduction
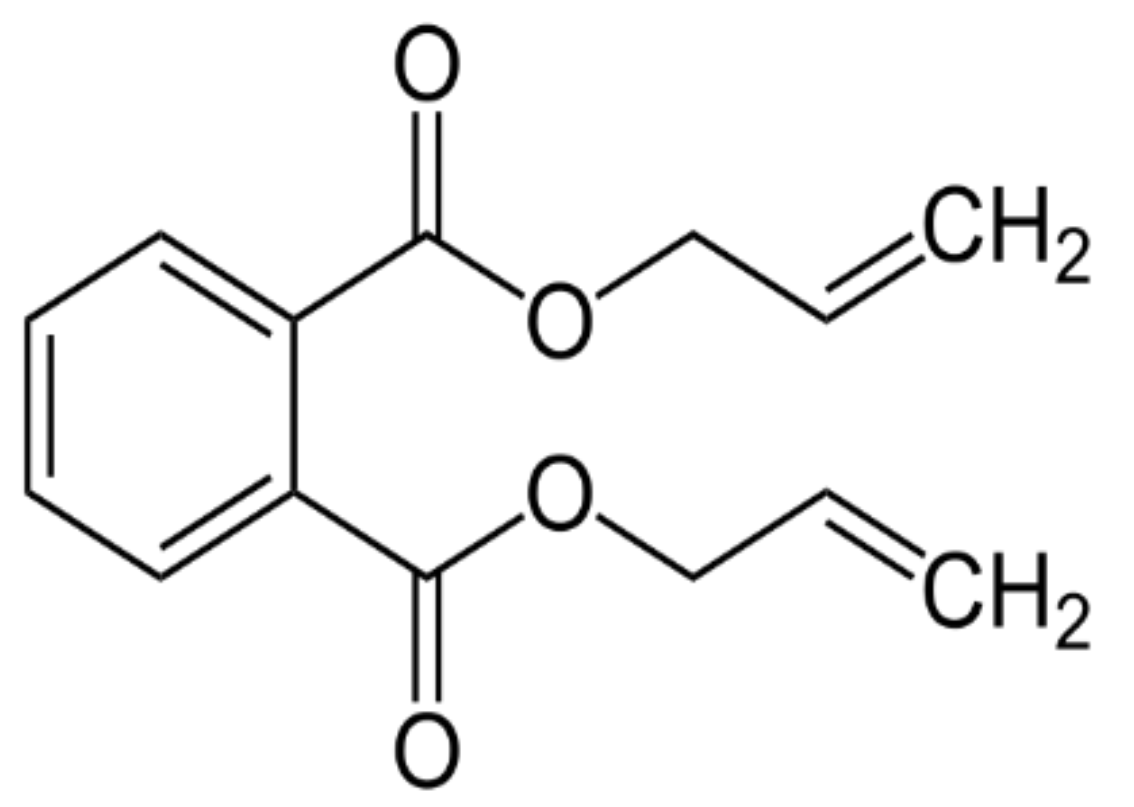
The uses of phthalates as plasticizers are widely spread and growing rapidly in the manufacture of various PVC products, textiles, toys as well as medicinal products [1,2,3,4]. Moreover, they can be applied in various industries such as insect repellents, propellants and many cosmetics manufacture [3,4]. Due to its low cost production and its versatile chemical properties, phthalates attracted innumerable industrialists towards plastic-based productions throughout the world [3,5]. Being widely used as plasticizers and not bounded to polymer mesh, they easily pass from plastic products to surrounding environments and consequently pollute water, soil, air and last but not least food products [4,6,7,8,9]. Rainfall transfers phthalates and phthalate esters in the atmosphere, which lead to their accumulation in water depending on geographic locations [8]. Discharge of phthalate esters into the atmospheric and aquatic regions has therefore increased as a reason of urbanization. Using agricultural plastics has enormously caused contamination to the soil in rural areas [10]. Hence, phthalates are very toxic, carcinogenic and can cause serious diseases in human beings [9,11,12]. They are considered as toxic environmental priority pollutants and endocrine disruptor chemicals [7,10,13,14]. In addition, it has toxic effects on the liver, kidney, and reproductive organs and act partly as endocrine disrupting agents [5,12,14,15]. Thus far, a number of phthalates have been reported such as Dibutyl Phthalate (DBP), Diethyl Phthalate (DEP), Diethyl Hexyl Phthalate (DEHP), Diallyl Phthalate (DAP) and identified in environmental water samples. DAP selected for evaluation in the current work has a chemical structure given in Figure 1. This compound can pause environmental and health problems [16,17]. DAP is largely used as plastilizers in PVC plastic containers, packaging and medical devices. It can be released during longtime storage in warm conditions and contaminate water bodies [10,11,12,13,14,15,16,17]. Nevertheless, despite its high toxicity, no valuable information on the decontamination of wastewaters containing DAP exists.
Advanced oxidation processes (AOPs) are water treatment methods generating powerful oxidants mainly hydroxyl radicals (HO•). The Fenton process, considered a cost-effective AOP is largely utilized in industrial wastewater treatment plants [18,19,20]. In Fenton oxidation, the reaction between hydrogen peroxide (H2O2) and ferrous ions (Fe2+) promotes the formation of •OH radicals in an acidic medium (Equation (1)).
Fe2+ + H2O2 → Fe3+ + HO• + OH−
Acidic conditions are necessary to scavenge the hydroxide ions formed in reaction (Equation (1)) to avoid the precipitation of Fe(OH)3. In addition, the doses of Fe2+ and H2O2 should be carefully adjusted to make Fenton oxidation highly effective. Recently, the development of new Fenton and Fenton-like catalysts for more efficient decomposition of H2O2 into HO• radicals would result in the large industrial application of Fenton oxidation for environmental remediation and water purification [21,22,23].
This work aims to investigate the degradation of DAP in aqueous solutions by Fenton oxidation. The effects of different experimental parameters such as pH, H2O2 and iron doses, iron source on the mineralization efficiency and oxidative degradation of DAP aqueous solutions were studied. The absolute rate constant for the reaction between the DAP and hydroxyl radicals was determined by the competition kinetic method, using benzoic acid as a reference. Aromatic and aliphatic byproducts of DAP oxidation by the Fenton process were examined by high performance liquid chromatography (HPLC) analysis and total organic carbon (TOC) measurement. A simple mechanism of DAP oxidation by Fenton oxidation was proposed.
2. Materials and Method
2.1. Chemicals
DAP (C14H14O4), phthalic acid (C8H6O4), 1,2-dihydroxybenzene (C4H6O2), 1,2,4-trihydroxybenzene (C6H6O3), oxalic acid, maleic acid, formic acid, and benzoic acid (C7H6O2) were purchased from Sigma-Aldrich with purities between 97% and 99%. Hydrogen peroxide was a 30% (w/w) solution (VWR). Other chemicals such as ferrous sulfate, ferric oxide, ferrous fluoride, pyrite, sulfuric acid, sodium sulfite and sodium hydroxide were supplied from VWR and Sigma-Aldrich. HPLC grade acetonitrile (Merck, Buchs, Switzerland) and formic acid (Sigma Aldrich Int., Buchs, Switzerland) were used for HPLC analysis.
2.2. Analytical Procedures
The Analytik Jena TOC analyzer was used to measure the total organic carbon (TOC). The quantification of DAP and its intermediates were performed by HPLC–UV (Agilent 1100 series, Santa Clara, CA, USA) at 25 °C. 20 μL of each sample was injected into a Nucleosil C18 analytical column. The wavelength of the UV detector was set at 260 nm. A mixture of 25 mM formic acid aqueous solution (solvent A) and 25 mM of formic acid in acetonitrile (solvent B) was used as eluents. A lineal gradient elution (0.5 mL/min) was operated starting at 10% of solvent B rising the composition to 100% of solvent B after 40 min. HPLC using a Supelcogel H column was performed to analyze carboxylic acids. An aqueous solution of 0.15% phosphoric acid (flow rate: 0.15 mL/min) was the mobile phase. The wavelength of the UV detector was fixed at 210 nm. Linear calibration curves were obtained for the standard solutions with correlation values (r2) higher than 0.99. The pH was determined with a Micronal pH meter (model B474).
2.3. Fenton Experiments
The Fenton processes were carried out in a 1 L Pyrex reactor equipped with a magnetic stirrer, and a thermometer. Drops of 1 M sulfuric acid or 2 M sodium hydroxide was added to adjust the pH of the solution. After pH adjustment, a given mass of FeSO4.7H2O or any other iron source was introduced to the DAP solution. After the iron salt was dissolved, the Fenton oxidation started when an exact mass of 30% H2O2 was added to the solution. 10 mL samples were withdrawn from the solution at certain time intervals. To stop the reaction, a small amount of Na2SO3 was added immediately to each sample. An instantaneous analysis of pH was performed. The samples were filtered through 0.20 μm Nylon filters and analyzed for TOC, target compounds and intermediates.
3. Results and Discussion
3.1. Influence of Initial pH
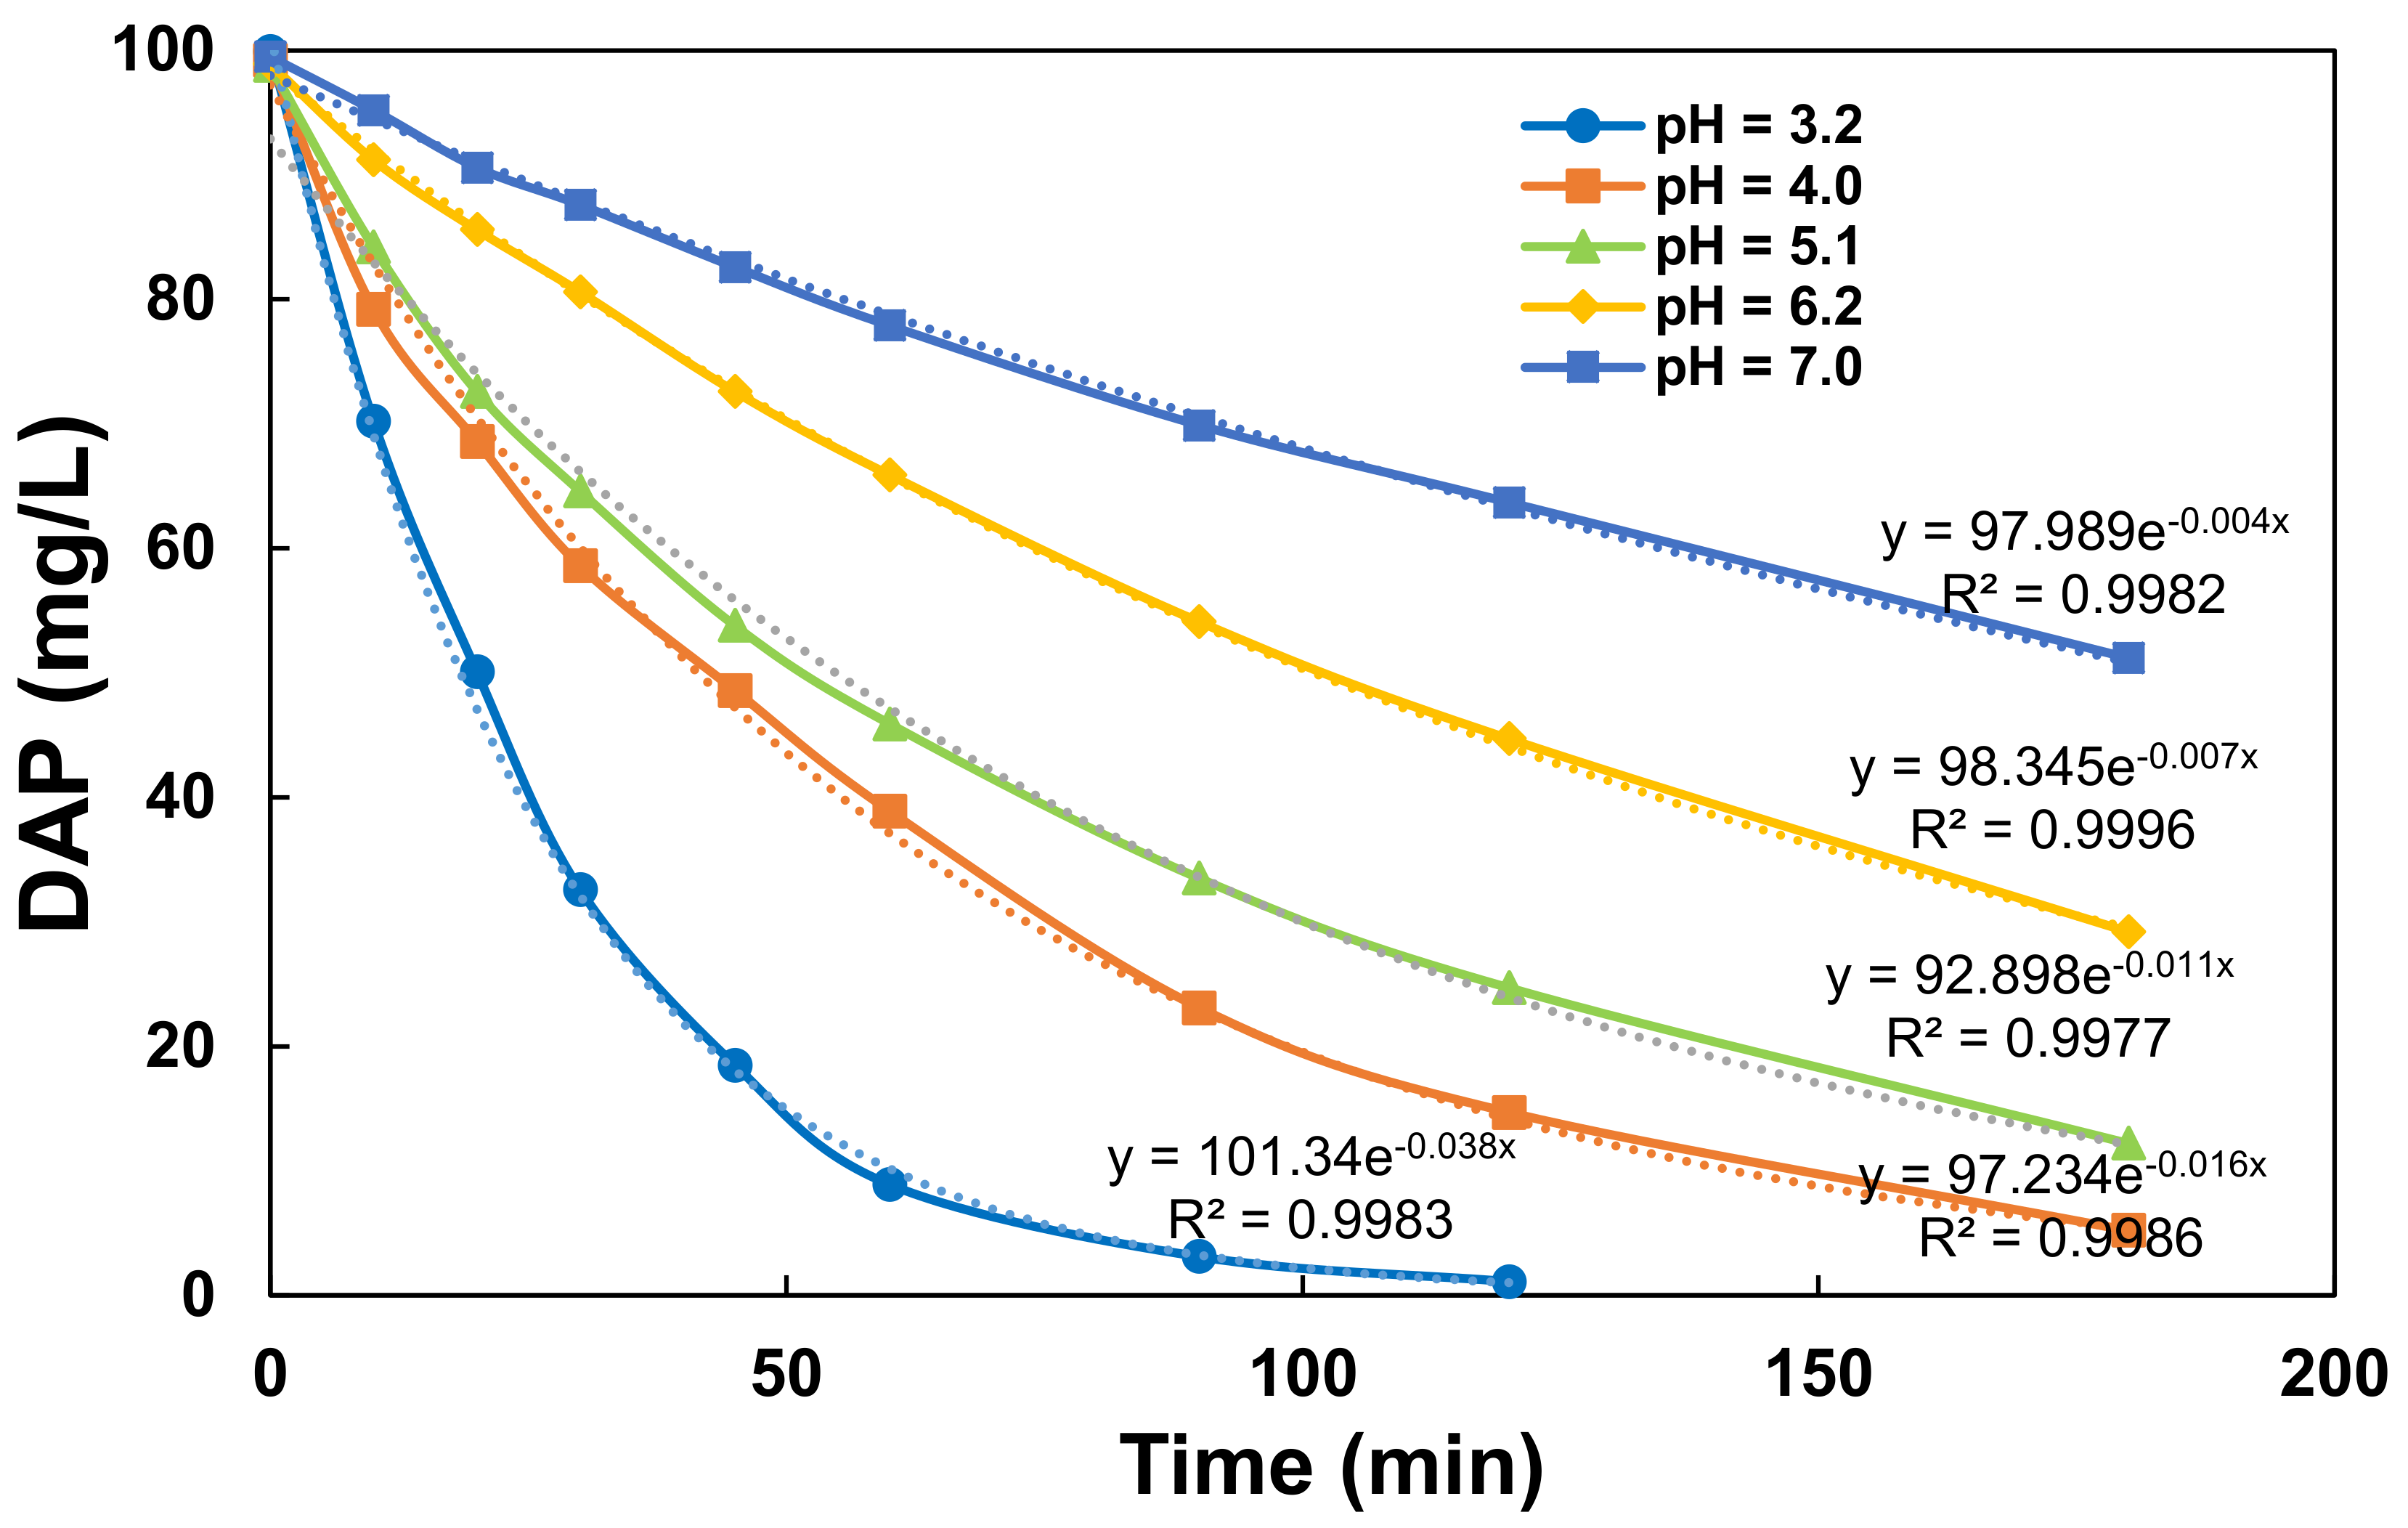
The solution pH is crucial in determining the efficiency of Fenton oxidation in degrading organic pollutants. The effect of pH within the range of 3.0 and 7.0 on DAP removal by Fenton oxidation is shown in Figure 2. This figure indicates that independent of initial pH, the DAP concentration started to decrease at the beginning of Fenton oxidation. As it can be seen, an increasing pH from 3.2 to 4.0, 5.1, 6.2 and then to 7 decreased the DAP removal from 100 mg/L to 1.1 mg/L, 14.7 mg/L, 24.7 mg/L, 44.7 mg/L and 63.7 mg/L, respectively. This result indicated that more than 98% of DAP removal was obtained at pH 3.2, while the percentage of DAP removal was between 36% and 85% for other initial pH values after 120 min of treatment. Therefore, the degradation of DAP was significantly affected by the initial pH. The highest DAP degradation yield was obtained at pH 3.2. This can be correlated to the generation of hydroxyl radicals by Fenton’s reaction. In fact, a greater generation of hydroxyl radicals at acidic conditions enhances the oxidation of organics. However, at a pH higher than 3.2, the formation of ferric hydroxide complexes Fe(OH)3 and the auto-decomposition of H2O2 to oxygen and water reduces the generation of hydroxyl radicals, which decreases the degradation efficiency of DAP. Additionally, the formation of Fe(III)-complexes at high pH values limits the regeneration of ferrous ion (Fe2+) catalyst and then reduces the regeneration of hydroxyl radicals [24,25]. Several studies have reported that pH can dramatically affect the degradation of organic pollutants such as phenols, dyes, and petrochemicals by Fenton oxidation. Higher degradation yields were measured at pH values in the range 3.0–4.0 [20,26,27,28,29,30].
3.2. Effect of Fe2+ Dose and Iron Source
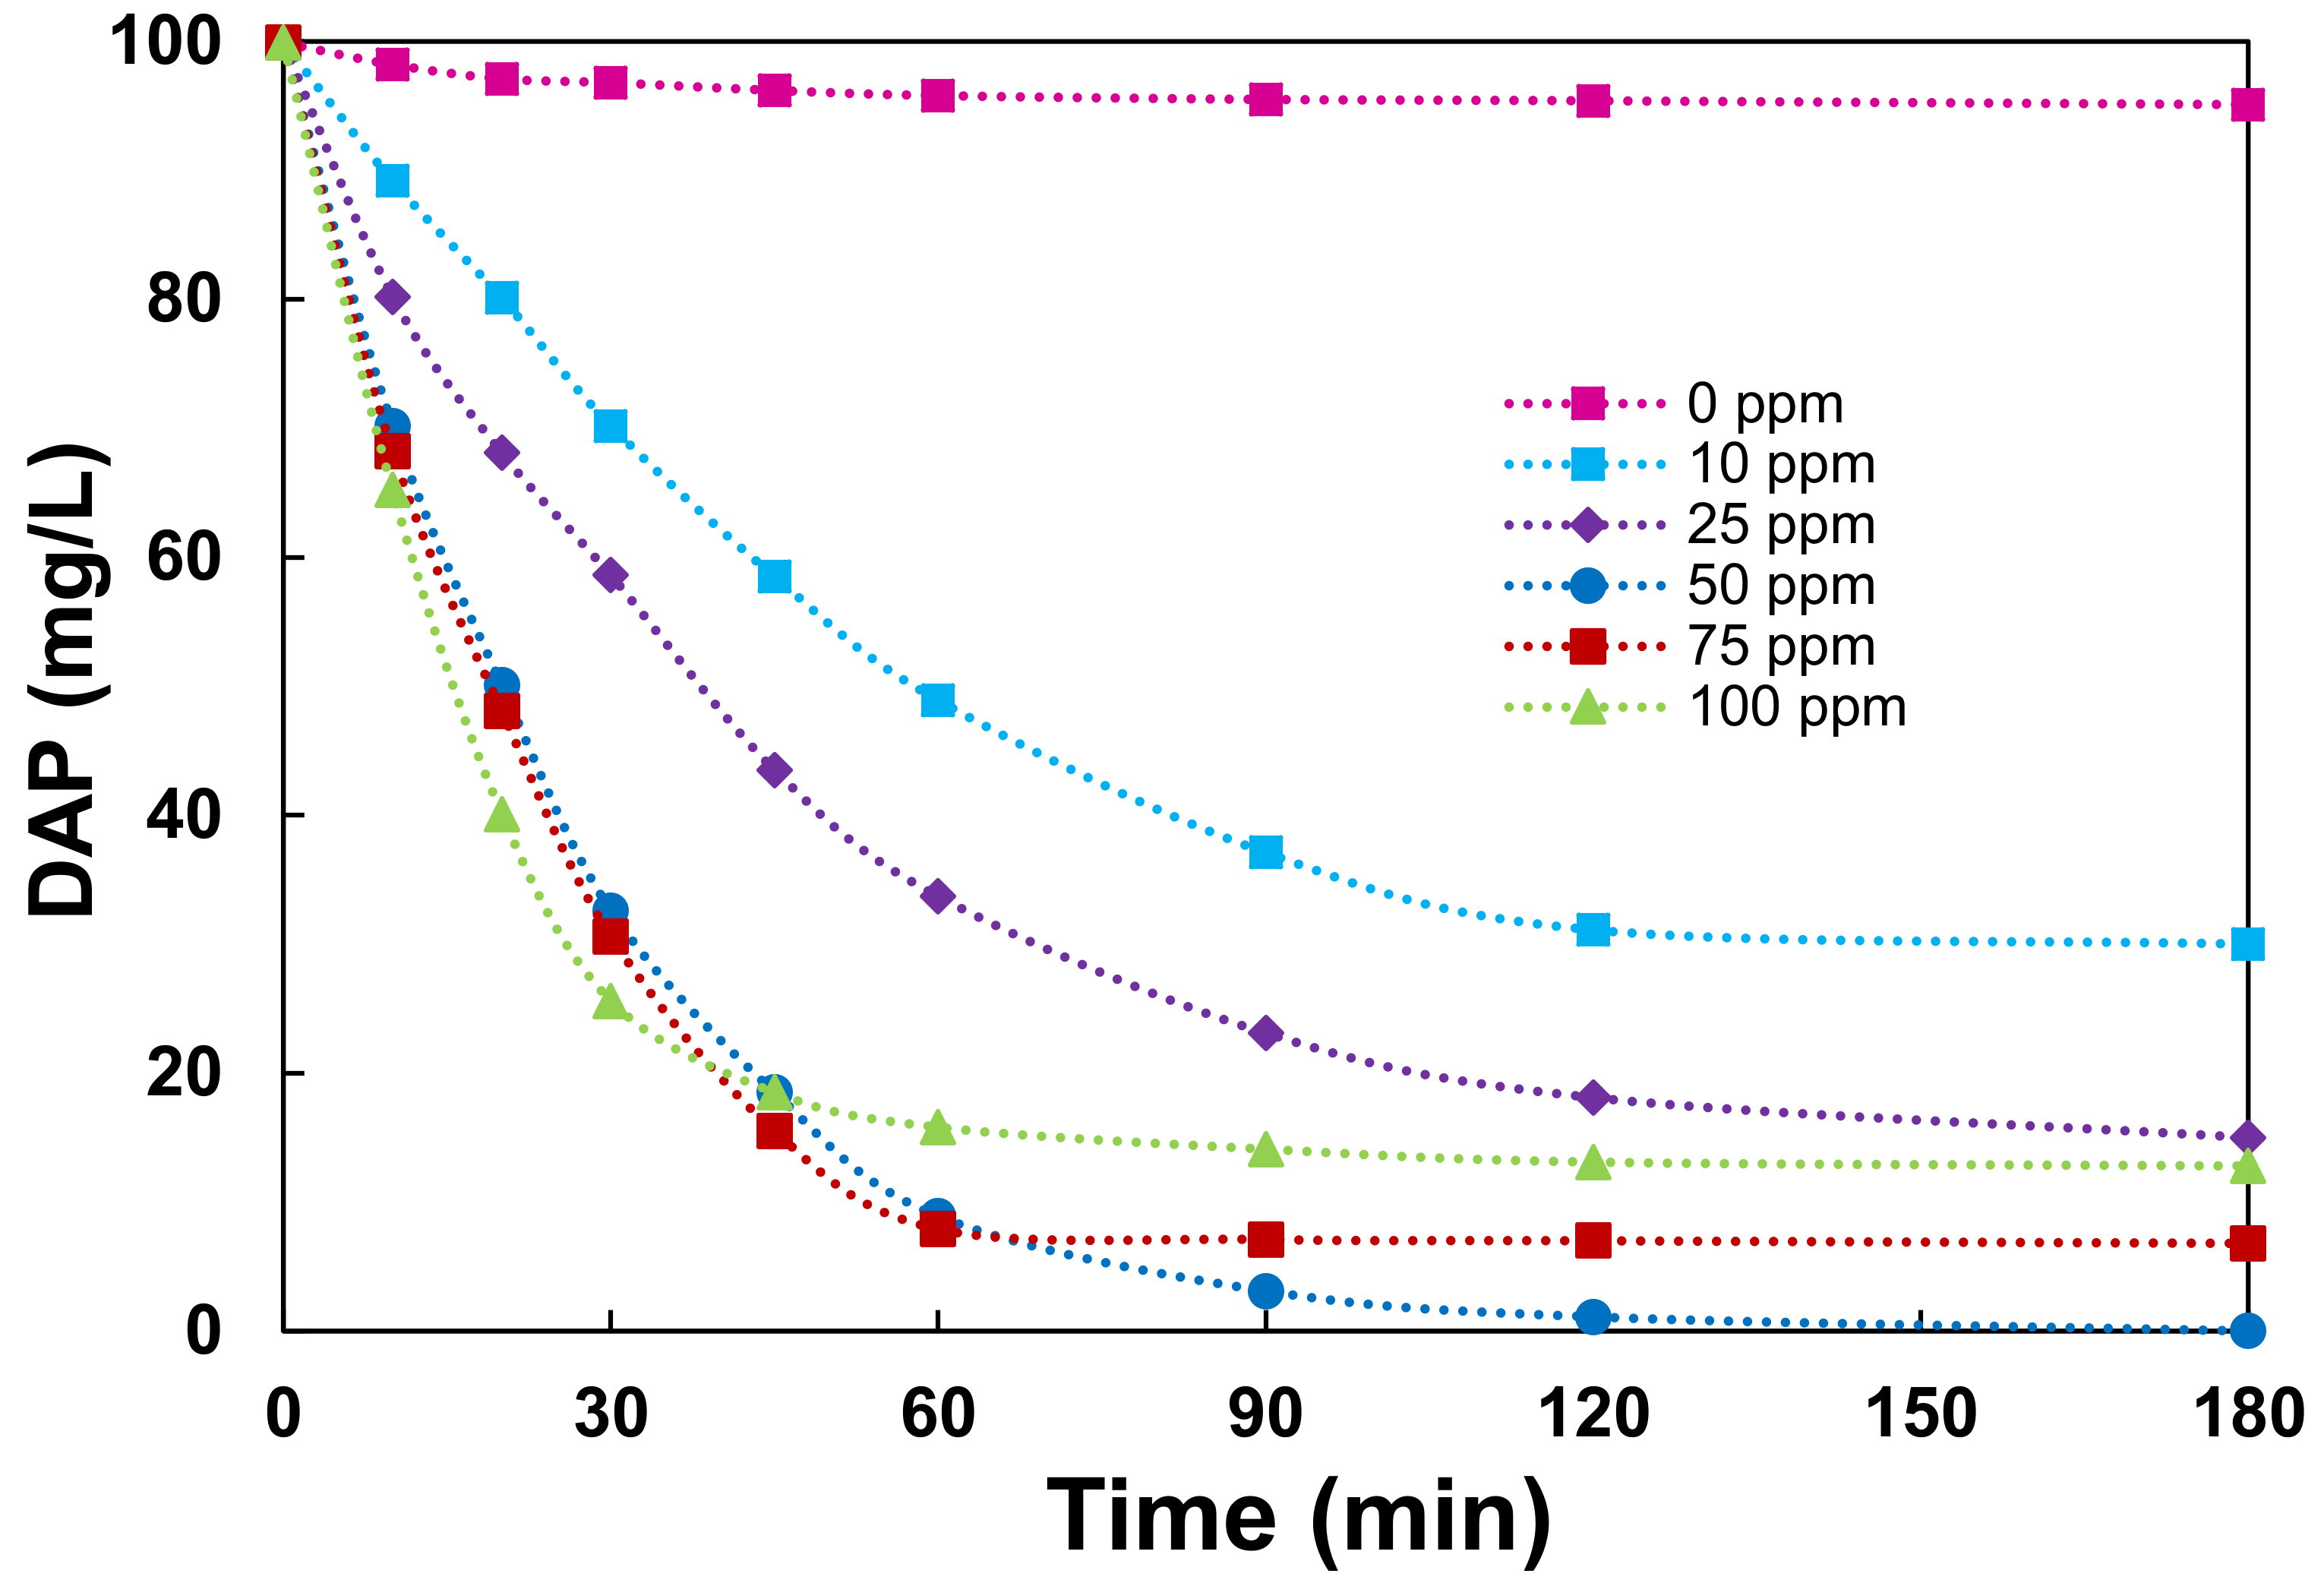
Fe2+ ions play the role of reactant/catalyst in Fenton’s reaction (Equation (1)) capable of decomposing H2O2 into hydroxyl radicals and forming ferric ions. Firstly, the influence of Fe2+ dose on the degradation of DAP was evaluated for doses between 0 and 100 mg/L during Fenton oxidation of 100 mg/L DAP using 1000 mg/L of H2O2 at pH 3.2. Figure 3 demonstrates the influence of the Fe2+ dose on DAP decay during the Fenton process. This figure shows that the degradation of DAP was remarkably affected by the Fe2+ concentration. In the absence of Fe2+, the percentage of the DAP degradation yield was less than 5%, while it increased markedly in the presence of Fe2+. Furthermore, the DAP degradation yield increased with augmenting Fe2+ concentration from 0 to 50 mg/L; however, it remained unchanged or decreased with a further increase in Fe2+ higher than 50 mg/L. Indeed, DAP degradation yields (after 180 min) were 69.96%, 84.98%, 100%, 93.19 and 87.18% for Fe2+ doses of 10, 25, 50, 75 and 100 mg Fe2+/L, respectively. Maximum DAP degradation efficiency (100 %) was achieved by 50 mg/L of Fe2+. The DAP degradation yield showed progressive improvement with the increase in the initial Fe2+ dose within the range 10–50 mg/L and could be due to the greater generation of hydroxyl radical by reaction (Equation (1)). Moreover, higher Fe2+ doses than 50 mg/L can lead to consumption of the hydroxyl radical •OH by excessive Fe2+ ions by reaction (Equation (2)) inducing the decrease in DAP degradation yield [24,31].
Fe2+ + •OH → Fe3+ + OH−
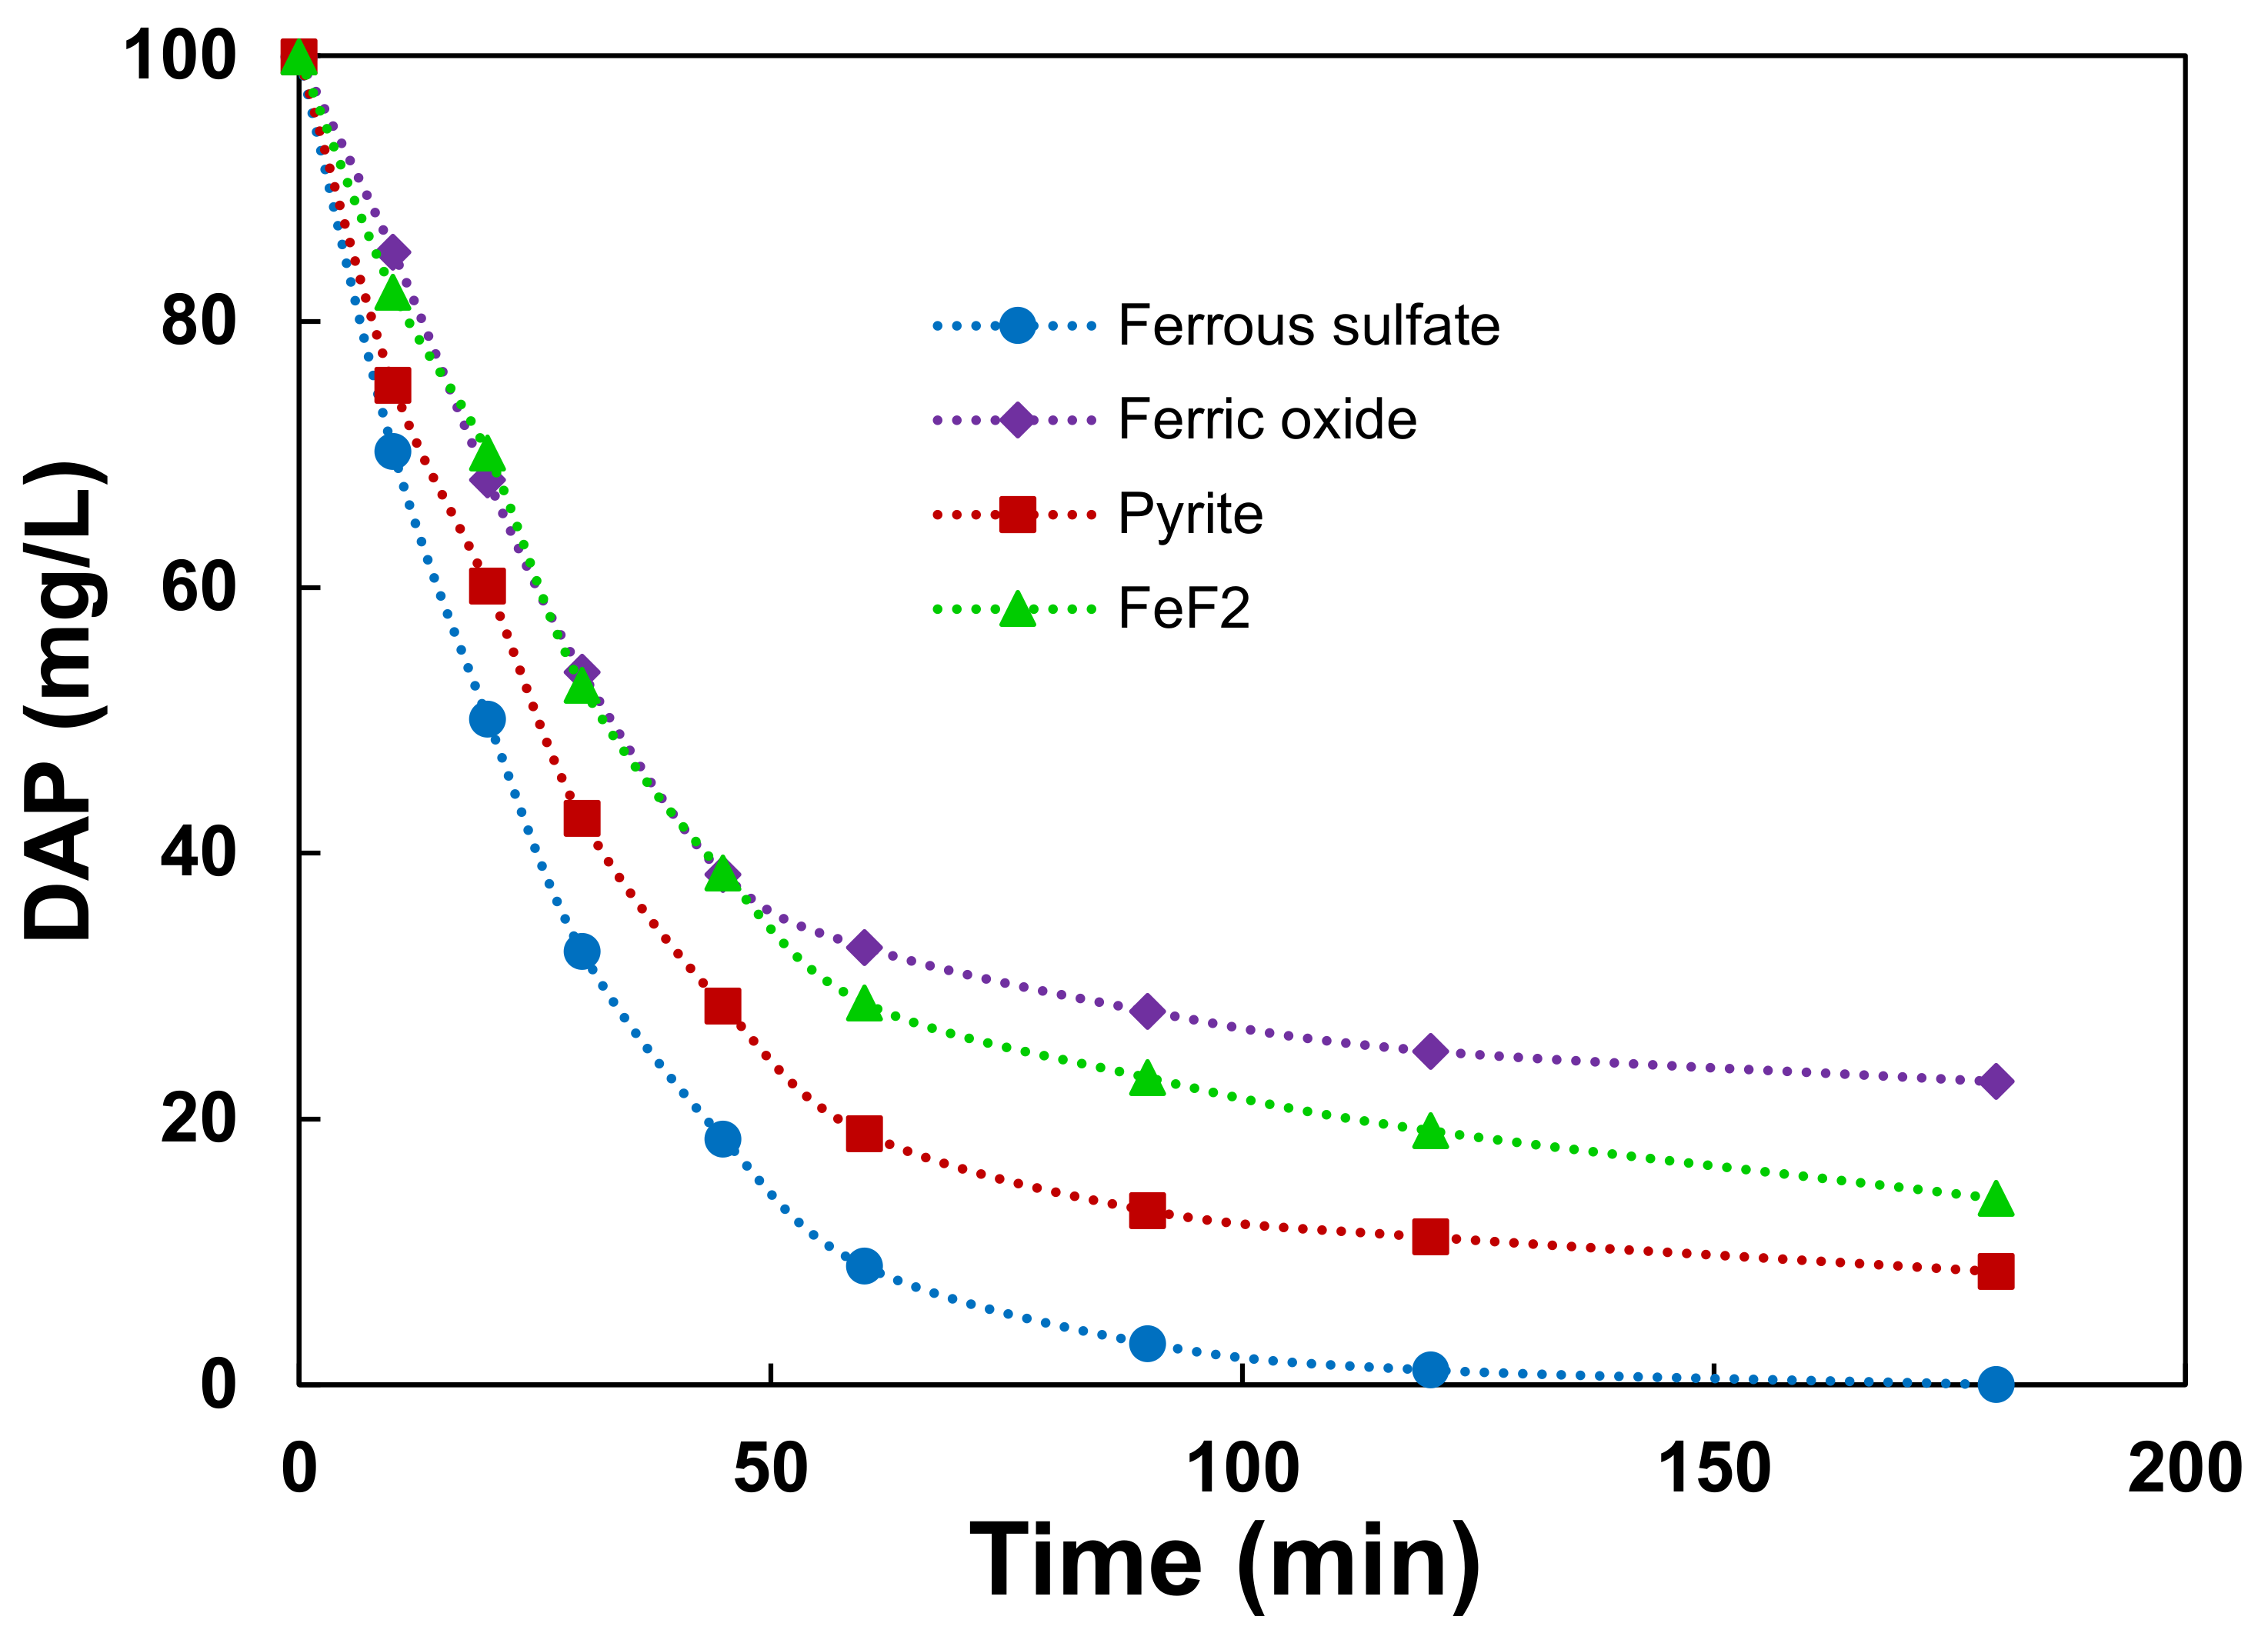
Thus, the optimum [H2O2]/[Fe2+] mass ratio for Fenton oxidation of DAP at pH 3.2 was 20 confirming the need for Fe2+ doses, which was much too less than the stoichiometric dose as reported by several studies [24,31]. To compare the effect of the catalyst source on degradation of DAP by the Fenton process, a series of experiments were performed using a fixed concentration of DAP of 100 mg/L and a dose of H2O2 of 1000 mg/L at pH 3.2, and 50 mg/L Fe2+ obtained from different sources. Four iron sources (ferrous sulfate, ferric oxide, pyrite and FeF2) were supplied during DAP degradation by Fenton reaction. The results of these experiments are presented in Figure 4. This figure shows that the DAP concentration decreased from the beginning of treatment by the Fenton process for all iron sources. However, in the presence of ferrous sulfate, the DAP degradation yield was higher than that obtained with the addition of ferric oxide, pyrite or FeF2. The complete DAP degradation was observed only when ferrous sulfate was used as a source of iron after 180 min. DAP degradation yields were 100%, 91.49%, 85.98% and 77.17% for ferrous sulfate, pyrite, FeF2 and ferric oxide, respectively. The results confirm that DAP degradation is affected by the iron source. Consequently, DAP degradation is significantly favored by homogeneous catalysis when Fe2+ is available in a soluble form than heterogeneous catalysis when an insoluble source of iron is used.
3.3. Effect of H2O2 Dose
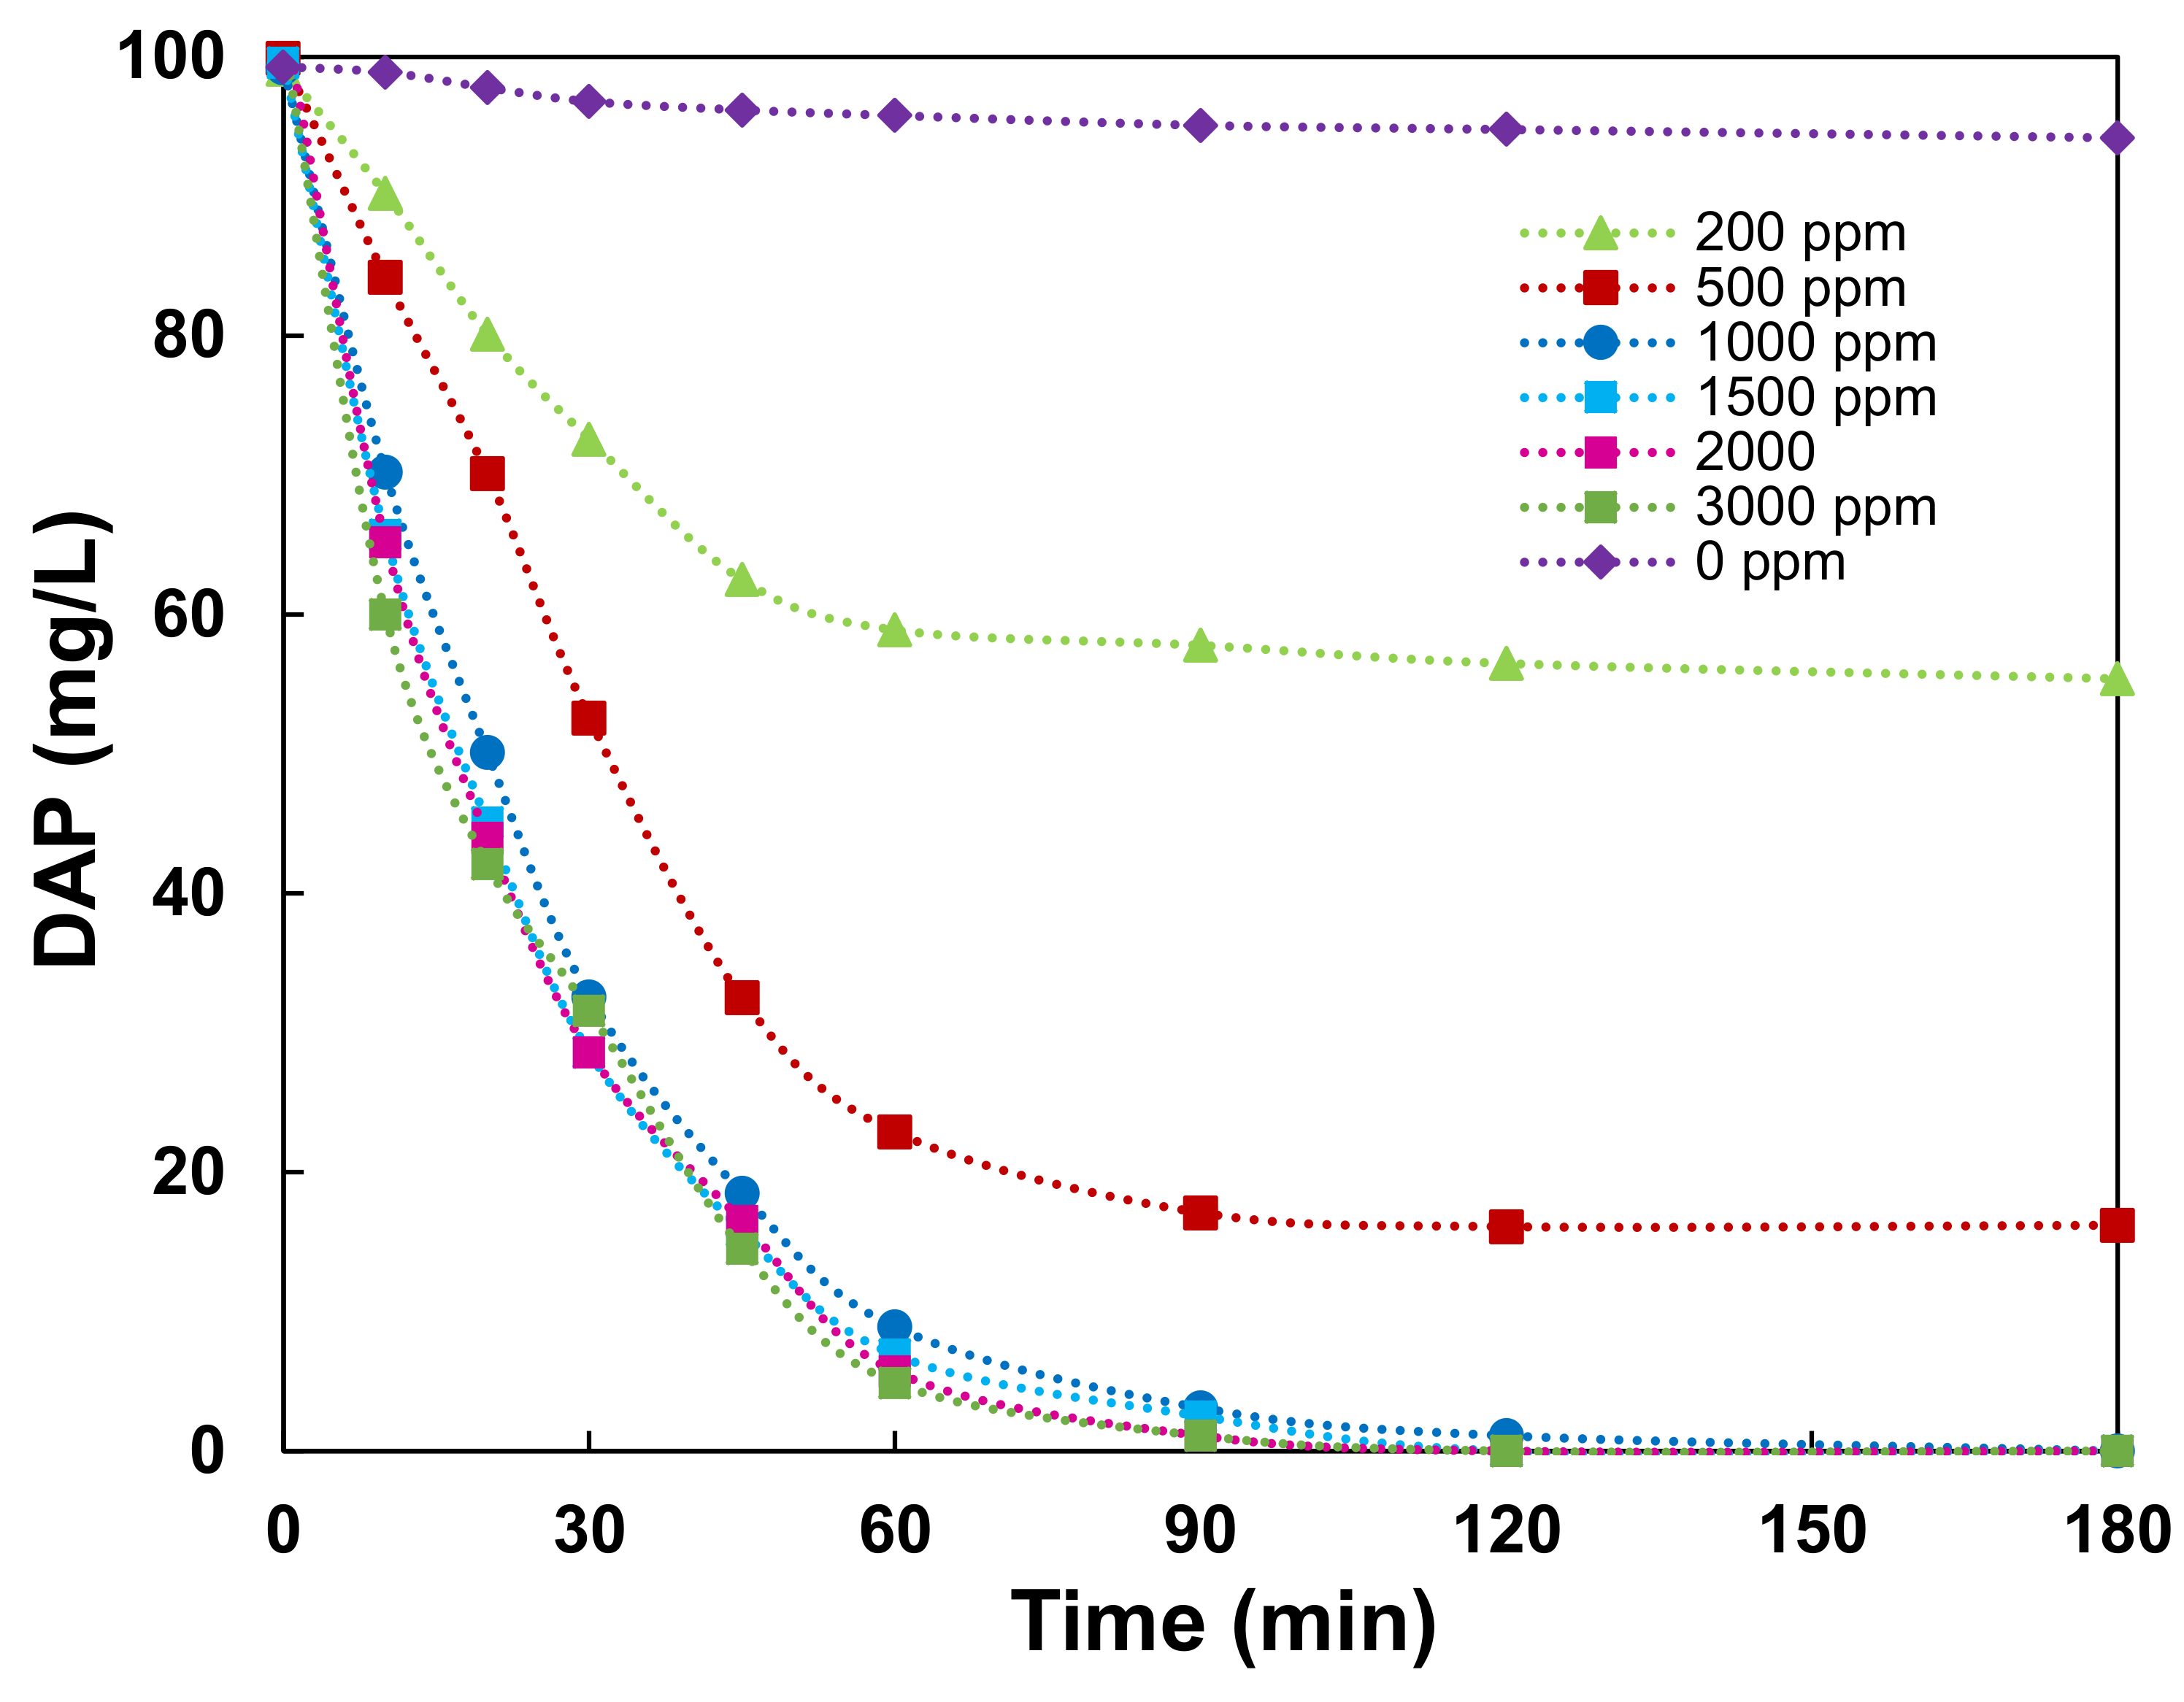
Hydrogen peroxide plays a fundamental role as an oxidizing agent in the Fenton oxidation process. For this reason, the effect of H2O2 concentration on DAP degradation was optimized using 100 mg/L of DAP, a constant [H2O2]/[Fe2+] molar ratio of 20 at pH 3.2 and different H2O2 concentrations ranging from 0 to 3000 mg/L. The results are illustrated in Figure 5. It was noticeably observed that the DAP degradation yield depended largely on the H2O2 dose. The increase in H2O2 concentration from 0 to 1000 mg/L increased the DAP degradation yield from 5% to 100% after 120 min of treatment. This can be due to a greater generation of •OH radical in the solution by catalytic decomposition of hydrogen peroxide. The highest DAP degradation yield was obtained when 1000 mg/L H2O2 was added to 100 mg/L DAP. A further increase in H2O2 concentration beyond 1000 mg/L had no effect on the degradation yield. This can be explained by the acceleration of competitive reactions between hydroxyl radicals •OH with pollutants and their scavenging by the excess in H2O2 ((Equation (3)) and (Equation (4))) [26,32]. Additionally, the auto-decomposition of H2O2 into O2 and H2O (Equation (5)) consumes a significant amount of H2O2 for higher H2O2 doses than 1000 mg/L. Accordingly, a H2O2 dose of 1000 mg/L is optimal to reach the highest DAP degradation yield by Fenton oxidation, which corresponds to [H2O2]/[DAP] mass ratio equal to 10.
HO• + Organic Pollutant → Products
HO• + H2O2 → H2O + HO2•
2H2O2 → O2 + 2H2O
3.4. Effect of DAP Concentration
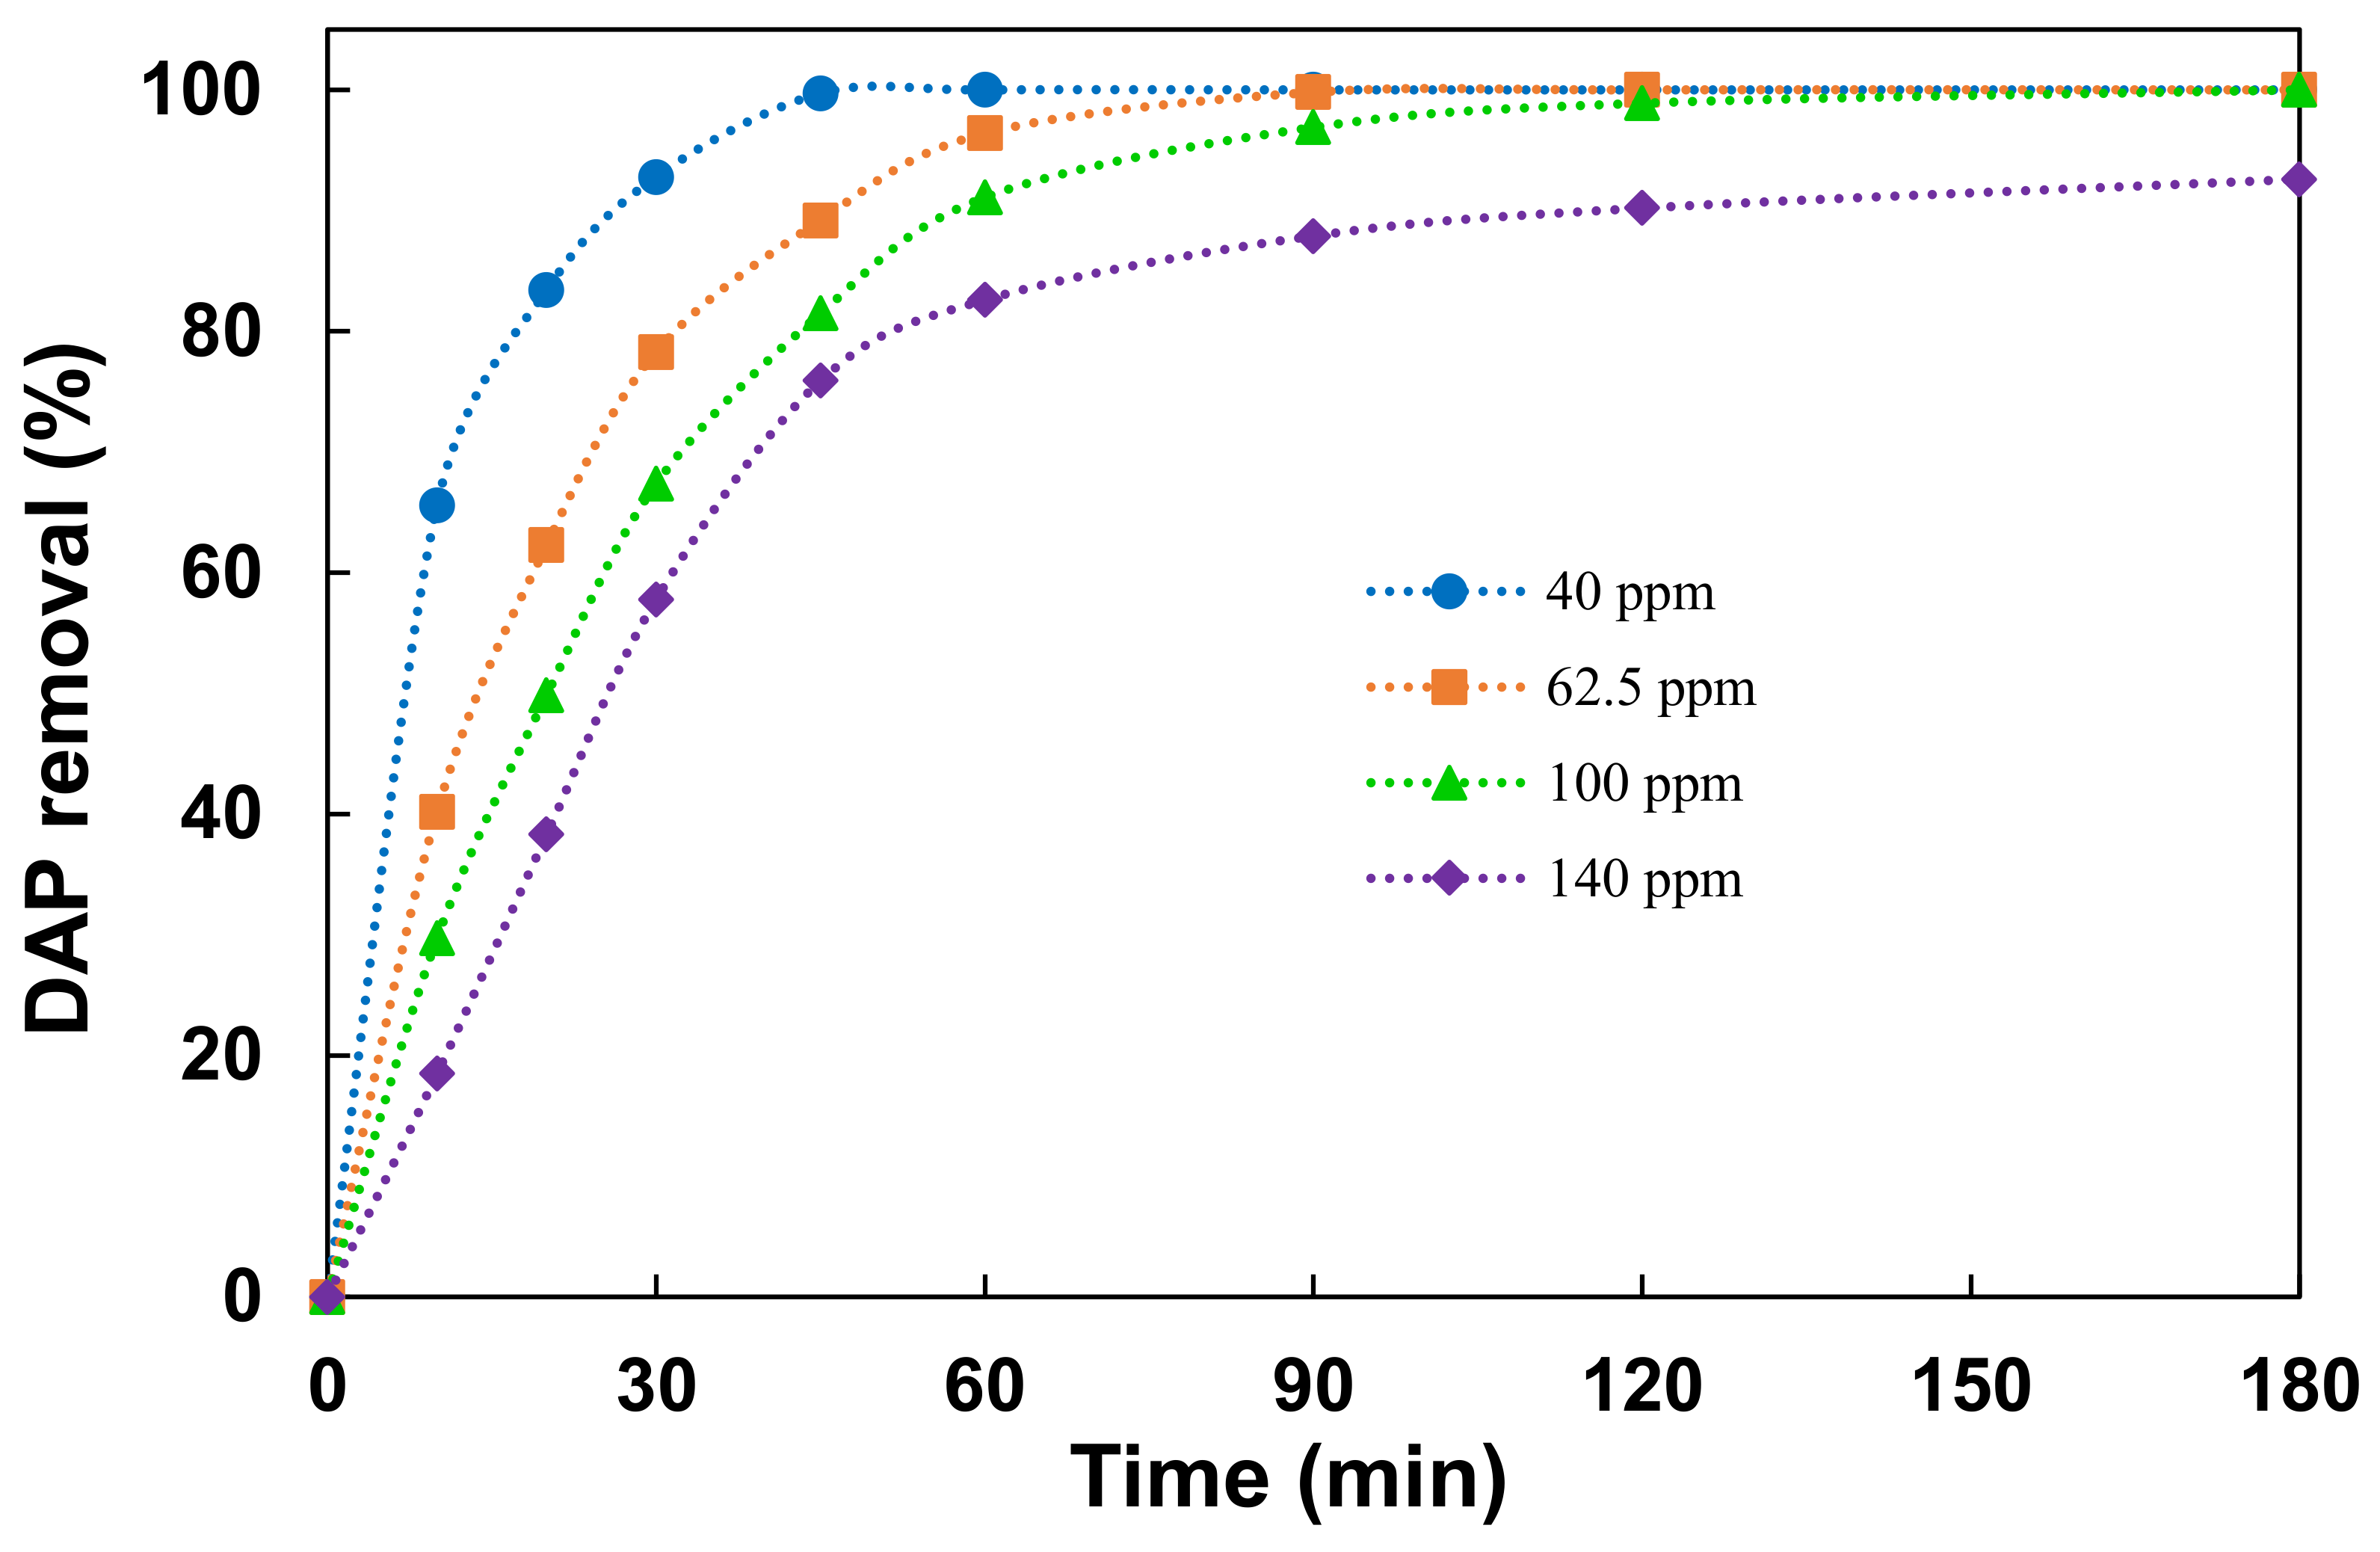
The pollutant concentration is an important parameter in wastewater treatment. To evaluate the influence of this parameter on the efficiency of the oxidation process the pH was fixed at 3.2 keeping [H2O2]/[Fe2+] and [H2O2]/[DAP] mass ratios equal to 20 and 10, respectively. The effect of DAP concentration in the range 40–140 mg/L is presented in Figure 6. This figure indicates that the DAP degradation yield achieved more than 92% after 120 min for all DAP concentrations. The increase of DAP concentration from 40 to 140 had no significant effect on DAP degradation yield by Fenton oxidation. The lower the DAP initial concentration, the shorter the reaction time needed to completely degrade DAP. For example, the DAP degradation yield decreased from 99.7% to 75.9% with an increase in DAP concentration from 40 to 140 mg/L after 45 min. This decrease in degradation rate may be due to the competitive reactions between •OH and the intermediates formed during DAP degradation by Fenton oxidation.
3.5. Rate Constant for Reactions between the DAP and Hydroxyl Radicals
Benzoic Acid (BA) was used as a model compound to determine the absolute rate constant of the reaction between DAP and HO• radicals. An absolute rate constant of BA with HO• radicals of 5 109 M−1 s−1 was reported in literature [32,33].
Considering second order reaction kinetics for the reactions between BA and DAP with HO• radicals, the rate of the reactions can be given by the equations (Equations (6)–(7)):
Assuming pseudo-first order for BA and DAP (Equations (8) and (9)):
Solving the equations for gives (Equations (10) and (11)):
The plot of Ln([DAP]0/[DAP]t) vs Ln([BA]0/[BA]t) during Fenton oxidation of 100 mg/L DAP and 100 mg/L BA (using 1000 mg/L H2O2 and 50 mg Fe2+/L at pH 3.2) is given in Figure 7. This plot is linear with a correlation coefficient (R2) higher than 0.99. After least-square regression analysis, a slope of 1.2308 was measured. Based on the competitive kinetic model reported in literature by several studies [32,33], the absolute rate constant of the reaction between DAP and HO• hydroxyl radicals was calculated to be 7.26 109 M−1 s−1. This value DAP was in the same range as other aromatic compounds and phenols mentioned by Benitez et al. [33].
3.6. DAP Mineralization and Identification of Oxidation Intermediates
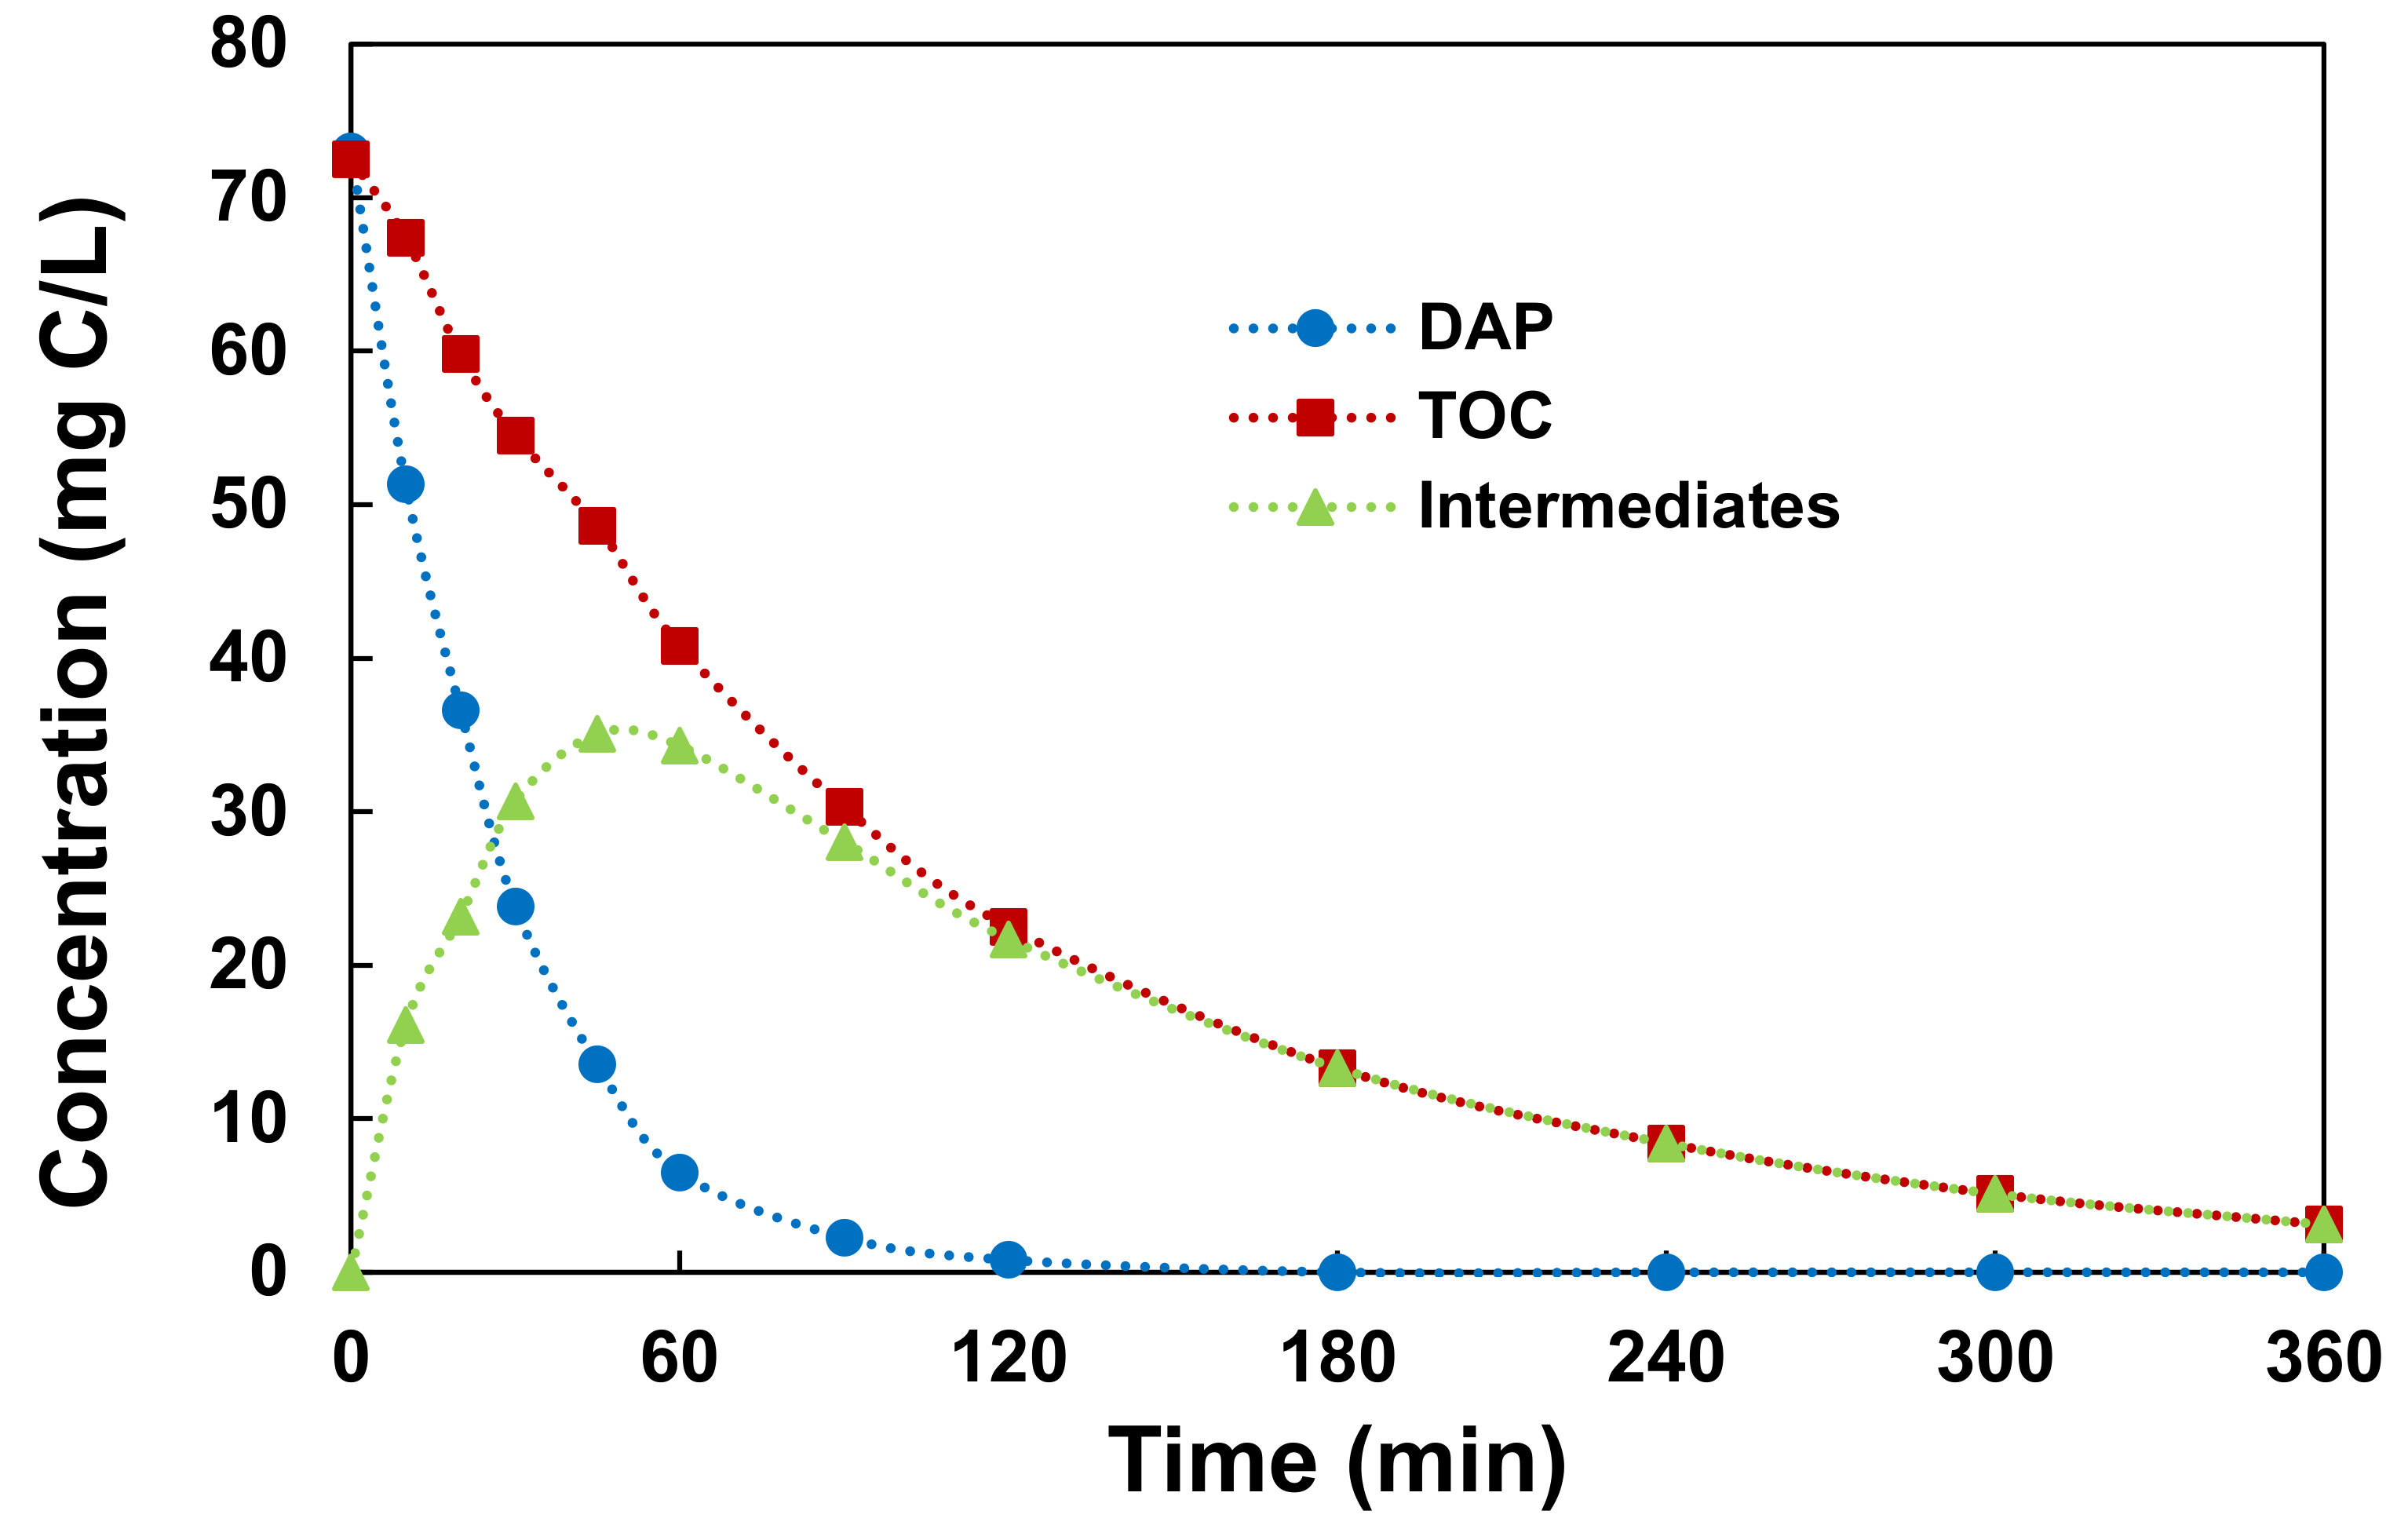
The TOC removal is necessary for the complete destruction of the starting molecule and its transformation into CO2 and H2O. For this reason, the mineralization of DAP was followed by measuring the TOC changes during DAP degradation by Fenton oxidation of 100 mg/L DAP aqueous solution using 1000 mg/L H2O2 and 50 mg/L Fe2+ at pH = 3.2. Figure 8 presents the changes in the concentrations of DAP, TOC and the intermediates (in mg C/L) with time during the treatment. As it can be seen, the concentration of DAP and TOC were satisfactorily reduced. DAP was rapidly and completely removed by the Fenton oxidation after a reaction time of 120 min. However, a slower exponential decrease of TOC rather than DAP was observed. TOC removal reached about 95% after 360 min treatment. This indicates that the degradation of organic compounds is more rapid than their complete mineralization. In the first step of Fenton oxidation, DAP is degraded into intermediates without carbon dioxide formation. This is confirmed by the changes of the intermediates concentration (determined by the mass difference between TOC and DAP (mg C/L) showing a rapid increase in the intermediates concentration to reach a maximum at 60 min and then parallel decay than TOC.
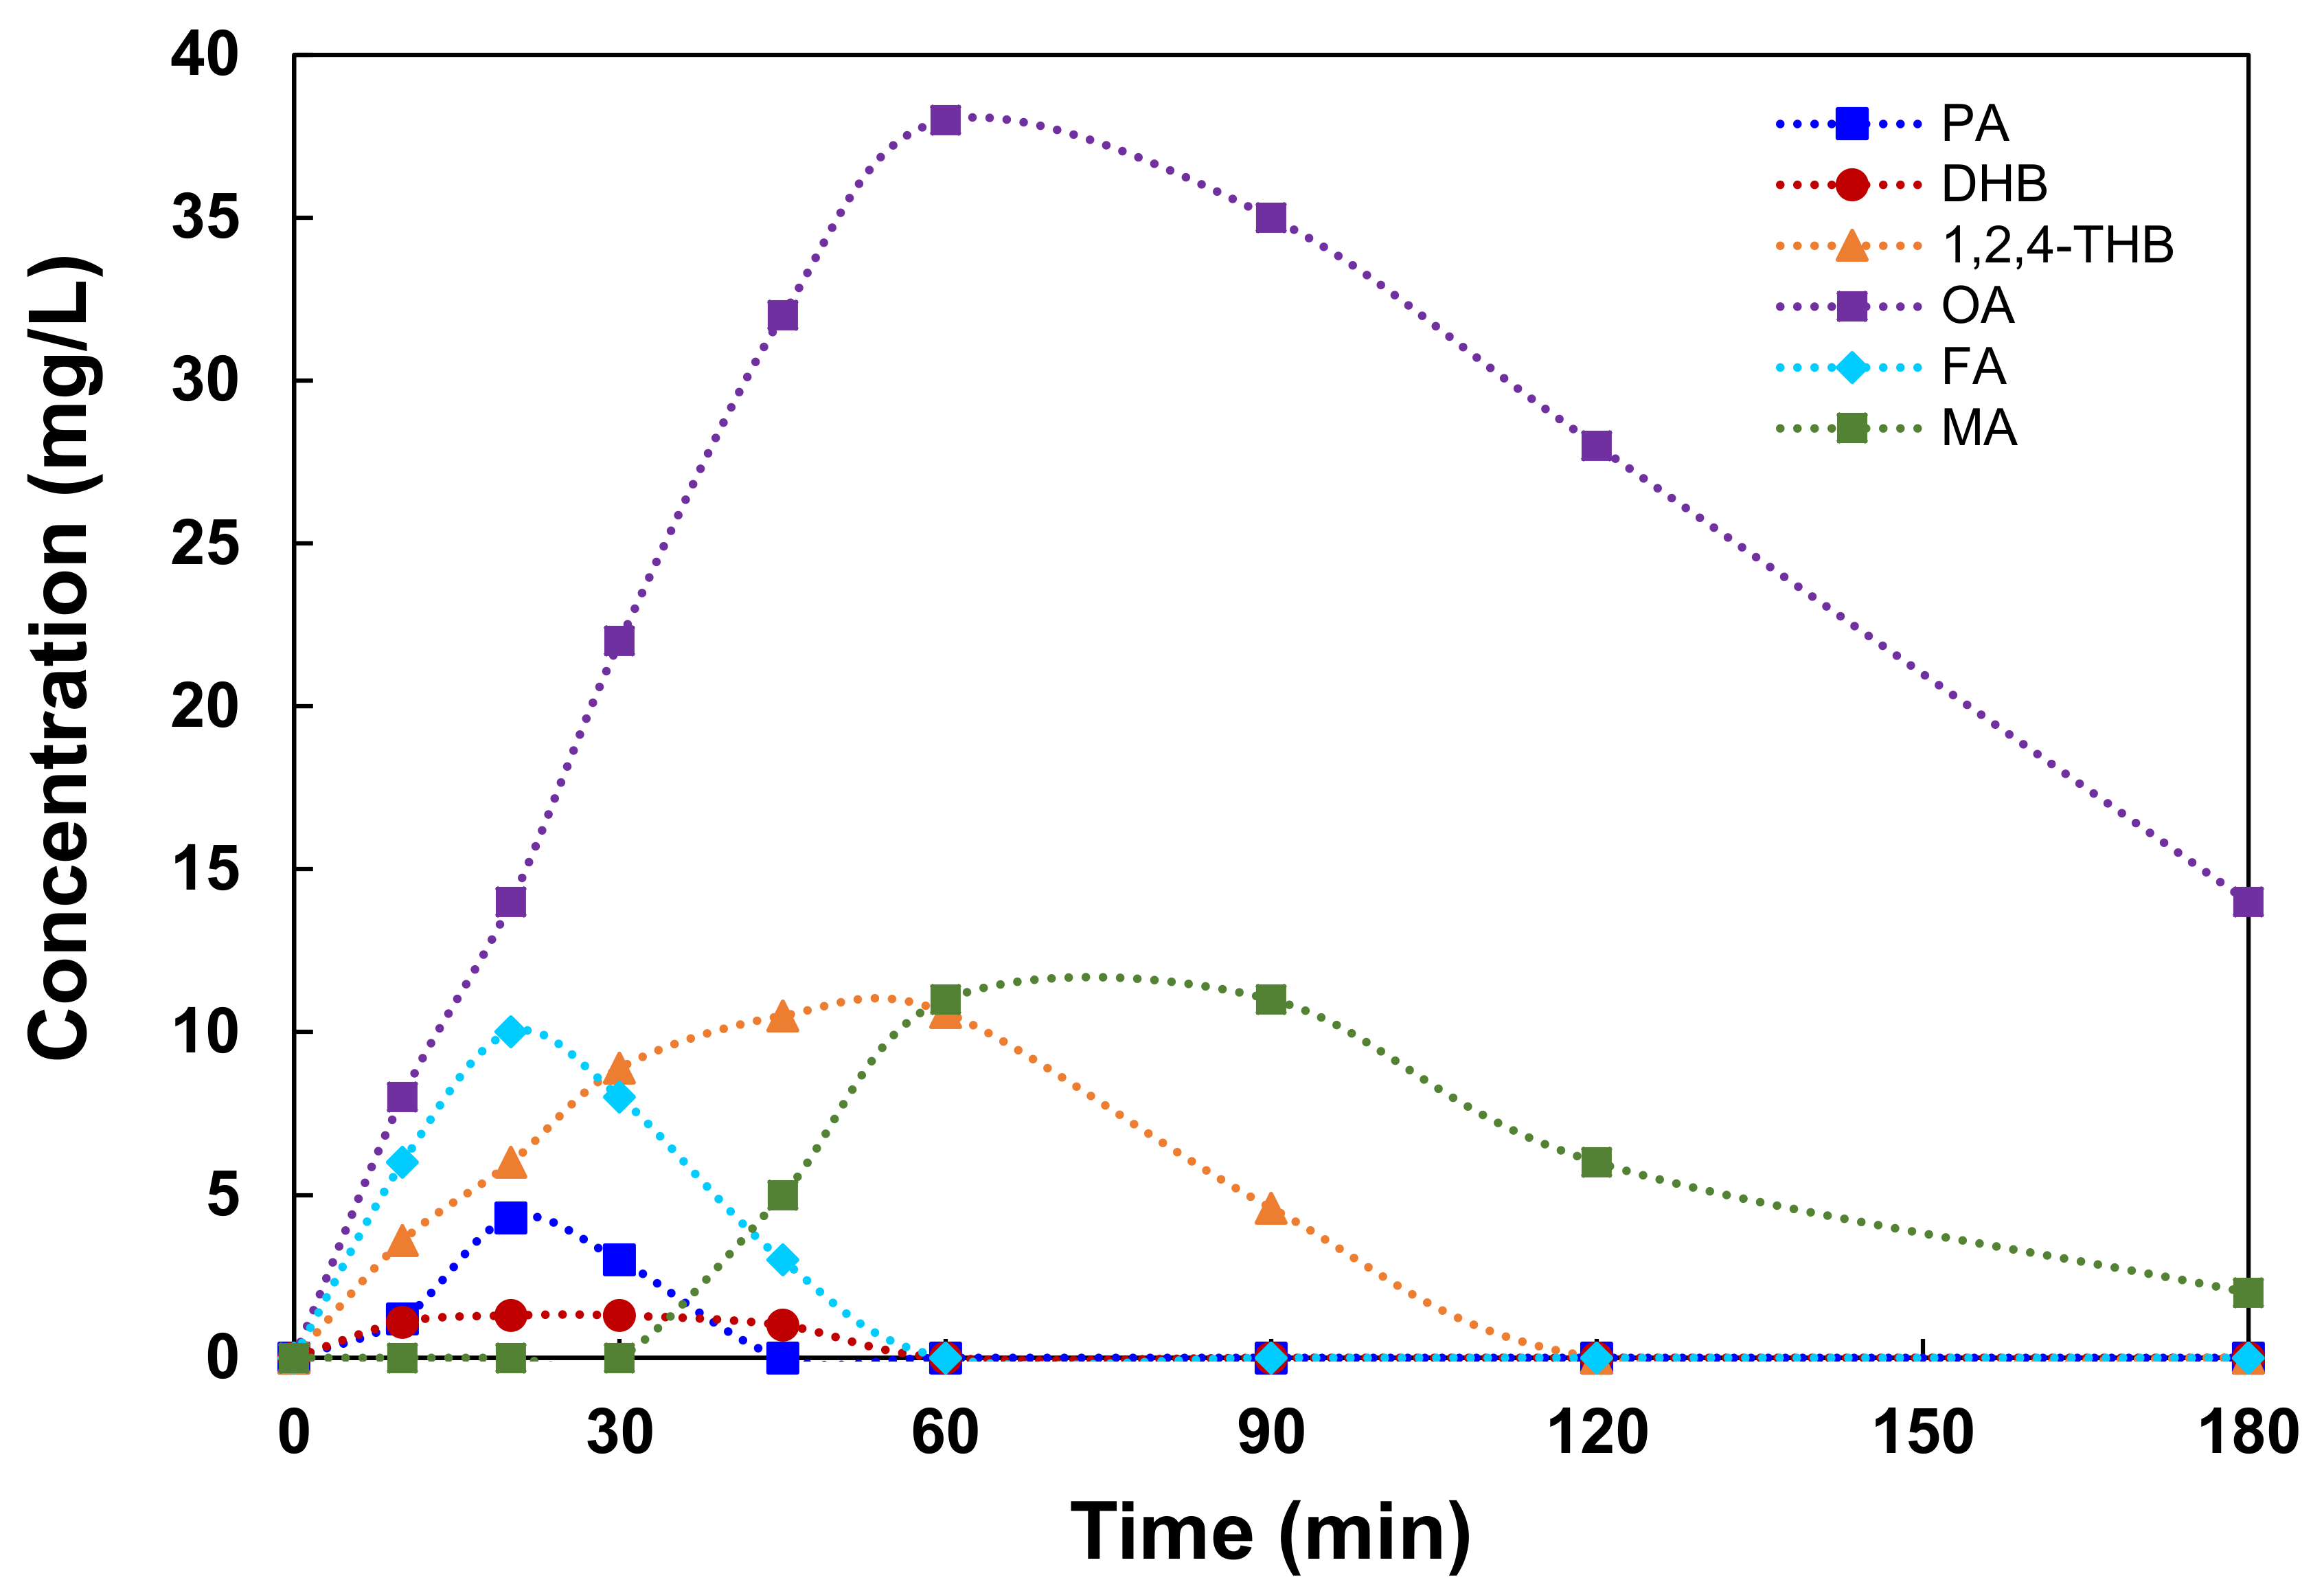
On the basis of the results above, the oxidative degradation of DAP by the Fenton process was accompanied by the formation of aromatic and aliphatic intermediate products. For this reason, it is very important to identify the main intermediates. Their identification was carried out by HPLC analyses. Figure 9 presents the evolution of the concentration of the aromatic and aliphatic intermediates with time during the treatment of aqueous solution containing 100 mg/L DAP by the Fenton process using 1000 mg/L H2O2 and 50 mg Fe2+/L and at pH 3.2. This figure shows that phthalic acid (PA), 1,2-dihydroxybenzene (DHB) and 1,2,4-trihydroxybenzene (THB) were the main aromatic intermediates identified during the oxidation of DAP by the Fenton process. These three intermediates (PA, DHB and THB) are clearly formed from the beginning of the treatment of DAP (about 5 min). A maximum concentration of 4.3 ppm phthalic acid (PA), 1.3 ppm 1,2,4-trihydroxybenzene (THB) and 10.6 ppm 1,2-dihydroxybenzene (DHB) were found, and then completely removed in 45, 60 and 120 min of treatment, respectively. This result indicated the opening of the aromatic ring and the generation of aliphatic intermediates. Maleic, formic and oxalic acids are the detectable aliphatic intermediates of DAP oxidation by the Fenton process (see Figure 8). The formation of maleic acid appeared after 30 min of treatment, attaining a plateau concentration of about 11 mg/L after around 45 min of treatment and then decreasing to very low values (2 mg/L) after 120 min treatment. Formic acid starts its formation at the beginning of treatment, reaches its maximum concentration of 10 mg/L and then completely disappears after 45 min. On the other hand, oxalic acid was, as expected, the major and most persistent carboxylic acid generated. The concentration of oxalic acid increased rapidly at the starting of treatment. The highest concentration of oxalic acid was quantified as 38 mg/L at 60 min of the treatment. After that time, the amount of oxalic acid gradually decreased to a value of 14 mg/L at the end of the treatment. Consequently, these six intermediates were more or less quickly oxidized into CO2 and H2O, and quasi-completely mineralized after about 180 min of treatment.
3.7. Proposed Reaction Pathway for DAP Mineralization
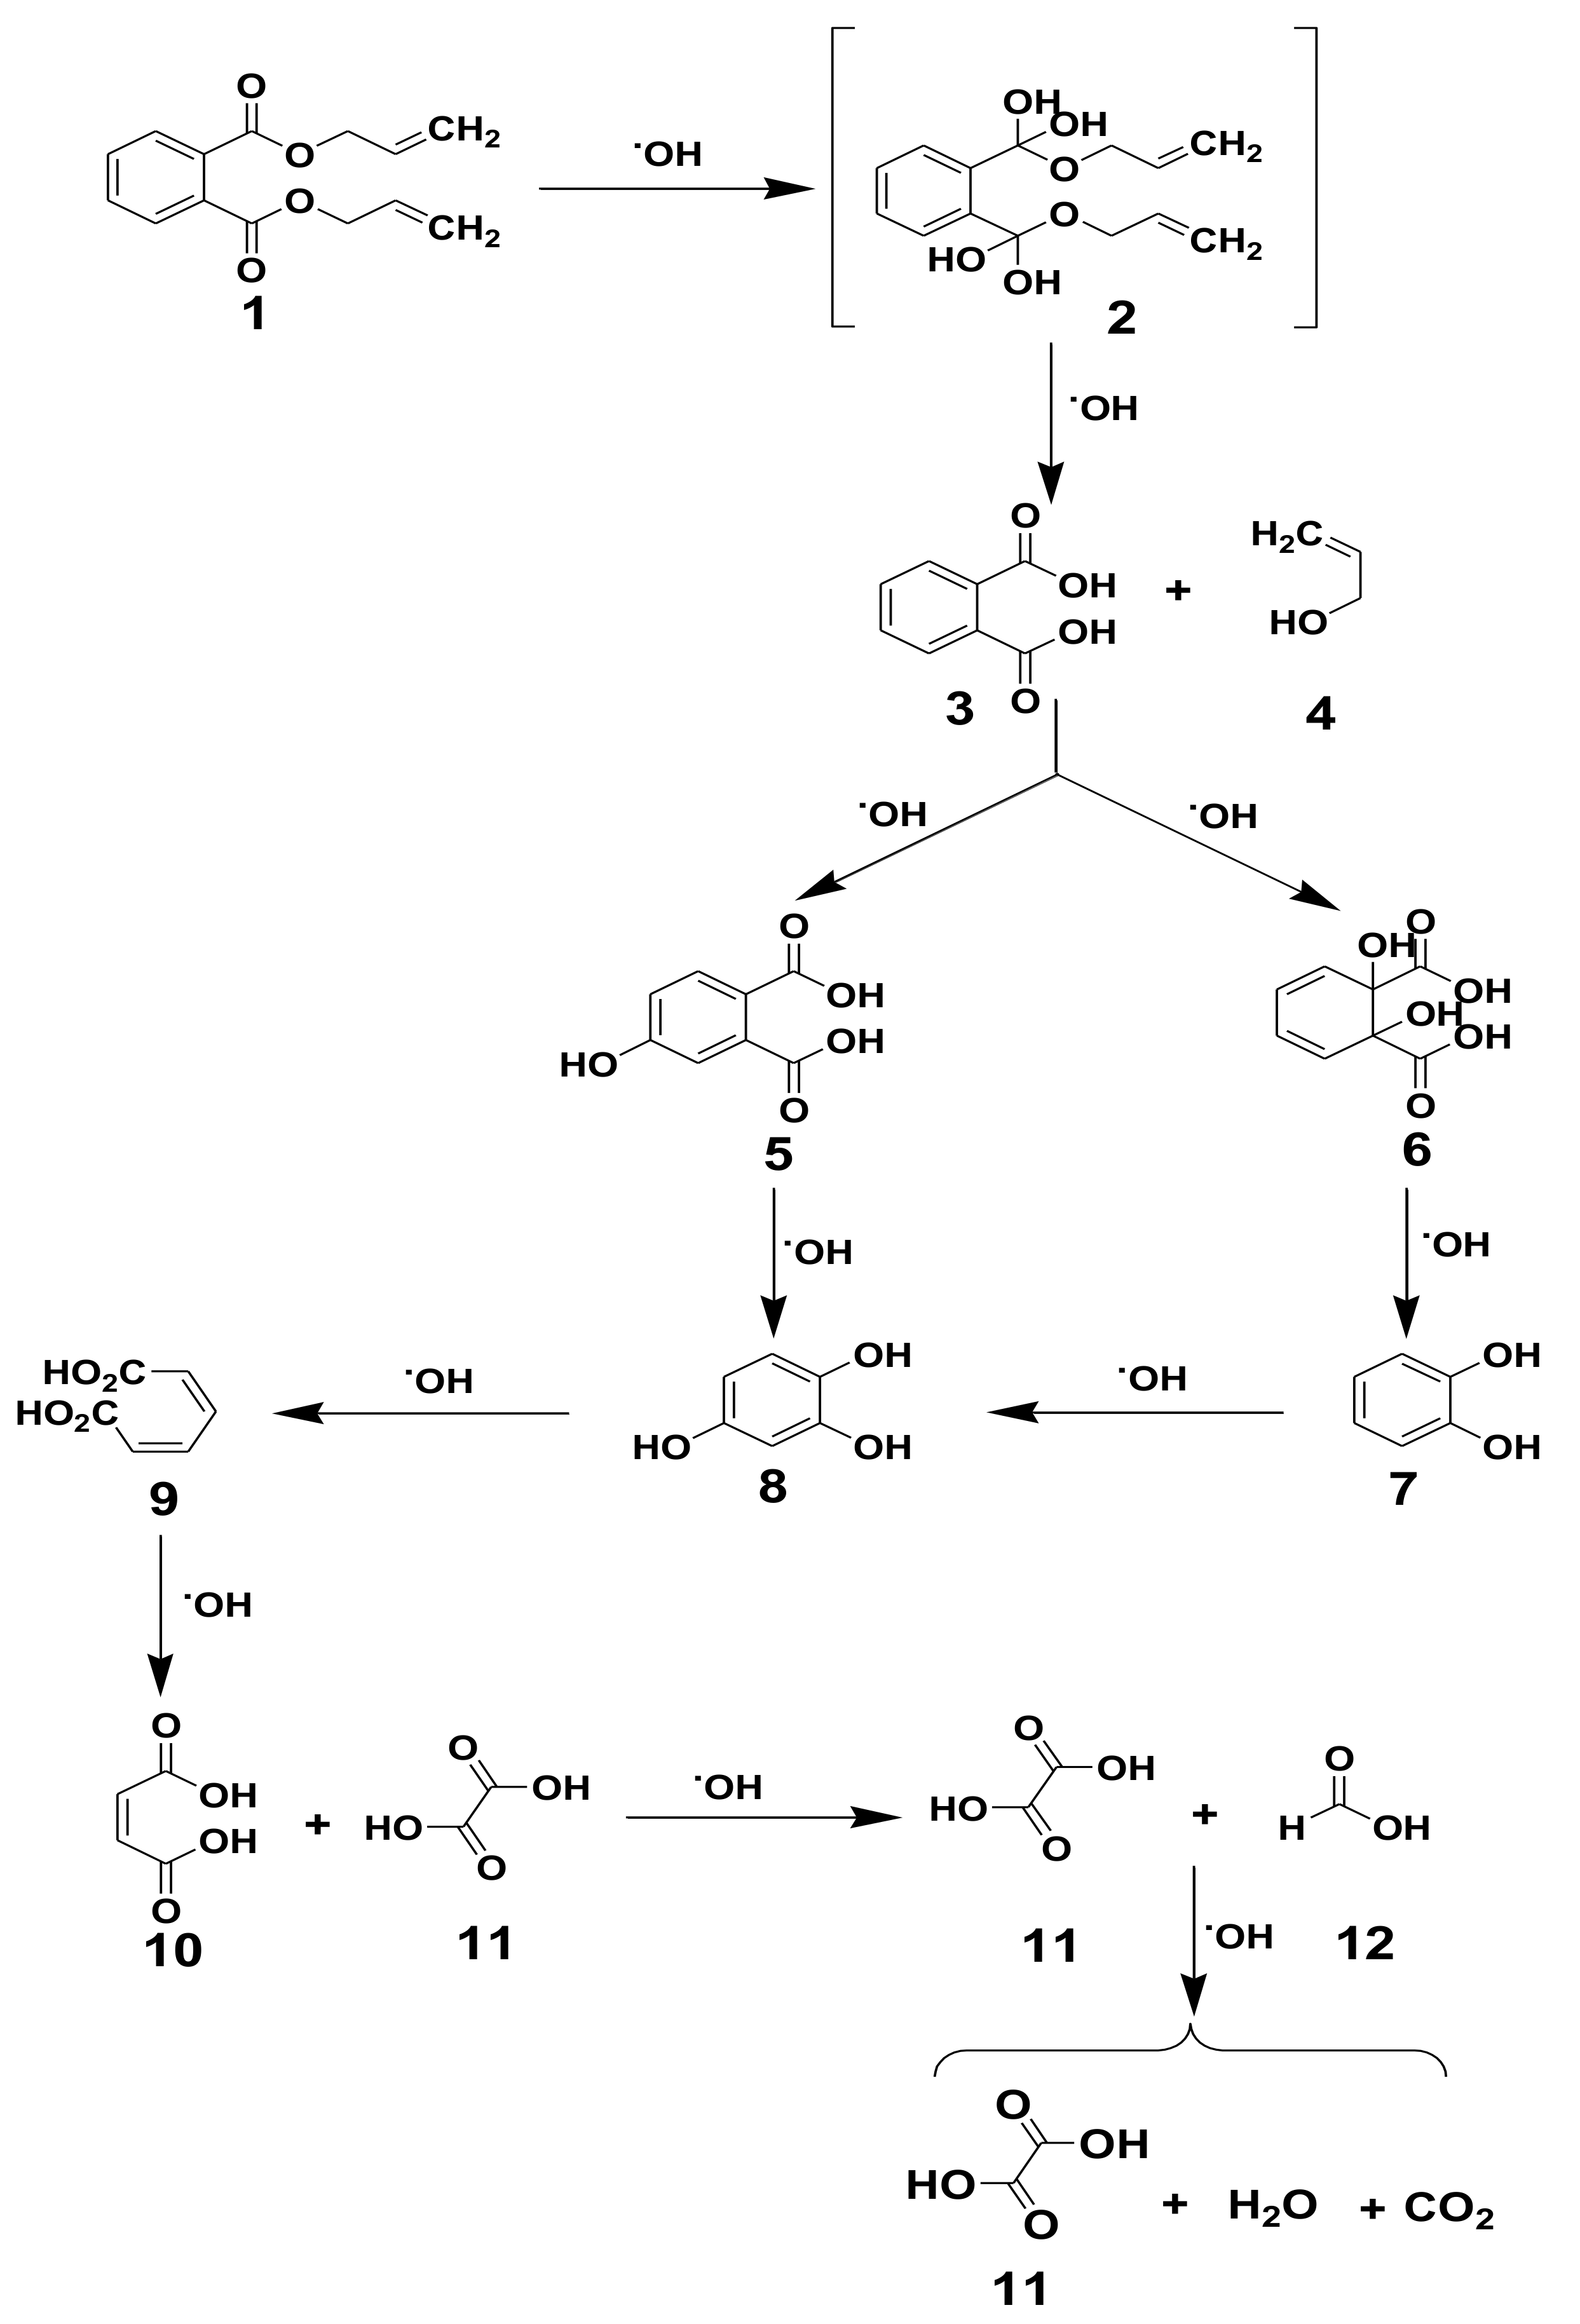
The reaction pathway of Figure 10 is proposed for the mineralization of DAP under optimal conditions. The reaction is initiated by the attack of hydroxyl radicals •OH on the carbonyl group of the benzene ring of DAP (1) leading to the formation of phthalic acid (3) and allyl alcohol group (4), which is spontaneously transformed into carboxylic acid. Phthalic acid could be easily transformed into phthalic acid derivatives (5) and (6) by hydroxylation. These compounds are very unstable and hence its absence in the detected products of Fenton oxidation of DAP. Moreover, subsequent oxidation with decarboxylation of phthalic acid derivatives leads to the formation of 1,2-dihydroxybenzene (7) for (6) and 1,2,4-trihydroxybenzene (8) for (5). 1,2-dihydroxybenzene is quickly oxidized to 1,2,4-trihydroxybenzene by the attack of the hydroxyl radical. 1,2,4-trihydroxybenzene then undergoes rapid ring opening to produce muconic acid (9), which is rapidly transformed into maleic acid (10), oxalic acid (11) and formic acid (12). Oxalic and formic acids end up being slowly mineralized into CO2 and H2O. Oxalic acid (11) accumulated to a much larger extent than the other acids, being the most persistent of all of them.
The Fenton process generates hydroxyl radical, which accounts for substrate removal. However, some other radicals, like the superoxide radical can also be produced. The addition of ethanol (as HO• radicals scavenger) after 30 min from the starting of the reaction showed that DAP concentration remained constant (data not showed here). This confirms that DAP degradation occurs via direct oxidation with hydroxyl radicals rather than other radicals, which is in agreement with other studies reported in the literature [34,35].
4. Conclusions
It can be concluded that:
- The Fenton process is an effective technology for the removal of total organic content of DAP from aqueous solutions within 120 min and 95% of TOC removal during 360 min under the following optimized conditions: 100 mg/L DAP, [H2O2] = 1000 mg/L, [Fe2+] = 50 mg/L (ferrous sulfate catalyst), and at pH = 3.2.
- The ferrous sulfate can be used effectively as a heterogeneous source of Fe2+ ion and as a catalyst in the Fenton treatment of DAP from water.
- A rate constant of 7.26.109 M−1 s−1 was determined for the reaction between DAP and hydroxyl radicals •OH through a competition kinetic method using BA as a reference compound.
- HPLC analyses and TOC measurement indicated that numerous successive steps are involved in the degradation of DAP by Fenton oxidation including (i) oxidation via hydroxyl radicals generated from water by catalytic decomposition of H2O2 in an acidic medium, (ii) oxidative opening of benzene rings into aliphatic intermediates, and (iii) fragmentation of aliphatic compounds into small carboxylic acids and then to carbon dioxide and water.
- Oxalic acid was detected as the most persistent product, being the predominant species present in the solution.
- It can be summarized that the Fenton oxidation process could be the best method for the total destruction of DAP from water.
Author Contributions
N.B. and A.B. designed the experimental part; S.D. and M.M.Z. performed the experiments; N.B. and A.B supervised experimental work and data analysis; S.D., N.B. and M.M.Z. wrote the manuscript.
Acknowledgments
The publication of this article was funded by the Qatar National Library.
Conflicts of Interest
All authors of this article declare no conflicts of interest.
References
- Fromme, H.; Lahrz, T.; Piloty, M.; Gebhart, H.; Oddoy, A.; Rüden, H. Occurrence of phthalates and musk fragrances in indoor air and dust from apartments and kindergartens in Berlin (Germany). Indoor Air 2004, 14, 188–195. [Google Scholar] [CrossRef] [PubMed]
- Wensing, M.; Uhde, E.; Salthammer, T. Plastics additives in the indoor environment—Flame retardants and plasticizers. Sci. Total Environ. 2005, 339, 19–40. [Google Scholar] [CrossRef] [PubMed]
- Fromme, H.; Gruber, L.; Schlummer, M.; Wolz, G.; Böhmer, S.; Angerer, J.; Mayer, R.; Liebl, B.; Bolte, G. Intake of phthalates and di(2-ethylhexyl)adipate: Results of the Integrated Exposure Assessment Survey based on duplicate diet samples and biomonitoring data. Environ. Int. 2007, 33, 1012–1020. [Google Scholar] [CrossRef] [PubMed]
- Qu, R.; Feng, M.; Sun, P.; Wang, Z. A comparative study on antioxidant status combined with integrated biomarker response in Carassius auratus fish exposed to nine phthalates. Environ. Toxicol. 2015, 30, 1125–1134. [Google Scholar] [CrossRef] [PubMed]
- Kavlock, R.; Barr, D.; Boekelheide, K.; Breslin, W.; Breysse, P.; Chapin, R.; Gaido, K.; Hodgson, E.; Marcus, M.; Shea, K.; et al. NTP-CERHR Expert Panel Update on the Reproductive and Developmental Toxicity of Di(2-ethylhexyl) phthalate. Reprod. Toxicol. 2006, 22, 291–399. [Google Scholar] [CrossRef] [PubMed]
- Thompson, R.C.; Moore, C.J.; Vom Saal, F.S.; Swan, S.H. Plastics, the environment and human health: Current consensus and future trends. Philos. Trans. R. Soc. London B Biol. Sci. 2009, 364, 2153–2166. [Google Scholar] [CrossRef] [PubMed]
- Saillenfait, A.-M.; Roudot, A.-C.; Gallissot, F.; Sabaté, J.-P.; Chagnon, M.-C. Developmental toxic potential of di-n-propyl phthalate administered orally to rats. J. Appl. Toxicol. 2011, 31, 36–44. [Google Scholar] [CrossRef] [PubMed]
- Bergé, A.; Cladière, M.; Gasperi, J.; Coursimault, A.; Tassin, B.; Moilleron, R. Meta-analysis of environmental contamination by phthalates. Environ. Sci. Pollut. Res. 2013, 20, 8057–8076. [Google Scholar] [CrossRef]
- Huang, J.; Nkrumah, P.N.; Li, Y.; Appiah-Sefah, G. Reviews of Environmental Contamination and Toxicology; Springer Science & Business Media: New York, NY, USA, 2013; Volume 236, pp. 1–297. [Google Scholar]
- Gani, K.M.; Kazmi, A.A. Phthalate contamination in aquatic environment: A critical review of the process factors that influence their removal in conventional and advanced wastewater treatment. Crit. Rev. Environ. Sci. Technol. 2016, 46, 1402–1439. [Google Scholar] [CrossRef]
- Matsumoto, M.; Hirata-Koizumi, M.; Ema, M. Potential adverse effects of phthalic acid esters on human health: A review of recent studies on reproduction. Regul. Toxicol. Pharmacol. 2008, 50, 37–49. [Google Scholar] [CrossRef]
- Keresztes, S.; Tatár, E.; Czégény, Z.; Záray, G.; Mihucz, V.G. Study on the leaching of phthalates from polyethylene terephthalate bottles into mineral water. Sci. Total Environ. 2013, 458, 451–458. [Google Scholar] [CrossRef] [PubMed] [Green Version]
- Deblonde, T.; Cossu-Leguille, C.; Hartemann, P. Emerging pollutants in wastewater: A review of the literature. Int. J. Hyg. Environ. Health 2011, 214, 442–448. [Google Scholar] [CrossRef] [PubMed]
- Julinová, M.; Slavík, R. Removal of phthalates from aqueous solution by different adsorbents: A short review. J. Environ. Manag. 2012, 94, 13–24. [Google Scholar] [CrossRef] [PubMed]
- Özer, E.T.; Güçer, Ş. Determination of di(2-ethylhexyl) phthalate migration from toys into artificial sweat by gas chromatography mass spectrometry after activated carbon enrichment. Polym. Test. 2012, 31, 474–480. [Google Scholar] [CrossRef]
- Saillenfait, A.M.; Gallissot, F.; Sabaté, J.P. Evaluation of the developmental toxicity of diallyl phthalate administered orally to rats. Food Chem. Toxicol. 2008, 46, 2150–2156. [Google Scholar] [CrossRef] [PubMed]
- Zhou, J.; Cai, Z.-H.; Li, L.; Gao, Y.-F.; Hutchinson, T.H. A proteomics based approach to assessing the toxicity of bisphenol A and diallyl phthalate to the abalone (Haliotis diversicolor supertexta). Chemosphere 2010, 79, 595–604. [Google Scholar] [CrossRef]
- Zhang, H.; Choi, H.J.; Huang, C.-P. Optimization of Fenton process for the treatment of landfill leachate. J. Hazard. Mater. 2005, 125, 166–174. [Google Scholar] [CrossRef]
- Pignatello, J.J.; Oliveros, E.; MacKay, A. Advanced Oxidation Processes for Organic Contaminant Destruction Based on the Fenton Reaction and Related Chemistry. Crit. Rev. Environ. Sci. Technol. 2006, 36, 1–84. [Google Scholar] [CrossRef]
- Bautista, P.; Mohedano, A.F.; Casas, J.A.; Zazo, J.A.; Rodriguez, J.J. An overview of the application of Fenton oxidation to industrial wastewaters treatment. J. Chem. Technol. Biotechnol. 2008, 83, 1323–1338. [Google Scholar] [CrossRef]
- Sun, M.; Chu, C.; Geng, F.; Lu, X.; Qu, J.; Crittenden, J.; Elimelech, M.; Kim, J.-H. Reinventing Fenton Chemistry: Iron Oxychloride Nanosheet for pH-Insensitive H2O2 Activation. Environ. Sci. Technol. Lett. 2018, 5, 186–191. [Google Scholar] [CrossRef]
- Hodges, B.C.; Cates, E.L.; Kim, J.-H. Challenges and prospects of advanced oxidation water treatment processes using catalytic nanomaterials. Nat. Nanotechnol. 2018, 13, 642–650. [Google Scholar] [CrossRef]
- Yang, X.; Xu, X.; Xu, J.; Han, Y. Iron Oxychloride (FeOCl): An Efficient Fenton-Like Catalyst for Producing Hydroxyl Radicals in Degradation of Organic Contaminants. J. Am. Chem. Soc. 2013, 135, 16058–16061. [Google Scholar] [CrossRef]
- Ahmed, B.; Limem, E.; Abdel-Wahab, A.; Nasr, B. Photo-Fenton Treatment of Actual Agro-Industrial Wastewaters. Ind. Eng. Chem. Res. 2011, 50, 6673–6680. [Google Scholar] [CrossRef]
- Dbira, S.; Bedoui, A.; Bensalah, N. Investigations on the Degradation of Triazine Herbicides in Water by Photo-Fenton Process. Am. J. Anal. Chem. 2014, 5, 500–517. [Google Scholar] [CrossRef]
- Bedoui, A.; Ahmadi, M.F.; Bensalah, N.; Gadri, A. Comparative study of Eriochrome black T treatment by BDD-anodic oxidation and Fenton process. Chem. Eng. J. 2009, 146, 98–104. [Google Scholar] [CrossRef]
- Babuponnusami, A.; Muthukumar, K. Degradation of Phenol in Aqueous Solution by Fenton, Sono-Fenton and Sono-photo-Fenton Methods. CLEAN—Soil Air Water 2011, 39, 142–147. [Google Scholar] [CrossRef]
- Zazouli, M.A.; Yousefi, Z.; Eslami, A.; Ardebilian, M.B. Municipal solid waste landfill leachate treatment by fenton, photo-fenton and fenton-like processes: Effect of some variables. Iran. J. Environ. Health Sci. Eng. 2012, 9, 3. [Google Scholar] [CrossRef] [PubMed] [Green Version]
- Louhichi, B.; Bensalah, N. Comparative study of the treatment of printing ink wastewater by conductive-diamond electrochemical oxidation. Fenton process, and ozonation. Sustain. Environ. Res. 2014, 24, 49–57. [Google Scholar]
- Yang, S.; Xiong, Y.; Ge, Y.; Zhang, S. Heterogeneous Fenton oxidation of nitric oxide by magnetite: Kinetics and mechanism. Mater. Lett. 2018, 218, 257–261. [Google Scholar] [CrossRef]
- Chen, W.-S.; Juan, C.-N.; Wei, K.-M. Mineralization of dinitrotoluenes and trinitrotoluene of spent acid in toluene nitration process by Fenton oxidation. Chemosphere 2005, 60, 1072–1079. [Google Scholar] [CrossRef]
- Bensalah, N.; Khodary, A.; Abdel-Wahab, A. Kinetic and mechanistic investigations of mesotrione degradation in aqueous medium by Fenton process. J. Hazard. Mater. 2011, 189, 479–485. [Google Scholar] [CrossRef]
- Benitez, F.J.; Real, F.J.; Acero, J.L.; Garcia, C. Photochemical oxidation processes for the elimination of phenyl-urea herbicides in waters. J. Hazard. Mater. 2006, 138, 278–287. [Google Scholar] [CrossRef] [PubMed]
- Chen, L.; Peng, X.; Liu, J.; Li, J.; Wu, F. Decolorization of Orange II in Aqueous Solution by an Fe(II)/sulfite System: Replacement of Persulfate. Ind. Eng. Chem. Res. 2012, 51, 13632–13638. [Google Scholar] [CrossRef]
- Chen, L.; Huang, X.; Tang, M.; Zhou, D.; Wu, F. Rapid dephosphorylation of glyphosate by Cu—catalyzed sulfite oxidation involving sulfate and hydroxyl radicals. Environ. Chem. Lett. 2018, 1–5. [Google Scholar] [CrossRef]
Figure 1.
Structure of Diallyl Phthalate (DAP).

Figure 2.
Influence of the initial pH on the DAP degradation kinetics during the Fenton process (H2O2/Fe2+). Experimental conditions: [DAP]0 = 100 mg/L; [H2O2] = 1000 mg/L; [Fe2+] = 50 mg/L; pH = 3.2–7.
Figure 2.
Influence of the initial pH on the DAP degradation kinetics during the Fenton process (H2O2/Fe2+). Experimental conditions: [DAP]0 = 100 mg/L; [H2O2] = 1000 mg/L; [Fe2+] = 50 mg/L; pH = 3.2–7.

Figure 3.
Effect of Fe2+ content on the DAP degradation kinetics during the Fenton process (H2O2/Fe2+). Experimental conditions: [DAP]0 = 100 mg/L; [H2O2] = 1000 mg/L; [Fe2+] = 0–100 mg/L; pH = 3.2.
Figure 3.
Effect of Fe2+ content on the DAP degradation kinetics during the Fenton process (H2O2/Fe2+). Experimental conditions: [DAP]0 = 100 mg/L; [H2O2] = 1000 mg/L; [Fe2+] = 0–100 mg/L; pH = 3.2.

Figure 4.
Effect of the iron source on the degradation of DAP kinetics during the Fenton process (H2O2/Fe2+). Experimental conditions: [DAP]0 = 100 mg/L; [H2O2] = 1000 mg/L; [Fe2+] = 50 mg/L; pH = 3.2.
Figure 4.
Effect of the iron source on the degradation of DAP kinetics during the Fenton process (H2O2/Fe2+). Experimental conditions: [DAP]0 = 100 mg/L; [H2O2] = 1000 mg/L; [Fe2+] = 50 mg/L; pH = 3.2.

Figure 5.
Effect of H2O2 concentration on the DAP degradation kinetics during the Fenton process (H2O2/Fe2+). Experimental conditions: [DAP]0 = 100 mg/L; [H2O2] = 0–3000 mg/L; [H2O2]/[Fe2+] = 20; pH = 3.2.
Figure 5.
Effect of H2O2 concentration on the DAP degradation kinetics during the Fenton process (H2O2/Fe2+). Experimental conditions: [DAP]0 = 100 mg/L; [H2O2] = 0–3000 mg/L; [H2O2]/[Fe2+] = 20; pH = 3.2.

Figure 6.
Effect of initial DAP concentration on the DAP degradation kinetics during the Fenton process (H2O2/Fe2+). Experimental conditions: [DAP]0 = 40–140 mg/L; [H2O2]/[DAP] = 10; [H2O2]/[Fe2+] = 20 pH = 3.2.
Figure 6.
Effect of initial DAP concentration on the DAP degradation kinetics during the Fenton process (H2O2/Fe2+). Experimental conditions: [DAP]0 = 40–140 mg/L; [H2O2]/[DAP] = 10; [H2O2]/[Fe2+] = 20 pH = 3.2.

Figure 7.
Competitive kinetic model for the determination of the absolute rate constant of the reaction of DAP and HO• hydroxyl using benzoic acid as a reference compound. Experimental conditions: [DAP]0 = 100 mg/L; [BA]0 = 100 mg/L, [H2O2] = 1000 mg/L; [Fe2+] = 50 mg/L; pH = 3.2.
Figure 7.
Competitive kinetic model for the determination of the absolute rate constant of the reaction of DAP and HO• hydroxyl using benzoic acid as a reference compound. Experimental conditions: [DAP]0 = 100 mg/L; [BA]0 = 100 mg/L, [H2O2] = 1000 mg/L; [Fe2+] = 50 mg/L; pH = 3.2.

Figure 8.
Changes in concentrations (mg C/L) of DAP, intermediates and TOC during Fenton oxidation of 100 mg/L DAP. Experimental conditions: [H2O2] = 1000 mg/L; [Fe2+] = 50 mg/L; pH=3.2.
Figure 8.
Changes in concentrations (mg C/L) of DAP, intermediates and TOC during Fenton oxidation of 100 mg/L DAP. Experimental conditions: [H2O2] = 1000 mg/L; [Fe2+] = 50 mg/L; pH=3.2.

Figure 9.
Evolution of the concentration of aromatic and aliphatic intermediates detected during the Fenton degradation of aqueous solution containing 100 ppm DAP. Experimental conditions: [DAP]0 = 100 mg/L; [H2O2] = 1000 mg/L; [Fe2+] = 50 mg/L; pH = 3.2.
Figure 9.
Evolution of the concentration of aromatic and aliphatic intermediates detected during the Fenton degradation of aqueous solution containing 100 ppm DAP. Experimental conditions: [DAP]0 = 100 mg/L; [H2O2] = 1000 mg/L; [Fe2+] = 50 mg/L; pH = 3.2.

Figure 10.
Proposed reaction pathway of DAP mineralization by the Fenton process.

© 2018 by the authors. Licensee MDPI, Basel, Switzerland. This article is an open access article distributed under the terms and conditions of the Creative Commons Attribution (CC BY) license (http://creativecommons.org/licenses/by/4.0/).
Share and Cite
MDPI and ACS Style
Dbira, S.; Bensalah, N.; Zagho, M.M.; Bedoui, A. Degradation of Diallyl Phthalate (DAP) by Fenton Oxidation: Mechanistic and Kinetic Studies. Appl. Sci. 2019, 9, 23. https://0-doi-org.brum.beds.ac.uk/10.3390/app9010023
AMA Style
Dbira S, Bensalah N, Zagho MM, Bedoui A. Degradation of Diallyl Phthalate (DAP) by Fenton Oxidation: Mechanistic and Kinetic Studies. Applied Sciences. 2019; 9(1):23. https://0-doi-org.brum.beds.ac.uk/10.3390/app9010023
Chicago/Turabian StyleDbira, Sondos, Nasr Bensalah, Moustafa M. Zagho, and Ahmed Bedoui. 2019. "Degradation of Diallyl Phthalate (DAP) by Fenton Oxidation: Mechanistic and Kinetic Studies" Applied Sciences 9, no. 1: 23. https://0-doi-org.brum.beds.ac.uk/10.3390/app9010023
Note that from the first issue of 2016, this journal uses article numbers instead of page numbers. See further details here.