Article

Distribution and Factors Influencing Organic Carbon Stock in Mountain Soils in Babia Góra National Park, Poland

by
Lizardo Reyna-Bowen
1,*,
Jarosław Lasota
2,
Lenin Vera-Montenegro
3,
Baly Vera-Montenegro
3 and
Ewa Błońska
2
1
Forestry Department, University of Córdoba, Rabanales University Campus, Ctra. Madrid-Cadíz Km. 396, 14014 Córdoba, Spain
2
Faculty of Forestry, Department of Forest, Engineering, University of Agriculture in Kraków, Al. 29 Listopada 46, 31-425 Kraków, Poland
3
Escuela Superior Politécnica Agropecuaria de Manabí MFL, Calceta 130602, Ecuador
*
Author to whom correspondence should be addressed.
Submission received: 22 June 2019 / Revised: 23 July 2019 / Accepted: 25 July 2019 / Published: 29 July 2019
(This article belongs to the Section Chemical and Molecular Sciences)

Abstract

:
The objective of this study was to determine the soil organic carbon stock (T-SOC stock) in different mountain soils in the Babia Góra National Park (BNP). Environmental factors, such as the topography, parent material, and vegetation, were examined for their effect on carbon stock. Fifty-nine study plots in different BNP locations with diverse vegetation were selected for the study. In each study plot, organic carbon stock was calculated, and its relationships with different site factors were determined. The results reveal that the SOC stocks in the mountain soils of the BNP are characterized by high variability (from 50.10 to 905.20 t ha 1 ). The general linear model (GLM) analysis indicates that the soil type is an important factor of soil organic carbon stock. Topographical factors influence soil conditions and vegetation, which results in a diversity in carbon accumulation in different mountain soils in the BNP. The highest carbon stock was recorded in histosols (>550 t C ha 1 ), which are located in the lower part of the BNP in the valleys and flat mountain areas.

1. Introduction

Forest ecosystems contain the highest organic carbon stock among terrestrial ecosystems [1,2]. Forest systems cover more than 4.1 × 10 9 hectares of the Earth’s land area [3]. In these ecosystems, organic carbon accumulates in the biomass of trees, shrubs, and herbaceous plants, as well as in the soil horizons that form the soil profile. It is estimated that the carbon contained in soil constitutes 75% of the total organic carbon stock stored in terrestrial ecosystems, and it is twice the amount of carbon stock in the atmosphere [3,4]. Soil carbon (C) stock is influenced by several environmental factors, such as the topography, slope, exposure, elevation, climate, parent material, and vegetation [5,6,7,8]. Site properties (altitude, exposition, slope) influence the soil conditions and soil properties. Above all, vegetation affects soil parameters because it supplies organic matter that varies in quantity and quality [9].
Mountain areas are characterized by climatic and topographic factors that are highly variable, and this variation results in the diversification of vegetation and, as a consequence, differences in soil properties among locations. Depending on the definition, mountain areas cover roughly 22–27% of the Earth’s total land area [10]. According to [11], mountain soils are highly dynamic systems that are sensitive to environmental changes. Soil fertility and productivity depend on soil organic matter (SOM), which is a reservoir of nutrients and plays an important role in cycling nutrients and improving the physical, chemical, and biological properties of soils [12,13]. The amount and quality of soil organic matter depend on forest land management. The amount of SOM in forest soils is determined by the balance between soil organic matter input by on the one hand, and the release of C during decomposition on the other hand [14]. Changing the land use from natural forest to plantations affects the C stored in the soil [15]. According to [16], ecosystem C stock in plant and soil pools was 284 Mg C ha 1 in natural forests and decreased by 28% in plantations. In the study in [17], the land-use system and altitude were shown to be important factors in the regulation of SOM decomposition by altering the natural soil characteristics. Unmanaged or old-growth forests are important for carbon sequestration [18].
The mechanisms responsible for carbon stabilization in soil have received much interest recently because they are crucial for understanding the global carbon cycle. Knowledge about the factors that shape the accumulation of organic carbon in the soil is important for understanding the carbon cycle in mountain forest ecosystems. The primary objective of this study was to quantify the soil organic carbon stock (T-SOCstock) in sites with different conditions in the Babia Góra National Park (BNP). We predicted that topographical factors influence the soil conditions and vegetation, leading to a diversity of carbon accumulation in the mountain soils of the BNP.

2. Materials and Methods
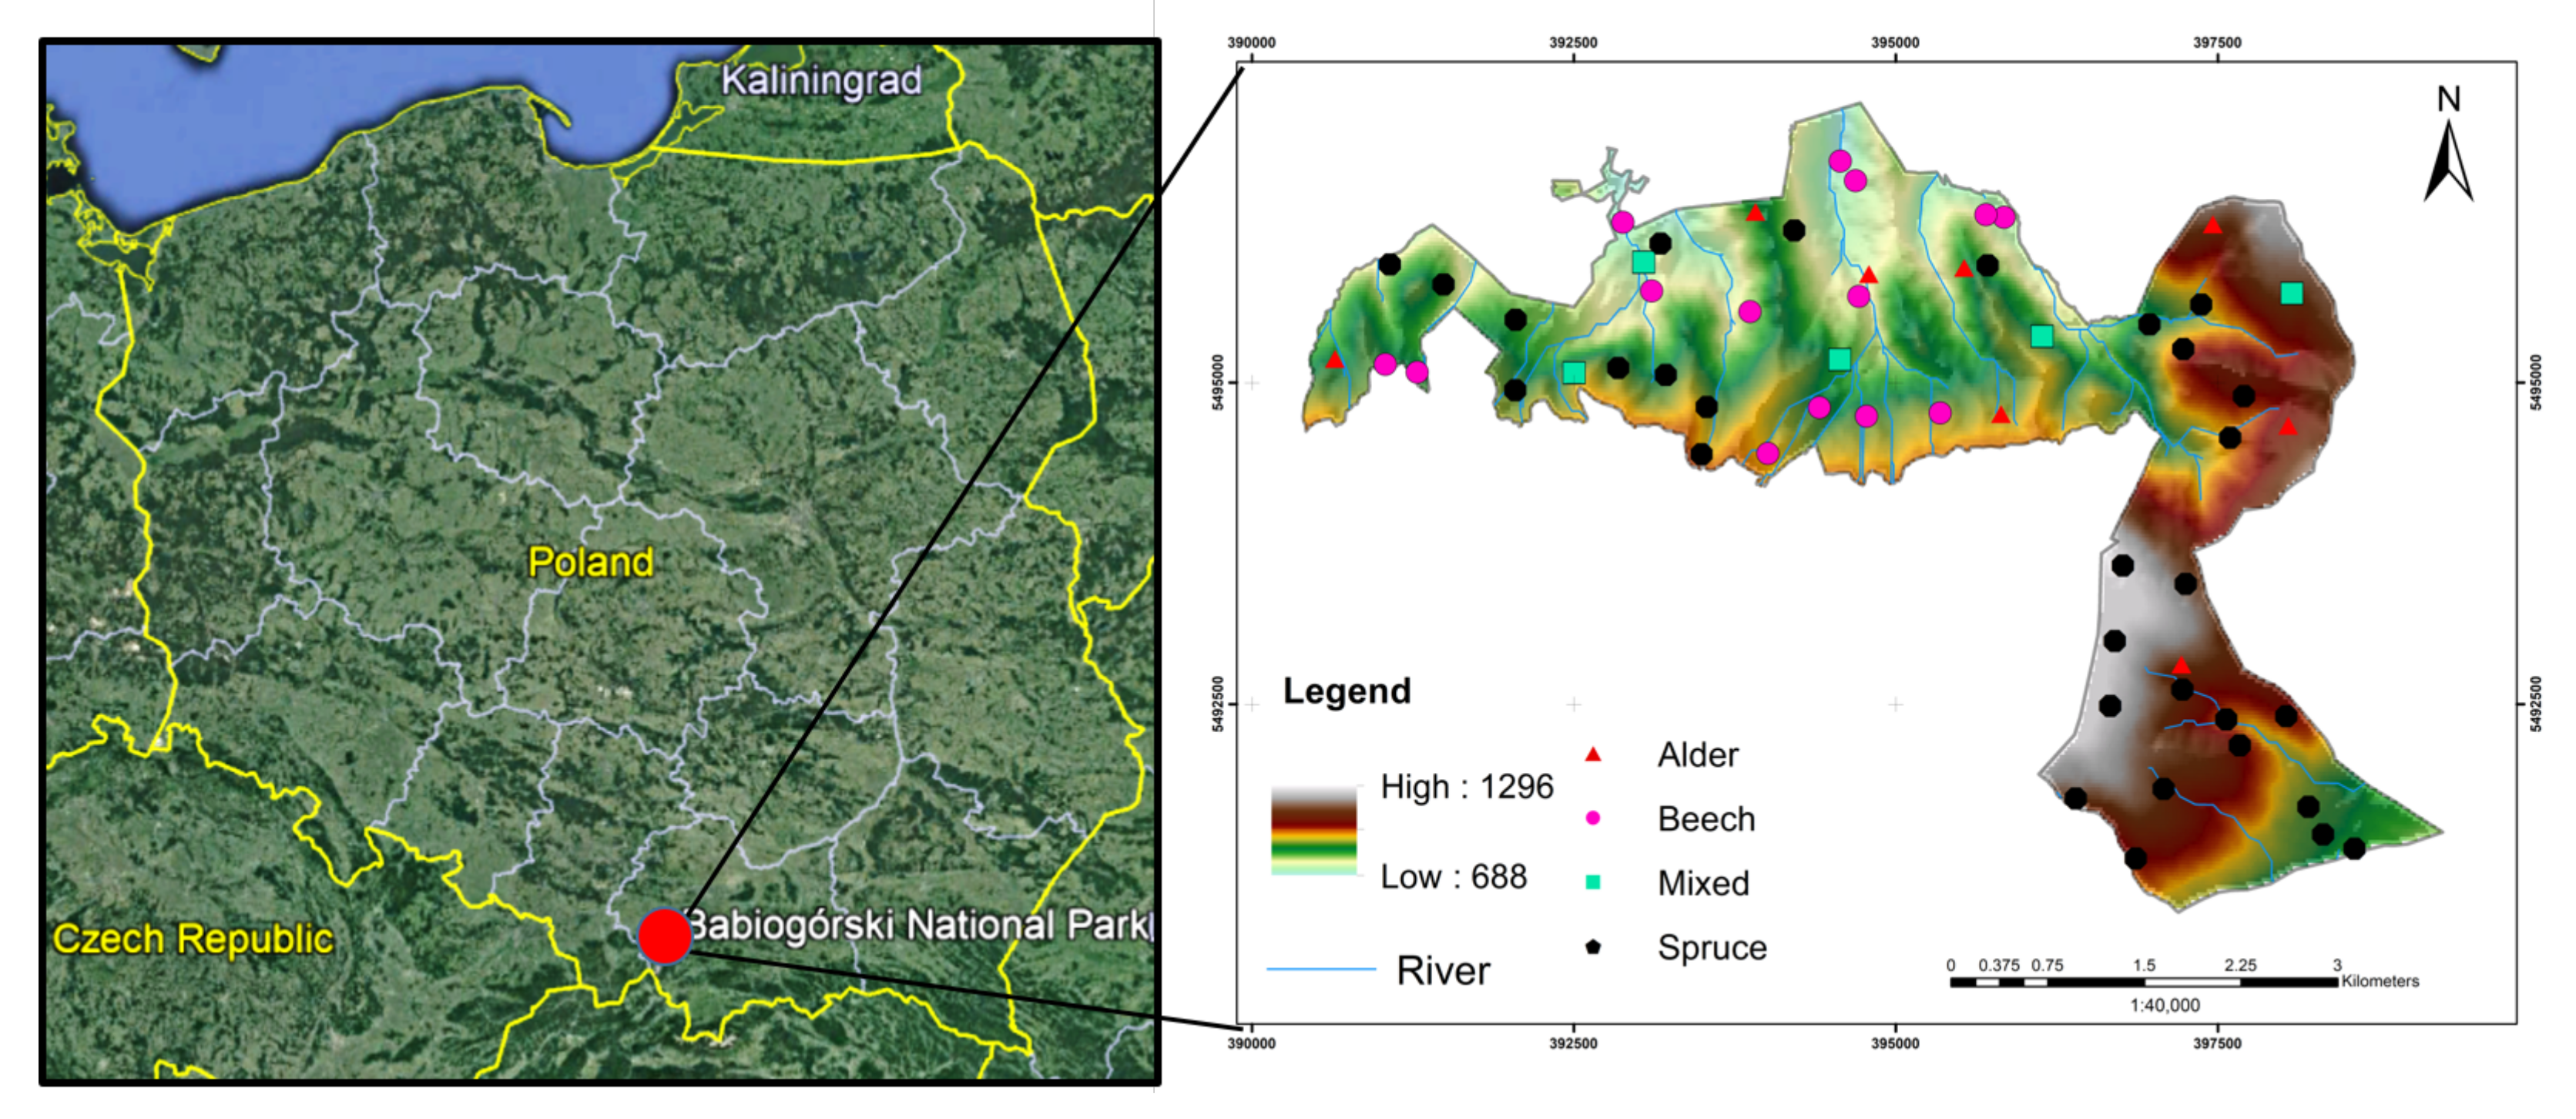
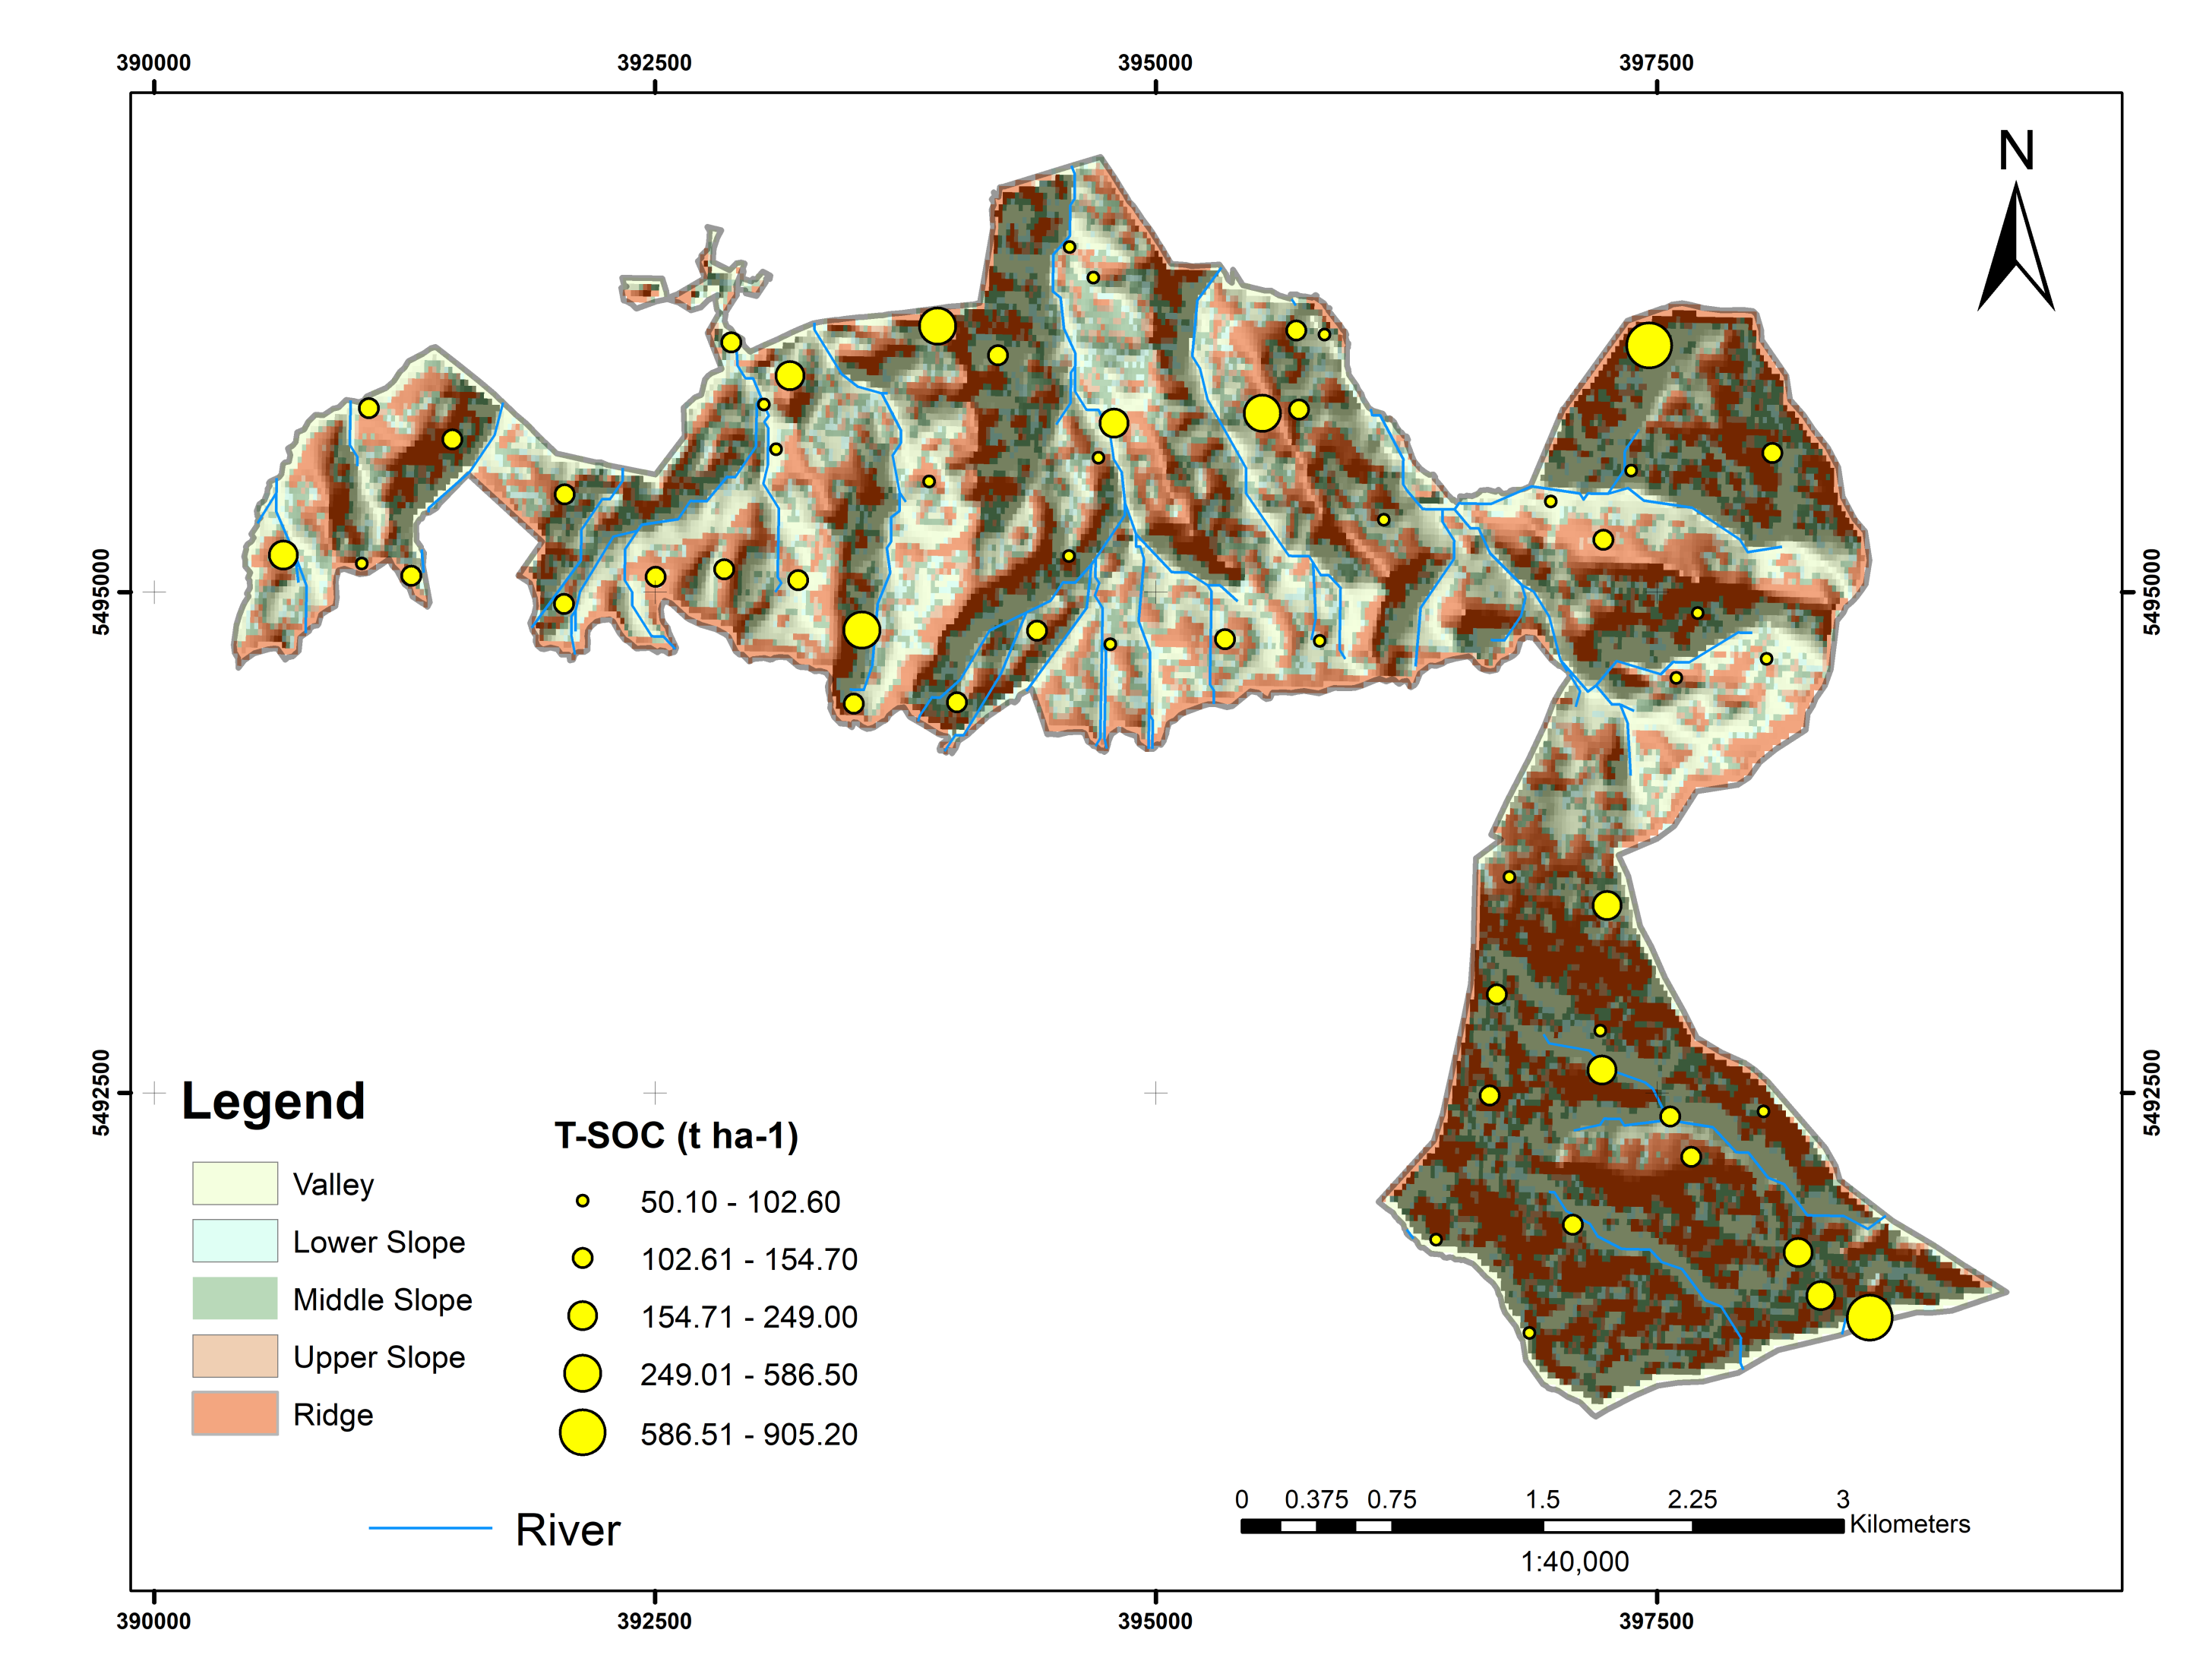
2.1. Study Area

The study was carried out in the Babia Góra National Park (BNP) ( 49 ° 34 N and 19 ° 31 E) in southern Poland (Figure 1). The BNP occupies an area of 3391.55 ha, and its altitude ranges from approx. 700 m a.s.l. to the summit of Babia Góra at 1725 m a.s.l. The climate is cool and humid: at the timberline level of Babia Góra Mt., the mean annual temperature is about 2 ° C, and the annual sum of precipitation is slightly over 1400 mm [19]. The growing season in the lowest portion of the Babia Góra National Park (700 m a.s.l.) is 202 days, and it is shorter in the higher climatic and vegetation zones (140 days at 1100 m a.s.l. and 105 days at the highest point).
The Babia Góra massif comprises Upper Cretaceous–Paleogene flysch sediments, with Magura sandstone in the uppermost part. The latter is represented by thick layers of sandstone with thin intercalations of mudstone and shale. Quaternary sediments also constitute part of the study area [20]. A considerable majority of the Babia Góra National Park is predominated by hyperdystric cambisols (36.8%) and, to a lesser extent, epidystric cambisols (13.6%), albic cambisols (13.5%), podzols, and other soil types [21]. Characteristic zonation of mountainous vegetation can be distinguished in the area of the Babia Góra National Park, starting from the highest portions: the alpine zone (1650–1725 m a.s.l.), mountain pine zone (1350–1650 m a.s.l.), upper subalpine zone (1100–1350 m a.s.l.), and lower subalpine zone (700–1100 m a.s.l.). The BNP is primarily overgrown with beech, spruce, and fir forests. The Dentario glandulosae-Fagetum, Luzulo nemorosae-Fagetum, Abieti-Piceetum association has a considerable share of the park. The Alnetum incanae association can be found in the vicinity of creeks; within troughs and submersion areas, the Caltho laetae-Alnetum association is also present [8].

2.2. Soil Sampling

The study was conducted using 59 research plots located in the Babia Góra National Park. Soil samples for laboratory analyses were collected from each research plot. Soil samples were taken from the soil horizons that were distinguished from the profiles during fieldwork. Samples for laboratory testing were collected from the organic horizon (Oh, Ofh, Ot, OM), the first mineral horizon (AE, A, AB, or AG), and the subsequent mineral horizon (horizons B, G, and C). Soil samples were taken from horizons according to the depth at which they occurred. On average, soil samples were taken to a depth of 100 cm. Organic horizons had an average depth of 20 cm, a minimum depth of 2 cm, and a maximum depth of 92 cm. The humus forms were determined according to Classification of Forest Soils in Poland (2000). Four subsamples were collected from each plot and thoroughly mixed to obtain a composite soil sample, and the samples from each horizon were put into plastic containers. Research plots were grouped on the basis of species composition, soil type, and altitude. The studied plots were divided into four groups according to the species composition of the stand (Alder: the share of alder (Alnus incana) in the stand is more than 80%; Beech: the share of beech (Fagus sylvatica) in the stand is more than 80%; Spruce: the share of spruce (Picea abies) in the stand is more than 80%; Mixed: stands that contain beech and spruce). Seven soil groups were defined: dystric cambisols (CD), eutric cambisols (CE), fluvisols (FL), gleysols (GL), histosols (HI), podzols (PO), and stagnosols (ST). Additionally, the research plots were grouped according to parent material (I: terrace sediment accumulation; II: fluvial sediments; III: hieroglyphic sandstone; IV: Magura sandstone; V: osielecki sandstone; VI: peat sediments). Three groups of altitude were defined: <900 m a.s.l, 900–1100 m a.s.l., and >1100 m a.s.l.

2.3. Laboratory Analysis

Soil samples obtained in the field were dried and sieved through a 2.0 mm mesh. The particle-size distribution was determined using laser diffraction (Analysette 22, Fritsch, Idar-Oberstein, Germany). The pH of the samples was analyzed in H2O and KCl using a potentiometric method. The carbon (C) and nitrogen (N) contents were measured with an elemental analyzer (LECO CNS TrueMac Analyzer (Leco, St. Joseph, MI, USA)) and the Ca, Mg, K, and Na contents were determined by inductively coupled plasma optical emission spectrometry (ICP-OES) (iCAP 6500 DUO, Thermo Fisher Scientific, Cambridge, U.K.). The sum of base cations (BC) was calculated. Samples with intact structures were collected in metal cylinders and used to determine the bulk density by the drying-weighing method [22]. The stone content in the soil horizon was visually estimated in the field. The share of stones in particular genetic horizons was determined as a percentage. The bulk density and the share of stones were used to calculate the soil organic carbon stock. Calculation of Soil Organic C Stocks Soil organic C depth interval (SOCstock) and for the whole soil profile (to 100 cm) were calculated according to [23]. Equivalent approaches at different scales were used by [24] Equation (1):
S O C s t o c k = S O C · B D · d · ( 1 σ ) ,
S O C s t o c k = i = 1 i n S O C s t o c k i ,
where SOC is soil organic C density (Mg ha 1 ), SOC is soil organic C percentage (g 100 1 g 1 ), BD is bulk density (g cm 3 ), D is the thickness of the studied layer (cm) and σ is the soil coarse fraction so that (1 – σ ) is the fine earth fraction (unitless). The fraction of gravel larger than <2 mm in the soil is the proportion in volume of coarse fragments. Therefore, Equation (2), n is the number of soil layers, calculates the total soil organic carbon, i.e., the total SOCstock (Mg ha 1 ), in the whole soil profile.

2.4. Geography Information System and Index

The following inputs were used to obtain the index necessary for the elaboration of the maps. Environmental covariates were derived from the Digital Elevation Model (DEM) of SRTM (NASA SRTM, spatial resolution of 90 m) and calculated using ArcGis programs. These covariates were analytical hillshade (shadow model according to the relief and light source), slope, aspect, and curvature (model of surface curvature for concave and convex surfaces).
The Topographic Position Index (TPI) is a metric that compares the elevation of each cell in the DEM with the mean elevation of the neighborhood around the specified cell. The local mean elevation is subtracted from the elevation value at the center of the local window. The algorithm is provided as an ESRI-script by Jenness Enterprises (Arizona, USA, 1987), and its local window options are rectangular, circular, and annulus [25]. Positive TPI values represent locations that are higher than the average of the local window, e.g., ridges, and high positive values represent peaks and ridges. Negative TPI values represent locations that are lower, e.g., valleys. TPI values near zero are either flat areas (where the slope is near zero) or areas with a constant slope (where the slope of the point is significantly greater than zero). TPI is calculated by Equation (3):
T P I i = Z 0 Σ 1 n Z n n ,
where Z 0 is the elevation of the model point under evaluation, Zn is the elevation of the grid within the local window, and n is the total number of the surrounding points employed in the evaluation.

2.5. Statistical Analysis

The obtained data did not show normality, so a non-parametric test was used for the analysis of the variables. The Kruskal–Wallis test was used. A general linear model (GLM) was used to investigate the effect of soil type, altitude, and type of forest stand on the total soil organic carbon stock and it averages the horizons for comparison. Principal component analysis (PCA) was used to evaluate the relationships between T-SOCstock and the position characteristics, soil, and forest stand type. In accordance with Ward’s method, the study plots were agglomerated into groups with different altitudes, slopes, T-SOCstock values, and types of forest stands. The average and standard deviation (SD) are presented in tables and figures. Differences with p < 0.05 were considered statistically significant. All analyses were performed using Statistica 12 software (StatSoft, Inc. (2012). STATISTICA (data analysis software system), version 10. www.statsoft.com).

3. Results

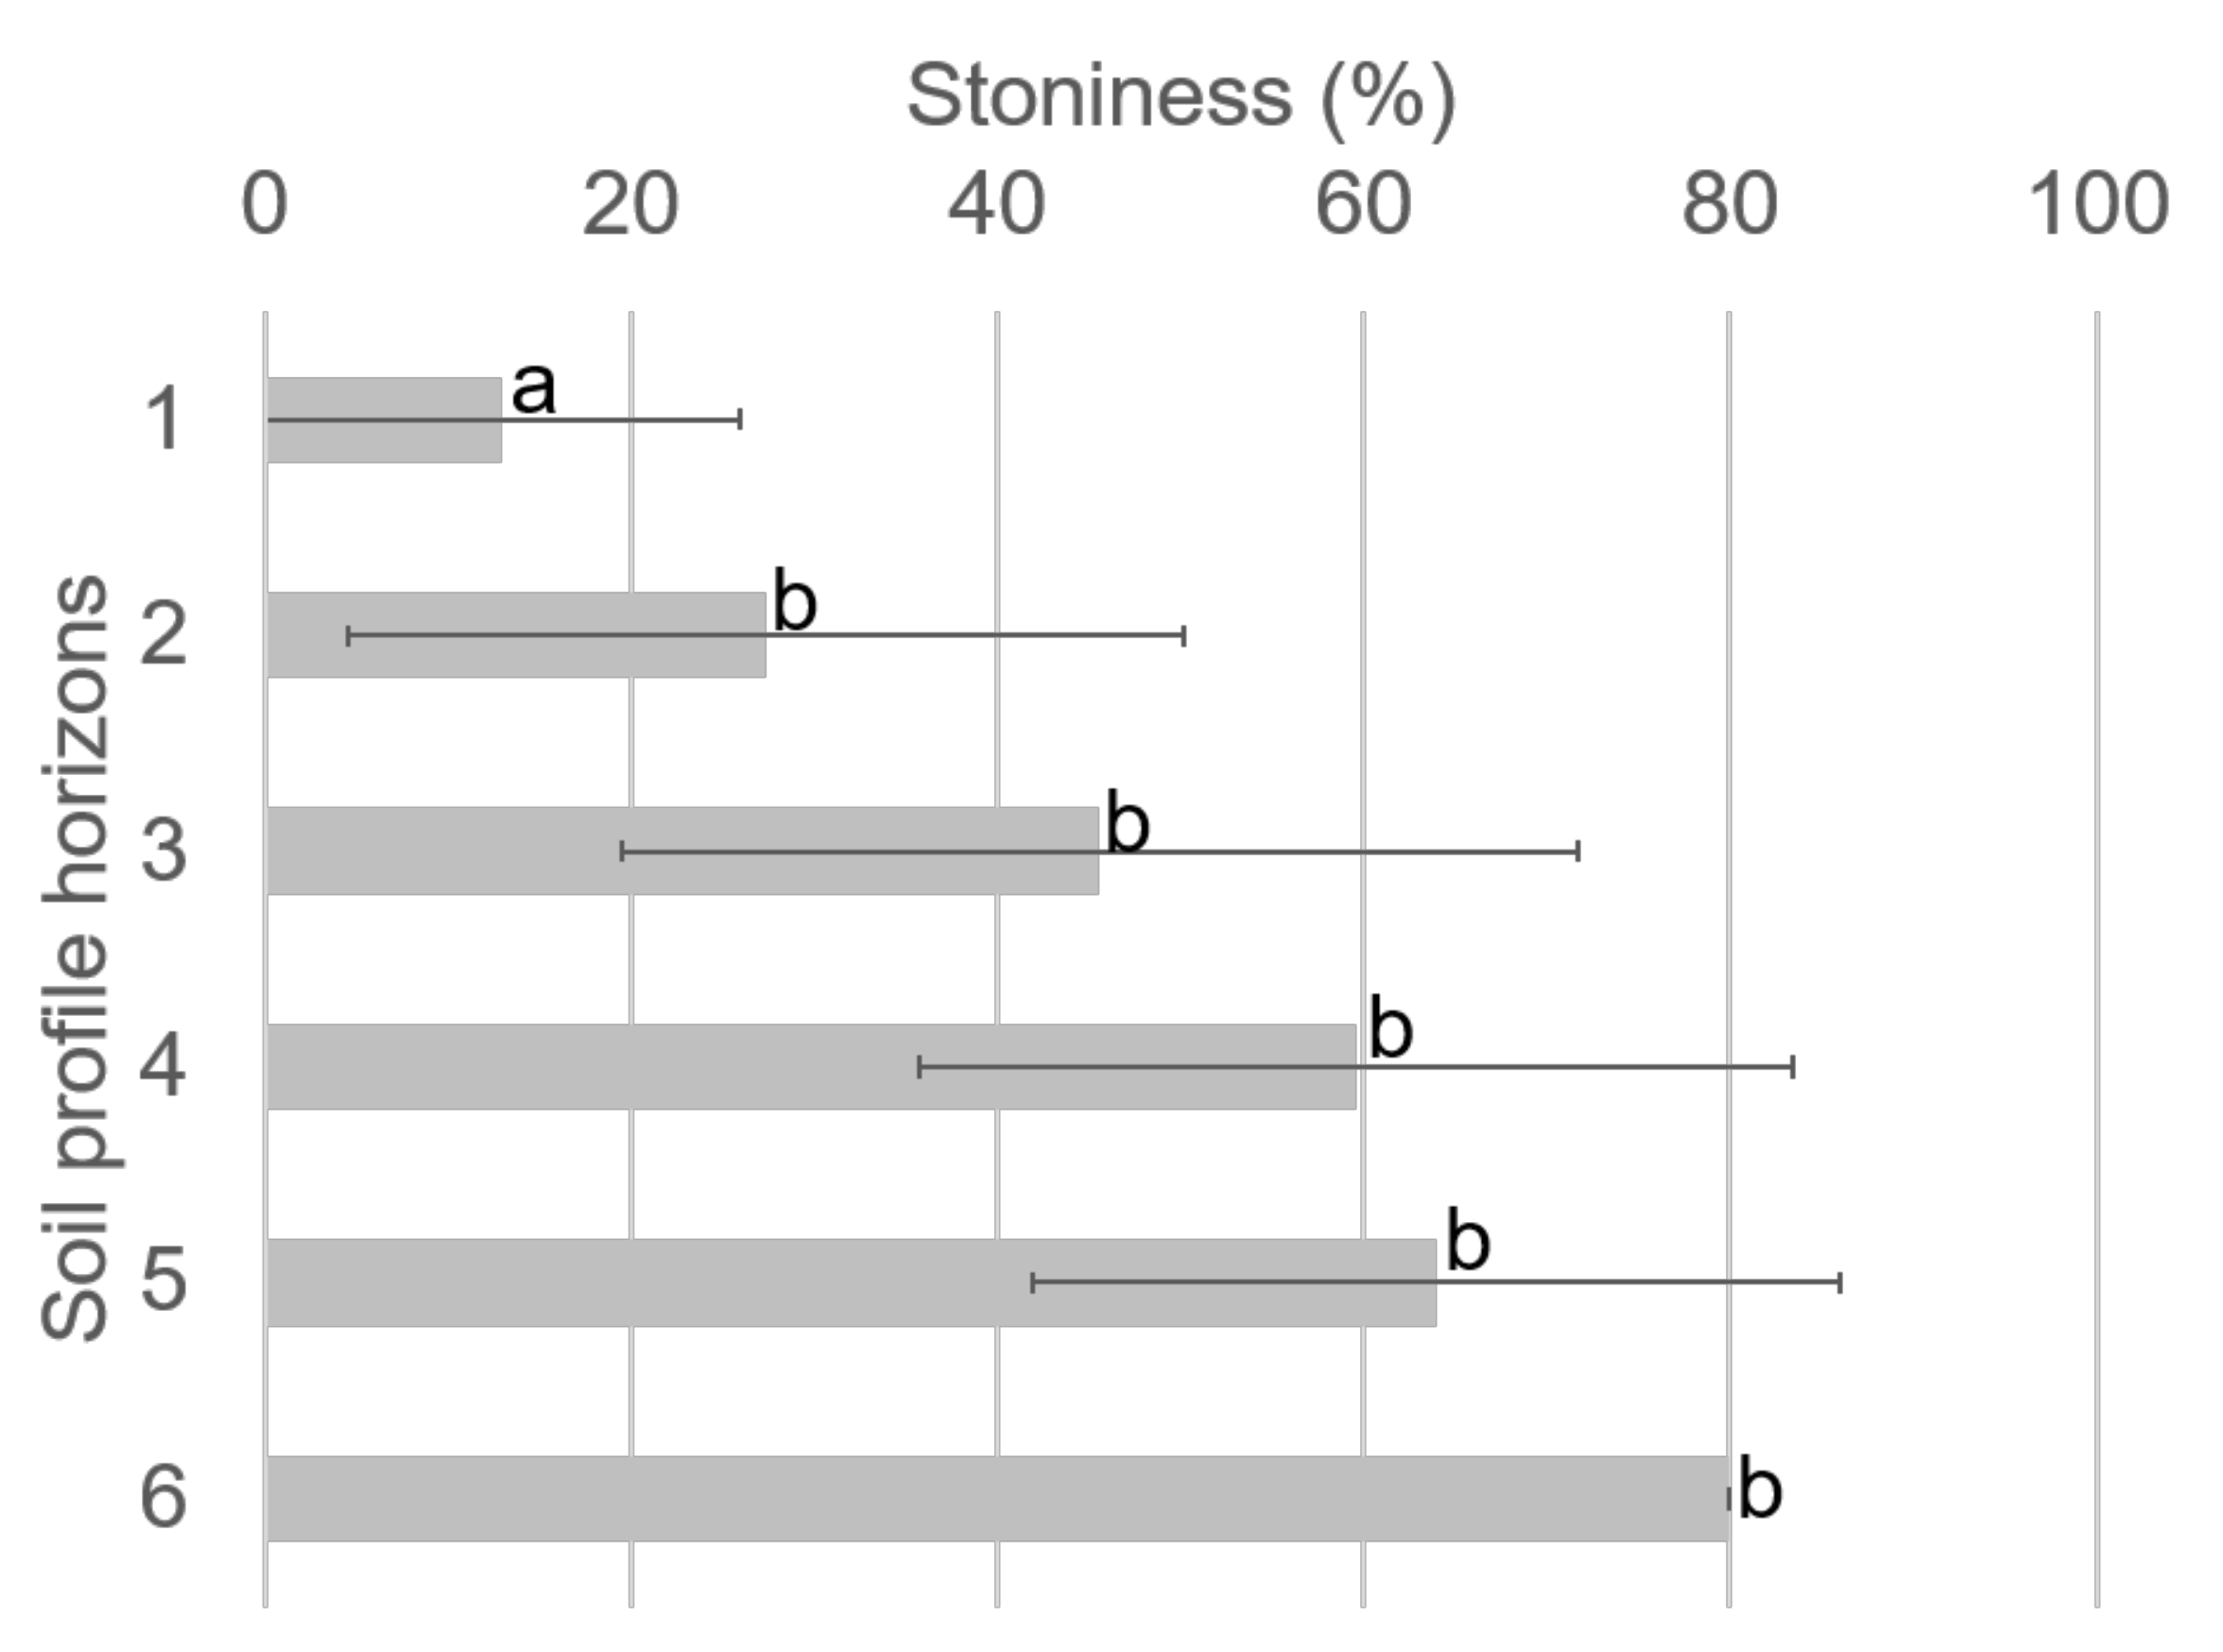
3.1. Basic Properties of the Studied Soils

The studied soils were characterized by diverse properties. The texture of the investigated soils was dominated by sand (average content of 44%) and silt (average content of 41%). The clay content ranged from 1% to 77%, and the pHH2O of soils ranged from 3.1 to 8.1 (Table 1). The variability in soil organic carbon and nitrogen content was high, with ranges of 4.0–422.0 g kg 1 and 1.0–29.0 g kg 1 , respectively (Table 1). The studied soils were characterized by a high variation in the base cation content (Table 1), and the results obtained for the bulk density show diversity in all the profiles (0.1–1.4 g cm 3 ). Because the percentage of stones is a very influential factor in the estimation of carbon accumulation, it was necessary to determine differences in the stone content in different soil horizons. The results obtained show that the first horizon had an average stone content of 12%, which is significantly lower than the stone content in the other horizons. The percentage of stones increased to over 80% in the lowest horizons (Figure 2). The horizons (H) had the following averages; H1 = 11.39 ± 7.48 cm; H2 = 21.80 ± 17.90 cm; H3 = 38.69 ± 17.4 cm; H4 = 26.37 ± 11.63; H5 = 20.50 ± 12.67 cm; and finally H6 = 20.00 ± 0 cm.

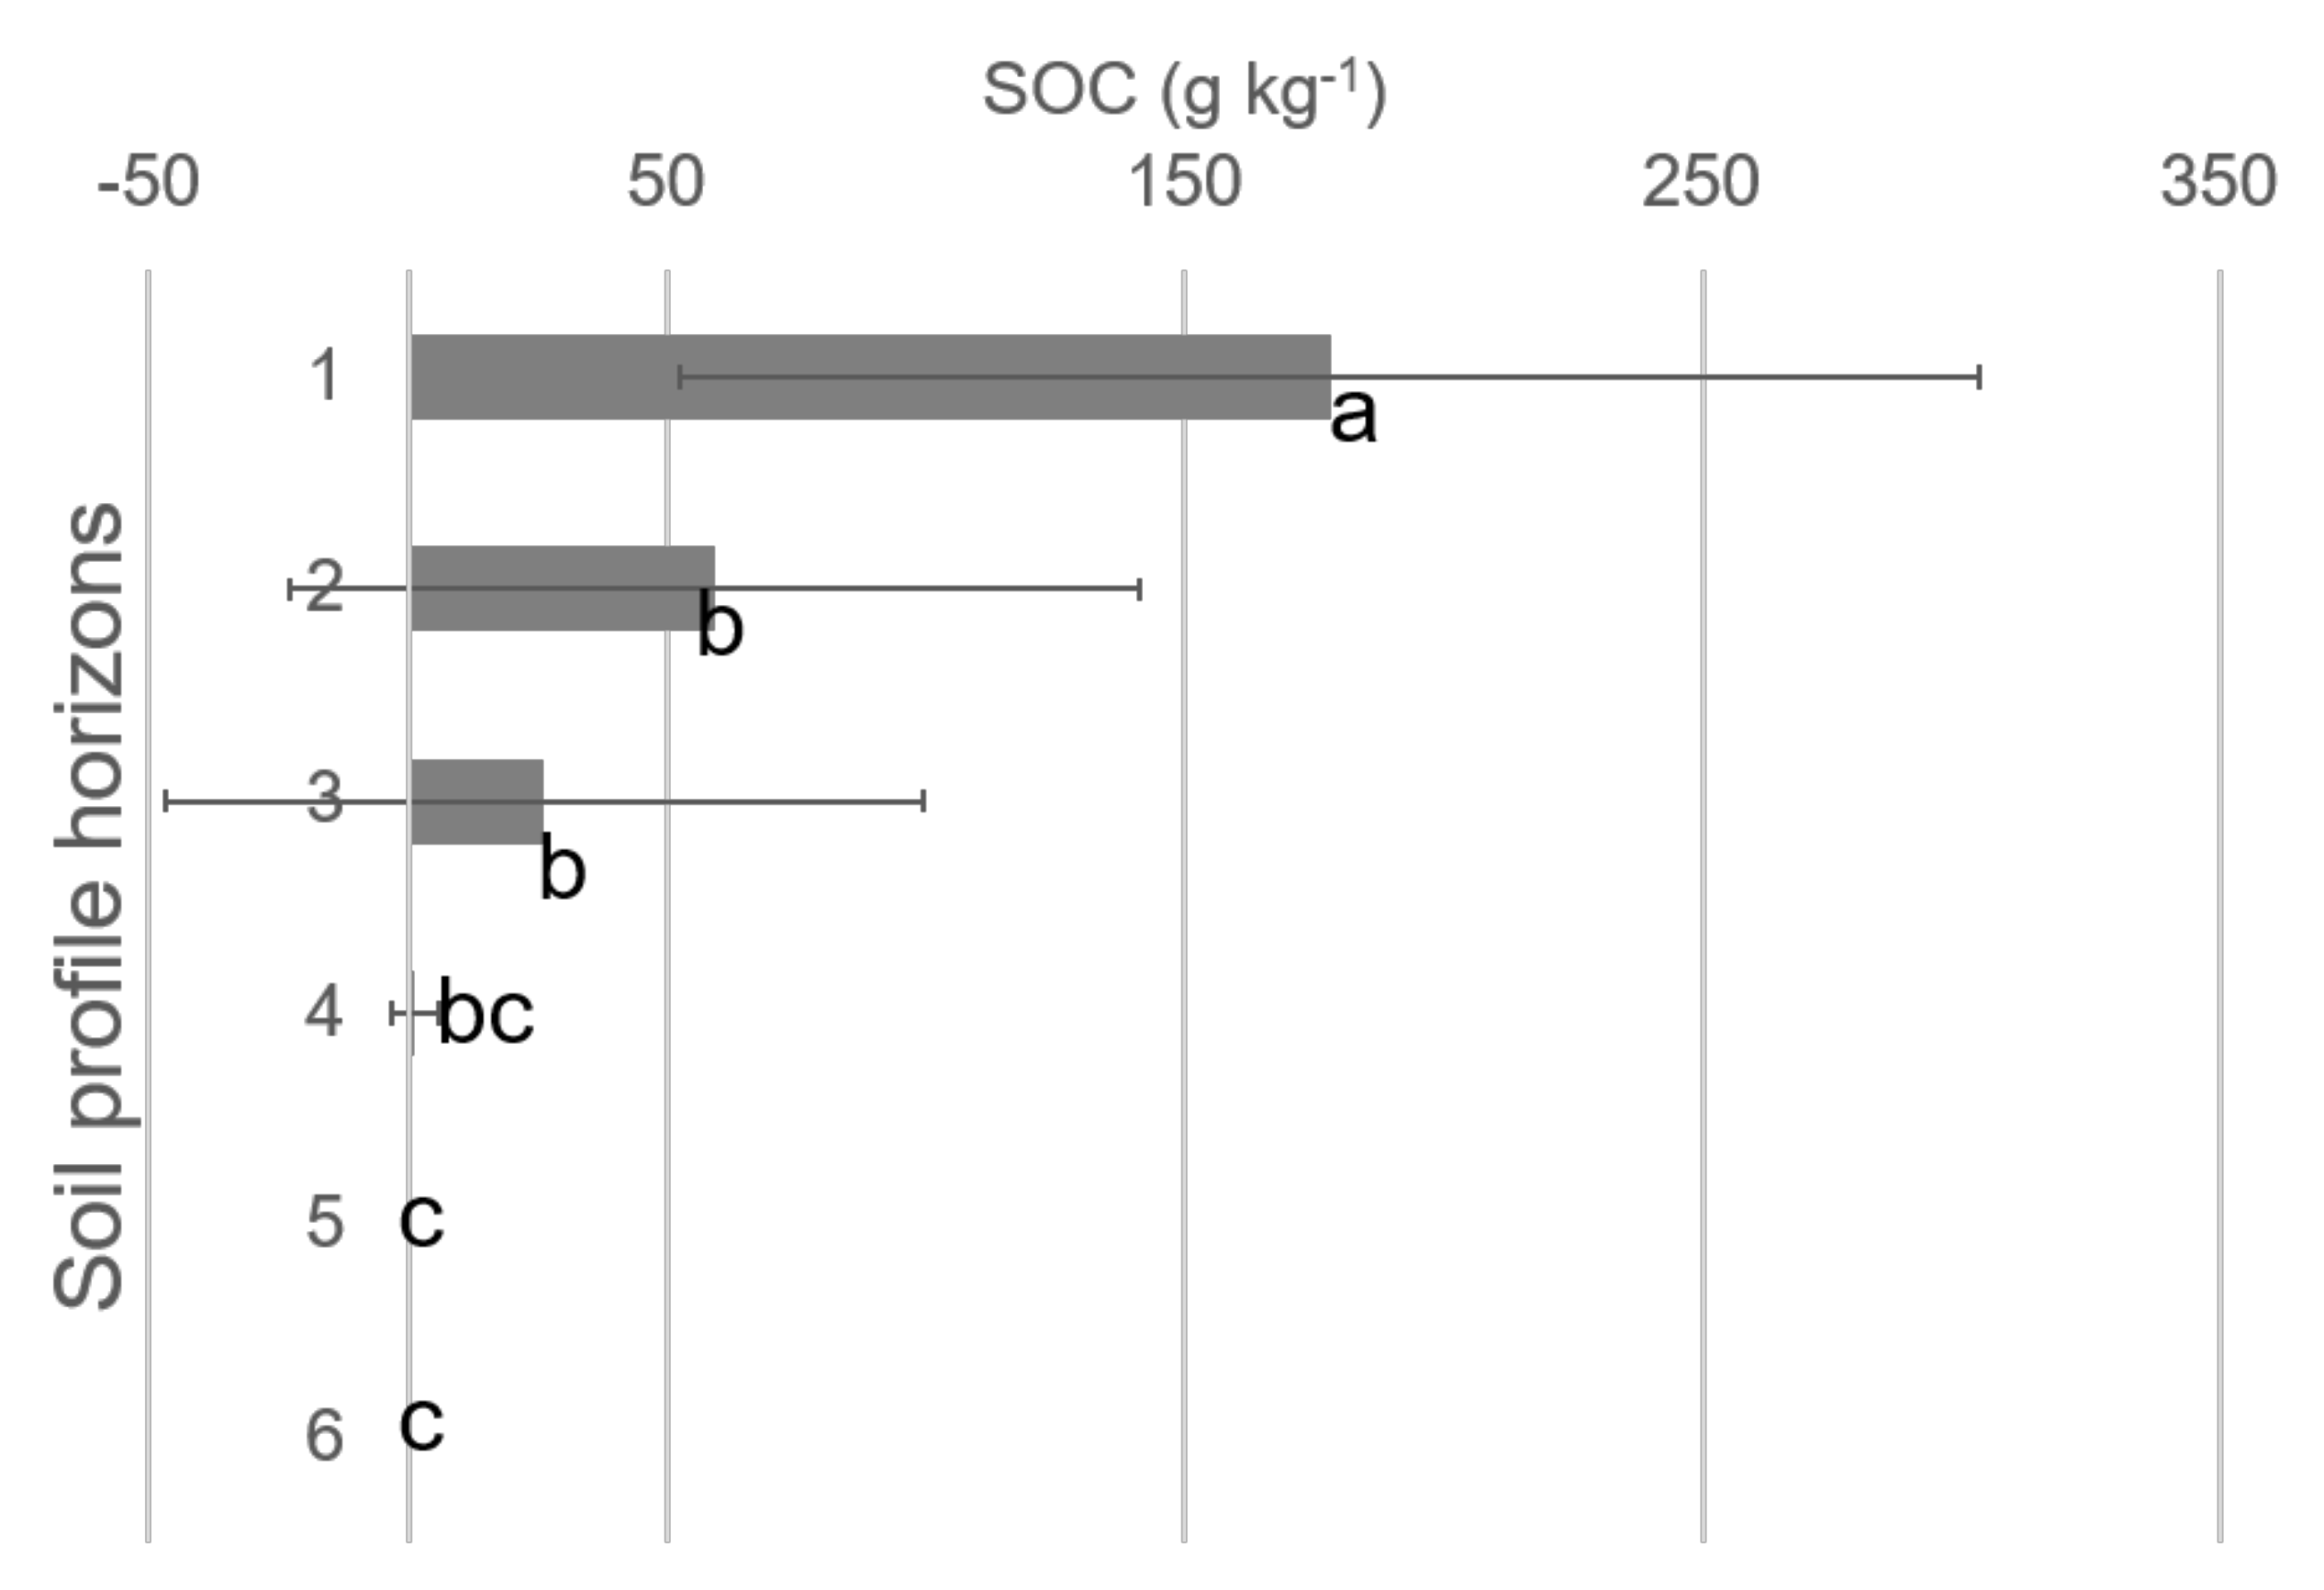
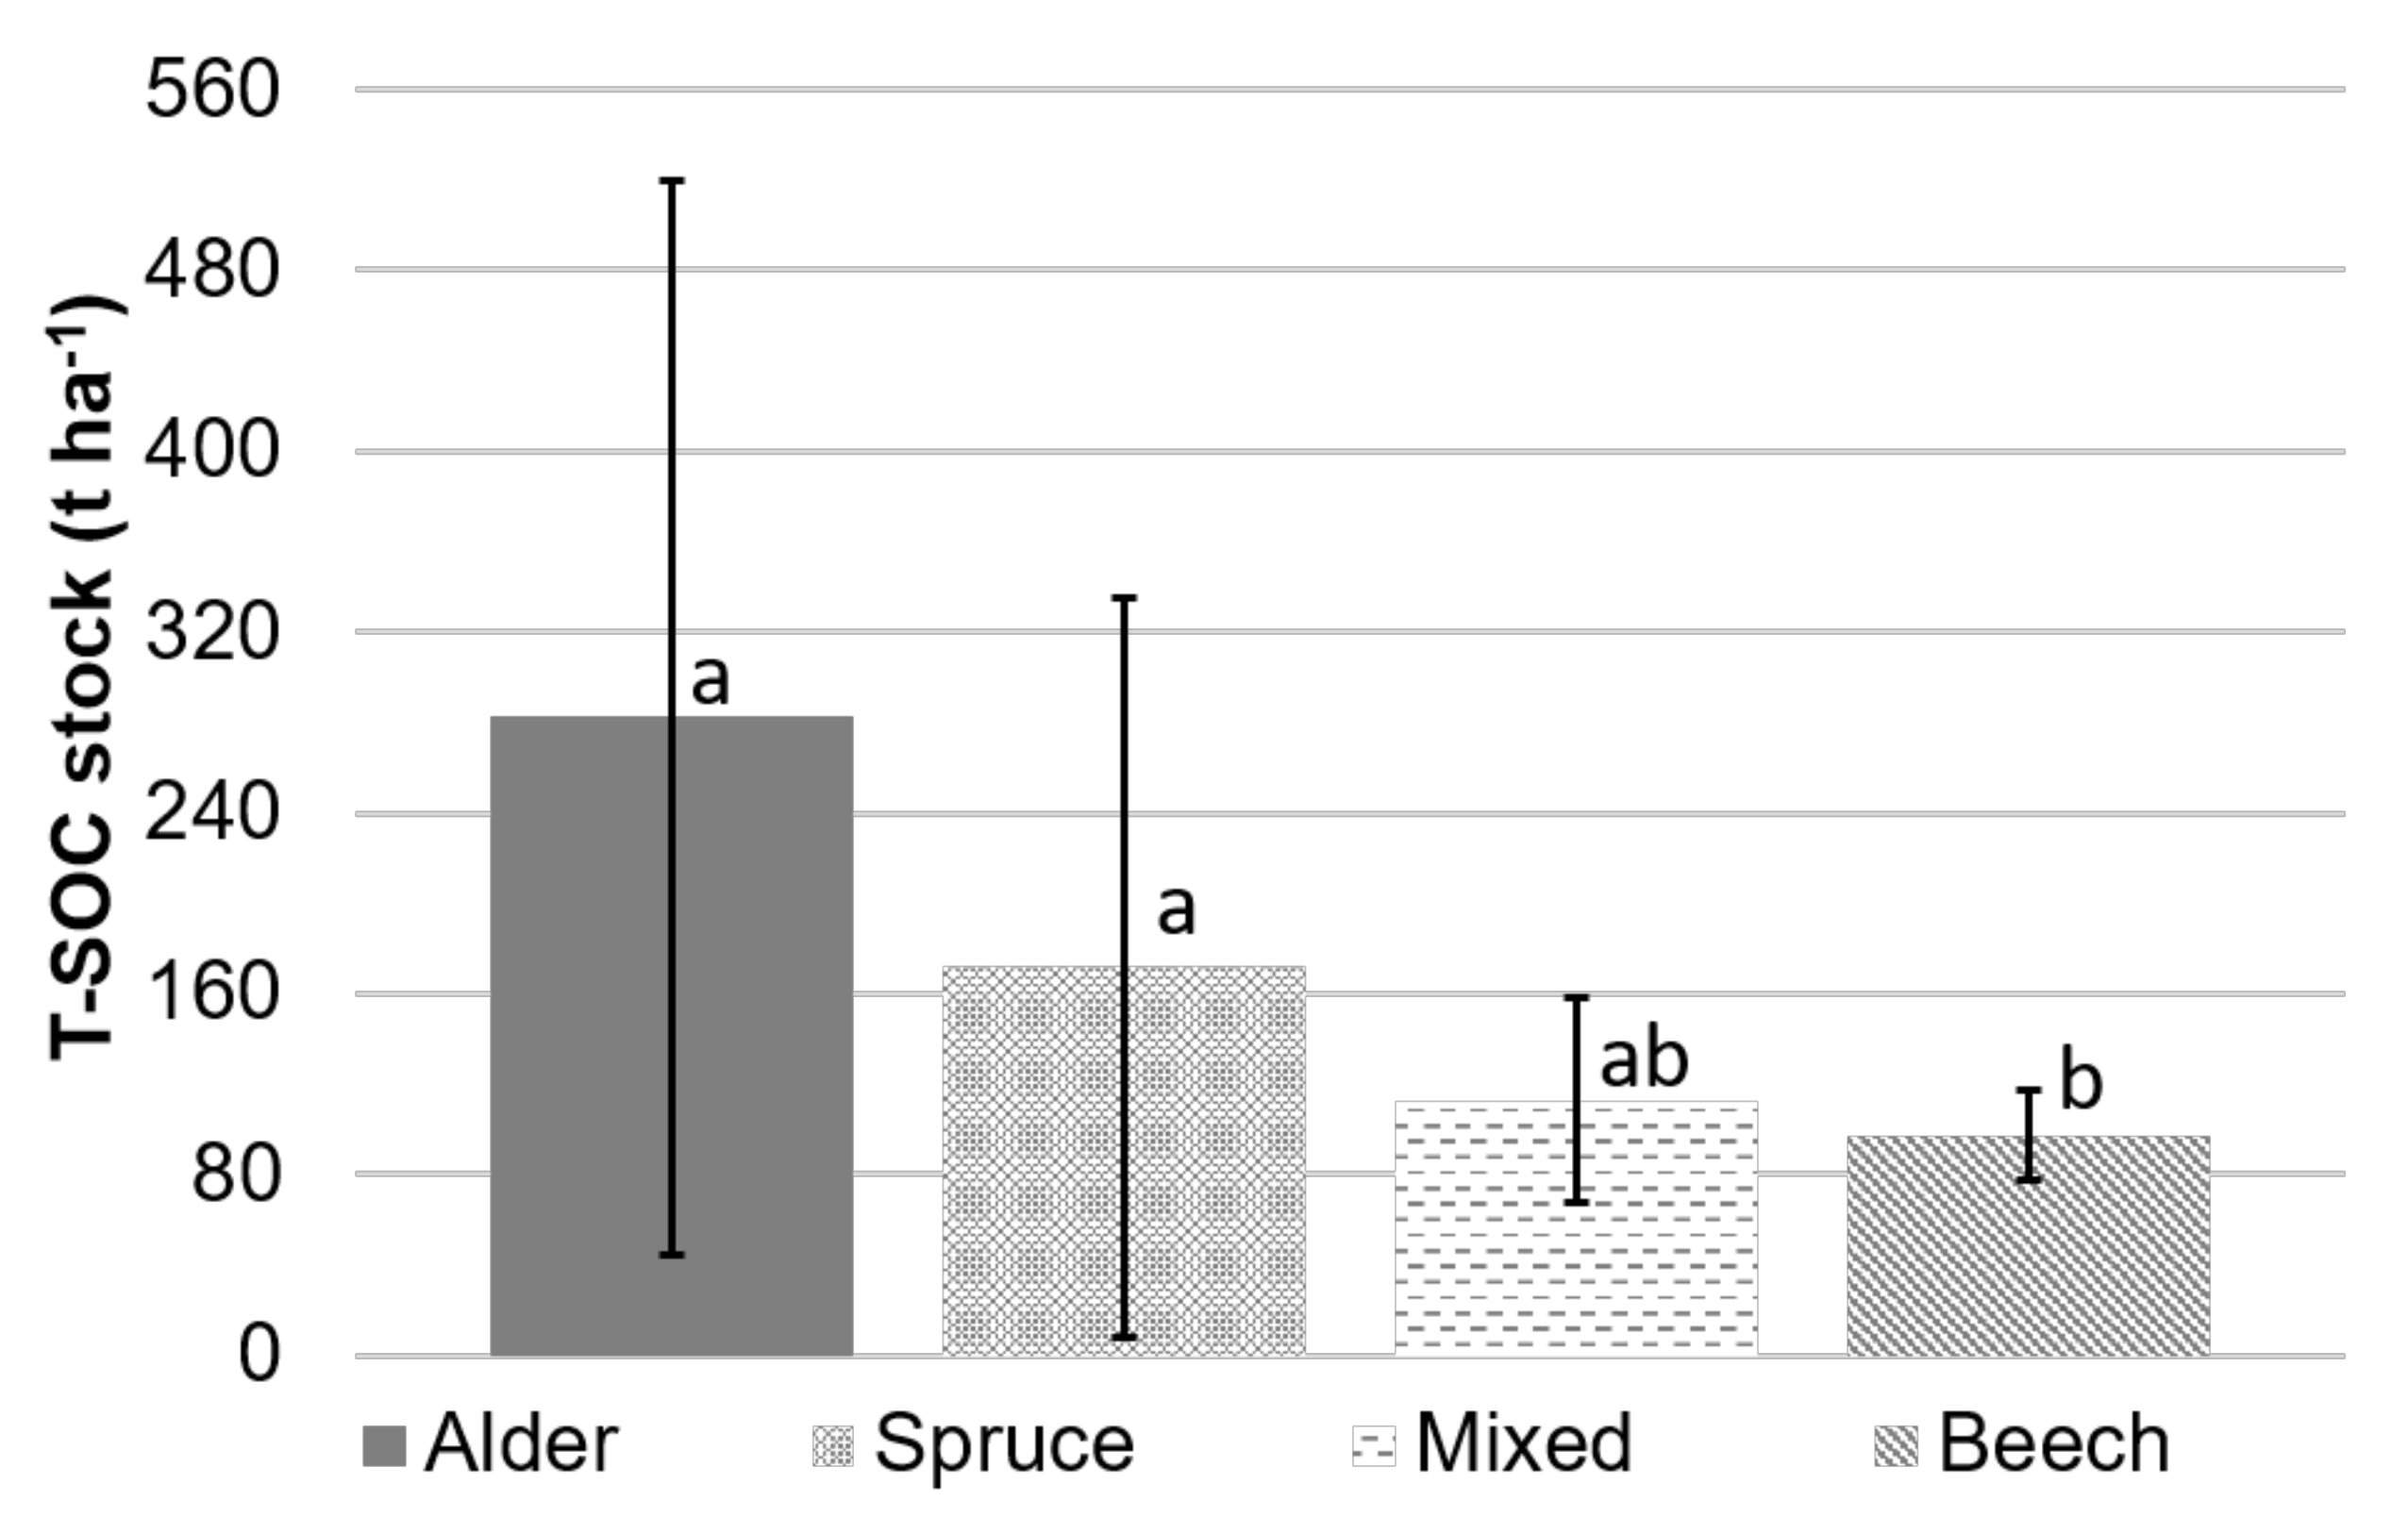
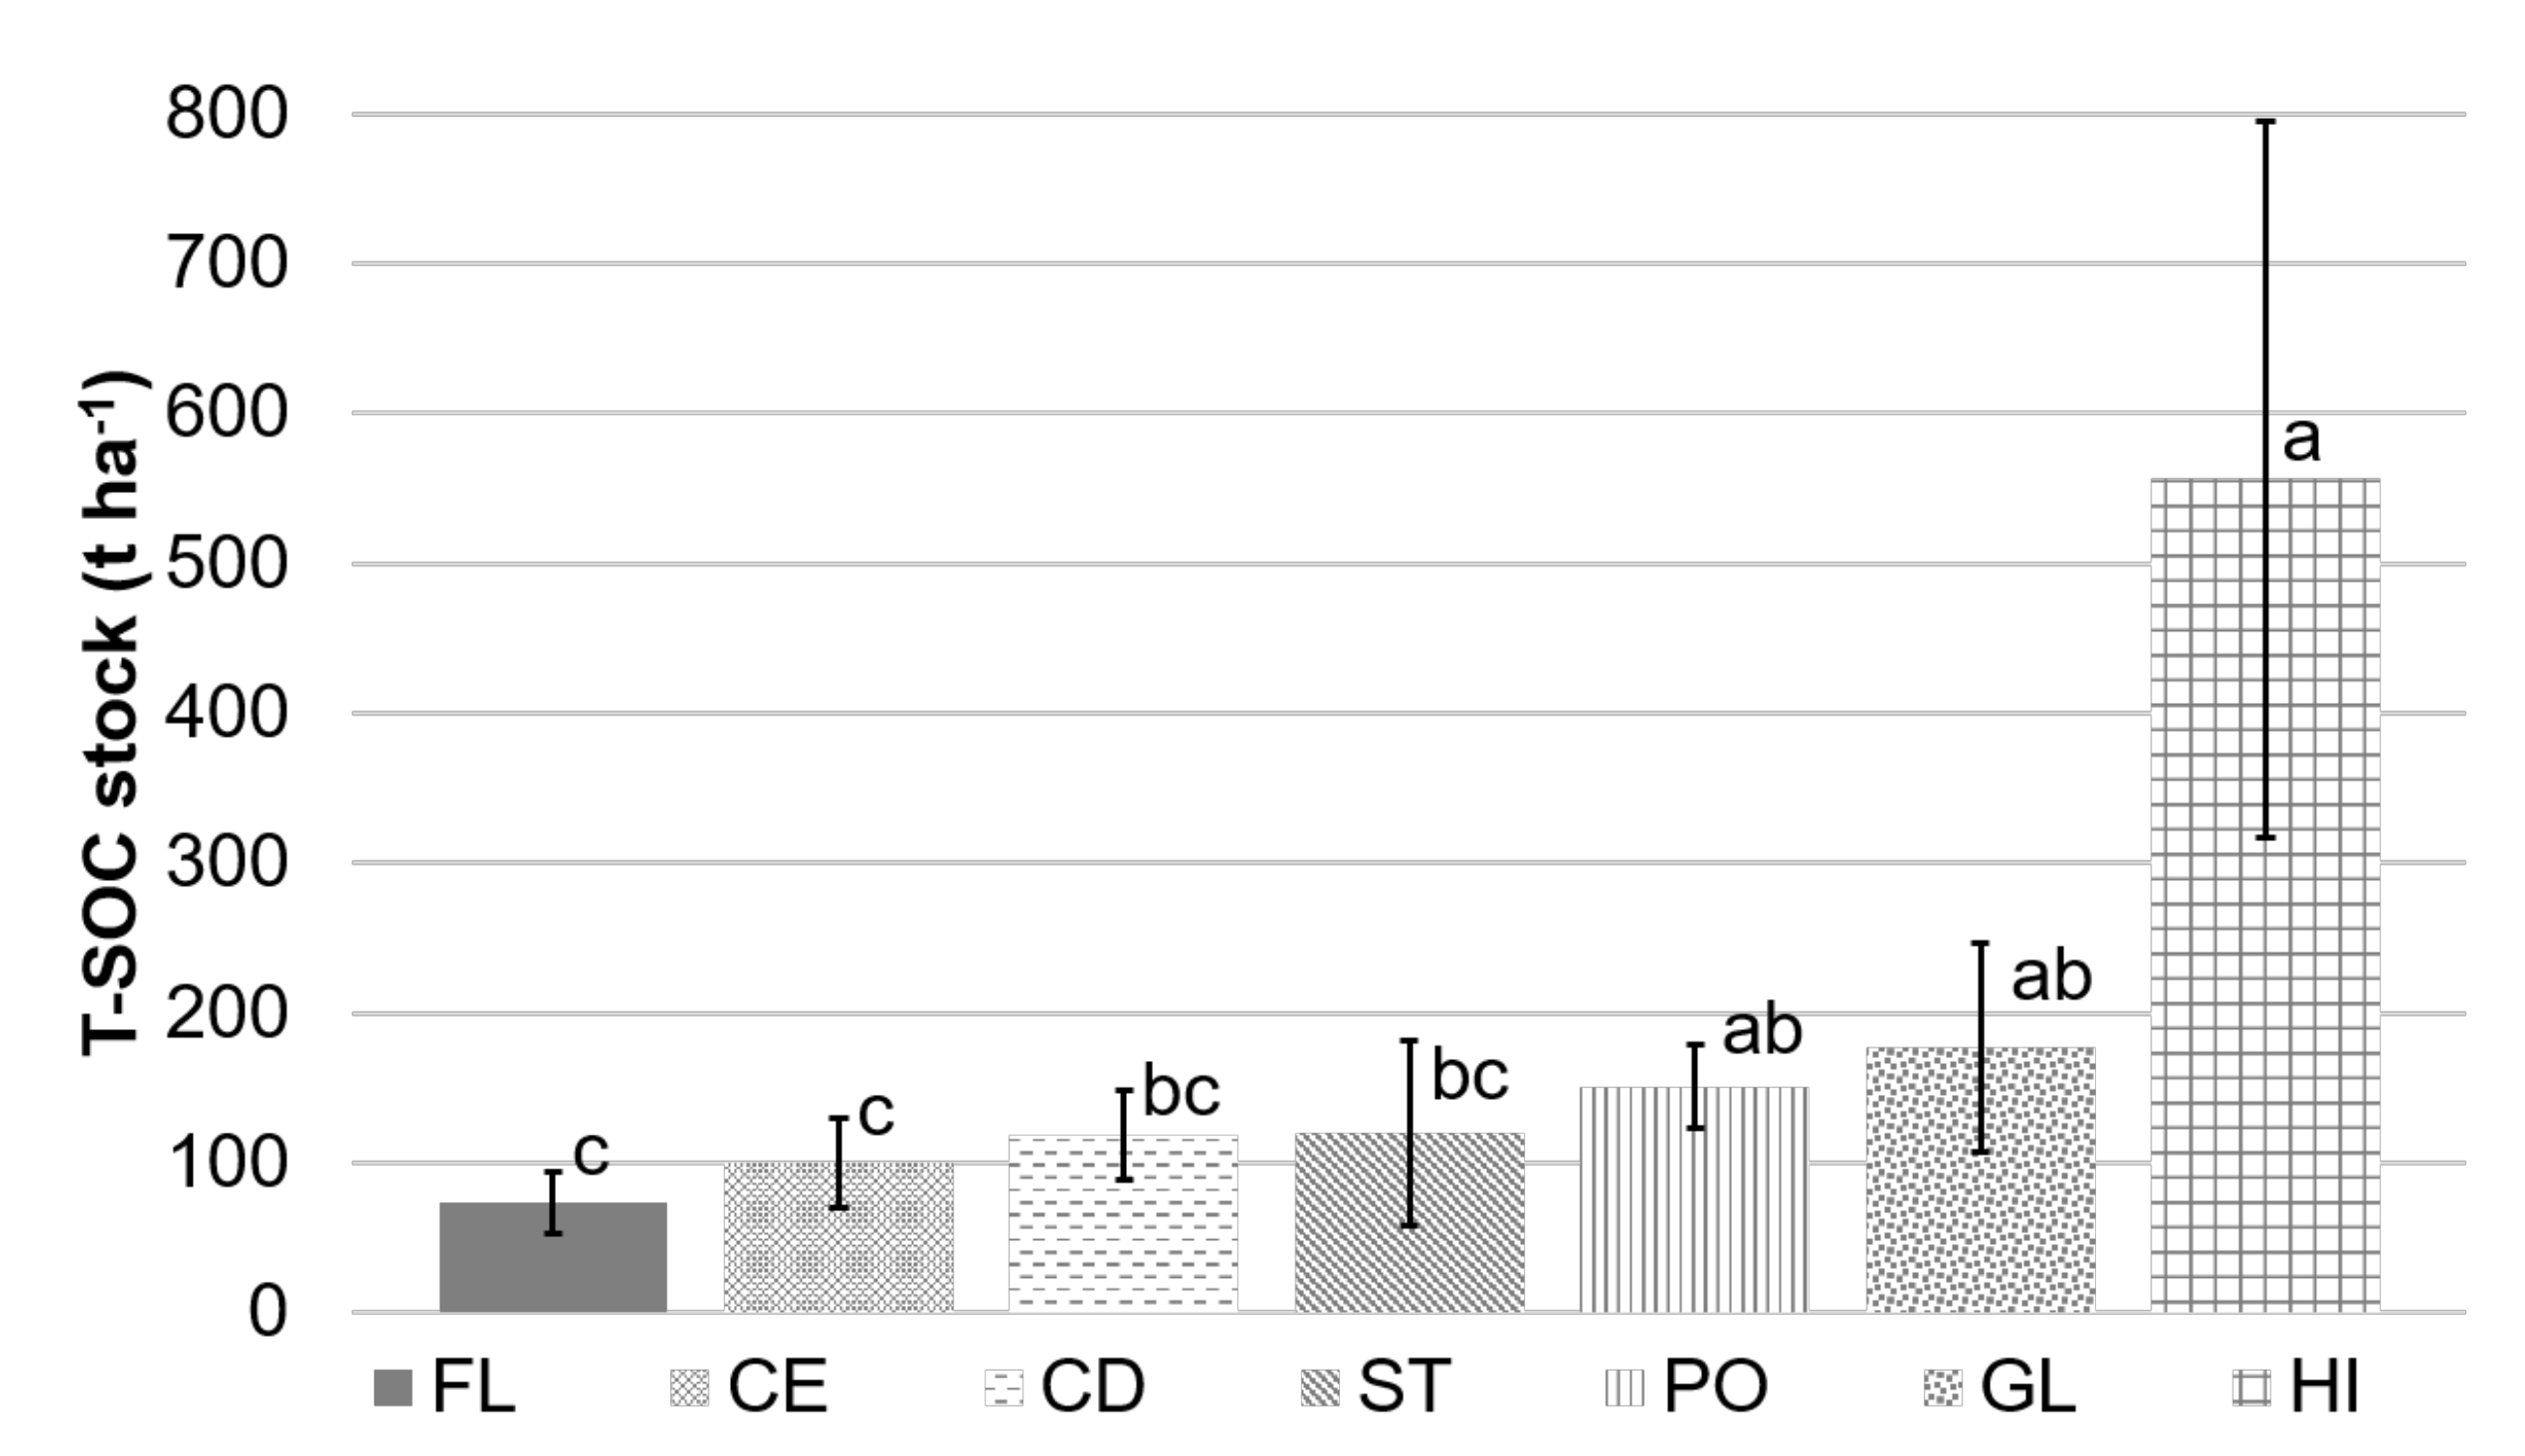
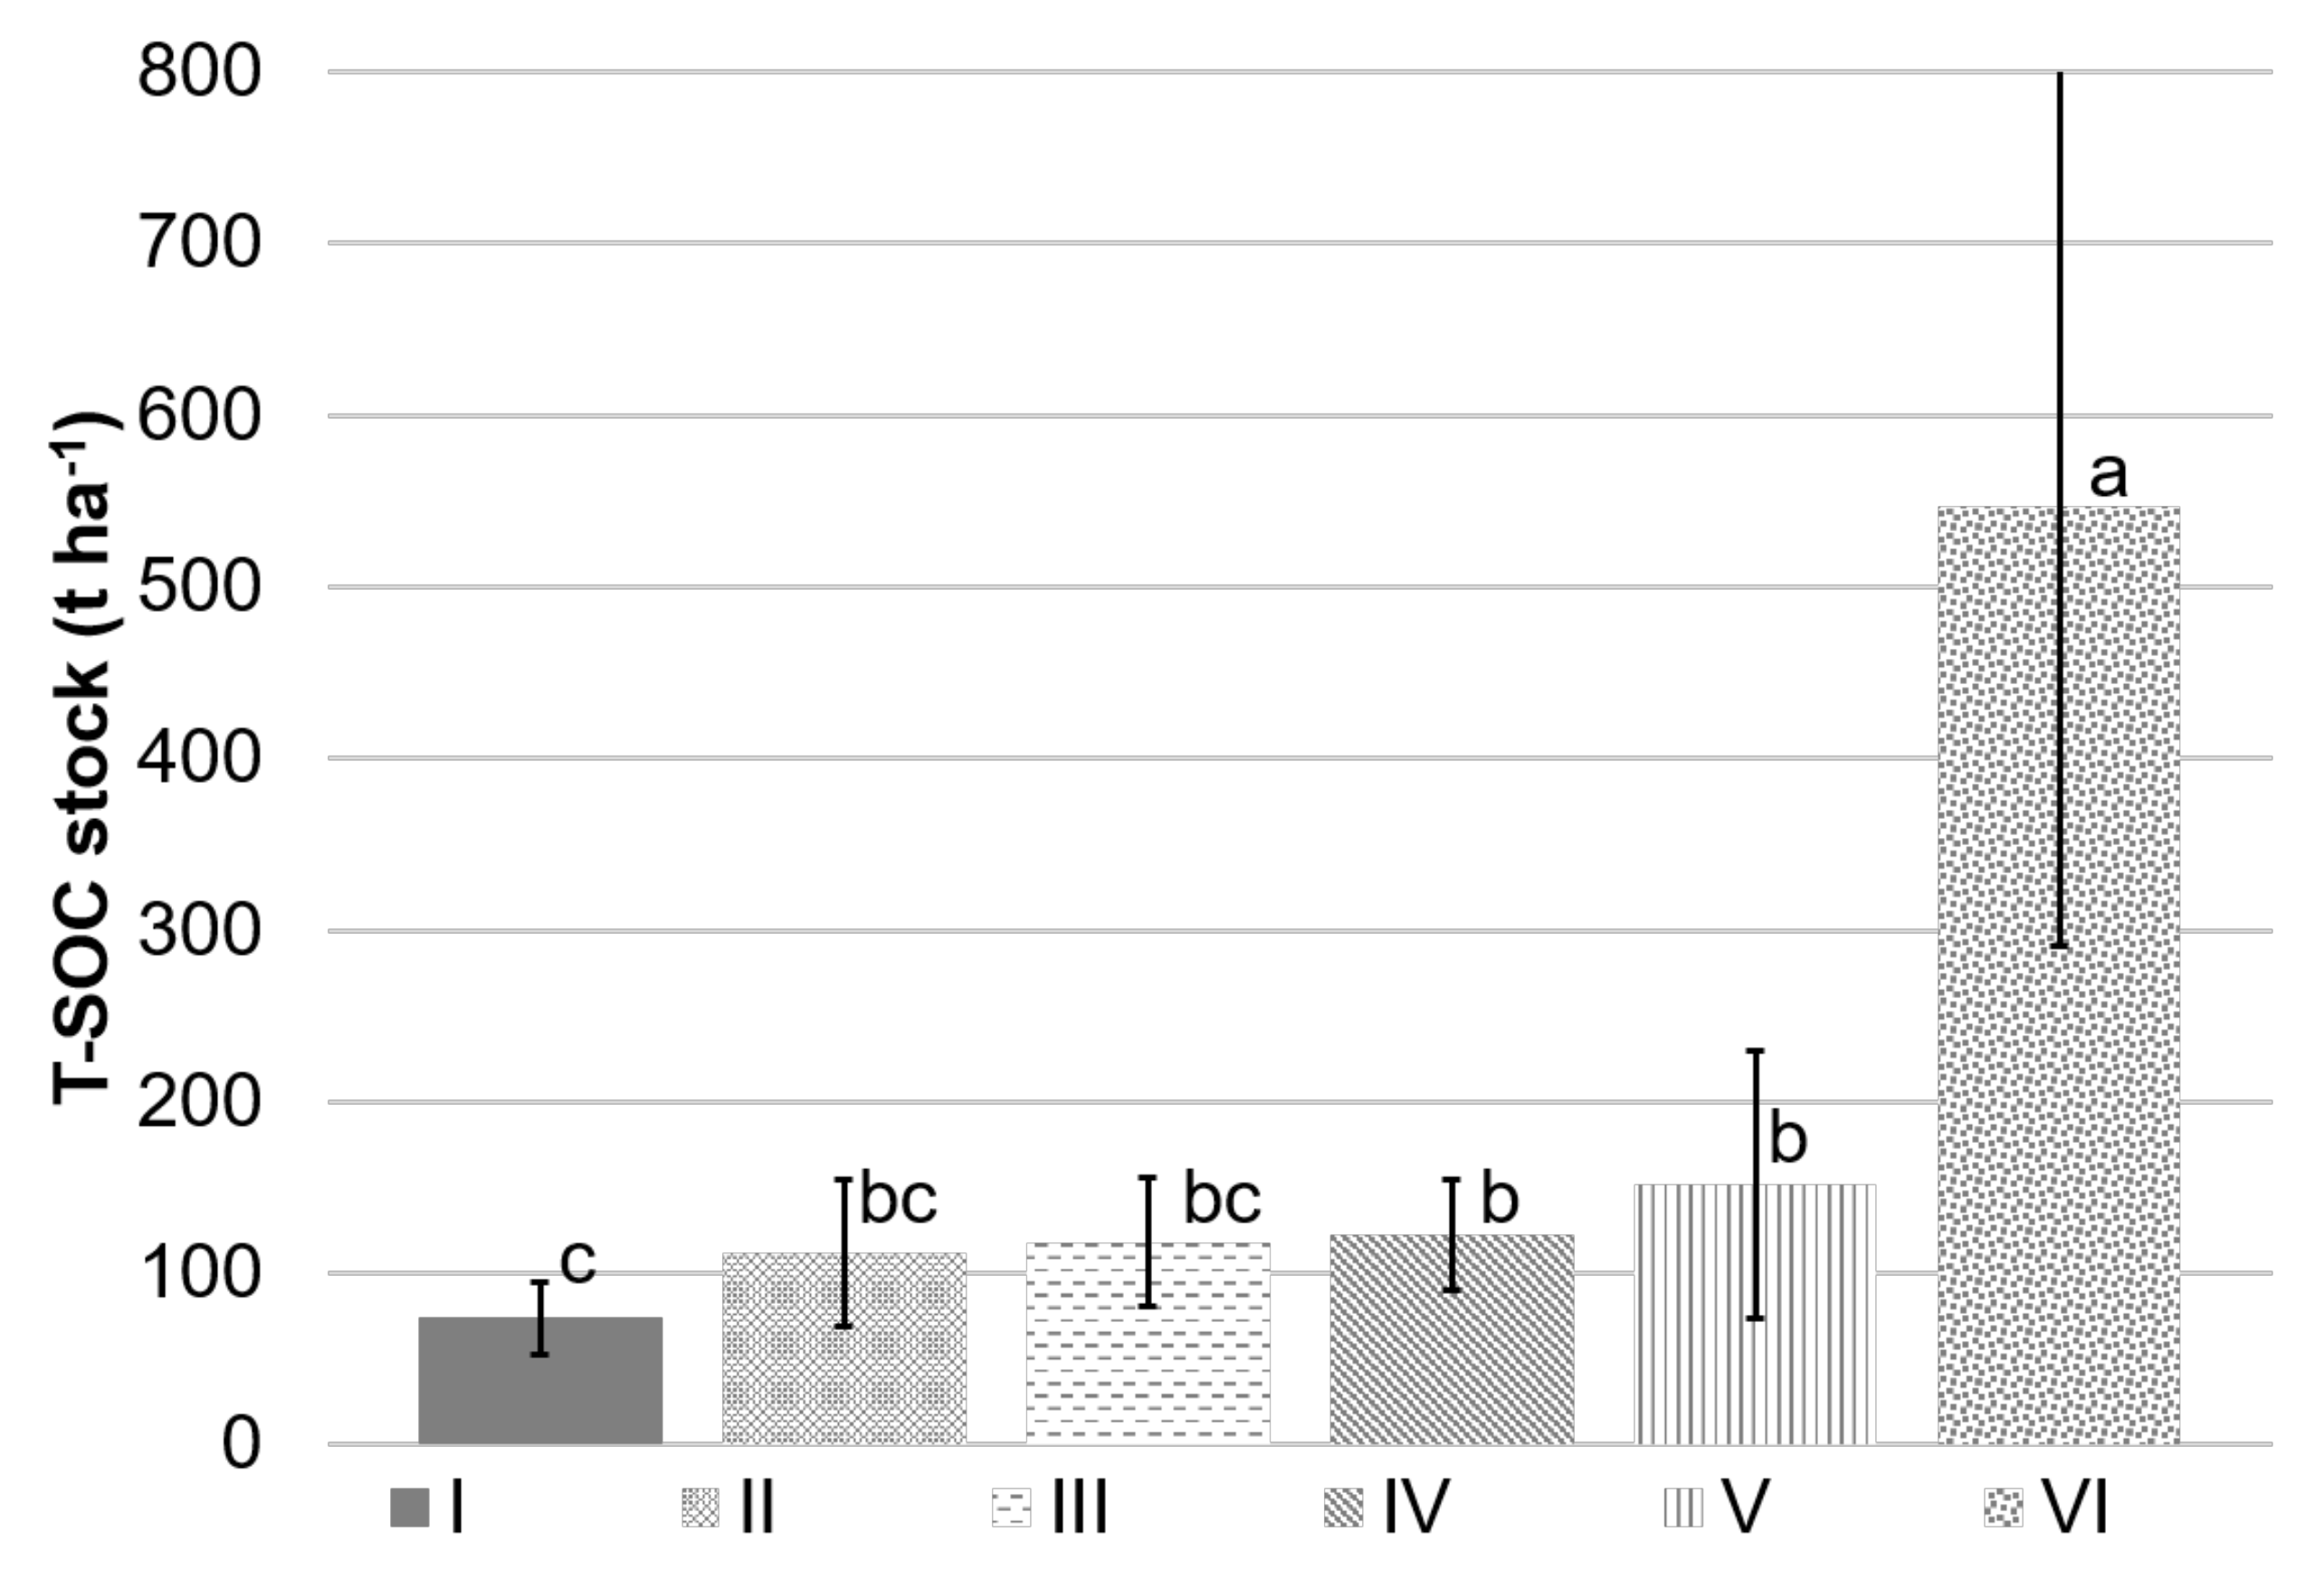
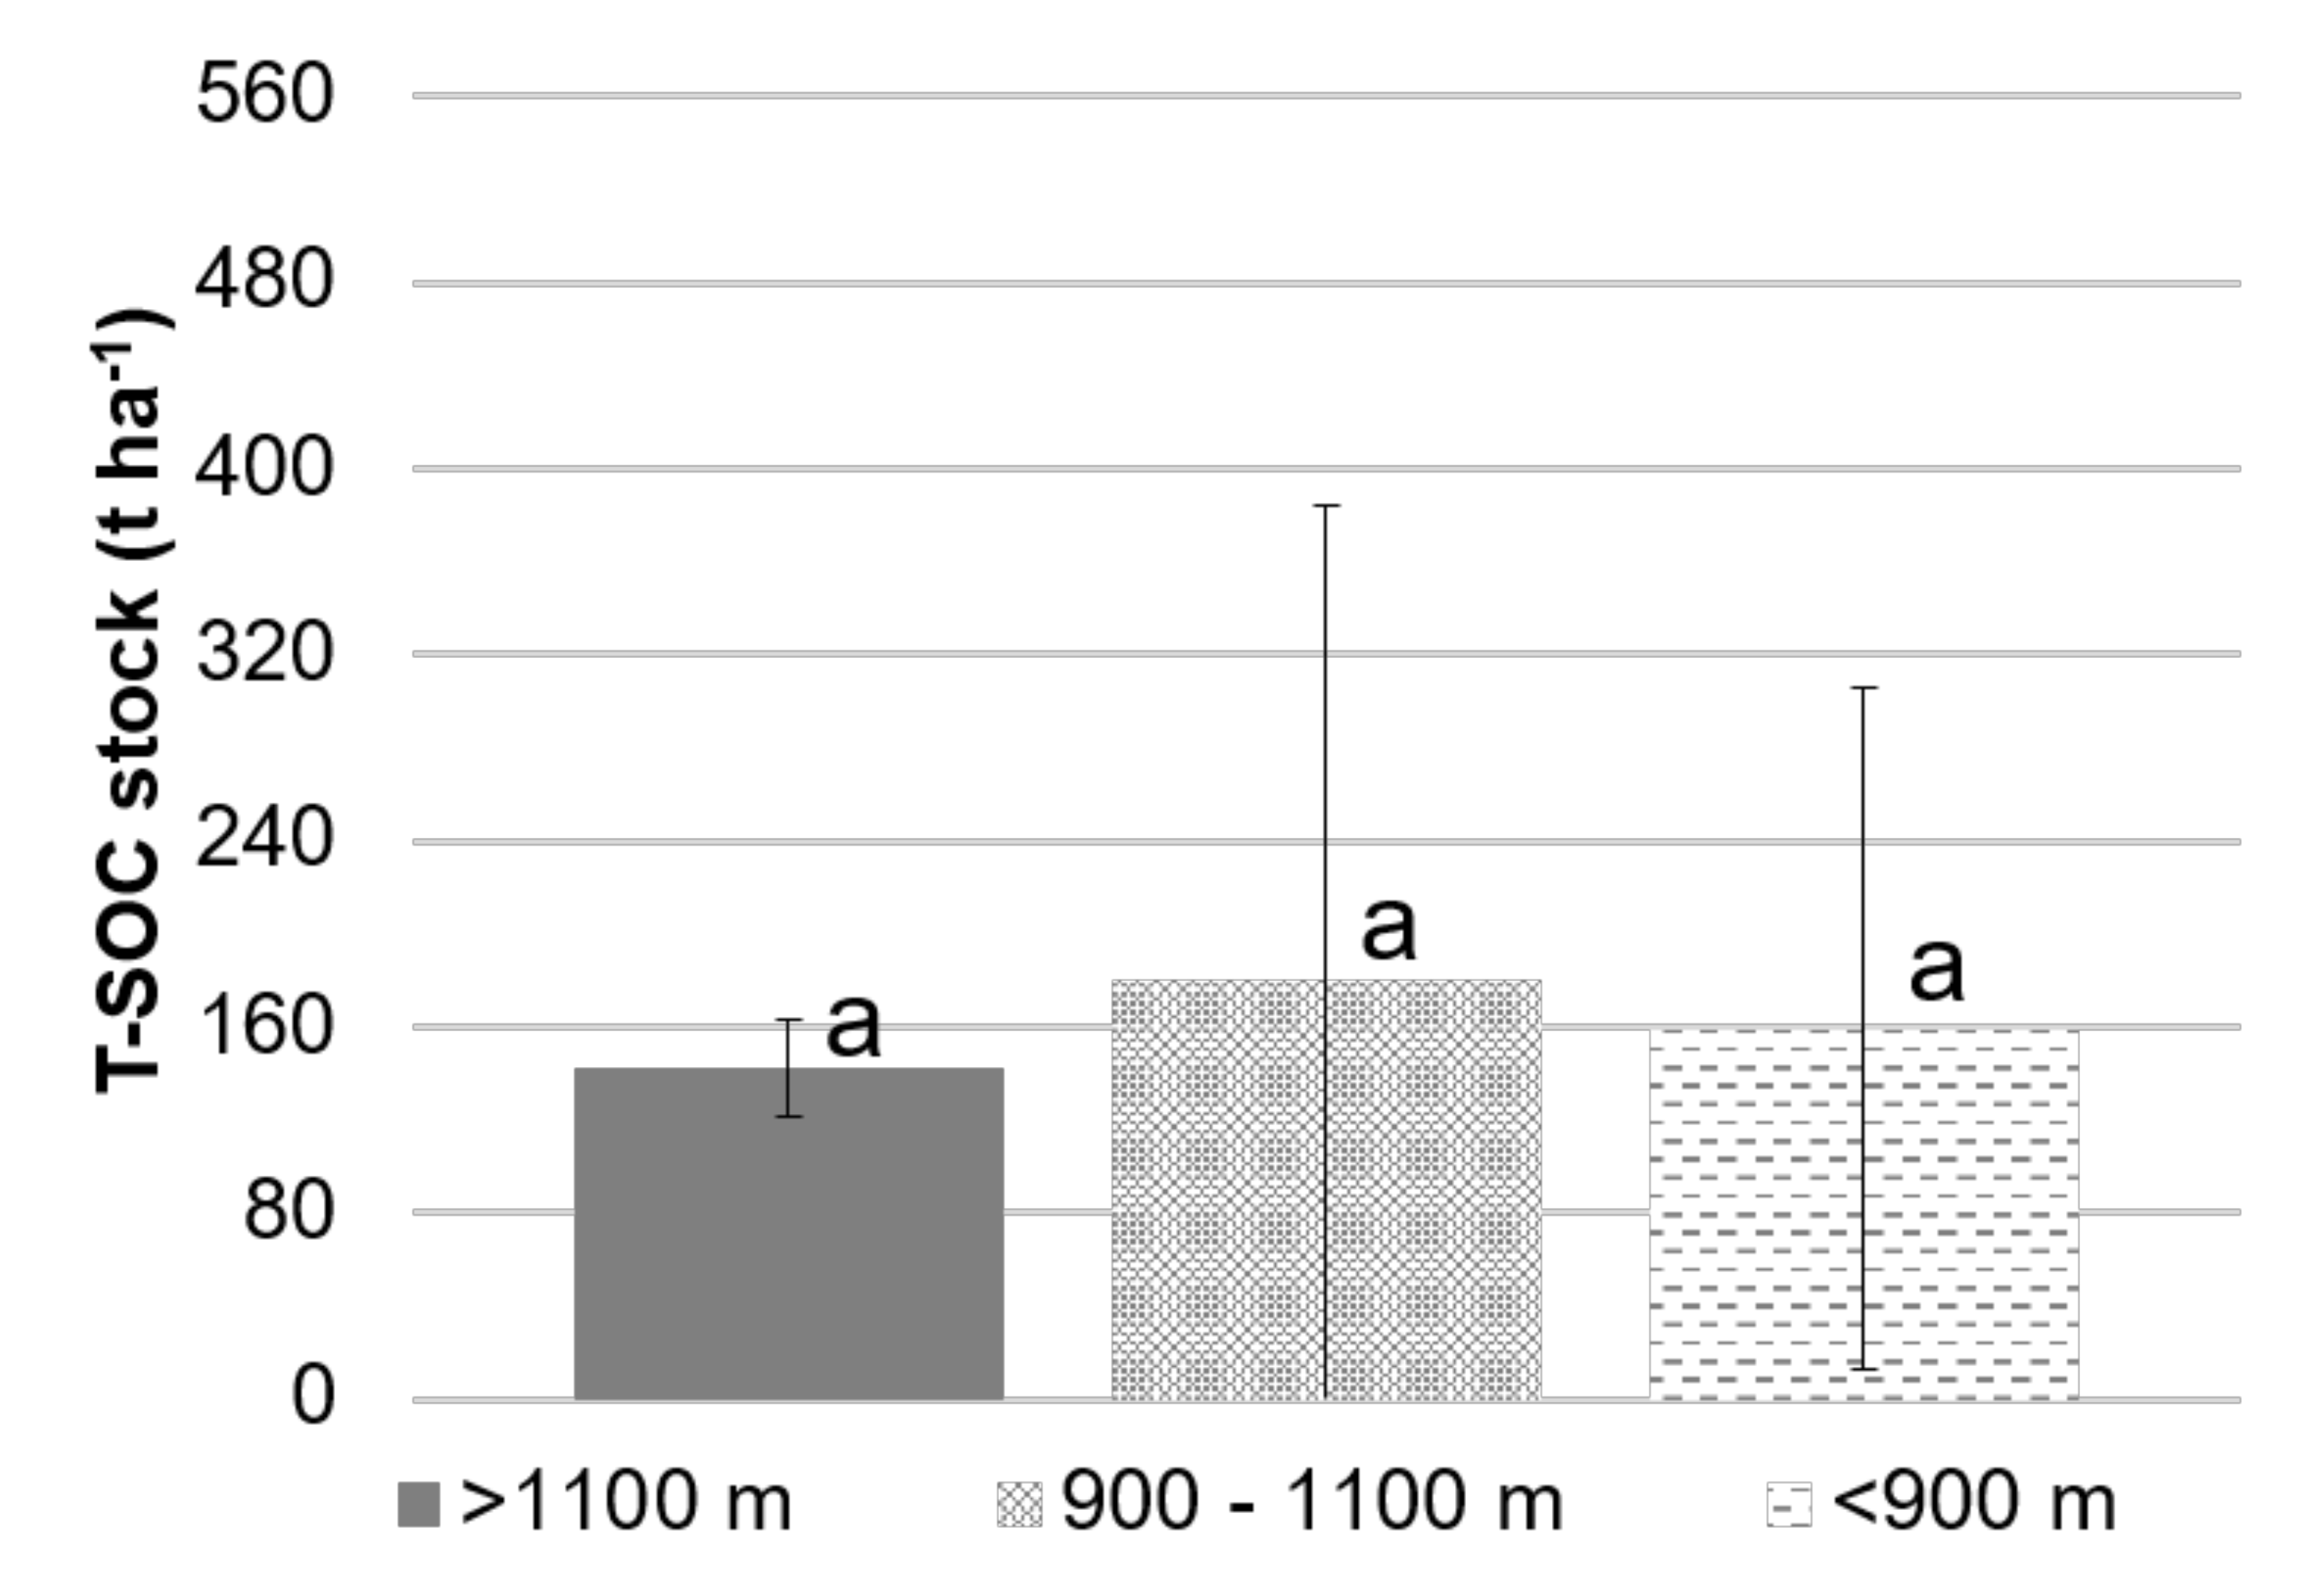
3.2. Soil Organic Carbon and Stock in the Studied Soils

As expected, there was clear stratification of organic carbon content (g kg 1 ) with respect to the horizons (Figure 3). Analyses of the first horizon show an average carbon content of 178.2 ± 125.5 g kg 1 , which differs from that in the other horizons. There was a decrease in organic carbon content in the second and third horizons, which had values of 59.1 ± 89.1 g kg 1 and 26.3 ± 73.1 g kg 1 , respectively. A significantly higher SOC content (g kg 1 ) was noted in the surface horizon (Figure 3).
Significant differences in total organic carbon stock in the soils of different forest stands were found (Figure 4). The highest total organic carbon stock was in the soils of alder and spruce forests (282.07 ± 237.62 t ha 1 and 171 ± 163.74 t ha 1 ). The transition to lower T-SOCstock was in soils of mixed forest (112.84 ± 45.75 t ha 1 ), and the lowest T-SOCstock was in soils of beech forest (97.26 ± 20.06 t ha 1 ) (Figure 4).
The studied soils were divided into seven groups. Significantly higher T-SOCstock was found in histosols (556.23 ± 238.69 t ha 1 ) compared with the other soil types. Significantly lower T-SOCstock was in fluvisols and eutric cambisols (73.81 ± 20.65 and 99.92 ± 30.08 t ha 1 , respectively) (Figure 5). Among different types of parent material, peat sediments (VI) had significantly higher T-SOCstock (546.3 ± 255.04 t ha 1 ). The average T-SOCstock in the soils formed on the remaining parent material was 78% lower (115.65 ± 42.32 t ha 1 ) (Figure 6).
The total organic carbon stock in soils was not significantly different between the three altitude groups (>1100, 900–1100, and <900 m) (Figure 7). Figure 8 maps the values of the total organic carbon stock (t ha 1 ) in soils with the Topography Position Index (TPI). The highest T-SOCstock (50.10–905.20 t ha 1 ) was in the valley and on flat mountain areas. Low and intermediate slopes were characterized by a lower T-SOCstock (Figure 8).
The interaction effects of soil type, altitude, and type of forest stand on the total soil organic carbon stock were confirmed by the general linear model (GLM) analysis (Table 2), which indicates that soil type was a more important factor than the other characteristics (Table 2). A pronounced increase in the T-SOC stock was found in histosols at a lower altitude under deciduous forest stands. A projection of the variables on the factor plane clearly demonstrates a correlation between total soil organic carbon stock and soil type, altitude, and type of forest stand (Figure 9). Two main factors had a significant total impact (41.63%) on the variance of the variables. Factor 1 explains 22.77% of the variance of the examined properties, whereas Factor 2 accounts for 18.86% of the variance. PCA analysis confirms the relationship between T-SOCstock and histosols and the dominance of the alder forest. Cluster analysis was used to classify cases (study plots) into groups called clusters. The results are illustrated with a dendrogram, which enables the identification of two main groups that differ in altitude, slope, T-SOCstock, and type of forest stand. The strongly moistened soils (histosols, fluvisols, gleysols, stagnosols) clearly differ from other soils. The latter group is clearly divided into study plots with podzols and poorer subtypes of cambisols and study plots with richer subtypes of cambisols (Figure 10).

4. Discussion

Considering that the study area is 1754.5 ha, the carbon contribution to the environment is very important. It was estimated that this area provides 50.10–905.20 t ha 1 of soil organic carbon to a 1 m depth. In a study on British forest soils [2], the authors noted high values of carbon stock (589 t ha 1 ) in the top 80 cm, and 664 t C ha 1 in the top 1 m of soil, but their results were very dependent on climatic factors and soil type. In [26], the carbon stock in the forest soils of Europe was estimated to range between 1.3 and 70.8 t C ha 1 for the O-layer and between 11.3 and 126.3 t C ha 1 for the mineral soil to 0–20 cm. In [27], forest soil carbon stock of 79 Gt C was reported for all European soils, including peat. In [28], total stocks were estimated to be 3.50–3.94 Gt C on the forest floors and 21.4–22.7 Gt C in the mineral and peat soils to a depth of 1 m in European forests. The topsoil SOC values for agricultural soils across Europe were determined to range between 40 and 250 t C ha 1 [29]. The highest SOC values were found in Ireland, the UK, the Netherlands, and Finland, all of which had values of >250 t C ha 1 and correspond to peatland areas. The carbon stock in the mountain soils of BNP was comparable to the carbon stock for forest soils in other parts of Europe, and it is much higher than the average carbon stock in agricultural soils. Several papers confirm that the greatest organic carbon content is above a depth of 30 cm in different conditions [30,31,32].
The obtained results confirm the influence of topography on the accumulation of carbon in the soils of the BNP. The highest carbon stock was recorded in histosols, which are located in the lower positions of the BNP in valleys and on flat mountain areas. A high T-SOCstock was found in spruce stands created on podzols and located at higher altitudes. The temperature decreases with the altitude, which results in a slower rate of organic matter decomposition [33]. At the same time, low temperatures reduce the productivity of ecosystems [34]. In [35], the authors found that SOC stock showed a decreasing trend at higher elevations, which is where the forest vegetation types transform into alpine shrublands. Altitude importantly but indirectly influences the SOC stock by affecting properties such as lower soil depths, different distributions of forest species, different soil types, and increased percentages of stone content [7,11,36,37]. In our study, the results of the PCA analysis confirm the importance of the slope in shaping the SOC stock. A lower slope position promotes vegetation growth, which results in higher SOC accumulation. In [38], it was suggested that, at the hill scale, the variability of soil organic carbon stock might be explained by the slope rather than the elevation. [39] observed a strong relationship between the slope and the quantity and quality of SOC accumulation in hillslope systems. Specifically, moderate slopes (15%) combined with a concave profile and plan curvature led to greater SOC accumulation.
An important edaphic factor that determines the accumulation of SOC in soils is the parent material [28,38]. In our research, high SOC stock was associated with sediments accumulated on terraces, which occur in low-lying valleys and flat mountain areas and are characterized by strong waterlogging. The results of the cluster analysis identify high SOC stock in highly waterlogged soils. In [34,40], the authors confirmed the relationship between SOC and soil water content, and soil moisture explained >50% of the total variation in SOC stock. The favorable humidity conditions have a positive impact on the productivity of forest ecosystems. Meanwhile, anaerobic conditions that reduce the activity of microorganisms prevail in heavily moistened soils, resulting in a slower rate of organic matter decomposition. In [41,42], the importance of soil moisture and acidity for soil organic matter accumulation was confirmed: 89% of the variance in the C content was explained by the hydrolytic acidity and moisture of the soils. In this study, the results show that histosols have the capacity to accumulate more carbon than other soil types. Histosols form when organic matter decomposes more slowly than it accumulates because of a decrease in microbial decay rates. This occurs most frequently in extremely wet areas or underwater. In [42], the authors stated that wetland and peatland soils are among the largest organic carbon stocks, and they contribute to carbon emission or accumulation. Most histosols form in environments such as wetlands in which restricted drainage inhibits the decomposition process. The conclusion in [43] asserted that histosols in northeastern Poland are rich in organic carbon content (162.2–459.5 g kg 1 ). Similar values were found by [44], who examined the histosols of forest ecosystems. The organic carbon content in histosols in northeastern Poland was determined to contribute 40% in the first 10 cm [45]. In our study, the soil with the highest supply of carbon was accompanied by alder. Alder species have a greater capacity to incorporate nitrogen (N) into the soil, facilitating the development of nearby vegetation and providing more organic carbon to the soil through the roots [46]. Considerable carbon stock was recorded in soils under spruce stands. High SOC stock under these stands is the result of altitude, as well as the characteristics of this species. Spruce forests have more acidifying effects on the soil than deciduous or mixed forests [14,41], and acidifying species such as spruce decrease the rate of organic matter decomposition. In our research, the lowest SOC accumulation was recorded in the soils of mixed and beech stands. This is the result of these stands being located at a lower altitude, where thermal conditions favor the decomposition process.

5. Conclusions

The present study reveals that the SOC stocks in the mountain soils of the BNP are characterized by high variability (from 50.10 to 905.20 t ha 1 ). The SOC stock in the mountain areas of BNP is affected by interactions between the soil type, altitude, and type of forest stands. The highest carbon stock was found in histosols with alder, which are located at lower altitudes in the valleys and flat mountain areas of the BNP. Higher positions were characterized by a slower rate of organic matter decomposition. A high carbon stock was noted in soil with spruce located at higher altitudes. We ranked the investigated soil types according to their capacity to carbon accumulation: histosols > gleysols > podzols > stagnosols > cambisols > fluvisols. In order to maximize the potential of carbon accumulation in the ecosystem, we emphasize the need to protect histosols, especially from dehydration, and to ensure the proper selection of tree species for breeding programs.

Author Contributions

The following statements should be used; methodology, J.L.; software, E.B. and L.R.-B. resources, L.V.-M. and B.V.-M.; writing—original draft preparation, L.R.-B.; writing—review and editing, E.B.; supervision, E.B.; project administration, E.B.

Funding

This research was financed by the Ministry of Science and Higher Education of the Republic of Poland (DS-3407).

Acknowledgments

We thank the Erasmus+ program for the help exchange between the University of Córdoba, the University of Agriculture in Krakow, and ESPAM M.F.L. in Ecuador.

Conflicts of Interest

The authors declare no conflict of interest.

References

  1. Pan, Y.; Birdsey, R.A.; Fang, J.; Houghton, R.; Kauppi, P.E.; Kurz, W.A.; Phillips, O.L.; Shvidenko, A.; Lewis, S.L.; Canadell, J.G.; et al. A Large and Persistent Carbon Sink in the World’s Forests. Science 2011, 333, 988–993. [Google Scholar] [CrossRef] [PubMed]
  2. Vanguelova, E.I.; Nisbet, T.R.; Moffat, A.J.; Broadmeadow, S.; Sanders, T.G.M.; Morison, J.I.L. A new evaluation of carbon stocks in British forest soils. Soil Use Manag. 2013, 29, 169–181. [Google Scholar] [CrossRef]
  3. Dixon, R.K.; Solomon, A.M.; Brown, S.; Houghton, R.A.; Trexier, M.C.; Wisniewski, J. Carbon Pools and Flux of Global Forest Ecosystems. Science 1994, 263, 185–190. [Google Scholar] [CrossRef] [PubMed]
  4. Six, J.; Callewaert, P.; Lenders, S.; De Gryze, S.; Morris, S.J.; Gregorich, E.G.; Paul, A.; Paustian, K. Measuring and Understanding Carbon Storage in Afforested Soils by Physical Fractionation. Soil Sci. Soc. Am. J. 2002, 66, 1981–1987. [Google Scholar] [CrossRef] [Green Version]
  5. Tsui, C.C.; Chen, Z.S.; Hsieh, C.F. Relationships between soil properties and slope position in a lowland rain forest of southern Taiwan. Geoderma 2004, 123, 131–142. [Google Scholar] [CrossRef]
  6. Zhang, S.; Chen, D.; Sun, D.; Wang, X.; Smith, J.L.; Du, G. Impacts of altitude and position on the rates of soil nitrogen mineralization and nitrification in alpine meadows on the eastern Qinghai–Tibetan Plateau, China. Biol. Fertil. Soil. 2011, 48, 393–400. [Google Scholar] [CrossRef]
  7. Bardelli, T.; Gómez-Brandón, M.; Ascher-Jenull, J.; Fornasier, F.; Arfaioli, P.; Francioli, D.; Egli, M.; Sartori, G.; Insam, H.; Pietramellara, G. Effects of slope exposure on soil physico-chemical and microbiological properties along an altitudinal climosequence in the Italian Alps. Sci. Total Environ. 2017, 575, 1041–1055. [Google Scholar] [CrossRef] [PubMed]
  8. Ajczak, A.; Spyt, B. Differentiation of vertical limit of forest at the Babia Góra Mt., the Western Carpathian Mountains. Geogr. Pol. 2018, 91, 217–242. [Google Scholar] [CrossRef]
  9. Ayres, E.; Steltzer, H.; Berg, S.; Wallenstein, M.D.; Simmons, B.L.; Wall, D.H. Tree Species Traits Influence Soil Physical, Chemical, and Biological Properties in High Elevation Forests. PLoS ONE 2009, 4, e5964. [Google Scholar] [CrossRef]
  10. Grabherr, G.M.B. An Overview of the World Mountain Environments. Austrian MAB Committee. Austrian MAB Comm. 2011, 4, 8–14. [Google Scholar]
  11. Egli, M.P.J. Soils of Mountainous Landscapes. Int. Encycl. Geogr. People Earth Environ. Technol. 2016, 1, 1–10. [Google Scholar]
  12. Steiner, C.; Teixeira, W.G.; Lehmann, J.; Nehls, T.; de Macêdo, J.L.V.; Blum, W.E.H.; Zech, W. Long term effects of manure, charcoal and mineral fertilization on crop production and fertility on a highly weathered Central Amazonian upland soil. Plant Soil 2007, 291, 275–290. [Google Scholar] [CrossRef] [Green Version]
  13. Bhattacharyya, R.; Prakash, V.; Kundu, S.; Srivastva, A.K.; Gupta, H.S.; Mitra, S. Long term effects of fertilization on carbon and nitrogen sequestration and aggregate associated carbon and nitrogen in the Indian sub-Himalayas. Nutr. Cycl. Agroecosyst. 2009, 86, 1–16. [Google Scholar] [CrossRef]
  14. Jandl, R.; Lindner, M.; Vesterdal, L.; Bauwens, B.; Baritz, R.; Hagedorn, F.; Johnson, D.W.; Minkkinen, K.; Byrne, K.A. How strongly can forest management influence soil carbon sequestration? Geoderma 2007, 137, 253–268. [Google Scholar] [CrossRef]
  15. Haghdoost, N.; Akbarinia, M.; Hosseini, S.M. Land-use change and carbon stocks: A case study, Noor County, Iran. J. For. Res. 2013, 24, 461–469. [Google Scholar] [CrossRef]
  16. Liao, C.; Luo, Y.; Fang, C.; Li, B. Ecosystem Carbon Stock Influenced by Plantation Practice: Implications for Planting Forests as a Measure of Climate Change Mitigation. PLoS ONE 2010, 5, e10867. [Google Scholar] [CrossRef] [PubMed]
  17. Manojlović, M.; Čabilovski, R.; Sitaula, B. Soil organic carbon in Serbian Mountain soils: Effects of land use and altitude. J. Environ. Stud. 2011, 4, 977–986. [Google Scholar]
  18. Krug, J.; Koehl, M.; Kownatzki, D. Revaluing unmanaged forests for climate change mitigation. Carbon Balance Manag. 2012, 7, 11. [Google Scholar] [CrossRef]
  19. Obrębska Starkel, B. Climate of Babia Góra range. In Monografia Przyrodnicza, Kraków: Wydawnictwo i Drukarnia Towarzystwa Sowak w Polsce; Wooszyn, B.W., Jaworski, A., Szwagrzyk, J., Eds.; The Nature of the Babiogórski National Park; University of Agriculture in Krakow: Krakow, Poland, 2004. [Google Scholar]
  20. Alexandrowicz, S.W. Outlines of geology of the Babia Góra range. In Krakw: Komitet Ochrony Przyrody PAN, Babiogorski Park Narodowy; Wooszyn, B.W., Jaworski, A., Szwagrzyk, J., Eds.; University of Agriculture in Krakow; The Nature of the Babiogrski National Park; Krakow, Poland, 2004. [Google Scholar]
  21. Kowalska, J.; Kajdas, B.; Zaleski, T. Variability of morphological, physical and chemical properties of soils derived from carbonate-rich parent material in the Pieniny Mountains (south Poland). Soil Sci. Ann. 2017, 68, 27–38. [Google Scholar] [CrossRef] [Green Version]
  22. Grossman, R.B.; Reinsch, T.G. 2.1 Bulk Density and Linear Extensibility. In Methods of Soil Analysis: Part 4 Physical Methods; Dane, J.H., Topp, C.G., Eds.; Soil Science Society of America: Wisconsin, MA, USA, 2002. [Google Scholar]
  23. IPCC. Definitions and Methodological Options to Inventory Emissions from Direct Human-induced Degradation of Forests and Devegetation of Other Vegetation Types. National Greenhouse Gas Inventories Programme. In Encyclopedia of Energy, Natural Resource, and Environmental Economics; Institute for Global Environmental Strategies (IGES) for the IPCC; Kamiyamaguchi Hayama: Kanagawa, Japan, 2003. [Google Scholar]
  24. Muñoz-Rojas, M.; Jordán, A.; Zavala, L.M.; la Rosa, D.D.; Abd-Elmabod, S.K.; Anaya-Romero, M. Organic carbon stocks in Mediterranean soil types under different land uses (Southern Spain). Solid Earth 2012, 3, 375–386. [Google Scholar] [CrossRef] [Green Version]
  25. Weiss, A. Topographic Position and Landforms Analysis Andrew D. Weiss, The Nature Conservancy. In The Nature Conservancy; Northwest Division: Oklahoma City, OK, USA, 2001. [Google Scholar]
  26. Baritz, R.; Seufert, G.; Montanarella, L.; Ranst, E.V. Carbon concentrations and stocks in forest soils of Europe. For. Ecol. Manag. 2010, 260, 262–277. [Google Scholar] [CrossRef]
  27. Jones, R.J.A.; Hiederer, R.; Rusco, E.; Montanarella, L. Estimating organic carbon in the soils of Europe for policy support. Eur. J. Soil Sci. 2005, 56, 655–671. [Google Scholar] [CrossRef] [Green Version]
  28. Vos, B.D.; Cools, N.; Ilvesniemi, H.; Vesterdal, L.; Vanguelova, E.; Carnicelli, S. Benchmark values for forest soil carbon stocks in Europe: Results from a large scale forest soil survey. Geoderma 2015, 251–252, 33–46. [Google Scholar] [CrossRef]
  29. Lugato, E.; Panagos, P.; Bampa, F.; Jones, A.; Montanarella, L. A new baseline of organic carbon stock in European agricultural soils using a modelling approach. Glob. Chang. Biol. 2013, 20, 313–326. [Google Scholar] [CrossRef] [PubMed]
  30. Don, A.; Schumacher, J.; Scherer-Lorenzen, M.; Scholten, T.; Schulze, E.D. Spatial and vertical variation of soil carbon at two grassland sites—Implications for measuring soil carbon stocks. Geoderma 2007, 141, 272–282. [Google Scholar] [CrossRef]
  31. Brjesson, G.; Bolinder, M.A.; Kirchmann, H.; Ktterer, T. Organic carbon stocks in topsoil and subsoil in long-term ley and cereal monoculture rotations. Biol. Fertil. Soils 2018, 54, 549–558. [Google Scholar] [CrossRef] [Green Version]
  32. Marinho, M.A.; Pereira, M.W.; Vázquez, E.V.; Lado, M.; González, A.P. Depth distribution of soil organic carbon in an Oxisol under different land uses: Stratification indices and multifractal analysis. Geoderma 2017, 287, 126–134. [Google Scholar] [CrossRef]
  33. Parras-Alcántara, L.; Lozano-García, B.; Galán-Espejo, A. Soil organic carbon along an altitudinal gradient in the Despeñaperros Natural Park, southern Spain. Solid Earth 2015, 6, 125–134. [Google Scholar] [CrossRef]
  34. Zhu, M.; Feng, Q.; Zhang, M.; Liu, W.; Qin, Y.; Deo, R.C.; Zhang, C. Effects of topography on soil organic carbon stocks in grasslands of a semiarid alpine region, northwestern China. J. Soils Sediment. 2018, 19, 1640–1650. [Google Scholar] [CrossRef]
  35. Chen, L.F.; He, Z.B.; Du, J.; Yang, J.J.; Zhu, X. Patterns and environmental controls of soil organic carbon and total nitrogen in alpine ecosystems of northwestern China. Catena 2016, 137, 37–43. [Google Scholar] [CrossRef]
  36. Kacprzak, A.; Migoń, P.; Musielok, L. Using soils as indicators of past slope instability in forested terrain, Kamienne Mts., SW Poland. Geomorphology 2013, 194, 65–75. [Google Scholar] [CrossRef]
  37. Soucémarianadin, L.N.; Cécillon, L.; Guenet, B.; Chenu, C.; Baudin, F.; Nicolas, M.; Girardin, C.; Barré, P. Environmental factors controlling soil organic carbon stability in French forest soils. Plant Soil 2018, 426, 267–286. [Google Scholar] [CrossRef]
  38. Zhu, M.; Feng, Q.; Qin, Y.; Cao, J.; Li, H.; Zhao, Y. Soil organic carbon as functions of slope aspects and soil depths in a semiarid alpine region of Northwest China. Catena 2017, 152, 94–102. [Google Scholar] [CrossRef]
  39. Fissore, C.; Dalzell, B.J.; Berhe, A.A.; Voegtle, M.; Evans, M.; Wu, A. Influence of topography on soil organic carbon dynamics in a Southern California grassland, USA. Catena 2017, 149, 140–149. [Google Scholar] [CrossRef]
  40. Nie, X.; Yang, L.; Li, F.; Xiong, F.; Li, C.; Zhou, G. Storage, patterns and controls of soil organic carbon in the alpine shrubland in the Three Rivers Source Region on the Qinghai-Tibetan Plateau. Catena 2019, 178, 154–162. [Google Scholar] [CrossRef]
  41. Błońska, E.; Lasota, J.; Gruba, P. Effect of temperate forest tree species on soil dehydrogenase and urease activities in relation to other properties of soil derived from loess and glaciofluvial sand. Ecol. Res. 2016, 31, 655–664. [Google Scholar] [CrossRef] [Green Version]
  42. Slepetiene, A.; Amaleviciute-Volunge, K.; Slepetys, J.; Liaudanskiene, I.; Volungevicius, J. The Status of Pachiterric Histosol Properties as Influenced by Different Land Use. In Peat; InTech: Vilnius, Lithuania, 2018. [Google Scholar] [Green Version]
  43. Jonczak, J.; Parzych, A.; Sobisz, Z. Distribution of carbon and nitrogen forms in Histosols of headwater areas A case study from the valley of the Kamienna Creek (northern Poland). J. Elementol. 2015, 20, 95–105. [Google Scholar] [CrossRef]
  44. Glina, B.; Bogacz, A.; Gulys, M. The effect of long-term forestry drainage on the current state of peatland soils: A case study from the Central Sudetes, SW Poland. Mires Peat 2016, 18, 1–11. [Google Scholar]
  45. Jonczak, J.; Parzych, A.; Sobisz, Z. The content and profile distribution patterns of Cu, Ni and Zn in Histosols of headwater areas in the valley of Kamienna Creek (northern Poland). J. Ecol. Prot. Coastline 2015, 18, 5–13. [Google Scholar]
  46. Selmants, P.C.; Hart, S.C.; Boyle, S.I.; Stark, J.M. Red alder (Alnus rubra) alters community-level soil microbial function in conifer forests of the Pacific Northwest, USA. Soil Biol. Biochem. 2005, 37, 1860–1868. [Google Scholar] [CrossRef]
Figure 1. The study area, Babia Góra National Park in Poland.
Applsci 09 03070 g001
Figure 2. Stratification of stoniness content (%) in the soil profile layers (n = 59). Different letters indicate a significant difference (p < 0.05) between sections of the soil profile according to the Kruskal–Wallis test.
Applsci 09 03070 g002
Figure 3. Stratification of soil organic carbon (SOC) content (g kg 1 ) in soil profiles (n = 59). Different letters indicate a significant difference (p< 0.05) between sections of the soil profile according to the Kruskal–Wallis test.
Applsci 09 03070 g003
Figure 4. Total organic carbon stock in the soils of different forest stands (t ha 1 ) (Alder n = 8; Spruce n = 31; Mixed n = 6; Beech n = 14). Different letters indicate a significant difference (p< 0.05) between the types of forest stands according to the Kruskal–Wallis test.
Applsci 09 03070 g004
Figure 5. Total organic carbon stock (t ha 1 ) in different soil types (CD: dystric cambisols, n = 21; CE: eutric cambisols, n = 16; FL: fluvisols, n = 3; GL: gleysols, n = 4; HI: histosols, n = 6; PO: podzols, n = 6; ST: stagnosols, n = 3). Different letters indicate a significant difference (p< 0.05) between soil types according to the Kruskal–Wallis test.
Applsci 09 03070 g005
Figure 6. Total organic carbon stock (t ha 1 ) in soils created on different parent materials (I: terrace sediment accumulation, n = 3; II: fluvial sediments, n = 15; III: hieroglyphic sandstone, n = 5; IV: Magura sandstone, n = 24; V: osielecki sandstone, n = 6; VI: peat sediments, n = 6). Different letters indicate a significant difference (p< 0.05) between parent material according to the Kruskal–Wallis test.
Applsci 09 03070 g006
Figure 7. Total organic carbon stock (t ha 1 ) at different elevations (>1100 m, n = 5; 900–1100 m, n = 15; <900 m, n = 39). Different letters indicate a significant difference (p< 0.05) between soil types according to the Kruskal–Wallis test.
Applsci 09 03070 g007
Figure 8. Map of total organic carbon stock (t ha 1 ) in soil and the Topography Position Index (TPI).
Applsci 09 03070 g008
Figure 9. Diagram of PCA with the projection of variables on a plane of the first and second factor for total soil organic carbon stock (T-SOCstock). CD: dystric cambisols; CE: eutric cambisols; FL: fuvisols; GL: gleysols; HI: histosols; PO: podzols; ST: stagnosols.
Applsci 09 03070 g009
Figure 10. Dendrogram with group identified in the cluster analysis. The altitude, slope, Total SOCstock and type of forest stands were used for diagram preparation (plots number plus symbol of different soil types, CD—dystric cambisols, CE—eutric cambisols, FL—fuvisols, GL—gleysols, HI—histosols, PO—podzols, ST—stagnosols).
Applsci 09 03070 g010
Table 1. The basic properties of the studied soils (n = 59).
VariableMeanSDMinimumMaximum
sand4416.71182
silt4111.51265
clay158.9177
pH H2O50.93.18.1
pH KCl3.980.812.57
SOC99.0118.04.0422.0
N5.06.01.029.0
C/N17.157.638.9
Na1.32.10.218.8
Ca136.5261.30.51771.6
Mg13.920.60.2130.6
K1211.21.158.6
BD1.10.40.11.4
Bulk density (BD) is expressed in g cm 3 ; Na, Ca, Mg, and K contents are expressed in mg 100 g; Sand, silt, and clay content are expressed as %; soil organic carbon (SOC) and nitrogen (N) content are expressed in g kg 1 . Standard deviation (SD)
Table 2. Summary of GLM analysis with “sequential” sum of squares (Type I) for the total soil organic carbon stock.
CharacteristicsT-SOCstock
Fp value
Altitude1.550.222
Soil type9.96<0.001
Type of forest stand0.260.614
Altitude*Soil type6.88<0.001
Altitude*Type of forest stand0.780.513
Soil type*Type of forest stand0.290.593
Soil type*Type of forest stand*Altitude6.67<0.001
General Linear Model (GLM), Significant effects (p < 0.05) are in bold.

