1. Introduction
The necessary forensic analysis after an earthquake to implement seismic mitigation strategies in cities is quite complex. To begin with, there are many variables and uncertainties that center around the evaluation process (number of victims, location and amount of damage, characteristics of the seismological phenomenon, presence of attenuating or amplifying local factors, influence of urban and building design, etc.) [
1]. These variables tend to belong to different fields of knowledge, such as structural dynamics [
2], earthquake engineering [
3], geotechnics and geology [
4], seismology [
5], or even the urban configuration of cities [
6].
On many occasions, this situation requires addressing clearly multidisciplinary problems, such as the forensic analysis of building damage levels resulting from the earthquake in the whole city, using approaches subjected to the limitations of each field of knowledge [
7]. Some methodological perspectives are able to combine two or even three different disciplines in a single analysis to find possible correlations among them (soil–structure interaction [
8], building design combined with seismology [
9], building design combined with material resistance [
10], building design combined with seismology and urban configuration [
11], etc.). However, we can rarely find a post-earthquake forensic analysis capable of responding comprehensively to all of the effects observed in a city in the aftermath of an earthquake.
In addition to this we must add the inherent difficulty in obtaining reliable forensic data in the field and in sufficient quantity to enable an analysis to be carried out with all of the guarantees. It is important to keep in mind that normally the highest priorities in the first hours and days after a seismic event consist of helping the victims, safeguarding the rest of the citizens, avoiding major damage from possible aftershocks, and starting the reorganization work as soon as possible to try to recover normality in the city [
12]. This goes, to some extent, against the scientific interest in obtaining invaluable information that occurs during this period when we are able to analyze damage and its characteristics in order to implement optimal strategies to mitigate risks against future seismic events.
One of the main difficulties that we find when developing truly effective strategies to mitigate seismic risks in cities is the need to prioritize the importance of the phenomena derived from an earthquake. On many occasions we find that the studies carried out on the effects of an earthquake in a city offer partial views on the measures to be adopted, since all of them tend to focus the problem within the exclusive scope of their scientific discipline (structure dynamics, foundation construction and geotechnics, geology, urban planning, seismology, etc.). This makes it rather difficult to implement balanced seismic mitigation strategies based on the post-earthquake knowledge in many studies that are carried out, because it is not possible to perform a priori evaluation objectively if the damage occurred in the buildings of a city is more so the consequence of poor structural design, an incorrect urban and architectural configuration, or the absence of foundations that take into account the seismic variable of soil geology.
In this context, the implementation of a geostatistical approach could be very interesting for this field of research, since it allows the spatial statistical correlation between different factors that have no obvious theoretical relation to each other to be evaluated [
13]. In a context in which previous studies have highlighted the influence of various heterogeneous variables to explain the origins and consequences of a seismic event, this methodological approach can prove to be of great interest to reliably assess and develop effective measures for a seismic mitigation strategy. It is, therefore, an approach not used thus far in the post-earthquake diagnosis of cities and also benefits greatly from the major development experienced in recent years by GIS (Geographic Information System) analysis computer programs, which today enable the implementation of accurate analysis tools that were not available just a few years ago.
In this article, the geostatistical approach will be put into practice with the assessment of the Lorca earthquake that occurred in Lorca, Spain, on May 11, 2011. This earthquake has been analyzed from different points of view in recent years [
11], giving answers to questions such as the influence of the geology of the area on the earthquake [
14], the impact of the shallow focal depth [
15], or the effect of some factors related to the configuration of the urban plot and building design [
16]. This situation has given rise to numerous theories regarding the causes of the major damage from the earthquake, although none of these theories has enabled the development of a comprehensive risk mitigation strategy in the city.
The geostatistical approach will spatially determine the existing correlation between variables of different fields of knowledge and the damage detected. The analysis through different statistical tools and GIS indicators will help us to rank the importance of each one of the different phenomena detected in 2011 in the post-earthquake scenario of the city.
2. Materials and Methods
2.1. Area of Study and Main Characteristics of Lorca, 2011 Earthquake
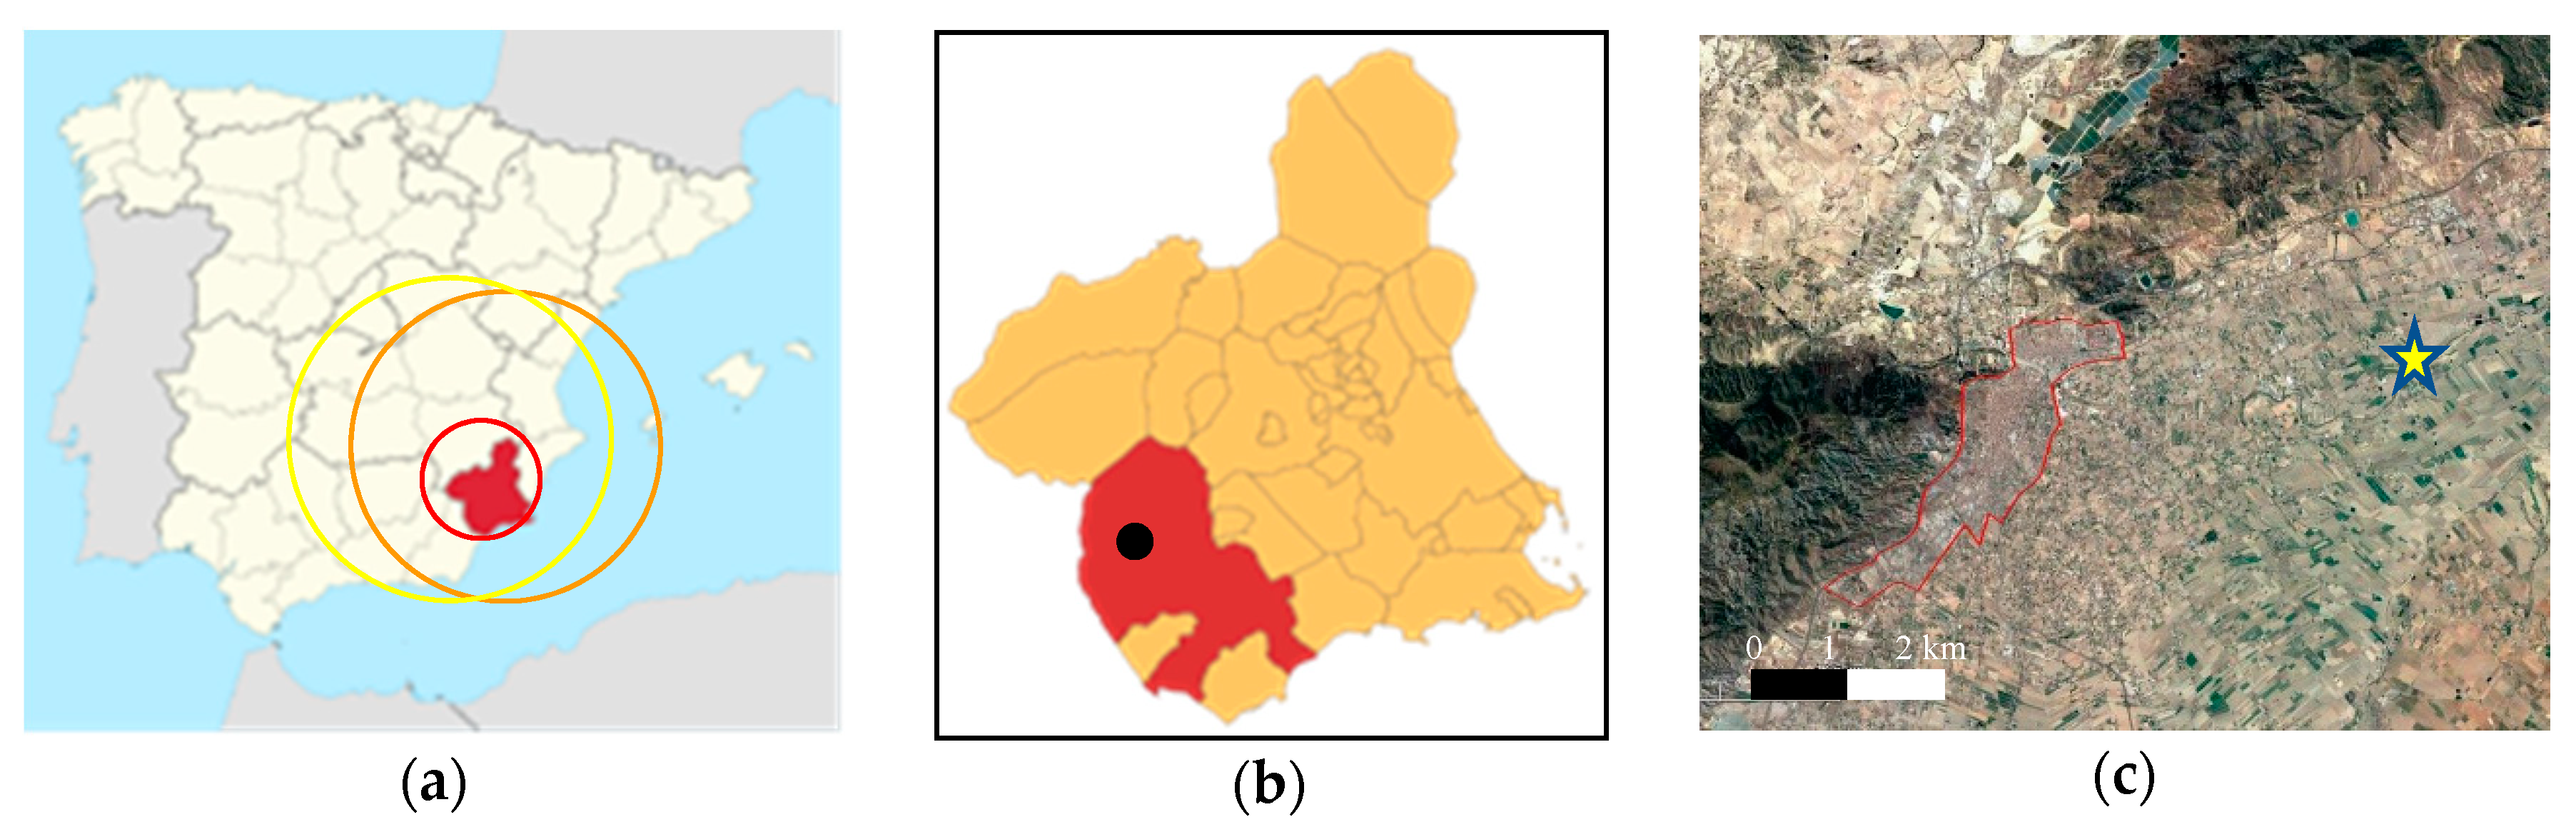
The Lorca earthquake on May 11, 2011, had a magnitude of 5.1 on the moment magnitude scale. It was preceded two hours earlier by a premonitory earthquake of 4.5 M
w. The earthquake was also felt in neighboring regions and other parts of the country, but at very low intensity levels (
Figure 1). Multiple aftershocks occurred in the hours following the shock at 16:47, with that of the largest magnitude occurring at 22:37 local time, measured at 3.9 on the moment magnitude scale.
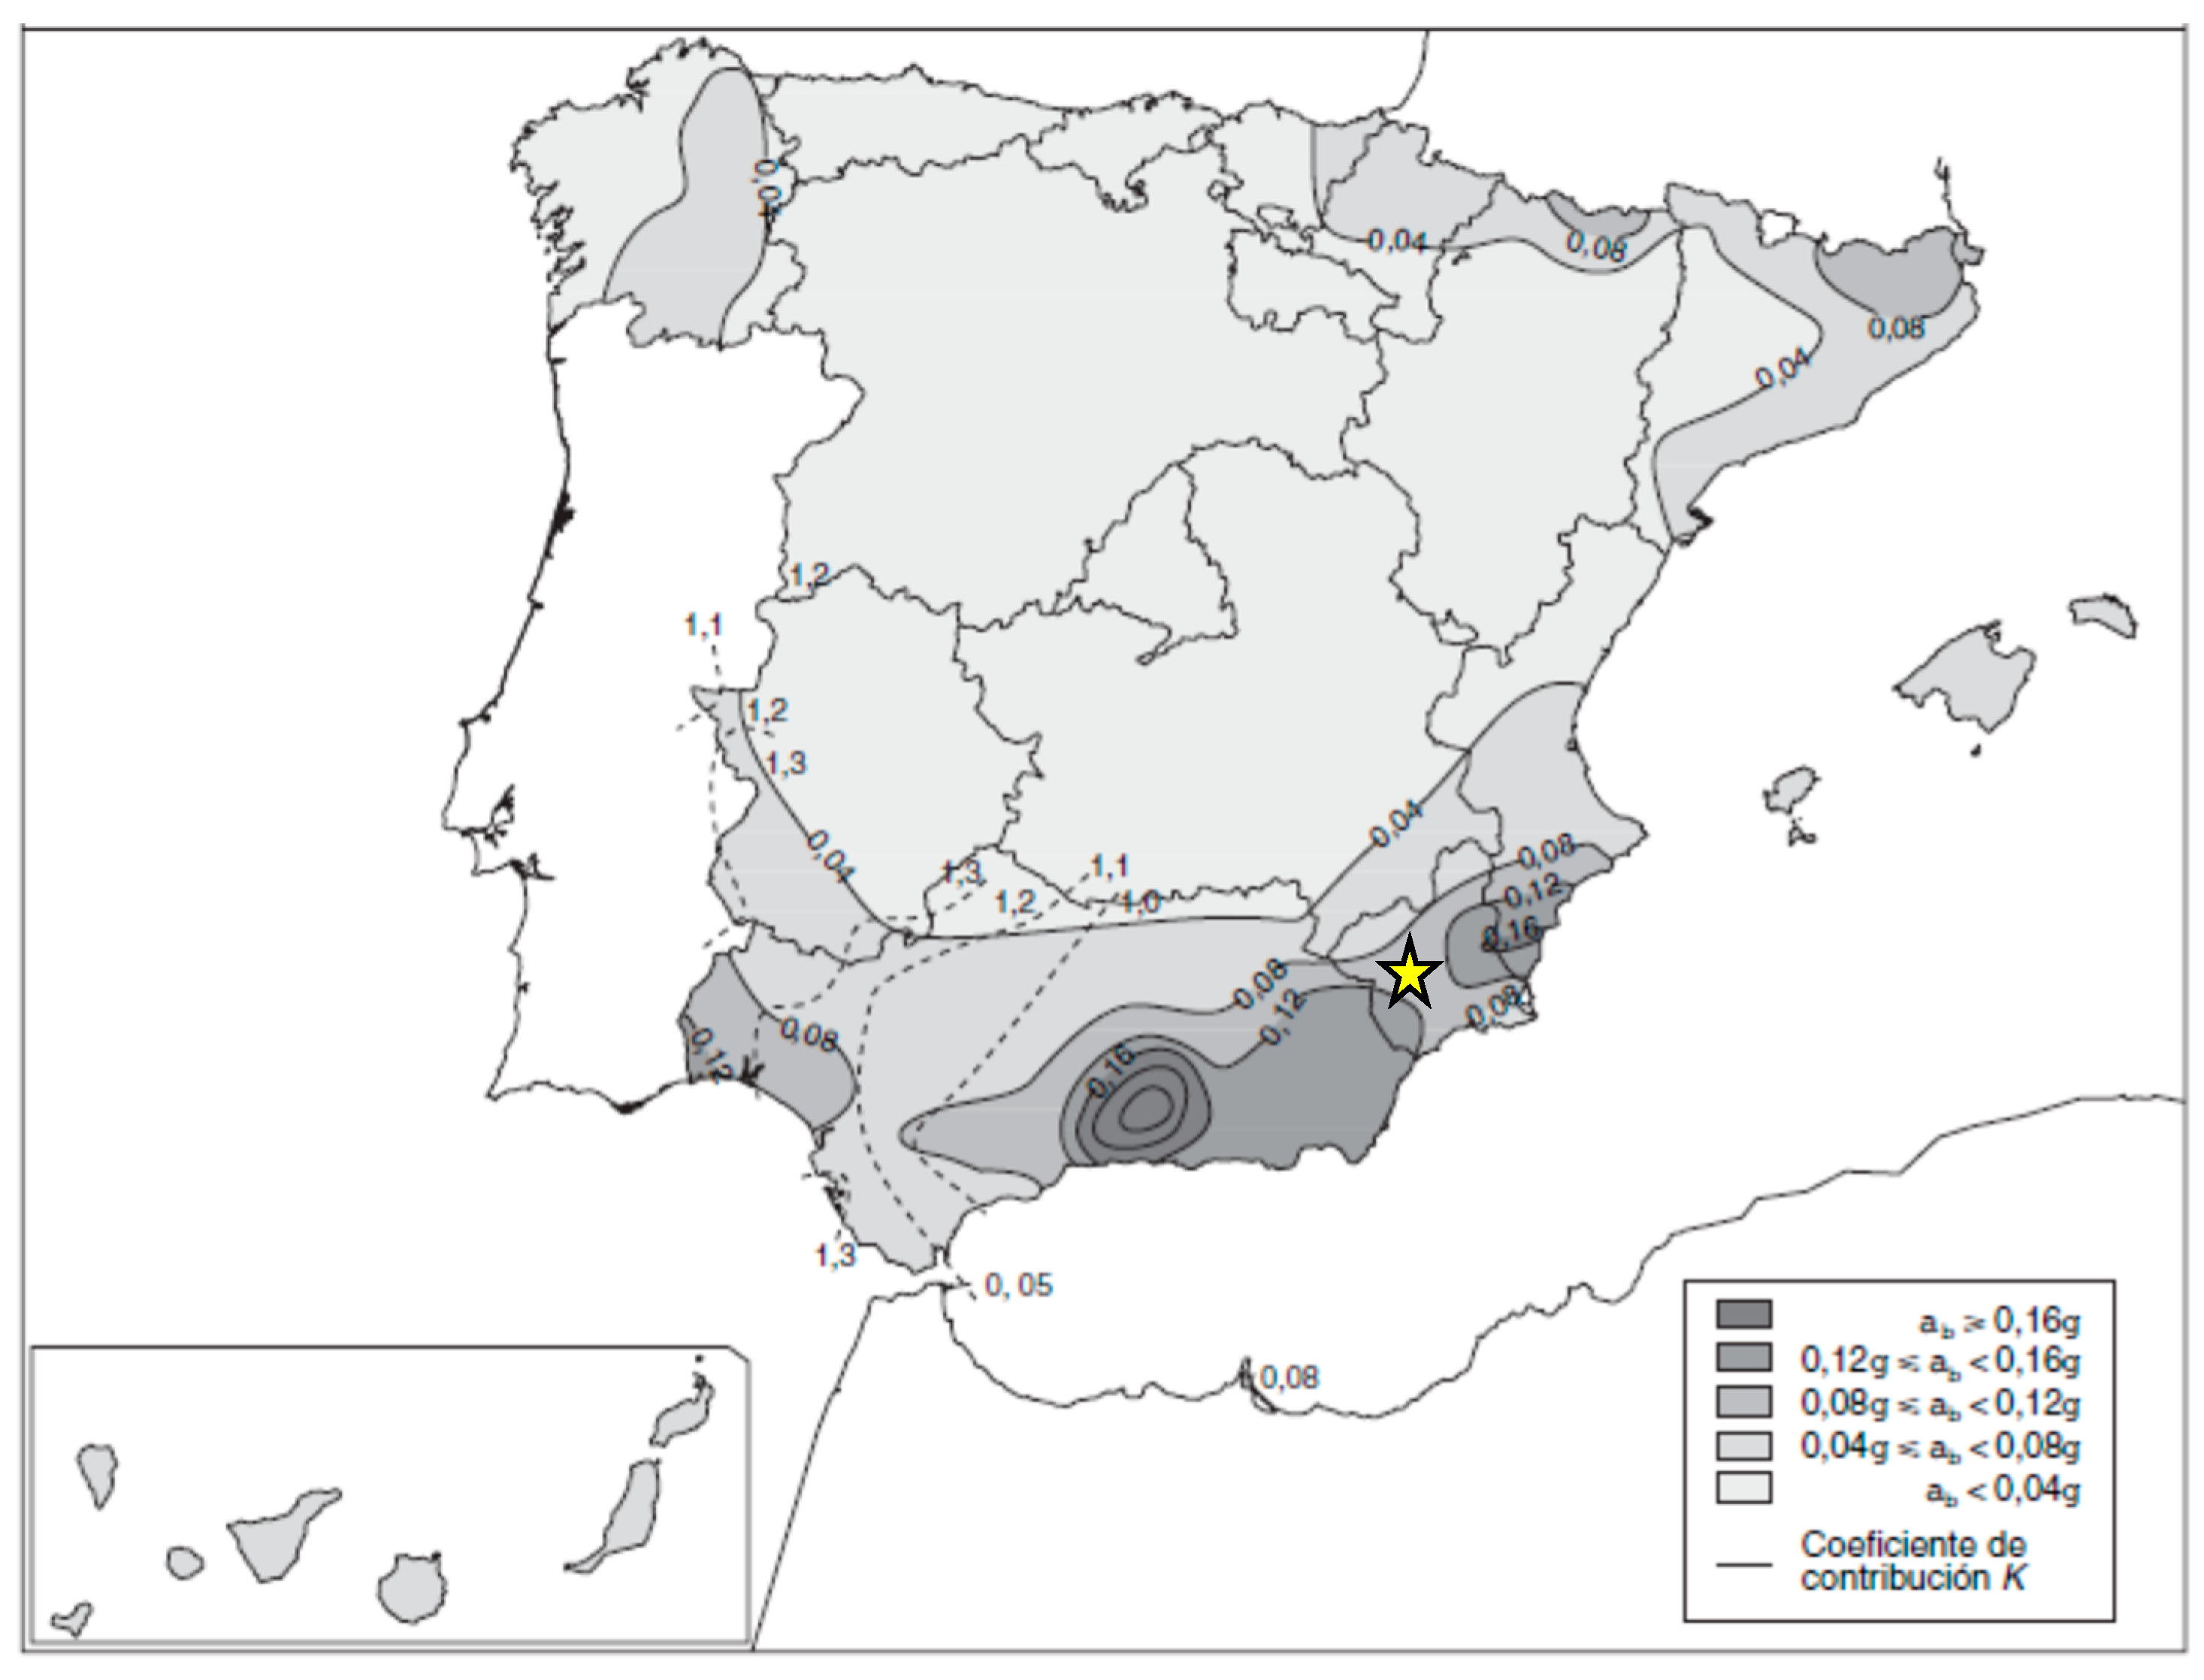
The southeastern region where Lorca lies is theoretically one of the most active seismic zones in Spain. Nevertheless, the Lorca urban area basic acceleration (parameter defined in the Spanish seismic standard NCSE-02 as the characteristic value of the horizontal ground acceleration, with 10% exceedance probability in 50 years) of 0.12 g in the Spanish standard [
17] is not among the most dangerous areas (
Figure 2).
The main earthquake occurred on land approximately 2 km northeast of the town of Lorca. Its hypocenter was quite shallow (about 1000 m depth). The area is located on the plate boundary between the Eurasian plate and the African plate. However, most of the earthquakes in the region do not often reach perceptible magnitudes, and therefore are not usually felt. It has been estimated that the earthquake was a direct result of a strike-slip fault close to another major fault, the “Alhama de Murcia” one. This fault is a very shallow line, which extends from 40 to 50 km, of which local specialists noted the presence of rupture surfaces in the vicinity [
18].
The earthquake in Lorca aroused the interest of many regional and national experts in the field and the entire local technical staff who came as volunteers to carry out damage assessment, supervision of buildings, realization of public and private reports, etc. This allowed a detailed and reliable multidisciplinary technical database to be obtained on a large scale, with geolocated information and homogeneous analysis codes, thanks to the coordination of public administrations. The geostatistical analysis has the ideal boundary conditions to be applied here, since it will take advantage of the large amount of technical geolocated information available and the existence of various previous studies from different fields of knowledge.
Despite its low intensity and its short duration (
t = 2 s), the consequences of the earthquake were controversial due to the high number of fatalities (9 dead and 324 injured) and material damage (more than 1000 houses demolished and €1.2 billion estimated for complete reconstruction of the city [
6]). This aspect has generated numerous theories (some of which have appeared in scientific articles) in recent years on what the main causes of the earthquake damage were and which priority measures should be adopted. Several theories pointed to the importance of the age of the buildings, due to the lack of adaptation of their structures to the current seismic regulations, while others emphasized the erroneous architectural configuration of many of them in the face of an earthquake [
15,
18]. Some more recent studies have underlined the effect of the urban configuration of the city [
9,
19]; one article even assures that this variable, added to the geologic configuration of the ground and other seismological variables, generated a phenomenon of directivity that remarkably increased the damage [
20]. All these analyses have been taken as the basis to configure the following GIS indicators.
2.2. Post-Earthquake Indicators
In order to analyze possible spatial correlations between the detected phenomena pointed out by previous studies and the different levels of damage in buildings pointed out by technicians who evaluated the buildings, several GIS indicators have been created. These indicators have been chosen based on the observed frequency and importance of the different phenomena described in scientific publications consulted about the Lorca earthquake for various fields of knowledge during the 2012–2018 period. We have thus obtained seven different main indicators from different fields of research—two of a structural type, one of a geological-geotechnical type, one of the urban planning field, one related to architectural design of the building, one related to the age of the buildings, and finally the last one aggregating the main seismological factors. The indicators implemented in the model are detailed below.
2.2.1. Soft Story Phenomena in the Configuration of Buildings ()
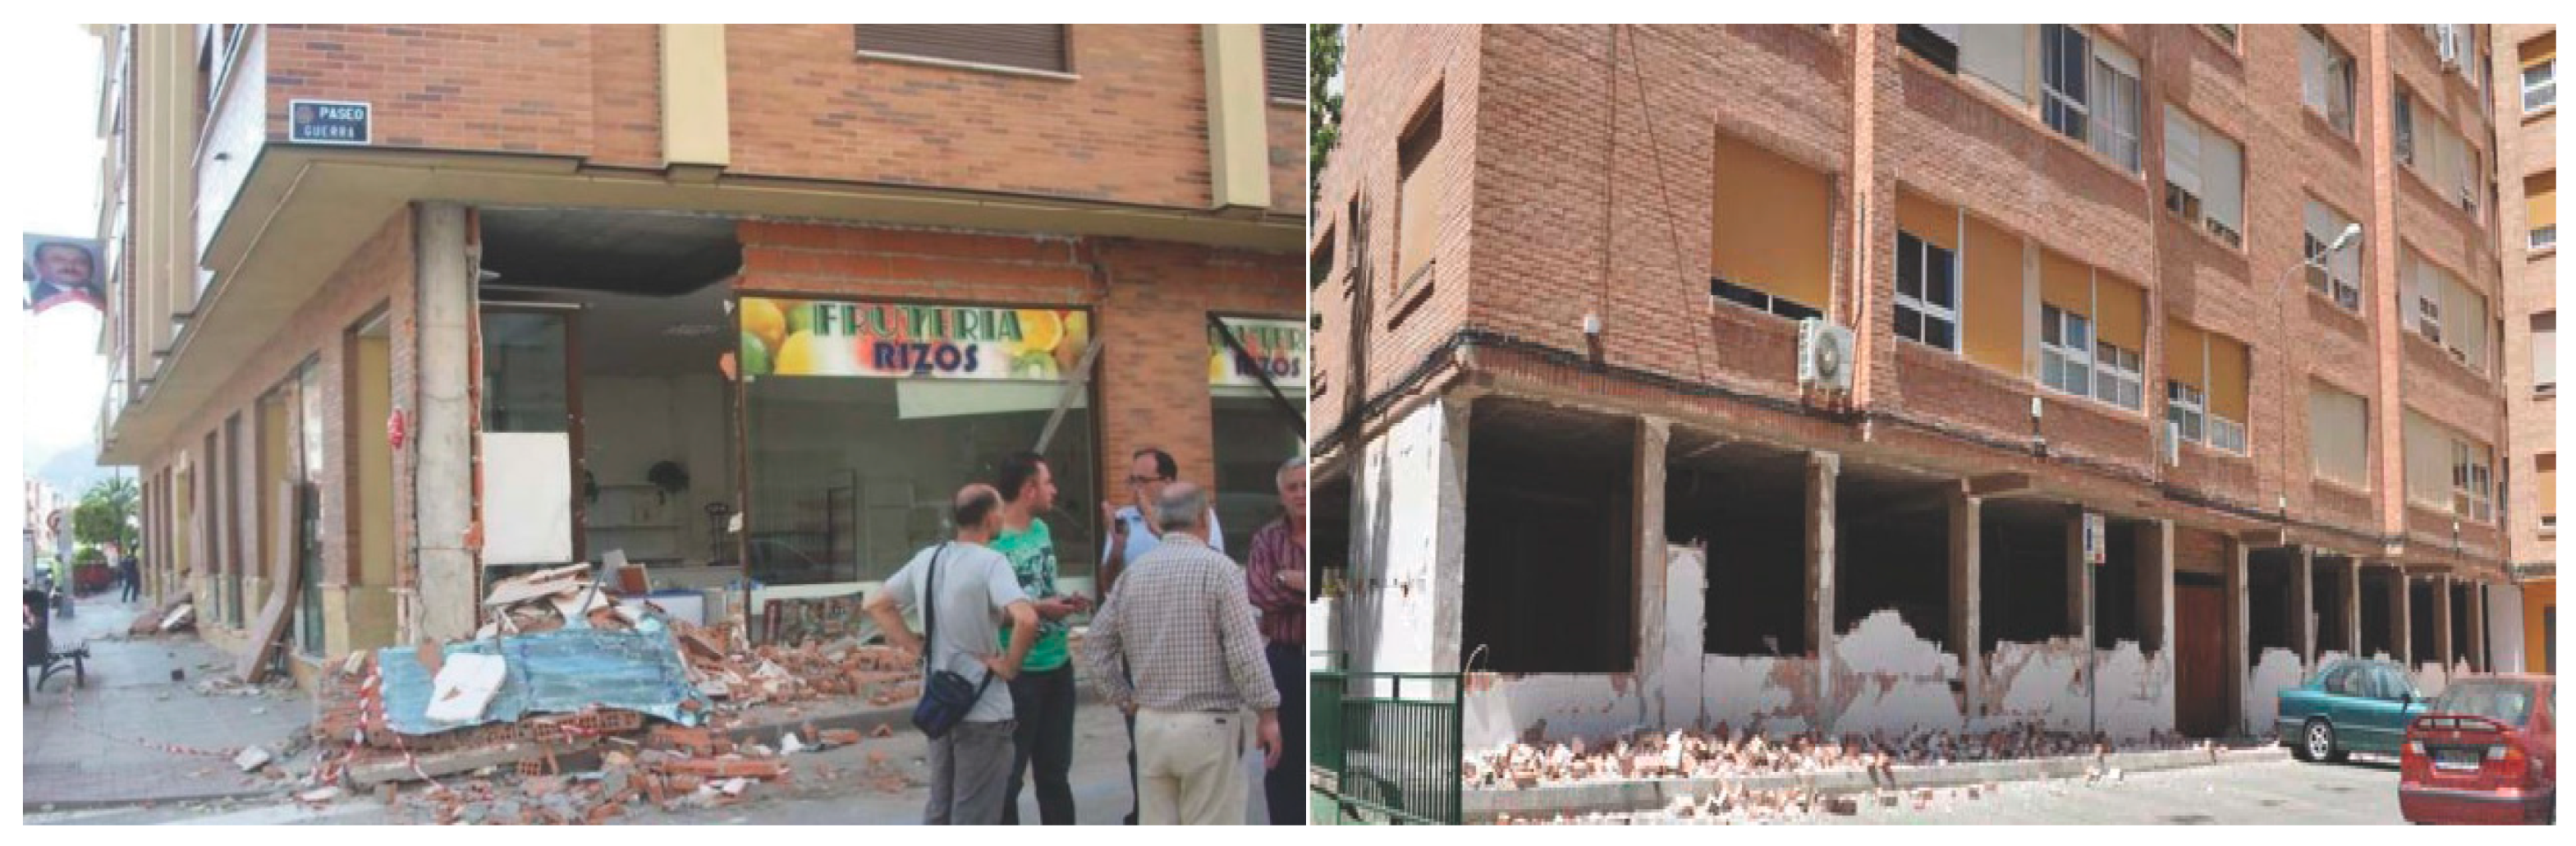
One of the most commonly detected phenomena in the Lorca earthquake was that of the buildings that suffered the so-called “soft story” effect [
21]. In these cases, a non-regular distribution of masses could be found between the lower ground floor, which was of greater height and less compartmentalized than the rest of the floors due to the commercial use of the first one. This generates an affect at a structural level in buildings of medium height, where in the example of a 5-story building, the first to fourth floors behave as a rigid object that hardly suffers damage, while the damage is concentrated in the lower ground floor of the building (
Figure 3).
To assess the existence of soft story phenomena, the Index of soft stories (ISS) indicator will spatially indicate the places where buildings clearly damaged by soft story phenomena have been found. Clear phenomena are those in which the buildings suffered significant damage to the ground floor, while the upper floors showed no visible external damage.
where
F(
x,
y) represents the area of buildings affected by soft story phenomena;
g is a parameter that represents the level of intensity of the phenomena for each building (three levels of intensity of the phenomenon were implemented in the distribution of GIS buildings database:
t = 0.5 for partial damage associated with soft story phenomena,
t = 0.75 to damage detected in buildings not exclusively associated with soft story phenomena, and
t = 1 to clear situations where buildings were damaged only due to soft story phenomena); and
H(
x,
y) is the total area analyzed for a homogenous sector.
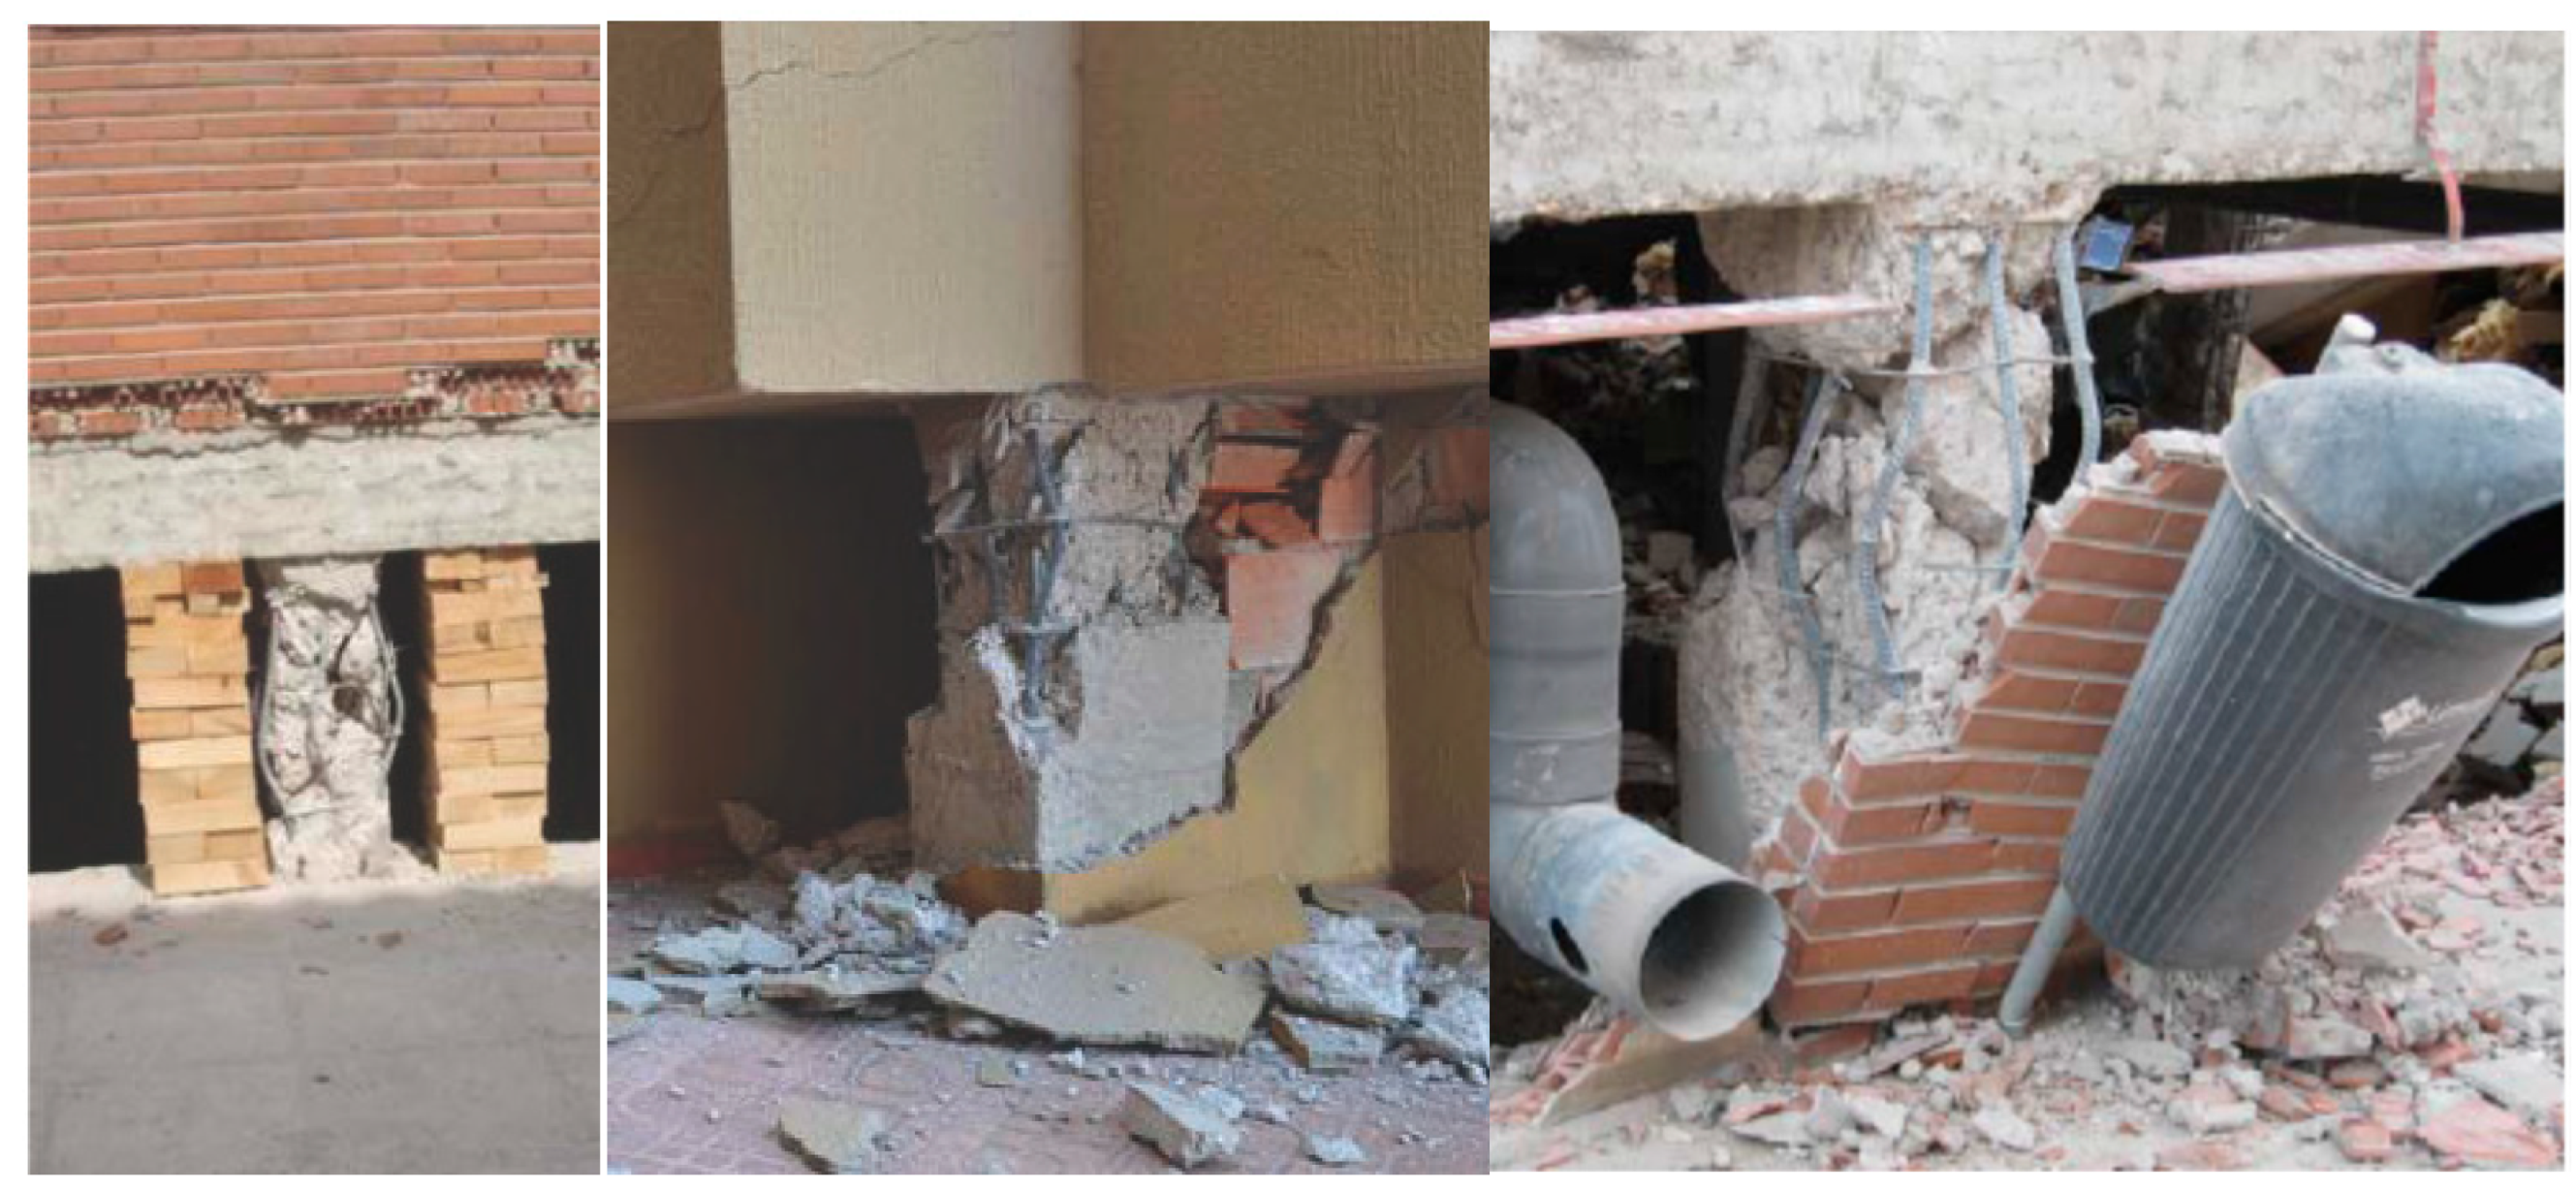
2.2.2. Existence of Short Columns in Buildings ()
Another of the structural phenomena that were particularly relevant at the scientific level in the Lorca earthquake was the case of so-called “short columns”. This structural configuration produced important damage, and according to the opinion of several authors, led to the immediate or later forced collapse or demolition of several buildings (
Figure 4).
The analysis of this phenomenon has been carried out in two ways. On the one hand, from a numerical point of view, the geolocated and discretized database of buildings that had short columns was analyzed individually. On the other hand, from a spatial point of view, the whole of the city has been discretized in homogenous areas by analyzing the levels of density of the point cloud of the number of individual short columns in each area. The application of both methodologies will be explained in greater detail later in the statistical tools section and in the results section.
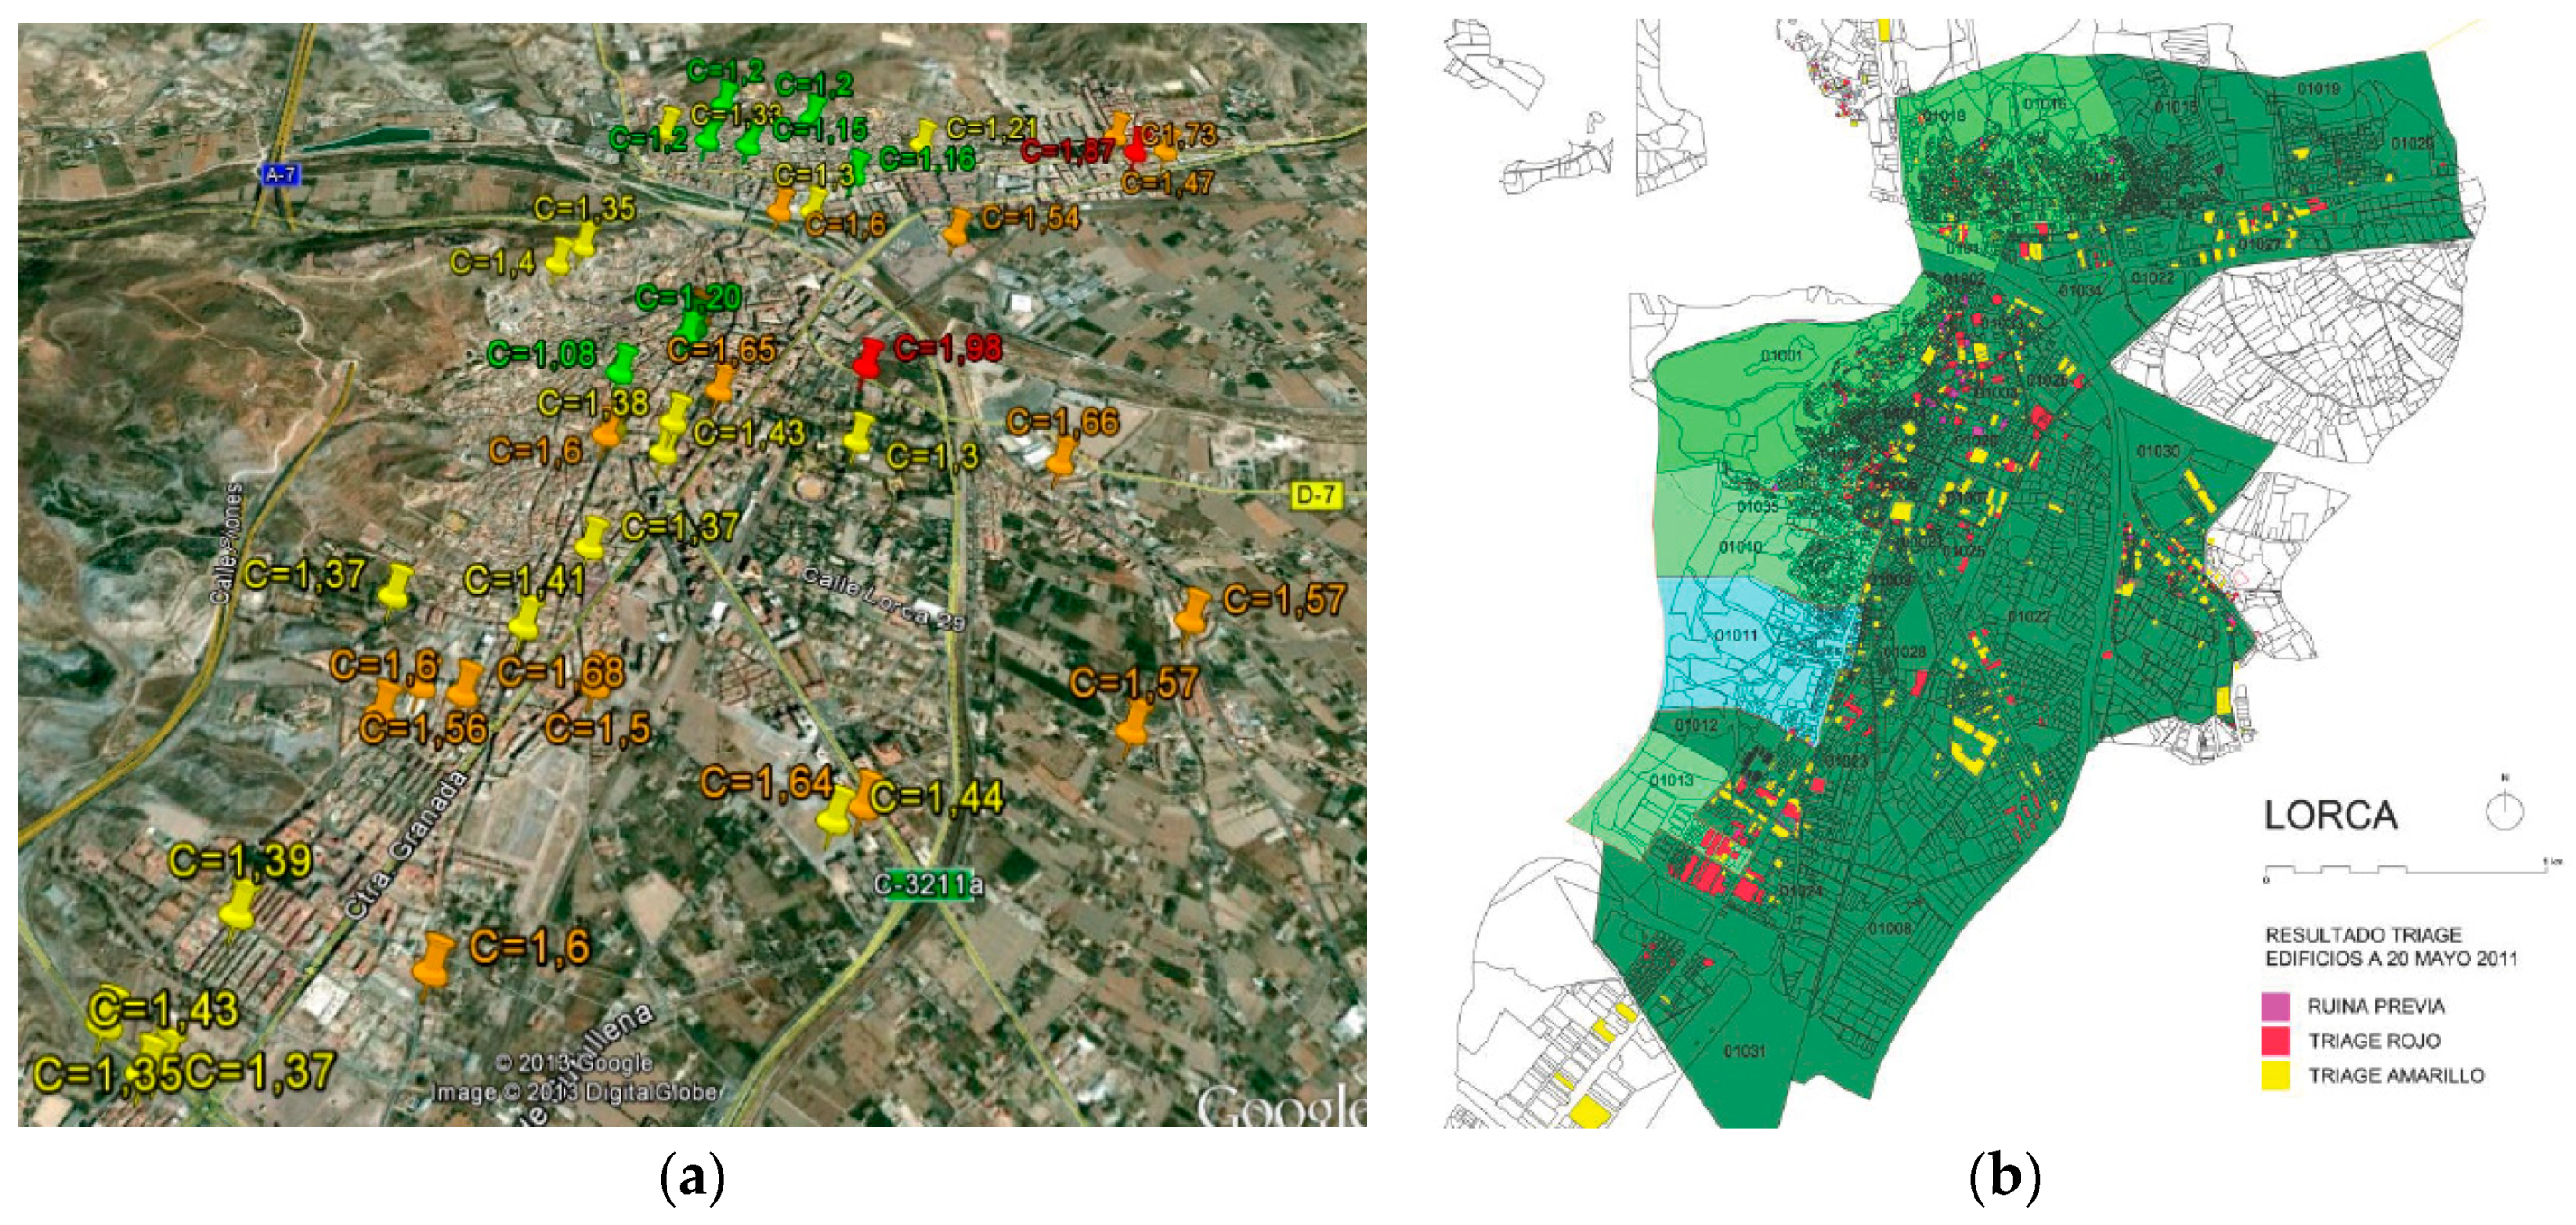
2.2.3. Existence of Soils with High Amplification Capacity of Seismic Waves ()
The capacity of the soil of the city of Lorca to amplify or reduce the seismic waves according to their geotechnical or geological nature has also been the object of some study. Regarding this aspect, soil analysis has been addressed from different approaches. In this case, the conformation of zones of soil with homogeneous characteristics in influencing the effects of the earthquake has been approached, taking into account two parameters contained in the Spanish Earthquake Resistant Norm [
17]. The first is the so-called terrain amplification coefficient, whose value is expressed as a function of parameter C (
Figure 5a). This parameter varies at a very local scale depending on the geotechnical characteristics of the terrain, so it is discretized in the database with spatial-level point values. The second is the terrain classification coefficient that establishes four categories (I–IV) as a function of the propagation velocity of the shear elastic waves (
Figure 5b). This second parameter of a more geological character varies on a larger scale, spatially generating larger homogeneous contours. Since both coefficients have a certain correlation when obtaining them, it has been possible to form a spatial Index of Soil Amplification Capacity (
ISAC) that assesses the effect of the soil on earthquake damage. This indicator has been made from the weighted average convolution geo-process of both parameters:
where
P is the discrete average value of the parameter for a homogenous area, taking into account the point cloud of values existing in this area;
U is the function that models the weighted surface in each homogenous sector of the soil, taking into account the four different categories from [
17]; and
H(
x,
y) is the total area analyzed for a homogenous sector.
2.2.4. Inadequate Urban Configurations of the Buildings ()
One of the causes that some authors [
6,
9] have pointed out as a possible reason for the excessive level of damage suffered, despite the earthquake being of only moderate intensity in a city with theoretically well-constructed buildings, is the urban variable. The urban configuration of the city of Lorca has several singularities. On the one hand, it has a topography crossed diagonally by the wadi that channels the river, which generates significant slopes. In addition, the urban growth of part of the city around the skirt of the mountain that houses the old medieval castle generates an orography with unevenness in almost all of the streets. On the other hand, urban growth structured primarily longitudinally favors, in the opinion of other authors [
20], the phenomenon of directivity (a factor that had not been analyzed systematically in events of less than 6.5 on the Richter scale). This could have increased the level of damage, as the seismic wave may have propagated in the densely built-up area of the urban plot. In this context, the strong presence of unevenness in the streets and the scarcity of seismic joints between buildings could have produced accentuated pounding phenomena between building slabs or even slabs and columns (
Figure 6).
In the same way as the indicator of short columns, this indicator has been analyzed in two ways to evaluate its behavior at a spatial level. On the one hand, the number of buildings whose separation did not meet the levels of separation of seismic joints required in previous work [
17] has been evaluated discretely. On the other hand, the streets and buildings whose slopes and orographic and geometrical conditions violate some of the urbanistic recommendations established have been evaluated at a spatial level in previous work [
6,
9,
11,
12]. The spatial intensity value of the aggregate mean value of both parameters has been modeled with the ArcGIS density geo-process.
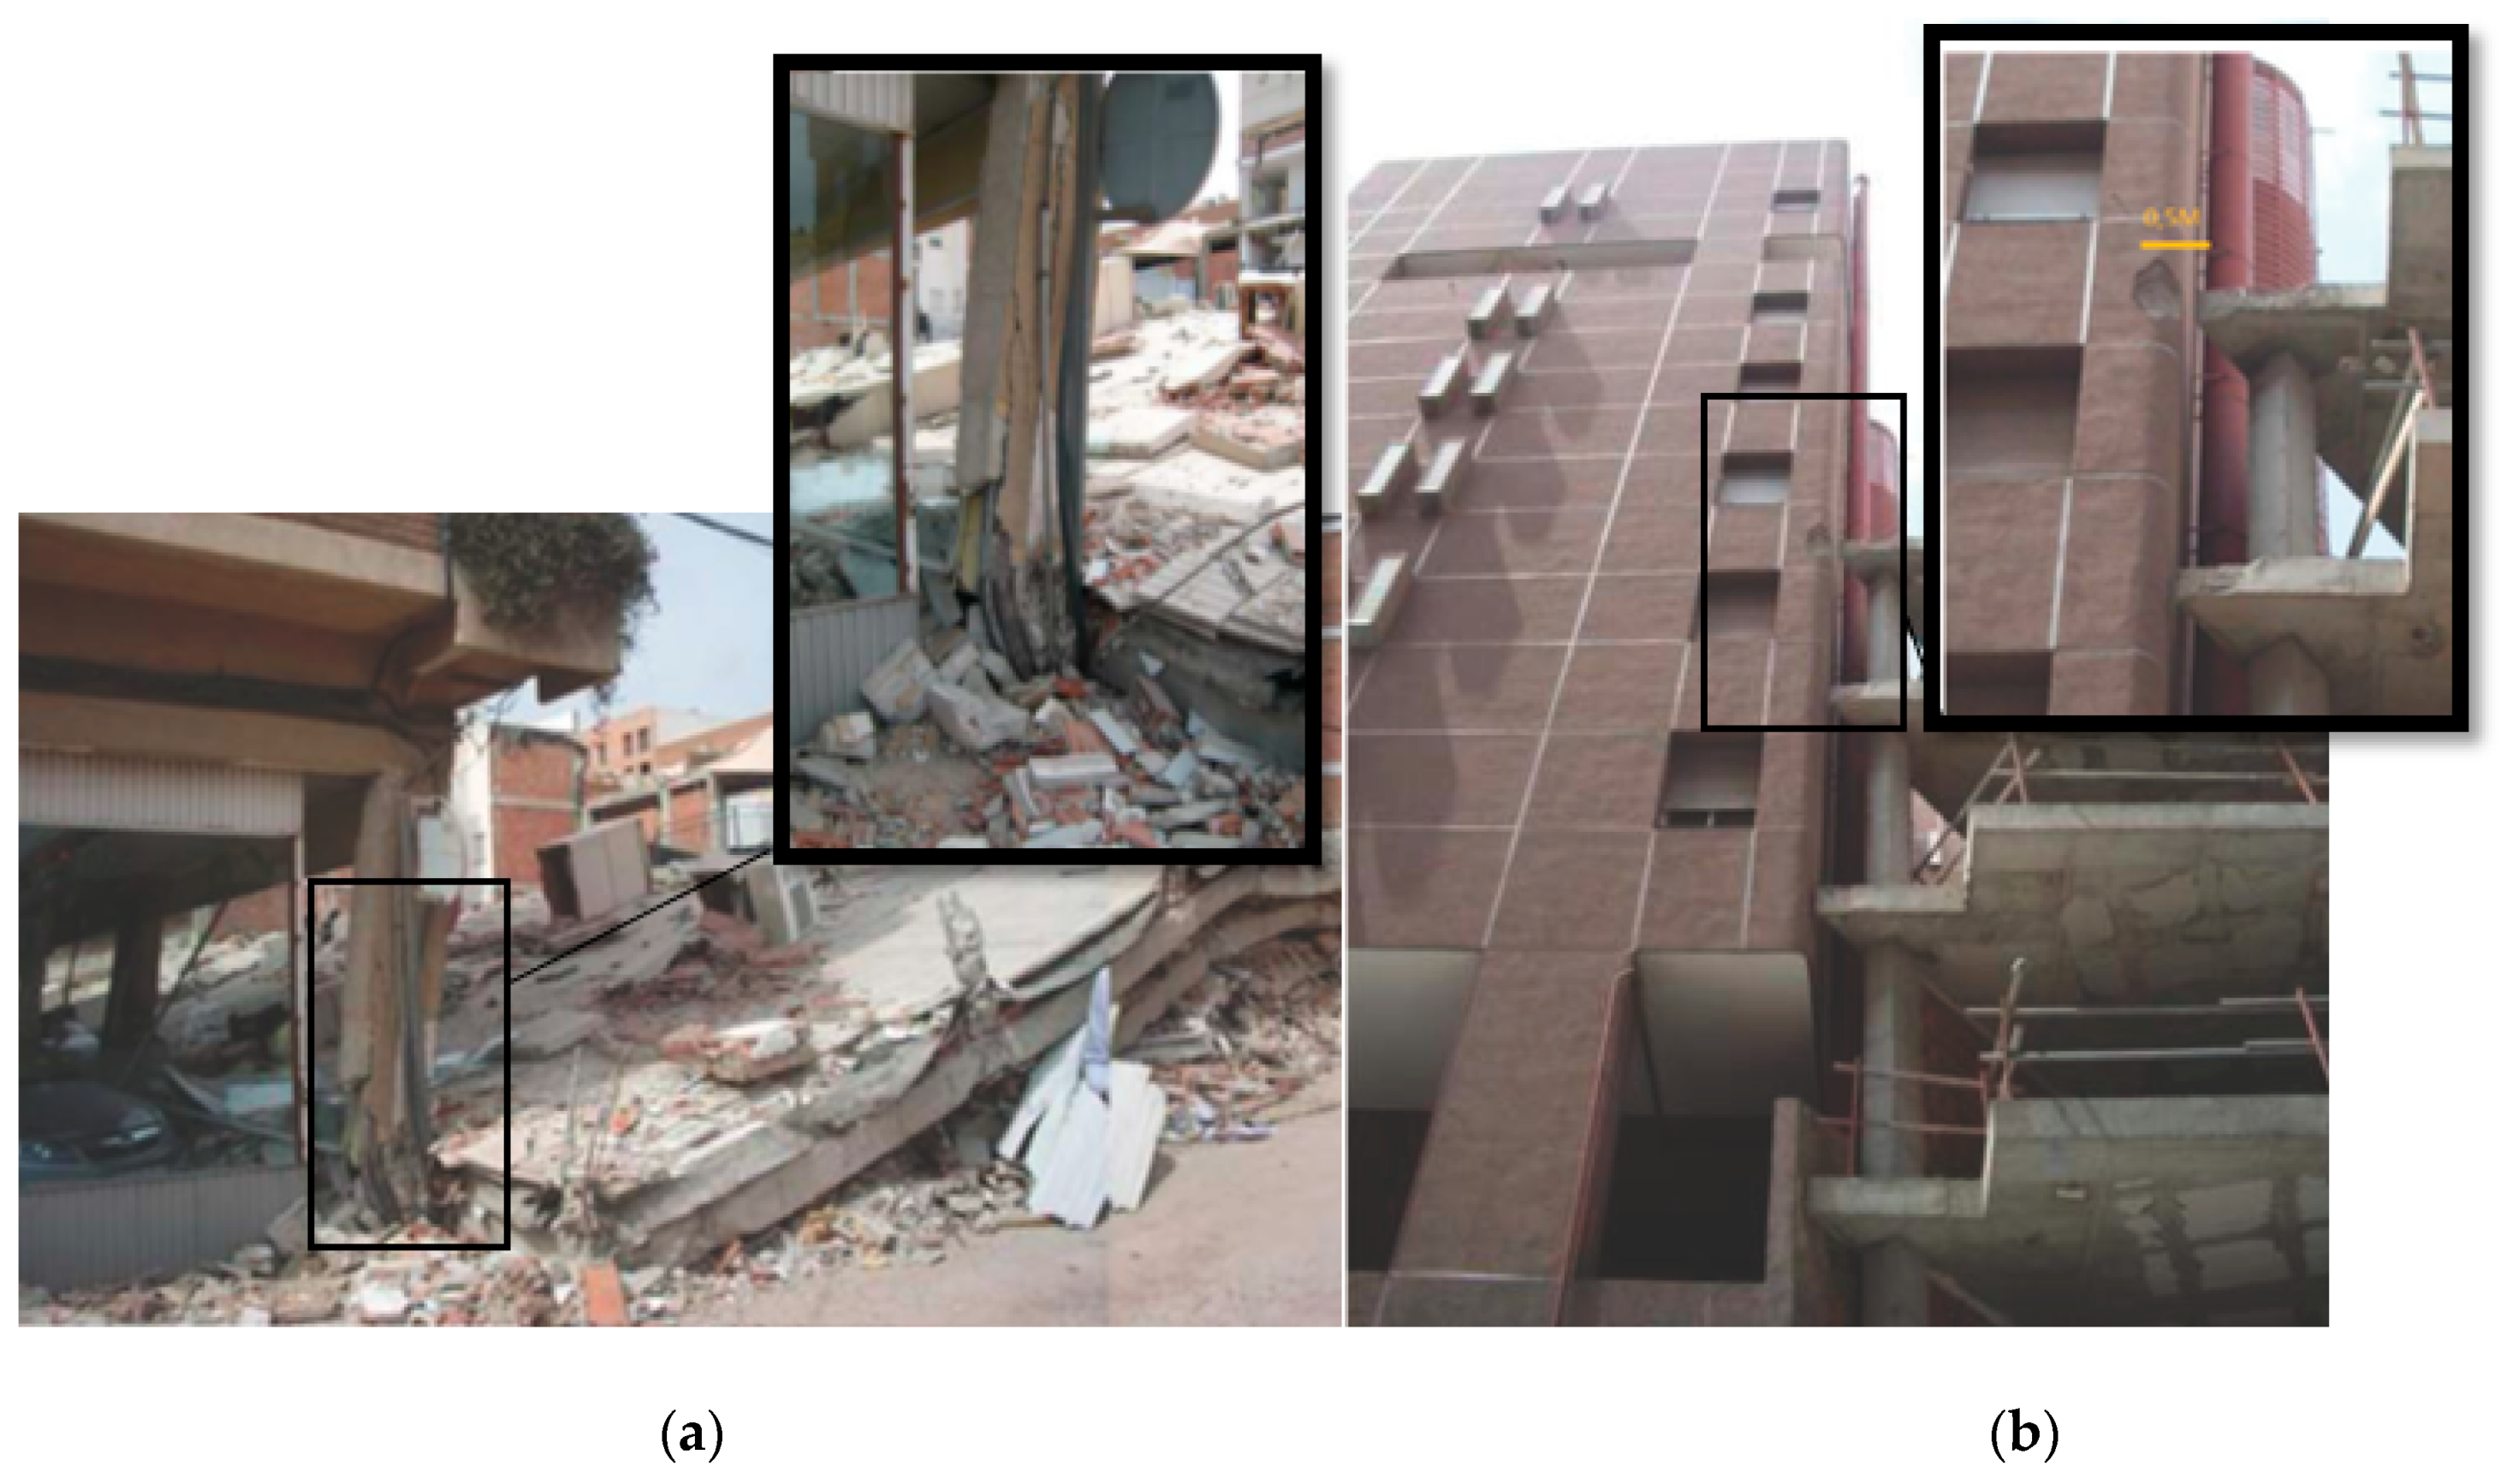
2.2.5. Inadequate Seismic Design in the Architectural Configuration of Buildings ()
The inadequate architectural design of the buildings facing the earthquake had a strong relationship with the unexpected level of damage in the opinion of several authors [
19]. The seismic vulnerability of the set of buildings in a city can be analyzed in different ways [
23,
24,
25,
26]. Its added value is usually the sum of various subparameters related to the architectural configuration of the building. One of these subparameters is usually the existence of long unbraced parapets on the roofs of buildings for example. These elements directly caused several of the earthquake casualties (
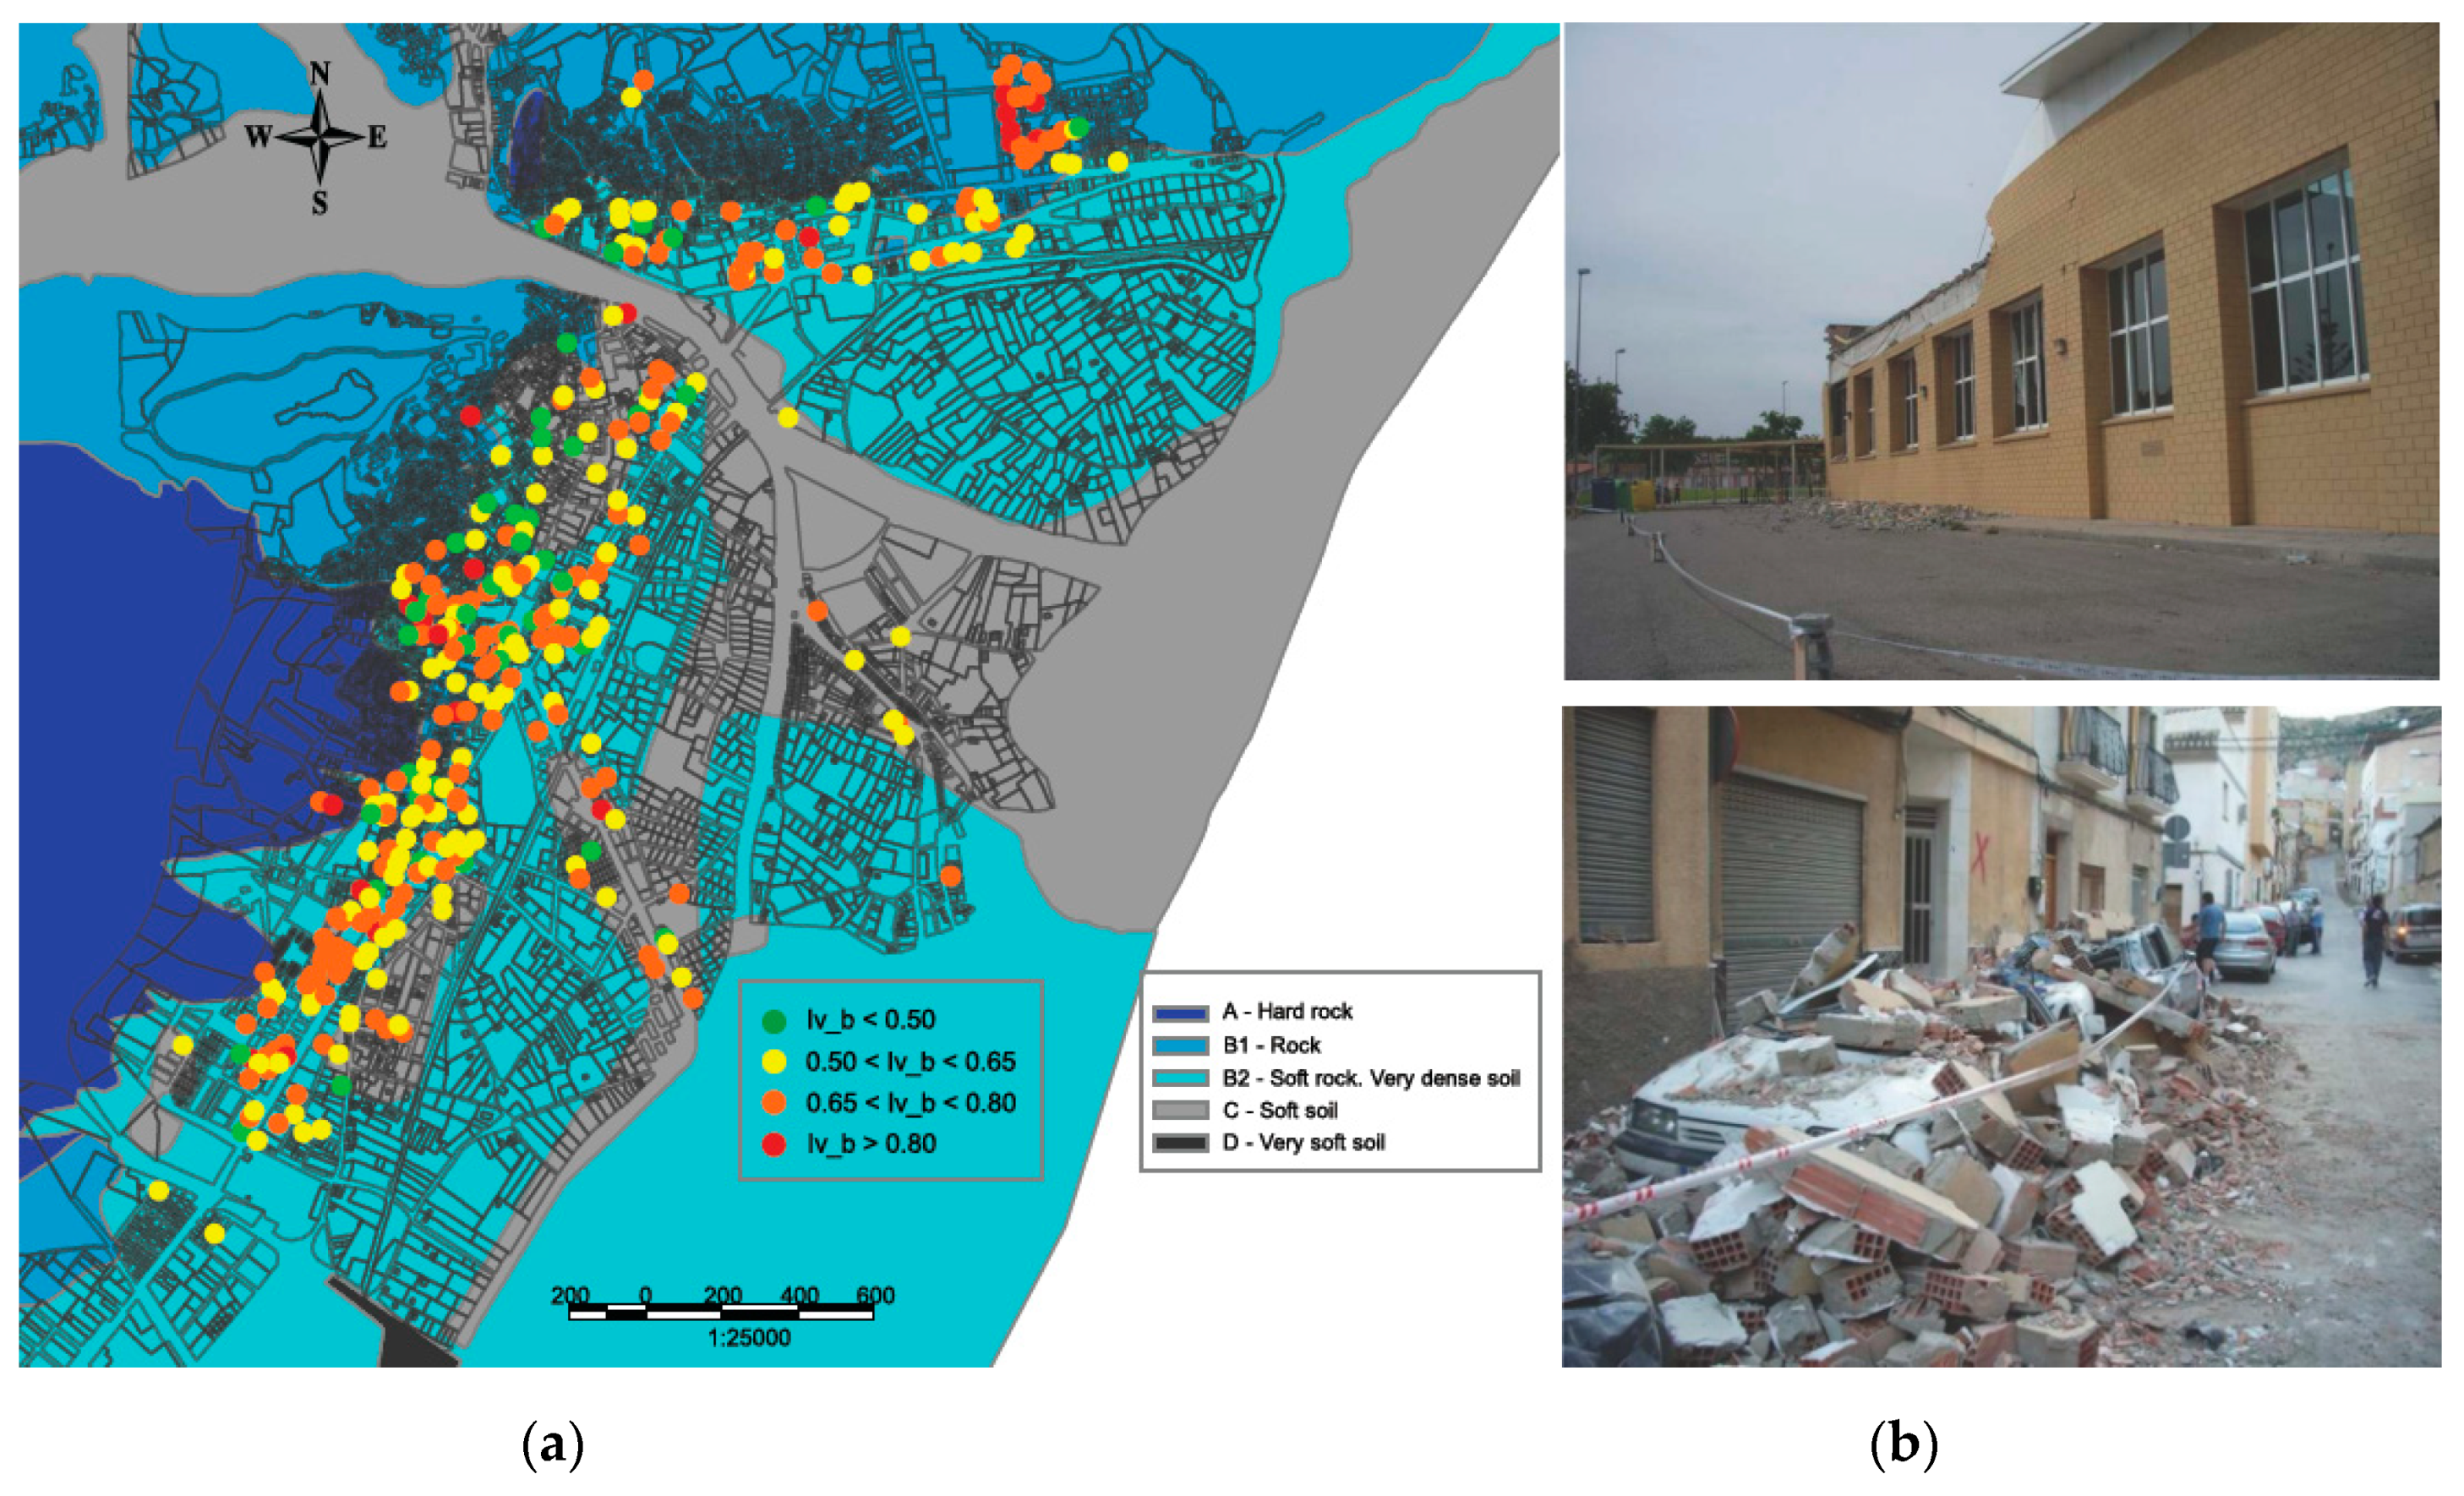
Figure 7). In this case, the spatial distribution of inadequate seismic design in the architectural configuration of buildings (
IIARSD) will be assessed from the perspective of the vulnerability index from the Risk-UE project [
27], following the criteria of Rodenas et al. [
12].
The vulnerability spatial indicator
Iv−b of a building is evaluated in a geolocated way according to these criteria and following this expression:
where
Iv−t is the basic vulnerability index of the structural configuration of the building; Δ
MR is a local modifier; and Σ
MC is the individual set of behavior modifiers taking into account the architectural parameters for each building assessed (see previous work [
9] for further details).
2.2.6. Age of the Building Stock of the City ()
Another factor on which there are scant scientific publications, and which nevertheless appears cited in various technical reports made by public institutions after the earthquake, is the age of the buildings. This question has been controversial. Logic could lead us to think that the most modern buildings should be the best prepared to deal with the earthquake, because of having been built with better materials and with designs that consider the latest earthquake resistance standards (we must consider that in Spain there was no specific regulation on the subject prior to 1994).
Even so, it should be noted that the building that suffered the most immediate and catastrophic collapse had been built only seven years before the earthquake, and several of the buildings subsequently demolished due to the severity of the earthquake damage were relatively modern buildings (this was not the consequence of shortcomings in the seismic design code, but the lack of its enforcement due to the scant importance that technicians usually gave seismic design in Spain prior to the Lorca earthquake). It is, therefore, an issue on which there are no clear appreciations, and which requires a numerical and statistical analysis of the whole set of buildings damaged or demolished in order to obtain clear conclusions.
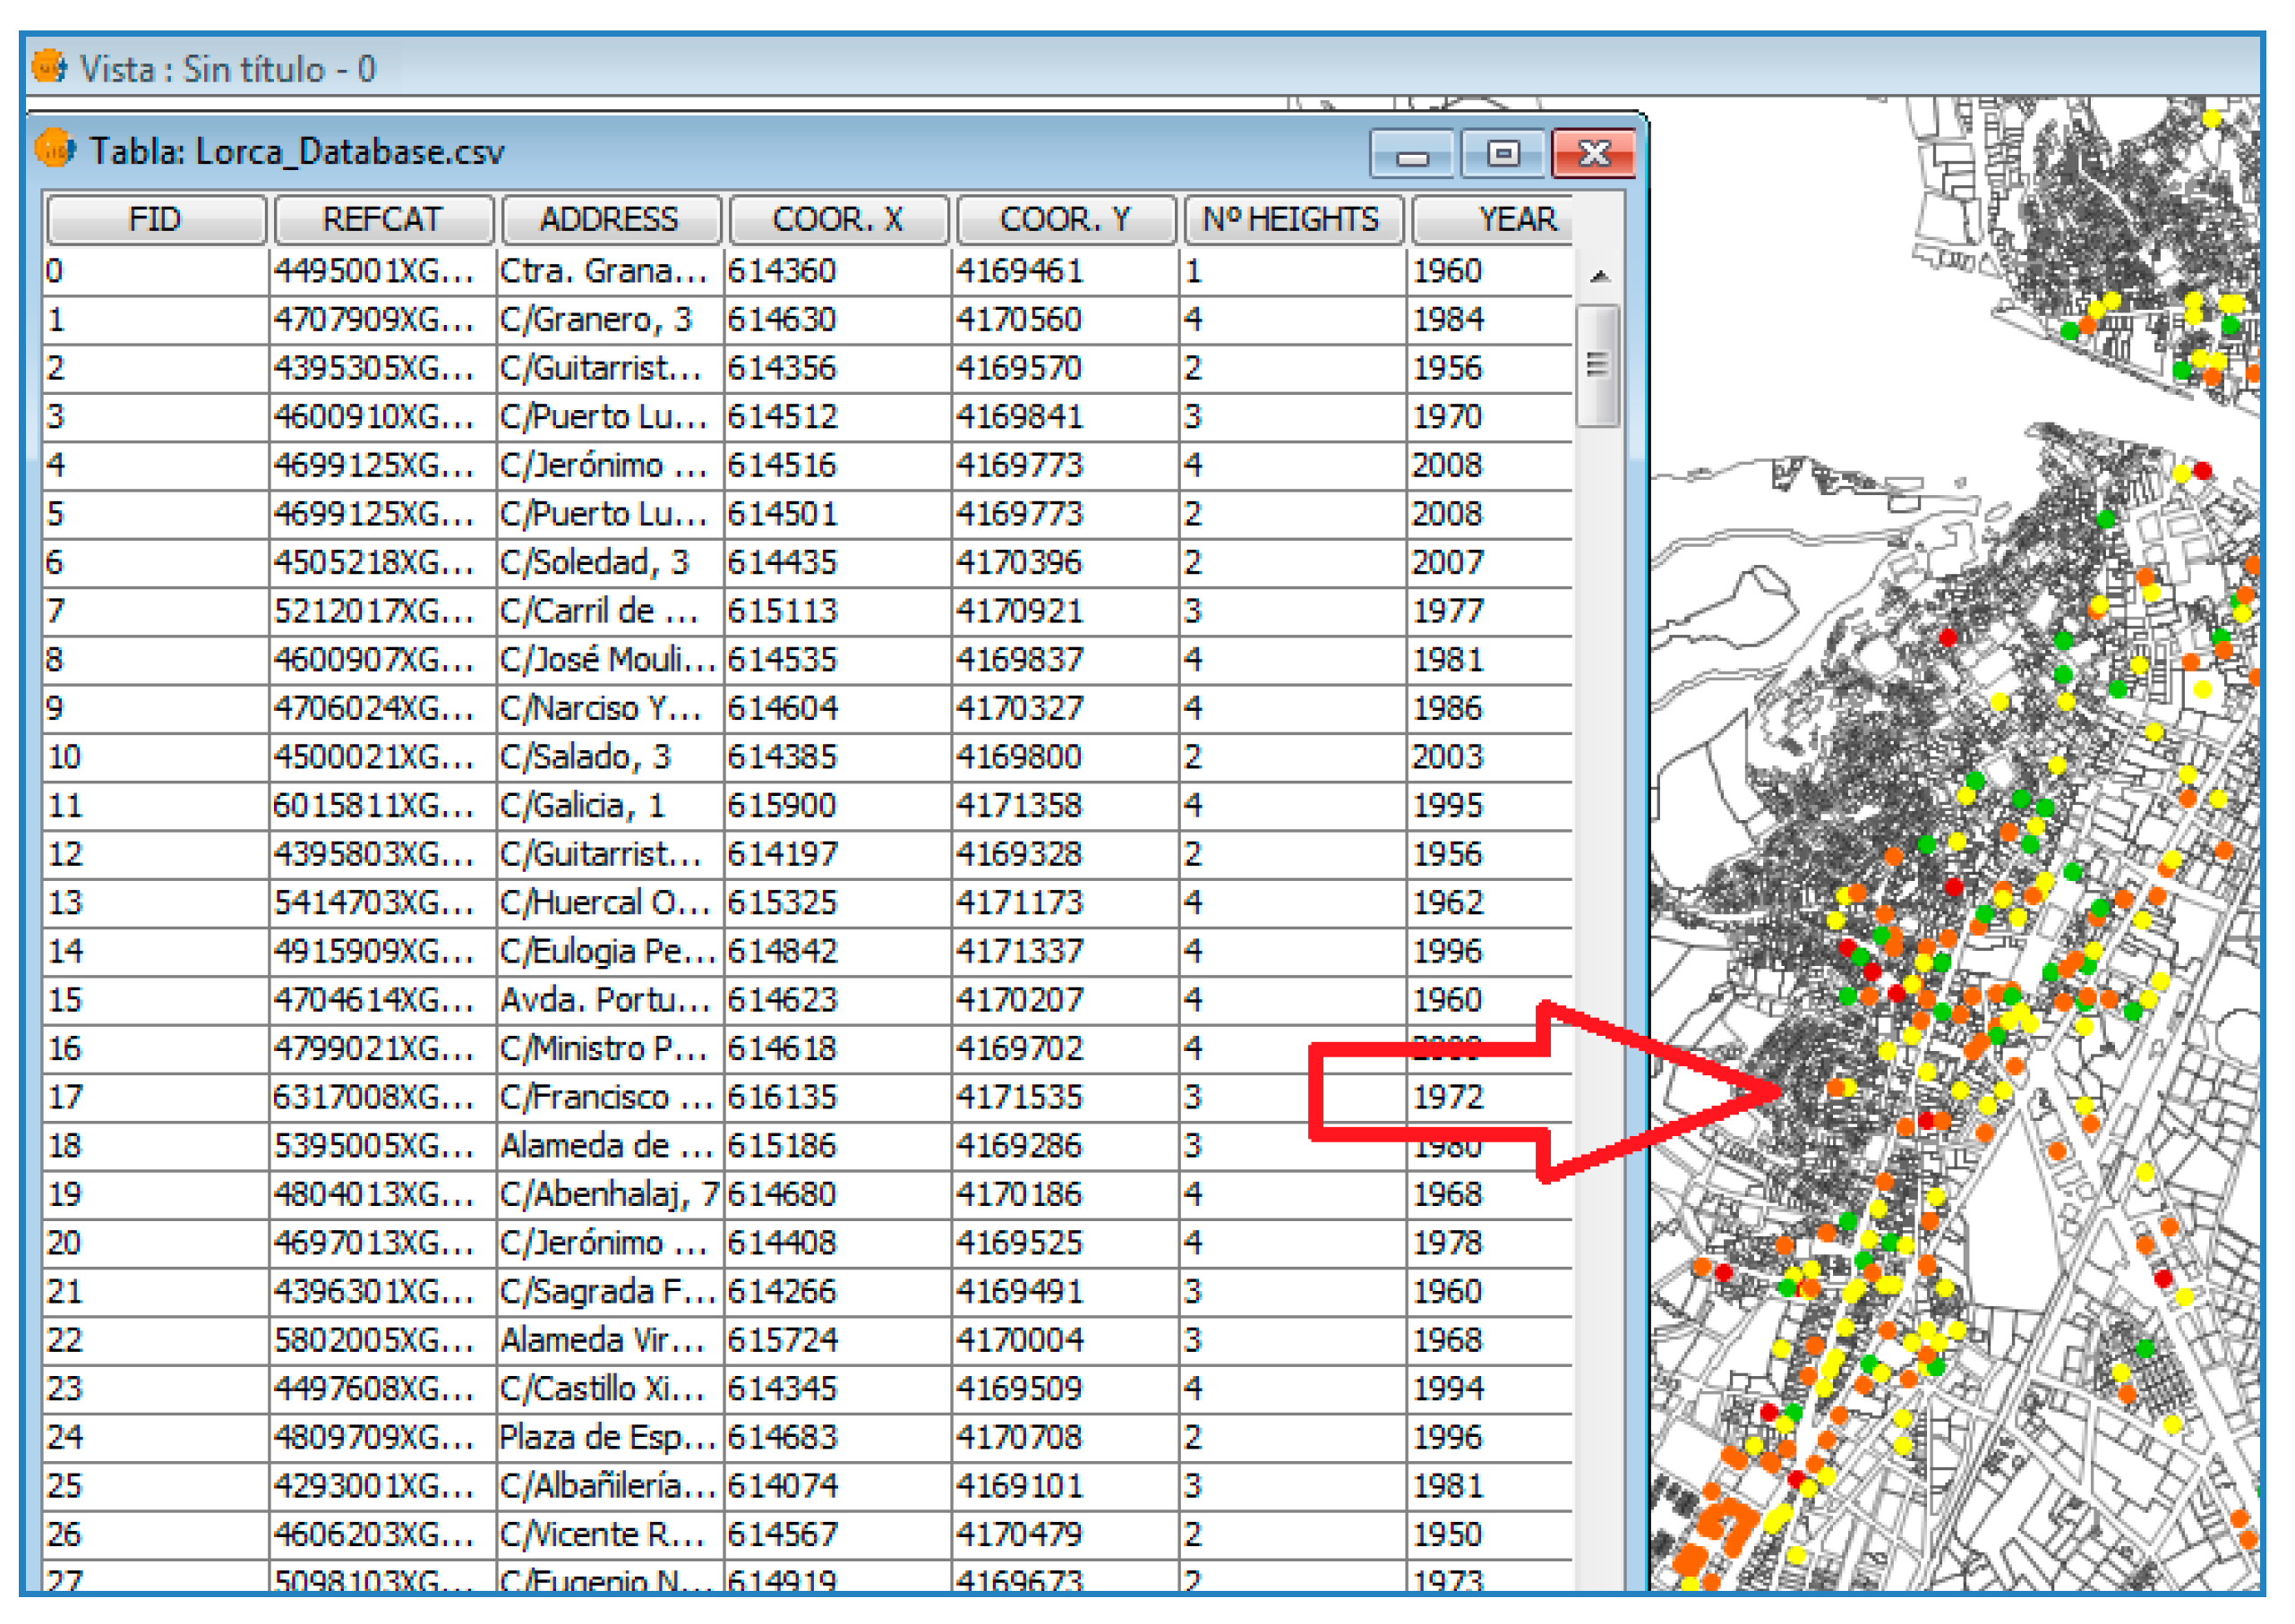
To carry out this work, the cadastral database of the buildings will be geostatistically correlated with the damage level through an index of the buildings’ antiquity (
IBA,
Figure 8). This spatial indicator will generate perimeters of homogeneous age of buildings preferably following the structure of neighborhoods but taking into account temporary singularities or rehabilitated buildings (see the results section below for greater detail).
2.2.7. Influence of Seismological Factors ()
Seismological factors are important variables of analysis in any earthquake. In the case of Lorca, the studies carried out highlight the scarce focal depth, its duration, and the peak ground acceleration as more representative singularities and facts of the seismic phenomenon [
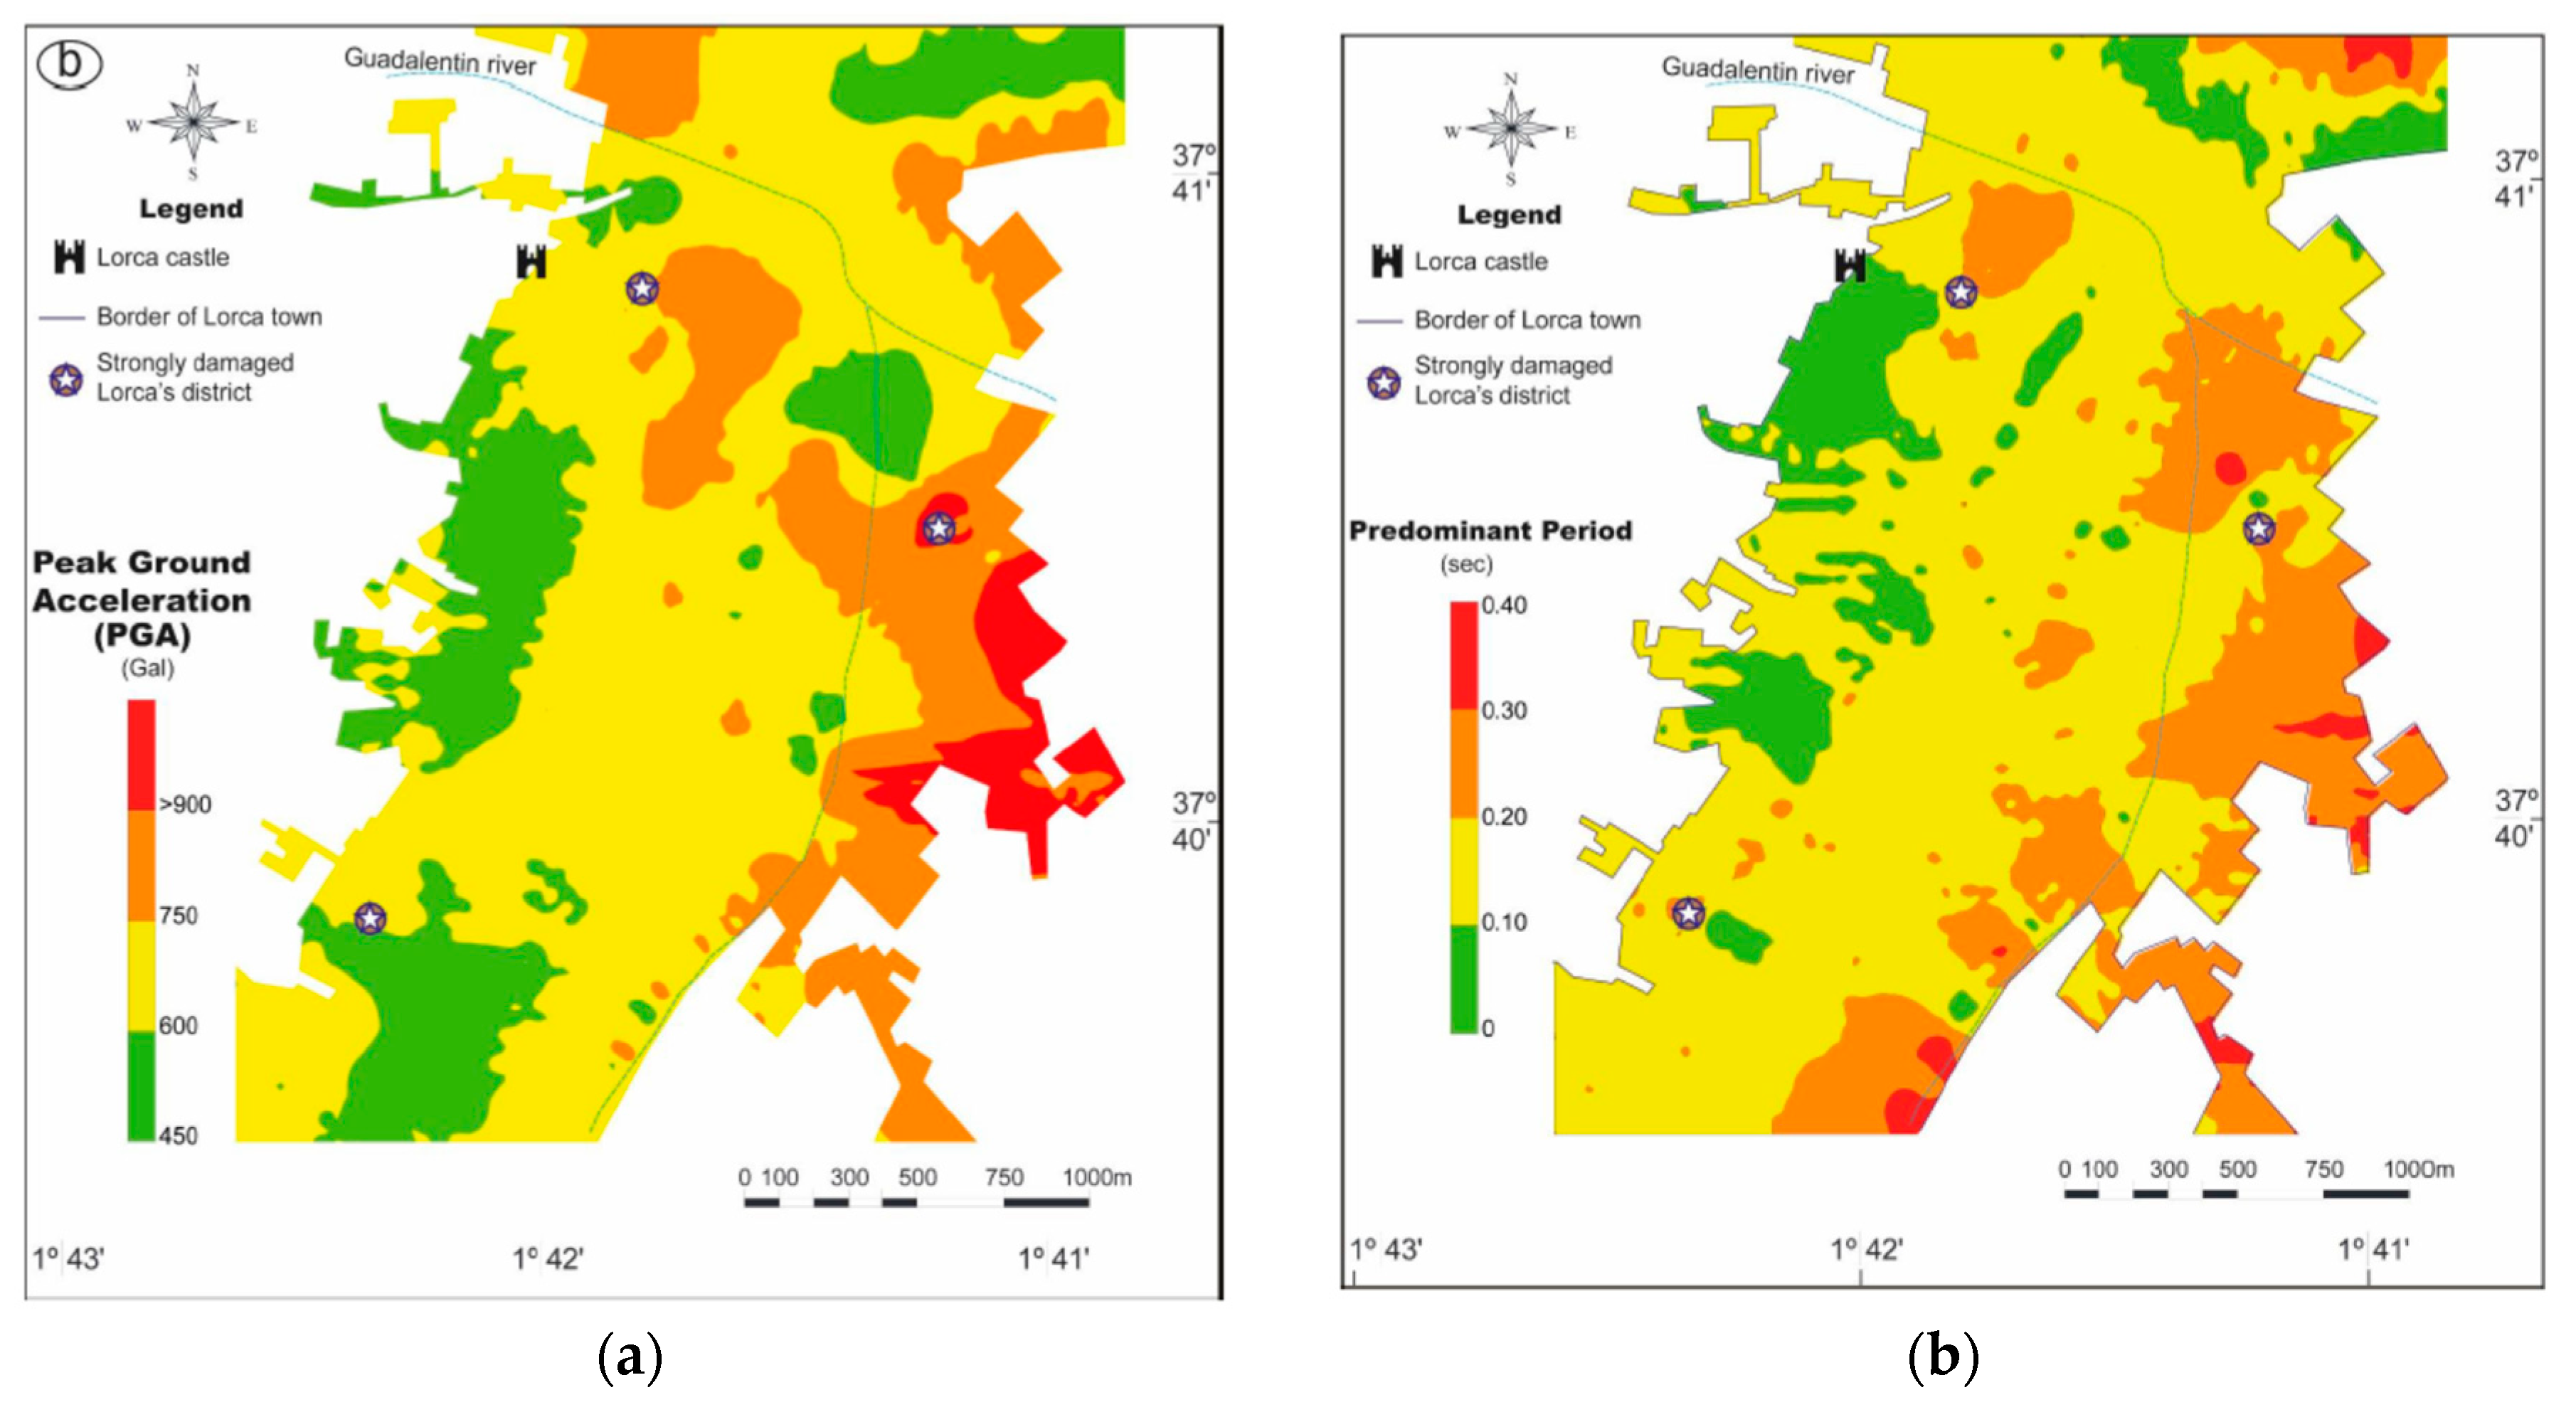
28]. In this context, to spatially analyze the relationship of these seismological factors with the level of observed damage, an indicator that enables their spatial distribution to be assessed in an aggregate manner has been generated (
Figure 9). This indicator, called the Index of Seismological Factors (
ISF), is the result of adding the dimensionless values of the Peak Ground Acceleration (PGA) and Predominant Period (PP) of the vibrations of the soil during the earthquake for the different areas of the city in addition to the relative proximity of each zone of the city to the focus of the earthquake:
where
is a dimensionless function measuring the intensity of PGA for a homogenous area;
is the dimensionless function measuring the intensity of PP for a homogenous area; and
is the function that measures the average distance from a specific homogenous area to the focus of the earthquake in relation to the maximum distance measured for the whole set of homogenous areas analyzed (see
Appendix A for further details about the obtaining of the database).
2.2.8. Levels of Damage in Buildings ()
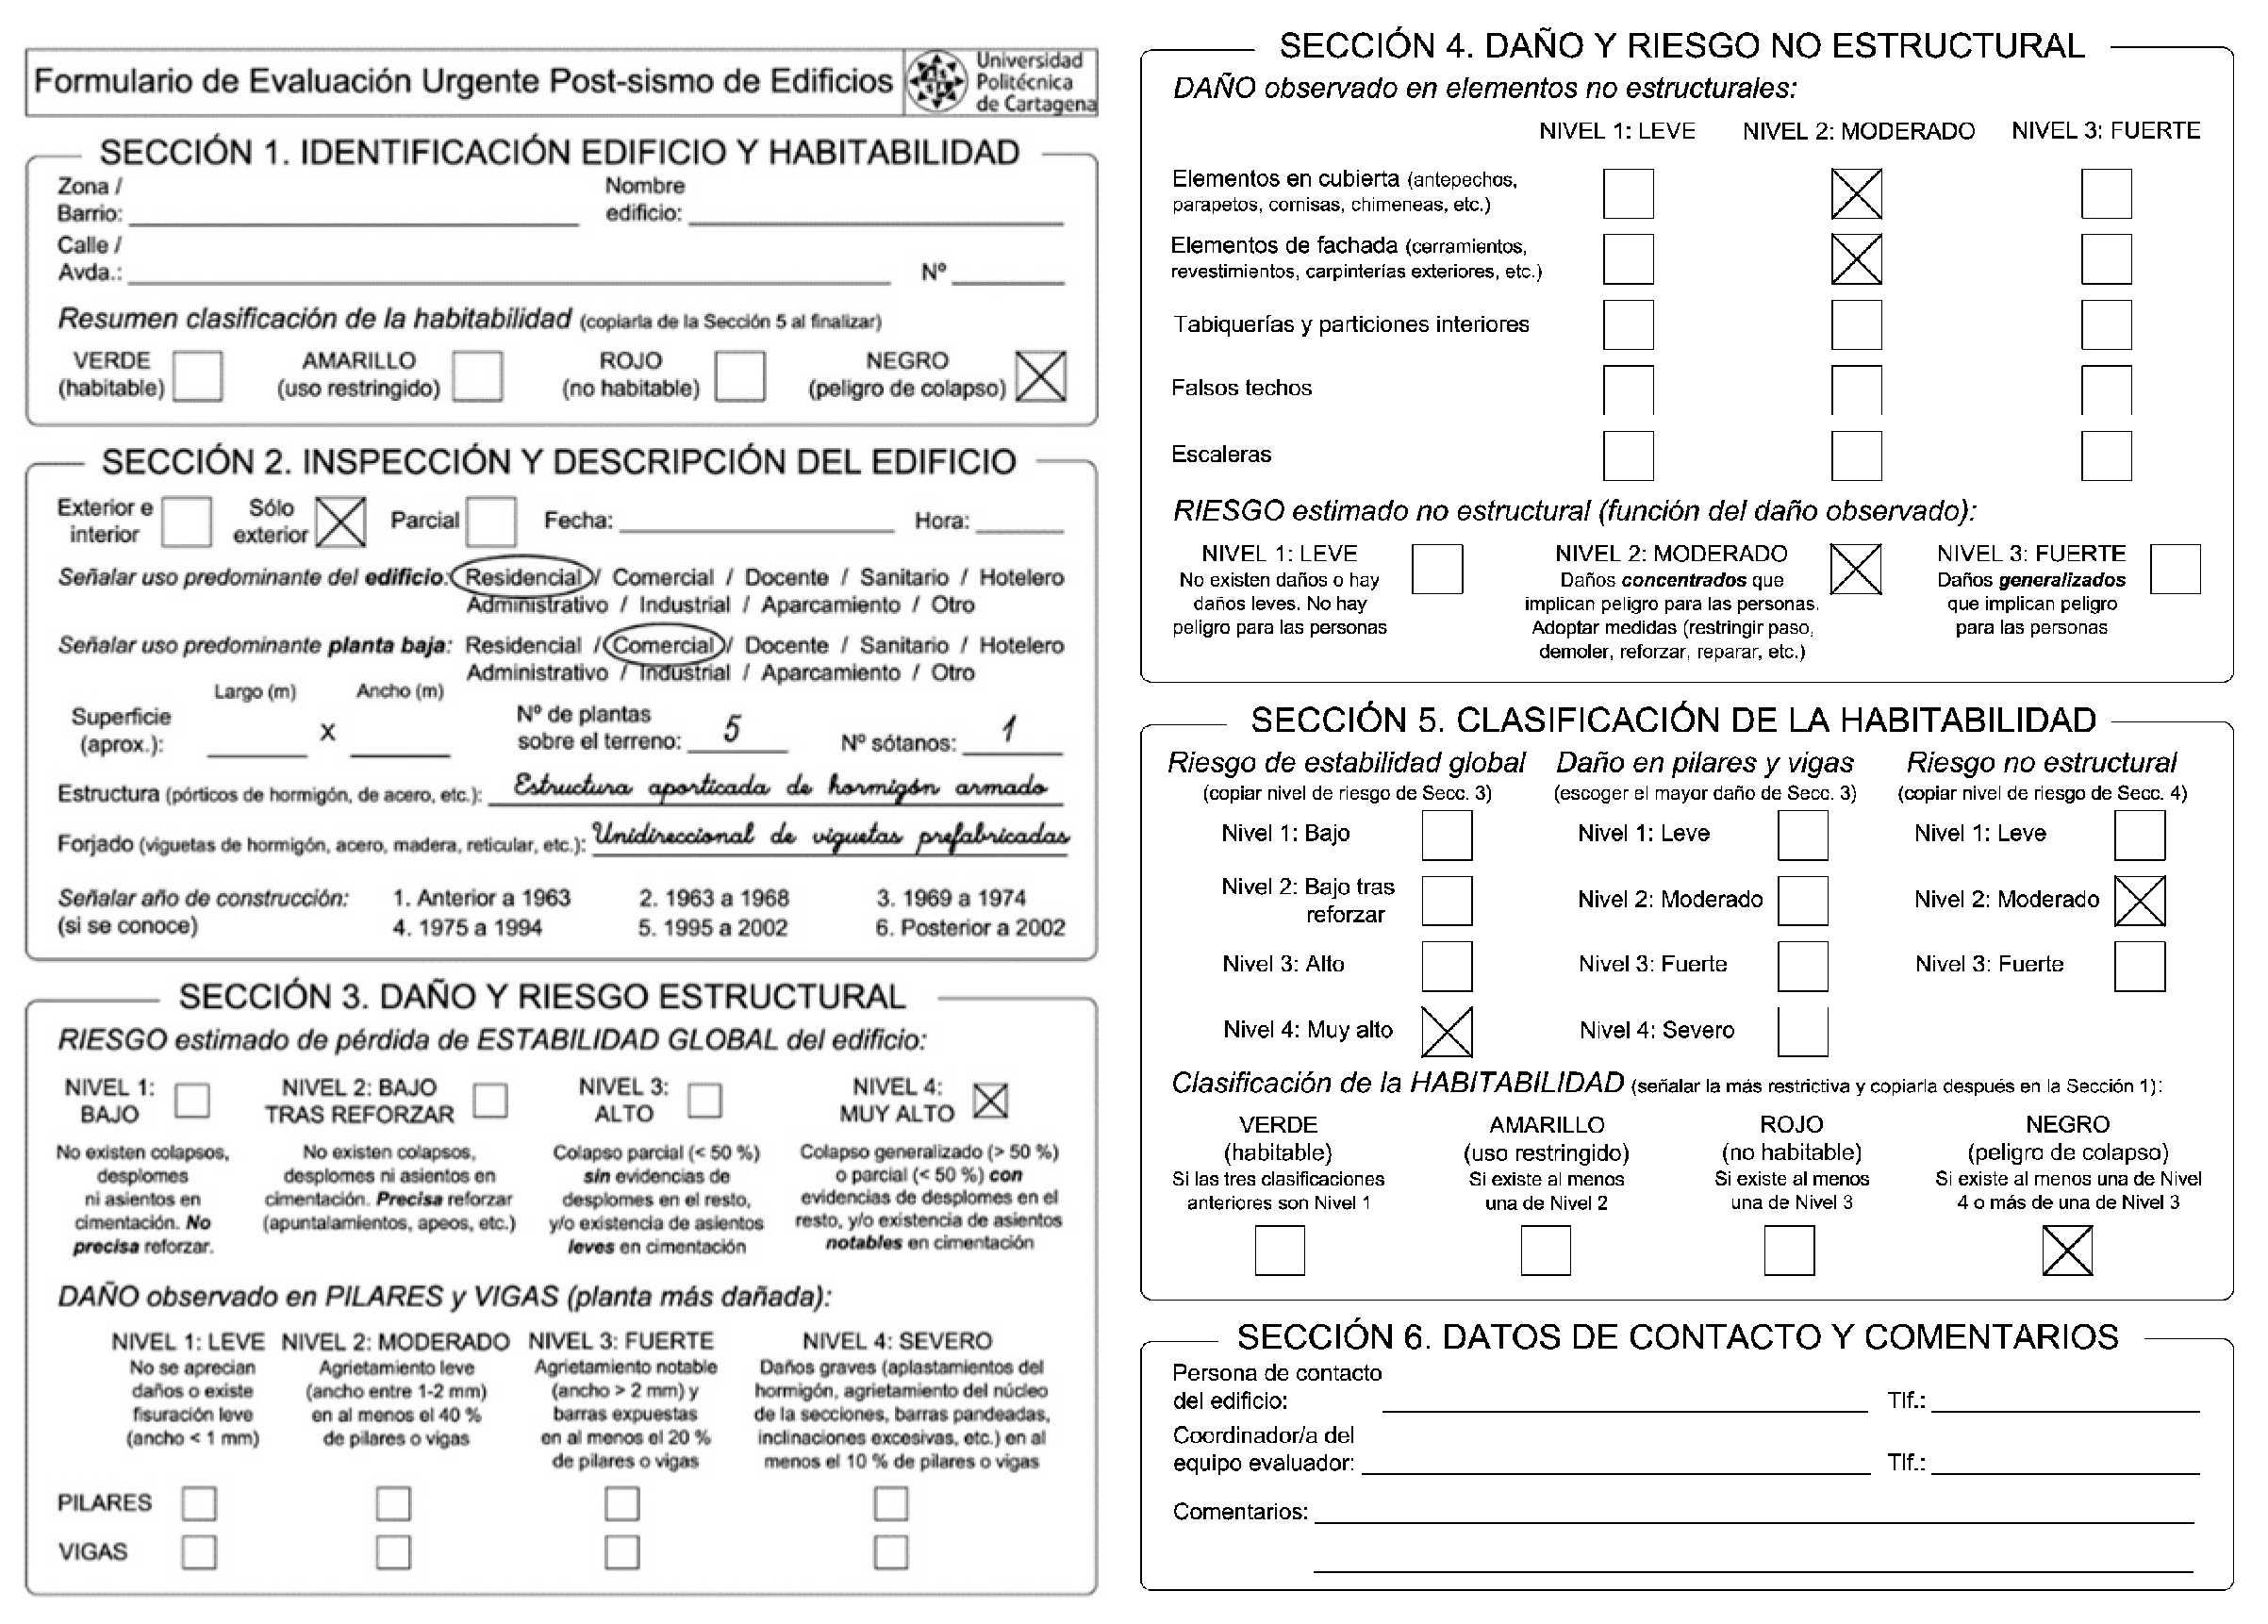
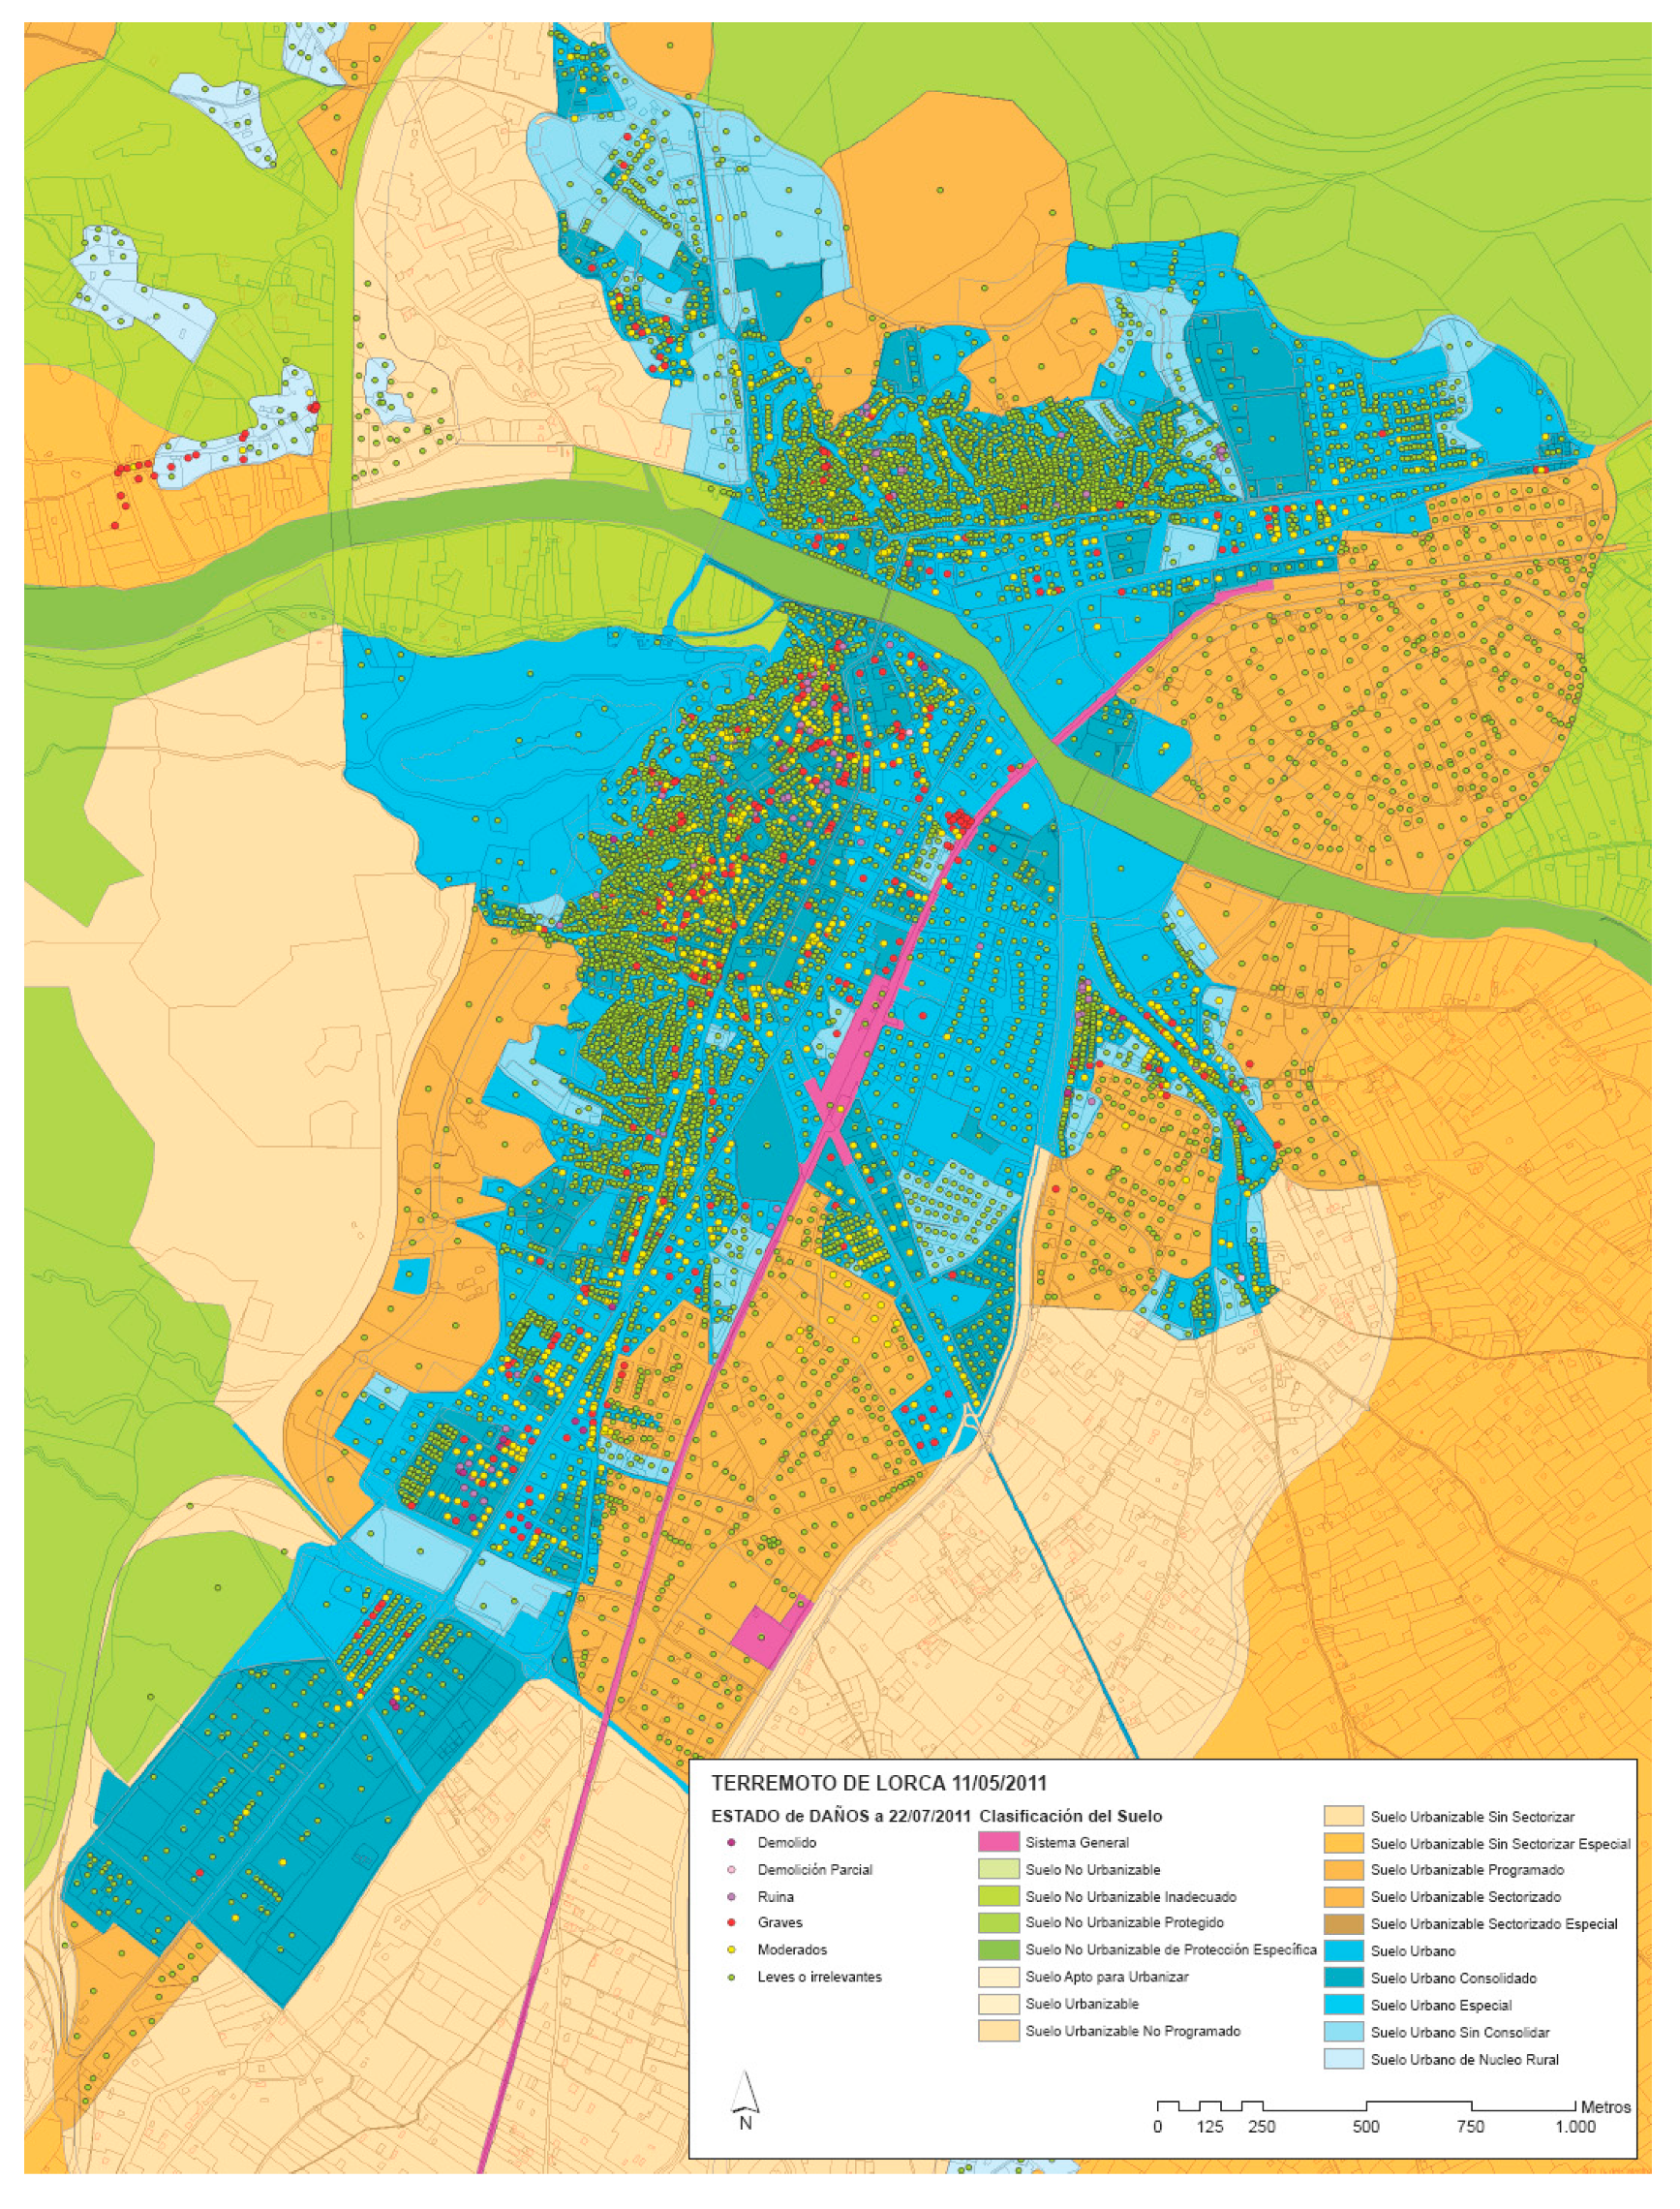
The Lorca earthquake presents some very interesting conditions to develop a geostatistical analysis of its effects. This is mainly due to the great collaboration in the evaluation of the earthquake’s effects by specialized technicians and people with some technical training (firefighters, emergency personnel, administration officials, insurance experts, etc.). More than 1000 people fitting this profile voluntarily came to the city as a result of the enormous interest that this unusual phenomenon generated throughout the country. This important human resource, together with the good organization of the authorities during the post-earthquake phase (specialized technicians and volunteers were grouped so that each group was coordinated by at least one technician from the administration), made it possible to channel the vast amount of information generated at that time into a huge and detailed database.
This database, containing all of the collapsed, demolished, or damaged buildings and created from reports performed by volunteers or specialized technicians (such as that in
Figure 10), has been homogenized and spatially geolocated by the authors (maintaining the anonymity of the owners in all cases, with the database being referenced only by the numerical codes of the cadaster). To implement the geostatistical analysis, four levels of damage were established (green, yellow, orange, and red) to describe situations without or with irrelevant damage, with minor non-structural damage (fundamentally damaged facades, interior partitions or elements not belonging to the set columns-beams-slabs), reparable structural damage, and irreversible structural damage, respectively (the criterion established to determine if a building was in a situation of reparable or irreparable damage was the legal one adopted by the administration in the reports, through which a building is declared ruined if it is in a state of imminent structural collapse or if the cost of its repair exceeds the cost of construction thereof by 50%). Minor non-structural damage fundamentally referred to damaged facades, interior partitions, or elements not belonging to the set columns-beams-slabs. In some cases, a black level was also included for very serious cases in which there had been fatalities. This enabled us to create an Index of Level of Damage in Building (
ILDB) based on the cloud point distribution of these discrete geolocated values structured into four levels (value 0 assigned to green code and 3 assigned to the red one). The detailed technical criteria used to identify each of the categories in the reports are those found in previous work [
12] and the spatial distribution of the final situation of the 1062 buildings analyzed for the implementation of the database can be observed in
Figure 11.
2.3. Geostatistical Correlation Analysis Methodology
The statistical correlation at the spatial level between the seven indicators described and the importance of the damage produced by the earthquake will be evaluated through geo-process functions from ArcGIS and geostatistical tools from ArcGIS Pro Desktop (GIS database was previously elaborated through GvSIG program). First, the level of statistical significance of the distribution of each of the seven earthquake indicators will be analyzed through a geo-process based on the Global Moran’s I statistic [
29].
Global Moran’s I statistic will analyze the degree of spatial autocorrelation of the different geolocated data obtained from the distribution of the indicators in the city of Lorca, and the sign of this autocorrelation (positive or negative). Its statistical formula for spatial autocorrelation is given as:
where
is the deviation of an attribute for feature
from its mean
is the spatial weight between feature
and
;
is equal to the total number of features; and
is the aggregate of all the spatial weights:
The
-score for the statistic is calculated by the GIS program as:
where:
Global Moran’s I statistic returns three values: the Moran’s I Index, z-score, and p-value. Given a set of features and an associated attribute, the ArcGIS geo-process evaluates whether the pattern expressed is clustered, dispersed, or random. When the z-score or p-value indicates statistical significance, a positive Moran’s I index value indicates a trend toward clustering while a negative Moran’s I index value indicates a trend toward dispersion. The z-score and p-value are measures of statistical significance which inform us whether or not to reject the null hypothesis. For this statistical geo-process, the null hypothesis states that the values associated with features are spatially randomly distributed.
Secondly, the level of spatial correlation between each of the indicators and the severity of the damage detected will be evaluated. We will use two tools to numerically calculate the two-dimensional correlation between each indicator and the observed damage, and on the other hand spatially distribute the intensity of said correlation. Anselin Local Moran’s I [
30] will analyze cluster and outlier numerical bivariate analysis. This statistic of spatial association is given as:
where
is an attribute for feature
;
is the mean of the corresponding attribute;
is the spatial weight between feature
and
, and:
with
n equating to the total number of features. The
-score for the statistic is computed as:
where (see
Appendix B for further mathematical details):
Finally, for those indicators that reflect a significant statistical correlation with the observed damages numerically and at an aggregate level, an intensity spatial analysis will be carried out through the segmentation of cold and hot spots Getis-Ord Gi [
31]. The Getis-Ord local statistic formula is given as:
where
is the attribute value for feature
;
is the spatial weight between feature
and
is the total number of features, and:
The
statistic is a
z-score, so no further calculations are required to obtain it [
30]. This parameter will measure the degree of clustering for either high values or low values. This High–Low clustering tool returns four values: Observed General G, Expected General G,
z-score, and
p-value. The
z-score and
p-value are measures of statistical significance that can tell us whether or not to reject the null hypothesis. For this analysis, the null hypothesis states that the values associated with features are randomly distributed, so no bivariate correlation exists [
32]. Therefore, the higher (or lower) the
z-score is, the stronger the intensity of the bivariate clustering is. A
z-score near zero indicates no apparent clustering within the study area. A positive
z-score indicates a bivariate clustering of high values. A negative
z-score indicates a bivariate clustering of low values.
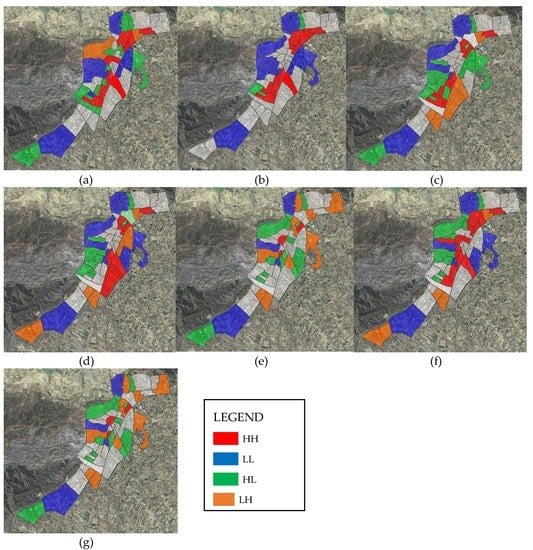
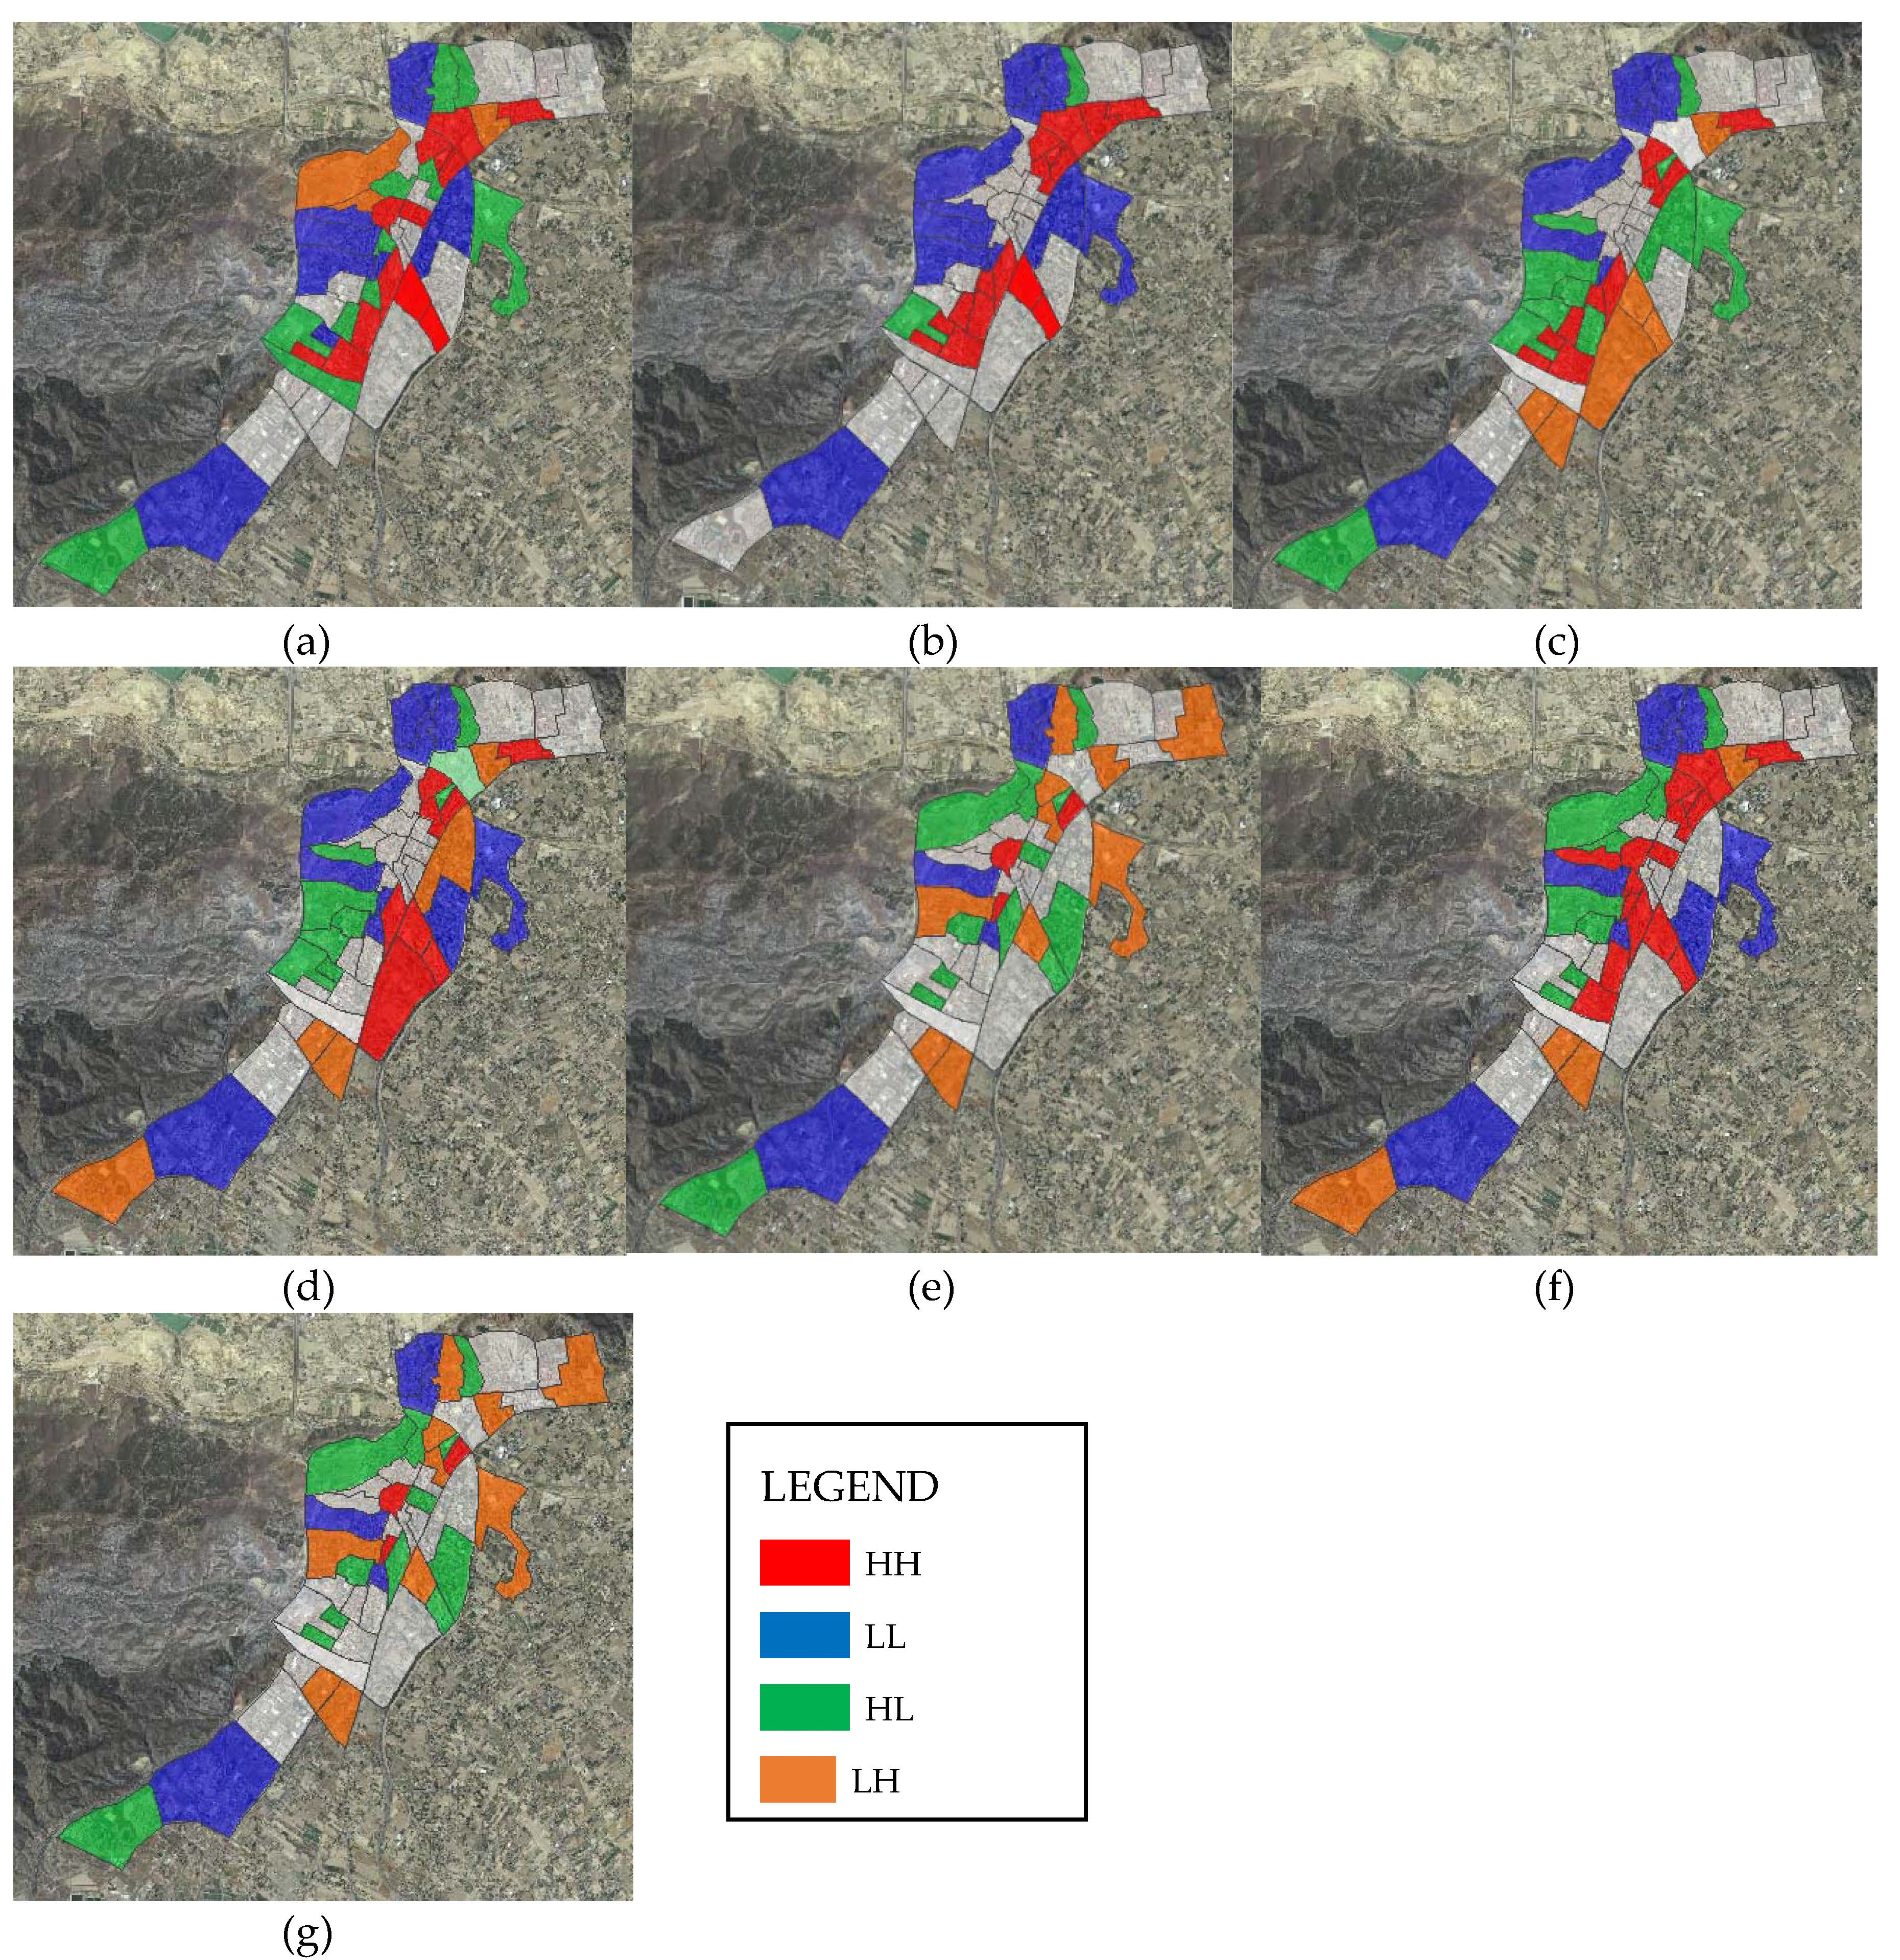
This evaluation implemented through GIS mapping of the city of Lorca will enable us to distinguish configuration patterns of High–High clusters (a high value surrounded primarily by high values), Low–Low clusters (a low value surrounded primarily by low values), and spatial outliers, either High–Low (high values surrounded primarily by low values) or Low–High (low values surrounded primarily by high values). This analysis will help us to determine the most dangerous phenomena related to damage in buildings from a comprehensive point of view. In addition, its spatial distribution may help us also to find possible linkages between the different phenomena or their global level of responsibility in the existence of victims and serious situations of insecurity during the earthquake.
3. Results
A geostatistical analysis has been carried out on the behavior of the spatial distribution of the GIS indicators described in the previous section. In the first phase, the level of statistical autocorrelation of the spatial distribution of the indicators was analyzed. This allows one to validate the selection of indicators performed in the previous section because we can distinguish which indicators have an apparently random spatial distribution and those which may have a distribution subject to the effect of other factors at a spatial level. In the second phase, those indicators whose spatial distributions presented more interesting behavior can be statistically correlated with each other if necessary, and a bivariate analysis of all of them has been carried out with the indicator representing the damage level. Finally, a hot spot analysis of the spatial distribution of these bivariate statistical correlations between indicators and the level of damage has been carried out.
3.1. Spatial Autocorrelation: Global Moran’s I Statistic
Initially, the level of statistical clustering of the different indicators was analyzed to evaluate the degree of spatial randomness of their numerical distribution. To evaluate this behavior we resorted to Global Moran’s I spatial autocorrelation statistic [
29] and the city of Lorca was discretized spatially into 53 areas of homogeneous conditions to simplify the analysis of data with a greater number of elements.
To avoid possible bias in the results because of the design of homogenous areas, these divisions essentially consider the administrative and historical structure of the city’s neighborhoods, but other design criteria have also been introduced to assure homogeneity. The segmentation of the city was carried out by selecting areas with a significant number of buildings and following a criterion of 80/80/80 percentage (all areas with at least 80% of its buildings built in the same time frame of 20 years, 80% of soil classified in the same category according to previous work [
17], and 80% of its surface under similar orographic conditions). The results for each of the indicators can be seen in
Table 1.
If we analyze the numerical results in detail, we can see that in theory none of the indicators have a significant a priori spatial autocorrelation level. The statistic values are generally low, as is the z-score value, and the value of p does not exceed the 1% significance level in any case. Only the values related to the soil (0.71 for and 0.63 for ) present a tendency toward clustering, with a certain level of spatial autocorrelation being reasonable due to the more or less grouped distribution of terrain layers and layers with homogeneous geotechnical properties. However, it can be stated that in theory, at this initial stage these indicators present an independent spatial distribution not subject to the effect of other indicators. In particular, it is of special interest to observe the moderately low distribution of the indicator of the intensity of damage to buildings, which in principle suggests a statistically random distribution of this indicator at the spatial level.
3.2. Bivariate LISA Analysis
Once the independence of the indicators was analyzed from the point of view of spatial autocorrelation, a bivariate analysis was carried out between each of the indicators and the damage indicator of the buildings. To do this the level of local correlation in the two-dimensional approach was calculated using the Anselin Local Moran’s statistic (LISA) [
30] with a 95% confidence level. The values obtained for the bivariate analysis from ArcGIS are summarized in
Table 2.
The aggregate bivariate analysis clearly shows that there is no two-dimensional correlation at the spatial level between the buildings’ antiquity indicator and their damage level, nor was significant geostatistical correlation found between the designed seismological indicator and the level of damage to buildings The rest of the indicators present, to a greater or lesser extent, a certain globally positive two-dimensional correlation. However, a more detailed analysis is necessary in order to specify whether this correlation occurs only at the level of the mean values from a numerical point of view, or if a coherent and homogeneous behavior for the spatial detailed perspective of distribution actually occurs.
3.3. High/Low Clustering: Getis-Ord General G statistic
The geostatistical correlations obtained in the previous section using the Anselin Local Moran’s I (LISA) global approach are quite interesting, since they allow us to know which indicators have a greater global degree of spatial correlation with the level of damage in buildings. However, this two-dimensional evaluation of the statistical correlation has certain limitations when working with average values to simplify the numerical analysis. Therefore, we shall graphically represent the distribution of those couples of the LISA analysis performed that present higher levels of bivariate correlation to analyze their spatial distribution through a two-dimensional Low–High statistical map.
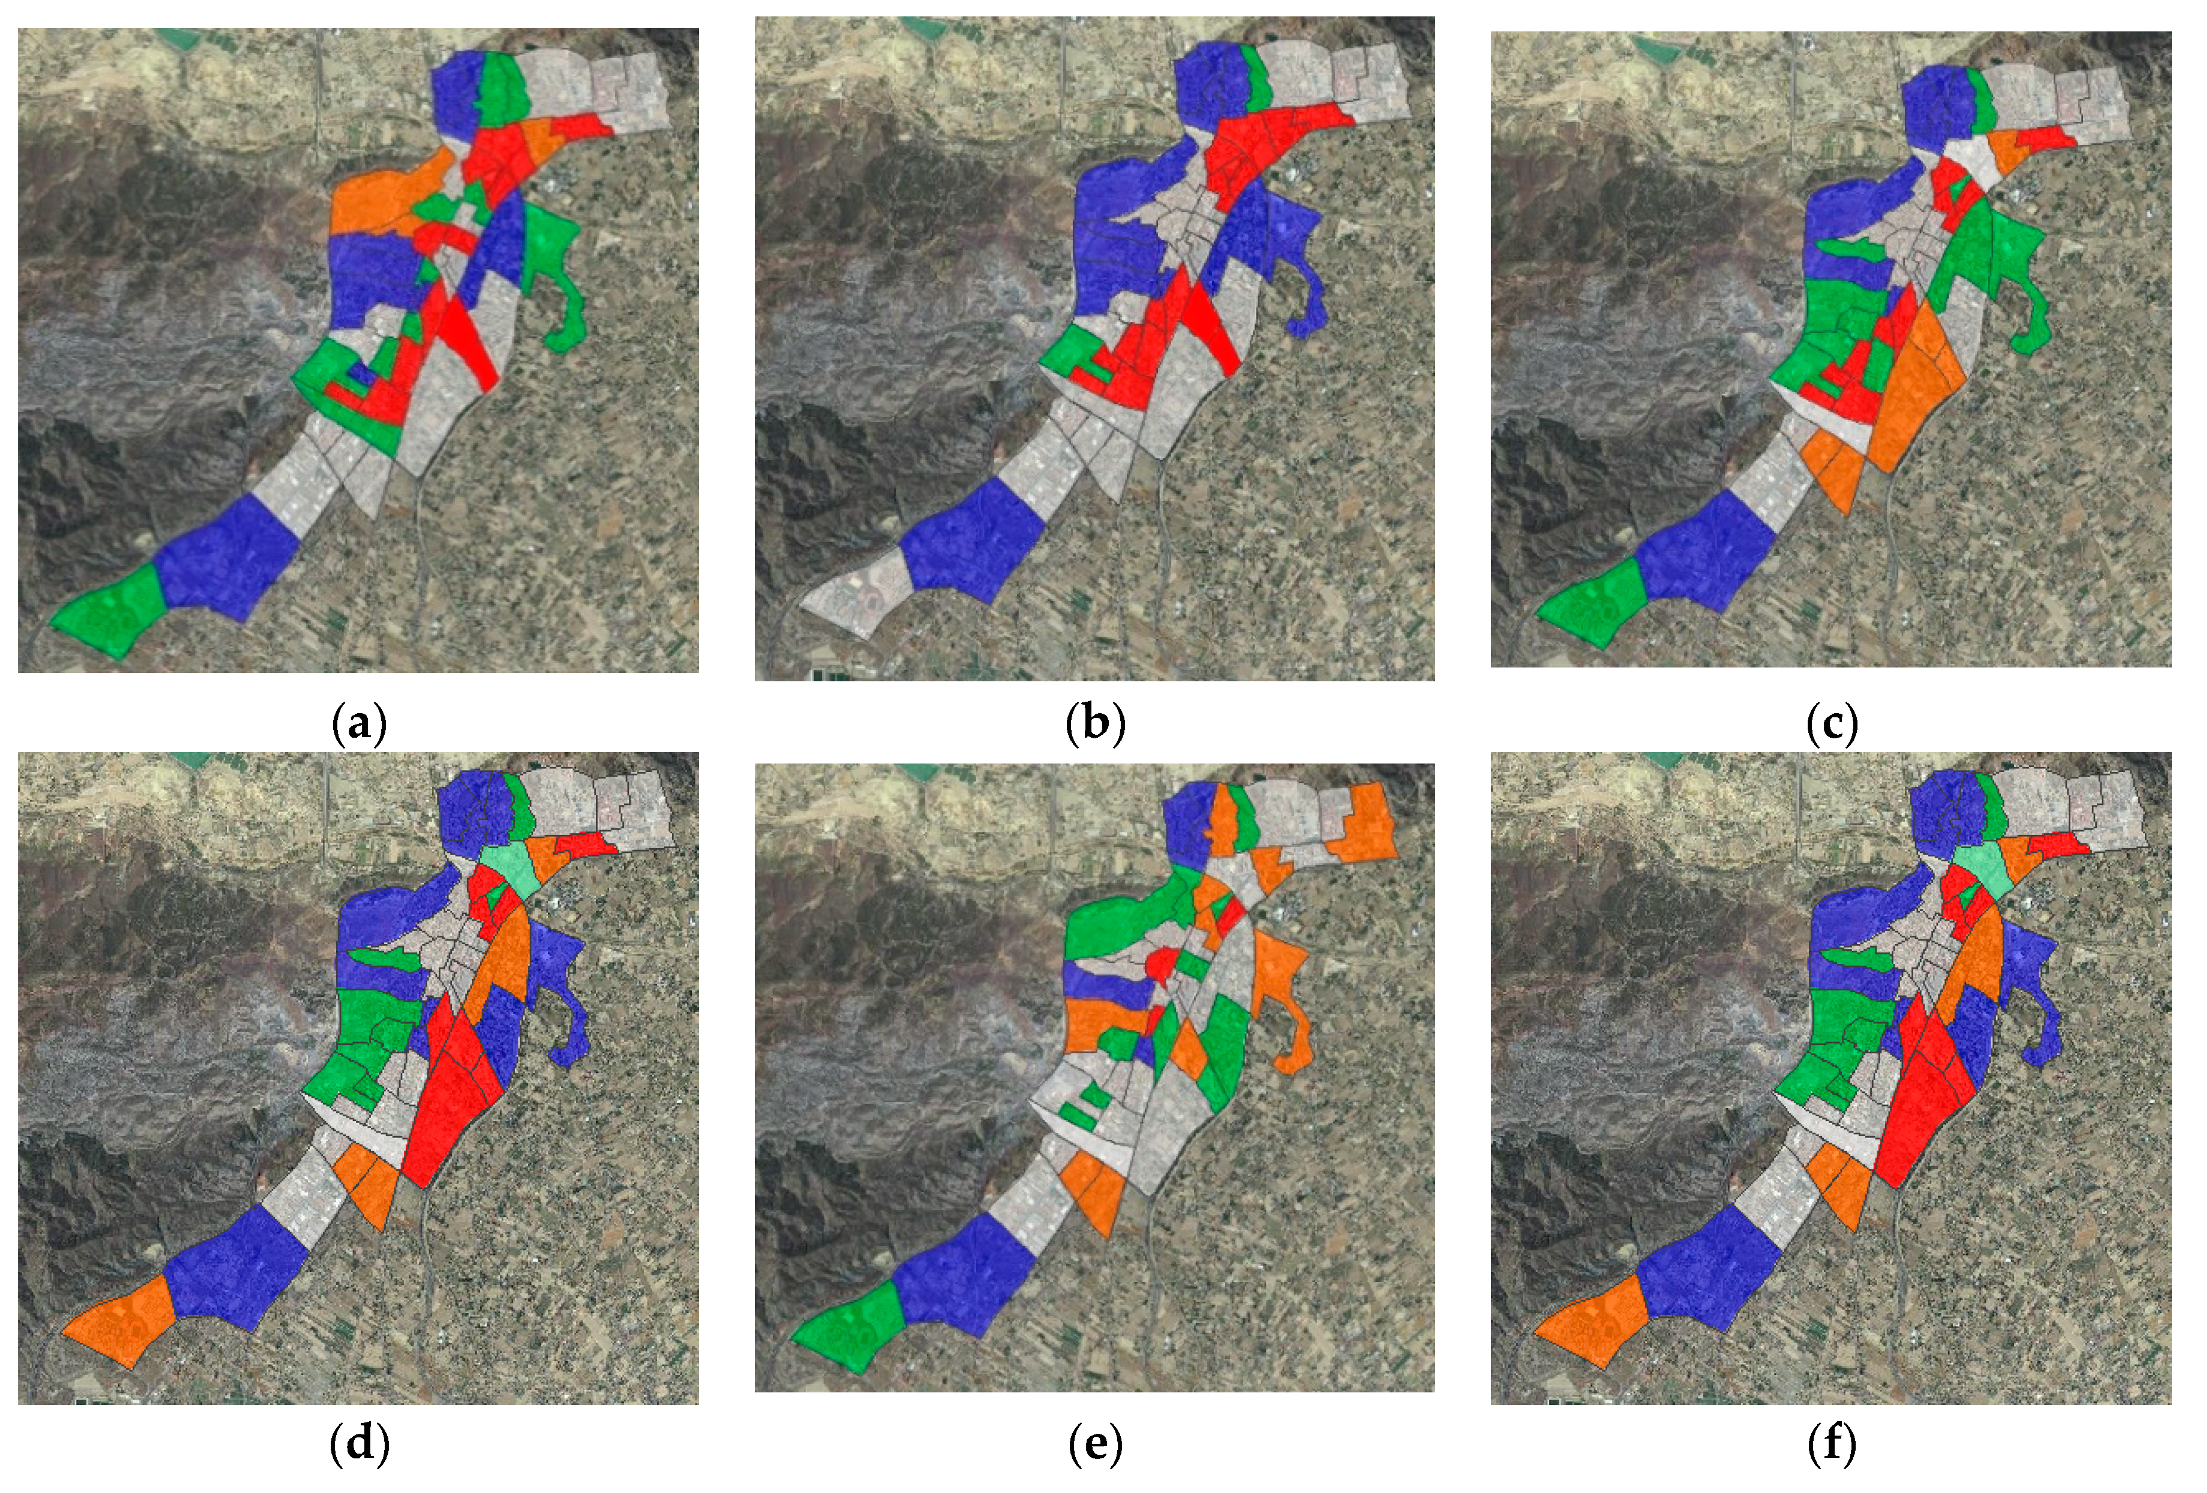
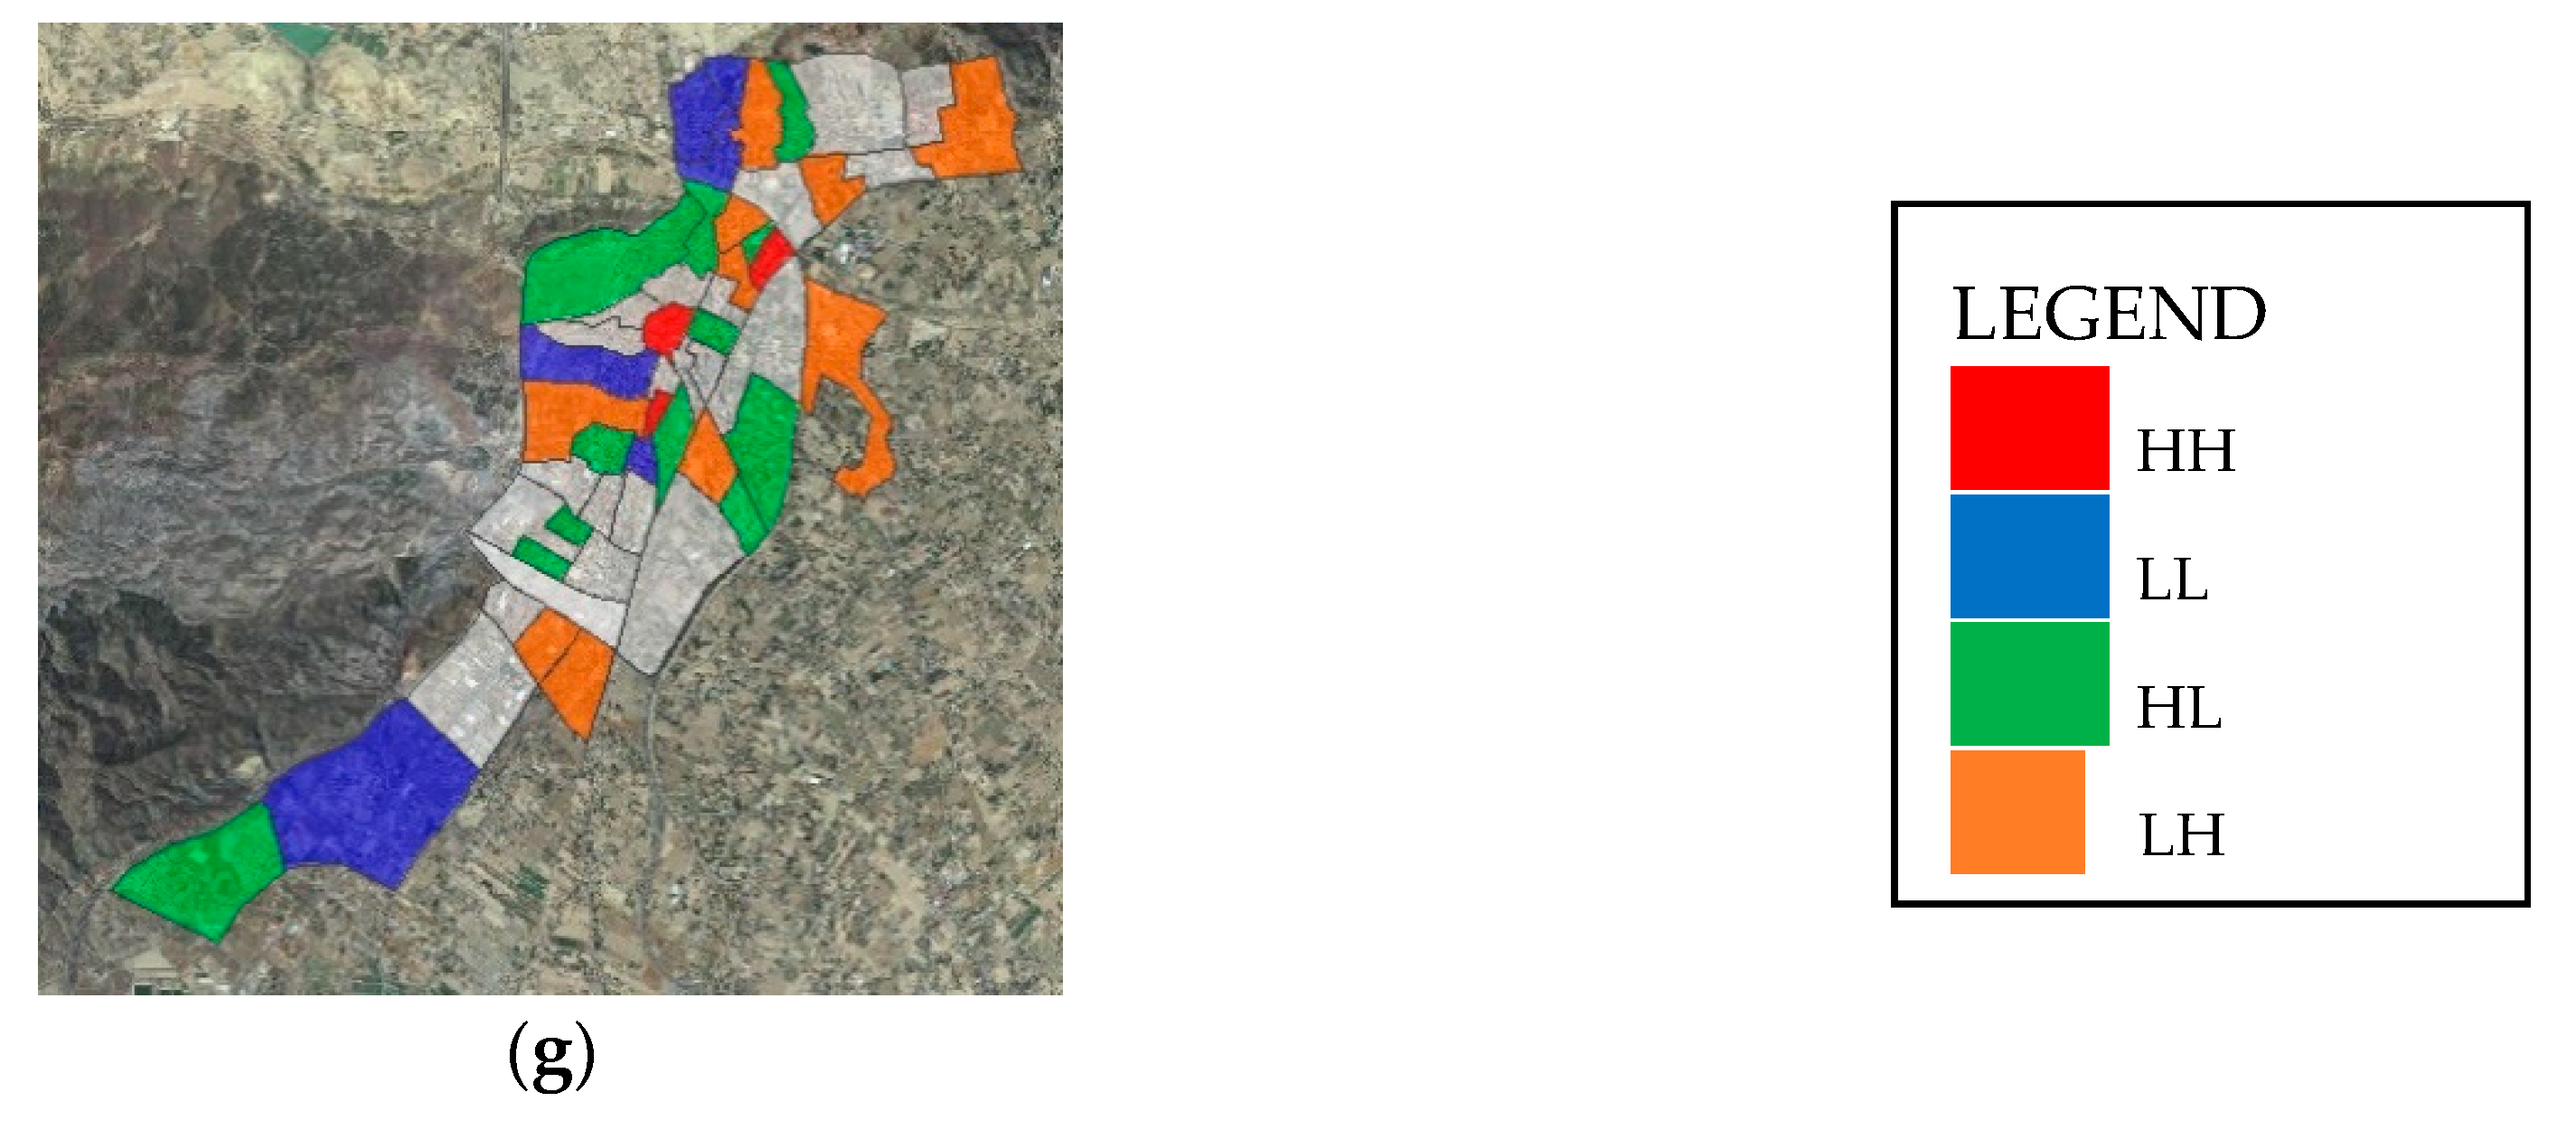
Using the whole set of values of the LISA bivariate statistics we can identify High–High clusters (a high value surrounded primarily by high values) and Low–Low clusters (a low value surrounded primarily by low values) and map them spatially at a local level. In addition, spatial outliers, either High–Low (high values surrounded primarily by low values) or Low–High (low values surrounded primarily by high values) can also be mapped and analyzed numerically.
The geoprocessing tool of ArcGIS Getis-Ord
Gi* Hot Spot Analysis measures the degree of clustering for either high values or low values using the Getis-Ord General G statistic. Given incident points or weighted features (geolocated points for discrete values or interpolated surfaces for areas), it creates a map of statistically significant hot and cold spots using the Getis-Ord
Gi* analysis. Thus we can distinguish the spatial distribution in detail areas where high values of an indicator imply a high level of damage in buildings, areas where low values of an indicator imply low values of building damage and the level of both kinds of outliers. The results obtained for the different couples can be observed in the spatial hot spot analysis of
Figure 12 and the detailed numerical data for the different levels of damage in
Table 3.
The brief observation coefficient B in
Table 3 indicate that the red codes are clearly associated with the phenomena of short columns, while the driving mechanisms in the rest of the phenomena indicators are more heterogeneous and complex. Red codes tend to be found in areas with well-defined characteristics. The model obtained for this code, therefore, has a relatively high explanatory capacity (R2Adj.: 0.52, the rest of the codes reflect a much smaller adjustment in their models, which explains less than 25% of their distribution). In the cases of the green and yellow codes, it is also quite interesting to observe that there is a strong presence of soft story phenomena, being very numerous in the overall quantity yet not particularly relevant in terms of the level of damage.
The two-dimensional numerical analysis of Low–High geostatistical results in
Figure 12 is also quite revealing. To begin with, the results obtained previously at the numerical level are confirmed at a spatial level (for example, there are no specific differences in damage between the historical center and the new areas of the city). On the other hand, we can observe that there are phenomena showing an important correlation with the existence of damage in buildings, but whose level of correlation varies greatly with the intensity of the damage. This is the case of the phenomena modeled through the indicators
(“buildings with short columns”) and
(“buildings with soft stories”). In the first case, there is a clear statistical correlation at a spatial level, with high levels of damage to buildings (red codes) with an important presence of short pillars (High–High and Low–Low correlation), and the absence of high damage in a large part of the buildings that do not have problems related to this phenomenon.
A similar behavior can be observed with the GIS indicator (“existence of soils with high amplification capacity of seismic waves”), where the neighborhoods located in areas with high amplification capacity presented greater damage intensity than the neighborhoods with less capacity, describing a clear Low–Low (LL) /High–High (HH) phenomenon with few outliers. For , we found inverse behavior. There is a strong geostatistical correlation at a general level between both indicators, but a high level of the existence indicator of the soft story phenomenon is generally associated with green or yellow codes (High–Low (HL)), while in those buildings with red or black codes this phenomenon is hardly referenced (Low–High (LH), both analyzed as outliers by the hot-spot analysis).
Finally, it is quite interesting to observe the spatial behavior of the indicators (“Inadequate seismic design in architectural configuration of buildings”) and (“Inadequate urban configurations of the buildings”). The first of the two indicators shows reasonably heterogeneous behavior. It is a conceptually very broad indicator subjected to a complex casuistry, so its analysis has been transferred to the discussion section. The behavior of the second one provides a clearer explanation from the point of view of the numerical–spatial correlation between the urban configuration indicator and the level of damage. This indicator analyzes both the detection in the reports of the technicians of phenomena of pounding between buildings due to a lack of the necessary separation between buildings, as well as the existence of inadequate urban configurations and orographic unevenness from the point of view of the seismic vulnerability of the buildings.
If we analyze the numerical correlation between this indicator and the intensity damage level indicator at spatial level, we observe two clearly differentiated behaviors. On the one hand, there is a strong numerical correlation in the same areas in which there is High–High correlation of the indicator of existence of short columns. On the other hand, there is a weak or non-existent numerical correlation in areas with a strong presence of the indicator but non-existence of high values for the indicator of short columns (outlier High–Low). Therefore, we can understand that the existence of a globally positive geostatistical correlation between the parameter of urban configurations and the level of damage is not strictly biunivocal. The damage derived from the inadequate urbanistic configuration of the buildings is not, therefore, due to the phenomenon of the pounding caused by insufficient separation between buildings (phenomenon that is revealed to be poorly spatially correlated with the level of higher damages). It is rather the inadequate urban configuration of the streets, whose unevenness encourages the existence of short columns in the structural configuration of buildings, a parameter that has been clearly demonstrated to be correlated with the most relevant damage in the city.
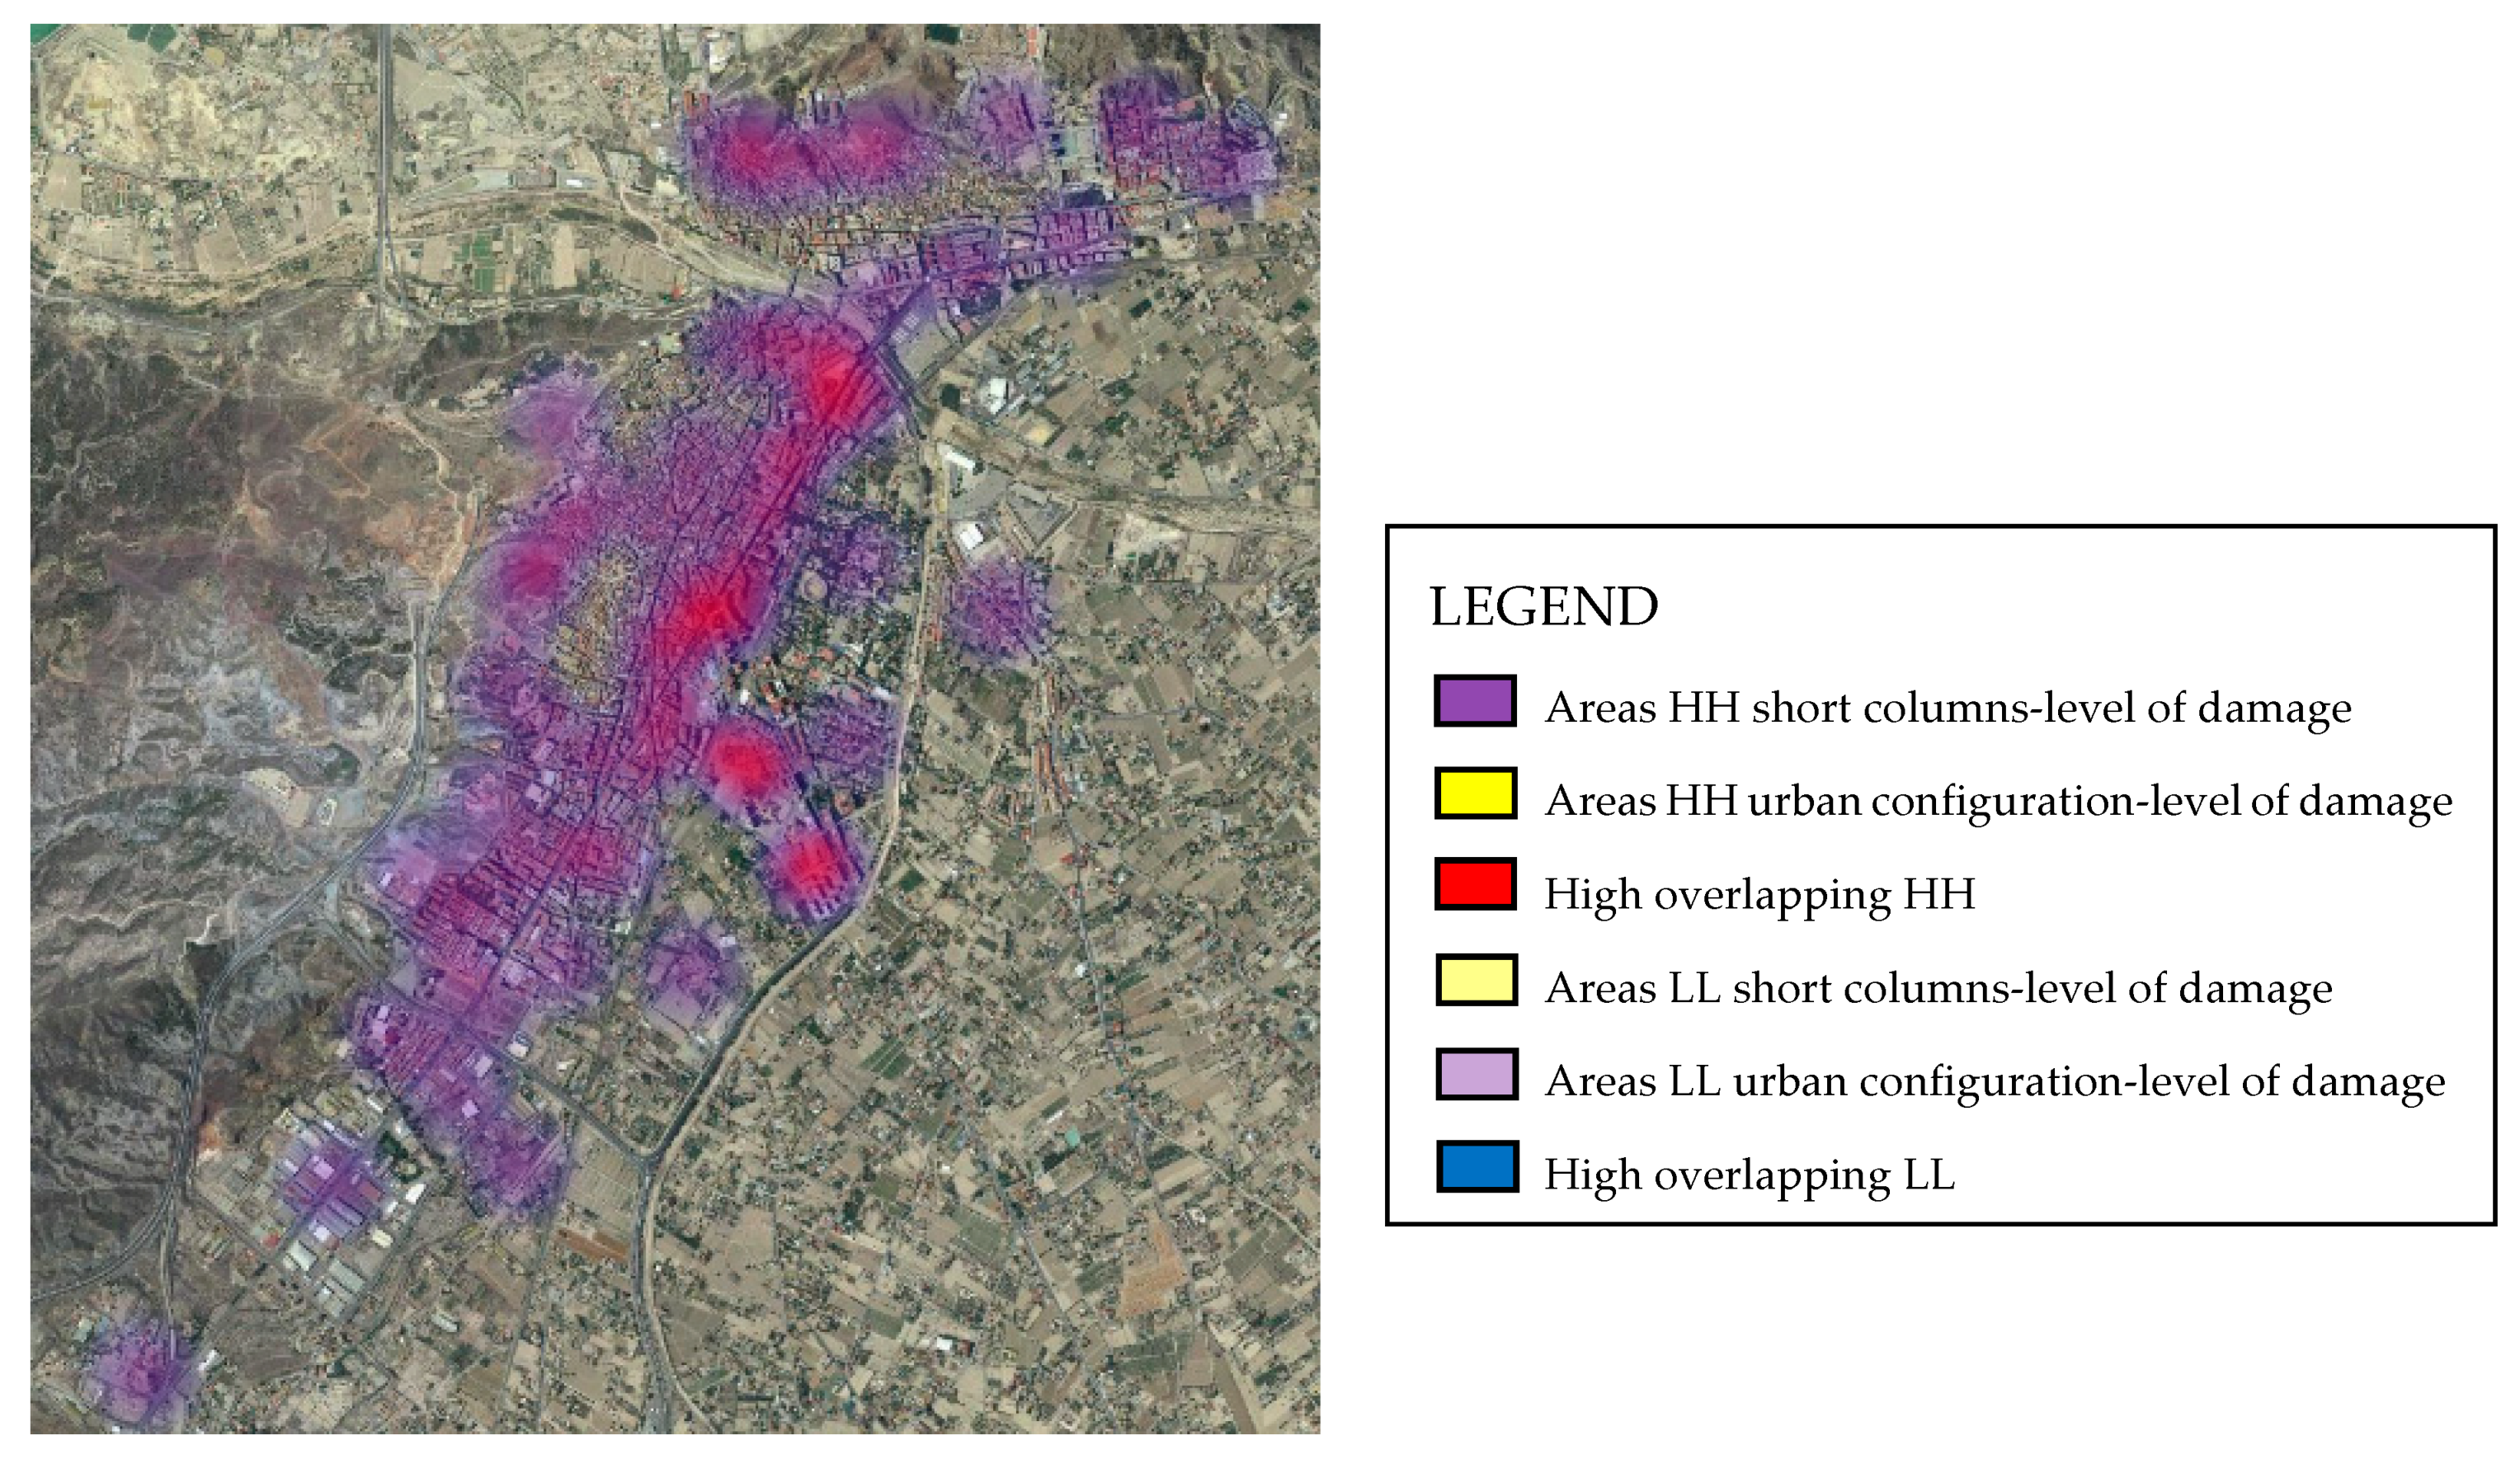
A triangular simulation of the levels of overlap in the geostatistical correlations HH and LL of the pairs “short columns-damage level” and “urban configurations-damage level” is graphed in
Figure 13. In this figure, we can see the intensity level for the two pairs of bivariate geostatistical correlation. As can be observed, we can appreciate areas with HH geostatistical correlation for “short columns-damage level” (in purple) in different parts of the city, but no specific HH areas for “urban configurations-damage level” (in yellow). This is because these areas always overlap with the previous ones (in red), given that all the cases of inadequate urban configuration that generated a high level of damage were always linked to the appearance of short columns in buildings as a result of these urban configurations.
4. Discussion
In light of the results obtained, what should the policy implications in the city of Lorca be to adequately prepare the city for an eventual new earthquake? It is clear that some of the priority axes must be oriented to the most catastrophic phenomena revealed, such as the analysis of buildings that already have short columns or urban and architectural configurations that result in the stock of these (e.g., steep slopes in the streets). In addition, the local urban regulations should discourage these types of elements, which are widely used in this area of Spain because they enable areas such as garages or mezzanines to be illuminated (the buildability of the floors located mostly below ground is currently not computed in urban planning standards, which makes these types of structural elements very attractive, therefore eliminating this incentive in new buildings that use these elements could be an appropriate measure). Another element that has been shown geostatistically to be more closely linked to high levels of damage has been the terrestrial amplification factor. This means that the geotechnical variable is a parameter that must be considered, especially in those buildings that have other vulnerabilities (such as inadequate architectural design). These considerations are convergent with previous studies [
14,
18,
28]. In this case, additional restrictions should be introduced in the buildable land (see
Figure 11) where the situation is close to the areas in which a greater correlation between the soil amplification factor and the maximum damage levels has been found at the spatial level (e.g., neighborhoods of La Viña, San Jose, or Alfonso X). Such restrictions could affect the foundations of buildings located in areas that exceed a certain correlation value, for example forcing the footings to be tied in both directions (or even in specific areas with very high correlation with the maximum level of damage, forcing the foundation of the footings to be replaced by piles).
The phenomenon of soft story, despite the spectacular nature of its damage with the explosion of the enclosures of the ground floors of buildings, has been shown to be far less catastrophic than the previous two (this phenomenon was essentially associated with green and yellow codes). It is a much more generalized phenomenon, in which the repair cost was much lower, since the structures did not collapse or the buildings were subsequently demolished. Therefore, it is not considered essential to modify its current conditioning elements due to the social and economic impact that this would have (local regulations require the commercial premises of buildings to have a height of at least 3.5 m). However, it is considered strategic to restrict excessive configurations that deepen this problem in new buildings (e.g., by limiting the maximum height to 4 m in these cases). This is consistent with the results obtained in seismic phenomena in other cities [
33,
34], but an analysis of these characteristics for a mid-level intensity earthquake has yet to be documented in the current scientific bibliography.
The results clearly refute certain statements made in some media in the first days after the earthquake regarding the possibility that the most damaged buildings were those which were older as a result of their misalignment with current seismic standards. This result is congruent with similar situations in previous work [
11,
12,
16]. In this context, the geostatistical analysis has proved to be a rather interesting approach to carry out a detailed, objective, and multidisciplinary aftershock evaluation for building damage at a large scale in a city. This tool enables one to clearly hierarchize the importance of a phenomenon (e.g., the short column phenomenon) or to reject erroneous theories that can be the result of the partial vision of a scientific discipline or simply the consequence of an interested analysis.
In relation to the directivity phenomenon wielded in previous work [
20], the results are inconclusive. Although a clear geostatistical correlation can be seen at a geotechnical level, it is observed that the results obtained in the analysis of the urban configuration of the streets and buildings are in fact contingent upon the existence of short columns in the buildings. In addition, the indicator relating to seismological parameters does not offer a significant spatial correlation with the levels of damage to buildings. Therefore, although this theory cannot be ruled out in the light of the results, this methodology does not offer relevant conclusions either.
One issue that remains pending to be addressed in the study is to more accurately assess the weight of the victims together with the economic damage in the geostatistical analysis (given that the main purpose of the analysis must be to better prepare cities against future earthquakes). In the case of the Lorca earthquake, the victims were not due to the collapse of buildings, for example, but were entirely due to the projection of facades, parapets and other non-structural elements, poorly designed for an earthquake, which could be considered included in the indicator (“Inadequate seismic design in architectural configuration of buildings”). It is also true that one third of the victims were due to projections of a building that collapsed due to the failure of short columns, so the importance in this aspect of indicator (“Existence of short columns in buildings”) may also be taken into account. In any case, fortunately there were only nine victims in this earthquake, so it has been considered that we did not have a significant enough sample at a numerical and spatial level to statistically analyze the effect of each of the phenomena studied for this field in a reliable way. Therefore, the spatial distribution of this parameter has not been considered in the calculations, since it is understood that there is not enough critical mass of victims to establish a statistical correlation, with the spatial distribution at the numerical level being possibly more the result of chance than due to scientific issues. However, in future studies of more catastrophic seismic events in larger cities it may be of great interest to implement this variable as a corrective factor added to the damage indicator or even as an independent factor so that the statistical analysis is conducted in three bands: phenomenon-victims-damage in buildings.
Therefore, we can indeed conclude that geostatistical analysis is a useful tool for post-earthquake diagnosis and the development of strategies against future earthquakes in a city. However, it is clear that this is an approach with a methodology that requires important inputs in order to be implemented. On the one hand, the existence of previous studies is necessary to develop indicators that reliably model all of the earthquake-derived phenomena that theoretically generated the most important damage. On the other hand, the existence of a geolocated database that has inventoried all of the damage in the city in a homogeneous way and following standardized technical criteria is also essential. These two boundary conditions are not always available after an earthquake. However, the geostatistical approach has proved to be very useful because in many cases, such as the one studied, the main variables of the earthquake damage are not clear. The methodology is able to prioritize the importance of the effects belonging to different disciplines, whilst also detecting linkages not detectable at first sight between different phenomena. It is, therefore, an innovative approach in this field of research that can be improved in the coming years, with new applications implemented thanks to the strong technological development of GIS analysis tools.
Finally, how could the results obtained be translated into measures to be implemented in a seismic risk mitigation strategy in the case study of Lorca? As has been pointed out, it is evident that the construction of short columns has to be strongly discouraged, forcing the buildings to implement extra measures of structural safety against the earthquake if these are essential. This issue must be implemented in the urban planning standards of the city in order to authorize new licenses for the construction of buildings. Likewise, all those buildings that have these types of construction in their structure should be reviewed. Another important issue in developing an optimal anti-earthquake strategy is taking care of the architectural and urbanistic configuration of the city. Although some issues in this area, such as the separation between buildings, have not been observed as determinant because of the limited impact of phenomena such as pounding, urban planning of the city must include the seismic variable in its future development, since certain linkages with short columns phenomena has been observed. The orographic structure of the streets and the development of non-recommended architectural elements, such as long unbraced parapets on the cornices of buildings, have also been shown to be some of the variables directly or indirectly linked to the main damage. These considerations should, therefore, be included in the future masterplan of the city, paying special attention to the results obtained in the most damaged neighborhoods. As a final point, the incorporation of the spatial bivariate variables is also very interesting. The statistically contrasted importance of the soil amplification capacity of damage according to its nature invites reflection on how to approach this issue. In Spain, the seismic regulations influence the need to tie the foundations of buildings according to the value of an acceleration parameter that is distributed by large zones throughout the territory, including some small local modifiers. In the case of Lorca, the characterization of these local modifiers may have been insufficient, with spatially quite heterogeneous distributions being found within the urban space of the city itself. Therefore, it would be interesting in the framework of the development of an earthquake mitigation risk strategy to develop urban seismic micro-zoning of the city to contrast the results with the geostatistical analysis for the buildable land. This operation would help to establish more precise thresholds on the soil amplification capacity (whose effect has been detected as being quite important in damage distribution) in relation to the effects of an earthquake and how this should be translated into the foundation configurations of the different zones determined by the micro-zoning in the city.


