Article

Three-Dimensional (3D) Modeling of Cultural Heritage Site Using UAV Imagery: A Case Study of the Pagodas in Wat Maha That, Thailand

by
Supaporn Manajitprasert
*,
Nitin K. Tripathi
and
Sanit Arunplod
Remote Sensing and Geographic Information Systems Field of Study, School of Engineering and Technology, Asian Institute of Technology, P.O. Box 4, Klong Luang, Pathumthani 12120, Thailand
*
Author to whom correspondence should be addressed.
Submission received: 1 August 2019 / Revised: 27 August 2019 / Accepted: 28 August 2019 / Published: 4 September 2019

Abstract

:

Featured Application

UAV-SfM was applied for generating 3D pagoda models in Thailand.

Abstract

As a novel innovative technology, unmanned aerial vehicles (UAVs) are increasingly being used in archaeological studies owing to their cost-effective, simple photogrammetric tool that can produce high-resolution scaled models. This study focuses on the three-dimensional (3D) modeling of the pagoda at Wat Maha That, an archaeological site in the Ayutthaya province of Thailand, which was declared a UNESCO World Heritage Site of notable cultural and historical significance in 1991. This paper presents the application of UAV imagery to generate an accurate 3D model using two pagodas at Wat Maha That as case studies: Chedi and Prang. The methodology described in the paper provides an effective, economical manner of semi-automatic mapping and contributes to the high-quality modeling of cultural heritage sites. The unmanned aerial vehicle structure-from-motion (UAV-SfM) method was used to generate a 3D Wat Mahathat pagoda model. Its accuracy was compared with a model obtained using terrestrial laser scanning and check points. The findings indicated that the 3D UAV-SfM pagoda model was sufficiently accurate to support pagoda conservation management in Thailand.

1. Introduction

During the last decade, UAV-imaging has developed rapidly, enabling advancements in three-dimensional (3D) modeling for preservation, documentation, and management of cultural heritage sites [1,2]. Terrestrial surveying using terrestrial laser scanners is accepted for producing high-quality cultural heritage images, while the advent of robotic total stations has enabled researchers to gather large quantities of data more easily than ever before [3,4,5,6]. Unfortunately, the use of such geomatics-based approaches requires considerable expertise and a large surveying budget [2]. Alternatively, unmanned aerial vehicles (UAVs) can be used to easily and feasibly acquire 3D models. Furthermore, imaging using UAVs can be conducted economically and offers an ideal means for surveying complex archaeological sites [7,8,9]. There are different forms of UAVs, including fixed-wing [10], multi-rotor [11], and gyro. Furthermore, current platforms such as quadrotor [12] are more robust than their previous forms, due to their vertical take-off and landing capability, insensitivity to varying environments, high mobility and stability, and ease of operation [13,14]. The combination of computer vision and photogrammetry present in [15] has the following advantages: (1) Remote control systems, permitting the UAV to be perfectly positioned to collect images at varying heights and angles; (2) different sensors, ensuring that different image types can be used, including infrared, visible-spectrum, and thermal images captured from both calibrated and non-calibrated cameras, and (3) high-quality outcomes, enabling a researcher to control the reliability and accuracy of the results.
This study focuses on the low cost, portability, and completeness provided by the unmanned aerial vehicle structure-from-motion (UAV-SfM) method for cultural heritage site management. Two pagodas in Wat Maha That, Thailand (Chedi and Prang) are considered as a case study. The results demonstrate the accuracy of 3D models obtained using ground control points (GCPs), checkpoints (CPs), and terrestrial laser scanning (TLS). The study aims to apply the UAV-SfM method, which is cost-effective, convenient, and provides acceptable accuracy for building the 3D models compared with traditional techniques, such as TLS. The constructed 3D model could be employed in different applications in the future, such as tourism and generating the rapid mapping of cultural heritage in a short period, while ensuring acceptable quality.

2. Previous Work

Several previous studies have sought to use UAV technology for archaeological projects. Among these, Brutto [16] used the microdrone MD4-200 and the Sensefly Swinglet CAM UAV to photogrammetrically record the Temple of Isis. The equipment used in this case consisted of two UAV systems with different performance and characteristics fitted using a global station. Nadhirah and Khairul [17] proposed the use of UAV photogrammetry as a tool to capture and generate a 3D model in Negeri Sembilan, Malaysia.
Several other authors have used UAVs with certain geotechnological approaches; for example, Ebolese [18] used UAVs to produce a high-resolution 3D model of Lilybaeum, the ancient city of Marsala in Southern Italy. Chiabrando [19] studied an archaeological site in Hierapolis, Phrygia, Turkey, using UAV photogrammetry to collect aerial images of the site. Stek [20] used an inexpensive method involving drones to collect particularly high-quality spatial geoinformation, which could be employed to study the landscape archaeology at Le Pianelle in the Tappino Valley of Molise, Italy. Bolognesi [21] used a remotely piloted aircraft system for aerial photogrammetry at the Delizia del Verginese Castle of Italy. This was combined with a terrestrial laser scanner to generate a 3D archaeological model.
Research indicates that UAVs can be used for low-altitude imaging and remote sensing of spatial data [7,22,23,24]. UAVs are used for exploring cultural heritage sites because they are reliable and easy to use [25,26]. The latest developments in photogrammetry technology provide a simple, cost-effective manner to create a relatively accurate 3D model from 2D images [27,28]. These techniques provide a new set of tools for cultural heritage professionals to capture, store, process, share, and display images and annotate 3D models in the field. A review by Colomina and Molina [7] showed that the use of UAVs in the exploration of cultural heritage is increasing, owing to the ease of use and quality of processed measurements.

3. Materials and Methods

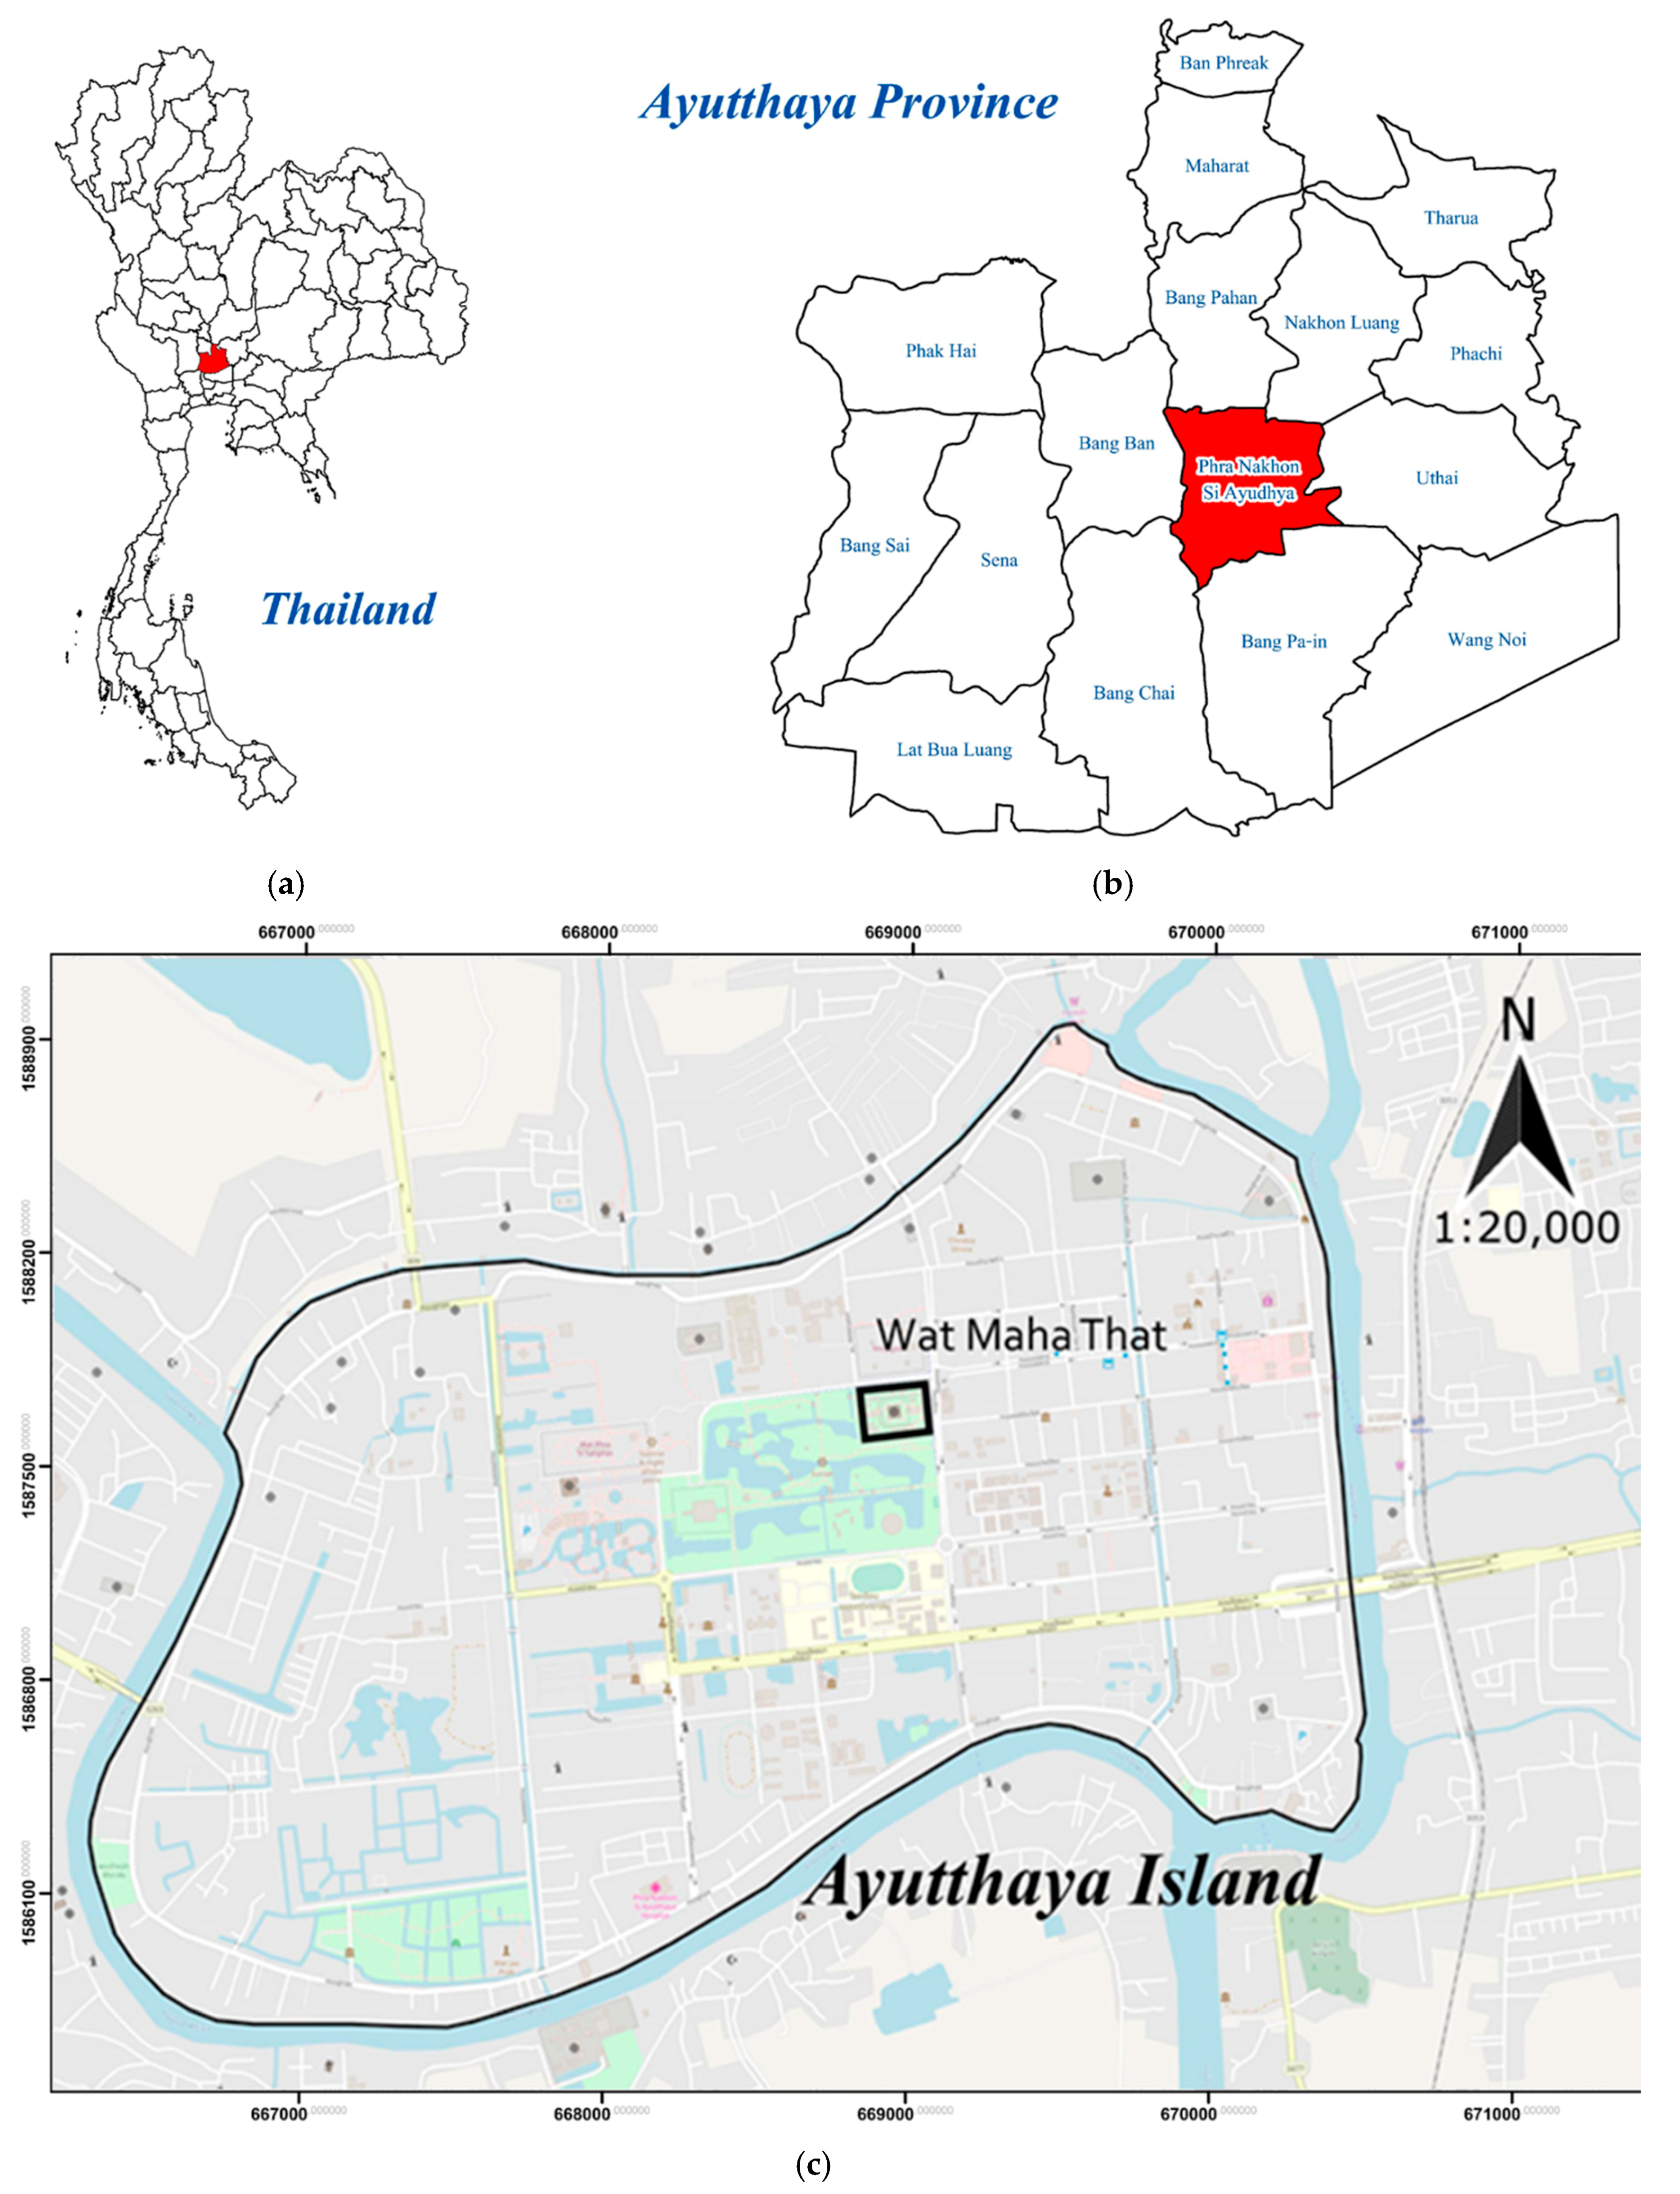
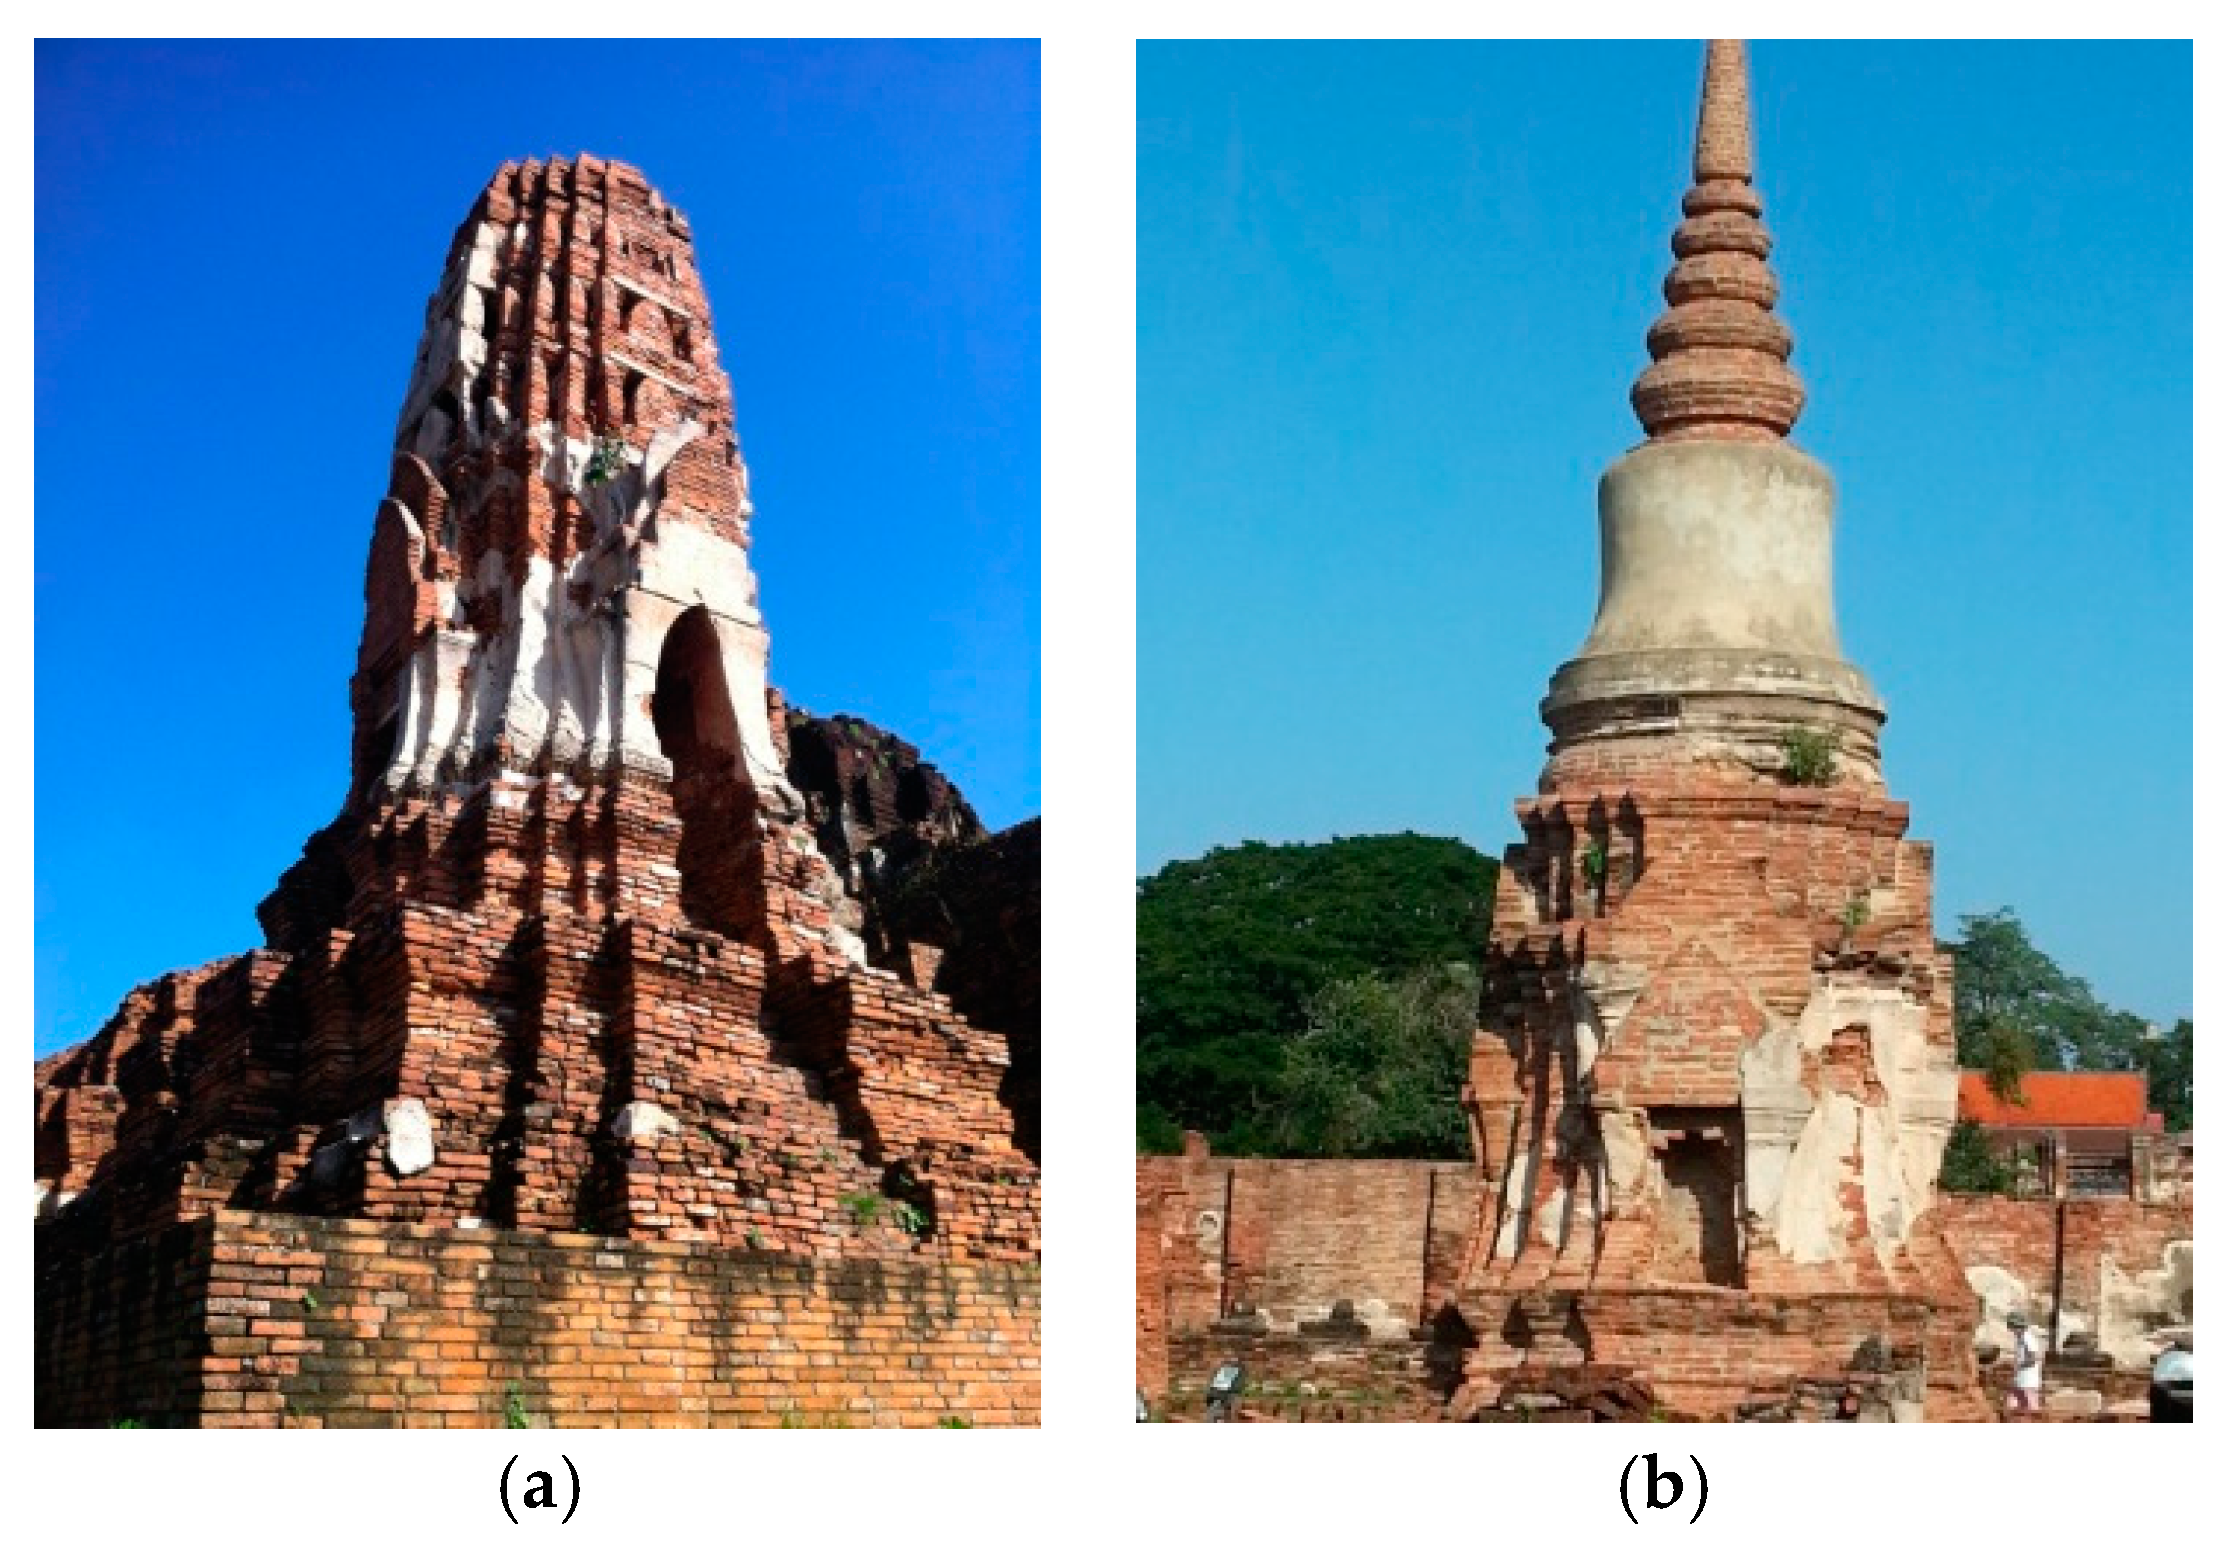
3.1. Cultural Heritage Sites: Wat Maha That, Thailand

The Wat Maha That site, including the site of the studied pagoda, is located at Ayutthaya, which was historically one of Thailand’s capitals and is now a UNESCO World Heritage site. The city is located 85 km directly north of Bangkok. A historical park forms an important part of the city and is home to several culturally significant ancient temples. The historical park was granted UNESCO World Heritage status in 1991. This was justified under criteria III, which held that the site could be deemed an excellent witness to a period in which a true national form of Thai art was developed [29].
As shown in Figure 1, Wat Maha That is situated east of the Ayutthaya Island. It was a temple that held royal status and was considered the most sacred during the Ayutthaya period. The main Mahathat Chedi (bell-shaped pagoda) and Mahathat Prang (towering corn-cob pagoda) pagodas (Figure 2) contain relics from Buddha. At one point in history, these were temples where the Supreme Patriarch (head of the order of Buddhist monks in Thailand) resided.
The Ayutthaya Chronicle [29] reported that the construction of the Mahathat Chedi commenced in 1374 during the reign of Phra Borom Rajathirat I and was completed under the reign of King Ramesuan. The foundation of the pagoda collapsed during the reign of King Song Tham, but was later reconstructed under King Prasat Thong’s reign. Finally, the temple was destroyed and burned during the Burmese invasion in 1767 and has since been left in ruins.

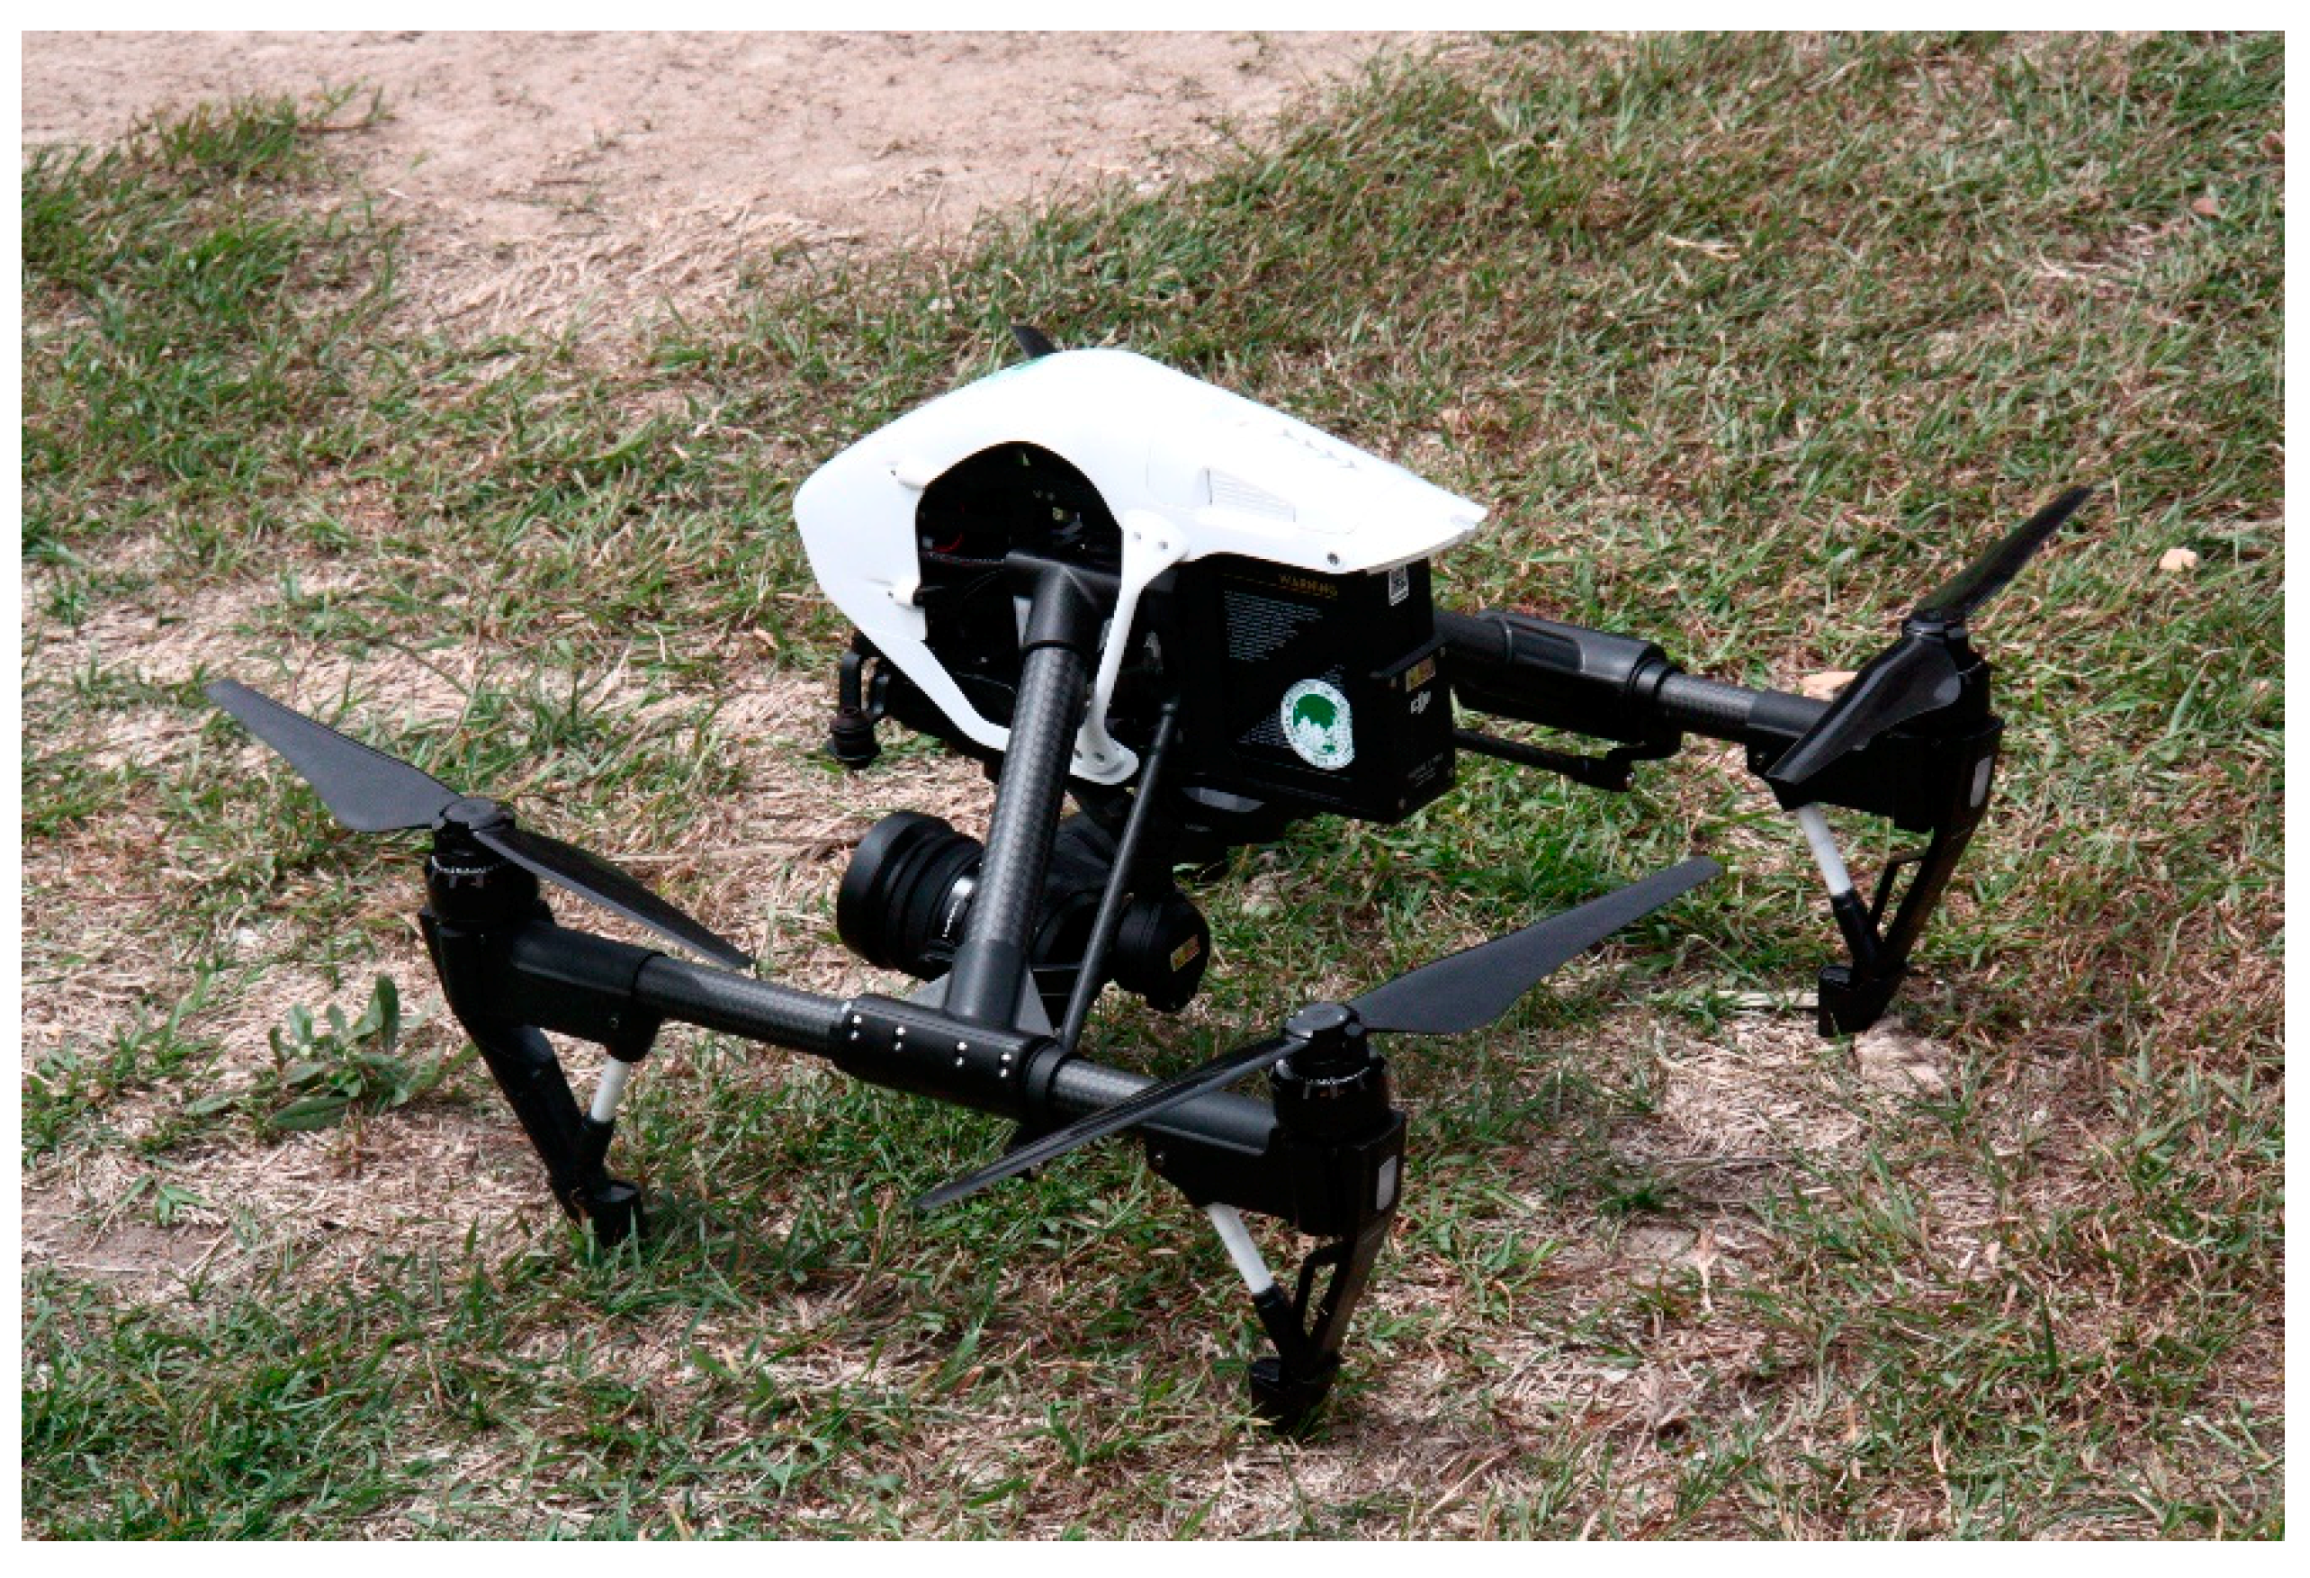
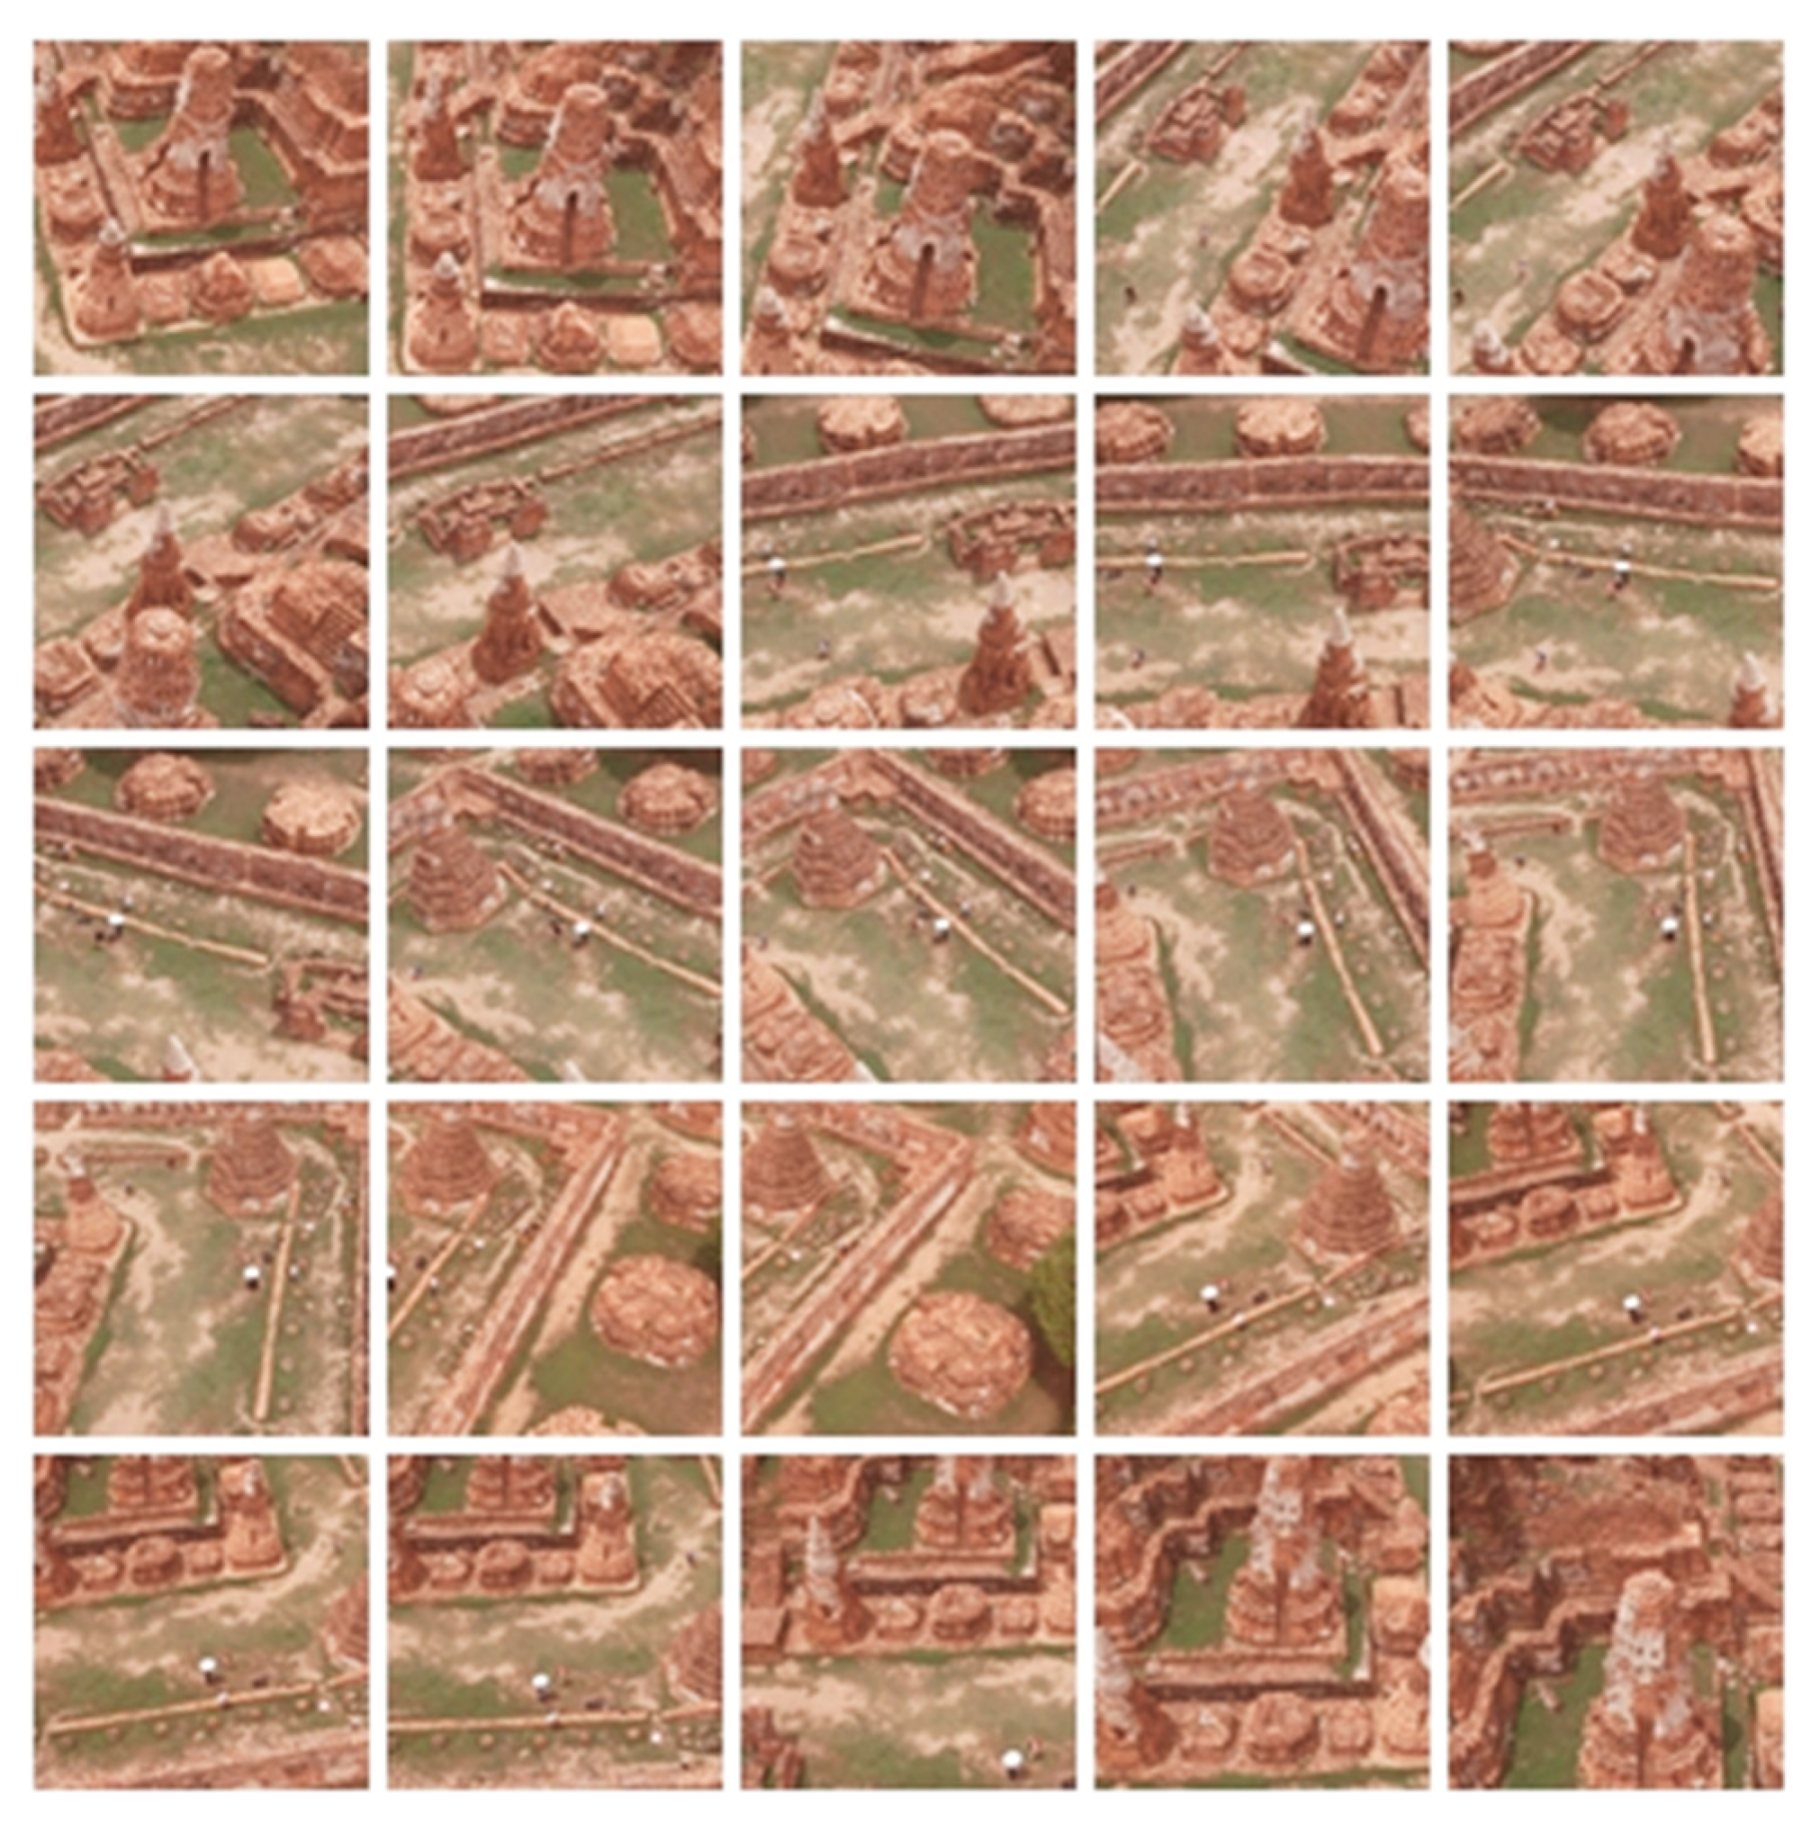
3.2. Image Acquisition Using UAVs

In the study, the DJI Inspire 1 Pro UAV platform (Figure 3), a Zenmuse X5 digital camera fitted with a global navigation satellite system (GNSS) and an interchangeable lens that can be operated in the real-time kinematic (RTK) mode was used to take 417 images of the Wat Maha That.

3.3. Flight Planning and Control

To collect high-quality data, it is necessary to carefully plan the UAV flight according to the technical limitations and attributes of the platform, its equipment, and sensors. To create the plan, it is first necessary to conduct visits to the site or gain access to detailed maps. A plan can then be created in stages:
  • A photogrammetric block is designed;
  • The flight path of the strips, along with their forward and side overlaps, are established;
  • The theoretical scale is determined using ground sample distance (GSD) calculations.
The photogrammetric block is determined by the size and location of the archaeological site and comprises take-off and landing points, along with the initial flight direction. From a theoretical perspective, the plan includes external orientation parameters (spatial and angular positions: X0, Y0, Z0, ω, φ, and κ) and internal camera parameters (principal point and principal distance: X0, Y0, and c). The latter are set by the manufacturer of the camera. Once these parameters have been determined, it is possible to calculate the scale, flight altitude, side and forward image overlaps, number of strips, and number of images to be collected for each strip. If the platform does not feature gyro-stabilization, incorrect positioning will likely occur, necessitating the use of GNSS observations, i.e., GCPs (Figure 4). The final step is to ensure that the flight adheres to the original flight plan. This is accomplished using geometric controls, which ensure that the thresholds do not exceed certain criteria:
  • The vertical deviation of the image must be controlled by monitoring the angle between the optical axis and the nadir direction at the projection center.
  • Changes in direction and the drift effect must be controlled by monitoring the difference in the image coordinate system between the flight axis and the x-axis directions. In a planned flight, the theoretical value is 0° because the x-axis and the flight axis are in alignment.
  • The scale must be controlled. During digital photogrammetric flights, the definition of theoretical scale depends on the pixel size that is projected to the ground. Maintaining a constant GSD requires the ground to be a plane, but this is rarely the case in practice. The GSD is therefore dependent on the flight altitude and ground elevation, and can be calculated at any given point using a digital elevation model. The main aim is therefore to obtain an estimate for the GSD for each image and for each strip, which will eventually provide the mean GSD for the entire photogrammetric block upon completion of the flight.
  • The extent of the overlap must also be controlled. After calculating the scale and GSD, it is necessary to verify the forward and side overlaps that rise between images and between strips (Figure 5). This is essential, owing to the high degree of correlation between the altitude, GSD, and overlap values. The control of overlap depends on the verification of the side overlap between images and strips, and the forward overlap found between sequential images and strips.
As this particular platform type has no gyro-stabilizers and the GNSS is not highly accurate, it is necessary to use relatively wide limits to control the capture of images geometrically. Forward and side overlap limits are set at a minimum of 80% and 40%, respectively, while the error of the camera position is 3 m, and errors for the angular deviations are 0.2° (φ), 2° (φ), and 0.2° (κ). The greatest variation is 10% over the mean GSD size. Flight directional changes are restricted to a maximum of 2°.
The flight was planned at an approximate altitude of 50 m, over an area of approximately 1 ha. The flight captured a total of 417 images in three west–east strips, with ten images per strip, a minimum forward overlap of 80%, and a minimum side overlap of 40% (Table 1).

3.4. Reference Measurements

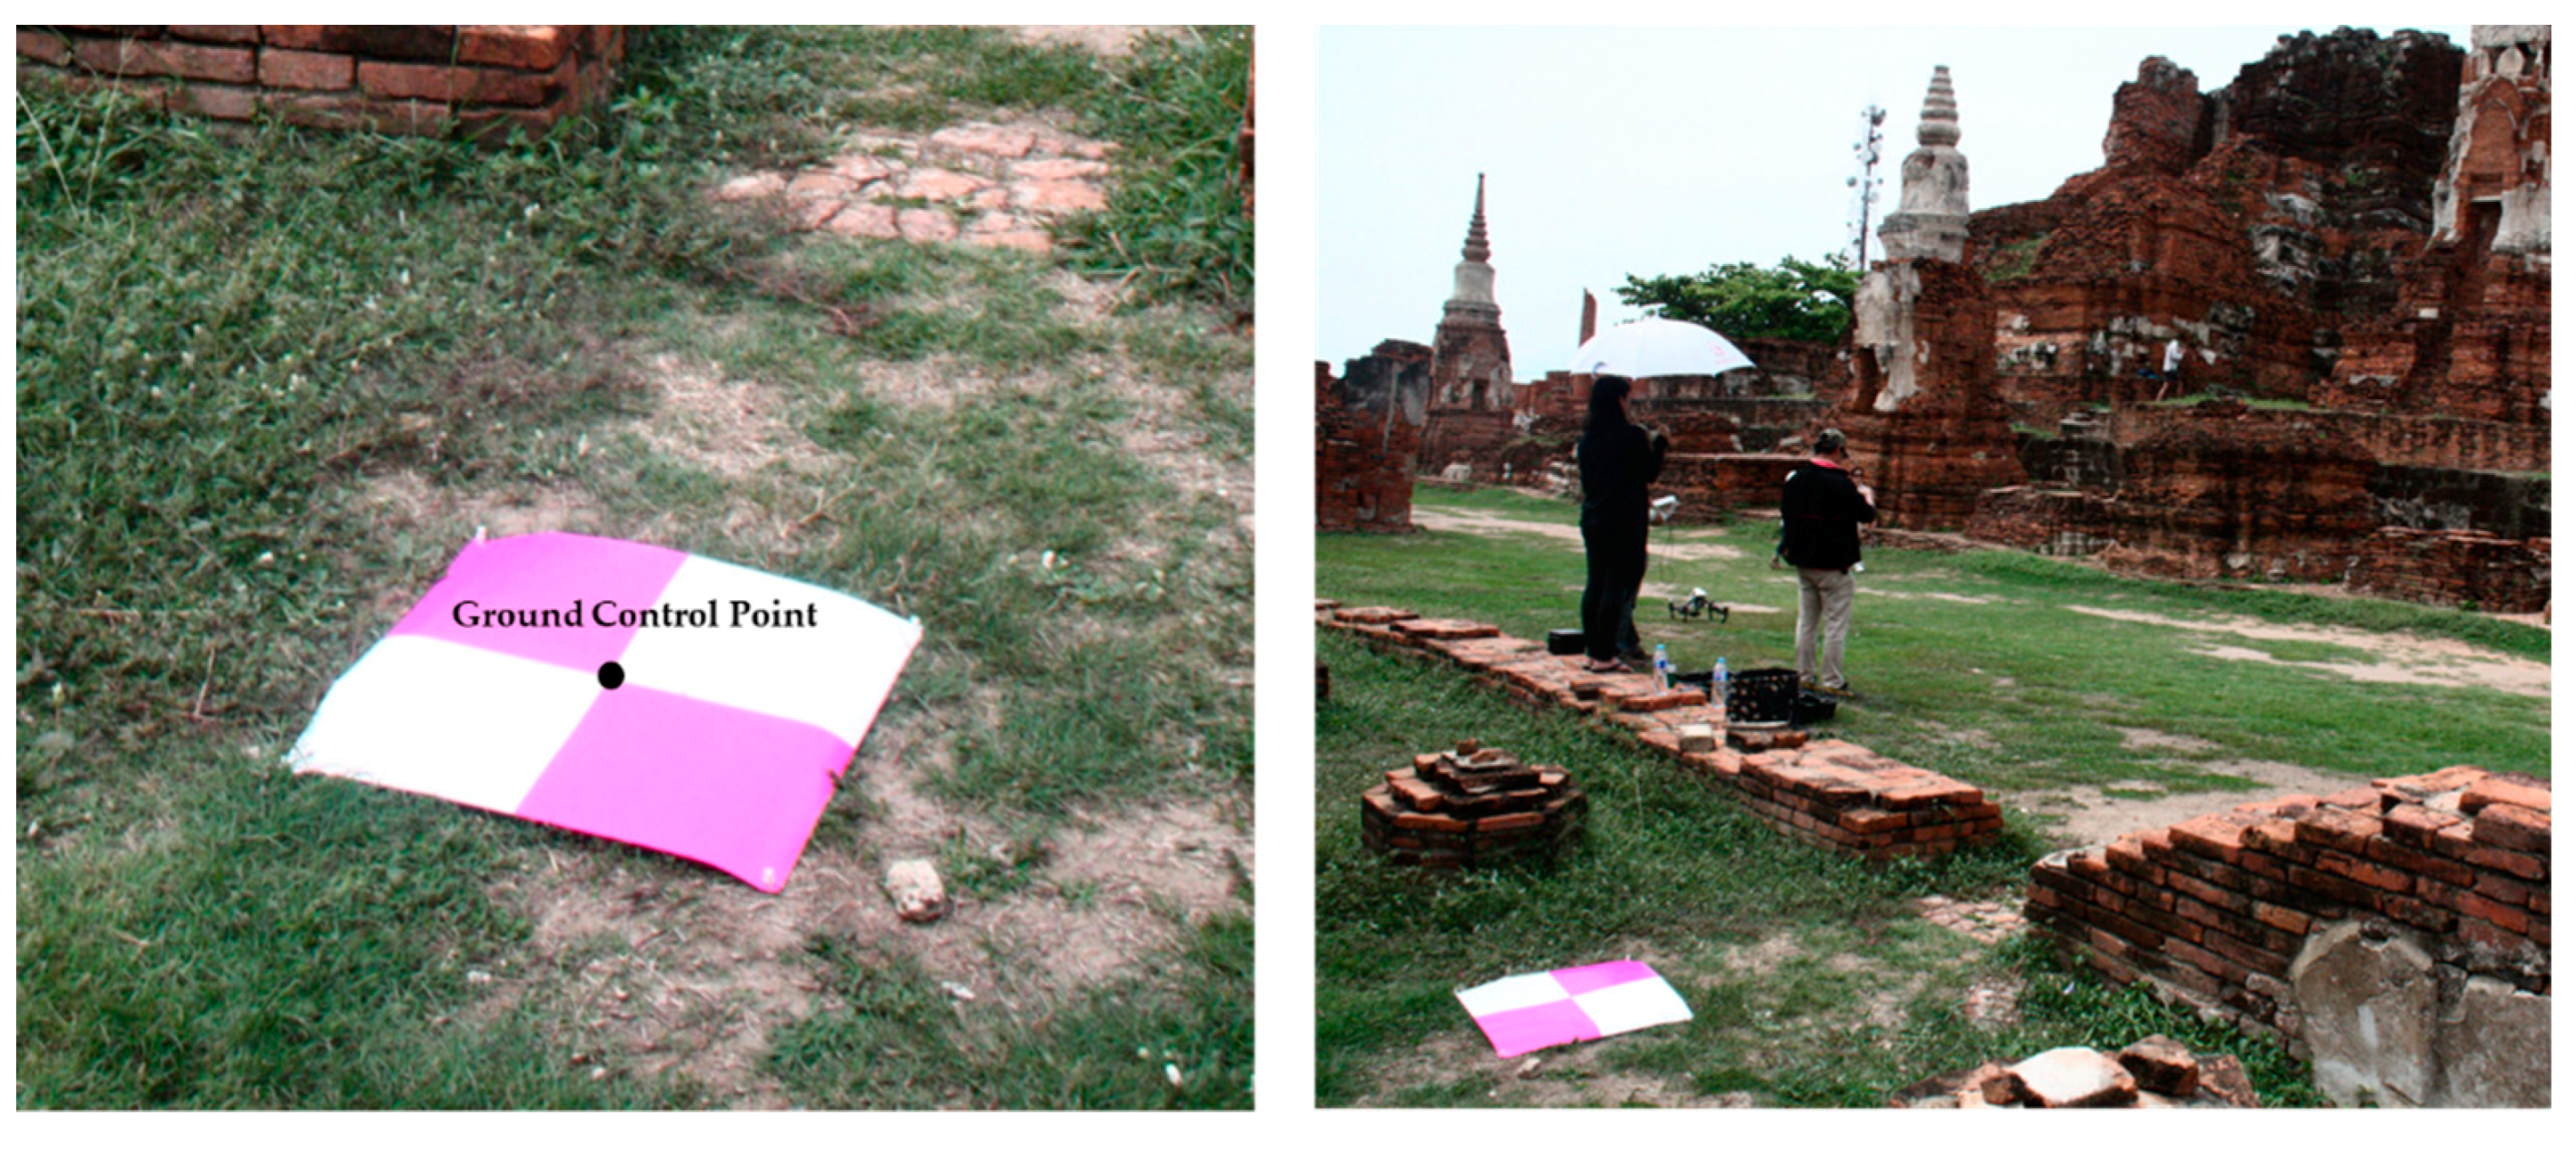
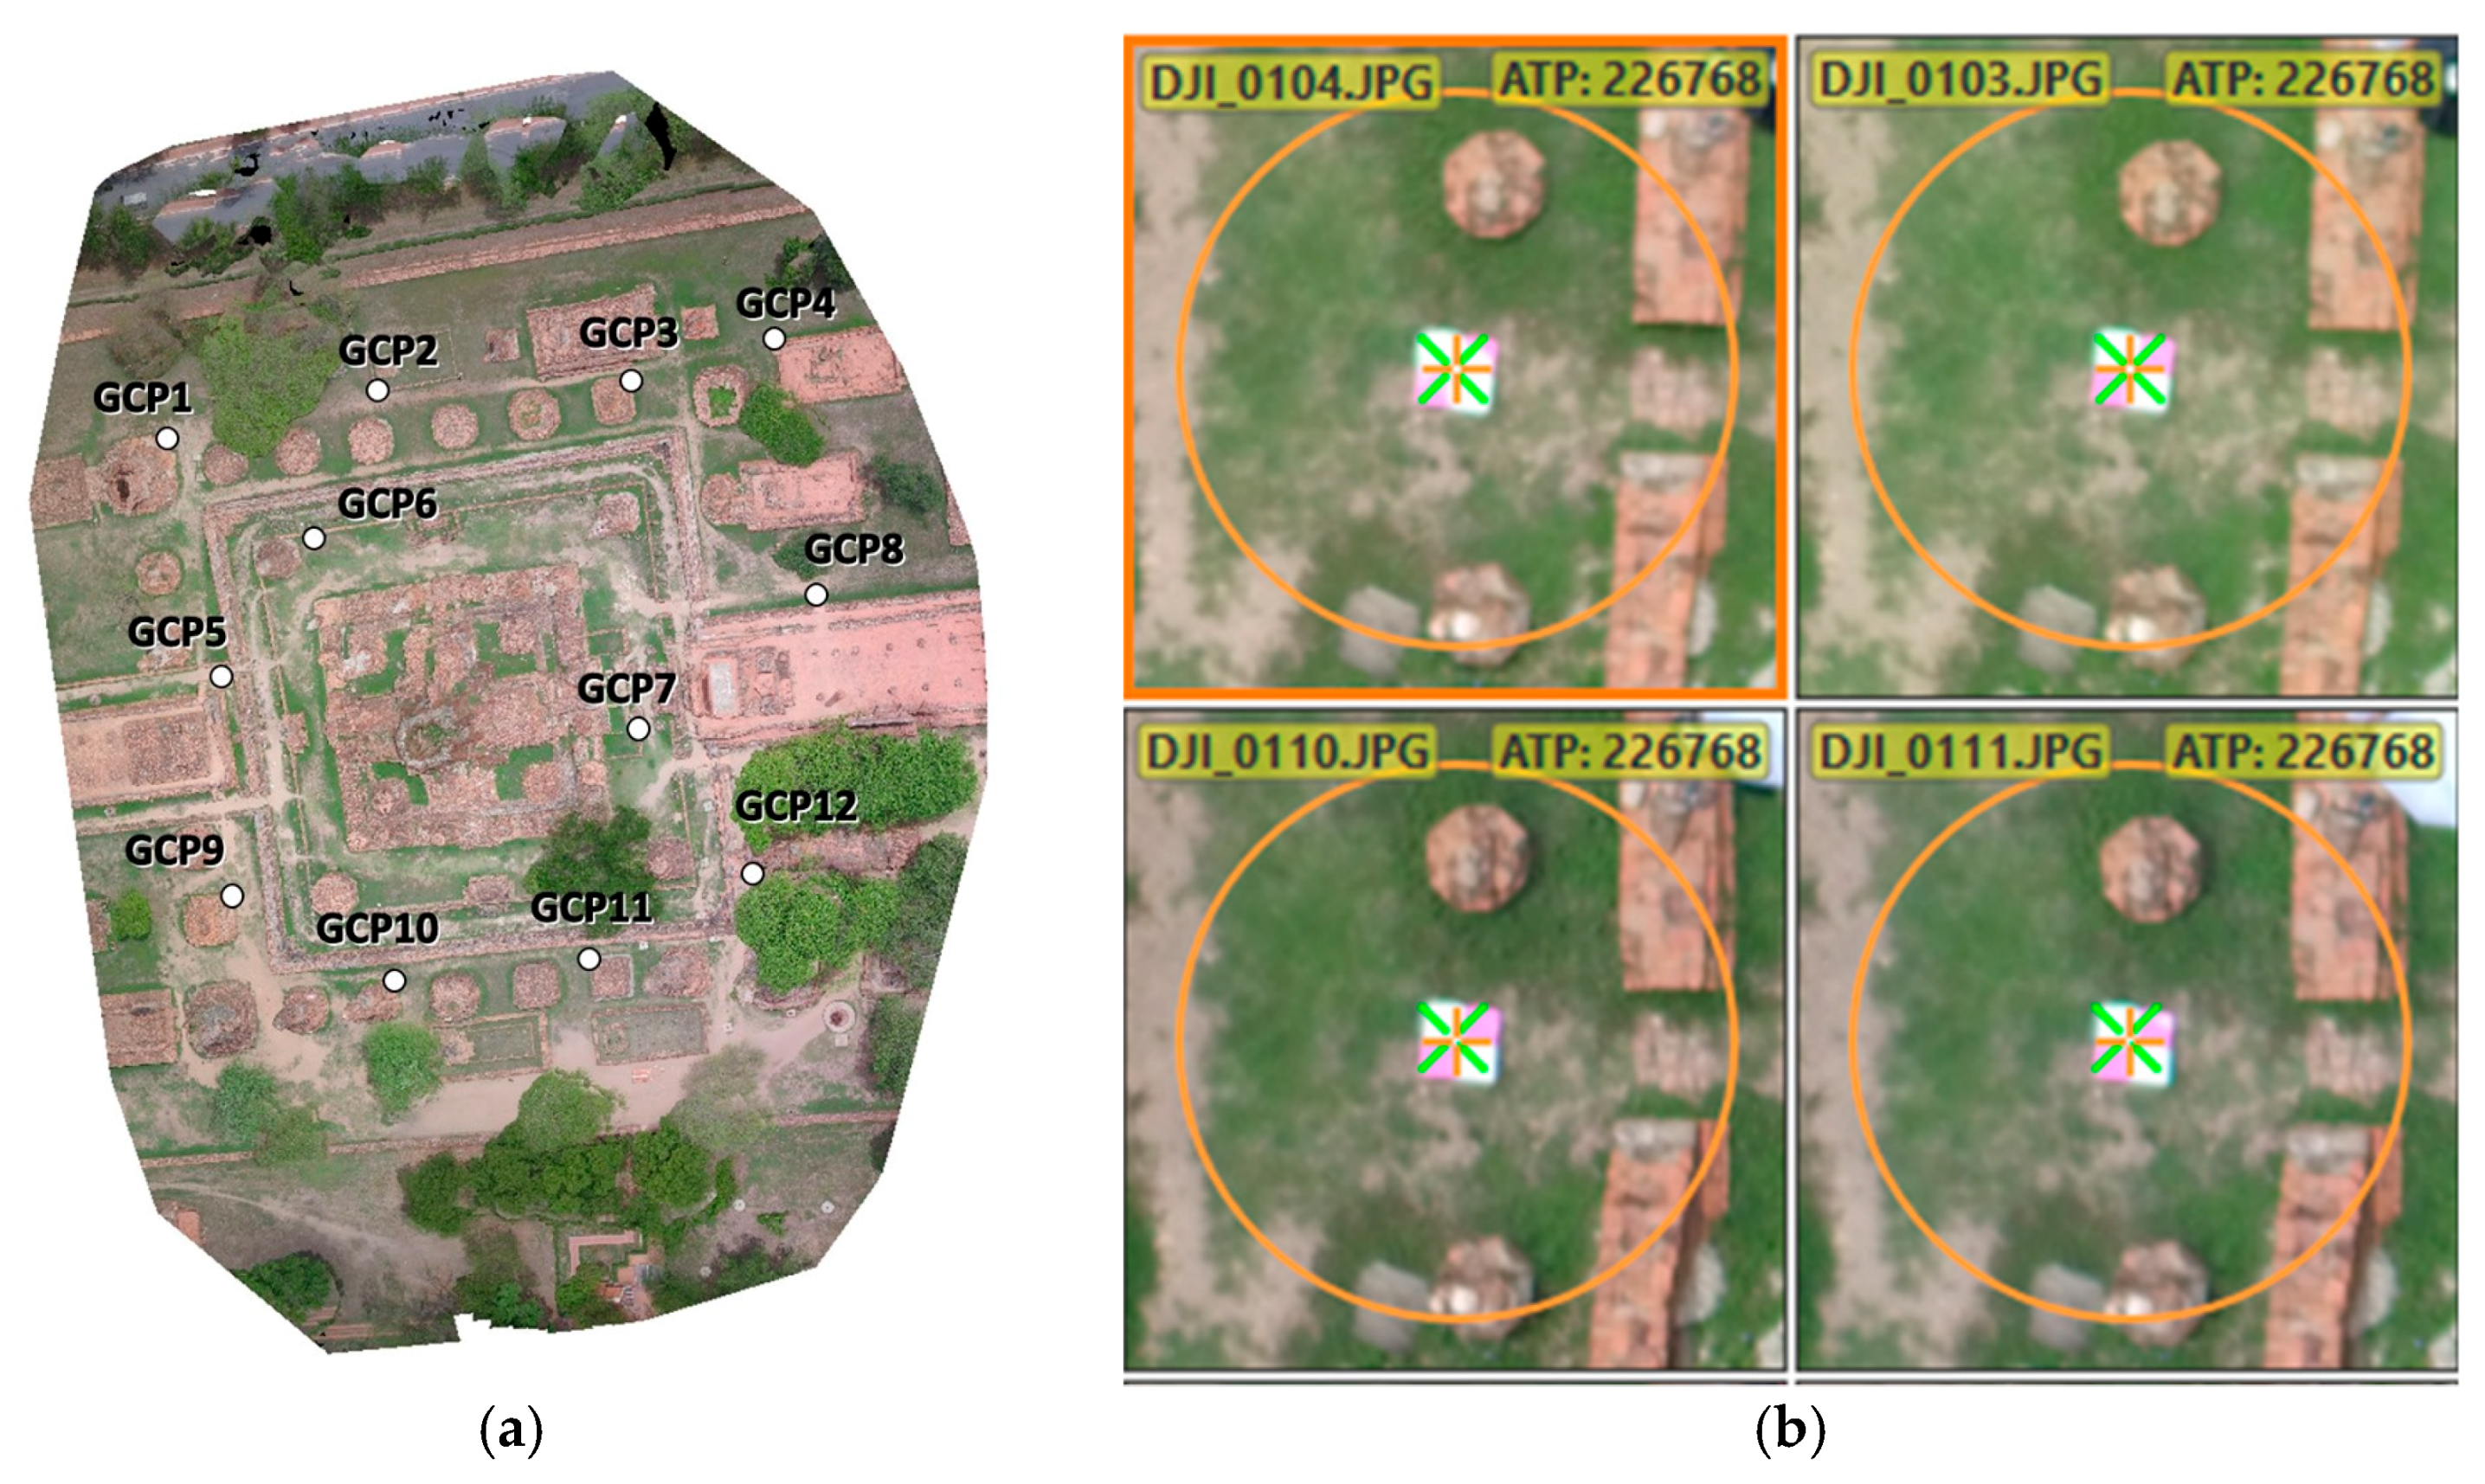
3.4.1. GCPs Measurements

GCPs were placed on natural features, such as the corner of the pagoda, and several on the interior of the interested area to assess the accuracy of the UAV-SfM method. Checkpoints (CPs) were used to check the pagoda accuracy in detail, and points were placed on the nature features of the pagoda façade.

3.4.2. Terrestrial Laser Scanning

The accuracy of a UAV-derived model was compared with that of the TLS data model, using a Riegl LMS-Z210 scanner recorded from multiple stations with high and medium resolution. TLS is a reference data model—its point cloud referred to known control points received from the RTK total station survey from benchmarks given by the Royal Thai Survey Department. The TLS device was set up at first at known XYZ coordinates, which were initiated from the total station. Finally, the result was applied as a reference for the UAV model. The accuracy of TLS is 3–5 mm. The 3D pagoda model was developed using the standard procedure implemented by CloudCompare software.

3.5. Image Processing

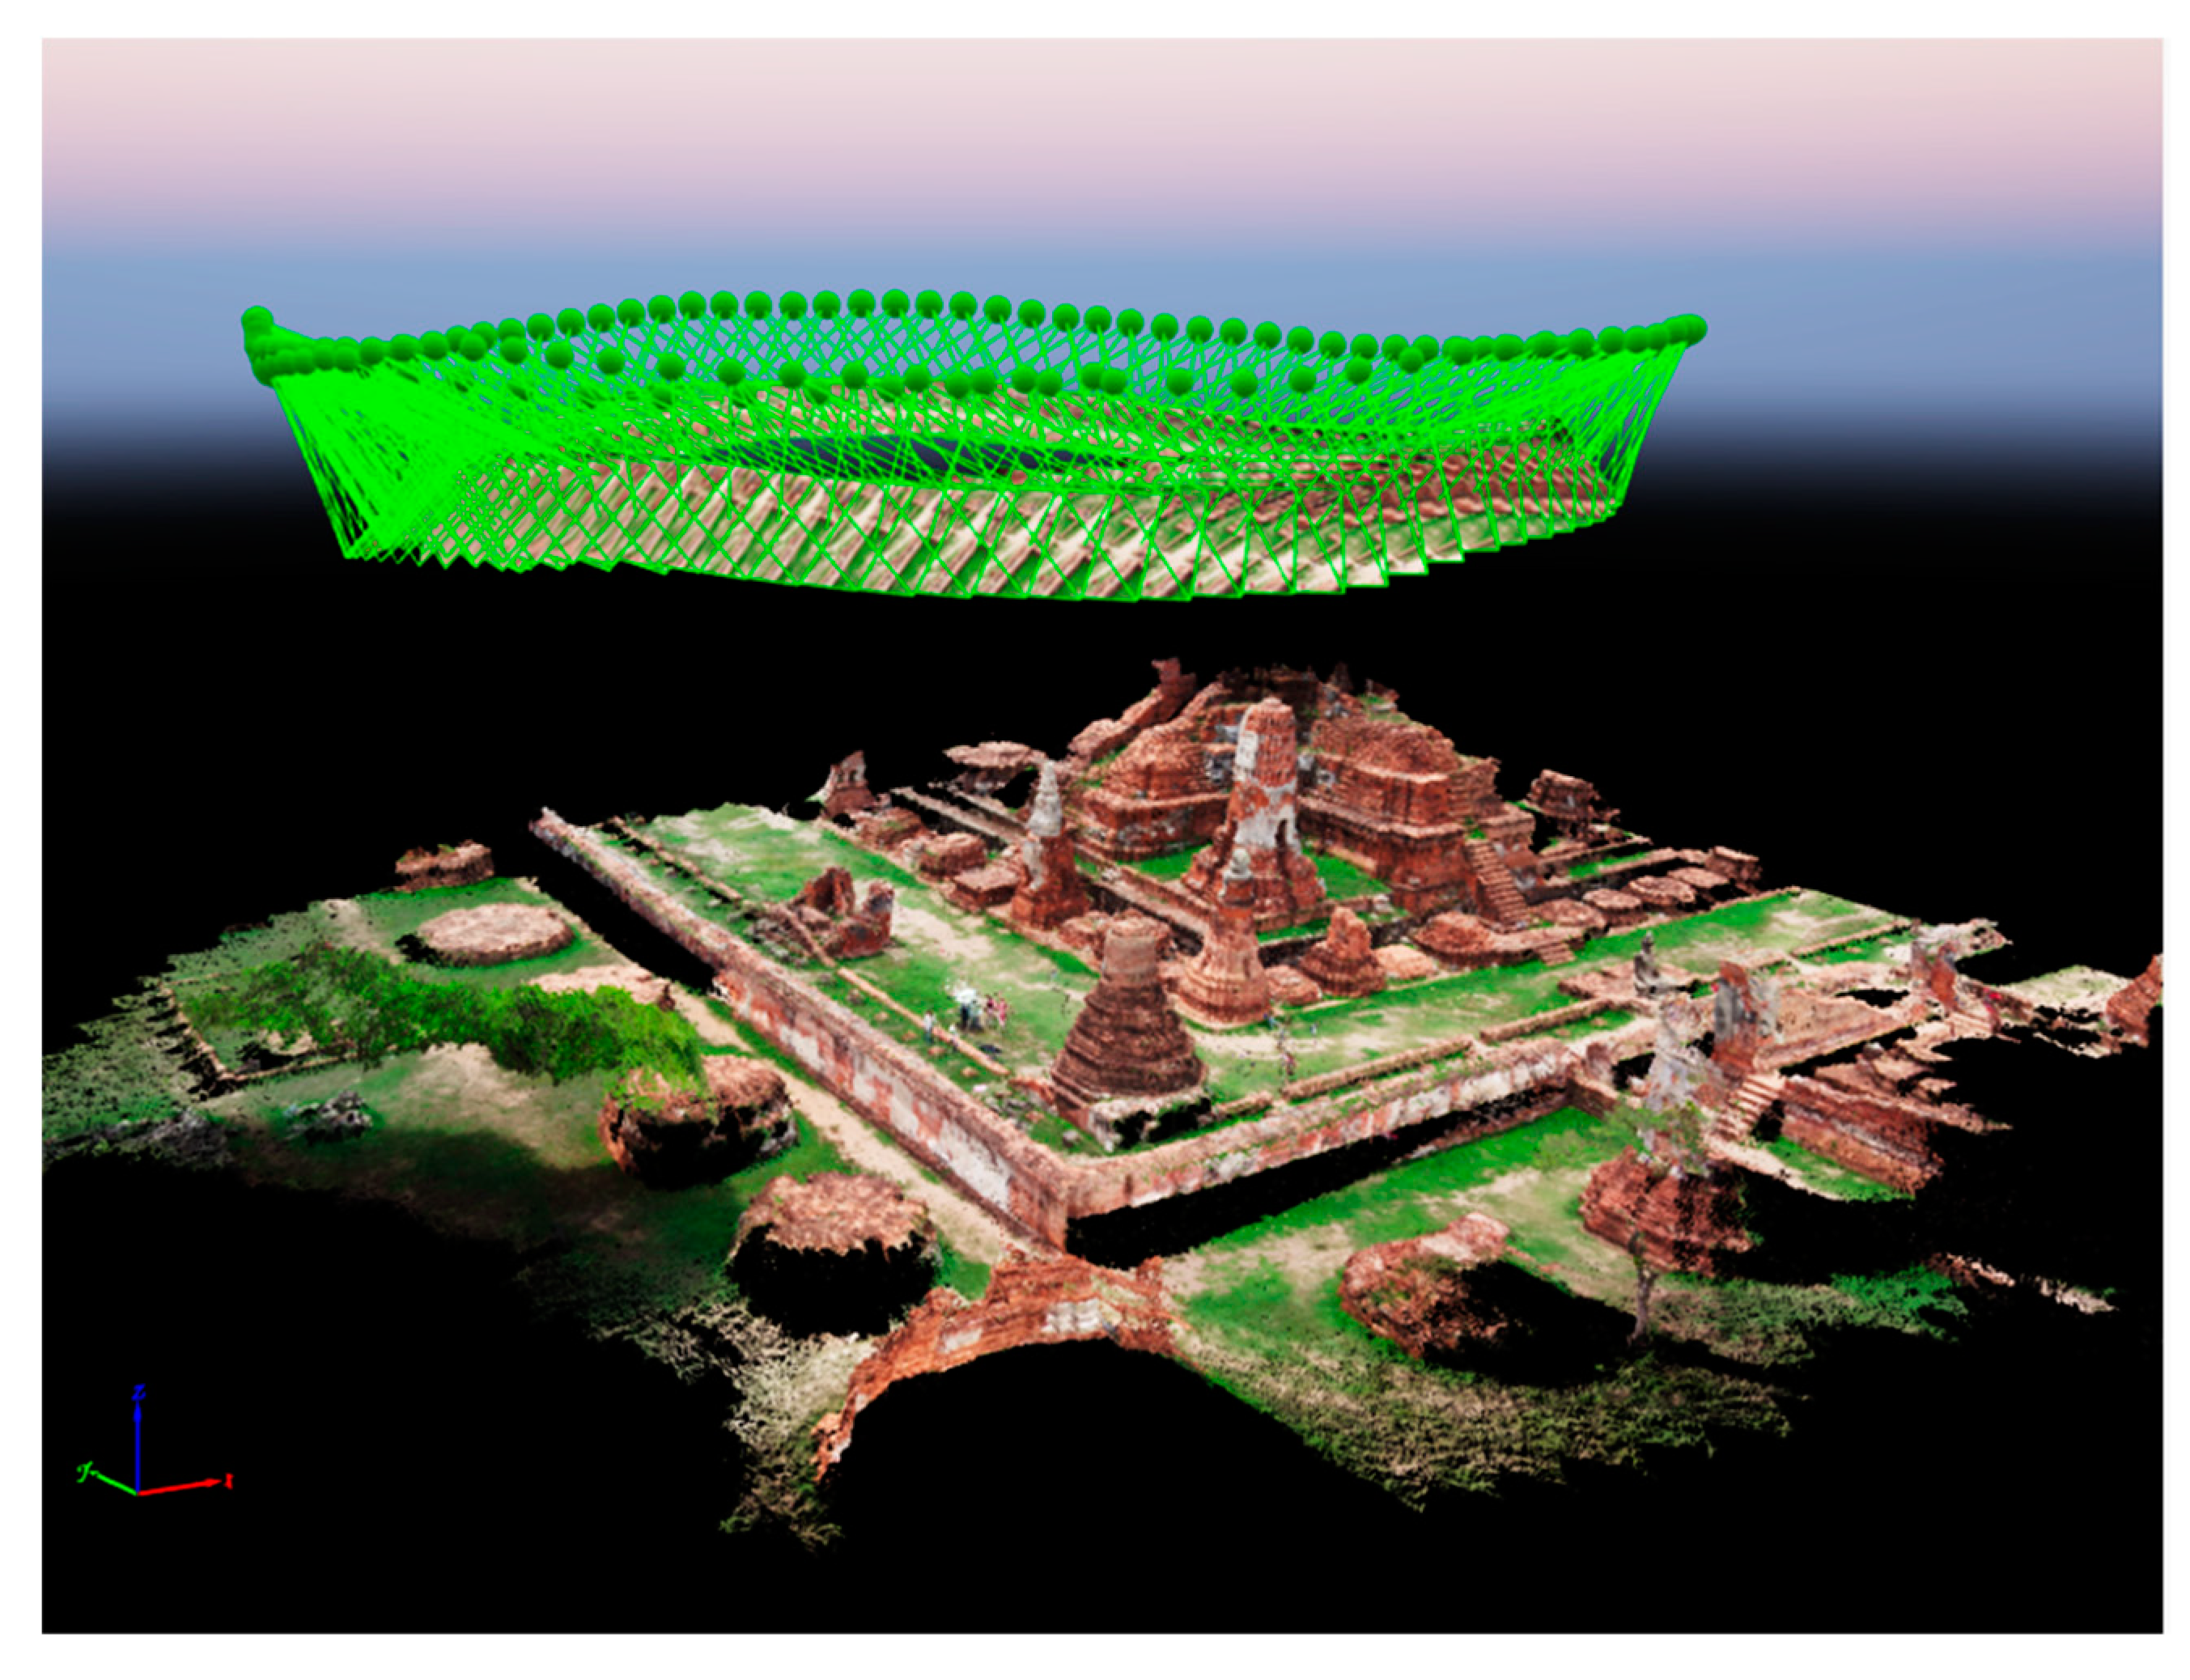
3.5.1. UAV Image Processing

A series of UAV images depicting an archaeological site were obtained, and these were then matched to specific points of interest. The hierarchical orientation of the images was the methodology adopted to produce an approximate orientation of the image, using the form of an arbitrary coordinate system through a computer vision technique. To automate image-based modeling and produce high-quality 3D point clouds, a structure-from-motion (SfM) algorithm was employed to process using Pix4D software. A total of 12 GCPs measured using a real-time kinematic GNSS were manually assigned to the corresponding locations on the textured model (Figure 6). The georeferenced data from the bundle adjustment between the recovered image blocks and the 3D model were optimized using the GCPs coordinates. We analyzed the quality of 3D models, using the coordinates that were measured independently of the ground truth point, and compared them with the photogrammetric coordinates. The 3D point clouds, textured meshes, and orthoimages were created to provide useful and accurate information for archaeological purposes (Figure 7).

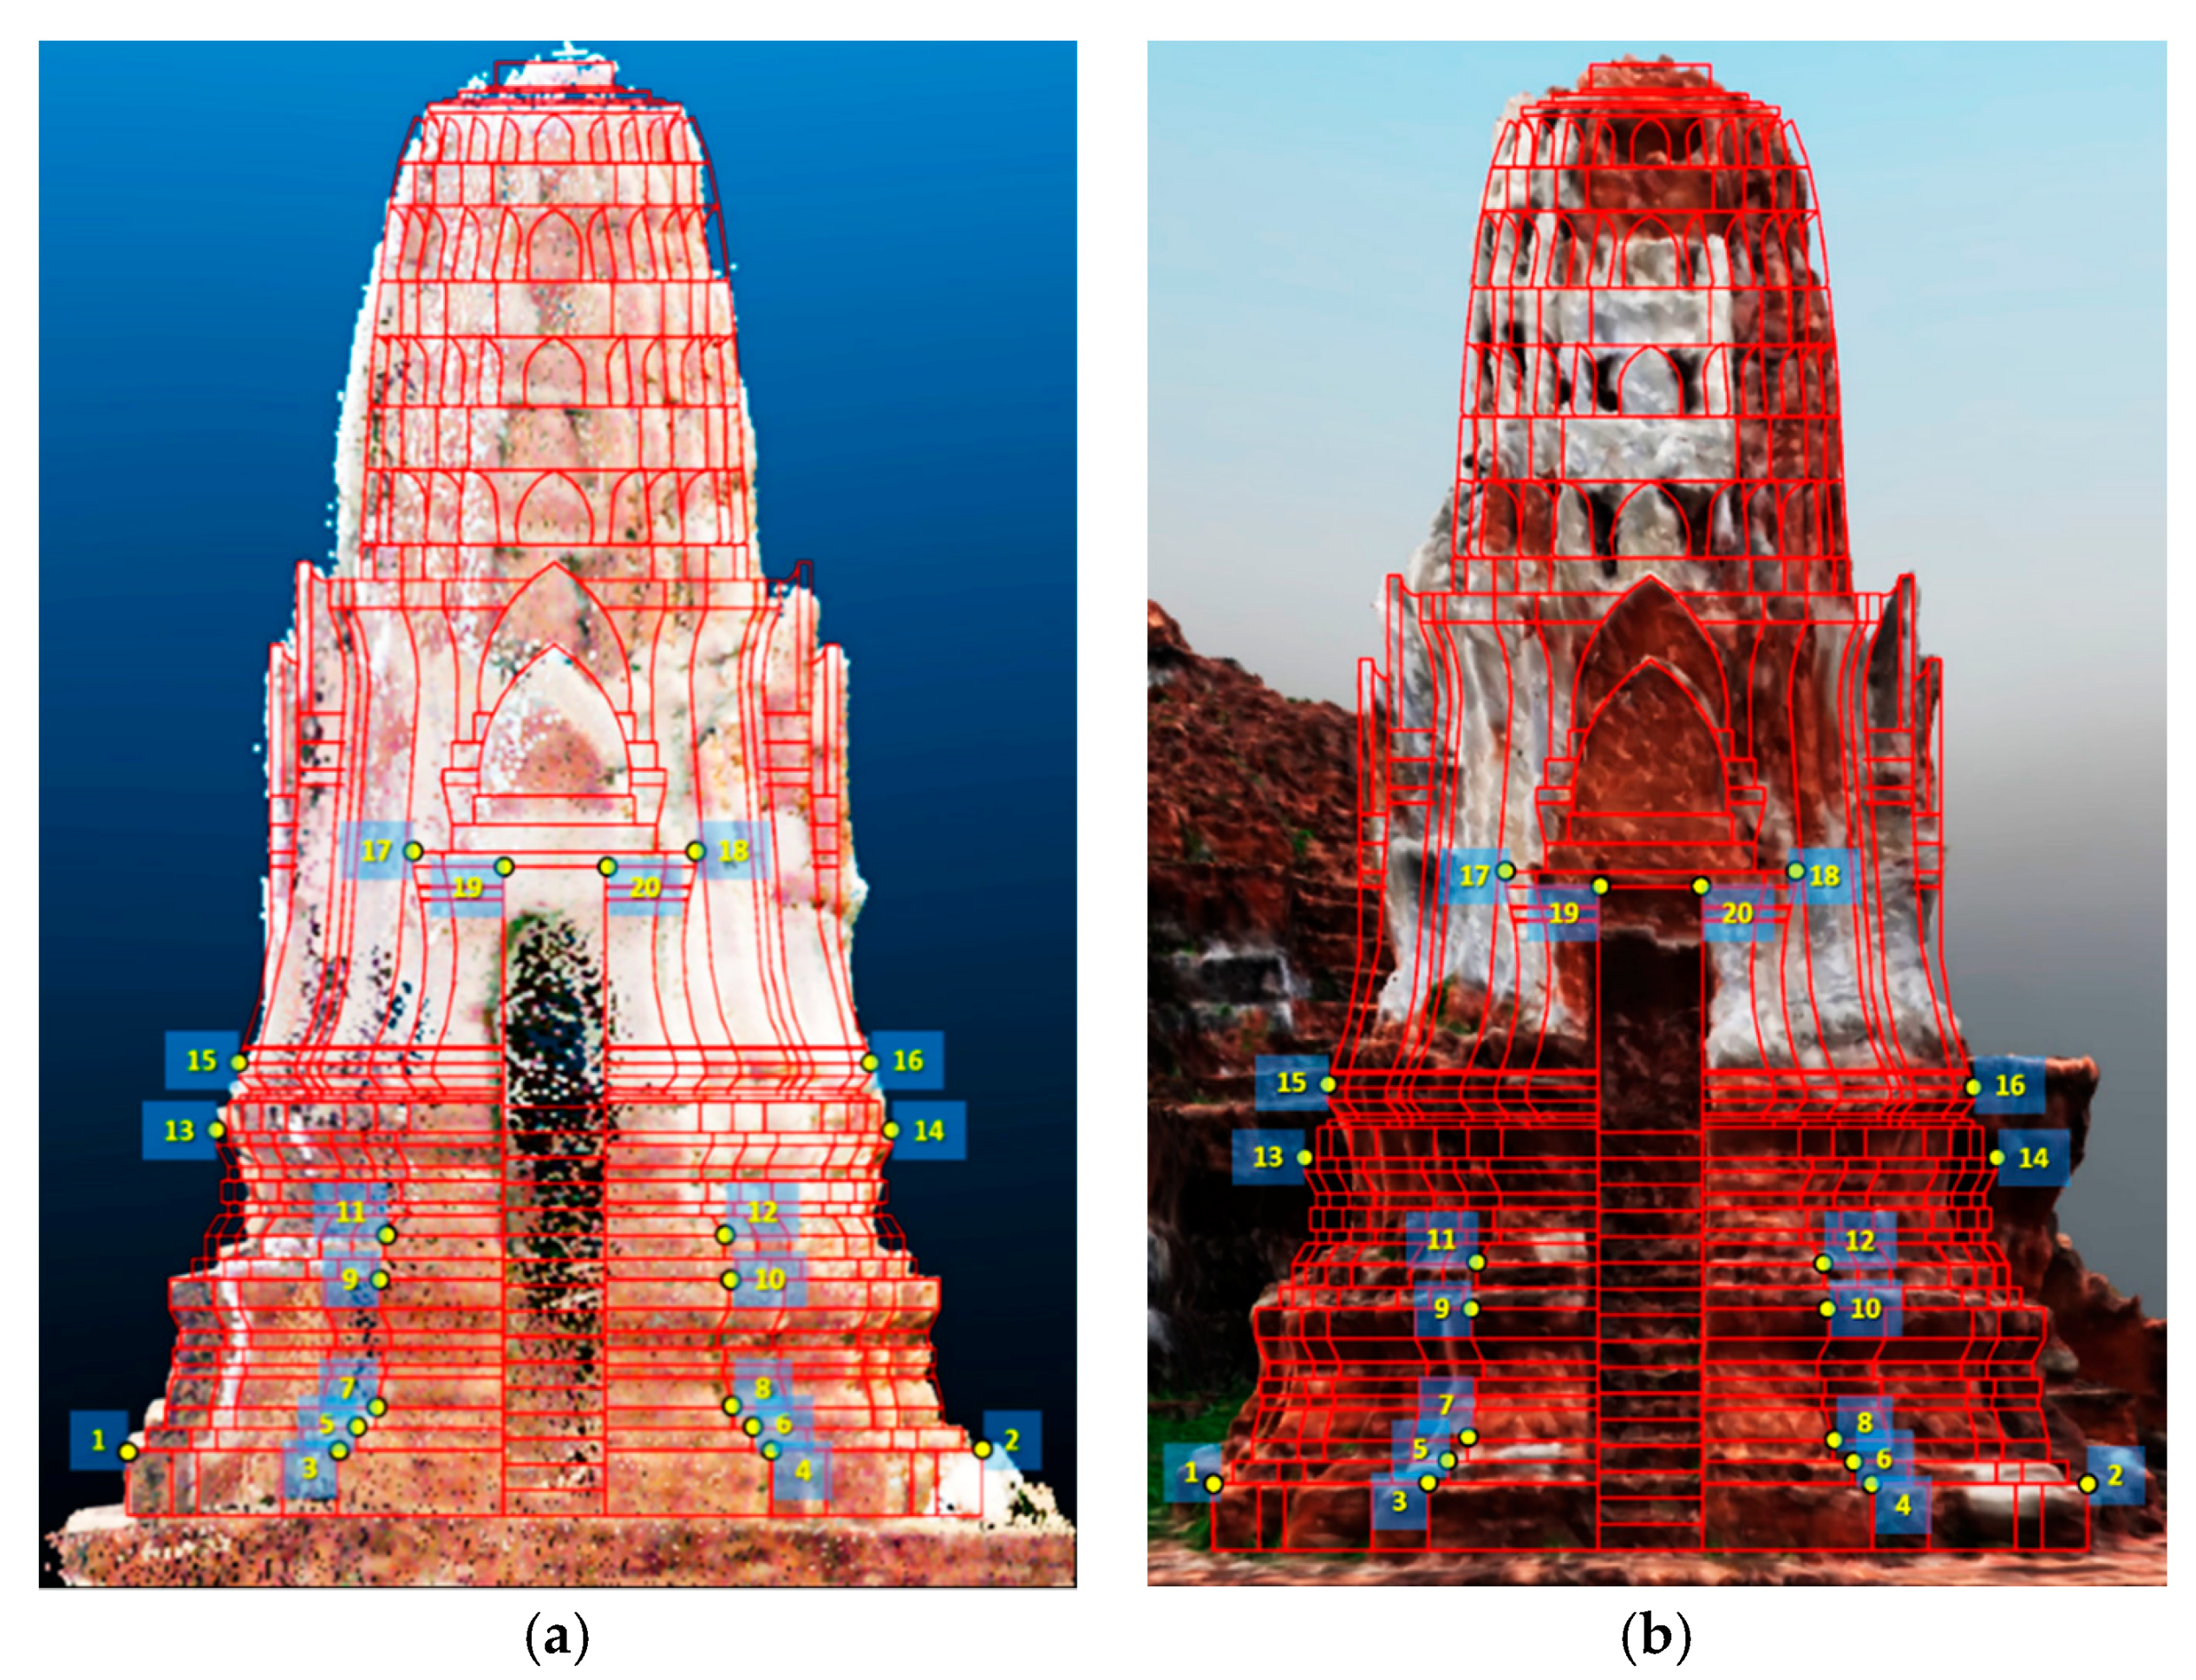
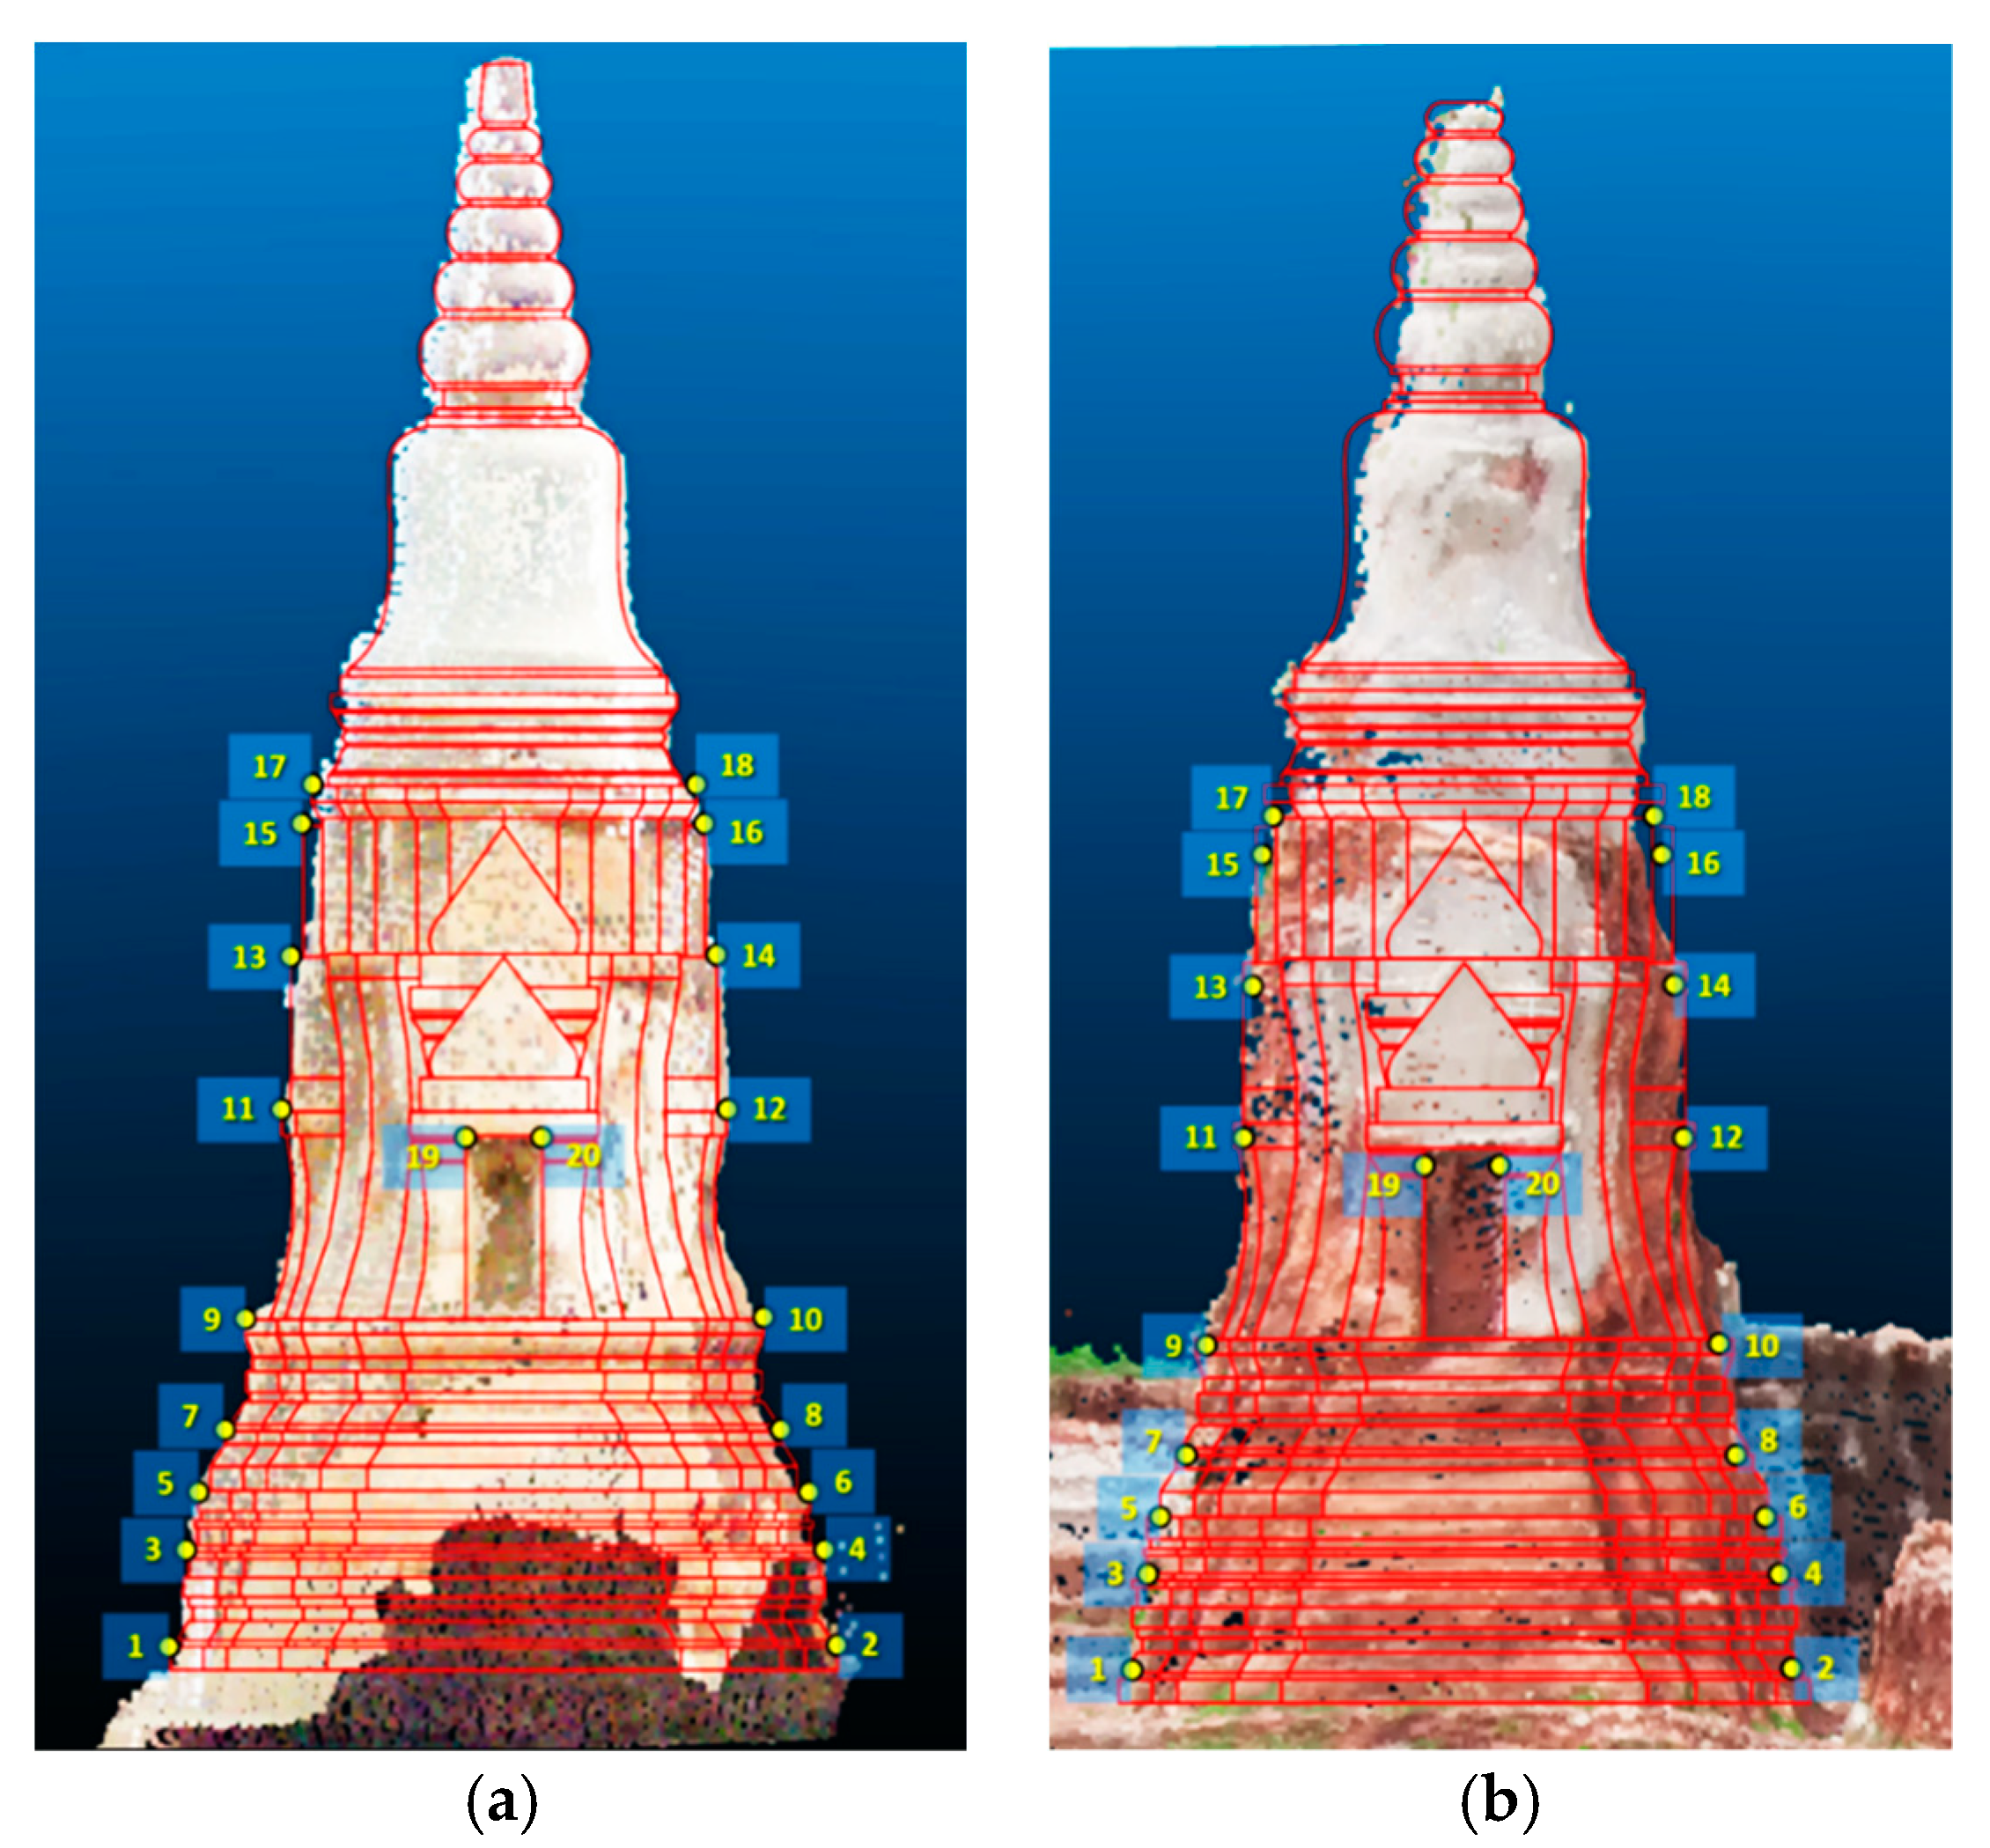
3.5.2. 3D Pagoda Models Comparison

There were two datasets: One from TLS, which was the reference model, and the point cloud-produced nadir images from Pix4D. In order to compare the 3D pagoda model, point clouds were used to generate the 3D models using CloudCompare software. The 20 checking points scattered on the façade were mainly defined by using total stations to the physical structure of the pagoda. Obviously, the pagoda is a man-made structure, so some identical points can be measured and visually identified by the human eye; e.g., the pagoda’s corners, windows, etc. However, the limitation of this study was not being allowed to place the checkpoint on the pagoda structure, due to the regulations and legislation governing historic structures with their conservative approaches, and the official suggestions were to declare it unsafe to climb the ruins of Wat Maha That.

4. Results

The initial UAV image processing of 417 images (0.016 m/pixel ground resolution at a flying height of 50 m) through the feature matching process, implemented in the SfM algorithm, produced a point cloud comprising 915,832 features over an area of 2020 m2. The 3D UAV-SfM’s model accuracy was evaluated by 12 GCPs, uniformly distributed over the study area using the following equations (Equations (1) to (3)):
RMSE = i = 1 n ( x RTK , i x computed , i ) 2 n
RMSE = i = 1 n ( y RTK , i y computed , i ) 2 n
RMSE = i = 1 n ( z RTK , i z computed , i ) 2 n
where
  • R M S E     is the root–mean–square error
  • x , y , z c o m p u t e d , i   is the point coordinates in the UAV images.
  • x , y , z R T K , i   is the point coordinate measured from RTK.
  • n         is the number of GCPs
After bundle adjustment processing, the reported horizontal RMSE value was 0.028 m, and vertical RMSE was 0.230 m. The result is given in Table 2.
Furthermore, TLS and total station were performed to acquire reference data in this study for the independent coordinate checkpoints. To evaluate the overall quality positional accuracy of UAV-SfM results in a 3D pagoda model reconstruction, the 20 checkpoints were spread across the pagoda façade (bricks, window corner, etc.). Figure 8 and Figure 9 show the distribution of these checkpoints on the pagoda façade.

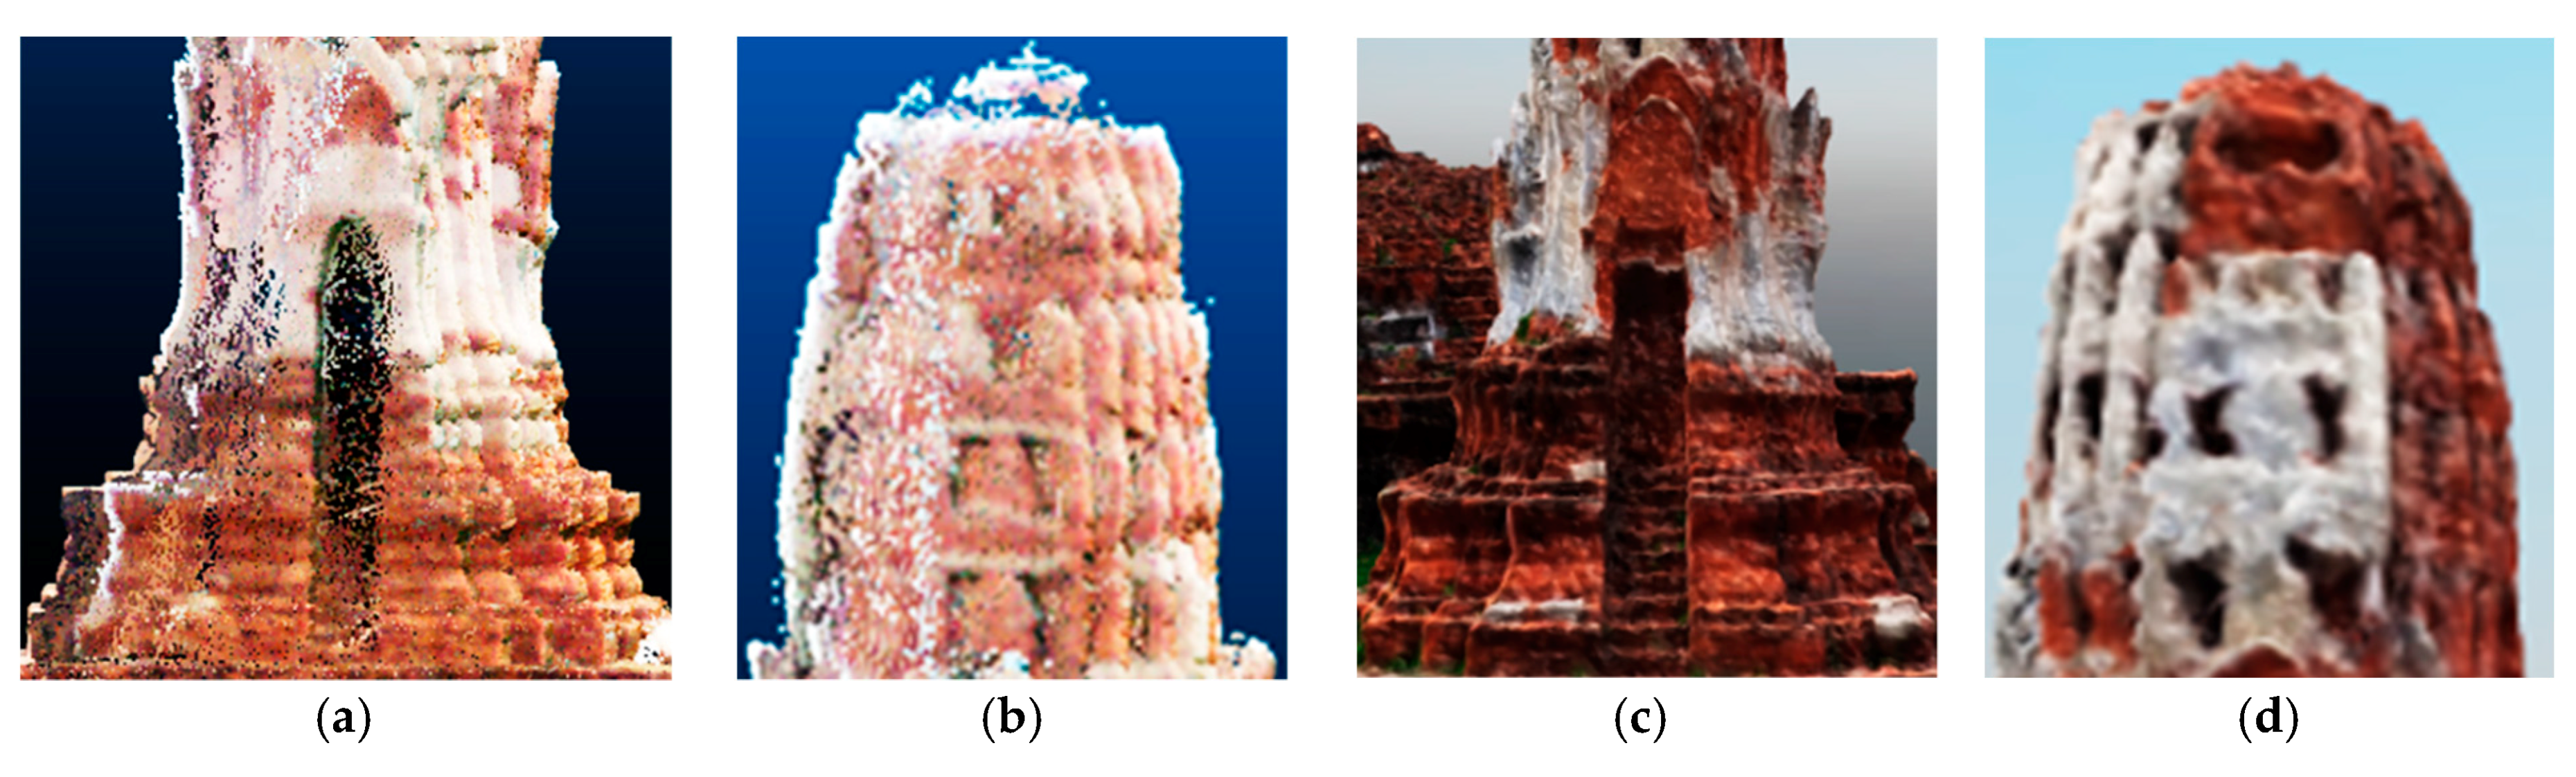
4.1. First Case Study: Prang Structure

The models derived from the UAV and models obtained from TLS were compared with total station data to make more detailed assessments. The results listed in Table 3 indicate that the RMSE horizontal of the Prang structure for TLS-calculated data from 20 checkpoints of ground control is 0.068 m, and that of the UAV is 0.066 m. The RMSEs of the vertical Prang structure were 0.030 and 0.054 m for TLS and UAV, respectively.

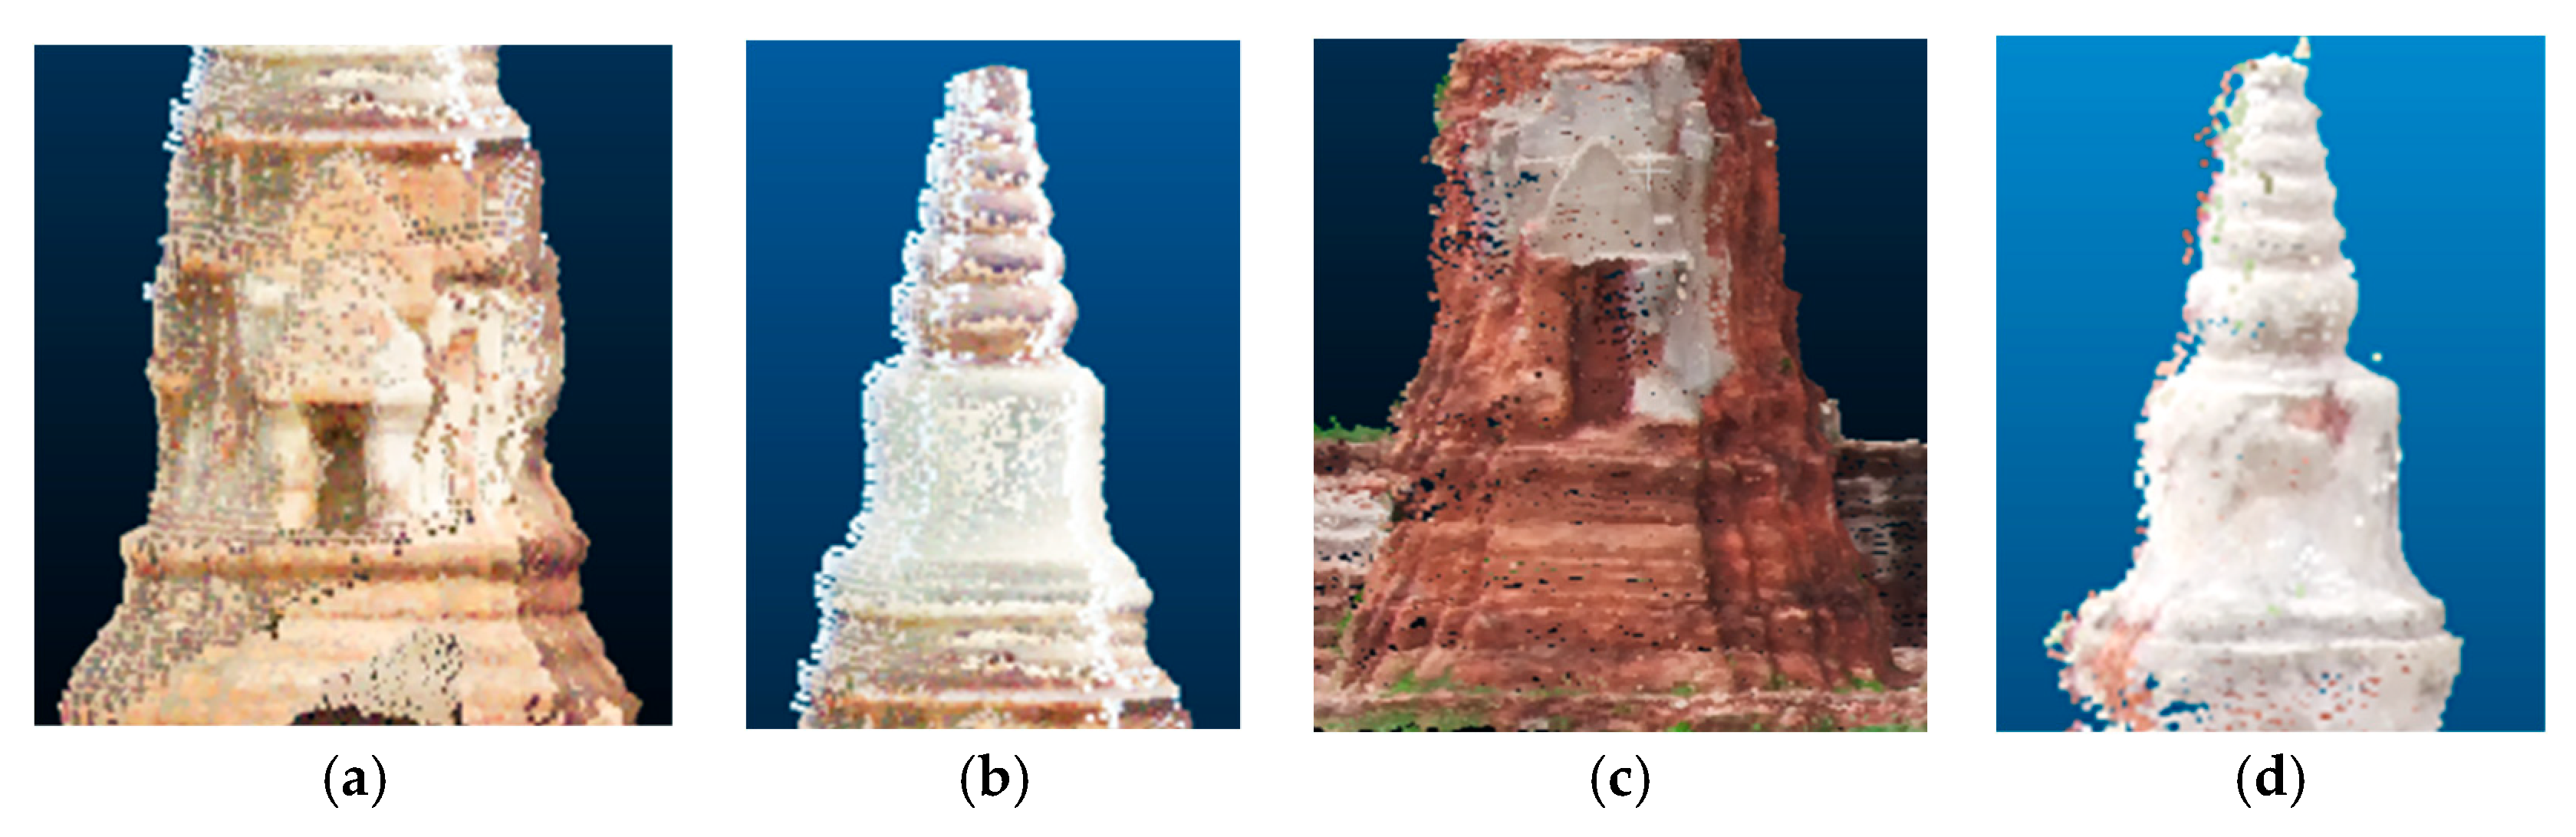
4.2. Second Case Study: Chedi Structure

The results for the Chedi structure can be seen in Table 4. The RMSE horizontal for TLS was 0.069 m, and for UAV was 0.069 m. The RMSE verticals were 0.022 and 0.021 m for TLS and UAV, respectively.
As shown in Figure 8 and Figure 9, to evaluate the quality of positional accuracy on the pagoda façade, in this study, the selected checkpoints could be clearly seen in a field survey, such as natural features, the corner of the pagoda, and brick, and also clearly seen in UAV images and TLS data. The red line is a 2D representation obtained from the Fine Arts Department of Thailand’s footprint to help assist in determining the checkpoint positions.
The reason why checkpoints are not selected at the top of the pagoda is that the edge or corner of the pagoda in the UAV and TLS point clouds cannot be clearly seen, as shown in Figure 10 and Figure 11.

5. Discussion

The UAV-SfM approach can generate orthoimages in a short time, with good quality and accuracy, and they are simple in nature, such that non-expert users can also use them. In this study, it was confirmed that SfM performances from UAV imageries could be implemented for modeling 3D cultural heritage. The UAV-SfM’s application for pagoda patterns in Thailand provides archaeologists and local authorities with high-resolution geoinformation that can be used to support tools for rapid mapping of cultural heritage buildings.
The quality of GCPs for verifying and checking accuracy-based georeferencing depends on the number of GCPs and their distribution over the study area [30,31,32]. Our results showed that the calculated RMSE values of 12 GCPs were 0.028 m in the horizontal direction and 0.230 m in the vertical direction, which are acceptable results for georeferencing.
The accuracy comparison between the point clouds produced from UAV imagery and the terrestrial laser scanning data uses the mean error of 20 check points. The output of UAV on the pagoda compared with the TLS point clouds found that the calculated RMSE value of TLS and UAV point clouds were almost the same, owing to the comparable size of both the Prang and Chedi patterns. In addition, the distribution of checkpoints were only on the bottom base of the pagoda.

6. Conclusions

Developments in laser scanning technology were believed to have rendered the archaeological applications of photogrammetry obsolete; however, in reality, the techniques of digital image matching and image-based modeling are now considered a valid alternative to laser scanning. In this study, a highly effective and inexpensive tool is presented, which can create 3D models and orthoimages through the application of an image-based approach to modeling in the absence of other geotechnological equipment. This tool is flexible and easy to use, and employs proprietary software to generate images and models of complex scenes and objects, such as the archaeological site for the current demonstration at Wat Maha That.
This study evaluates the accuracy of the UAV-SfM method for pagoda exploration at Wat Mahathat, which helped determine the RMSE value as 0.028 and 0.052 m in horizontal and vertical directions, respectively. In addition, the results could be possibly applied in further analysis and for historical heritage management. The recording of these changes is particularly important for the architectural heritage of the Lord Buddha, where the relationship between personal architecture and the neighboring geographic environment has been maintained for hundreds of years.
Further work can investigate the integration of oblique images to enable the recording of historical objects in order to detect and record small details with high accuracy and completeness.

Author Contributions

Conceptualization, S.M. and N.K.T.; reviewed and edited the manuscript, S.M.; data curation, S.M. and S.A.; methodology, S.M.; software, S.M. and S.A.; validation, S.M.; formal analysis, S.M., N.K.T., and S.A.; writing—original draft preparation, S.M.; writing—review and editing, S.M. and N.K.T.; visualization, N.K.T.; supervision, N.K.T.

Funding

This research received no external funding.

Conflicts of Interest

The authors declare no conflict of interest.

References

  1. Discamps, E.; Muth, X.; Gravina, B.; Lacrampe-Cuyaubère, F.; Chadelle, J.; Faivre, J.; Maureille, B. Photogrammetry as a tool for integrating archival data in archaeological fieldwork: Examples from the Middle Palaeolithic sites of Combe-Grenal, Le Moustier, and Regourdou. J. Archaeol. Sci. Rep. 2016, 8, 268–276. [Google Scholar] [CrossRef]
  2. Xu, Z.H.; Wu, L.X.; Shen, Y.L.; Li, F.X.; Wang, Q.Z.; Wang, R. Tridimensional reconstruction applied to cultural heritage with the use of camera-Equipped UAV and terrestrial laser scanner. J. Remote Sens. 2014, 6, 10413–10414. [Google Scholar] [CrossRef]
  3. Erenoglu, R.C.; Akcay, O.; Erenoglu, O. An UAS-Assisted multi-Sensor approach for 3D modeling and reconstruction of cultural heritage site. J. Cult. Herit. 2017, 26, 79–90. [Google Scholar] [CrossRef]
  4. O’Driscoll, J. Landscape applications of photogrammetry using unmanned aerial vehicles. J. Archaeol. Sci. Rep. 2018, 22, 32–44. [Google Scholar] [CrossRef]
  5. Themistocleous, K. Model reconstruction for 3-D vizualization of cultural heritage sites using open data from social media: The case study of Soli, Cyprus. J. Archaeol. Sci. Rep. 2017, 14, 774–781. [Google Scholar] [CrossRef]
  6. Young, H.J.; Seonghyuk, H. Three-Dimensional Digital Documentation of Cultural Heritage Site Based on the Convergence of Terrestrial Laser Scanning and Unmanned Aerial Vehicle Photogrammetry. ISPRS Int. J. Geo-Inf. 2019, 8, 53. [Google Scholar] [CrossRef]
  7. Colomina, I.; Molina, P. Unmanned aerial systems for photogrammetry and remote sensing: A review. ISPRS J. Photogramm. Remote Sens. 2014, 92, 79–97. [Google Scholar] [CrossRef] [Green Version]
  8. Sayab, M.; Aerden, D.; Paananen, M.; Saarela, P. Virtual structural analysis of jokisivu open pit using ‘structure-from-motion’ unmanned aerial vehicles (UAV) photogrammetry: Implications for structurally-Controlled gold deposits in southwest Finland. Remote Sens. 2018, 10, 1296. [Google Scholar] [CrossRef]
  9. Verhoeven, G. Taking computer vision aloft—Archaeological three-Dimensional reconstructions from aerial photographs with photoscan. Archaeol. Prospect. 2011, 18, 67–73. [Google Scholar] [CrossRef]
  10. Aerial Data Systems, Fixed-Wing UAV. 2016. Available online: http://aerialdatasystems.com/fixed-wing (accessed on 17 January 2019).
  11. Fallavollita, P.; Balsi, M.; Esposito, S.; Melis, M.G.; Milanese, M.; Luca, Z. UAS for Archaeology. New Perspectives on Aerial Documentation. Int. Arch. Photogramm. Remote Sens. Spat. Inf. Sci. 2013, 40, 4–6. [Google Scholar] [CrossRef]
  12. Olson, K.G.; Rouse, L.M. A Beginner’s Guide to Mesoscale Survey with Quadrotor-UAV Systems. Adv. Archaeol. Pract. 2018, 6, 357–371. [Google Scholar] [CrossRef]
  13. Xia, D.; Cheng, L.; Yao, Y. A Robust Inner and Outer Loop Control Method for Trajectory Tracking of a Quadrotor. Sensors 2017, 17, 2147. [Google Scholar] [CrossRef] [PubMed]
  14. Dong, J.; He, B. Novel Fuzzy PID-Type Iterative Learning Control for Quadrotor UAV. Sensors 2018, 19, 24. [Google Scholar] [CrossRef] [PubMed]
  15. Fernández-Hernandez, J.; González-Aguilera, D.; Rodríguez-Gonzálvez, P.; Mancera-Taboada, J. Image-Based modelling from unmanned aerial vehicle (UAV) photogrammetry: An effective, low-Cost tool for archaeological applications. Archaeometry 2015, 57, 128–145. [Google Scholar] [CrossRef]
  16. Lo Brutto, M.; Garraffa, A.; Meli, P. UAV Platforms for Cultural Heritages Survey: First Results. ISPRS Ann. Photogramm. Remote Sens. Spat. Inf. Sci. 2014, 2. [Google Scholar] [CrossRef]
  17. Nadhirah, H.M.N.; Khairul, N.T. 3D Model Generation from UAV: Historical Mosque (Masjid Lama Nilai). Int. Arch. Photogramm. Remote Sens. Spat. Inf. Sci. 2017, 42, 251. [Google Scholar]
  18. Ebolese, D.; Lo Brutto, M.; Dardanelli, G. UAV survey for the archaeological map of Lilybaeum (Marsala, Italy). Int. Arch. Photogramm. Remote Sens. Spat. Inf. Sci. 2019, 42. [Google Scholar] [CrossRef]
  19. Chiabrando, F.; Nex, F.; Piatti, D.; Rinaudo, F. UAV and RPV systems for photogrammetric surveys in archaelogical areas: Two tests in the Piedmont region (Italy). J. Arch. Sci. 2011, 38, 697–710. [Google Scholar] [CrossRef]
  20. Stek, T.D. Drones over Mediterranean landscapes. The potential of small UAV’s (drones) for site detection and heritage management in archaeological survey projects: A case study from Le Pianelle in the Tappino Valley, Molise (Italy). J. Cult. Herit. 2016, 22, 1066–1071. [Google Scholar] [CrossRef]
  21. Bolognesi, M.; Furini, A.; Russob, V.; Pellegrinelli, A.; Russo, P. Accuracy of Cultural Heritage 3D Models by RPAS and Terrestrial Photogrammetry. ISPRS Int. Arch. Photogramm. Remote Sens. Spat. Inf. Sci. 2014, 40, 113–119. [Google Scholar] [CrossRef]
  22. Cho, G.; Hildebrand, A.; Claussen, J.; Cosyn, P.; Morris, S. Pilotless aerial vehicle systems: Size, scale and functions. Coordinates 2013, 9, 8–16. [Google Scholar]
  23. Petrie, G. Commercial operation of lightweight UAVs for aerial imaging and mapping. Geoinformatics 2013, 16, 28–39. [Google Scholar]
  24. Remondino, F.; Nocerino, E.; Toschi, I.; Menna, F. A critical review of automated photogrammetric processing of large datasets. ISPRS Int. Arch. Photogramm. Remote Sens. Spat. Inf. Sci. 2017, 42, 591–599. [Google Scholar] [CrossRef]
  25. Themistocleous, K.; Agapiou, A.; Cuca, B.; Hadjimitsis, D.G. Unmanned Aerial Systems and Spectroscopy for Remote Sensing Application in Archaeology. Int. Arch. Photogramm. Remote Sens. Spat. Inf. Sci. 2015. [Google Scholar] [CrossRef]
  26. Remondino, F.; Barazzetti, L.; Nex, F.; Scaioni, M.; Sarazzi, D. UAV Photogrammetry for Mapping and 3D Modeling-Current Status and Future Perspectives. Int. Arch. Photogramm. Remote Sens. Spat. Inf. Sci. 2011, 38, 25–31. [Google Scholar] [CrossRef]
  27. Ioannides, M.; Hadjiprocopis, A.; Doulamis, N.; Doulamis, A.; Protopapadakis, E.; Makantasis, K.; Santos, P.; Fellner, D.; Stork, A.; Balet, O.; et al. Online 4D Reconstruction using multi-Images available under open access. ISPRS Ann. Photogramm. Remote Sens. Spat. Inf. Sci. 2013, 2, 169–174. [Google Scholar] [CrossRef]
  28. Koch, T.; Zhuo, X.; Reinartz, P.; Fraundorfer, F. A new paradigm for matching UAV and aerial images. ISPRS Ann. Photogramm. Remote Sens. Spat. Inf. Sci. 2016, 3, 83–90. [Google Scholar] [CrossRef]
  29. Ayutthaya Historical Research. Available online: http://www.ayutthaya-history.com/Temples_Ruins_MahaThat.html (accessed on 16 January 2019).
  30. Sanz-Ablanedo, E.; Chandler, J.; Rodríguez-Pérez, J.; Ordóñez, C.; Sanz-Ablanedo, E.; Chandler, J.H.; Rodríguez-Pérez, J.R.; Ordóñez, C. Accuracy of unmanned aerial vehicle (UAV) and SfM photogrammetry survey as a function of the number and location of ground control points used. Remote Sens. 2018, 10, 1606. [Google Scholar] [CrossRef]
  31. Smith, M.W.; Carrivick, J.L.; Quincey, D.J. Structure from motion photogrammetry in physical geography. Prog. Phys. Geogr. 2016, 40, 247–275. [Google Scholar] [CrossRef]
  32. James, M.R.; Robson, S.; Smith, M.W. 3-D uncertainty-Based topographic change detection with structure-From-Motion photogrammetry: Precision maps for ground control and directly georeferenced surveys. Earth Surf. Process. Landf. 2017, 42, 1769–1788. [Google Scholar] [CrossRef]
Figure 1. Aerial overview of the study area, Wat Maha That, Ayutthaya Island, Ayutthaya Province. (a) Map of Thailand. (b) Map of Ayutthaya Province. (c) Study area in Wat Maha That.
Applsci 09 03640 g001
Figure 2. Pagodas at Wat Maha That. (a) Prang structure. (b) Chedi structure.
Applsci 09 03640 g002
Figure 3. DJI Inspire 1 Pro and Inspire 1 RAW platforms designed to assist in aerial imaging.
Applsci 09 03640 g003
Figure 4. Ground control points (GCPs) designed in a white and pink pattern.
Applsci 09 03640 g004
Figure 5. Overlap and sidelap images established from flight planning and control.
Applsci 09 03640 g005
Figure 6. GCPs measured with a real-time kinematic global navigation satellite system (GNSS). (a) The locations of 12 GCPs. (b) GCPs marking.
Applsci 09 03640 g006
Figure 7. Camera position of the area of Wat Maha That, Ayutthaya flight.
Applsci 09 03640 g007
Figure 8. Comparison of the terrestrial and UAVs point cloud computed on 20 checkpoints for the Prang structure. (a) Point clouds from terrestrial laser scanning (TLS). (b) Point clouds from UAV.
Applsci 09 03640 g008
Figure 9. Comparison of the terrestrial and UAV point clouds, computed on 20 checkpoints for Chedi structure. (a) Point clouds from TLS. (b) Point clouds from UAV.
Applsci 09 03640 g009
Figure 10. Comparison of the terrestrial and UAVs point cloud of the Prang structure: (a) Base of the Prang from TLS. (b) Top of the Prang from TLS. (c) Base of the Prang from UAV. (d) Top of the Prang from UAV.
Applsci 09 03640 g010
Figure 11. Comparison of the terrestrial and UAVs point cloud of the Chedi structure: (a) Base of the Chedi from TLS. (b) Top of the Chedi from TLS. (c) Base of the Chedi from UAV. (d) Top of the Chedi from UAV.
Applsci 09 03640 g011
Table 1. Specifications of unmanned aerial vehicle (UAV) flight planning.
ParameterValueParameterValue
Area of flight1 haBaseline, b32 m
Scale, S1:50Overlap, p80%
GSD20 mmSidelap, q40%
Footprint80 × 60 mSpacing between strips, t36 m
Flight height, H50 mNumber of strips3
Orientation of stripsWest–EastImage per strip10
Table 2. Unmanned aerial vehicle structure-from-motion’s (UAV-SfM) model accuracy assessment.
GCPField Survey DataDiff
X (m)Y (m)Z (m)dX (m)dY (m)Z (m)
1669082.41911587840.237417.92600.021−0.0090.043
2669064.94751587827.133719.0470−0.0120.012−0.036
3669010.34871587839.873418.57600.028−0.029−0.049
4668978.68151587827.133718.15100.0080.009−0.086
5668983.04941587790.006618.53000−0.0010.021
6668996.88101587807.114218.243000.001−0.081
7669056.57571587778.358818.23500.0470.0030.026
8669086.05901587798.742419.3790−0.02700.068
9668984.14131587740.139720.18800.051−0.040−0.012
10669018.72051587733.223919.85800.0010−0.057
11669052.20781587737.227819.219000.0010.021
12669089.33491587739.775717.011000.001−0.062
RMSE H = sqrt (sum(dX)2 + (sum(dY)2/n)0.028 m
RMSE V= sqrt (sum(dZ)2/n)0.052 m
Table 3. RMSE of Prang, computed on 20 checkpoints for the terrestrial and UAV point clouds.
TerrestrialUAV
RMSE H (m)0.0680.066
RMSE V (m)0.0300.054
Table 4. RMSE of Chedi, computed on 20 checkpoints for the terrestrial and UAV point cloud.
TerrestrialUAV
RMSE H (m)0.0690.069
RMSE V (m)0.0220.021

