Imaging Correlography Using Ptychography
by
 , ,
, ,
Zhixin Li
1,2 ,
,
Desheng Wen
1,
Zongxi Song
1,*,
Tuochi Jiang
1,2,
Weikang Zhang
1,2,
Gang Liu
1,2 and
Xin Wei
1,2 1
Xi’an Institute of Optics and Precision Mechanics, Chinese Academy of Sciences, Xi’an 710119, China
2
University of Chinese Academy of Sciences, Beijing 100049, China
*
Author to whom correspondence should be addressed.
Appl. Sci. 2019, 9(20), 4377; https://0-doi-org.brum.beds.ac.uk/10.3390/app9204377
Submission received: 26 August 2019
/
Revised: 8 October 2019
/
Accepted: 12 October 2019
/
Published: 16 October 2019
(This article belongs to the Collection Optical Design and Engineering)
Abstract
:Featured Application
Space target surveillance is a significant part of space defense, and is also important for maintaining national security. Imaging of the space targets is the direct method used to realize space target recognition. However, for long-range space targets, such as middle-and-high altitude Earth satellites and space debris above 10,000 km, the resolution of the imaging system is required to reach the milliarcsecond (mas) scale to obtain clear images. Because of the limitations of telescope apertures, it is difficult for traditional wavefront imaging to satisfy this requirement. In addition, the amplitude interferometer requires high accuracy from the instrument, which makes it difficult to achieve a long baseline. The proposed ptychographic imaging correlography removes the need to measure the phase information of the object. The ptychographic phase retrieval algorithm is applied to restore the phase data to realize target reconstruction. This has the advantages of low equipment accuracy and insensitivity to atmospheric turbulence. Therefore, the proposed method in this work has great prospects in long-range imaging systems.
Abstract
Imaging correlography, an effective method for long-distance imaging, recovers an object using only the knowledge of the Fourier modulus, without needing phase information. It is not sensitive to atmospheric turbulence or optical imperfections. However, the unreliability of traditional phase retrieval algorithms in imaging correlography has hindered their development. In this work, we join imaging correlography and ptychography together to overcome such obstacles. Instead of detecting the whole object, the object is measured part-by-part with a probe moving in a ptychographic way. A flexible optimization framework is proposed to reconstruct the object rapidly and reliably within a few iterations. In addition, novel image space denoising regularization is plugged into the loss function to reduce the effects of input noise and improve the perceptual quality of the recovered image. Experiments demonstrate that four-fold resolution gains are achievable for the proposed imaging method. We can obtain satisfactory results for both visual and quantitative metrics with one-sixth of the measurements in the conventional imaging correlography. Therefore, the proposed imaging technique is more suitable for long-range practical applications.
1. Introduction
The imaging correlography technique was first proposed by Idell and Fienup [1,2,3]. It can construct a high-resolution image of a laser-illuminated object from the measurements of backscattered laser speckle intensity patterns. Imaging correlography is based on the fact that the autocorrelation function of the object’s brightness distribution can be estimated from the average energy spectrum of the measured speckle intensity images. Previous work has demonstrated that the Fourier transform of the autocorrelation of the object’s brightness function is equal to the squared modulus of the Fourier transform of the object [4]. If the phase information associated with this Fourier transform can be retrieved, one can reconstruct the object by inverse Fourier transform of the synthesized Fourier data. The imaging correlography technique can recover the object using only the knowledge of the Fourier modulus, without needing phase information. It is insensitive to atmospheric turbulence and the optical imperfection of the device [5,6]. To obtain a Fourier magnitude estimate that is acceptable for reconstructing the object, in practical applications a large amount of speckle-intensity images is required. Moreover, the estimated Fourier modulus is noisy and loses a lot of high-frequency information, which makes it difficult for the phase retrieval algorithm to converge on the optimal global value [7,8]. In recent years, Thurin et al. used imaging correlography for high-resolution retinal imaging to overcome ocular aberrations [9]. Based on the shower curtain effect, Edrei et al. proposed a novel speckle correlography protocol that is insensitive to turbid medium motions. Additionally, they extended the correlography technique to transmitting or other nonscattering objects by illuminating the object with a speckle pattern [10].
Ptychography is a popular phase imaging technique for reconstructing a high-resolution image of a specimen from a series of diffraction patterns. It could only be applied to crystalline objects when it was first proposed by Hoppe in the 1970s [11]. After the Wigner distribution deconvolution method (WDMM) was proposed by Bates and Rodenburg, it could also be used to recover amorphous objects [12]. A breakthrough in ptychography was achieved in 2004; that is, an iterative algorithm named the ptychographic iterative engine (PIE) was applied to solve this phase problem [13]. In ptychography, a light probe is fixed on a translation stage, which can shift laterally with respect to the optical axis, such that probes at neighboring positions overlap with each other. The far-field diffraction patterns are recorded at each probe position, and then the object can be reconstructed with an iterative image reconstruction algorithm. This has been realized with electron beams [14], hard X-rays [15], and visible light [16]. Compared with other phase imaging techniques, such as interferometers [17] and digital holography [18], ptychography can obtain high-resolution and large field-of-view (FOV) images without complex optical systems or precise imaging applications. In the previous microscopic applications, the imaging targets for ptychography were thin biological samples that naturally have a smooth phase. However, the imaging samples for long-distance imaging systems are daily objects with “optically rough” surfaces. The variable height function of the surface introduces the rapidly changed random phase for the object. Because of the self-interference of coherent light backscattered from the object’s rough surface, the transmitted field forms as speckle patterns in the detection plane [19,20,21,22]. Holloway et al. realized the reconstruction of optically rough objects with Fourier ptychography [20,21]. Compared with conventional ptychography techniques, such as PIE, low-resolution images are measured in the image plane rather than the far-field diffraction patterns. A previous research studied utilized ptychography with a pseudothermal source [23]. However, their imaging method requires the detector to measure the speckle patterns within the coherence time of the intensity fluctuations. The intensity fluctuations for the thermal source are in the order of tens of femtoseconds, meaning most detectors are not fast enough to record it. Gardner and Li et al. [24,25] imaged extended objects using the ptychographic speckle correlation method, which is based on the “memory effect” of speckles [26,27,28]. This method can realize noninvasive imaging with a single speckle pattern. However, the illuminated area for each position is chosen to satisfy both the memory effect range and practical limits of the detector. Therefore, it is more suitable for biomedical and materials research.
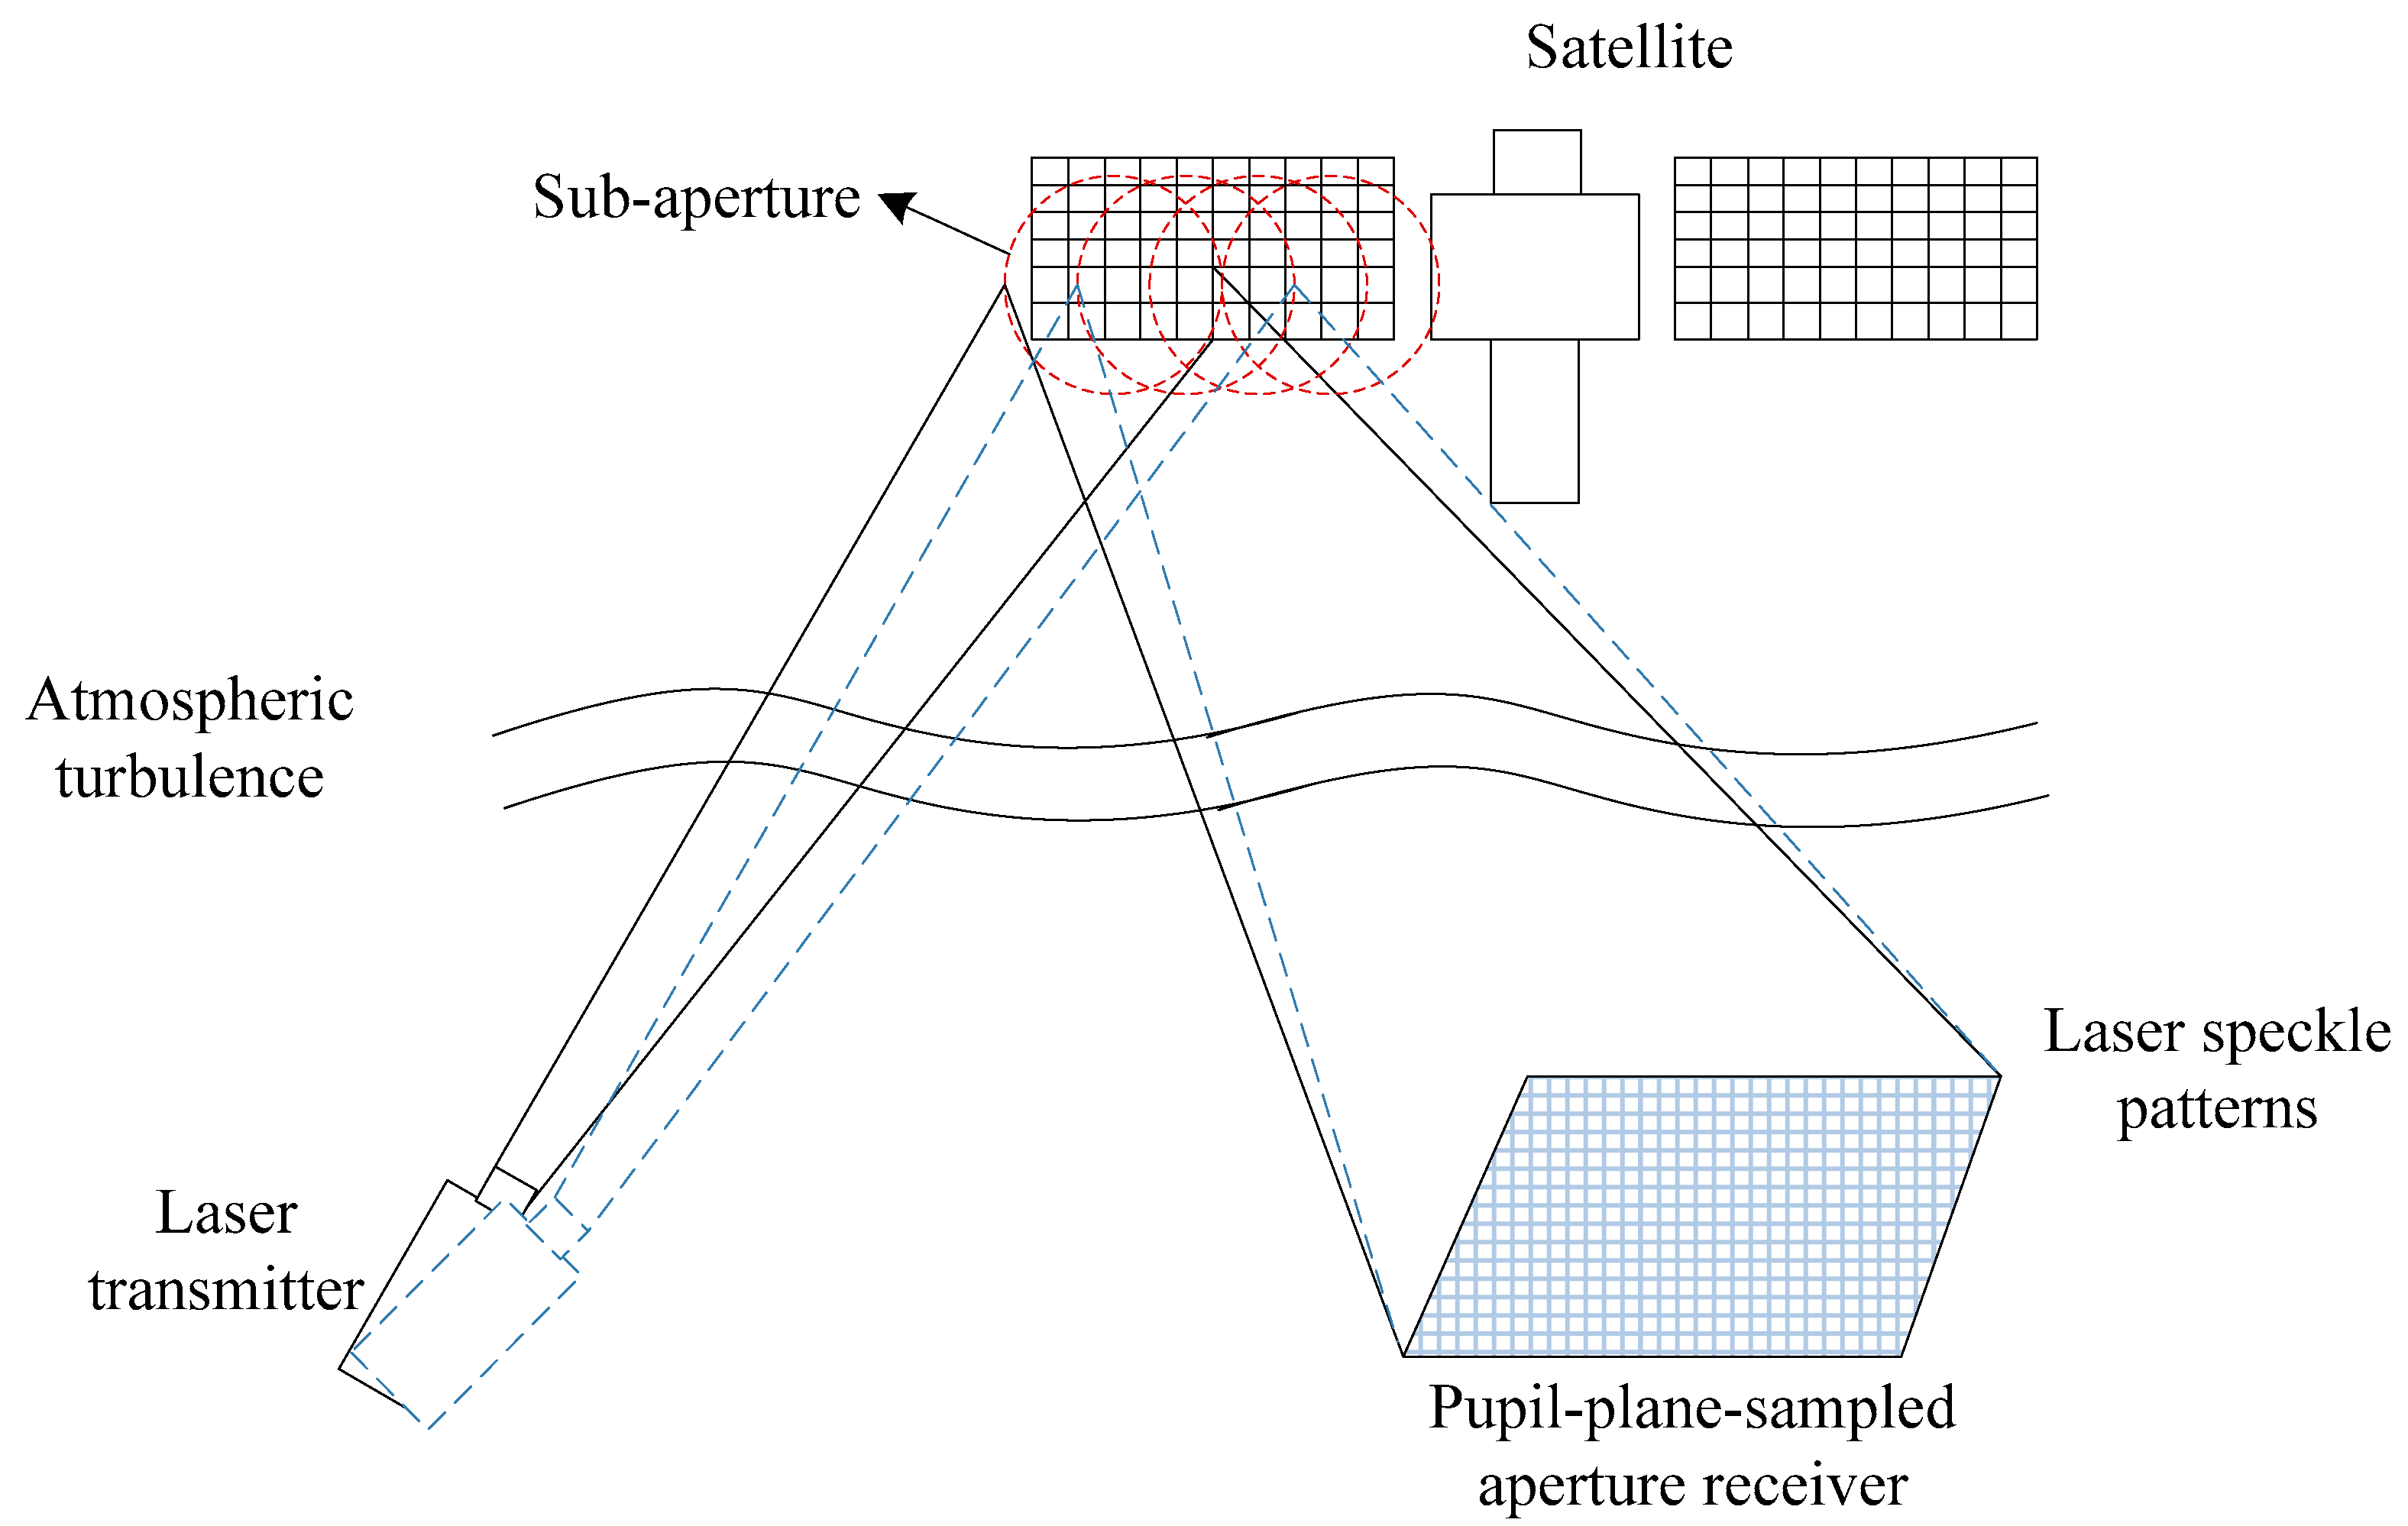
In this work, we join imaging correlography and ptychography together. A practical implementation of imaging correlography using ptychography is illustrated schematically in Figure 1. The laser beam passes over a long distance to form an illumination spot of a certain size. Scanning measurements can be realized by changing the illumination angle of the laser source. Different deflection angles correspond to different overlapping areas. Here, red circles indicate scanning positions for ptychographic measurements. The solid black line represents the imaging process for the first position, and the dotted blue line represents the imaging process for the second position with the change of illumination angle. Instead of illuminating the whole object, we measure the object part-by-part in a ptychographic way. Then, imaging correlography is used to estimate the Fourier modulus of each part of the object based on the measured far-field speckle patterns. Finally, the phase retrieval algorithm is applied to reconstruct the object. For Figure 1, the speckle patterns are formed by atmospheric turbulence. In some cases, the atmospheric turbulence effect is not strong enough to provide sufficient signal flux at the camera face. The independent patterns of the observed speckle intensity can be measured by translating the detector or rotating the object [2,3,7,8,29]. These measurements can also be achieved by directly illuminating the object with the speckle pattern, which is proposed in previous work [10]. Reconstructing images from astronomical speckle data is analogous to recovering images from speckle patterns as one rotates the object [8]. In both cases, the recorded speckle data can be processed to obtain an estimate of the Fourier magnitude of the object. Then, by using a phase retrieval algorithm, the object can be reconstructed.
In the proposed imaging method, we make three contributions. Firstly, the correlography and ptychography are joined together to solve the problem of inaccurate phase recovery in the imaging correlography. Secondly, the Fourier magnitude is estimated for ptychographic reconstruction using imaging correlography. Finally, the new initialization method and optimization framework are employed to the ptychographic imaging correlography. Moreover, a novel image space denoising regularization is plugged into the loss function to reduce the effects of reconstruction noise and improve the perceptual quality of the recovered image.
2. Method
2.1. Image Formation Model for Imaging Correlography
Here, we assume that the rough-surfaced object is flood-illuminated with the laser beam. Each realization of the field emerging from the object’s surface is randomly and coherently dephased, which can be given by the product of
where represent the independent speckle pattern realizations, is the object’s field amplitude reflectivity, is the phase of the reflected field associated with height profile of the object’s random rough surface, and are the lateral coordinates in the object plane. The -th intensity measurement of a fully developed laser speckle pattern is recorded by the detectors in the observation plane.
where denotes the Fourier transform operator and denotes the frequency coordinates in the observation plane. The independent intensity measurements can be realized by rotating the object slightly. From the previous research [30], the autocorrelation function of the object’s brightness distribution function can be described as
where is the ensemble (mean) intensity of the -th speckle intensity patterns, is the inverse Fourier transform operator, and is the total number of speckle patterns. Then, a measure of the object’s Fourier modulus can be estimated by Fourier transform of the autocorrelation function , followed by taking the square root.
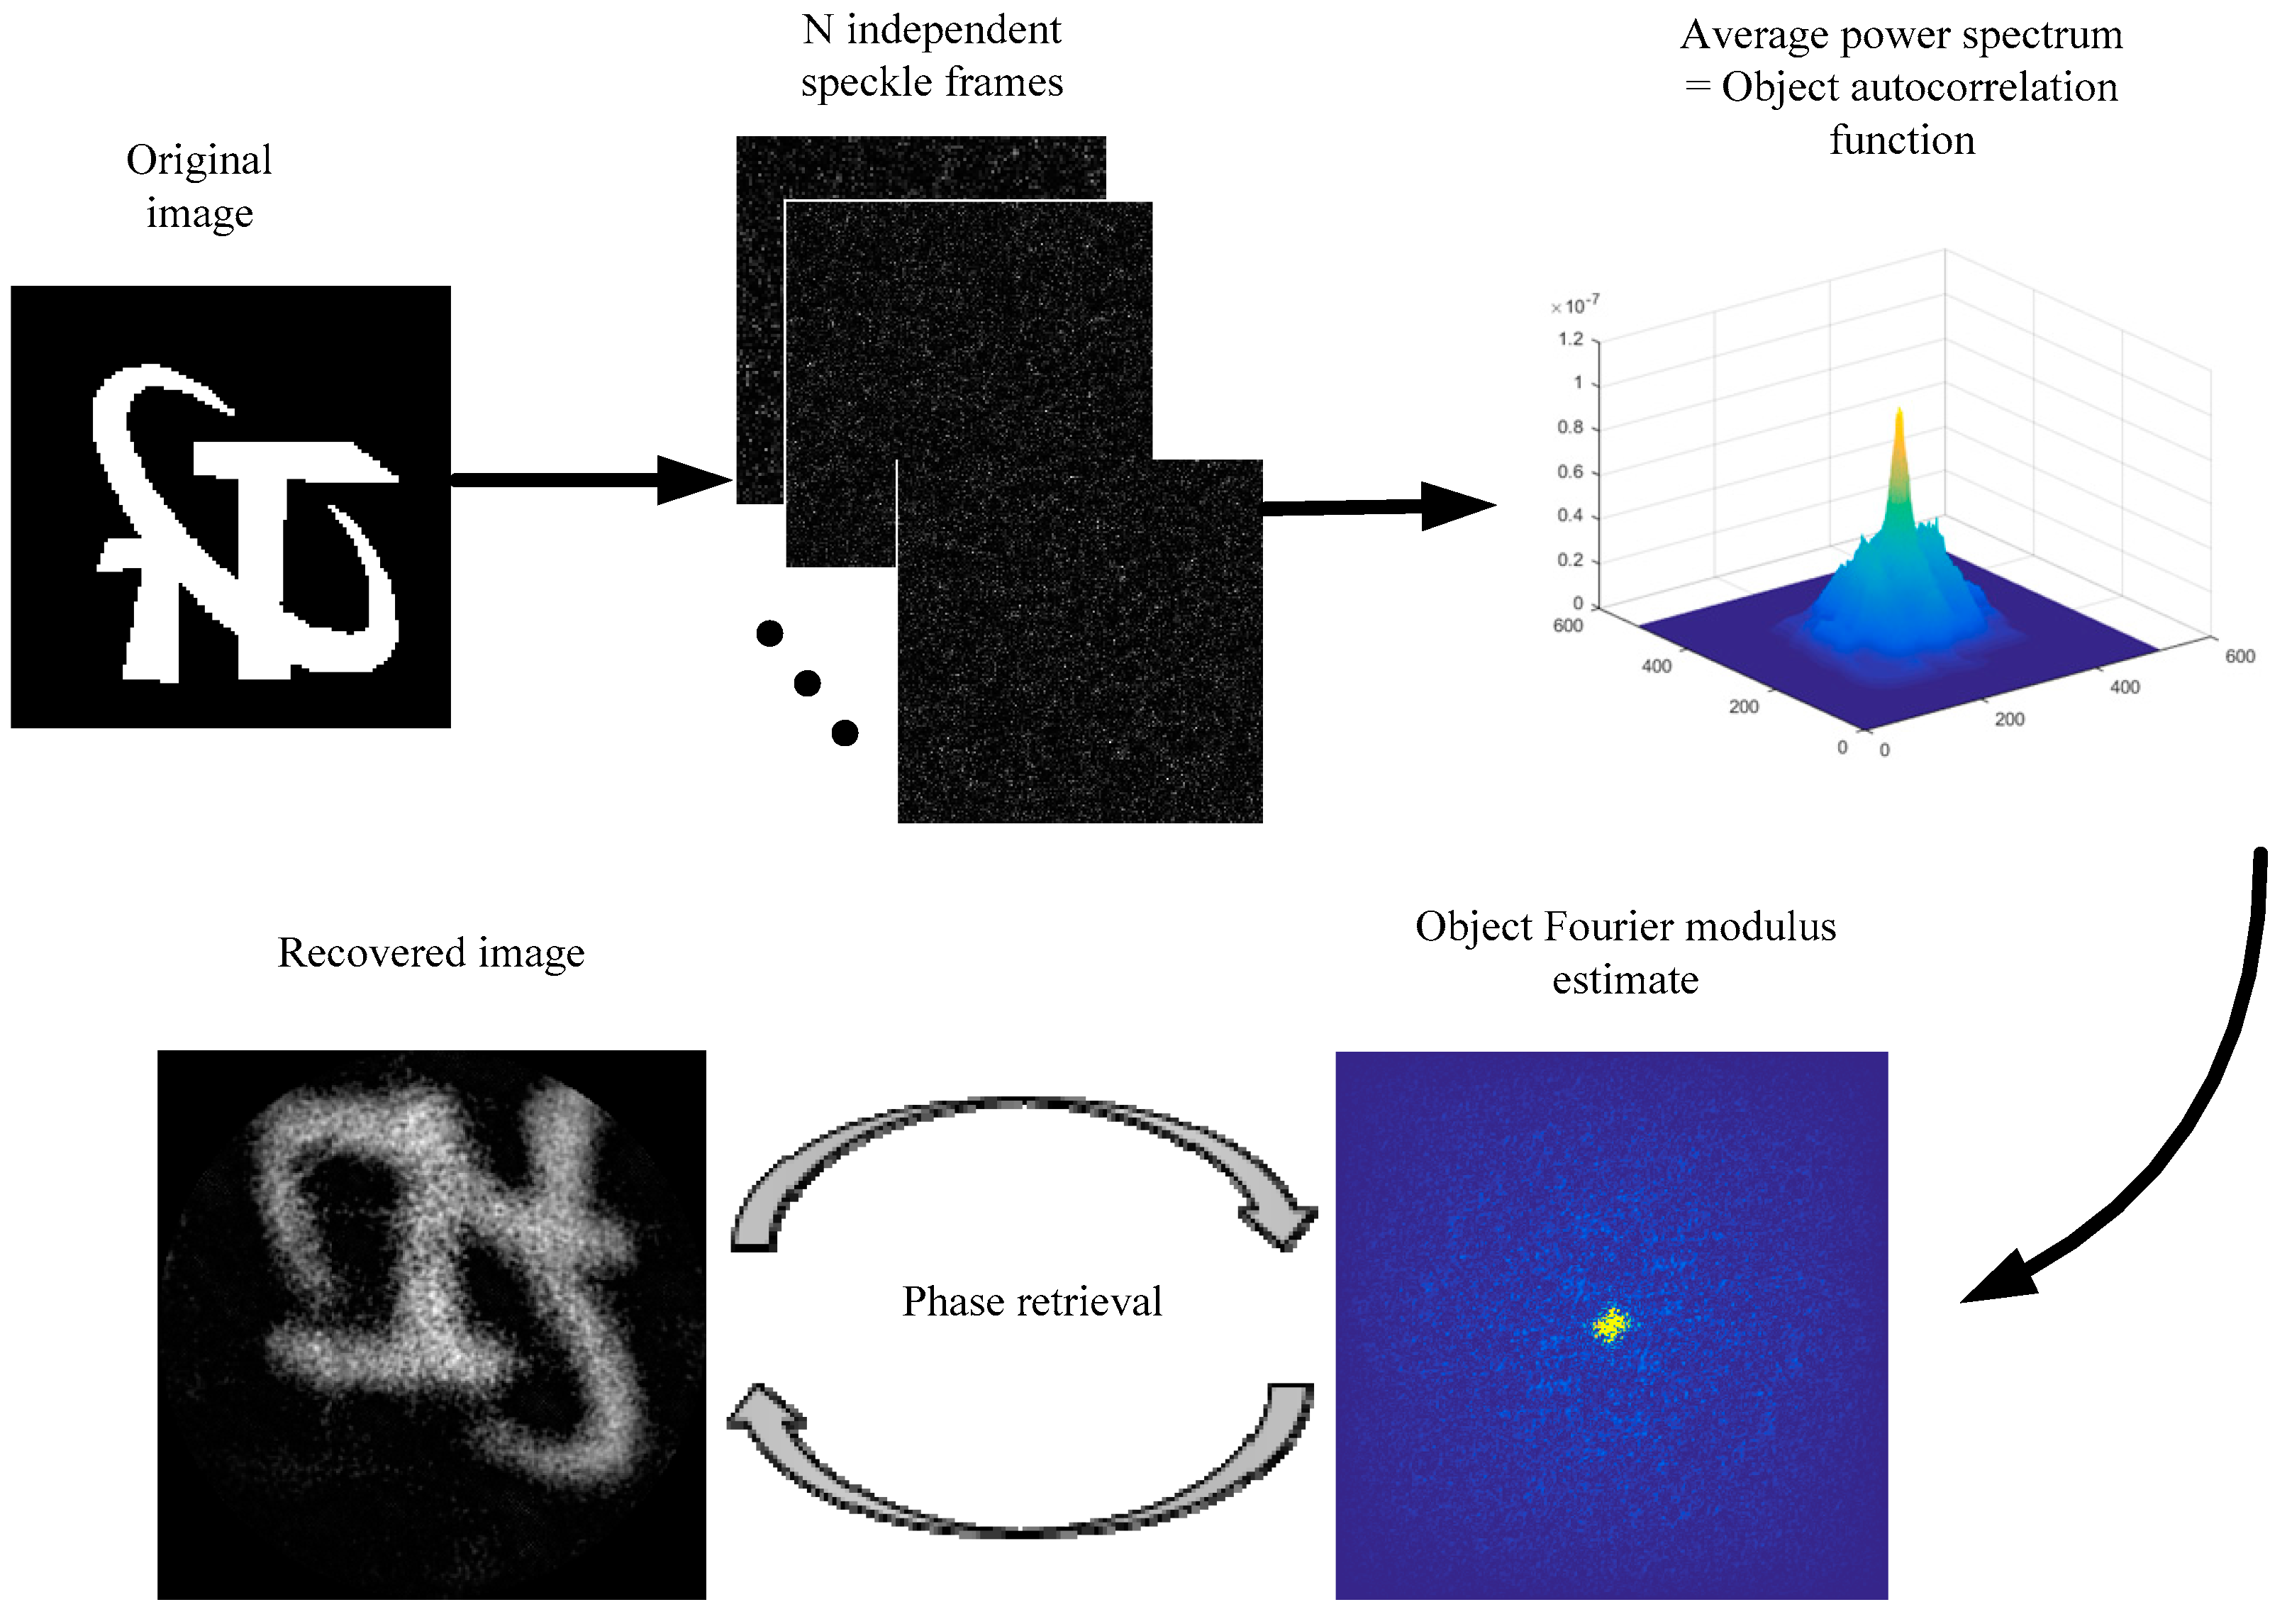
where denotes the Fourier magnitude of the object’s intensity distribution. Then, a phase retrieval algorithm is applied to recover the phase associated with the . By performing the inverse Fourier transform on the synthesized Fourier data, people can reconstruct the image of the object. Figure 2 is the block diagram of the imaging correlography.
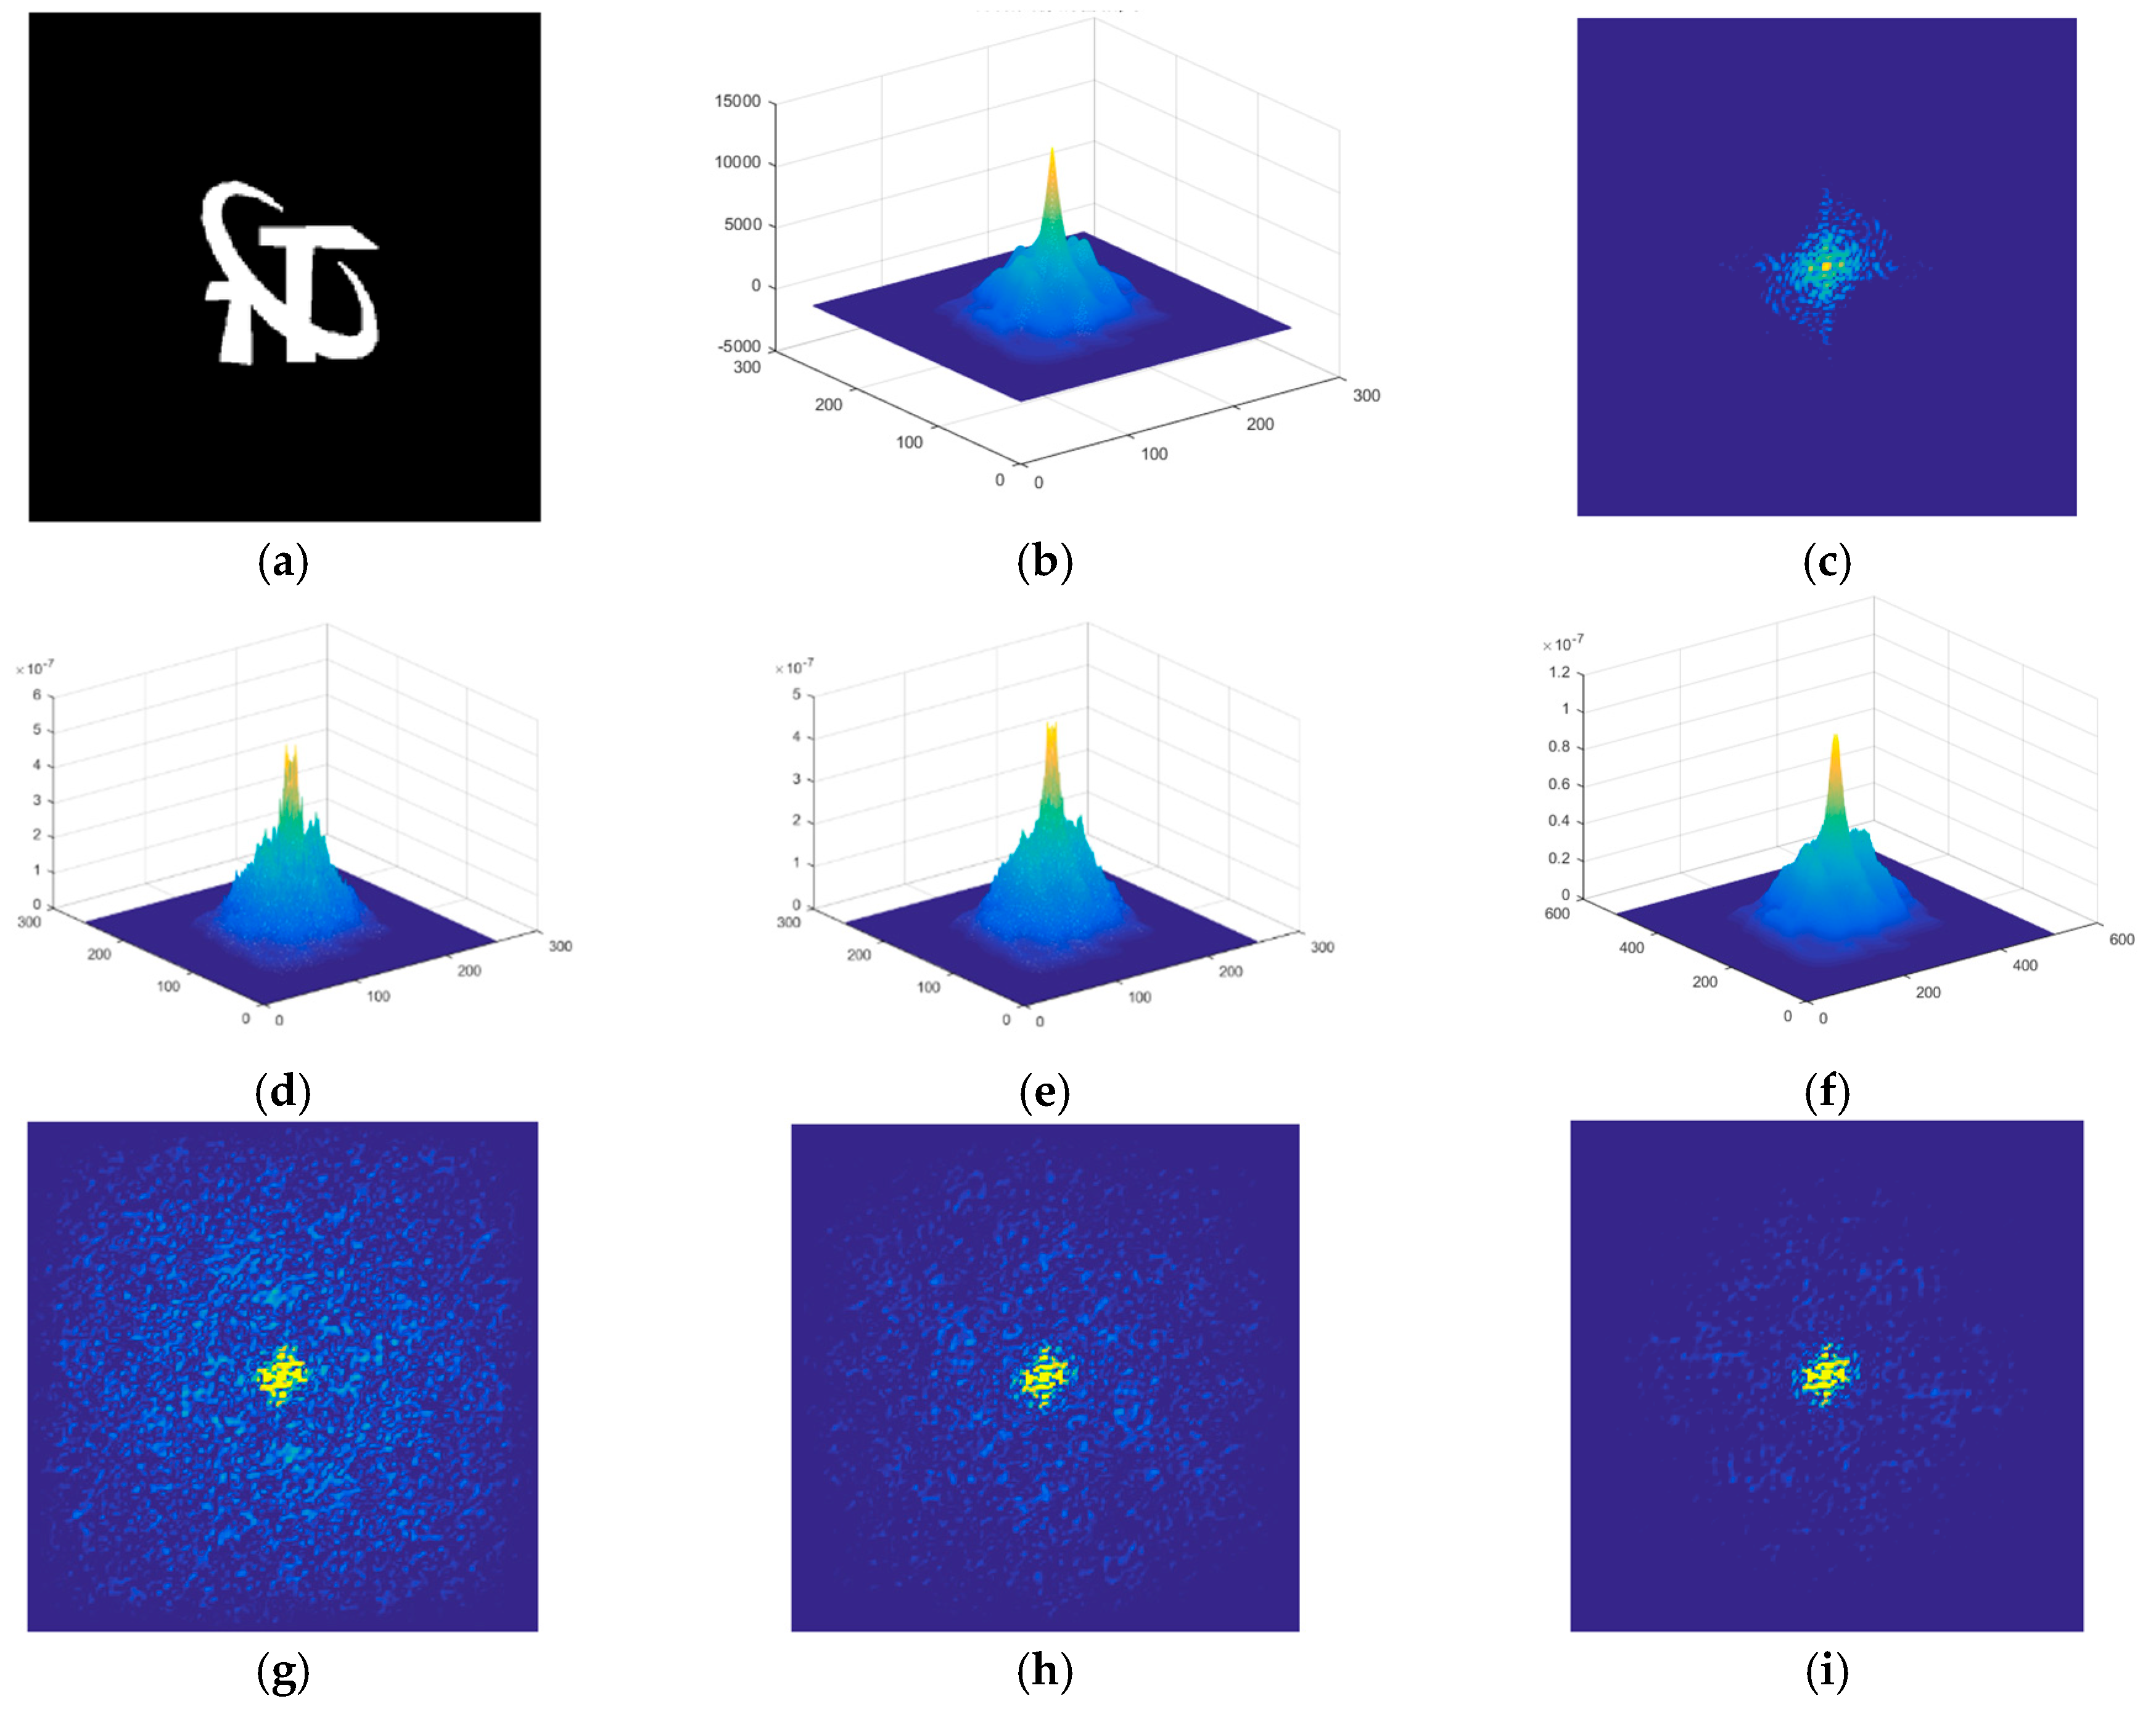
For practical imaging correlography geometries, a single speckle pattern realization () yields a rather noisy estimate of the object’s Fourier magnitude. Therefore, in most cases, a series of speckle pattern images are required to form a Fourier magnitude estimate that is acceptable for reconstructing an image of the object. Figure 3a is applied to generate the speckle intensity patterns. Figure 3b shows the actual autocorrelation function of the original image, and Figure 3c shows the actual Fourier magnitude of the original image. Figure 3d–f are estimated autocorrelation functions from 200, 500, and 1000 speckle frames, respectively, and Figure 3g–i are estimated Fourier magnitudes from 200, 500, and 1000 speckle frames, respectively. Compared with the actual data and estimated data, it is clear that the autocorrelation function and Fourier magnitude estimated in this manner are noisy. Especially at the higher spatial frequencies, the noise is pronounced and the Fourier modulus is weak. With the number of speckle patterns increasing, the apparent noise at higher spatial frequencies is reduced. It is quite difficult for the iterative phase retrieval algorithm to converge to the global optimal solution with these noisy estimated Fourier modulus data.
2.2. Imaging Correlography with Ptychography
The main problem with imaging correlography is that the estimated power spectrum has a very low signal-to-noise ratio (SNR) for high spatial frequencies, making the phase recovery inaccurate. Therefore, the recovered object suffers from low resolution. The ptychographic framework is used to solve the problem of inaccurate phase recovery when using imaging correlography. The overlapping region of subapertures can constrain the solution space of the reconstruction procedure. As the ratio of intensity measurements to unknowns is increased, the likelihood of ambiguous solutions existing reduces. In this subsection, we show how the ptychographic framework can be adapted to imaging correlography.
Similar to ptychography, an aperture is introduced to measure the object part-by-part. Here, the aperture is assumed to be a low pass filter with within a finite diameter, and is recentered at m different locations in the object domain. The n-th speckle intensity pattern of the j-th section of the object can be described as
According to Equation (3), the autocorrelation function of the j-th subobject can be estimated from the average spectrum of speckle intensity patterns.
where denotes the ensemble (mean) intensity of the n-th observed speckle pattern of the j-th subobject. Since the Fourier transform of the autocorrelation of the object’s brightness function is equivalent to the squared modulus of the Fourier transform of the brightness function [4], the Fourier magnitude of the j-th subobject can be described by
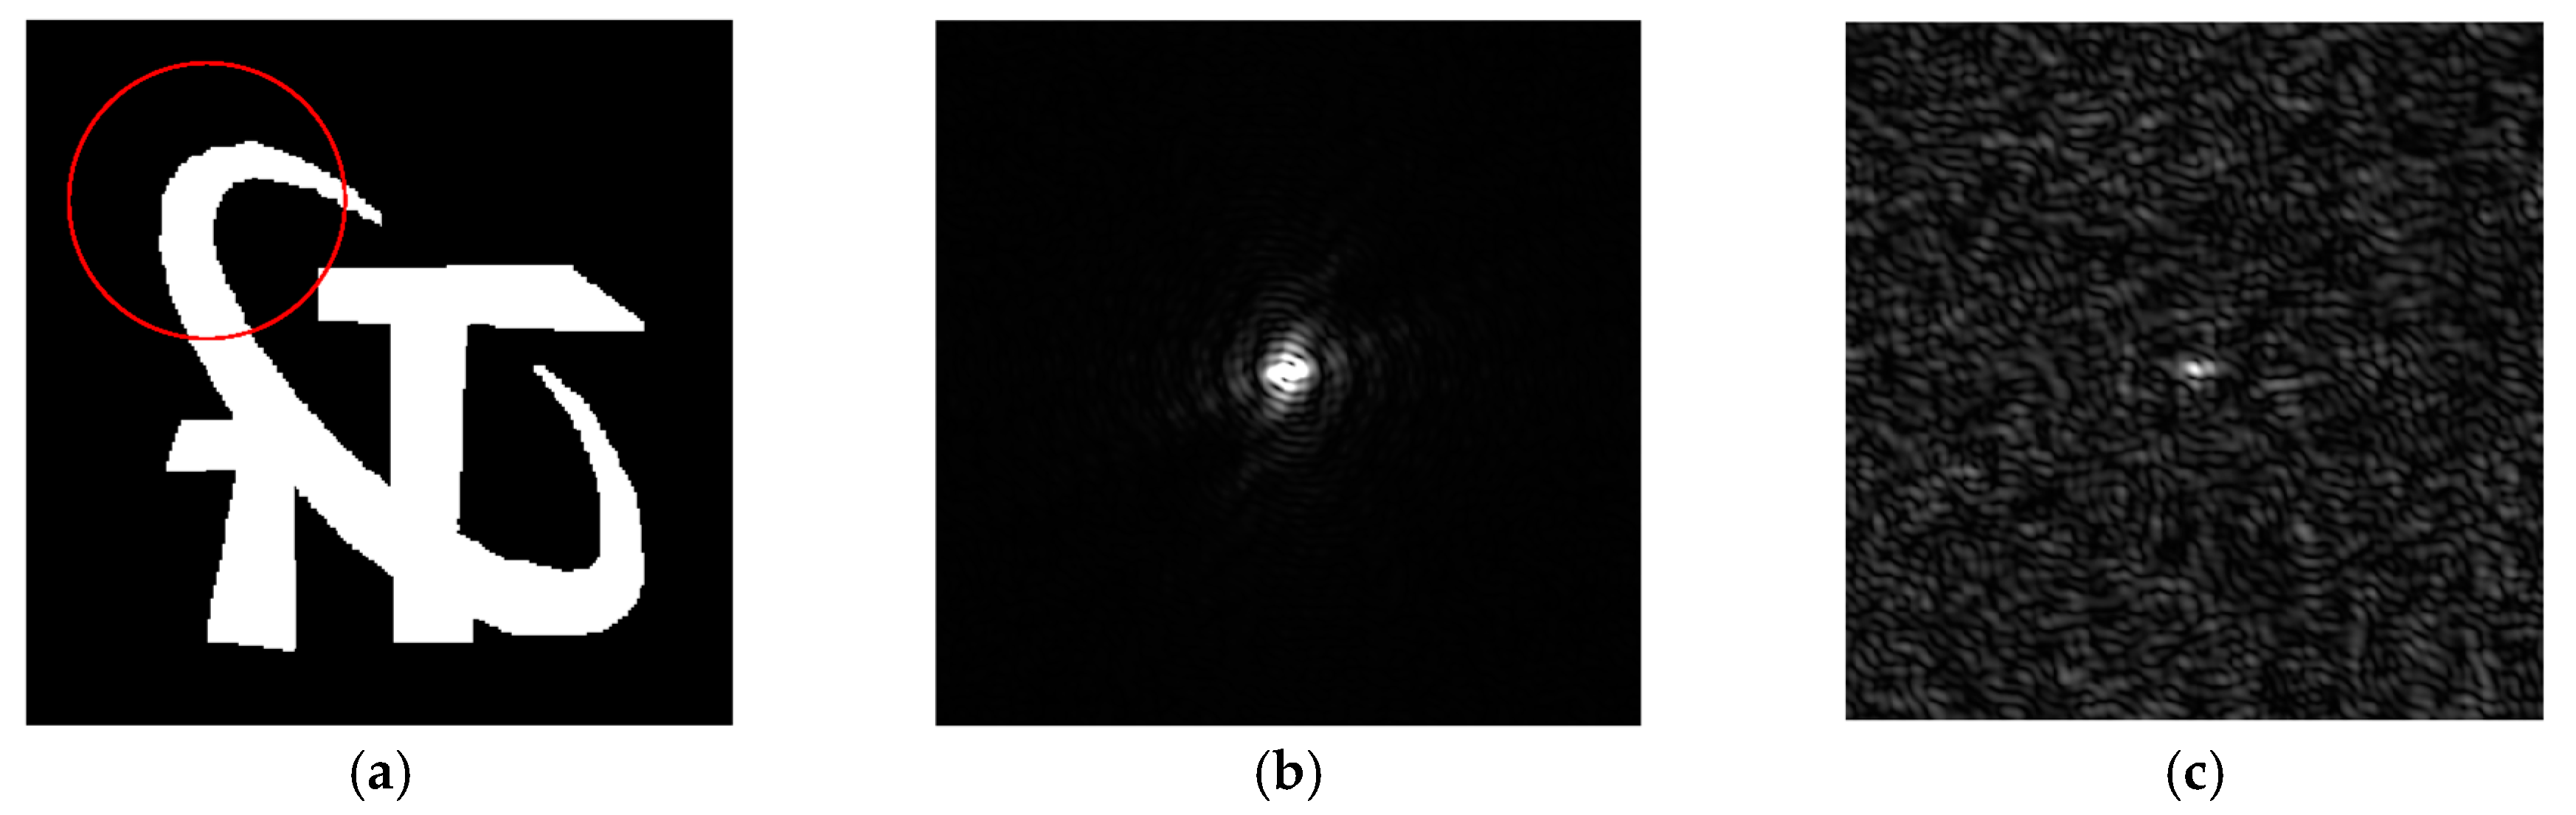
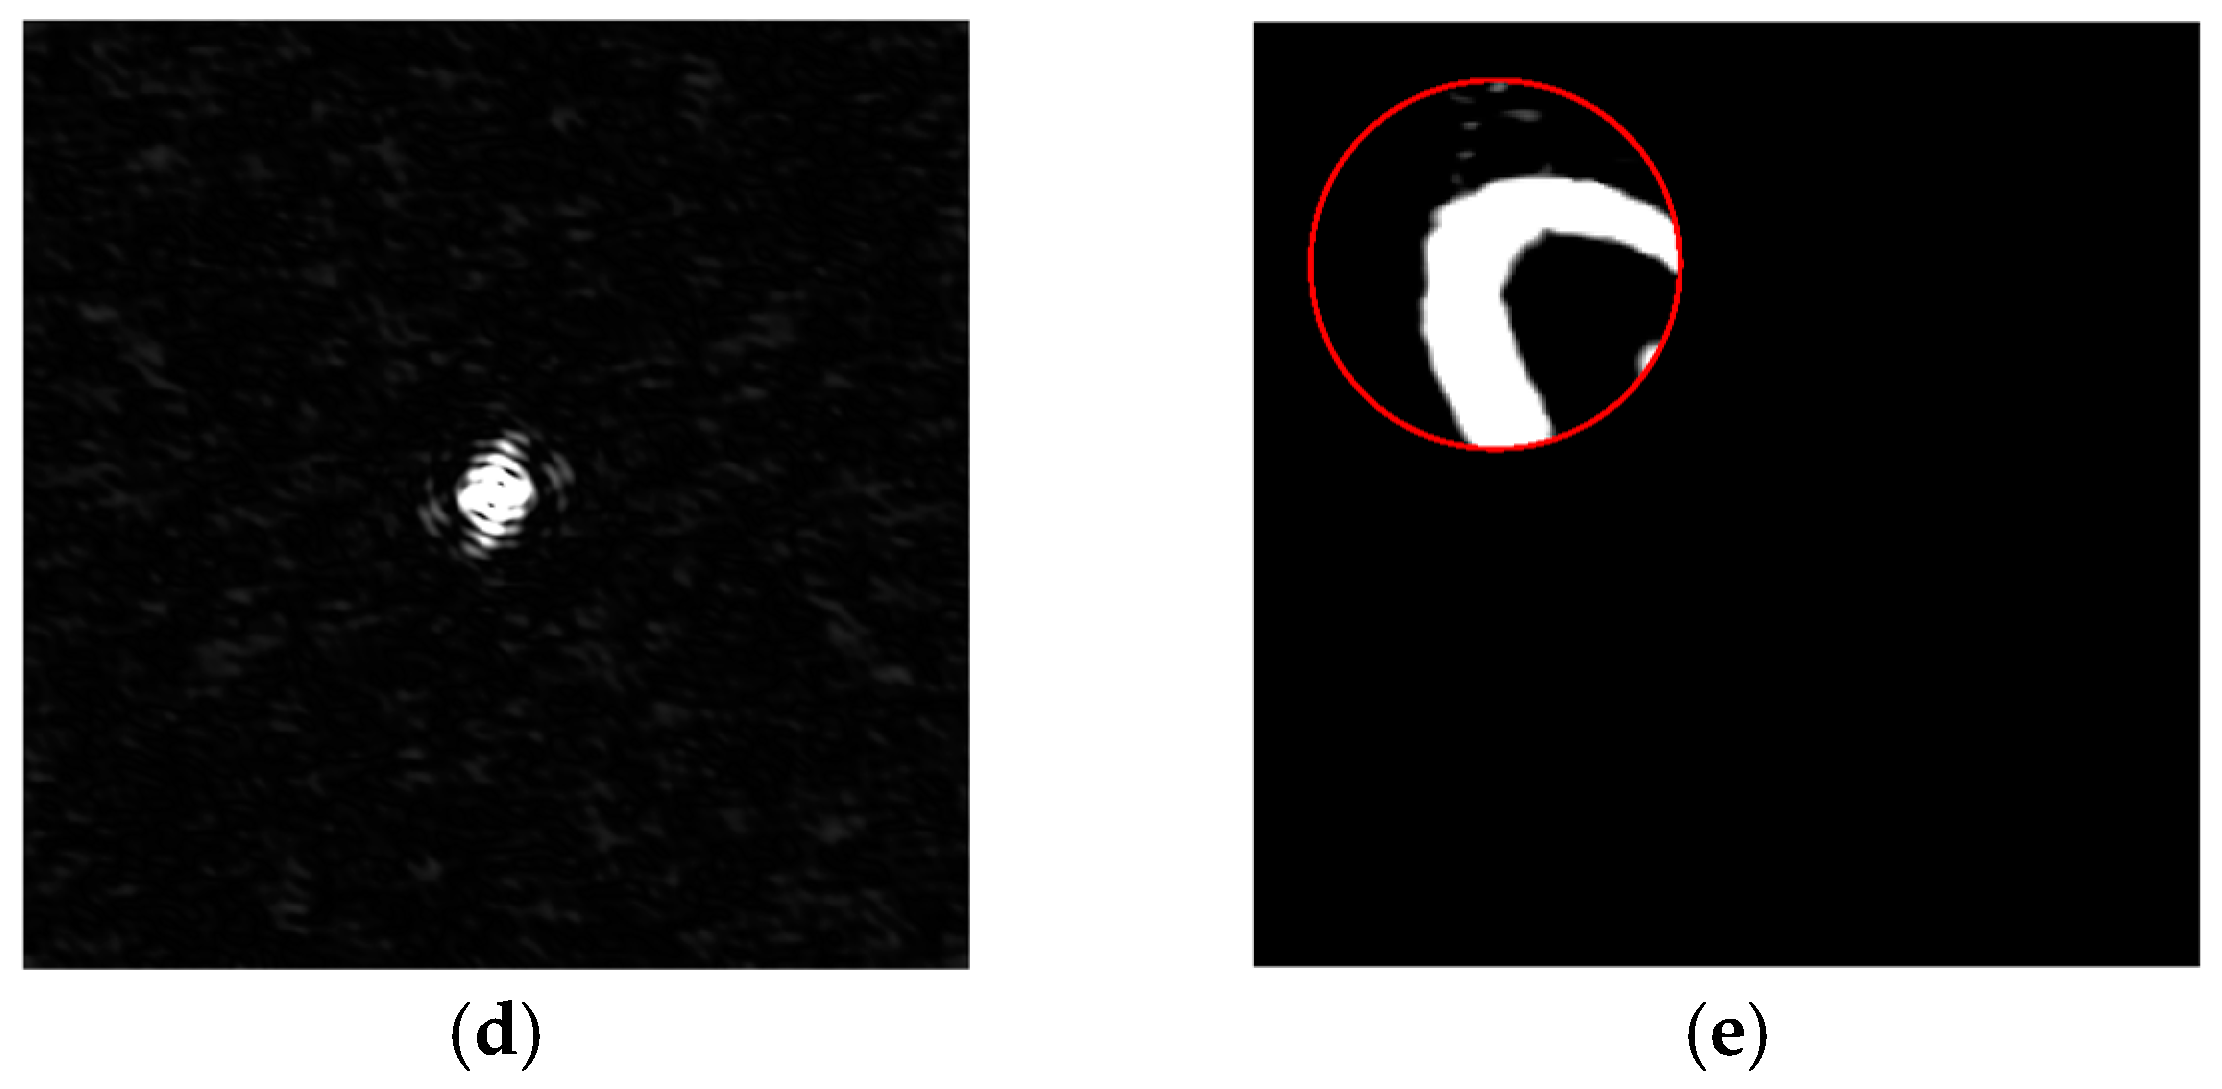
Note that the estimated can be treated as the measured intensity pattern in the far field plane for ptychography. Then, people can reconstruct the object using ptychographic phase retrieval algorithms. Figure 4 is the block diagram of the imaging correlography with ptychography. Compared with Figure 2 and Figure 4, the overlap of adjacent sections in the original object is crucial to provide redundant constraints. It can effectively solve the multiple solution problems and avoid converging to local optimal solutions for the conventional imaging correlography. Figure 5a is an original image, and the red circle area is the first scan position . Figure 5b is the far-field diffraction pattern of the red circle area. It can be regarded as the measured data from conventional ptychography under ideal conditions. Then, the rapidly changed random numbers are used for the phase of the optical field to simulate the phase perturbation. Figure 5c shows the recorded far-field diffraction pattern in this case. Compared with Figure 5b, the measured data in Figure 5c is very noisy. However, we can re-estimate the far-field diffraction pattern (Figure 5d) from a series of noisy measurements (Figure 5c) using the imaging correlography method. Figure 5d is the estimated far-field diffraction pattern via correlography. Figure 5e is the ptychographic reconstruction results of the first scan position with estimated far-field diffraction patterns. Therefore, one can re-estimate the far-field diffraction pattern using imaging correlography if the directly measured data are noisy.
2.3. Optimization Framework
The estimated in the above ptychographic imaging correlography manner can only provide the Fourier magnitude of the j-th subobject. To obtain the image of the entire object, a reconstruction algorithm is required to retrieve the phase information associated with . Here, the Wiener filter is introduced before invoking the phase retrieval algorithms, which produces the minimum mean-square estimate of Fourier magnitude from the recorded speckle patterns [2,7]. This can greatly improve the visual quality of the recovered image. The filtered Fourier modulus is described by
where is the Wiener filter operator and is given as
where is the aperture transfer function, is an estimate of the object’s power spectrum, and is an estimate of the noise-energy spectrum. For this work, the parameters of the Wiener filter are estimated from the data recorded at the central position. The is taken to be the autocorrelation of the subaperture. The squared Fourier modulus is used in place of . is assumed to be a constant, whose value is obtained by averaging the squared Fourier modulus estimate over those high spatial frequencies. According to the actual situation, one can control the suppression of the high-frequency noise by adjusting the value of .
2.3.1. Image Recovery and Regularization
The error reduction (ER) algorithm [31] and hybrid input–output (HIO) algorithm [32] are commonly used phase retrieval methods for imaging correlography. They use a similar method, iterating between frequency and spatial domains with a set of constraints in both. The main difference between them is that the HIO algorithm applies a feedback function outside the object’s support. In fact, the conventional ptychographic iterative engine (PIE) for ptychographic imaging can be seen as using the ER algorithm for each probe position sequentially if the probe is assumed as a finite support. The main difference between PIE and ER is that PIE updates the subobject sequentially in each iteration, while the ER updates the entire object in each iteration.
In this work, we introduce the amplitude flow optimization framework [33] for ptychographic reconstruction and incorporate a regularizer named as regularization by denoising (RED) [34] to suppress noise. This method was first proposed by Metzler in the research [35]. It is suitable for various system models and suppresses noise well. As with the relationship between PIE and ER, our work updates the subobject sequentially in each iteration, while the research [35] updates the entire object in each iteration. The amplitude flow algorithm is a recently reported method used to recover the solution x to a system based on the magnitude measurements , where is the feature or sensing vector, x is the wanted unknown signal, and is the given observation. Previous research has demonstrated that this lower-order loss function based on absolute magnitude has great advantages in statistical and computational efficiency. Additionally, the gradient of the amplitude loss function is very similar to that of the Poisson log-likelihood [36]. In our case, the physical process of data detection corresponds to counting the number of electrons and photons hitting the sensor. Measurements in such a process are known to contain the Poisson distribution of noise [37]. Therefore, the amplitude-based reconstruction framework is reasonable for the proposed imaging process. To extend this framework to our reconstruction, the formulation of the proposed imaging model is rewritten as
where denotes the filtered Fourier magnitude of the subobject in Equation (8), and denotes the desired recovery object. denotes the relation between the reconstruction value and the estimated Fourier magnitude , which corresponds to two sequential operations: (i) downsampling of the object caused by aperture function; (ii) estimation of the Fourier magnitude of the subobject via imaging correlography. Following the least-squares criterion, the problem of solving Equation (10) is recast as a minimization problem
As mentioned above, imaging objects in this method results in noisy reconstructions. To further suppress noise, the RED framework is applied during the reconstruction. RED is an efficient and flexible approach used to solve inverse imaging problems. It can incorporate an arbitrary denoiser to regularize an arbitrary inverse imaging problem. Another advantage of RED is that it employs the denoising engine in defining the regularization of the inverse problem to make the overall reconstruction function clearer and better defined. Then the loss function for our reconstruction algorithm is constructed of the form
The first term following the form of Equation (11) is the data fidelity term, which encourages the estimated Fourier modulus to match the measured data . The second term is the RED term defined in the research [31]. Here, is the transposed conjugate matrix of the recovered object , is the regularization parameter, and is the denoising engine that can incorporate an arbitrary filter to plug in the regular term. The RED regularizer not only penalizes residual difference between the reconstruction data and its denoised self but also serves to prevent from removing the structure from . It is clear that if the denoised engine removes structure from the recovered data, this structure will show up in the residual difference [35]. The gradient of the data fidelity term is easily computable, and the gradient of the RED engine is described in previous research [34]. Then, the gradient of the loss function is given in the form
where is the sign function for nonzero arguments (, which is adopted if ), and is the transposed conjugate matrix of . The update formula for the loss function is described as
where t is the iterate count, and is the step size. The imaging reconstruction framework is summarized in Algorithm 1.
| Algorithm 1: The reconstruction framework for ptychographic imaging correlography. |
| Input: Estimated Fourier magnitudes ; sampling matrix . Output: Recovered image .
|
2.3.2. Initialization
The setting of initial value is also critical to our reconstruction. An initial guess close enough to the optimal solution can avoid image artifacts and speed up the phase retrieval process. Previous research [35,38] demonstrated that various spectral initializers were ineffective for Fourier measurements, although were successful for Gaussian measurements and coded diffraction measurements (CDP) [39]. Bian et al. used the captured data under normal incident light (center image) as the initial value for their Fourier ptychography setup [40,41]. A random matrix has also been employed previously as the coarse initialization [23]. In this work, the setting of initial value was similar to the research [35,42], which is more reliable for Fourier measurements. The HIO is first run 50 times using random initialization to obtain 50 estimates of the original data. We then choose the HIO estimate value with the lowest residual as an initialization for the HIO algorithm. The HIO is run a further 50 times, and the result is used to initialize the proposed reconstruction algorithm. The whole algorithm for ptychographic imaging correlography is described in Algorithm 1.
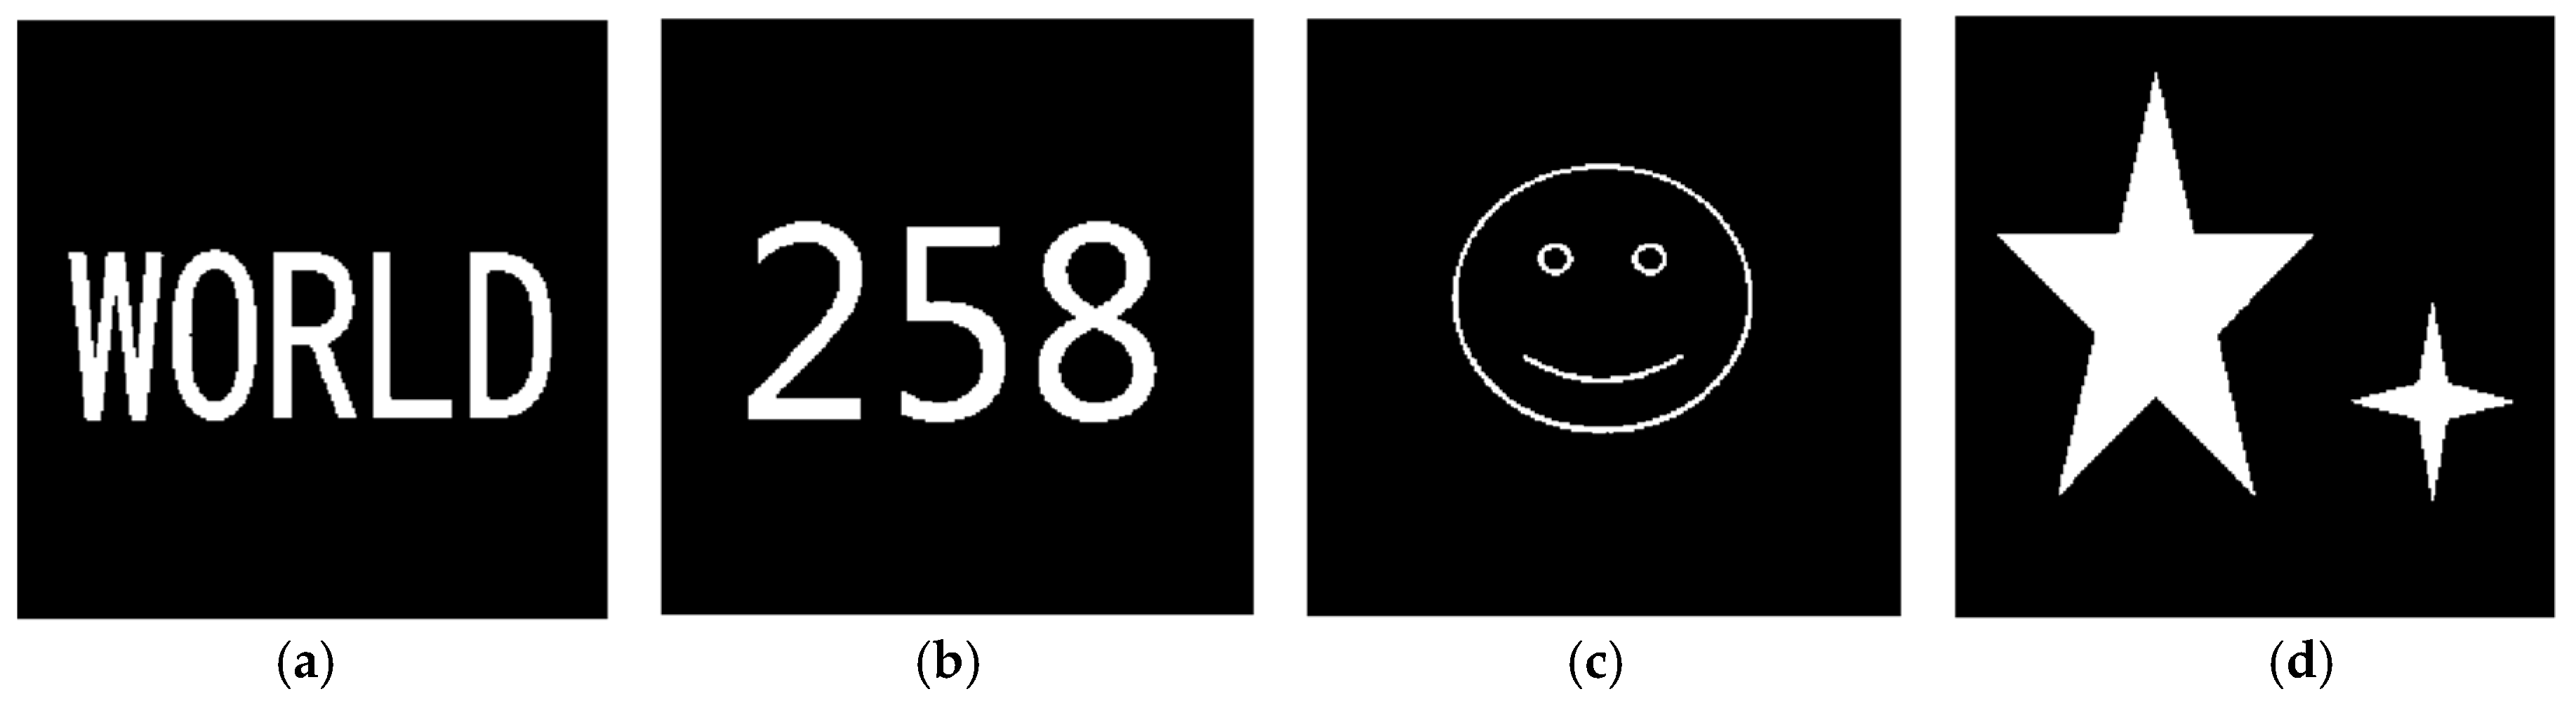
The convergence of the proposed algorithm with different initializations is validated on a series of images. The comparison methods include random initialization, spectral methods, and our initialization (HIO results). Because of the limited space, here we only show the results of four test images, including letters, numbers, and simple geometric figures. Figure 6 shows the original test images. The structural similarity index (SSIM) is used to quantitatively evaluate the reconstruction quality. Table 1 is the SSIM and iterations of the proposed algorithm with different initialization methods. The best reconstruction result for each test image is bolded in the Table 1. It is clear that the initialization method has a great impact on the reconstruction results. The spectral method mostly fails for the proposed imaging model, although occasionally a good result is obtained. The random matrix and the proposed initialization produce similar reconstructions, but the proposed initial method requires fewer iterations. Since the random initial value is far away from the truth data, it is difficult for the random method to find the steepest descent direction. The proposed initial method converges much faster than other methods. Actually, it can achieve relatively satisfactory results in about 20 iterations.
3. Experiments and Results
In this section, a series of experiments are conducted to investigate the advantages of the proposed imaging mechanism. We first compare the performance of conventional imaging correlography with ptychographic imaging correlography, and then analyze the effects of the number of speckle patterns on the proposed imaging method. Finally, we compare the performance of different reconstruction algorithms, including error reduction (ER), Wirtinger flow (WF), amplitude flow (AF), and amplitude flow with RED (AF-RED).
3.1. Numerical Simulation and Criterion
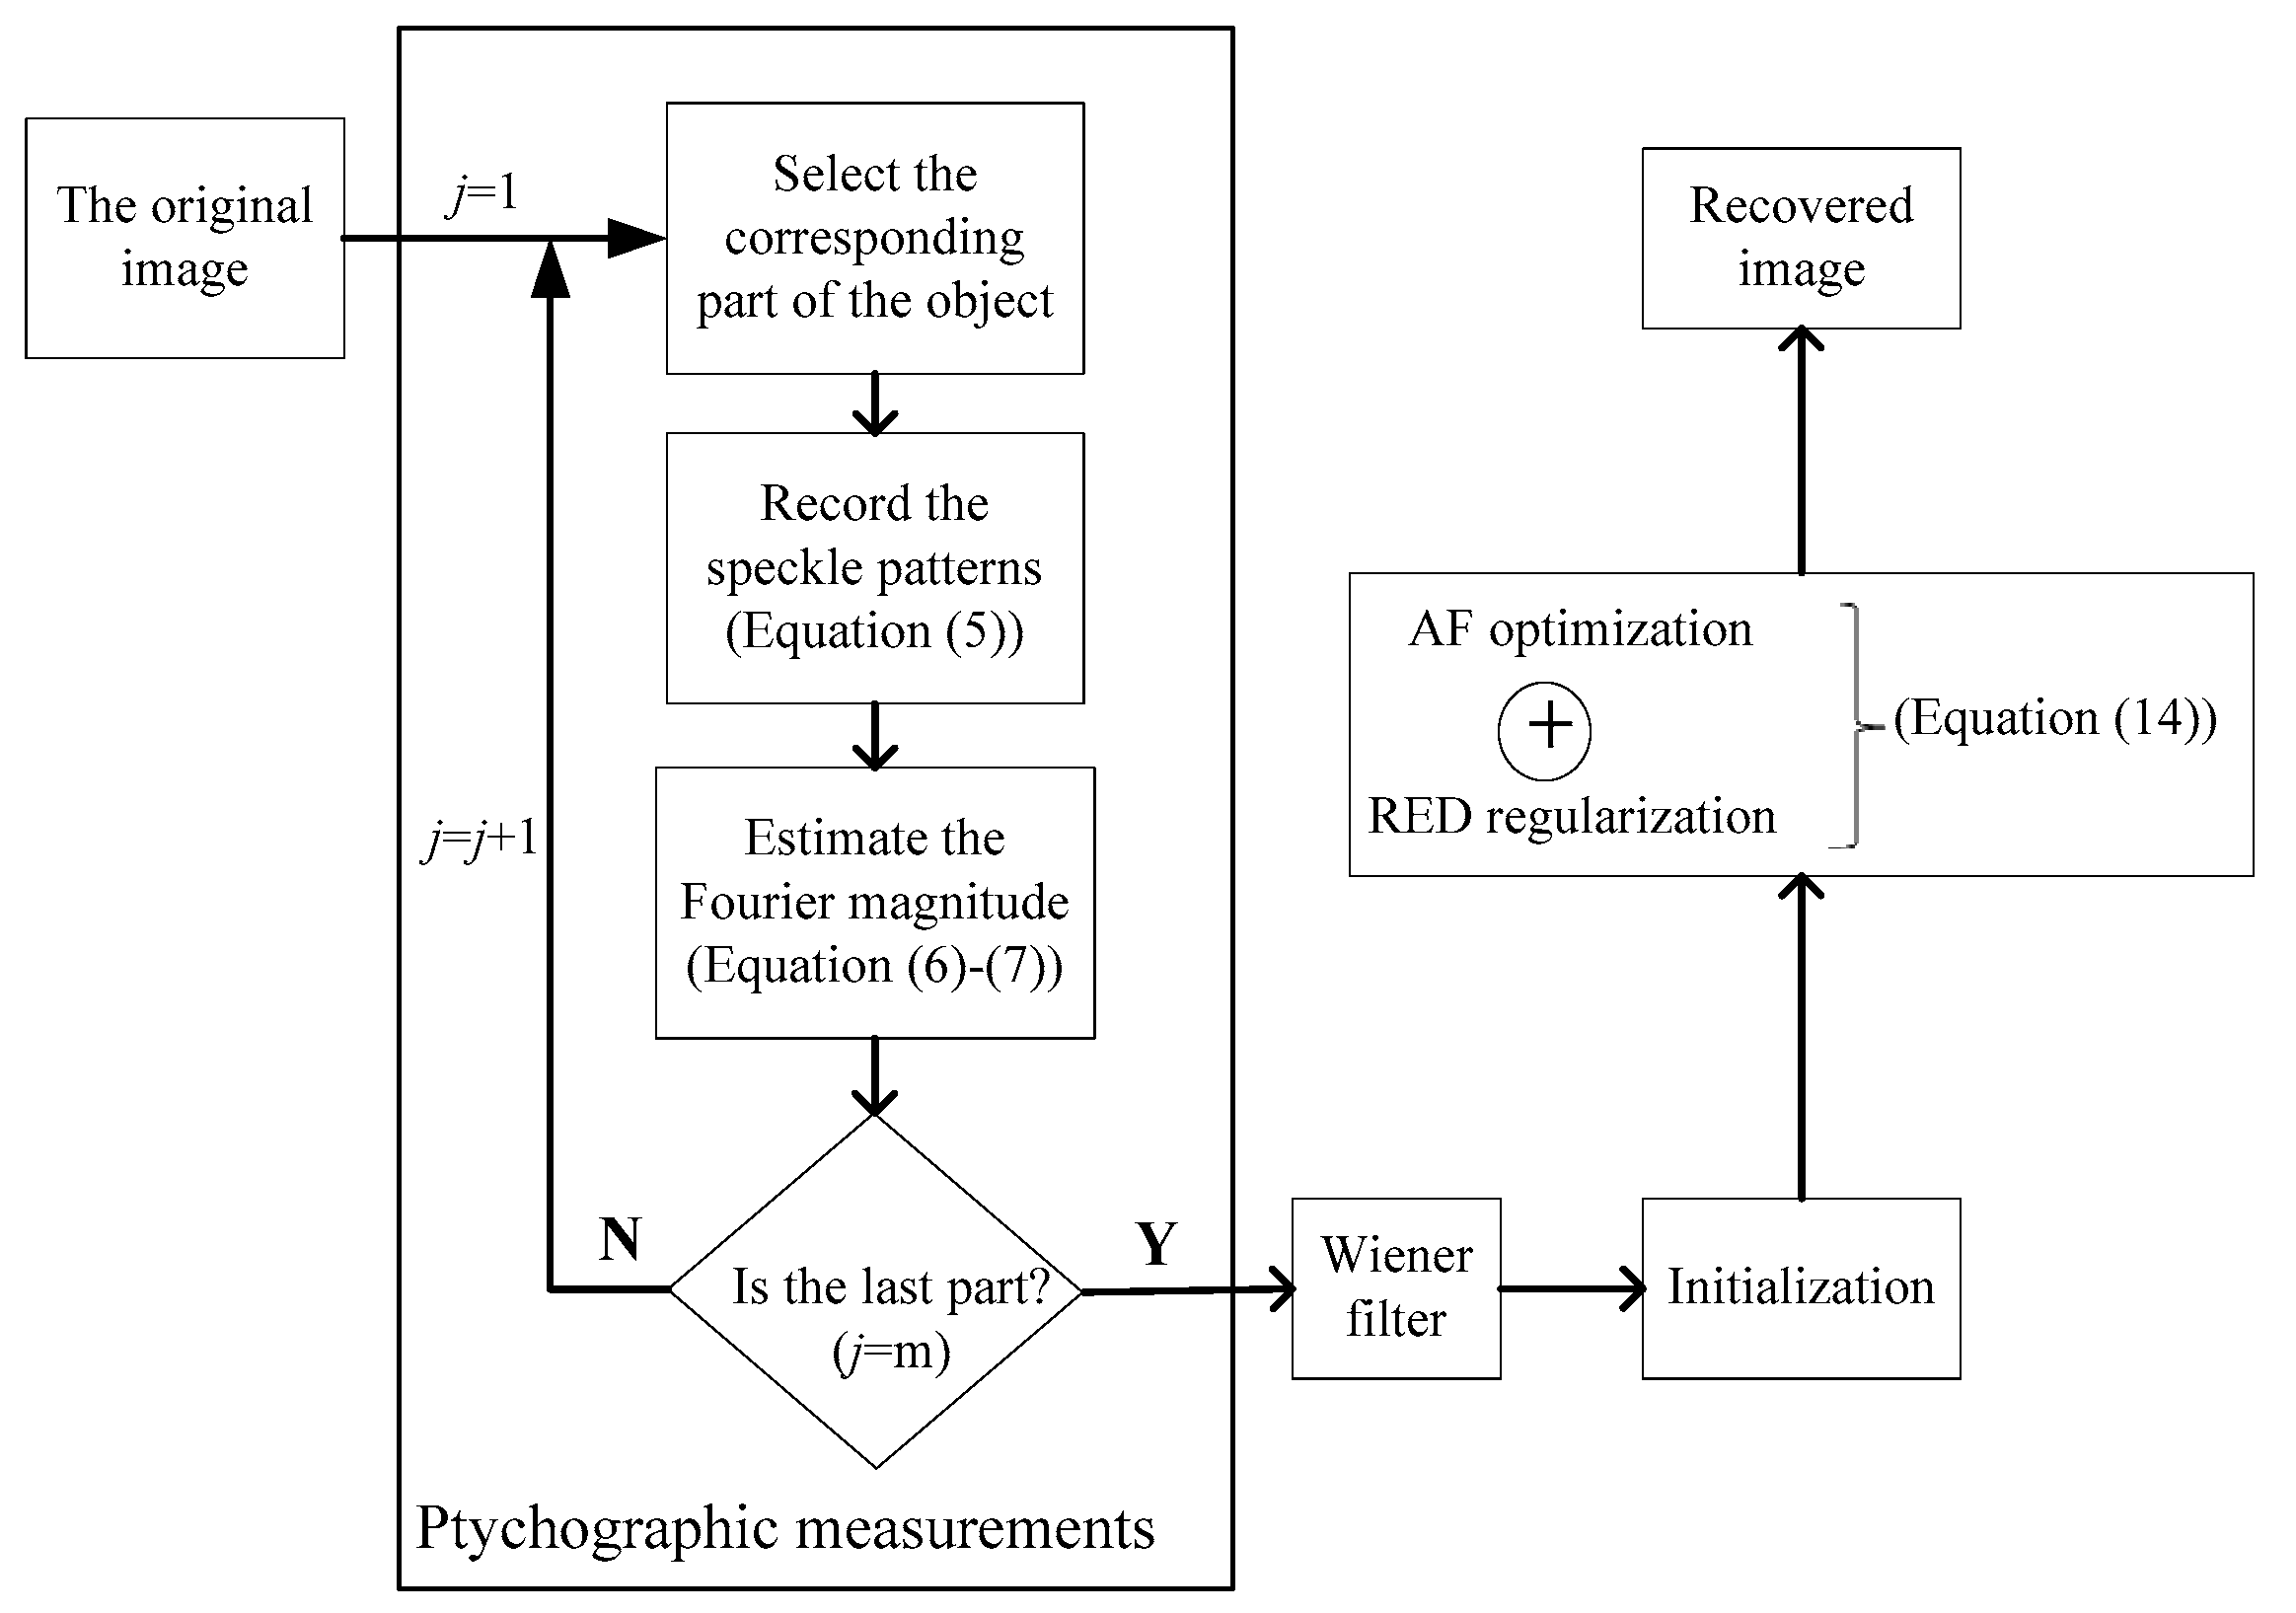
In simulation experiments, we assume that the object with the optically rough surface is illuminated with the laser. The amplitude of the object field is simulated by taking the square root of the test images. A simple way of modeling the surface roughness is to apply a random phase term to the object. The optical field is then propagated to the far field, and the square magnitude is taken to get the object speckle pattern. Independent speckle pattern realizations are obtained by computing the optical phase with different random numbers. Toward the ptychographic imaging methods, an aperture function is introduced to select a subsection of the object, which has been described previously. Similar to conventional imaging correlography, each section of the object obtains its corresponding speckle patterns. By using Equation (6), one can obtain the autocorrelation function of the subobject. The subobject’s Fourier magnitude is directly estimated according to Equation (7). People can then reconstruct the image of the object from the Fourier modulus by using the proposed ptychographic reconstruction algorithm. Intuitively, reconstruction quality is improved as the amount of overlap increases. The previous research indicates that a relative overlap of 60% yields high-quality reconstruction of the scanned object area [43]. The support size for conventional correlography is set to be consistent with the scanning range of the ptychographic measurements. The measured speckle frames for conventional imaging correlography are 1200, and the measured speckle frames for the proposed method are 150 at each position. The data processing steps used for the proposed ptychographic imaging correlography are presented in the flow chart in Figure 7.
In addition to the visual results, the structural similarity index (SSIM) [44] is used as a quantitative criterion to assess the quality of reconstruction appropriately. Instead of using a straightforward distance metric, the SSIM compares the restored image with the ground truth in terms of structure, contrast, and luminance.
3.2. Results
3.2.1. Recovery Performance Analysis
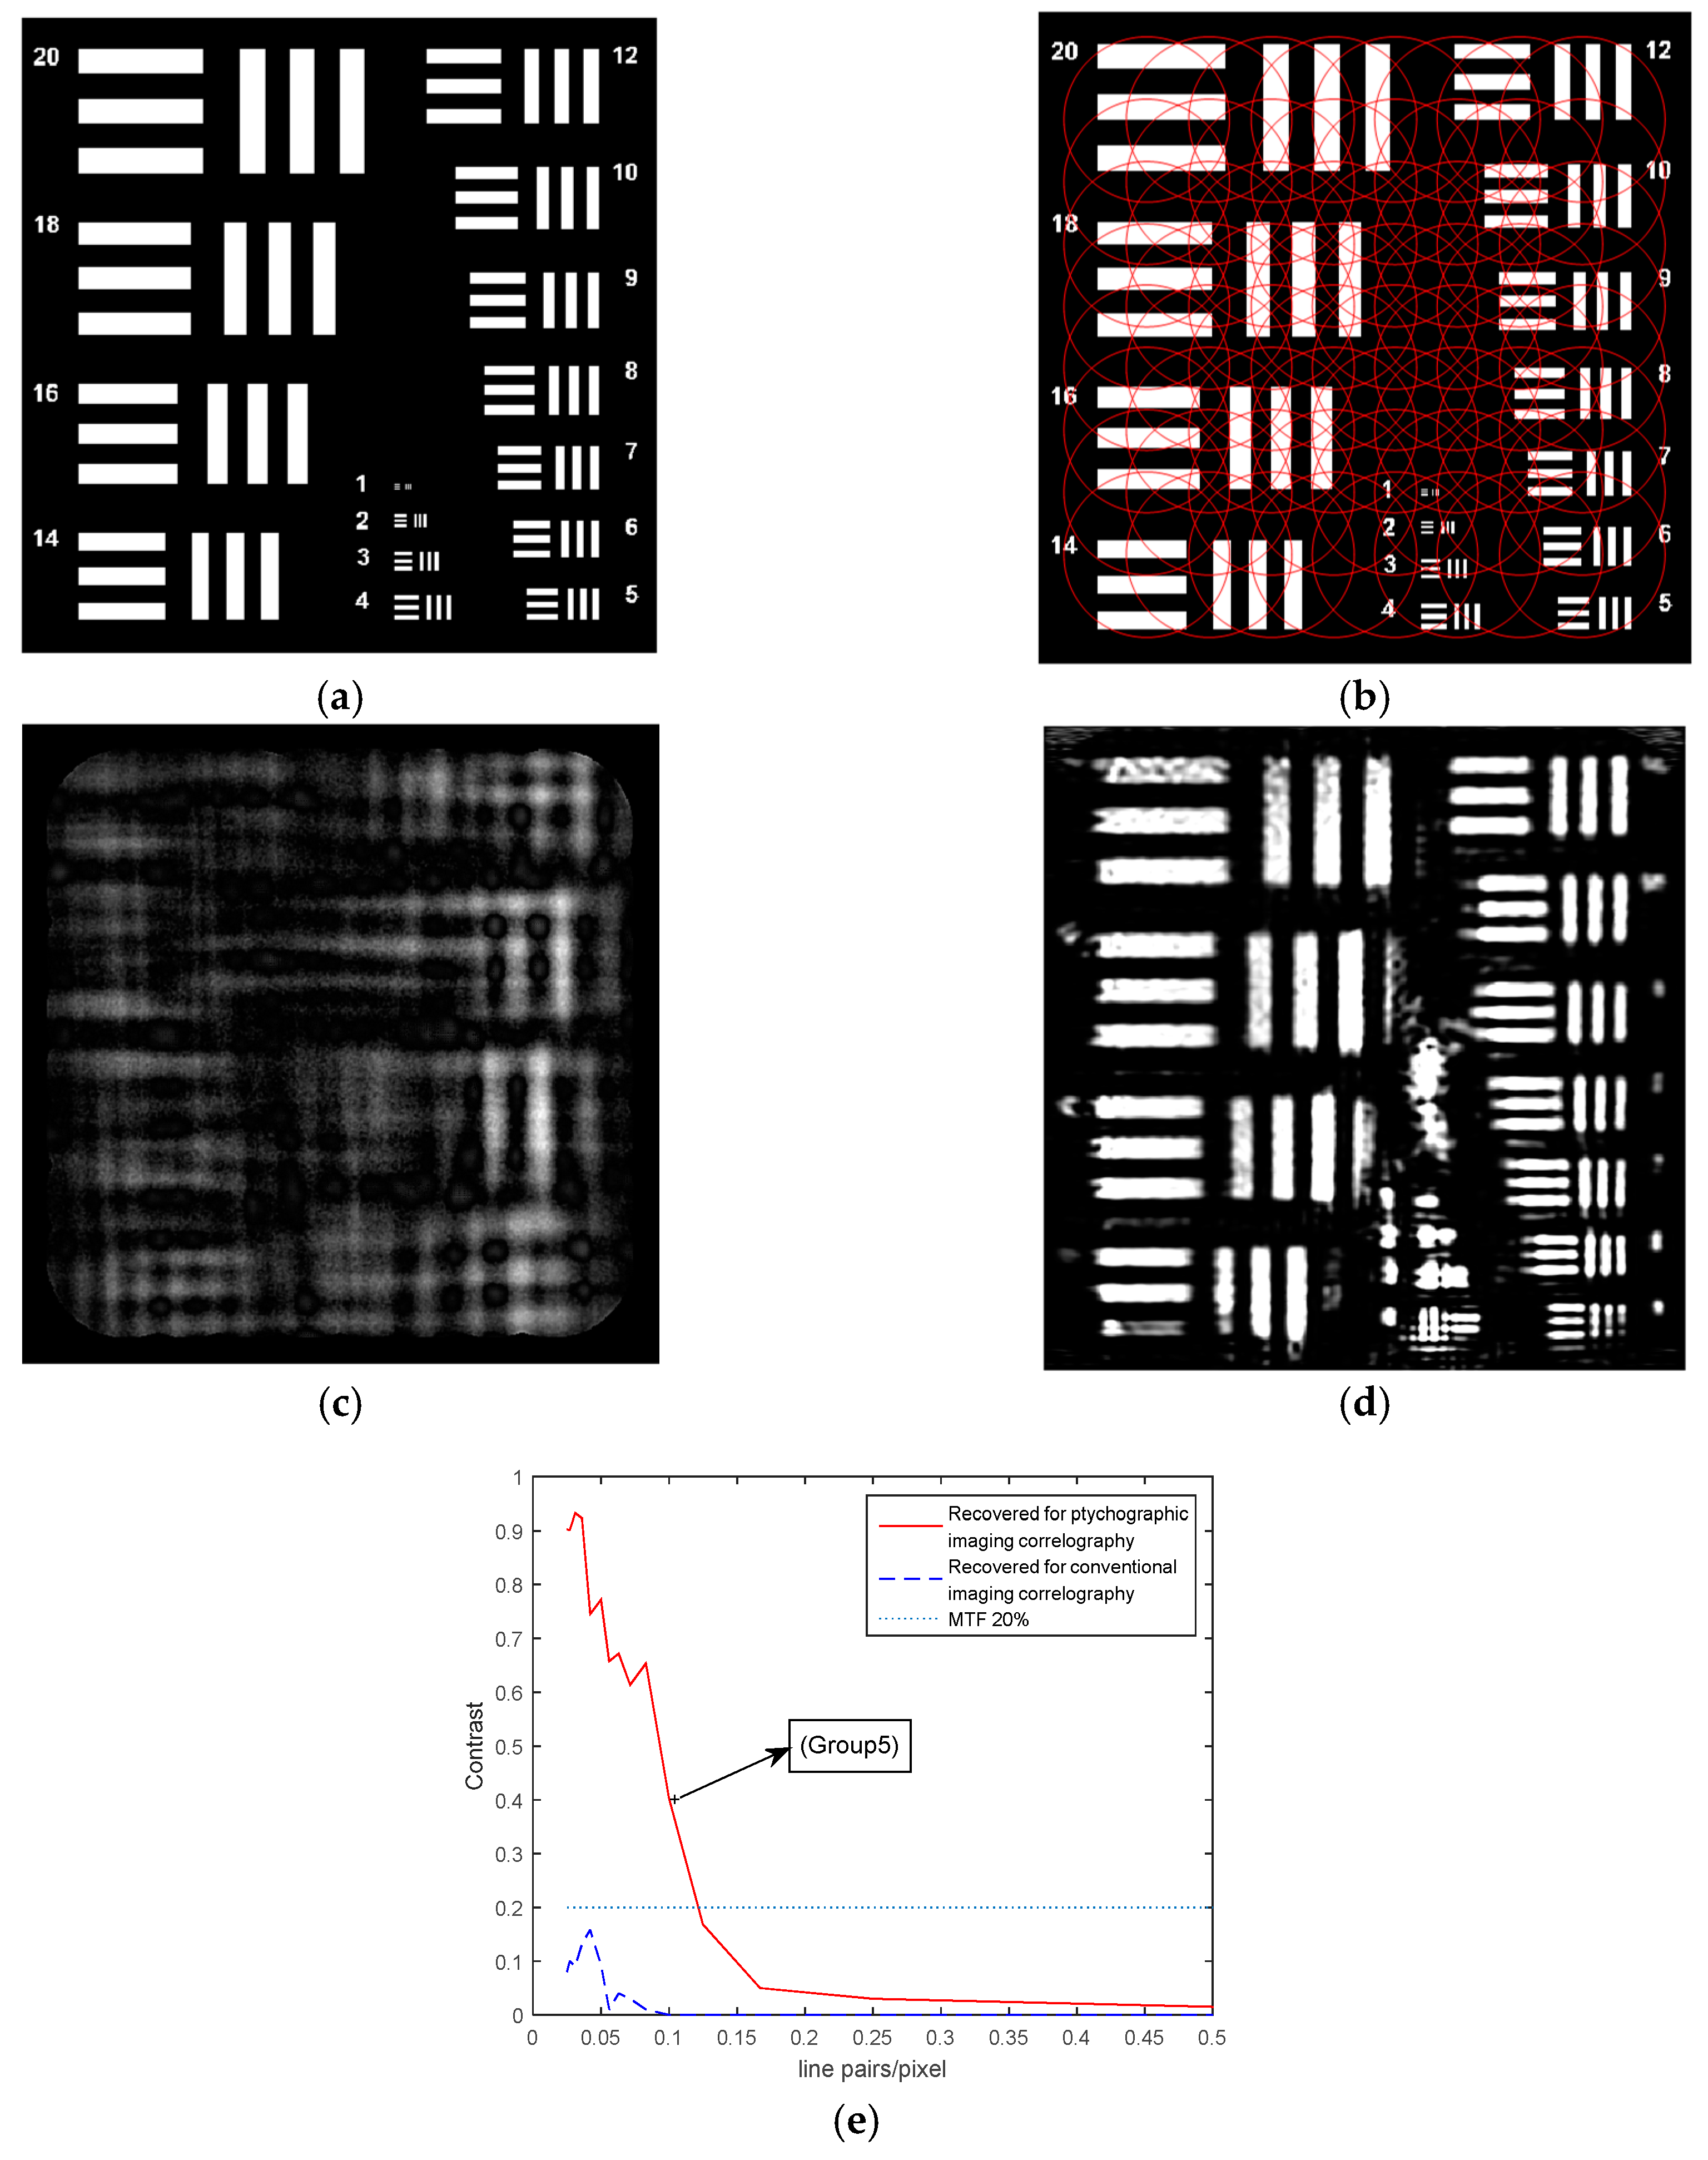
To compare the recovery performance of the conventional imaging correlography with the ptychographic imaging correlography, we perform the experimental simulations using a resolution chart, described in Figure 8a. The resolution chart contains line pairs with varying widths from 20 pixels down to 1 pixel, corresponding to line pairs per pixel in the range . The contrast for the horizontal and vertical bars belonging to each group is computed to quantify the reconstruction performance. The contrast is given as
where and are the average intensity of the black and white bars, respectively. To aid our discussion, the limit of resolvability is defined to be when the contrast of a group drops below (MTF 20%). MTF is the modulation transfer function of the imaging system. In the first simulation, we capture a grid of images with overlap between the neighboring positions. Figure 8b shows the ptychographic measurements for the resolution chart. The recovered image for conventional imaging correlography is shown in Figure 8c, and the recovered image for ptychographic imaging correlography is shown in Figure 8d. The plot in Figure 8e shows the contrast of the groups in the recovered images. The recovered results for conventional imaging correlography cannot resolve the features that have widths of 20 pixels (0.025 line pairs/pixel) before the contrast drops below . However, we are able to recover elements that are only 5 pixels wide (0.100 line pairs/pixel) using ptychographic imaging correlography. Compared with conventional imaging correlography, ptychographic imaging correlography improves the resolution of the object four-fold via the ptychographic measurements and the proposed optimization framework.
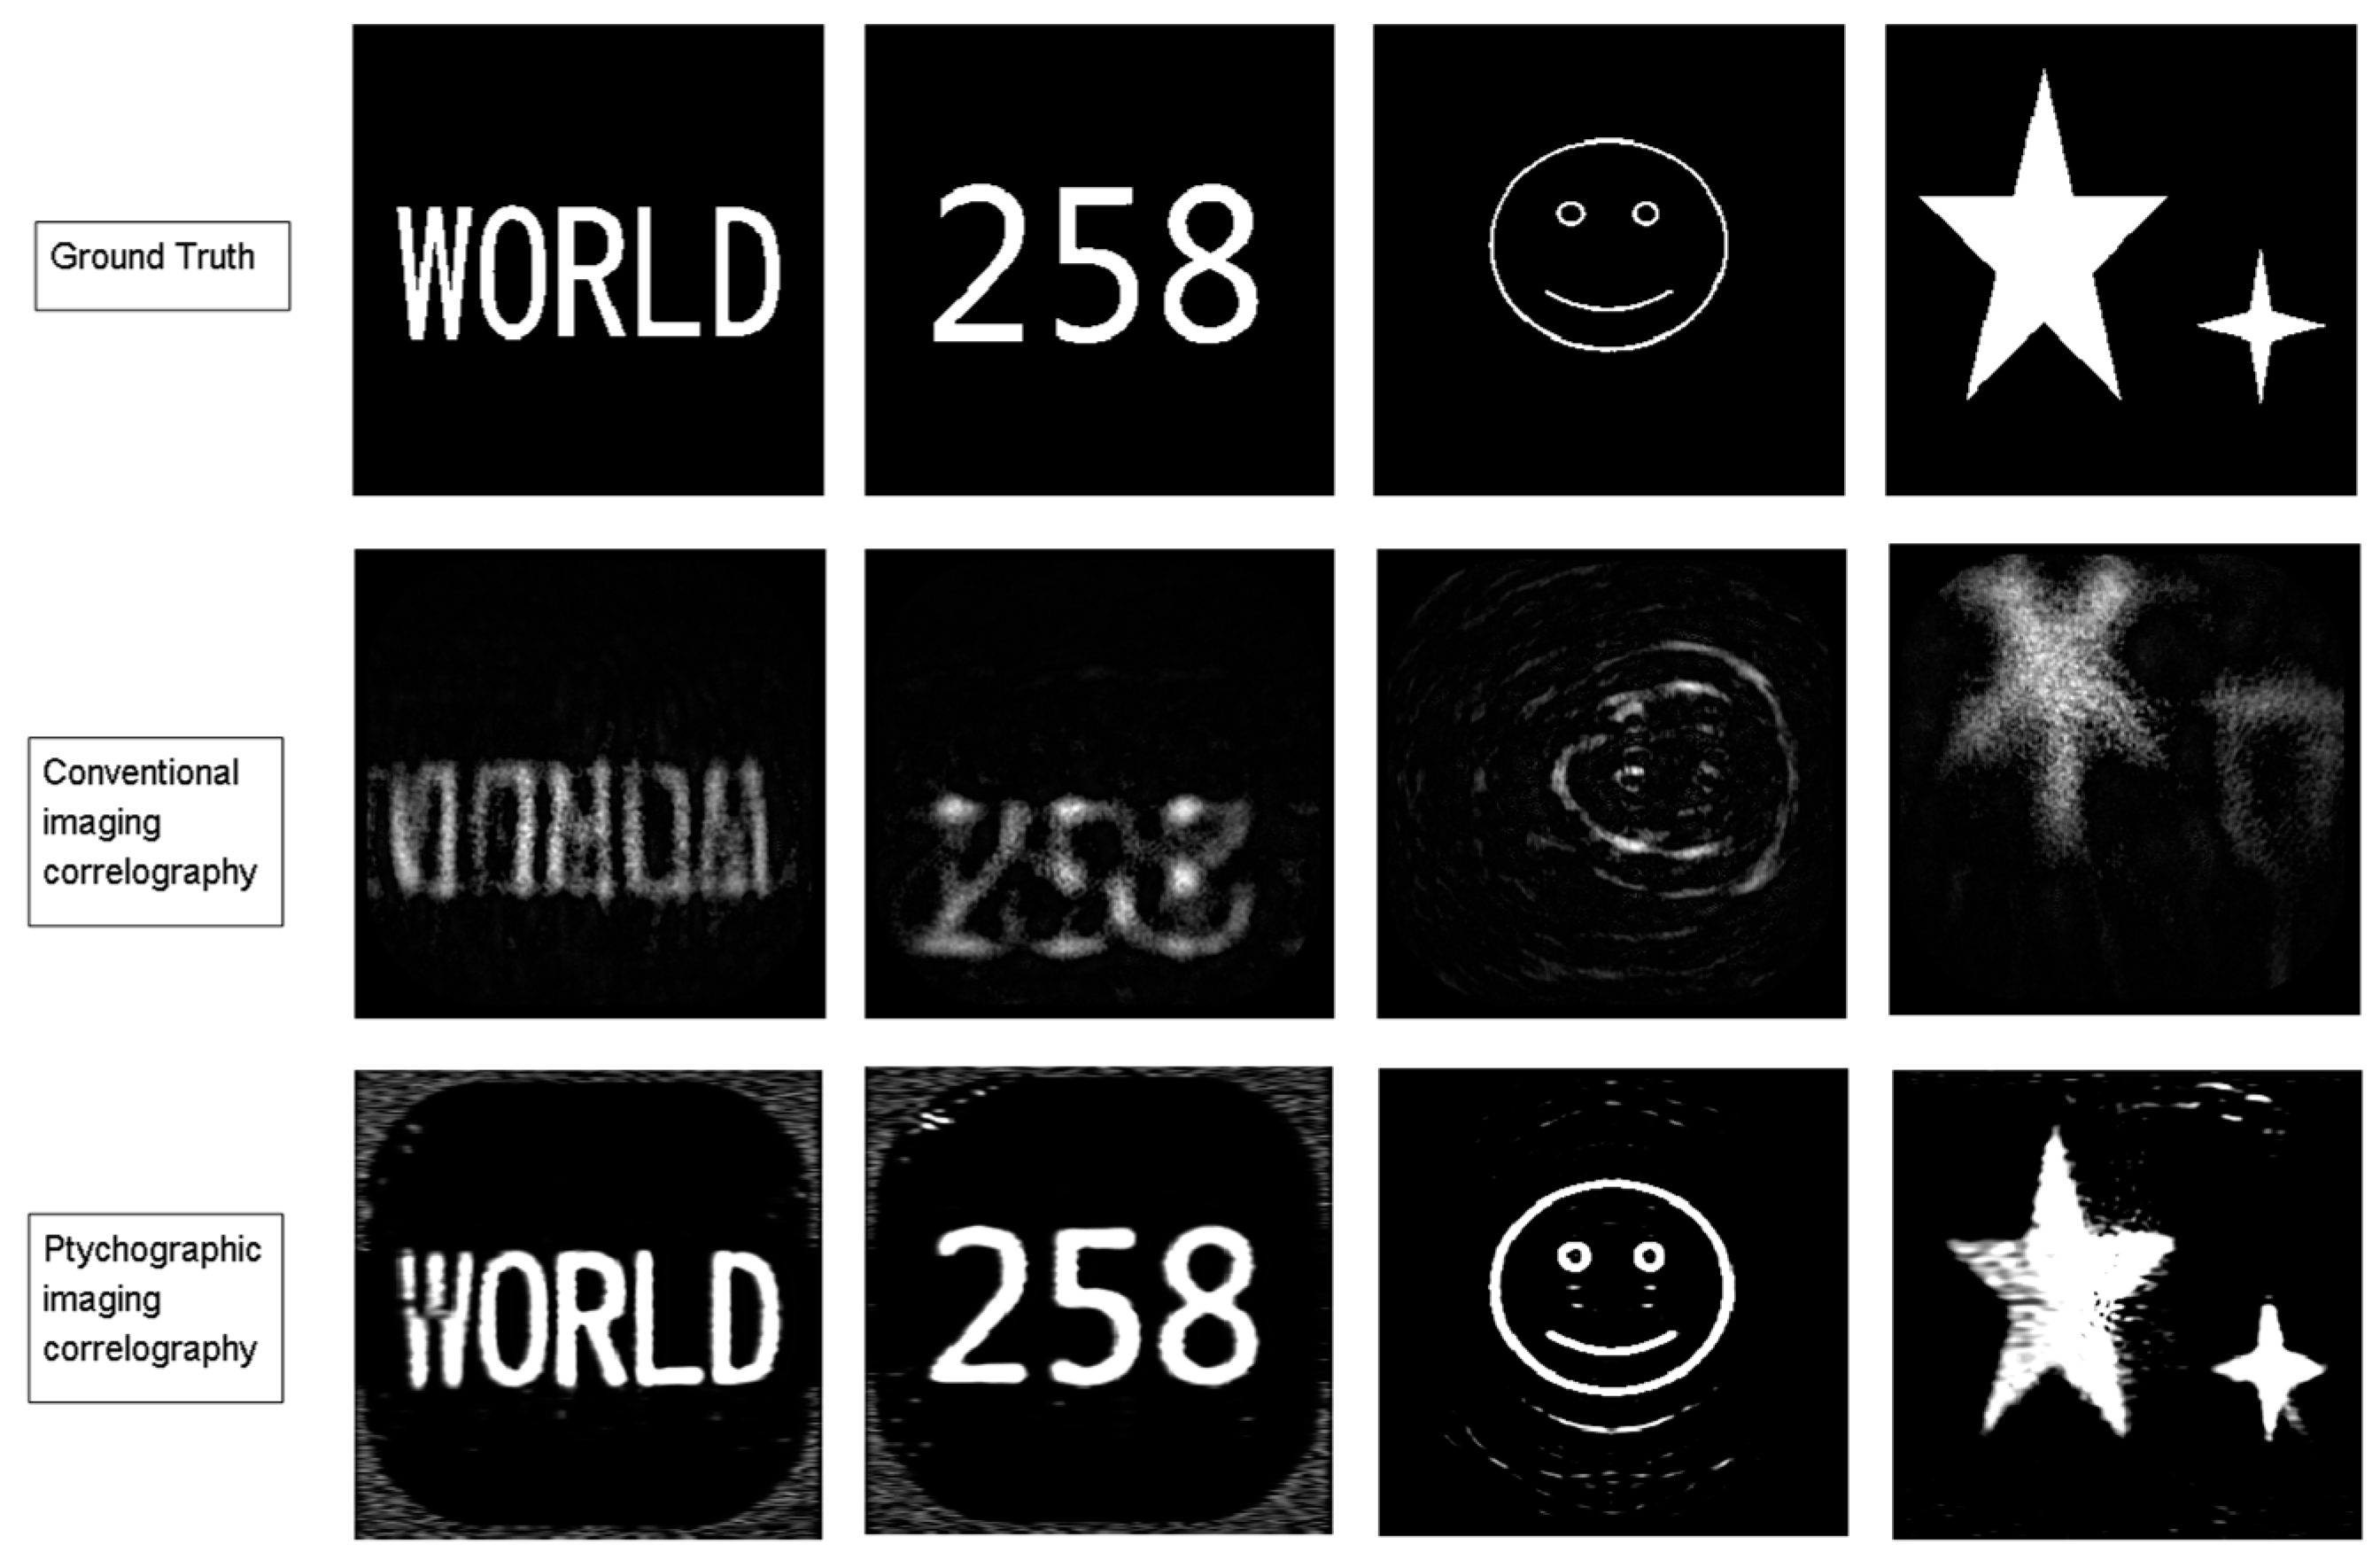
The four images in Figure 6 are employed as the original test images to analyze the recovery performance again. Here, the size of the images is pixels, the overlap ratio between two adjacent positions is 69%, the number of vertical and horizontal measurements is , and the measured speckle pattern for each subobject is . In Figure 9, we visually compare the reconstruction results using the conventional method and ptychographic method, respectively. The previous research demonstrated that the Fourier transform of a function with finite support could be uniquely estimated using analytic continuation. However, it is difficult for the conventional method to recover the original image, since a small error in the estimated Fourier component could produce a large error in the recovered values. Many estimated extrapolations are consistent with the real data, with results apparently being superimposed, upside down, or showing twin images during the reconstruction. From the reconstruction results, we can see that the ptychographic imaging correlography outperforms the conventional methods. This method successfully recovers all images. The redundant data provided by adjacent measurements means the algorithm converges with the global optimum with a high probability. The overlapping region of subapertures can constrain the solution space of the reconstruction procedure. As the ratio of intensity measurements to unknowns is increased, the likelihood of ambiguous solutions existing reduces. Therefore, the resolution of the recovered objects is improved. Since there is almost no recoverable signal at higher frequencies, the reconstruction results with the ptychographic method still have few cloudy features surrounding the recovered image.
3.2.2. Effect of the Number of Speckle Patterns
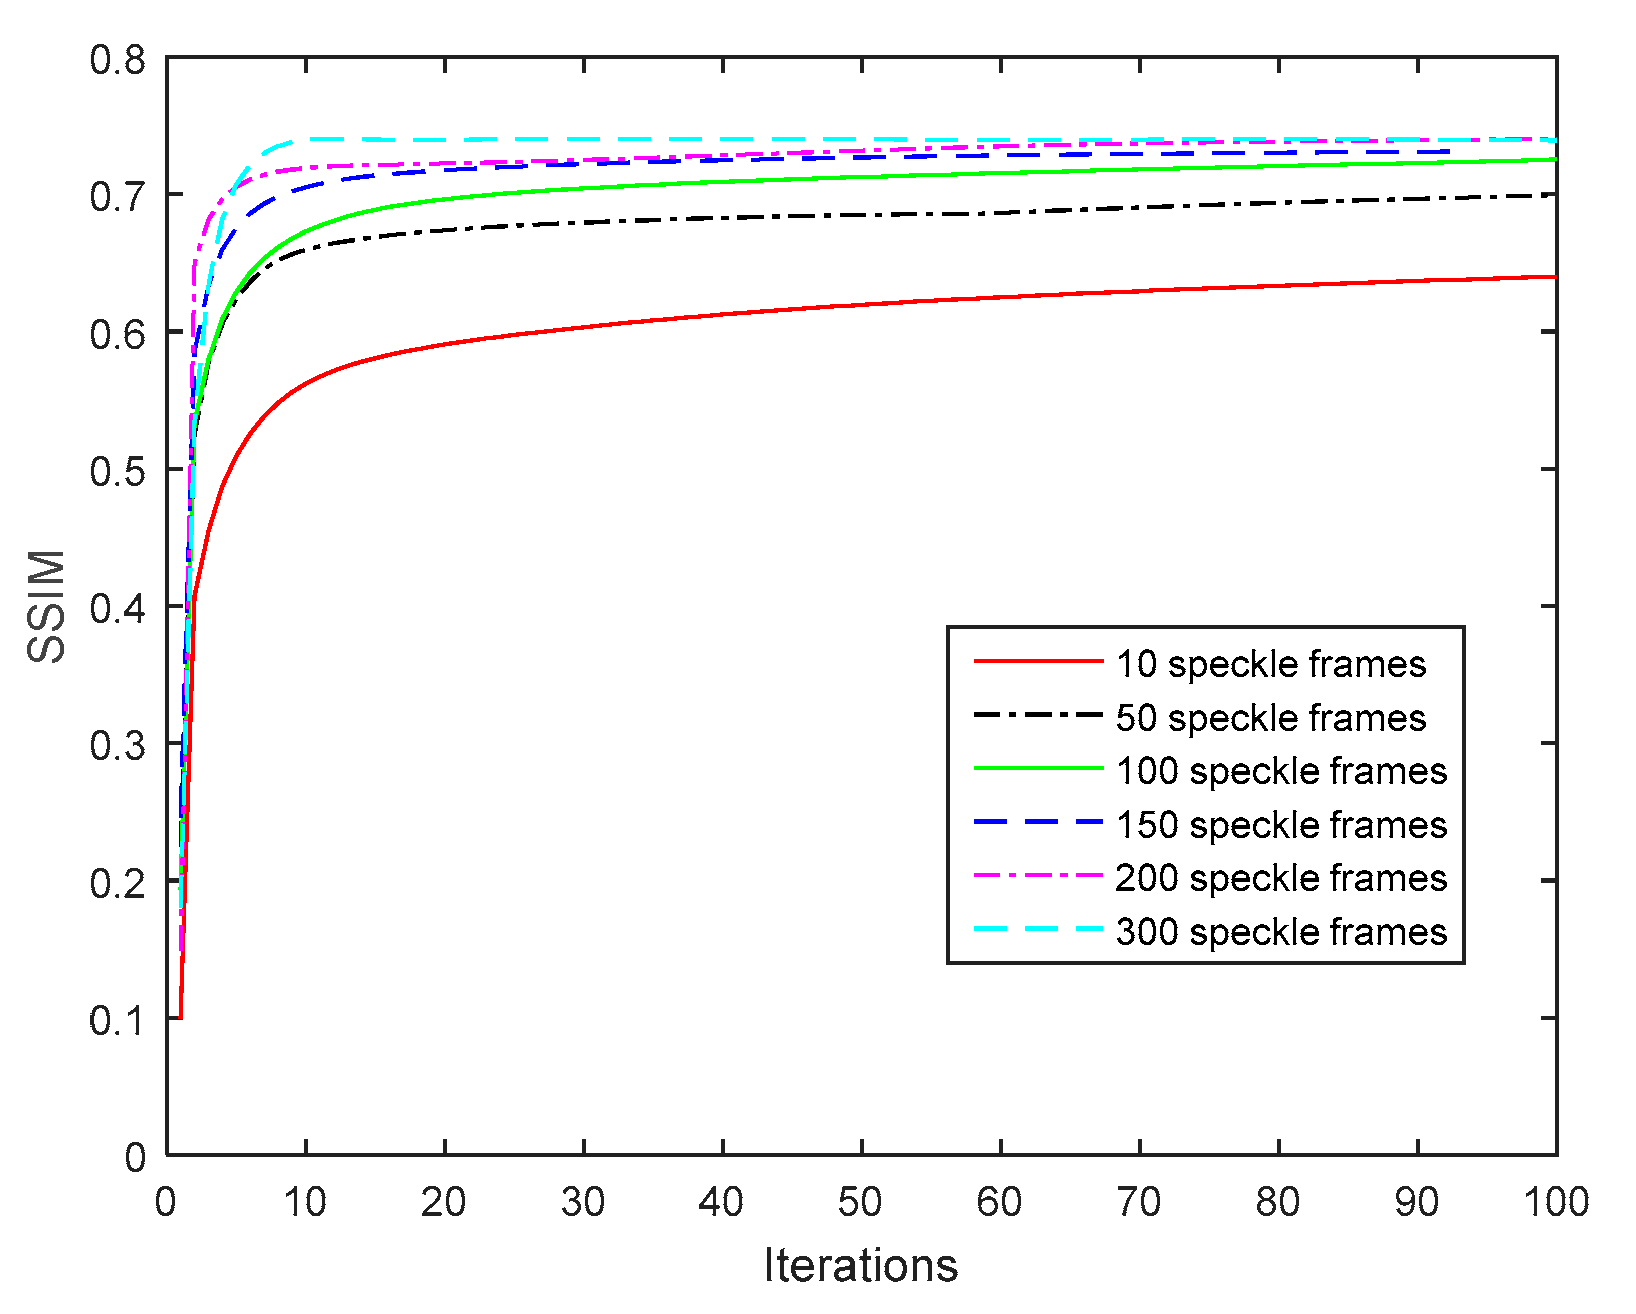
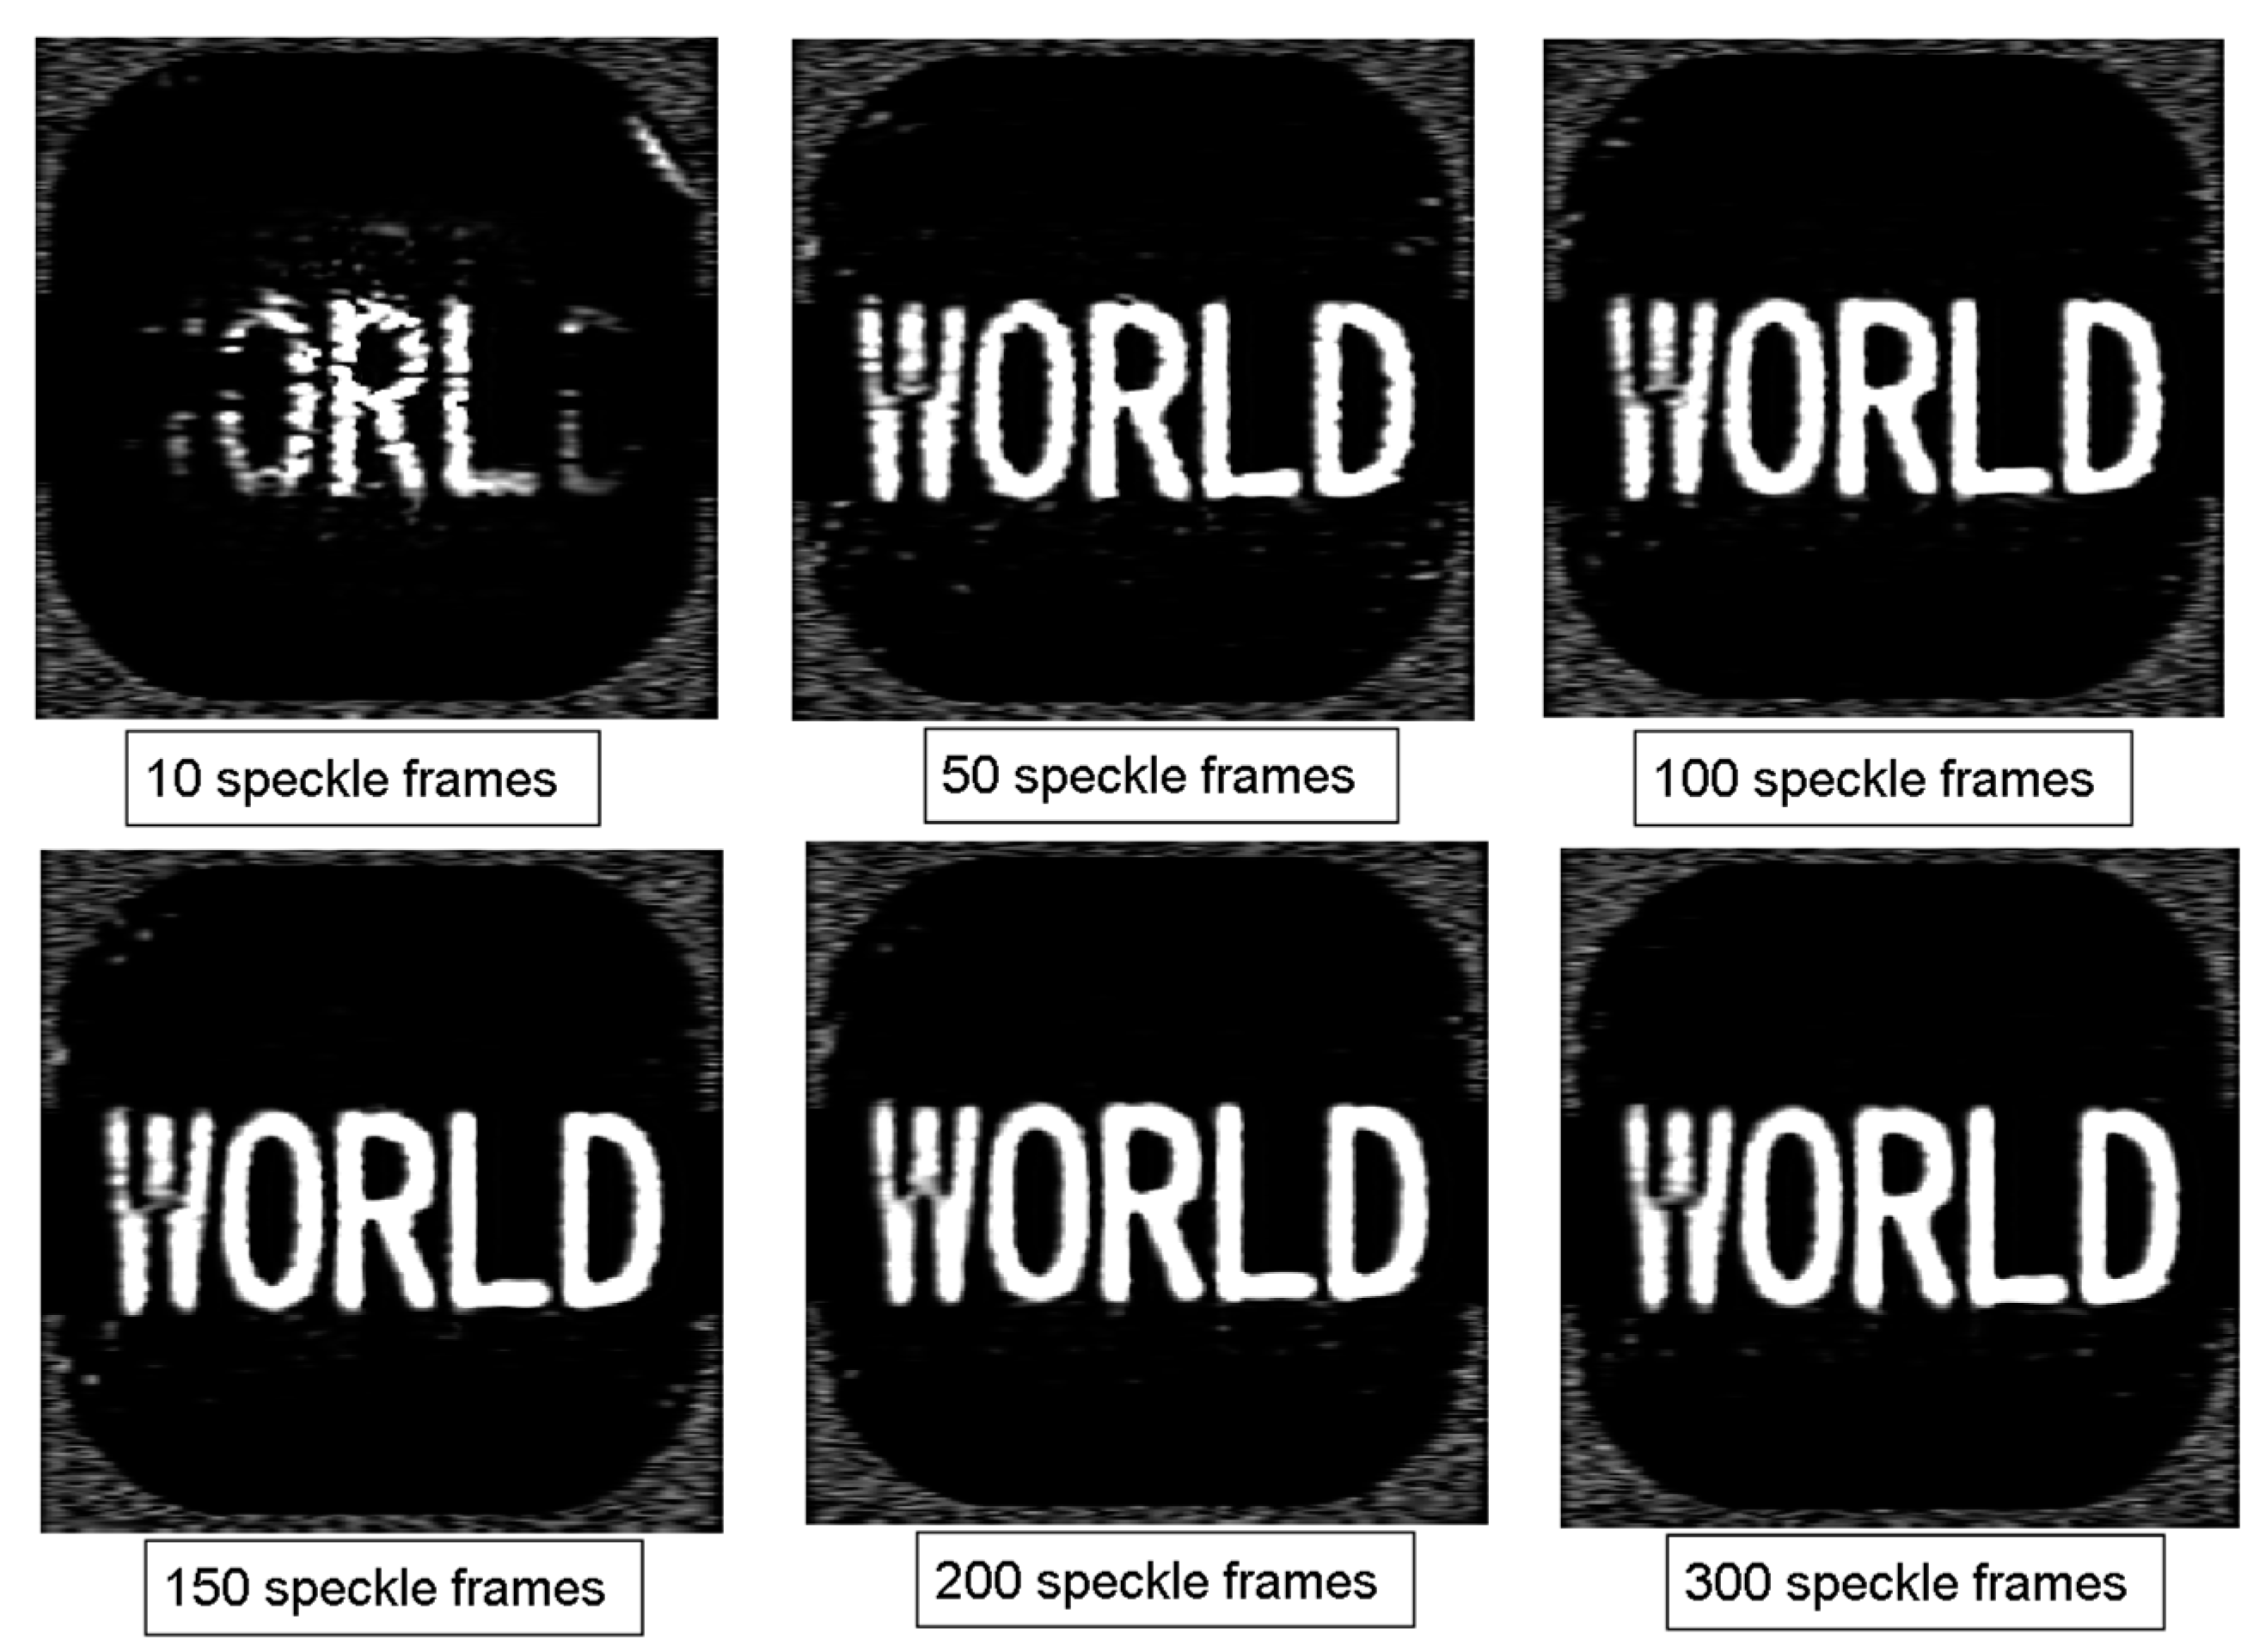
Next, we analyze the effects of the number of speckle patterns on the proposed imaging method. In the proposed ptychographic imaging setup, a series of speckle patterns of the subobject are required to estimate the corresponding Fourier modulus. As mentioned above, the high-quality power spectrum can be obtained with the increase of speckle frames. Compared with conventional imaging correlography, the ptychographic imaging correlography theoretically requires a large amount of calculation because of the scanning measurements. We experiment with various speckle frames and find that the proposed imaging implementation is not sensitive to the number of speckle frames. Since a large amount of redundant data is provided by the adjacent measurements, ptychographic imaging correlography can significantly reduce the requirement for speckle patterns. Figure 10 and Figure 11 are reconstruction results of ptychographic imaging correlography with various speckle frames. It is clear that the effects of the number of speckle patterns on reconstructed images are much lower than conventional imaging correlography. The proposed method can recover the object using only 50 speckle frames, although the results have some noise and blurred edges. Note that it is impossible for conventional imaging correlography to reconstruct the object with only 50 speckle frames. To achieve low noise and a smooth image, the speckle patterns of each subobject are set to 150 in most cases, which is about one-sixth of the conventional method.
3.2.3. Effect of the Reconstruction Algorithm
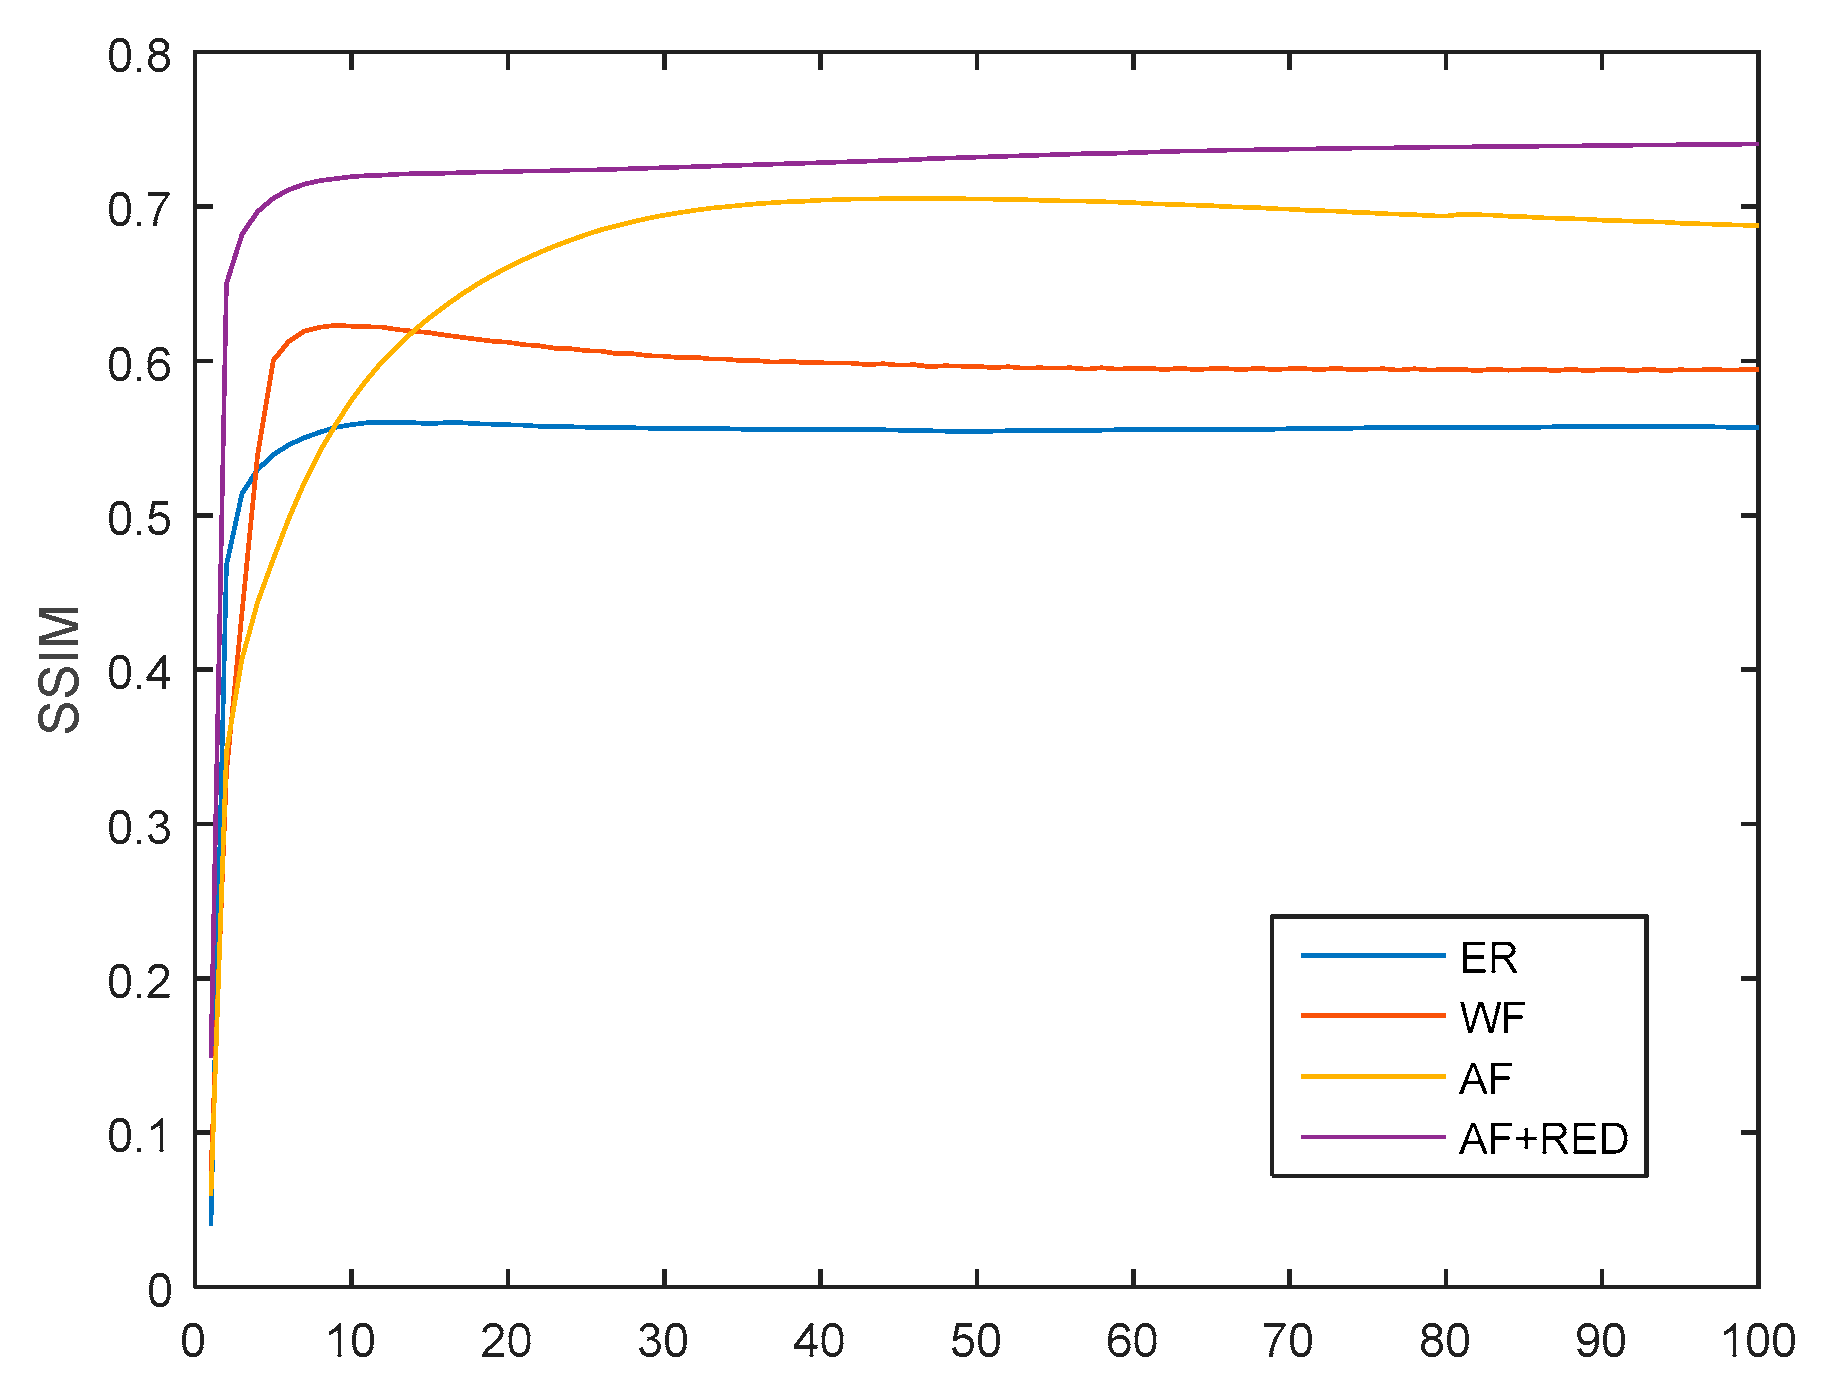
At last, we compare the proposed optimization framework (AF-RED) with three other reconstruction algorithms, including error reduction (ER) [31], Wirtinger flow (WF) [40], and amplitude flow (AF) [33]. ER is a baseline algorithm for ptychographic reconstruction. WF and AF are both new phase retrieval algorithms. The Wirtinger flow optimization is based on intensity measurements, while the AF optimization is based on amplitude measurements. Because the gradient of the Poisson log-likelihood function is very similar to amplitude-based loss function, PWF [44] is not included in the comparison algorithms. Regarding the proposed reconstruction algorithm (AF-RED), the wavelet filter is employed as the denoiser in the regularization.
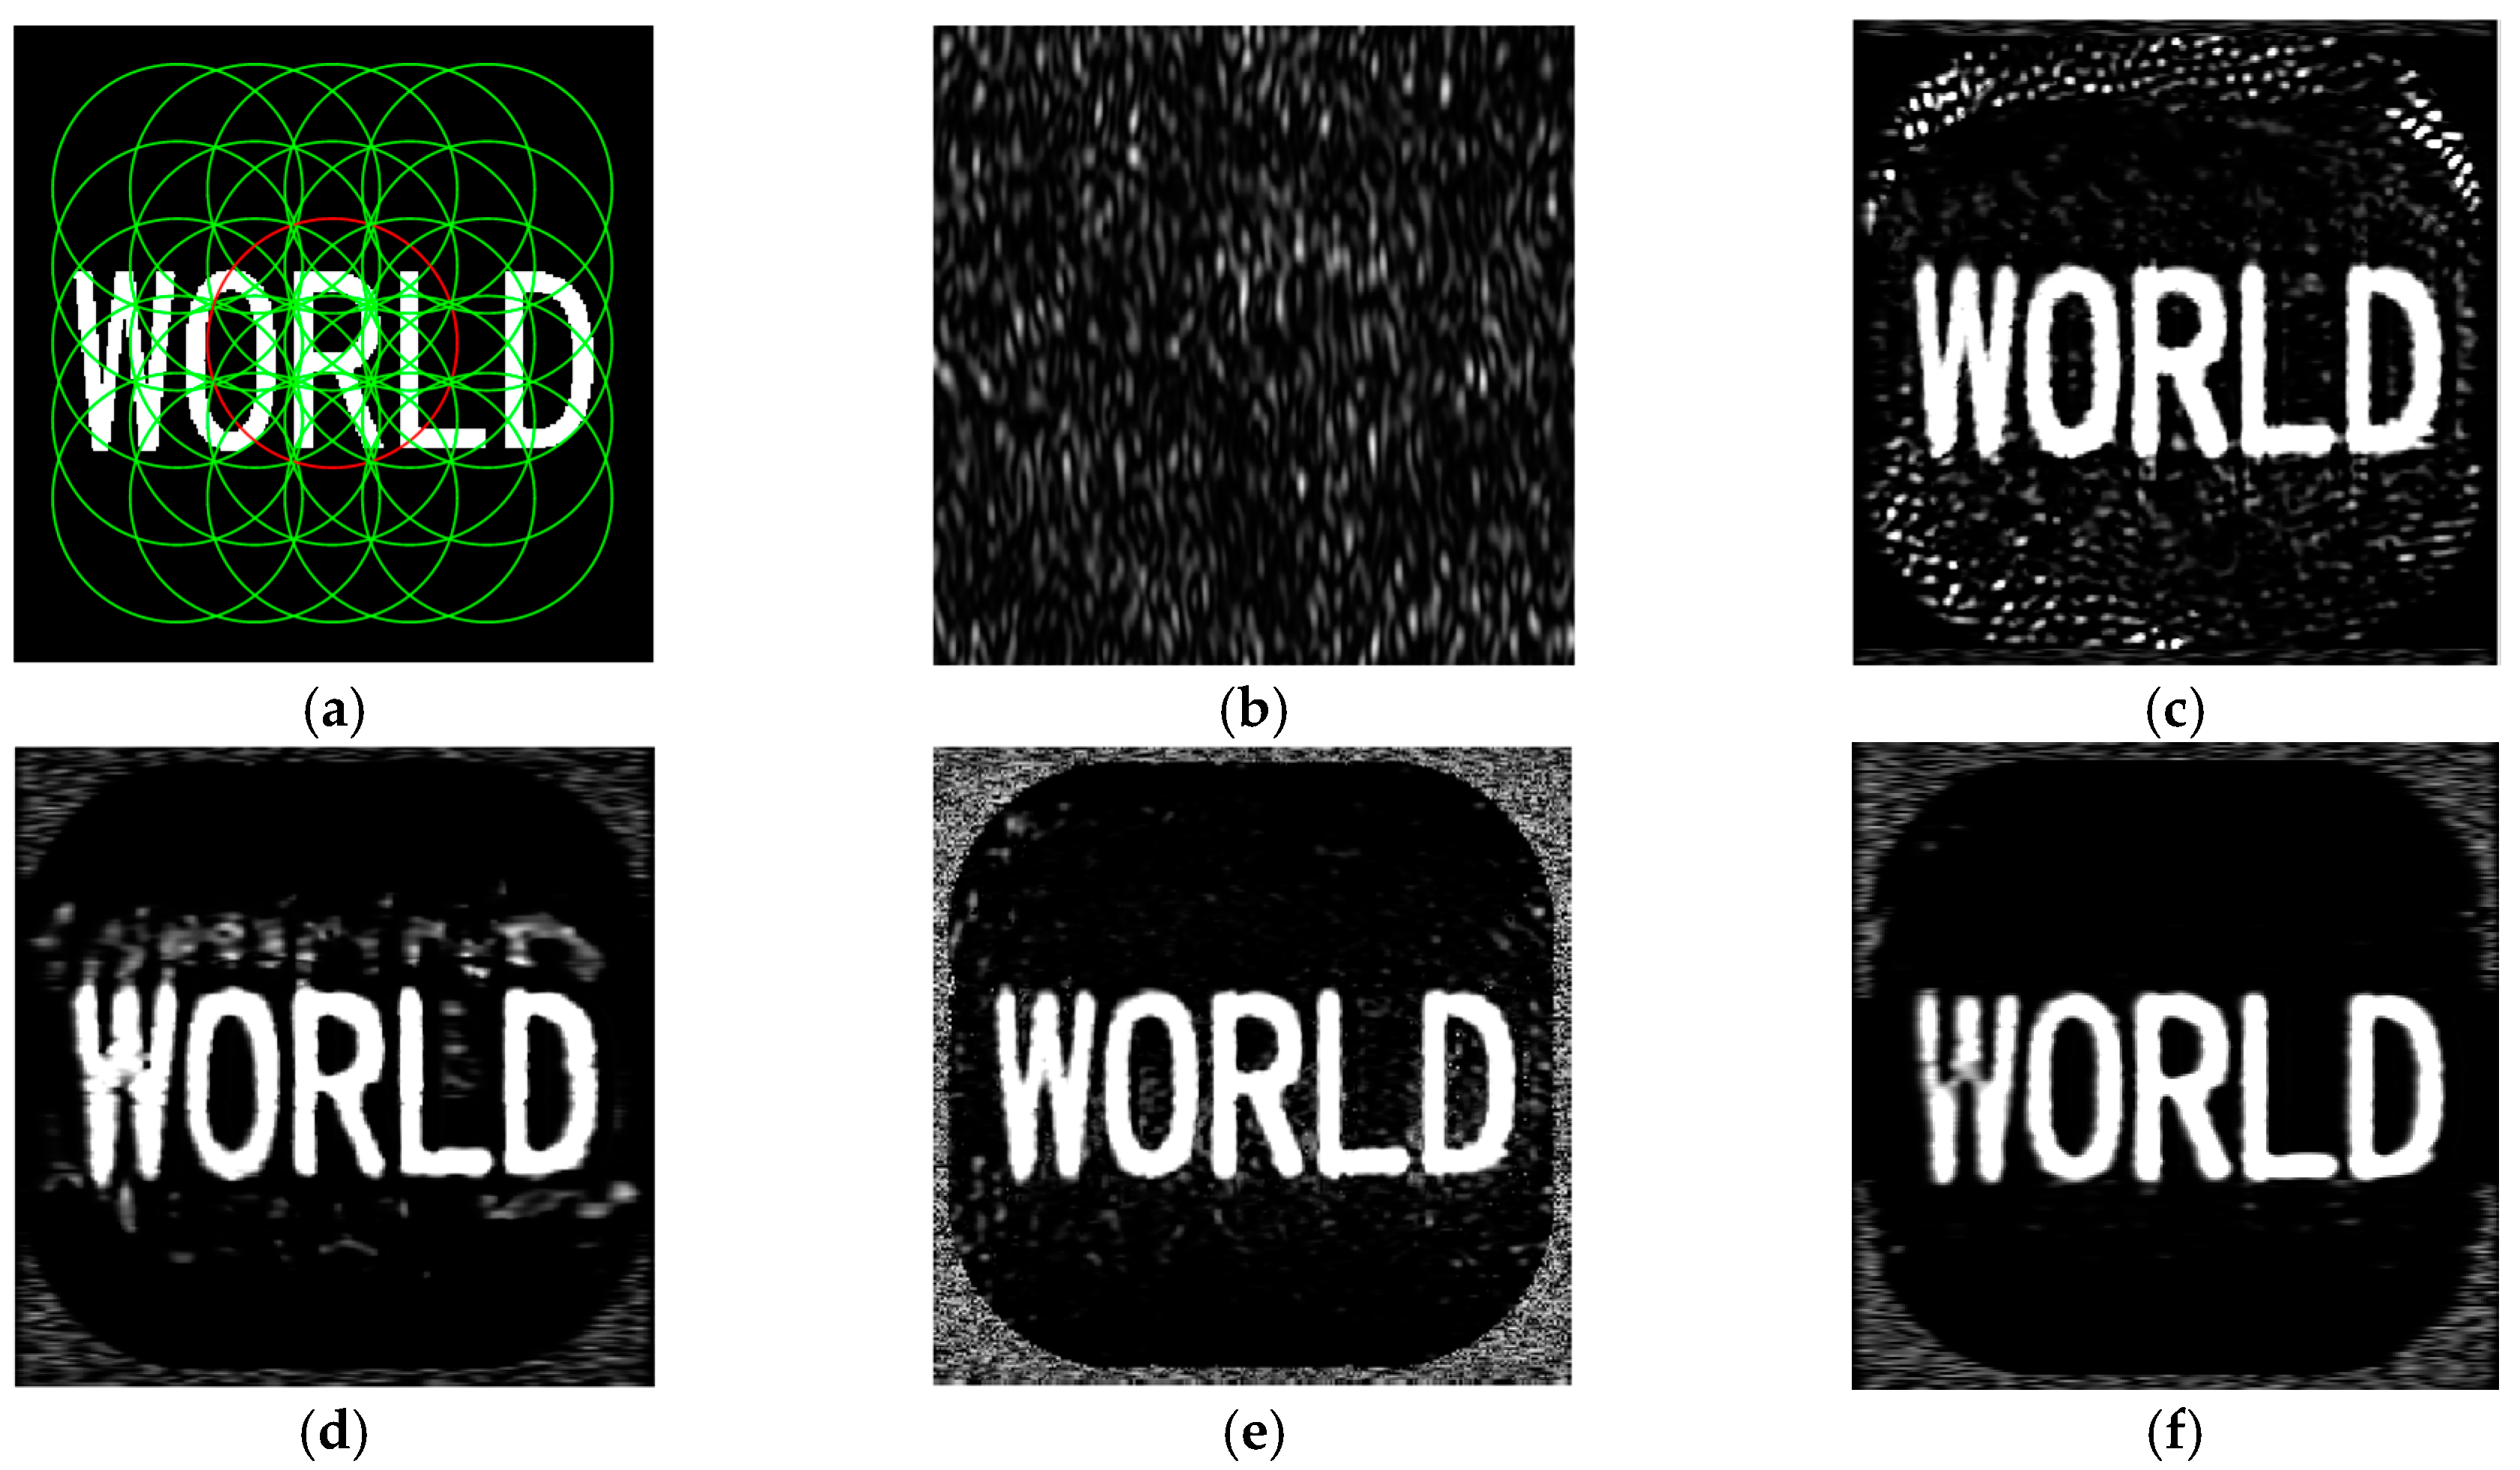
Figure 12a shows the ptychographic measurements for the original object. The circles describe different aperture positions, and the red circle is the central position. Figure 12b is one of the measured speckle patterns for the central probe. Figure 12c–f are the reconstruction results with ER, WF, AF, and AF-RED, respectively. All comparison algorithms use the same initial method described before. The Fourier modulus estimated by imaging correlography is not as accurate as that directly measured by ptychographic imaging in microscopy. It contains noise and loses a lot of high-frequency information. Therefore, the recovered data with ER suffer from apparent noise because they are sensitive to input noise. The WF phase retrieval algorithm is based on the Gaussian assumption, which is suitable for microscopic imaging. Regarding the long-distance ptychographic imaging correlography, the main noises are Poisson noise and speckle noise. Thus, there are obvious cloudy features surrounding the recovered object in Figure 12d. The AF reconstruction algorithm constructed by lower-order loss function has great advantages in statistical and computation efficiency compared to Wirtinger flow optimization. Therefore, the noise in Figure 12e is weaker than Figure 12d. The proposed reconstruction method outperforms the other three algorithms significantly by incorporating the advantages of AF and RED frameworks. It not only adopts the lower-order loss function to reconstruct the true solution with high probability, but also recognizes and filters the outliers using the RED framework. Figure 13 is the quantitative comparison of the reconstruction results using different algorithms. We can see that the convergence curve of the proposed algorithm is faster and smoother.
4. Discussion
In this work, a new ptychographic imaging correlography framework is proposed to realize long-range, high-resolution imaging. The redundant information provided by ptychography can sufficiently solve the phase retrieval challenges of conventional imaging correlography, including the apparent superimposed, upside down, and twin images. Moreover, the proposed method removes the requirement for detecting the speckle patterns within one coherence moment of the intensity fluctuations, which is impractical for the thermal source. Ptychographic imaging correlography is not constrained by the memory effect of speckles either. Therefore, there is no strict limit on the illumination probe and scattering medium. The number of speckle patterns required to recover a target is only one-sixth of the conventional imaging correlography. Therefore, the introduction of ptychography does not increase the storage burden of the system. Additionally, a flexible optimization algorithm combining the AF and RED frameworks is introduced into our reconstruction process. Given an appropriate initial value, the proposed algorithm can quickly converge on the global optimal value. Furthermore, the using of the RED regularizer can sufficiently suppress noise during reconstruction and maintain image details. A series of experiments demonstrate that the reconstruction results of the proposed imaging model are far superior to the conventional imaging correlography on both visual and quantitative metrics.
Although the proposed work significantly improves the reconstruction resolution, it still faces some challenges. Measurement for redundant information results in low time resolution for the system. New data processing methods are required to improve the time resolution. For coherent illumination, speckles will form when the amplitude of the background is not zero. Therefore, objects with strong contrast between the foreground and background amplitudes have better reconstruction results than those where the background and foreground amplitude values are similar. In future work, an optical experiment will be performed to further verify the performance of the proposed method. Besides, we will analyze the effect of target contrast on reconstruction results and try to restore objects with low contrast.
Author Contributions
Conceptualization, D.W. and Z.S.; methodology, Z.L.; software, W.Z. and Z.L.; validation, G.L. and X.W.; writing—original draft preparation, Z.L.; writing—review and editing, T.J.
Funding
This research was funded by National High Technology Research and Development Program of China 863 Program (No. Y512171800) and Youth Innovation Promotion Association (No.1188000111).
Conflicts of Interest
The authors declare no conflict of interest.
References
- Idell, P.S.; Fienup, J.R. Imaging correlography: A new approach to active imaging. In Proceedings of the Twelfth DARPA Strategic Systems Symposium Riverside Research Institute, Naval Postgraduate School, Monterey, CA, USA, 28–30 October 1986; pp. 141–151. [Google Scholar]
- Fienup, J.R. Imaging Correlography with Sparse Arrays of Detectors. Opt. Eng. 1988, 27, 279778. [Google Scholar] [CrossRef]
- Idell, P.S.; Goodman, R.S. Image synthesis from nonimaged laser speckle patterns. Opt. Lett. 1987, 12, 858–860. [Google Scholar] [CrossRef] [PubMed]
- Bracewell, R.N. The Fourier Transform and Its Applications; McGraw–Hill: New York, NY, USA, 1978; p. 115. [Google Scholar]
- Elbaum, M.; King, M.; Greenebaum, M. Laser Correlography: Transmission of High-Resolution Object Signatures through the Turbulent Atmosphere; Tech. Rep. T-1/306-3-11; Riverside Research Intstitute: New York, NY, USA, 1974. [Google Scholar]
- Fienup, J.R. Space object imaging through the turbulent atmosphere. Opt. Eng. 1979, 18, 185529. [Google Scholar] [CrossRef]
- Voelz, D.G.; Gonglewski, J.D.; Idell, P.S. Image synthesis from nonimaged laser-speckle patterns: Comparison of theory, computer simulation, and laboratory results. Appl. Opt. 1991, 30, 3333–3344. [Google Scholar] [CrossRef]
- Idell, P.S.; Gonglewski, J.D.; Voelz, D.G.; Knopp, J. Image synthesis from nonimaged laser-speckle patterns: Experimental verification. Opt. Lett. 1989, 14, 154–156. [Google Scholar] [CrossRef]
- Thurin, B.; Diaz-Santana, L. Imaging correlography applied to high resolution retinal imaging. In Proceedings of the European Conference on Biomedical Optics (ECBO), Munich, Germany, 17–21 June 2007; pp. 6631–6656. [Google Scholar]
- Edrei, E.; Scarcelli, G. Optical imaging through dynamic turbid media using the Fourier-domain shower-curtain effect. Optica 2016, 3, 71–74. [Google Scholar] [CrossRef] [Green Version]
- Hegerl, R.; Hoppe, W. Dynamische theorie der kristallstrukturanalyse durch elektronenbeugung im inhomogenen primarstrahlwellenfeld. Ber. Bunsenges. Physik. Chem. 1970, 74, 1148–1154. [Google Scholar] [CrossRef]
- Bates, R.H.T.; Rodenburg, J.M. Sub-Ångström transmission microscopy: A Fourier transform algorithm for microdiffraction plane intensity information. Ultramicroscopy 1989, 31, 303–307. [Google Scholar] [CrossRef]
- Rodenburg, J.M.; John, M.; Faulkner, H.M. A phase retrieval algorithm for shifting illumination. Appl. Phys. Lett. 2004, 85, 4795–4797. [Google Scholar] [CrossRef] [Green Version]
- Humphry, M.J.; Kraus, B.; Hurst, A.C.; Maiden, A.M.; Rodenburg, J.M. Ptychographic electron microscopy using high-angle dark-field scattering for sub-nanometre resolution imaging. Nat. Commun. 2012, 3, 730. [Google Scholar] [CrossRef]
- Rodenburg, J.M.; Hurst, A.C.; Cullis, A.G.; Dobson, B.R.; Pfeiffer, F.; Bunk, O.; David, C.; Jefimovs, K.; Johnson, I. Hard-X-ray lensless imaging of extended objects. Phys. Rev. Lett. 2007, 98, 034801. [Google Scholar] [CrossRef] [PubMed]
- Rodenburg, J.M.; Hurst, A.C.; Cullis, A.G. Transmission microscopy without lenses for objects of unlimited size. Ultramicroscopy 2007, 107, 227–231. [Google Scholar] [CrossRef] [PubMed]
- Roddier, F. Interferometric imaging in optical astronomy. Phys. Rep. 1988, 170, 97–166. [Google Scholar] [CrossRef]
- Tippie, A.E.; Kumar, A.; Fienup, J.R. High-resolution synthetic-aperture digital holography with digital phase and pupil correlation. Opt. Express 2011, 19, 12027–12038. [Google Scholar] [CrossRef]
- Dong, S.; Horstmeyer, R.; Shiradkar, R.; Guo, K.; Ou, X.; Bian, Z.; Xin, H.; Zheng, G. Aperture-scanning Fourier ptychography for 3D refocusing and super-resolution macroscopic imaging. Opt. Express 2014, 22, 13586–13599. [Google Scholar] [CrossRef]
- Holloway, J.; Asif, M.S.; Sharma, M.K.; Matsuda, N.; Horstmeyer, R.; Cossairt, O.; Veeraraghavan, A. Toward long-distance subdiffraction imaging using coherent camera arrays. IEEE Trans. Comput. Imaging 2016, 2, 251–265. [Google Scholar] [CrossRef]
- Holloway, J.; Wu, Y.; Sharma, M.K.; Cossairt, O.; Veeraraghavan, A. SAVI: Synthetic apertures for long-range, subdiffraction-limited visible imaging using Fourier ptychography. Sci. Adv. 2017, 3, e1602564. [Google Scholar] [CrossRef]
- Dainty, J.C. Laser Speckle and Related Phenomena; Springer Science & Business Media: Berlin, Germany, 2013; pp. 9–74. [Google Scholar]
- Wang, W.; Chen, H.; Yuan, Y.; Han, Q.; Wang, G.; Zheng, H.; Liu, J.; Xu, Z. Ptychographical intensity interferometry imaging with incoherent light. Opt. Express 2018, 26, 20396–20408. [Google Scholar] [CrossRef]
- Gardner, D.F.; Divitt, S.; Watnik, A.T. Ptychographic imaging of incoherently illuminated extended objects using speckle correlations. Appl. Opt. 2019, 58, 3564–3569. [Google Scholar] [CrossRef]
- Li, G.; Yang, W.; Wang, H.; Situ, G. Image transmission through scattering media using ptychographic iterative engine. Appl. Sci. 2019, 9, 849. [Google Scholar] [CrossRef]
- Freundk, I.; Rosenbluh, M.; Feng, S. Memory effects in propagation of optical waves through disordered media. Phys. Rev. Lett. 1988, 61, 2328. [Google Scholar] [CrossRef] [PubMed]
- Feng, S.; Kane, C.; Lee, P.A.; Stone, A.D. Correlations and fluctuations of coherent wave transmission through disordered media. Phys. Rev. Lett. 1988, 61, 834. [Google Scholar] [CrossRef] [PubMed]
- Katz, O.; Heidmann, P.; Fink, M.; Gigan, S. Non-invasive single-shot imaging through scattering layers and around corners via speckle correlations. Nat. Photonics 2014, 8, 784–790. [Google Scholar] [CrossRef]
- Fienup, J.R. Lensless coherent imaging by phase retrieval with an illumination pattern constraint. Opt. Express 2006, 14, 498–508. [Google Scholar] [CrossRef] [Green Version]
- Rabadi, W.A.; Myler, H.R.; Weeks, A.R. Iterative multiresolution algorithm for image reconstruction from the magnitude of its Fourier transform. Opt. Eng. 1996, 35, 1015–1025. [Google Scholar] [CrossRef]
- Gerchberg, R.W. A practical algorithm for the determination of phase from image and diffraction plane pictures. Optik 1972, 35, 237–246. [Google Scholar]
- Fienup, J.R. Iterative method applied to image reconstruction and to computer-generated holograms. Opt. Eng. 1980, 19, 193297. [Google Scholar] [CrossRef]
- Zhang, H.; Liang, Y. Reshaped wirtinger flow for solving quadratic system of equations. arXiv 2016, arXiv:1605.07719. [Google Scholar]
- Romano, Y.; Elad, M.; Milanfar, P. The little engine that could: Regularization by denoising (RED). SIAM J. Imaging Sci. 2017, 10, 1804–1844. [Google Scholar] [CrossRef]
- Metzler, C.A.; Schniter, P.; Veeraraghavan, A.; Baraniuk, R.G. PrDeep: Robust Phase Retrieval with Flexible Deep Neural Networks. arXiv 2018, arXiv:1803.00212. [Google Scholar]
- Yeh, L.; Dong, J.; Zhong, J.; Tian, L.; Chen, M.; Tang, G.; Soltanolkotabi, M.; Waller, L. Experimental robustness of fourier ptychography phase retrieval algorithms. Opt. Express 2015, 23, 33214–33240. [Google Scholar] [CrossRef] [PubMed]
- Osherovich, E.; Michael, Z.; Irad, Y. Signal Reconstruction from the Modulus of its Fourier Transform; No. CS Technion Report CS-2009-09; Computer Science Department: Technion, Haifa, Israel, 2009. [Google Scholar]
- Jagatap, G.; Chen, Z.; Hegde, C.; Vaswani, N. Sub-diffraction Imaging using Fourier Ptychography and Structured Sparsity. In Proceedings of the 2018 IEEE International Conference on Acoustics, Speech and Signal Processing (ICASSP), Calgary, AB, Canada, 15–20 April 2018. [Google Scholar]
- Candes, E.J.; Li, X.; Soltanolkotabi, M. Phase retrieval from coded diffraction patterns. Appl. Comput. Harmon. A 2015, 39, 277–299. [Google Scholar] [CrossRef]
- Bian, L.; Suo, J.; Zheng, G.; Guo, K.; Chen, F.; Dai, Q. Fourier ptychographic reconstruction using Wirtinger flow optimization. Opt. Express 2015, 23, 4856–4866. [Google Scholar] [CrossRef] [PubMed]
- Bian, L.; Suo, J.; Chung, J.; Ou, X.; Yang, C.; Chen, F.; Dai, Q. Fourier ptychographic reconstruction using Poisson maximum likelihood and truncated Wirtinger gradient. Sci. Rep. 2017, 6, 27384. [Google Scholar] [CrossRef]
- Heide, F.; Diamond, S.; Niener, M.; Ragan-Kelley, J.; Heidrich, W.; Wetzstein, G. Proximal: Efficient image optimization using proximal algorithms. ACM Trans. Graph. 2016, 35, 84. [Google Scholar] [CrossRef]
- Bunk, O.; Dierolf, M.; Kynde, S.; Johnson, I.; Marti, O.; Pfeiffer, F. Influence of the overlap parameter on the convergence of the ptychographical iterative engine. Ultramicroscopy 2008, 108, 481–487. [Google Scholar] [CrossRef]
- Wang, Z.; Bovik, A.C.; Sheikh, H.R.; Simoncelli, E.P. Image quality assessment: From error visibility to structural similarity. IEEE Trans. Image Process. 2004, 13, 600–612. [Google Scholar] [CrossRef]
Figure 1.
Schematic diagram of the ptychographic imaging correlography technique.

Figure 2.
Block diagram of the imaging correlography.

Figure 3.
(a) Original image, (b) actual autocorrelation function of the original image, and (c) actual Fourier magnitude of the original image. (d–f) Estimated autocorrelation function of the original image from 200, 500, and 1000 speckle patterns, respectively. (g–i) Estimated Fourier magnitude of the original image from 200, 500, and 1000 speckle patterns, respectively.

Figure 4.
Block diagram of the imaging correlography with ptychography.

Figure 5.
(a) The original image. (b) The far-field diffraction pattern of the red circle area under ideal conditions. (c) The far-field diffraction pattern of the red circle area with phase perturbation. (d) The estimated far-field diffraction pattern via correlography. (e) The ptychographic reconstruction results of the first scan position with estimated far-field diffraction patterns.


Figure 6.
Four test images, including letters, numbers, and simple geometric figures. (a) WORLD. (b) 258. (c) Smile. (d) Star.
Figure 6.
Four test images, including letters, numbers, and simple geometric figures. (a) WORLD. (b) 258. (c) Smile. (d) Star.

Figure 7.
The data processing flow chart for ptychographic imaging correlography. Note: AF = amplitude flow; RED = regularization by denoising.
Figure 7.
The data processing flow chart for ptychographic imaging correlography. Note: AF = amplitude flow; RED = regularization by denoising.

Figure 8.
(a) Ground truth resolution chart. (b) Ptychographic measurements for the resolution chart. (c) Recovered image for conventional imaging correlography. (d) Recovered image for ptychographic imaging correlography. (e) The contrast of the groups in the recovered images.
Figure 8.
(a) Ground truth resolution chart. (b) Ptychographic measurements for the resolution chart. (c) Recovered image for conventional imaging correlography. (d) Recovered image for ptychographic imaging correlography. (e) The contrast of the groups in the recovered images.

Figure 9.
Reconstruction results with the conventional method and ptychographic method, respectively.
Figure 9.
Reconstruction results with the conventional method and ptychographic method, respectively.

Figure 10.
Quantitative reconstruction results of ptychographic imaging correlography with various speckle frames.
Figure 10.
Quantitative reconstruction results of ptychographic imaging correlography with various speckle frames.

Figure 11.
Visual reconstruction results of ptychographic imaging correlography with various speckle frames.
Figure 11.
Visual reconstruction results of ptychographic imaging correlography with various speckle frames.

Figure 12.
(a) Ptychographic measurements for the original object. (b) One of the measured speckle patterns for the center aperture (red circle area (a)). (c) The reconstruction results for the error reduction (ER) algorithm. (d) The reconstruction results for the Wirtinger flow (WF) algorithm. (e) The reconstruction results for the amplitude flow (AF) algorithm. (f) The reconstruction results for the proposed amplitude flow regularization by denoising (AF-RED) algorithm.

Figure 13.
Quantitative comparison of the reconstruction results using different algorithms.


Table 1.
SSIM 1 and iterations of the proposed algorithm with different initialization methods.
| Test Images | Random | Spectral | HIO 2 Results | |||
|---|---|---|---|---|---|---|
| SSIM | Iteration | SSIM | Iteration | SSIM | Iteration | |
| ‘WORLD’ | 0.730 | 180 | 0.404 | 200 | 0.742 | 60 |
| ‘258’ | 0.748 | 250 | 0.492 | 500 | 0.743 | 40 |
| ‘Smile’ | 0.670 | 450 | 0.749 | 250 | 0.792 | 50 |
| ‘Star’ | 0.672 | 230 | 0.624 | 150 | 0.694 | 35 |
1 SSIM is the structural similarity index. 2 HIO is the hybrid input-output algorithm.
© 2019 by the authors. Licensee MDPI, Basel, Switzerland. This article is an open access article distributed under the terms and conditions of the Creative Commons Attribution (CC BY) license (http://creativecommons.org/licenses/by/4.0/).
Share and Cite
MDPI and ACS Style
Li, Z.; Wen, D.; Song, Z.; Jiang, T.; Zhang, W.; Liu, G.; Wei, X. Imaging Correlography Using Ptychography. Appl. Sci. 2019, 9, 4377. https://0-doi-org.brum.beds.ac.uk/10.3390/app9204377
AMA Style
Li Z, Wen D, Song Z, Jiang T, Zhang W, Liu G, Wei X. Imaging Correlography Using Ptychography. Applied Sciences. 2019; 9(20):4377. https://0-doi-org.brum.beds.ac.uk/10.3390/app9204377
Chicago/Turabian StyleLi, Zhixin, Desheng Wen, Zongxi Song, Tuochi Jiang, Weikang Zhang, Gang Liu, and Xin Wei. 2019. "Imaging Correlography Using Ptychography" Applied Sciences 9, no. 20: 4377. https://0-doi-org.brum.beds.ac.uk/10.3390/app9204377
Note that from the first issue of 2016, this journal uses article numbers instead of page numbers. See further details here.