Thermal Time Constant of PV Roof Tiles Working under Different Conditions


Faculty of Electrical Engineering, Institute of Electrical Engineering and Electronics, Poznań University of Technology, st. Piotrowo 3a, 60-965 Poznań, Poland
*
Author to whom correspondence should be addressed.
Appl. Sci. 2019, 9(8), 1626; https://0-doi-org.brum.beds.ac.uk/10.3390/app9081626
Submission received: 14 March 2019
/
Revised: 15 April 2019
/
Accepted: 16 April 2019
/
Published: 18 April 2019
(This article belongs to the Special Issue Ceramic Tiles Production and Consumption)
Abstract
:This paper presents different types of photovoltaic (PV) roof tiles integrating PV cells with roof covering. Selected elastic photovoltaic roof tiles were characterised for their material and electrical characteristics. Practical aspects of using PV roof tiles are discussed, alongside the benefits and drawbacks of their installation on the roof. Thermal resistance, heat transfer coefficient and thermal capacity were identified for elastic PV roof tiles and roof construction built of boards and PV roof tiles, according to valid standards and legal regulations. The resistance–capacity (RC) models of PV roof tiles and roofs are proposed according to the time constants identified for the analysed systems. The energy balance of the studied systems (PV roof tiles alone and the roof as a whole) is presented, based on which temperature changes in the PV cells of the roof tiles working under different environmental conditions were identified. The timing of PV cells’ temperature change obtained by material data and energy balance analyses were compared. The relationship between the temperature change times of PV cells and the thermal resistance and heat capacity of the whole system are demonstrated, alongside environmental parameters.
1. Introduction
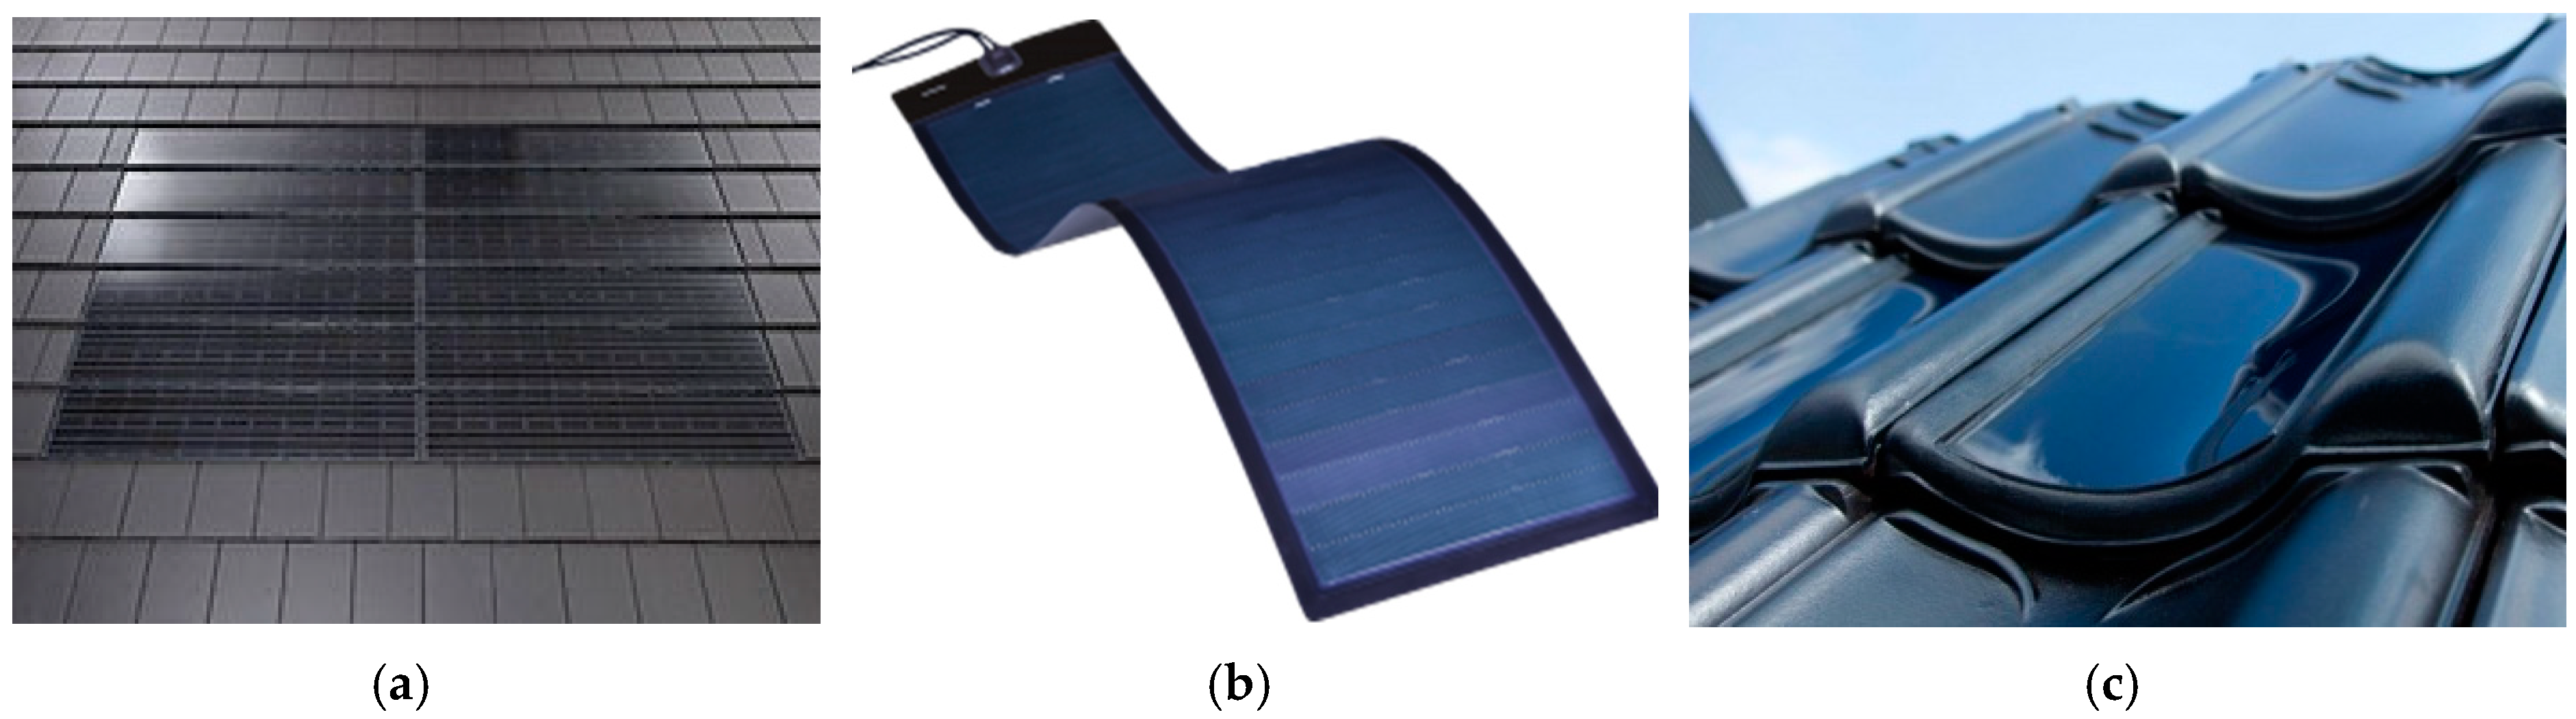
Photovoltaic (PV) roof tiles blend PV cells with roof covering. This type of PV item enables the optimal use of solar energy in light of their relevant exposure and roof slope. There are different types of PV roof tiles available—some look like traditional PV panels in glazed and metal-framed designs, while others are elastic modules or PV cells integrated with ceramic tiles (Figure 1).
The dimensions of PV roof tiles are selected in such a way that they can be fitted in between traditional roof covering items (i.e., ceramic tiles or bitumen covering). The standard height of PV roof tiles is ca. 40 cm, while their width ranges from several centimetres to several metres. They replace several ceramic tiles or a row or top layer of asphalt roofing felt. The smaller the item, the easier it is to fill the whole roof with PV elements, which increases the cost of a PV system compared to larger roof tiles [4,5].
PV cells in photovoltaic roof tiles are exposed to more severe working conditions compared to traditional PV panels installed on a supporting structure several centimetres above the roof surface. The lack of natural air movement (wind) on the back of the PV module, which reduces the temperature of PV cells, contributes to a lower power-generating efficiency of solar roof tiles. The heat released by the bottom side of the roof tiles is accumulated in the air gap between the bottom surface of the roof and the attic insulating layer in the case of rigid PV roof tiles with construction similar to the construction of traditional PV panels or PV ceramic roof tiles, or it may be transferred further into the roof structure as in the case of elastic PV roof tiles fixed (glued) to the roof construction (e.g., on the top layer of asphalt roofing felt and boards). The degree and rate of heat exchange from the PV roof tile to the roof, environment, or attic depends on the type of PV roof tile, its installation, the particular insulation materials of the roof and attic use. The bottom side of PV roof tiles can only be cooled and vented by air in the spaces between roof slats. The authors in [6,7] indicate a lack of confirmatory data concerning the efficiency of PV roof tiles, which prevents the popularisation of this technology. The authors in [8,9,10] present different studies on the productivity and energy loss quantities in building-integrated photovoltaic (BIPV) systems composed of different photovoltaic items (roof tiles, glass panes, shutters, wall-mounted items etc.). A number of studies have been carried out on methods of PV cell ventilation (when the cells are integrated with a roof or wall), heat removal and their use and impact on the energy efficiency of the system. In [11,12] it was revealed that adding a ventilating duct of a relevant size behind PV items increases their energy-generation efficiency. Gan [13] demonstrated that the optimum height of the gap between the panel and the roof is about 0.125 m, regardless of the inclination angle. The authors used CFD modelling to present the results of studies for different PV modules’ installation parameters and scenarios in [14,15,16]. In order to analyse the temperature changes of PV cells, Gunawan et al. [7] examined panels installed on a roof with an air gap (standard installation on a supporting structure), built-in in a cold roof (with no thermal insulation), built-in in a hot roof (with mineral wool insulation) and installed on a roof with American-style shingles. Additionally, for comparison, a panel was fixed to a structure which enabled its free cooling by the wind, and a weather station was installed to collect data on insolation, ambient temperature, wind force and precipitation in the UK. The author demonstrated that PV cells installed on American-style wood shingles reached the highest temperatures because heat exchange in their case was most difficult, and the heat released at the back of the panel heated the PV cells further. Yu-Hui et al. [17] proposed and experimentally revised a photo–electro–thermal model (PET model) for PV modules, based on which they confirmed the generated electrical energy dependence on PV cell temperature. In [18], the authors studied the temperature of PV cells working under different environmental conditions, considering such thermal processes as convection and radiation. They proposed new values of the coefficients of convective heat transfer based on a literature review and their own studies for different conditions. The obtained results were confirmed by other scientific papers [19,20,21]. Trzmiel [22] presents a mathematical model of a thin-film PV panel developed with the use of a PV cell single-diode electric model and temperature relationships, based on their own measurement data. Heat exchange between PV roof tiles, the roof structure and air can occur in three physically different ways: convection, radiation and conduction. With regard to the roof construction and arrangement of PV roof tiles on the roof, heat exchange by conduction and convection have the greatest share, while radiation processes can be neglected [23].
Based on a literature review and our own studies it can be concluded that the temperature of PV cells has a significant impact on PV conversion efficiency and the quantity of generated electrical energy, which is particularly evident in the case of PV cells integrated with the building (BIPV items) [24,25,26]. The photo–electro–thermal (PET) and resistance–capacity (RC) models of PV cells available in the literature are described and verified for traditional PV panels, but there is no confirmed validity test of these models for cells built in PV roof tiles integrated with the roof. Therefore, we attempted to determine the thermal time constant of PV cells integrated with PV roofs glued to the roof structure (based on the RC model) and to determine the maximum temperatures that they can achieve in different working conditions (using the PET model). In the RC and PET models, we considered the parameters of the roof structure (thermal resistance and thermal capacity of the board) to which the solar roof was glued and considered the temperature changes of the PV roof tiles integrated into the roof and working in various environmental conditions. By knowing the warming and cooling rates of PV cells—which are affected by heat processes in the system—one can identify energy losses related to temperature changes in the cells, which helps in the more precise estimation of the possible electrical energy yield.
2. Test Object—Description of an Elastic PV Roof Tile
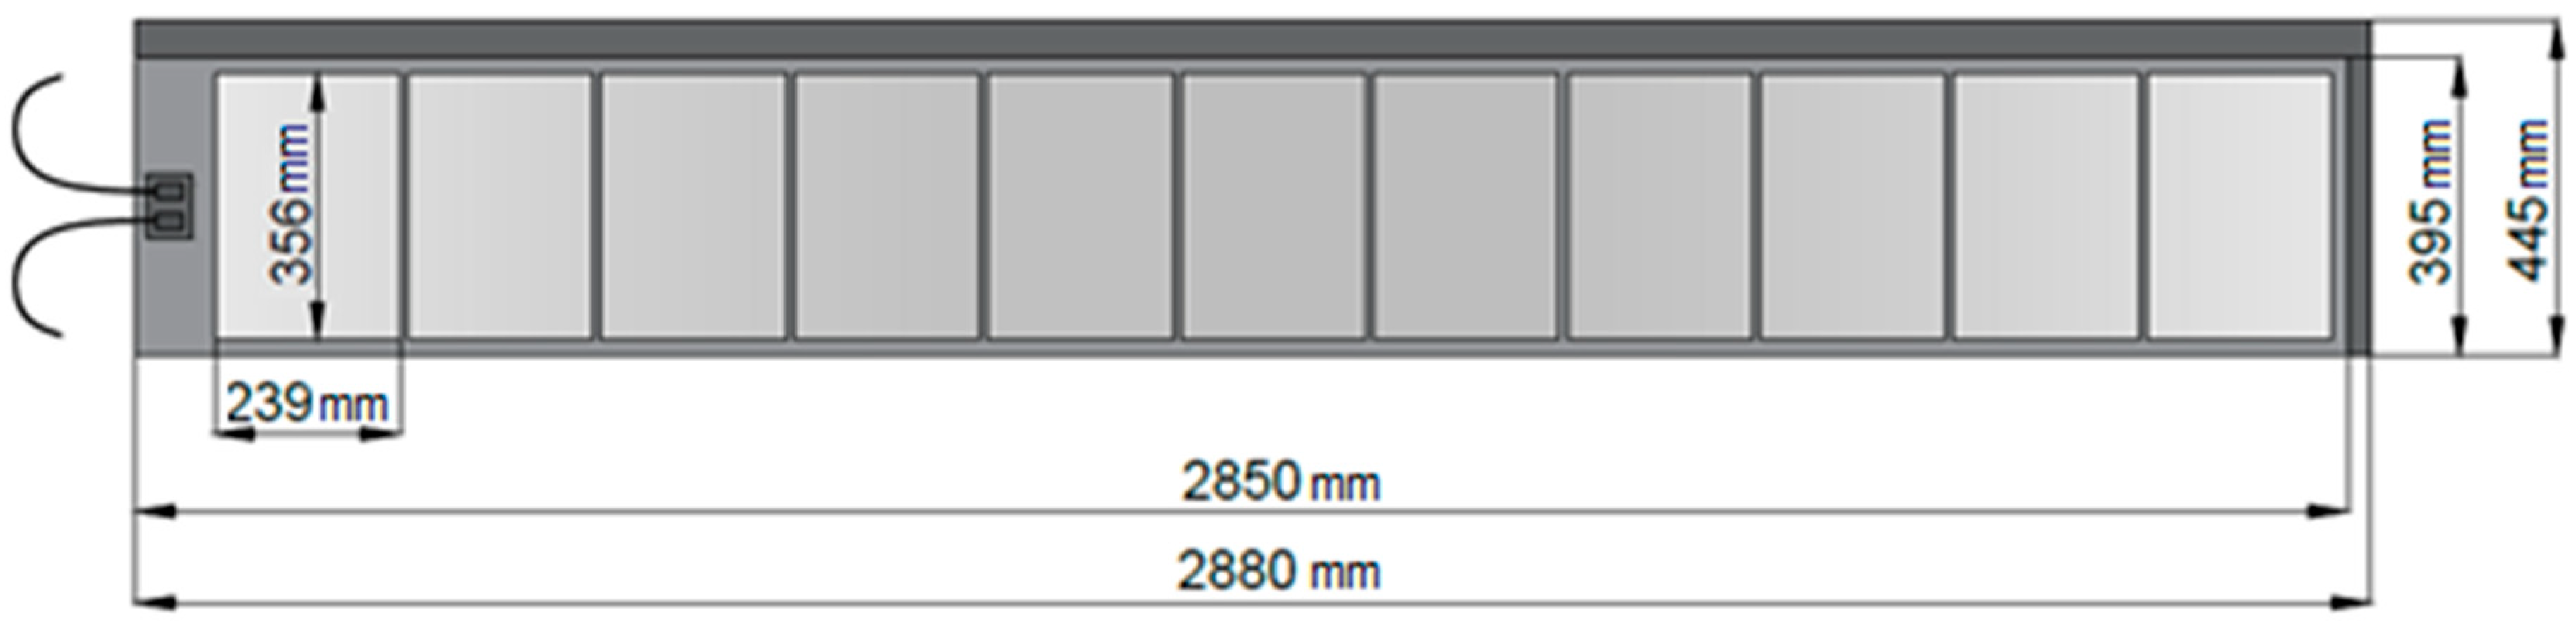
Our test object was a Tegosolar PVL68 elastic PV roof tile (of Tegola, Vittorio Veneto, Italy), presented in Figure 2. The PV roof tile weighs about 4 kg and consists of two parts: bitumen substrate and a Uni-Solar elastic PV module. The PV module with a maximum power of 68 W consists of eleven serially connected solar cells. The cells are based on triple-junction amorphous silicon. Each cell is featured with a by-pass diode soldered in parallel, which enables current flow if a part of the module is shaded. Although the efficiency of cells based on amorphous silicon is fairly low (6%–10%), they are much cheaper to produce than crystalline silicon cells and can be manufactured in any shape and size [27].
- ETFE (ethylene-tetrafluoroethylene, also known as Tefzel)—durable polymer resistant to water and moisture, with high tensile strength, highly transparent and resistant to UV light; it is also used for the proper encapsulation of PV cells ensuring their proper electrical insulation.
- PV cells—11 triple-junction PV cells made of amorphous silicon with different admixtures to improve sensitivity to absorption of light in the blue, green and red colour ranges; the total thickness of the PV cell was ca. 1 µm, dimensions: 239 × 356 mm and ca. 10% efficiency.
- Connection grid—stainless steel connections of PV cells.
- PVDF bottom laminate (polyvinylidene-fluoride)—thermoplastic polymer with a high degree of PVDF crystallisation; it provides additional protection of PV cells from moisture and atmospheric conditions, proper electrical insulation, and mechanical, thermal and chemical protection.
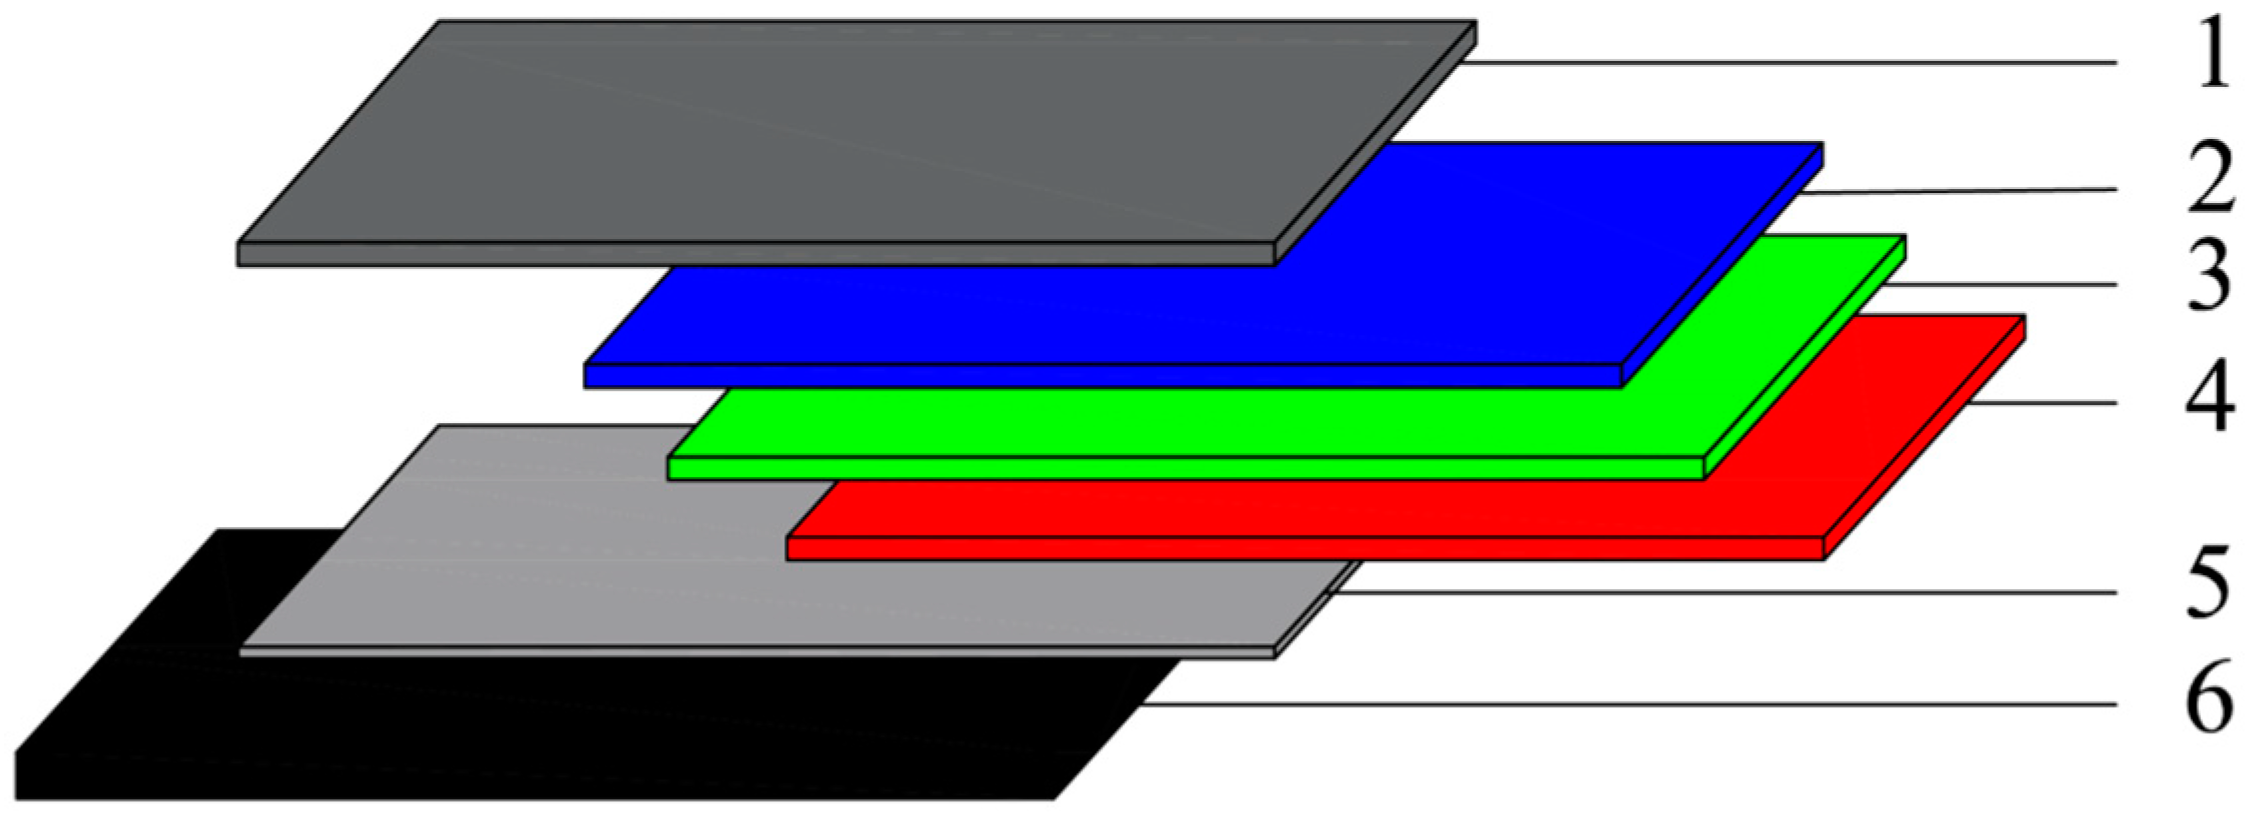
The construction of the reference photovoltaic roof tile, based on a triple-junction structure (with the addition of Ge in different amounts in individual parts of the PV cells) is presented in Figure 3, while its most important technical parameters are shown in Table 1. The structure which generated electrical energy consisted of stainless-steel foil, on which three layers of amorphous silicon, a transparent electrode and connection grid sockets were applied. The structure was coated with an ETFE polymer film, which protected the module from water and prevented dirt deposition. Because the low efficiency of amorphous cells is mainly caused by the poor absorption of low-energy infrared radiation, each of the three layers of amorphous silicon was responsible for the absorption of different solar radiation wavelengths [28].
Individual parameters of the material layers making up the PV roof tile and roof structures on which the tiles can be installed, are presented in Table 2. The connection paths of PV cells were not considered in the deliberations with regard to their small size compared to the total area of PV roof tiles.
The photovoltaic module of the reference PV roof tile has an adhesive layer on its bottom side to facilitate its fixing to the roof structure. The dimensions of the PV panel were the same as the dimensions of standard roof-covering items (bitumen—shingles or asphalt roofing felt), which makes embedding the PV roof tiles into the roof structure very easy. In addition to electrical current generation, a PV roof tile ensures the appropriate roof strength and water insulation, much like traditional roof covering. According to the recommendations of the PV roof tiles manufacturer, standard roof covering is to be used ca. 0.5 m from the outer edges of the roof [27].
3. Thermal Resistance and Thermal Capacity of the Roof and PV Roof Tiles
By knowing the construction and material parameters of PV roof tile layers as well as the roof structure, one can identify the thermal resistance and thermal capacity of each layer and the entire PV roof tile based on current legal regulations and standards concerning building materials. PN-EN ISO 6946:2017 “Building components and building elements. Thermal resistance and thermal transmittance. Calculation methods” is the standard valid currently in Poland [36]. The thermal resistance and thermal capacity of a homogeneous layer can be identified based on the following equations [18,36,37]:
where Rth is the material (layer) thermal resistance (m2K/W), Cth is the material (layer) thermal capacity (J/m2K), dm is the layer thickness (m), k is the thermal conductivity coefficient of the material (W/mK), ρn is the material density (kg/m3), and cp,n is the material specific heat (J/kgK).
The values of thermal resistance and thermal capacity of PV roof tile layers and roof structure, identified according to Equations (1) and (2), are collected in Table 3. Individual thermal resistance values Rth describe the material resistance to transmit heat, while thermal capacity values Cth refer to the ability to absorb and transmit heat. Heat transmittance (conduction) between the material layers (building component layers) is a process involving inert movement energy transmittance by adjacent particles; it is one of three kinds of heat transfer, with convection and radiation being the other two. The process strictly depends on the material parameters of the layers.
The total value of thermal resistance RTH and thermal capacity CTH of a PV roof tile or a roof is the total of thermal resistance and thermal capacity values of all layers in the analysed structure, which is expressed by the following equations [18,36]:
The abovementioned Equations (3) and (4) were used to calculate the values of thermal resistance and thermal capacity of the reference PVL68 PV roof tile, which amounted to 18.74 × 10⁻³ m2K/W and 4931.95 J/m2K respectively. The roof structure in the deliberations was treated as a homogeneous layer composed only of pine boards, without taking other components (e.g., rafters) into account, which would not greatly affect the identified RC time constant values due to the small size of the components compared to the roof slope area. Details of the method used to identify the total resistance of a roof composed of different layers, taking all components into account, are presented in [38].
When Equation (1) is transformed into one which enables the determination of the coefficient of thermal conductivity (thermal conductance) k of a PV roof tile, the following relationship is obtained:
The coefficient of thermal conductivity k of the studied PV PVL68 roof tile was 0.13 W/mK, that is, much lower than the value of k for standard ceramic tiles (i.e., 1 W/mK, according to standard [36]) and slightly lower than the coefficient value for the top layer of asphalt roofing felt (for which it amounts to 0.18 W/mK). This means that the reference PVL68 photovoltaic roof tile provided better thermal insulation of the roof than ceramic or bitumen roof covering, which would contribute to a lower cooling rate of the building attic in winter and a slower heating rate in summer. The entire analysed roof structure, composed of pine boards and PV roof tiles, had a thermal transmittance of 0.31 W/mK, a total thermal resistance amounting to 90.17 × 10⁻³ m2K/W and total thermal capacity of 22,931.95 J/m2K.
4. RC Circuit Model
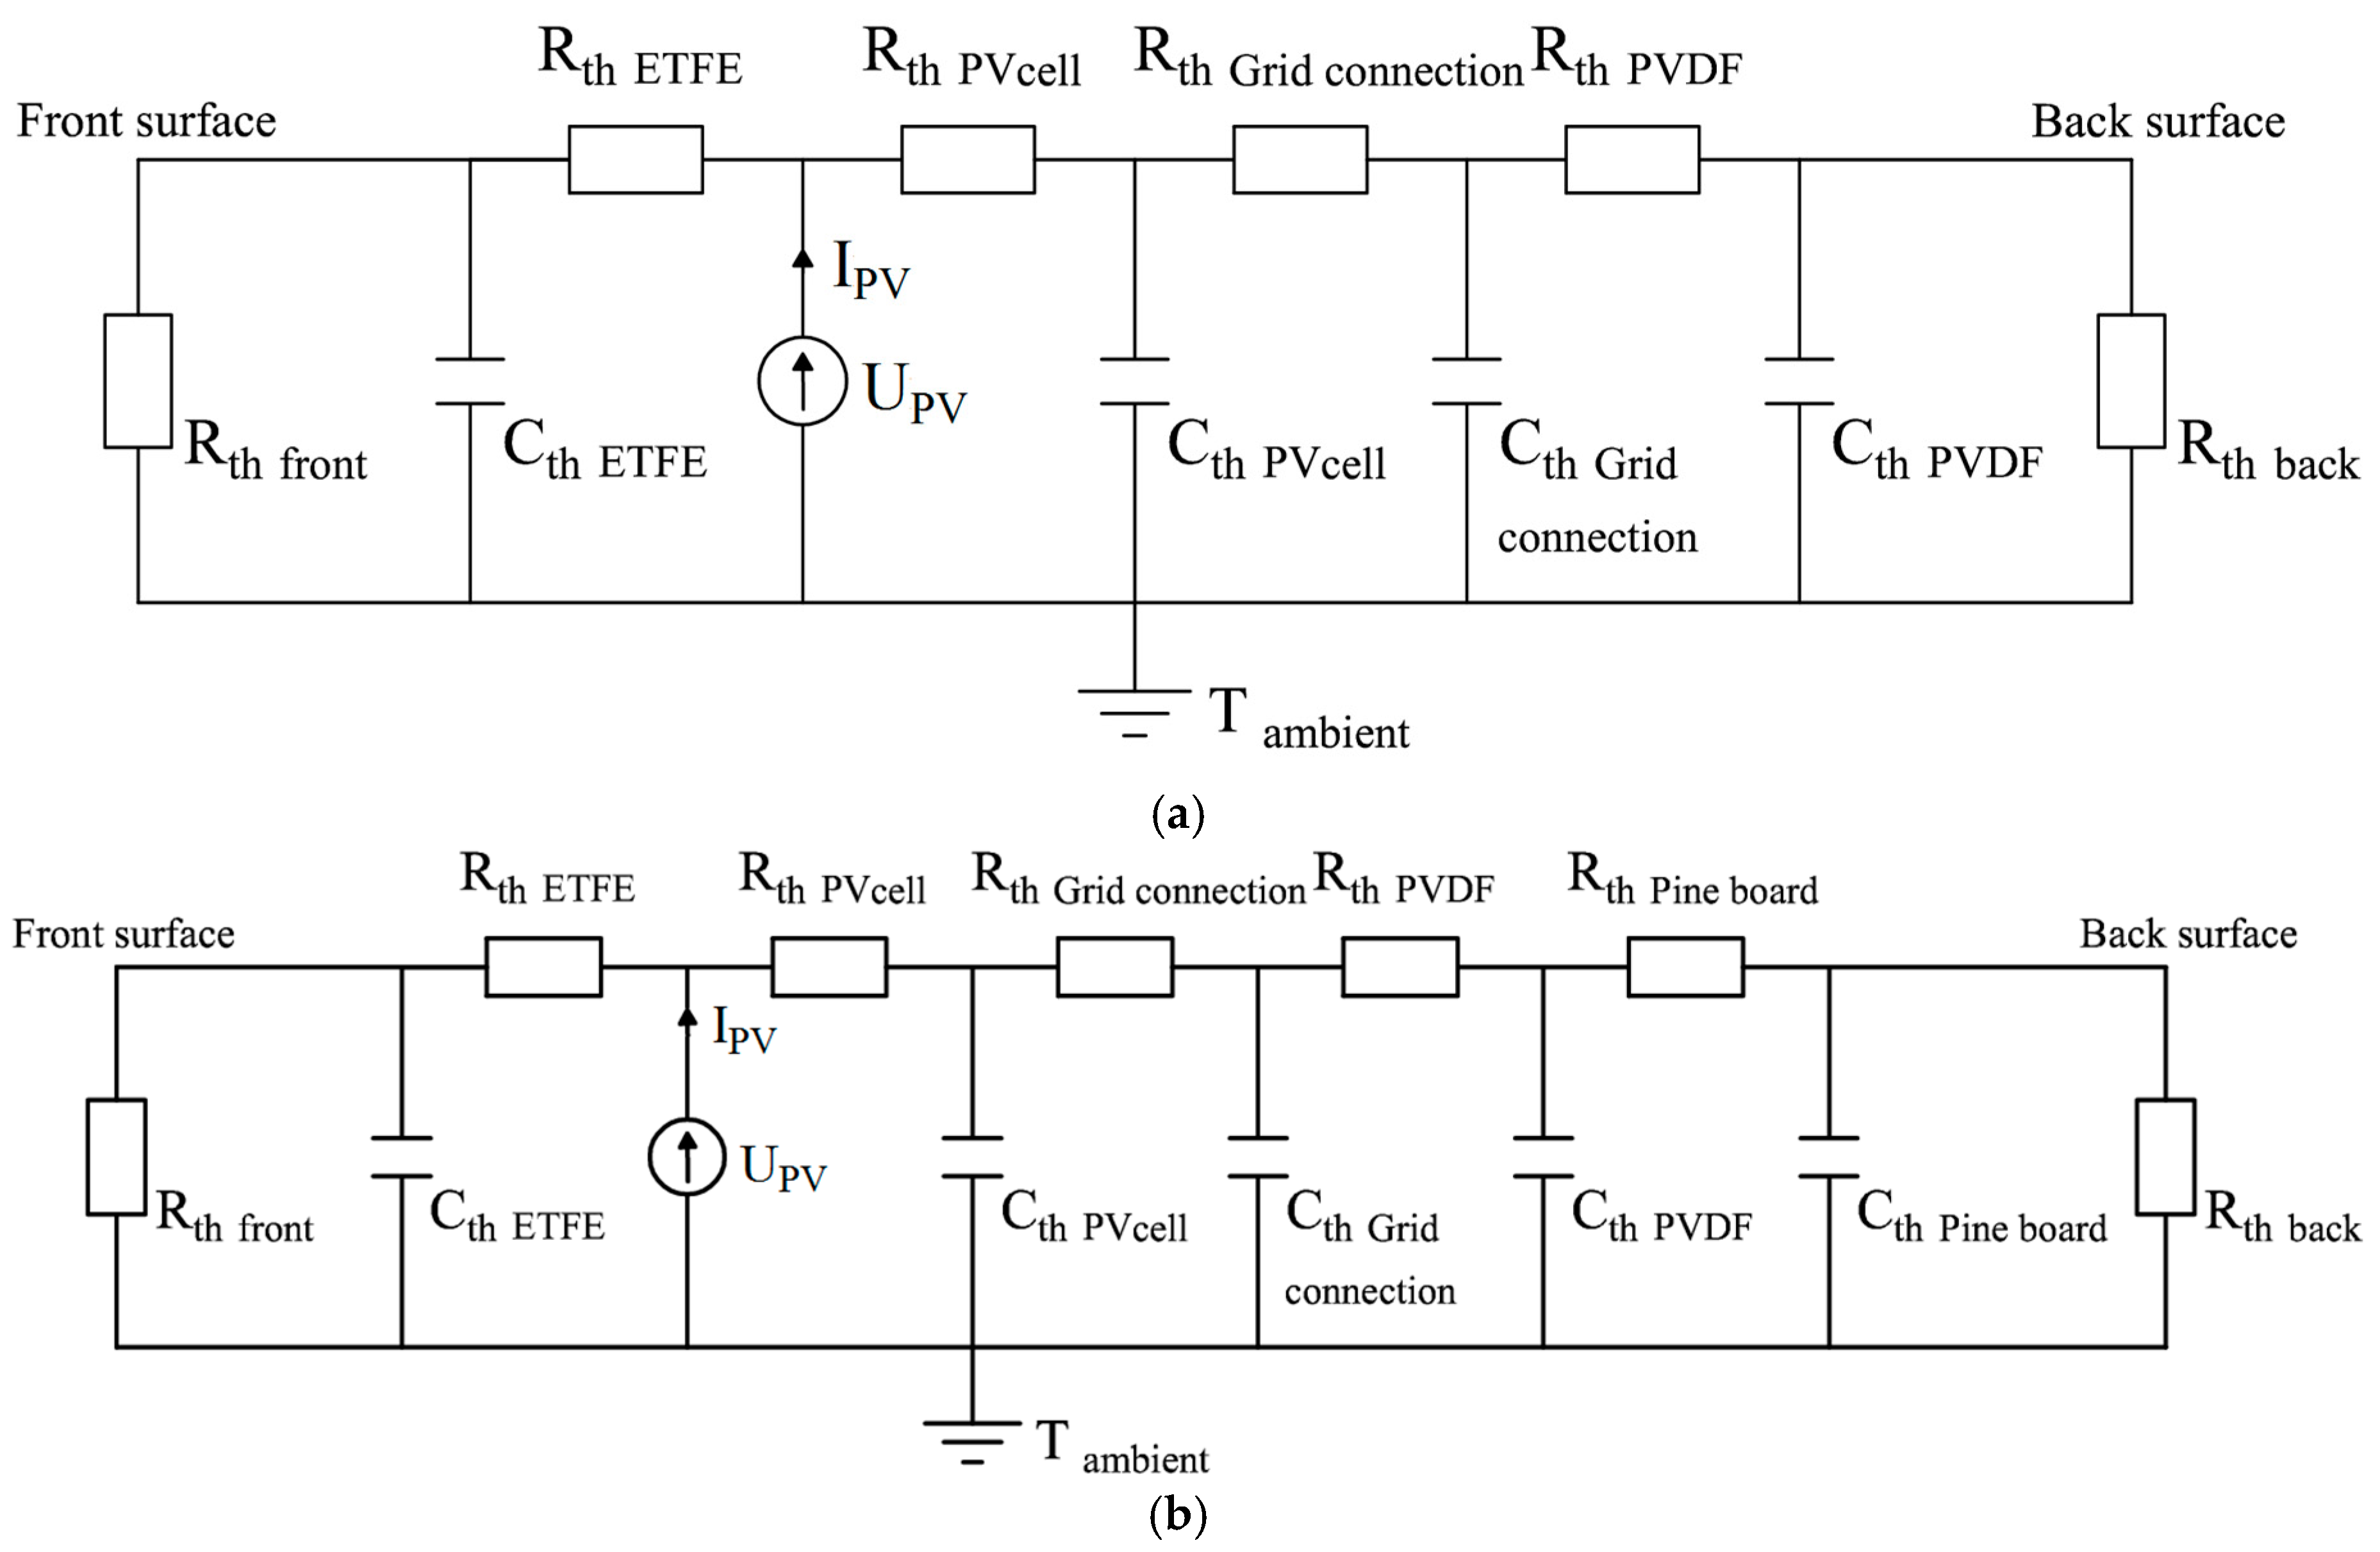
The material parameters of roof tile layers as well as atmospheric conditions (e.g., wind direction and speed, irradiance, ambient temperature) greatly affect the temperature of PV cells constituting the photovoltaic roof tile. A working PV roof tile also generates heat as a result of its internal processes. A resistance–capacity (RC) model of a photovoltaic roof tile helps to identify temperature changes of the PV cells, which are the PV roof tile components, with a sudden change in their working conditions (particularly atmospheric conditions and irradiance). The temperature of PV cells in photovoltaic roof tiles changes exponentially with a discontinuous (sudden) change in irradiance, while the RC time constant of a PV roof tile is defined as the time necessary to reach 63% of the total temperature change value. The proposed RC model of the studied PV roof tile helps to identify its τRC under variable working conditions. Thermal mechanisms of PV roof tiles were expressed by correlating their electrical equivalents (resistance and capacity) with thermal resistance and thermal capacity, used for defining heat transmittance in their layers. Figure 4 presents a substitute wiring diagram for the RC model of a studied single PVL68 photovoltaic roof tile (Figure 4a) and for the entire roof structure with built-in PV roof tiles (Figure 4b). Figure 4a,b covers the PV cell as a whole (i.e., assembly of the three layers of cells listed in Figure 3). IPV, UPV (Figure 4a,b) is a photovoltaic current and voltage of solar cells, respectively. PPV is a electric power generated by a solar roof tile, calculated as multiplication of the IPV and UPV.
Rth front and Rth back stand for the resistance of heat transfer on the outer Rse and inner Rsi surface of the item respectively. The resistance values, depending on the direction of the heat stream flow, were specified in [36] PN-EN ISO 6946:2017 and are presented in Table 4.
The time constant of the reference PV roof tile or the entire roof construction can be identified according to Equation (6), based on identified thermal resistance and heat capacity values (Table 3 and Table 4) and wiring diagrams presented in Figure 4:
The identified time constant values for the PVL68 photovoltaic roof tile and the entire roof amounted to τRC pv = 18.80 min and τRC roof = 99.43 min, respectively. In the analysis of the entire roof construction with PV roof tiles, the RC time constant value increased due to the high heat capacity of wood boards laid under the photovoltaic roof tiles.
5. Heat Balance of the Roof and Photovoltaic Roof Tiles
It was assumed that the PV roof tile temperature was uniformly distributed on its different layers and that the temperature of all PV cells was the same. In the case of photovoltaic roof tiles, it suffices to take conductive and convective heat exchange into account, while neglecting radiation. The value of electrical energy generated by PV roof tiles and the quantity of solar energy reaching the PV module surface were also considered. The thermal balance equation (PET model, photo-electro-thermal) can be formulated as follows [17]:
where S is the PV module surface (m2), CTH is the PV roof tile thermal capacity (J/m2K), Tpv is the PV cell temperature (K), Qsolar is the solar energy reaching the PV module surface (W), Ppv is the electrical power generated by the PV module (W) and Qconv represents the convective heat losses (W).
The power density value of solar radiation reaching the PV module surface can be identified from Equation (8) [17]:
where α is the PV module coefficient of solar radiation absorption, whose value ranged from 70% to 90%, and E is the solar radiation power density (W/m2).
The total value of convective heat losses is the total of forced convection heat on the PV module front surface and free convection heat of the module rear part, whereas free convection is minor compared to forced convection and can be neglected. Convective heat losses can be identified from Equation (9) [17]:
where hconv is the coefficient of convective heat exchange (W/m2K) and Tamb is the ambient temperature (K).
The coefficient of convective heat exchange hconv depends on the wind speed νwind (m/s), which is expressed by Equation (10) [18]:
The hconv coefficient was determined experimentally by the authors in [18], who also reviewed the other coefficients of Equation (10) depending on the determination methods—in a wind tunnel or during real measurements—and obtained on the basis of the fundamental theory of heat exchange and criterion numbers.
It was assumed that in natural conditions, the change in the ambient temperature at irradiance changes was slow enough to be considered as a constant value. Upon including Equations (8)–(10), a relationship for the momentary temperature value of PV cells was obtained in Equation (7) as an analytical solution of the first-order PET differential equation:
An assumption was made that under natural conditions, ambient temperature change at irradiance change occurs slowly enough to be considered a fixed value.
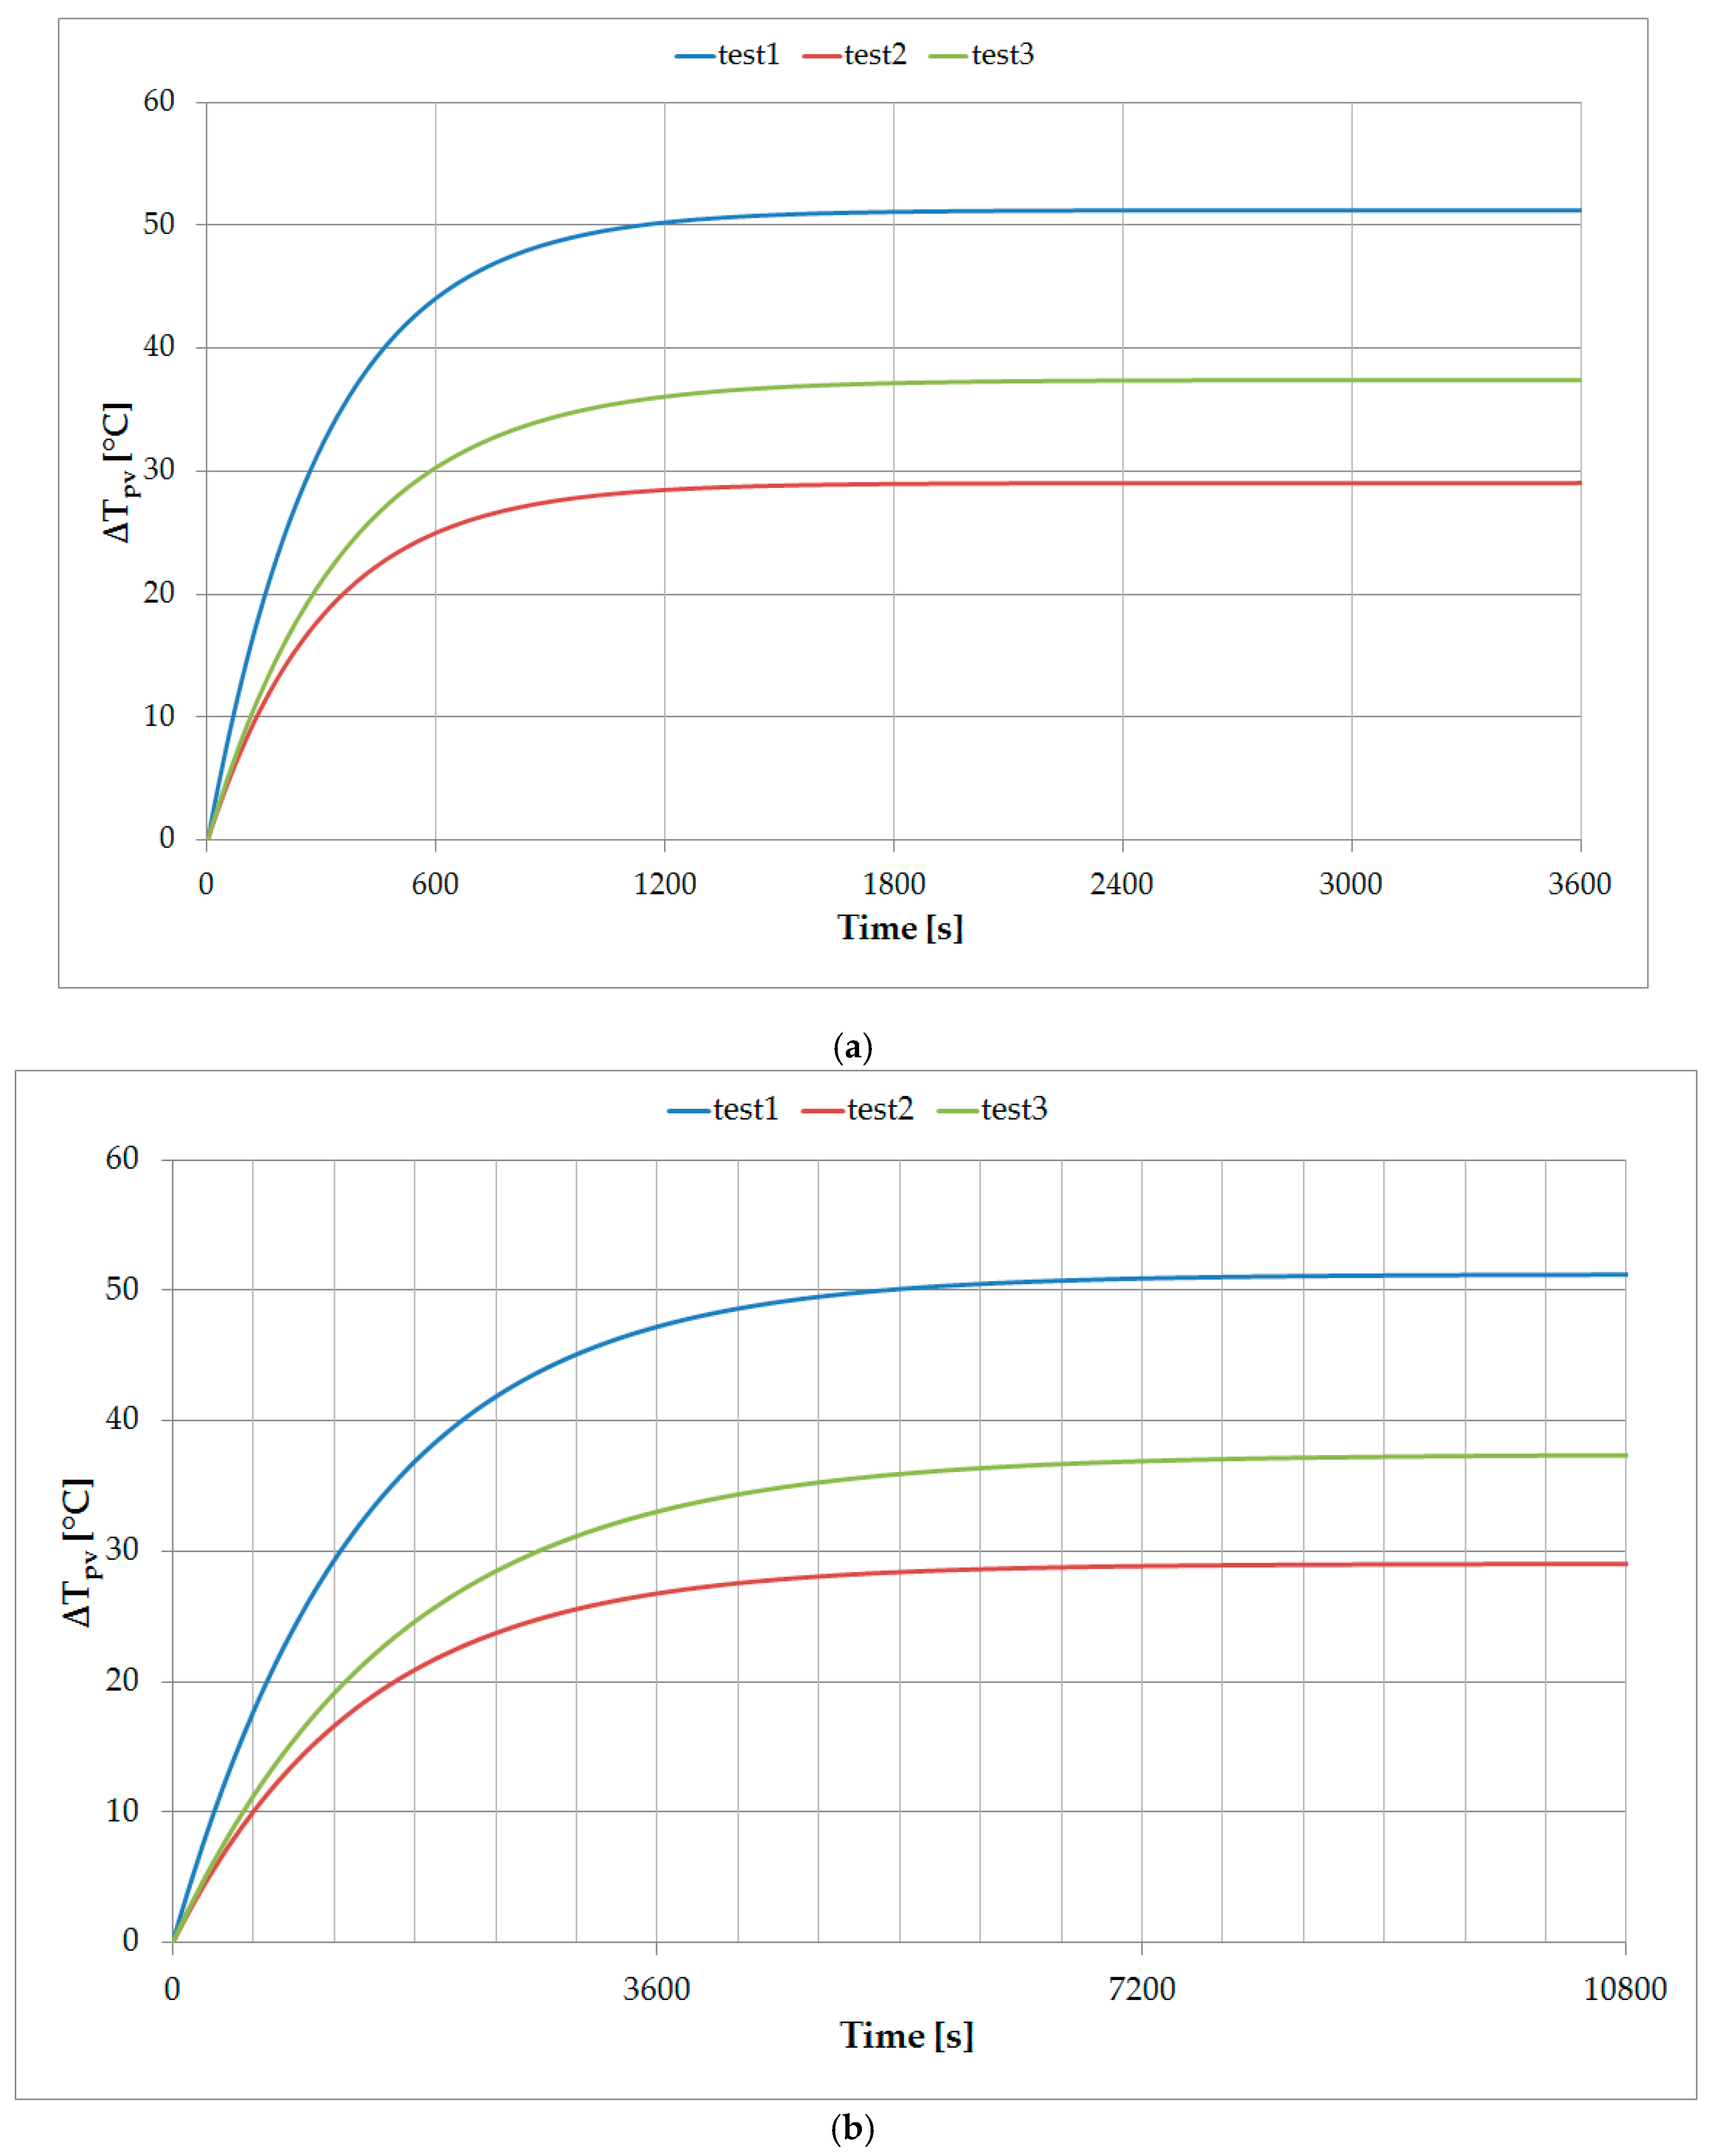
The PV cell temperature value of the reference standalone roof tile (Figure 5a) and built-in roof tile fixed to wood boards (Figure 5b) was identified for three different environmental conditions:
- (a)
- test1: E = 1000 W/m2, νwind = 3 m/s, Tamb = 30 °C;
- (b)
- test2: E = 600 W/m2, νwind = 3 m/s, Tamb = 30 °C;
- (c)
- test3: E = 600 W/m2, νwind = 2 m/s, Tamb = 30 °C.
The maximum temperature values of PV cells in a working PVL68 roof tile amounted to 81.26, 59.08 and 67.45 °C respectively for the three different sets of environmental conditions, which remained unchanged during the analysis. The value of the difference in the PV cells temperature and ambient temperature (presented in Figure 5) was identified based on the following equation:
6. Discussion
The values of time constants τRC of PV cells in a standalone roof tile and a tile built into the roof, working under different conditions, are listed in Table 5.
One can observe a high convergence when comparing the time constants of a PV roof tile obtained from material data and identified from the energy balance equation, but only in the case of free convection. The PET model, also taking into account forced convection, gives real values of the time response of temperature changes of PV cells to the currently prevailing environmental conditions of the PV roof tile (wind speed, irradiance) in which the PV tiles work. Under unchanged ambient conditions, after ca. 5–6 min, the temperature of PV cells in a standalone roof tile would change by 63% compared to their potential maximum value. The proposed roof structure composed of wood boards and PV roof tiles was characterised by a time constant in the range of 23–28 min, that is, four to five times longer than the time constant of the standalone roof tile. Note that due to its structure, a PV roof tile will never work as a standalone item, but will always be integrated with a substrate such as the roof of a building. A change in the irradiance value will cause directly proportional changes in the temperature values that a PV cell can reach. The irradiance value did not greatly affect the value of the system time constant, while a reduced wind speed (at unchanged irradiance value) contributed to the PV roof tile becoming considerably heated, and to an increase in the value of the system time constant.
A greater time constant is desired while the elements become heated during photovoltaic processes, so that the temperature of PV cells does not increase too quickly and does not reach too high a value, but rather has a negative impact during system cooling, when the temperature of PV cells is reduced as quickly as possible. The PV cell temperatures reached for the three presented cases (Tpv test1 = 81.26 °C, Tpv test2 = 59.08 °C, Tpv test3 = 67.45 °C) for the analysed PV roof tile with a temperature coefficient of power change υP = −0.21 %/°C may contribute to a reduction in the generated power value by a maximum of 11.81%, 7.16% and 8.91% respectively.
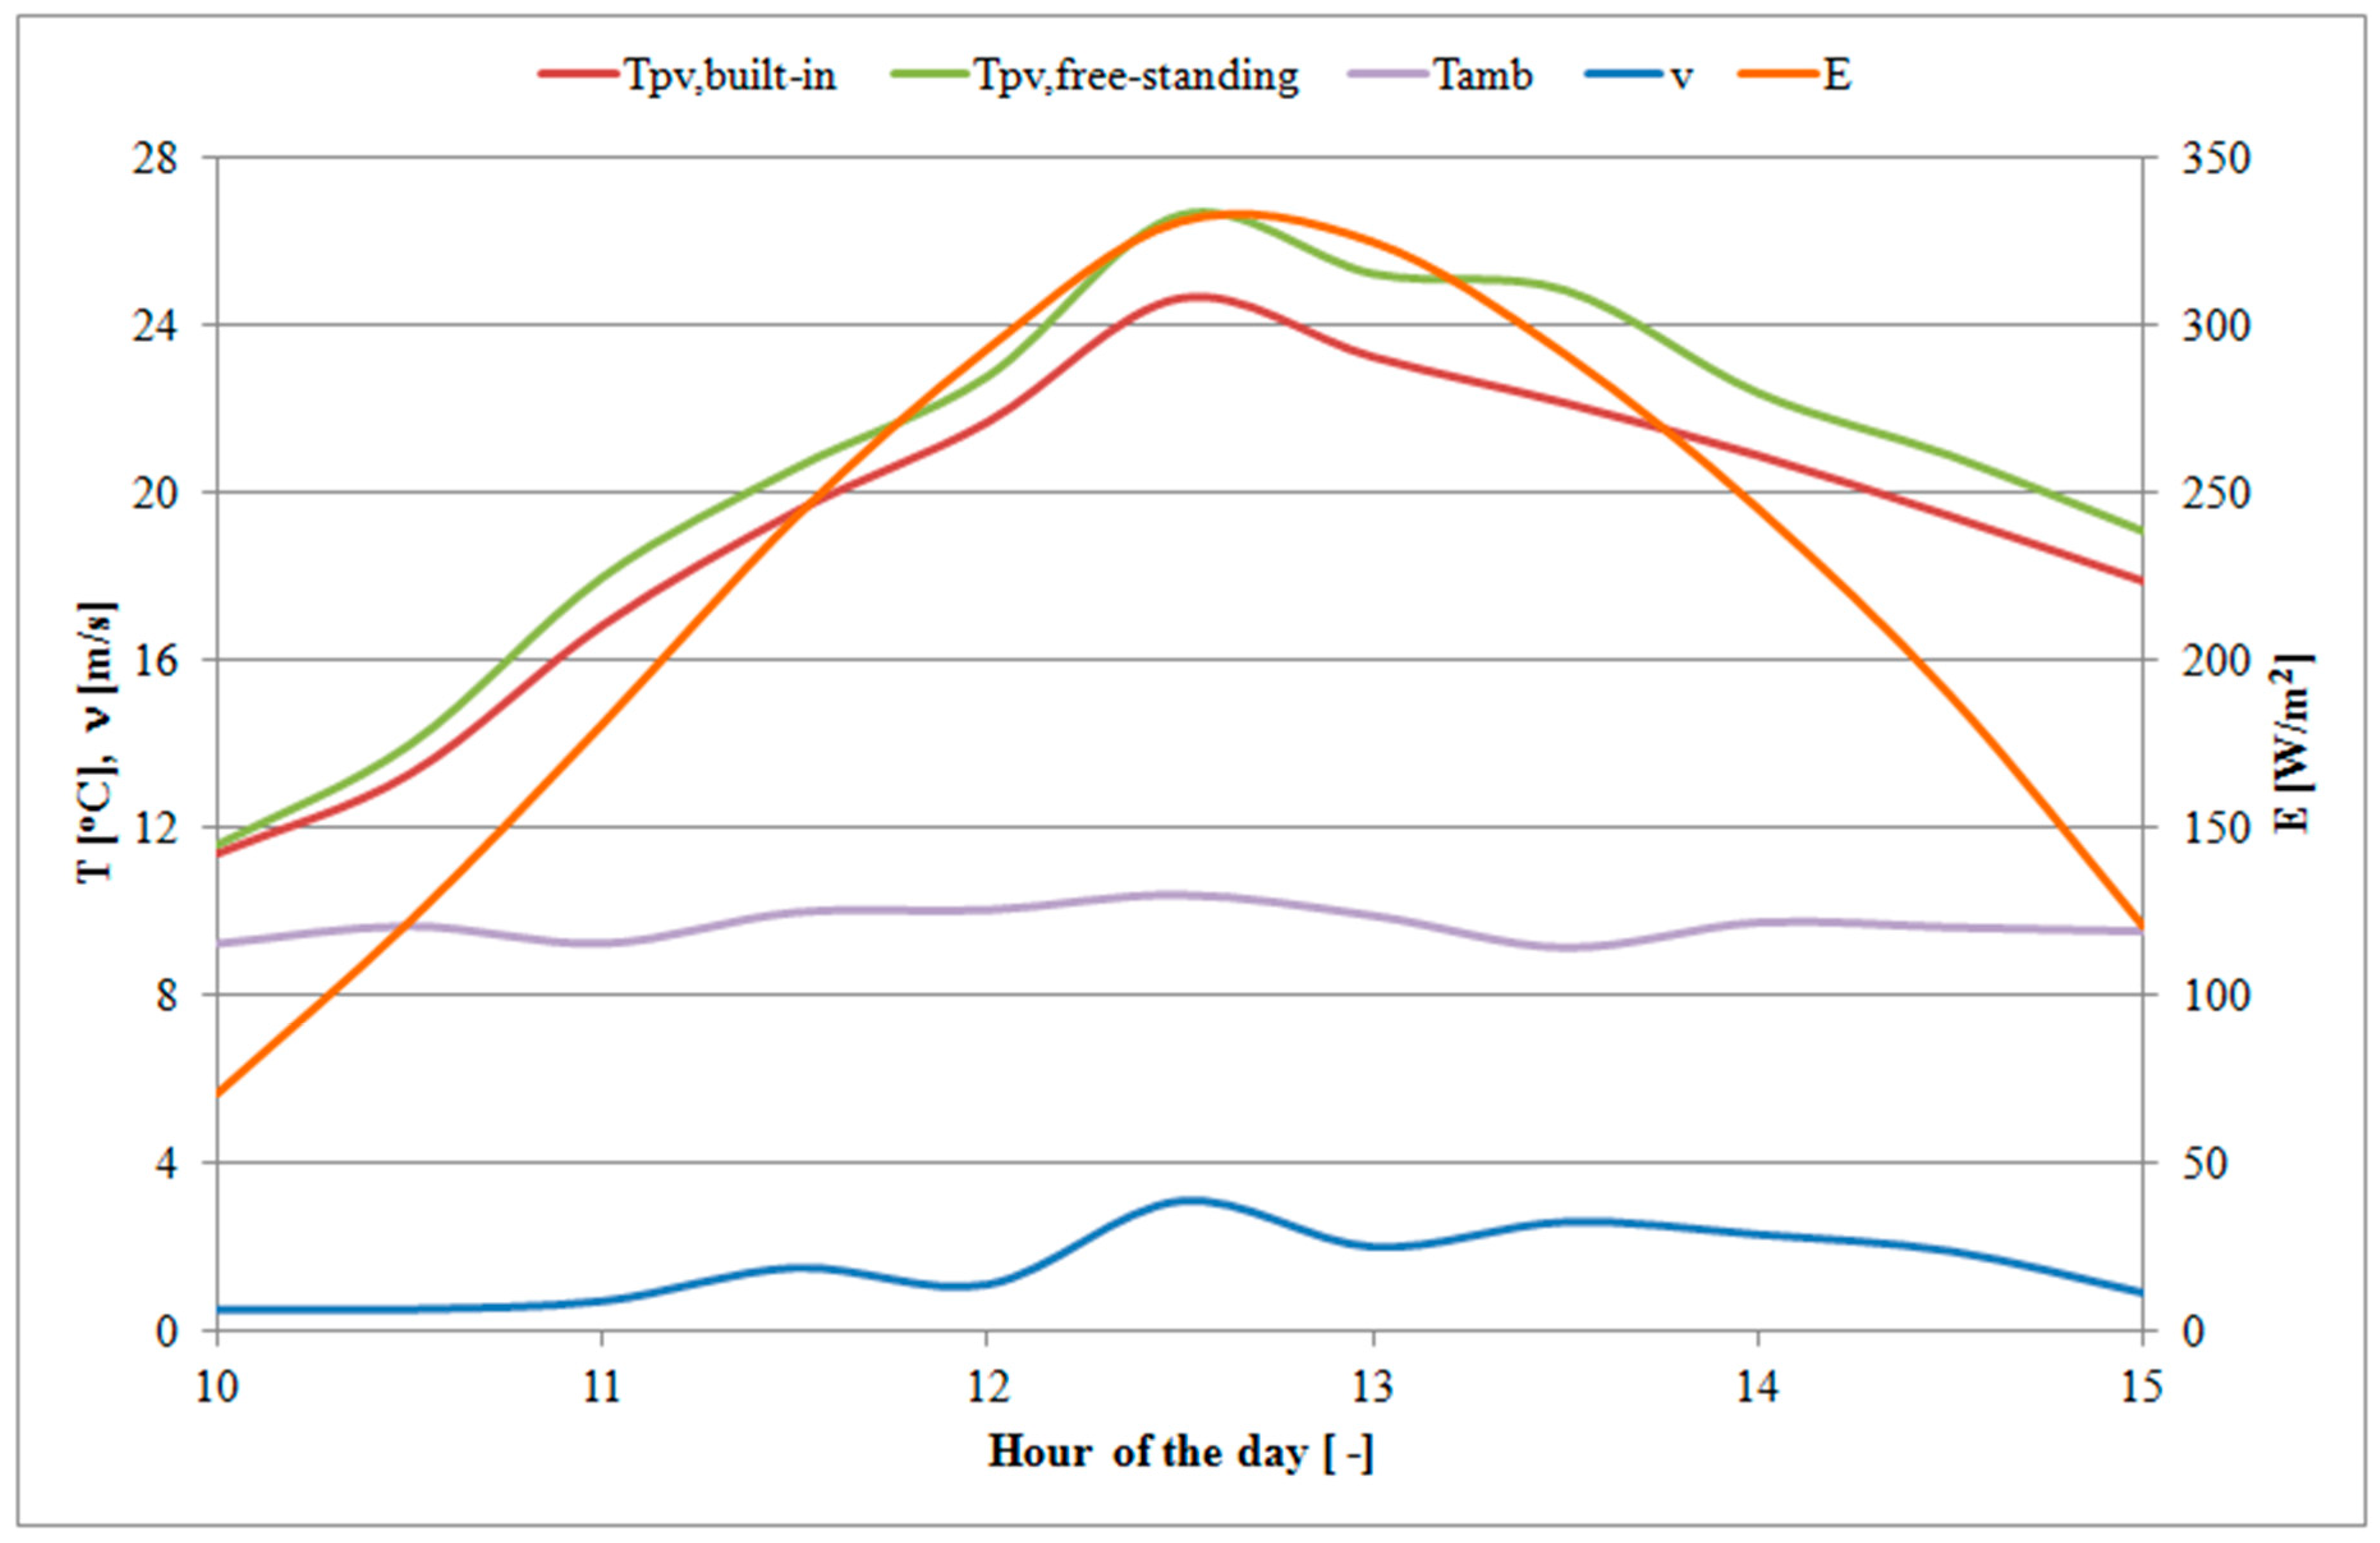
Initial experimental research was also carried out involving the measurement of the PV cells’ temperature of the free-standing PV tile and the PV tile built into the roof (glued to the boards) under real environmental conditions. The temperature chart of PV cells and the ambient conditions is shown in Figure 6.
During the test, the irradiance E was changed in the range of 70–330 W/m2, wind speed ν in the range 0.5–3.1 m/s, and ambient temperature Tamb in the range 9.1–10.4 °C. With the increase of irradiance, the temperature of PV cells increased, both tiles: free-standing (Tpv, free-standing) and built into the roof (Tpv, built-in). The maximum temperature of the PV cells of roof tiles built into the roof was 24.6 °C, and it was 2 °C lower than the temperature of free-standing tile cells at an ambient temperature of 10.4 °C. The PV cells of the free-standing tile reacted faster to changes in irradiance and wind speed. The most visible temperature changes of the PV cells of a free-standing tile were seen around at 12:30–14:00 at the highest wind speeds. On the other hand, the temperature of PV cells in roof tiles integrated with the roof decreased slower and more uniformly. Additionally, at the end of the measurement time, when the irradiance decreased significantly, the temperature of the PV cells of the free-standing tile decreased faster than those in the tile built into the roof.
This study confirms the simulation results of changes in the rate of heating and cooling of PV cells depending on the condition of their operation (free-standing or integrated with the roof). By gluing PV tiles to the roof structure, the overall system capacity increases, thanks to which the temperature decomposes in the entire mass and increases more slowly, but also slows the release of heat to the surroundings.
7. Conclusions
This paper presents known RC and PET models of photovoltaic cells that make up traditional PV panels and has been adapted to determine the thermal time constant of cells included in the photovoltaic roof tiles. They were confirmed to be correct for the PV roof tiles, but only in the case of their operation as a free-standing element, like traditional PV panels and not integrated with the roof. Differences in the values of the thermal time constant of PV roof tiles were also shown depending on the model used (RC or PET). The RC model, based on the material data of the PV roof tile layers, does not consider the weather conditions in which the tile works. Using the PET model (considering only the process of the free convection of heat exchange), convergent values of the time constant were obtained with the values obtained by means of the RC model (ca. 19–21 min). The use of the PET model allowed more accurate time constant results to be obtained (ca. 5–6 min), because it considers different forms of heat exchange as well as the current weather conditions (i.e., irradiance, ambient temperature, wind speed). Furthermore, it was shown that the available models cannot be used to determine the thermal time constant of PV roof tiles integrated in the roof, due to the additional thermal capacity and thermal resistance of the roof structure with which they are integrated. The authors modified the available RC model with a member representing a roof structure (composed of boards), taking into account its thermal resistance and thermal capacity. Also, in the PET model, the total thermal capacity of the system was taken into account, which is the sum of the thermal capacities of the PV roof tile and the roof structure. Accounting for the roof structure in both models caused about a five-fold increase in the value of the thermal time constant of PV cells. The earlier dependences of changes in the time constant value (taking into account only the free convection) were also met in the analysis of the entire roof with PV roof tiles.
In simulation tests nos. 1 and 2, the irradiance change of 400 W/m2 at a wind speed of 3 m/s caused a difference in the maximum temperature of the PV cells roof tile of 22 °C. During experimental investigations, with irradiance of 330 W/m2 and wind speed of 3.1 m/s, the temperature of PV cells increased by approx. 14–16 °C above ambient temperature, confirming the correctness of the proposed RC model of photovoltaic roof tiles.
The experimental tests carried out also confirmed the changes in the values of the thermal time constants of the PV cells of free-standing and integrated photovoltaic roof tiles. The temperature of the PV cells of a free-standing roof tile quickly responded to changes in the environment in which it worked compared to a PV roof tile built into the roof. However, further long-term studies are necessary, under different environmental conditions, so that the values of the time constants of the tested systems from experimental research can be unambiguously determined.
The temperature of roof tile PV cells did not change abruptly as a result of rapid changes in ambient conditions, and this was related to heat energy accumulation in the item’s mass. Hence, the determined time constant of a PV roof tile and the entire roof helped to estimate the speed of changes in PV cells during heating and cooling. In turn, the changes determine the electrical energy generation efficiency. A length of time of between three and five time constants was assumed as the time necessary to reach the maximum temperature of an item. The knowledge of thermal processes and PV cell temperature changes enables more precise estimation of the amount of electrical energy generated by a photovoltaic system built into a roof, depending on the roof structure type. The better the roof insulation, the higher the time constant value of the system and the longer the time necessary for PV cells to become heated and to cool down. The system cooling time has a special significance, after reduction in the momentary irradiance value.
Author Contributions
D.K.: conceptualisation, methodology, writing—original draft preparation, writing—review and editing; R.N.: conceptualisation, formal analysis, writing—review and editing, supervision.
Funding
This research was funded by Polish Government, Ministry of Science and Higher Education.
Conflicts of Interest
The authors declare no conflict of interest.
References
- Strona Firmy Monier Braas. Available online: https://www.monier.pl/produkty/systemy-solarne/energia-elektryczna/braas-pv-premium.html (accessed on 15 January 2019).
- MiaSolé Hi-Tech Corp. Company Website. Available online: http://miasole.com/products/ (accessed on 15 January 2019).
- FlexSol Solutions Company Website. Available online: https://flexsolsolutions.com/solar-roof-tile/ (accessed on 15 January 2019).
- Zanetti, I.; Bonomo, P.; Frontini, F.; Saretta, E.; Donker, M.; Vossen, F.; Folkerts, W. Status Report of Building Integrated Photovoltaics: Product Overview for Solar Building Skins. University of Applied Sciences and Arts of Southern Switzerland, Swiss BIPV Competence Center (SUPSI), Solar Energy Application Centre (SEAC). 2017. Available online: https://www.seac.cc/wp-content/uploads/2017/11/171102_SUPSI_BIPV.pdf (accessed on 15 January 2019).
- Henemann, A. BIPV: Built-in solar energy. Renew. Energy Focus 2008, 9, 14–19. [Google Scholar] [CrossRef]
- Davis, M.W.; Fanney, A.H.; Dougherty, B.P. Prediction of building integrated photovoltaic cell temperatures. J. Sol. Energy Eng. 2001, 123, 200–210. [Google Scholar] [CrossRef]
- Gunawan, A.; Hiralal, P.; Amaratunga, G.A.J.; Tan, K.T.; Elmes, S. The effect of the building integration on the temperature and performance of photovoltaic modules. In Proceedings of the 2014 IEEE 40th Photovoltaic Specialist Conference (PVSC), Denver, CO, USA, 8–13 June 2014. [Google Scholar] [CrossRef]
- Norton, B.; Eames, P.C.; Mallick, T.K.; Huang, M.J.; McCormack, S.J.; Mondol, J.D.; Yohanis, Y.G. Enhancing the performance of building integrated photovoltaics. Sol. Energy 2011, 85, 1629–1664. [Google Scholar] [CrossRef]
- Lee, J.B.; Park, J.W.; Yoon, J.H.; Baek, N.C.; Kim, D.K.; Shin, U.C. An empirical study of performance characteristics of BIPV (Building Integrated Photovoltaic) system for the realization of zero energy building. Energy 2014, 66, 25–34. [Google Scholar] [CrossRef]
- Hyo-Mun, L.; Seung-Chul, K.; Chul-Sung, L.; Jong-Ho, Y. Power Performance Loss Factor Analysis of the a-Si BIPV Window System Based on the Measured Data of the BIPV Test Facility. Appl. Sci. 2018, 8, 1645. [Google Scholar] [CrossRef]
- Moshfegh, B.; Sandberg, M. Flow and heat transfer in the air gap behind photovoltaic panels. Renew. Sustain. Energy Rev. 1998, 2, 287–301. [Google Scholar] [CrossRef]
- Shahsavar, A.; Salmanzadeh, M.; Ameri, M.; Talebizadeh, P. Energy saving in buildings by using the exhaust and ventilation air for cooling of photovoltaic panels. Energy Build. 2011, 43, 2219–2226. [Google Scholar] [CrossRef]
- Gan, G. Numerical determination of adequate air gaps for building-integrated photovoltaics. Sol. Energy 2009, 83, 1253–1273. [Google Scholar] [CrossRef]
- Brinkworth, B.J.; Cross, B.M.; Marshall, R.H.; Yang, H. Thermal regulation of photovoltaic cladding. Sol. Energy 1997, 61, 169–178. [Google Scholar] [CrossRef]
- Gan, G. Effect of air gap on the performance of building-integrated photovoltaics. Energy 2009, 34, 913–921. [Google Scholar] [CrossRef]
- Skoplaki, E.; Palyvos, J.A. On the temperature dependence of photovoltaic module electrical performance: A review of efficiency/power correlations. Sol. Energy 2009, 83, 614–624. [Google Scholar] [CrossRef]
- Lian, Y.H.; Kao, Y.P.; Tsai, H.L. Photo-Electro-Thermal Model for Commercial Photovoltaic Modules. In Proceedings of the IEEE International Conference on Applied System Innovation 2017, Sapporo, Japan, 13–17 May 2017; pp. 158–161. [Google Scholar] [CrossRef]
- Armstrong, S.; Hurley, W.G. A thermal model for photovoltaic panels under varying atmospheric conditions. Appl. Therm. Eng. 2010, 30, 1488–1495. [Google Scholar] [CrossRef]
- Jones, A.D.; Underwood, C.P. A thermal model for photovoltaic systems. Sol. Energy 2001, 70, 349–359. [Google Scholar] [CrossRef]
- Zhang, Z.; Wang, L.; Kurtz, S.; Wu, J.; Quan, P.; Sorensen, R.; Liu, S.; Bai, J.B.; Zhu, Z.W. Operating temperatures of open-rack installed photovoltaic inverters. Sol. Energy 2016, 137, 344–351. [Google Scholar] [CrossRef]
- Torres-Lobera, D.; Valkealahti, S. Inclusive dynamic thermal and electrical simulation model of solar PV system under varying atmospheric conditions. Sol. Energy 2014, 105, 632–647. [Google Scholar] [CrossRef]
- Trzmiel, G. Determination of a mathematical model of the thin-film photovoltaic panel (CIS) based on measurement data. Eksploatacja i Niezawodnosc—Maint. Reliab. 2017, 19, 516–521. [Google Scholar] [CrossRef]
- Kurz, D. Heat flow in installations with photovoltaic tiles. In Proceedings of the 17th International Conference Computational Problems of Electrical Engineering (CPEE), Sandomierz, Poland, 14–17 September 2016. [Google Scholar] [CrossRef]
- Kurnik, J.; Jankovec, M.; Brecl, K.; Topic, M. Outdoor testing of PV module temperature and performance under different mounting and operational conditions. Sol. Energy Mater. Sol. Cells 2011, 95, 373–376. [Google Scholar] [CrossRef]
- Hishikawa, Y.; Doi, T.; Higa, M.; Yamagoe, K.; Ohshima, H.; Takenouchi, T.; Yoshita, M. Voltage-dependent temperature coefficient of the I–V curves of crystalline silicon photovoltaic modules. IEEE J. Photovolt. 2018, 8, 48–53. [Google Scholar] [CrossRef]
- Edgar, R.; Cochard, S.; Stachurski, Z. A computational fluid dynamic study of PV cell temperatures in novel platform and standard arrangements. Sol. Energy 2017, 144, 203–214. [Google Scholar] [CrossRef]
- TEGOSOLAR PV Roof Tile Technical Sheet. Available online: http://www.tegolacanadese.com/assets/products/01/02/aa4c/02cec7ec/0102aa4c02cec7eca946f0d8a2467acc.pdf (accessed on 9 December 2018).
- Dobrzycki, A.; Kurz, D.; Laska, D. Analiza wpływu ukształtowania elastycznej dachówki fotowoltaicznej na uzysk energii elektrycznej. Poznan Univ. Technol. Acad. J. Electr. Eng. 2016, 87, 47–58. [Google Scholar]
- TEGOSOLAR PV Roof Tile Catalogue Sheet. Available online: http://www.tegola.cz/download.php?idx=1004 (accessed on 20 November 2015).
- Material Properties Database. Available online: https://www.makeitfrom.com/material-properties/Ethylene-Tetrafluoroethylene-ETFE (accessed on 10 January 2019).
- Jae-Han, L.; Yoon-Sun, L.; Yoon-Bok, S. Diurnal Thermal Behavior of Photovoltaic Panel with Phase Change Materials under Different Weather Conditions. Energies 2017, 10, 1983. [Google Scholar] [CrossRef]
- Lu, Z.H.; Yao, Q. Energy analysis of silicon solar cell modules based on an optical model for arbitrary layers. Sol. Energy 2007, 81, 636–647. [Google Scholar] [CrossRef]
- Material Tables. Available online: http://kurtz.zut.edu.pl/fileadmin/BE/Tablice_materialowe.pdf (accessed on 10 January 2019).
- Material Properties Database. Available online: https://www.makeitfrom.com/material-properties/Polyvinylidene-Fluoride-PVDF (accessed on 10 January 2019).
- Simpson, W.T. General Technical Report FPL-GTR-76, Specific Gravity, Moisture Content, and Density Relationship for Wood. 1993. United States Department of Agriculture Forest Service, Forest Products Laboratory. Available online: https://www.fpl.fs.fed.us/documnts/fplgtr/fplgtr76.pdf (accessed on 10 January 2019).
- EN ISO 6946:2017 “Building Components and Building Elements. Thermal Resistance and Thermal Transmittance. Calculation Methods” (Polish version PN-EN ISO 6946:2017). Available online: https://www.iso.org/standard/65708.html (accessed on 20 December 2018).
- Marańda, W.; Piotrowicz, M. Extraction of thermal model parameters for field-installed photovoltaic module. In Proceedings of the 27th International Conference of Microelectronics 2010, Nis, Serbia, 16–19 May 2010. [Google Scholar] [CrossRef]
- Kurz, D.; Nawrowski, R. The analysis of the impact of the thermal resistance of the roof on the performance of photovoltaic roof tiles. In Proceedings of the International Conference EEMS—Energy, Environment and Material Systems, Polanica Zdrój, Poland, 13–15 September 2017; p. 01039. [Google Scholar] [CrossRef]
Figure 1.
Different types of photovoltaic (PV) roof tiles: (a) rigid glass PV roof tiles in metal frames [1]; (b) elastic PV roof tiles [2]; (c) ceramic PV roof tiles [3].

Figure 2.
Photovoltaic roof tile (Tegosolar PVL68) [27].
Figure 2.
Photovoltaic roof tile (Tegosolar PVL68) [27].

Figure 3.
Construction of Tegosolar PVL68 photovoltaic elastic roof tile, where 1: ethylene-tetrafluoroethylene (ETFE); 2: silicon cell (a-Si for blue-colour radiation); 3: silicon cell (a-SiGe for green-colour radiation); 4: silicon cell (a-SiGe for red-colour radiation); 5: stainless steel foil (–); 6: polyvinylidene-fluoride (PVDF) base layers [27].

Figure 4.
Equivalent electrical circuit for the resistance–capacity (RC) model for: (a) a single PVL68 photovoltaic roof tile; (b) the entire roof composed of pine board and PVL68 photovoltaic roof tiles.
Figure 4.
Equivalent electrical circuit for the resistance–capacity (RC) model for: (a) a single PVL68 photovoltaic roof tile; (b) the entire roof composed of pine board and PVL68 photovoltaic roof tiles.

Figure 5.
Temperature change of PV cells of PVL68 photovoltaic roof tiles under different environmental conditions: (a) standalone roof tile; (b) roof tile fixed (glued) to the roof boards.
Figure 5.
Temperature change of PV cells of PVL68 photovoltaic roof tiles under different environmental conditions: (a) standalone roof tile; (b) roof tile fixed (glued) to the roof boards.

Figure 6.
Chart of temperature changes of PV cells in free-standing configuration and as roof-mounted solar roof tiles, as well as the ambient conditions prevailing during the tests. E: irradiance; Tamb: ambient temperature; ν: wind speed.
Figure 6.
Chart of temperature changes of PV cells in free-standing configuration and as roof-mounted solar roof tiles, as well as the ambient conditions prevailing during the tests. E: irradiance; Tamb: ambient temperature; ν: wind speed.


| Parameter | Symbol and Unit | Value |
|---|---|---|
| Maximum power rating | Pmax (W) | 68 |
| Open circuit voltage | Uoc (V) | 23.1 |
| Voltage at the maximum power point | Um (V) | 16.5 |
| Short circuit current | Isc (A) | 5.1 |
| Current at the maximum power point | Im (A) | 4.13 |
| Temperature coefficient of short-circuit current | υIsc (mA/°C) | 5.1 |
| Temperature coefficient of open-circuit voltage | υUoc (mV/°C) | −88 |
| υUoc (%/°C) | −0.38 | |
| Temperature coefficient of short-circuit current | υIsc (mA/°C) | 5.1 |
| υIsc (%/°C) | 0.1 | |
| Temperature coefficient of voltage at MPP | υUmpp (mV/°C) | −51 |
| υUmpp (%/°C) | −0.31 | |
| Temperature coefficient of current at MPP | υImpp (mA/°C) | 4.1 |
| υImpp (%/°C) | 0.1 | |
| Temperature coefficient of power | υP (mW/°C) | −143 |
| υP (%/°C) | −0.21 | |
| Panel efficiency | ηp (%) | 7.26 |
| Dimensions of PV cells | width × height (mm) | 239 × 356 |
| Number of PV cells in the panel | Ns (pcs.) | 11 |
| Type of PV cells | - | triple-junction, amorphous |
| Panel dimensions (global) | width × height × thickness (mm) | 2880 × 395 × 2.5 |
| Panel area (global) | S (m2) | 1.138 |
| Panel area (active) | Sa (m2) | 0.936 |
| Panel weight | m (kg) | 3.9 |
Table 2.
Material data of PVL68 photovoltaic roof tile layers and roof.
| Parameter | Thickness dm (m) | Specific Heat cp,n (J/kgK) | Density ρn (kg/m3) | Thermal Conductivity k (W/mK) | |
|---|---|---|---|---|---|
| Layer | |||||
| ETFE | 0.5 × 10⁻³ [27,29] | 1000 [30] | 1800 [30] | 0.24 [30] | |
| PV cell | 1 × 10⁻⁶ [27,29] | 677 [18,19,31] | 3200 [18,19,31] | 170 [18,31,32] | |
| Grid connection | 10 × 10−9 [27,29] | 460 [33] | 7900 [33] | 17 [33] | |
| PVDF | 2 × 10⁻³ [27,29] | 1120 [34] | 1800 [34] | 0.12 [34] | |
| Pine board | 25 × 10−3 | 1600 [33] | 450 [35] | 0.35 [35] | |
Table 3.
Calculated Rth and Cth values of PV PVL68 materials (layers) and roof components.
| Parameter | Rth | Cth | |
|---|---|---|---|
| Layer | (m2K/W) | (J/m2K) | |
| ETFE | 2.08 × 10⁻³ | 900 | |
| PV cell | 10 × 10−9 | 2.17 | |
| Grid connection | 0.1 × 10⁻⁹ | 3.6 × 10⁻³ | |
| PVDF | 16.66 × 10⁻³ | 4029.78 | |
| Pine board | 71.43 × 10⁻³ | 18,000 | |
Table 4.
Values of the heat transfer resistance on the surface and air layers, depending on the heat stream flow direction [36].
Table 4.
Values of the heat transfer resistance on the surface and air layers, depending on the heat stream flow direction [36].
| Heat Transfer Resistance (m2K/W) | Heat Stream Direction | ||
|---|---|---|---|
| Up | Horizontal * | Down | |
| Rsi | 0.10 | 0.13 | 0.17 |
| Rse | 0.04 | 0.04 | 0.04 |
* Values applying to the horizontal direction were used in case the direction of a heat stream was deflected by ±30° from the horizontal plane and when it was possible to change the heat stream direction.
Table 5.
Specifications of time constant values τRC of PV cells in a PVL68 roof tile working under different conditions as standalone and built-in versions, and values determined based on material data.
Table 5.
Specifications of time constant values τRC of PV cells in a PVL68 roof tile working under different conditions as standalone and built-in versions, and values determined based on material data.
| PV Cell in: | τRC (min) | ||||||
|---|---|---|---|---|---|---|---|
| Material Data | Forced Convection | Free Convection | |||||
| Test1 | Test2 | Test3 | Test1 | Test2 | Test3 | ||
| Standalone PV roof tile | 18.80 | 5.32 | 5.32 | 6.27 | 20.81 | 20.81 | 20.81 |
| Built-in PV roof tile | 99.43 | 23.80 | 23.76 | 28.25 | 95.58 | 95.76 | 95.49 |
test1: E = 1000 W/m2, νwind = 3 m/s, Tamb = 30 °C; test2: E = 600 W/m2, νwind = 3 m/s, Tamb = 30 °C; test3: E = 600 W/m2, νwind = 2 m/s, Tamb = 30 °C.
© 2019 by the authors. Licensee MDPI, Basel, Switzerland. This article is an open access article distributed under the terms and conditions of the Creative Commons Attribution (CC BY) license (http://creativecommons.org/licenses/by/4.0/).
Share and Cite
MDPI and ACS Style
Kurz, D.; Nawrowski, R. Thermal Time Constant of PV Roof Tiles Working under Different Conditions. Appl. Sci. 2019, 9, 1626. https://0-doi-org.brum.beds.ac.uk/10.3390/app9081626
AMA Style
Kurz D, Nawrowski R. Thermal Time Constant of PV Roof Tiles Working under Different Conditions. Applied Sciences. 2019; 9(8):1626. https://0-doi-org.brum.beds.ac.uk/10.3390/app9081626
Chicago/Turabian StyleKurz, Dariusz, and Ryszard Nawrowski. 2019. "Thermal Time Constant of PV Roof Tiles Working under Different Conditions" Applied Sciences 9, no. 8: 1626. https://0-doi-org.brum.beds.ac.uk/10.3390/app9081626
Note that from the first issue of 2016, this journal uses article numbers instead of page numbers. See further details here.