Edible Oils as Practical Phase Change Materials for Thermal Energy Storage


1
Department of Chemistry, Dalhousie University, Halifax, B3H 4R2, Canada
2
Clean Technologies Research Institute, Dalhousie University, Halifax, B3H 4R2, Canada
*
Author to whom correspondence should be addressed.
Appl. Sci. 2019, 9(8), 1627; https://0-doi-org.brum.beds.ac.uk/10.3390/app9081627
Submission received: 21 February 2019
/
Revised: 15 April 2019
/
Accepted: 17 April 2019
/
Published: 19 April 2019
(This article belongs to the Special Issue Advanced Applications of Phase Change Materials)
Abstract
:Featured Application
Passive thermal management of residential greenhouses.
Abstract
Edible oils could provide more accessible alternatives to other phase change materials (PCMs) for consumers who wish to build a thermal energy storage (TES) system with sustainable materials. Edible oils have good shelf life, can be acquired easily from local stores and can be less expensive than other PCMs. In this work, we explore whether margarine, vegetable shortening, and coconut oil are feasible PCMs, by investigations of their thermal properties and thermal stability. We found that margarine and vegetable shortening are not useful for TES due to their low latent heat of fusion, ΔfusH, and poor thermal stability. In contrast, coconut oil remained thermally stable after 200 melt-freeze cycles, and has a large ΔfusH of 105 ± 11 J g−1, a low degree of supercooling and a transition temperature, Tmpt = 24.5 ± 1.5 °C, that makes it very useful for TES in buildings. We also determined coconut oil’s heat capacity and thermal conductivity as functions of temperature and used the measured properties to evaluate the feasibility of coconut oil for thermal buffering and passive heating of a residential-scale greenhouse.
1. Introduction
Phase change materials (PCMs) provide high thermal energy storage density over a small temperature range, in comparison with sensible heat storage materials, such as water [1,2,3]. Among the different classes of PCMs [2], organic non-paraffin PCMs including fatty acids, esters, and alcohols, have many features that make them desirable for integration in latent-heat thermal energy storage (TES) systems operating near the ambient temperature range, i.e., 10–40 °C. These PCMs are particularly desirable for off-grid and renewable energy applications because the materials can be sustainable, non-toxic to the environment and abundant in nature [4,5,6,7,8,9]. They also can be integrated easily into building materials and residential structures to mitigate excessive temperature fluctuations, storing heat as they change phases, e.g., from solid to liquid [10,11,12,13]. The stored heat can be recovered later to warm the space when the temperature decreases below the solidification transition. Long-chain saturated fatty acids are naturally occurring PCMs, mainly extracted from renewable plant and animal sources such as tallow, coconut, palm kernel, and soybean oils [14,15,16]. A life-cycle assessment study of dodecanoic acid (aka lauric acid, [CH3(CH2)10COOH]) has shown [17] that the embodied energy associated with its production from palm kernel oil can be recouped in a matter of months.
Although fatty acid PCMs are non-toxic, food-grade chemicals, their availability is somewhat limited as acquisition of large quantities of fatty acids is through chemical suppliers, which could frustrate individual consumers wishing to build a TES system. Organic PCMs are available commercially in various encapsulated forms from many suppliers [18,19,20], but they are considerably more expensive than raw materials. Furthermore, a key limitation for pure, long-chain, saturated fatty acids as PCMs is that their transition temperatures are outside the 20–28 °C range that is typically required to mitigate temperature fluctuations in buildings. Eutectic mixtures composed of two or more fatty acids can achieve a transition in this temperature range, but add additional complications for an individual consumer [13,21,22].
Since many edible fats and oils from which fatty acids are derived can be purchased easily in large quantities from stores and wholesalers, they could potentially be used as practical PCMs for some TES applications. Or can they? Potential PCMs include margarines and shortening, which have good shelf life, but contain additives that have an unknown influence on their properties. Edible coconut oil is another possibility, due to its high content of saturated fat, up to 92% [14,15,23,24,25,26]. Coconut oil products labeled as virgin coconut oil and refined coconut oil are commonly found in the marketplace, where the difference is in the oil extraction method from the flesh of the coconut fruit [24,25]. Both have relatively good shelf life: 2 years for refined coconut oil and 5 years or more for virgin coconut oil (virgin coconut oil contains more anti-oxidants than refined coconut oil and some manufacturers state that it has an indefinite shelf life), which can even be much longer if coconut oil is stored in well-sealed opaque containers to reduce photodegradation and oxidation [27,28].
There are no reports assessing margarine and shortening as potential PCMs in terms of their thermal properties and their thermal stabilities, and only a few studies reporting the thermal properties of coconut oil and its application as a PCM for TES [25,26,29,30,31,32,33,34,35]. The latter showed that coconut oil could be useful for TES in buildings, given that its transition temperature is between 22 and 27 °C [25,26,30,31,32,33]. In particular, coconut oil can buffer the temperature of a room in tropical climates [32] and can prevent overheating of passenger vehicles [30]. Coconut oil also has been mixed with paraffin [36] and fatty acid [37] PCMs to prepare form-stable composite PCMs for TES in buildings. However, the coconut oil PCM studies reported a wide range of values for the latent heat of fusion, ΔfusH, and for the specific heat capacity. For instance, the specific heat capacities and ΔfusH measured by the T-history method [29] had large uncertainties, with a reported value of ΔfusH of 249 J g−1, significantly higher than ΔfusH of 103 J g−1 determined by differential scanning calorimetry (DSC) [33,34]. Furthermore, important properties such as the accurate thermal conductivity of both the solid and liquid phases, the degree of supercooling and information on the thermal stability after several melt-freeze cycles have not been reported for coconut oil. Such information is necessary to evaluate the economic viability and to model the effectiveness of coconut oil as a PCM, as well as to optimize the quantity needed and placement within the space.
In the present work, we accurately determined the thermal properties and thermal stability of coconut oil and blended oils products, namely margarine and shortening, to explore whether these edible oil products could be useful PCMs for residential applications. As an illustration, we investigated if these easily accessible and relatively inexpensive products can be integrated by a consumer as TES materials in a residential greenhouse or a garden shed to buffer temperature changes. We determined the thermal properties (latent heat of fusion, ΔfusH, and the melting temperature, Tmpt) and the thermal stabilities after many melt-freeze cycles of two brands of margarine (with different amounts of oil blends in their composition), vegetable shortening, and of both virgin and refined coconut oil. On the basis of the thermal results and cost, we selected refined coconut oil for further thermal characterization: we measured the heat capacity and thermal conductivity as functions of temperature, and degree of supercooling from heating and cooling curves of bulk samples. The measured thermal properties were then used to evaluate coconut oil as a potential PCM for passive heating and cooling of a typical residential greenhouse. We compared coconut oil to water and fatty acid PCMs, in terms of quantity of materials and cost, and also compared coconut oil’s cost with the cost of electric heat for the greenhouse during cold nights.
2. Materials and Methods
2.1. Materials
Five consumer-available edible fats and oils were tested as possible PCMs in this study. The fats and oils include two margarine products (two different brand names), one vegetable shortening and two types of coconut oil (100% virgin coconut oil and refined coconut oil). These products are available worldwide and can be purchased from retailers or food supply wholesalers (see Figure S1 in Supplementary Materials). Table 1 lists the products tested, their main compositions as listed on their labels and the average retail price in the North American market. All products were used “as is” without further treatment. The product referred to as 100% virgin coconut oil had been extracted from fresh coconuts through a process known as “wet milling” with minimal processing and no chemical or heat treatment during the production process. The refined coconut oil product had been produced through a “dry milling” process where the oil was extracted from baked coconuts and then bleached to remove microbes [24,38,39].
Refined coconut oil, which is normally marked as “coconut oil” on the product label, has a shorter shelf life than virgin coconut oil due to the presence of anti-oxidants in virgin coconut oil. Refined coconut oil is less expensive than virgin coconut oil (see Table 1), likely due to the higher yields of oil from the dry milling process. The two margarine products tested were composed mainly of vegetable-derived oils, with a small difference in the amount of non-hydrogenated oil blend in their compositions: 68% for Parkay® margarine versus 60% for Imperial® margarine (Figure S1 in Supplementary Materials). Both margarine products contain milk products and water (12% water for Parkay®, unspecified amount for Imperial®) among other additives. The vegetable shortening (Crisco® brand) tested in this work was composed of vegetable-derived oils and oil blends (including hydrogenated palm oil) with no water or milk products (Figure S1 in Supplementary Materials).
2.2. Experimental Methods
The melting temperatures, Tmpt, and latent heats of fusion, ΔfusH, of the edible oils were determined with a TA Instruments Q200 differential scanning calorimeter (DSC, TA Instruments, New Castle, DE, USA). Analysis of DSC data was performed using Universal Analysis 2000 computer software (version 4.5A, TA Instruments–Waters LLC 1998-2007, New Castle, DE, USA). The DSC was calibrated prior to each set of experiments by measuring ΔfusH and Tmpt of a high-purity indium standard (ΔfusH = 28.71 J g−1 and Tmpt = 156.6 °C [40]). For each DSC measurement, a sample of mass between 10 and 15 mg was hermetically sealed in a standard DSC aluminum pan and measured in a He gas atmosphere, at a gas flow rate of 25 mL min−1. The latent heat of fusion was determined from measurements performed at heating rates of 10 K/min and the melting temperature was determined from measurements at rates of 2 K/min, as recommended for high accuracy [41]. Typical uncertainties for this DSC system are ± 10 % for ΔfusH and ± 1.5 °C for Tmpt and at least 3 samples from each PCM were measured, and their values of ΔfusH and Tmpt were within these uncertainties.
The melting temperature of a material from a DSC experiment corresponds to the onset of the melting peak, Tonset [41]. However, due to the large number of components in the edible oils which broaden melting, the onset of melting was not well defined. For all samples here, the peak temperature will be reported as Tmpt, as is conventional for a blend PCM [42]. Moreover, it is important to note that the melting and crystallization behavior of fats and oils can be complex, with a strong dependence on the heating rate and maximum heating temperature [26]. However, our DSC measurements and analysis focused on the determination of ΔfusH and Tmpt from experimental conditions as close as possible to real-life solar thermal applications.
The stabilities of ΔfusH and Tmpt of virgin coconut oil (V-CNO) and refined coconut oil (R-CNO) after repeated melt-freeze cycles were determined from cycling experiments conducted on bulk samples. About 3 g of each type of coconut oil was placed in a screw-cap glass vial and heated in an oven to 50 °C until melted and then cooled to 0 °C in an ice-water bath until solidified. No attempt was made to exclude air from contact with the samples. In total, 200 melt-freeze cycles were carried out for each type of coconut oil, where one cycle consisted of a heating step from 0 to 50 °C (completely liquid) followed immediately by a cooling step from 50 to 0 °C (completely solid). Samples were kept at 0 °C for about 10 minutes before the next heating step started. During the thermal cycling, aliquots were taken for DSC determination of Tmpt and ΔfusH as a function of number of melt-freeze cycles.
We also used the DSC to measure the heat capacity at constant pressure as a function of temperature, Cp(T), of R-CNO. The solid (Cp,s) and liquid (Cp,l) phases heat capacities were determined following the procedures for Cp(T) measurement by DSC outlined in ASTM Standard E1269-11 [43] and the method of ref. [13]. The estimated uncertainty in Cp(T) measured with this DSC method is ± 10 % [13].
In addition to the DSC measurements, the solidification temperature and the degree of supercooling also were determined for R-CNO from temperature-versus-time cooling curves collected for a bulk (15 mL) sample. A simple bench-top experiment was designed to investigate the behavior of a bulk R-CNO in a situation that mimics its potential application as a PCM for TES. The experimental setup consisted of a temperature probe (thermistor) connected to a custom data logger used to record the temperature of the sample of R-CNO inside a test tube (see Figure S2 in Supplementary Materials). Another thermometer placed outside the test tube measured the temperature of the room close to the sample. The sample was first heated, by blowing hot air on the test tube, from room temperature (ca. 22 °C), at which R-CNO was in its equilibrium solid state, to temperatures between 40 and 50 °C. The sample was constantly stirred as it melted during heating. When the sample reached the maximum temperature and was completely melted, heating was stopped and the sample was allowed to cool (with stirring until no longer possible due to the solidified sample), and its temperature was recorded as a function of time using the probe. Cooling curves were recorded from two different sample cooling methods: in the first method, the sample was left to cool with no intervention, while for the second method cold air with a temperature close to 10 °C was blown on the test tube.
We also determined the thermal conductivity (κ) of R-CNO using the thermal transport option (TTO) of a Quantum Design Physical Property Measurement System (PPMS, Quantum Design Inc., San Diego, CA, USA) and a custom-designed fluid cell, similar to the cells described elsewhere [13,44]. The PPMs results gave the thermal conductance, K, of a ~50 µL sample of R-CNO, and the thermal conductivity, κ, was calculated from K and the known dimensions of the sample [13,44]. The thermal conductivities in both the solid phase, κs, and the liquid phase, κl, were measured in the temperature range −10 to 45 °C, i.e., through the solid-liquid phase transition of R-CNO. We estimate the uncertainties in the measured values of the thermal conductivities to be within 15% at room temperature [13,44].
3. Results and Discussion
3.1. Thermal Properties of Margarine and Shortening
The DSC thermograms of margarine samples M1 and M2 measured at a heating (and cooling) rate of 10 K/min are shown in Figure 1. The melting behavior of both margarine samples changed after the first cycle: there was a clear shift in the position and in the amplitude of the main endothermic (melting) peaks and additional endothermic and exothermic peaks appeared in the subsequent melting cycles (Figure 1a,b). There were no significant changes in the solidification curves of different cycles of the two samples, with one major exothermic peak remaining nearly the same for each cooling cycle. However, the cooling exotherms show that margarine supercooled by about 10 K, as determined from the estimated melting and solidification onset temperatures of the first cycle. For margarine samples, we note that it was not possible to accurately determine the melting and solidification temperatures from the DSC measurements performed at the rate of 2 K/min due to the emergence of multiple peaks around and within the main endothermic peak (see Figure S3 in Supplementary Materials). Therefore, we approximated the melting and solidification temperatures from the DSC thermograms measured at 10 K/min. For sample M1 (Parkay® margarine), the peak temperature of melting was 35.5 ± 1.5 °C and the latent heat of fusion was ΔfusH = 8 ± 1 J g−1, as determined from the heating curve from cycle 1. Upon cooling, sample M1 solidified with a peak temperature of 12.5 ± 1.5 °C. Sample M2 had a peak melting temperature at 33.0 ± 1.5 °C and a latent heat of fusion of ΔfusH = 7 ± 1 J g−1 (determined from first cycle). For both margarine samples, the small latent heats of solidification determined from the exothermic peaks (~4 J g−1 for M1 and ~2 J g−1 for M2) indicate that margarine is only partially solidified upon cooling. The appearance of extra peaks, especially after the first melt, likely results from the thermal response of the different oils in the blend and other additives that are present in margarine (see Table 1). This change in the thermal behavior and, most importantly, the small values of ΔfusH for both margarine samples, indicate that margarine is not useful as a PCM for TES applications.
The DSC thermograms of the vegetable shortening (VS) sample are shown in Figure 2. The melting temperature determined from the peak (Figure S4 in Supplementary Materials, measured at 2 K/min) is Tmpt = 44.7 ± 1.5 °C. Compared with margarine, the vegetable shortening was more stable after the first melt. Figure 2 shows that there is no major shift in the endothermic peak and no additional endothermic peaks appeared in the second heating cycle. The only change is a small exothermic peak that appears just before the melting starts around 25 °C. The appearance of the exothermic peak upon heating can be explained by a sudden crystallization which is likely dependent on the thermal history of the sample: when the same sample was measured again after being left for one day at room temperature, the exothermic peak was absent from the first heating cycle. The absence of additional endothermic peaks is not surprising since, unlike margarine, shortening is mostly composed of a blend of oils without much water or milk products, or other additives found in margarine. However, similar to margarine, VS has only a small latent heat of fusion, ΔfusH = 12 ± 1 J g−1, as determined from the average of four melt-freeze cycles measured at 10 K/min (Figure 2). Although VS has better thermal stability than margarine, its small ΔfusH indicates that it is not useful for thermal energy storage.
3.2. Thermal Properties of Coconut Oil
The melting/solidification properties of refined (R-CNO) and virgin (V-CNO) coconut oil samples that had undergone up to 200 melt-freeze cycles were determined by DSC. The DSC thermograms after 1, 5, 100, and 200 thermal cycles (Figure 3a,b) showed no significant change in the thermal behavior of either type of coconut oil after the initial melt (Cycle 1) and up to 200 melt-freeze cycles. Note that, when a given sample or an aliquot of a cycled bulk sample of R-CNO and V-CNO was cycled in the DSC (i.e., multiple heating-cooling curves measurements), the thermal behavior of that sample always changed slightly after the first DSC melt (see Figure 3c). The first melting curve for each sample showed a broad endotherm, composed of a major peak and a shoulder peak, extending from −7 to 32 °C for R-CNO and from 5 to 32 °C for V-CNO (black curves in Figure 3a,b, respectively), as also observed by others in DSC studies [25,26]. In the subsequent DSC melting curves of the same sample or aliquot, the two peaks merge into one endothermic peak. Similar results were obtained for samples measured at a slower rate of 2 K/min (Figure S5a,b in Supplementary Materials). Figure 3a,b show that for both types of coconut oil, the endothermic peaks of Cycle 100 and Cycle 200 overlap, but they are slightly narrower than the endothermic peak of Cycle 5. There were no significant shifts in the peak temperature or in the onset temperature after 200 thermal cycles. For the exothermic peaks (cooling curves), the shapes of the peaks were noticeably different for all three cycles shown in Figure 3. However, there were no significant shifts in the onset, offset and peak solidification temperatures after 200 cycles. The differences between the endothermic peaks for different cycles gave rise to a small decrease in ΔfusH and a small shift in Tmpt for both types of coconut oil. However, over the 200 melt-freeze cycles, these changes remained within the uncertainties of the measurements: for R-CNO, ΔfusH determined from the first cycle was 127 ± 13 J g−1 and the average ΔfusH (determined from 20 heating curves of the same sample) was 105 ± 11 J g−1. After 200 cycles, ΔfusH of R-CNO was 94 ± 9 J g−1. For V-CNO, ΔfusH determined from the first cycle was 110 ± 11 J g−1 and the average (from 20 heating curves) was 106 ± 11 J g−1. After 200 cycles, ΔfusH of V-CNO was 93 ± 9 J g−1. The values agree well with most literature values of ΔfusH determined by DSC in other studies (Table 2). (The exception is the report from reference [25], for which no DSC calibration information was provided. The value from reference [29] also is an outlier but is from T-history measurements which do not give accurate values of ΔfusH.) The melting temperatures determined from the DSC measurements at 2 K/min (Figure S5a,b in Supplementary Materials, Cycle 2, peak temperatures) are Tmpt = 24.4 ± 1.5 °C for R-CNO and Tmpt = 24.0 ± 1.5 °C for V-CNO. After 200 melt-freeze cycles, Tmpt was 24.0 ± 1.5 °C for R-CNO and 23.9 ± 1.5 °C for V-CNO. The peak melting temperatures were slightly different for the first cycle but remain virtually the same for the subsequent cycles. The values of ΔfusH and Tmpt and their variations as a function of cycle number are shown in Figure 4. (Note that, for the sake of comparison, Tmpt values in Figure 4 were determined from the cycling thermograms at 10 K/min.) There was no significant difference between the average value of Tmpt determined from 20 heating curves at 10 K/min and the values determined at 2 K/min, and all values are within the uncertainty of Tmpt (± 1.5 °C) and in good agreement with the peak melting temperatures reported for coconut oil in the literature [25,26,31,32,33,36]. Table 2 lists the values of ΔfusH and Tmpt of coconut oil determined in the present work and values reported in the literature.
The DSC results for R-CNO and V-CNO show that coconut oil is potentially suitable as a PCM for thermal energy storage given its large latent heat of fusion (≥100 J g−1) and its thermal stability after 200 melt-freeze cycles, contrasting with the results for margarine and shortening. The coconut oil results are not surprising given that, unlike margarine and vegetable shortening, coconut oil is not a blend of oils with other additives. Coconut oil consists mostly of fatty acids, dominated by 47%–51% dodecanoic acid (aka lauric acid, [CH3(CH2)10COOH]) [14,15,23], which are all very good PCMs [44,45]. It is important to note that, of the pure saturated unbranched fatty acids, there are none with melting temperatures between 17 and 28 °C, and often eutectic mixtures of two or more fatty acids are prepared in order to obtain a PCM with Tmpt within this range [13,21,22,44,45]. This temperature range is particularly useful for thermal energy storage applications in buildings [3,12,46,47,48]. Conveniently, the melting point of coconut oil (24.5 °C) falls within this temperature range.
The DSC results showed that there are only slight differences between the thermal properties of refined and virgin coconut oil: although there was an observable difference for their solidification behavior, their melting was almost the same, even after 200 thermal cycles (Figure 5). Therefore, in this work, we focus on further characterization of refined coconut oil because its retail cost is about half that of virgin coconut oil (Table 1), although the difference in price is less for bulk quantities and as commodities. Moreover, compared to V-CNO which has a strong coconut odor, especially when heated above its melting point, molten R-CNO has only a very subtle coconut odor.
The cooling curves of Figure 3a and Figure S5 in Supplementary Materials show that R-CNO supercools in the DSC, with a significant difference between the peak melting and the peak solidification temperatures, up to 19 K for the sample measured at a rate of 10 K/min (Figure 3a). This difference became less (~10 K) when the sample was cooled at a slower rate (i.e., 0.5 K/min, Figure S5c,d in Supplementary Materials) or when comparing the onset of the melting with the onset of the solidification temperatures. Nevertheless, the supercooling measured by DSC is significant and could be detrimental for R-CNO as a TES material given that the enthalpy stored upon melting at 24.5 °C would not be fully recovered at these cooling rates with this sample size unless R-CNO was cooled to below 10 °C.
However, supercooling can be influenced by sample size, so to further investigate the supercooling of R-CNO, we measured the heating and cooling curve of a large sample (15 mL) of R-CNO as described in Section 2.2. Prior to these measurements, we melted (by hot air) and solidified (by cold water bath) the sample of R-CNO a total of 10 times.
For the heating curve measurement, the sample was heated from 18 to 28 °C and the range of the solid-liquid transition was determined by visual inspection (appearance of liquid in the test tube) and from changes in the slope of the temperature-versus-time curve (Figure S6 in Supplementary Materials). For the cooling curve measurement, the solid sample was heated from its equilibrium temperature (room temperature, ~ 21.5 °C) to 40 °C by hot air and then left to cool by ambient air (Figure 6). The temperature-versus-time curve measured on heating (Figure S6 in Supplementary Materials) showed that the melting temperature range of the 15 mL R-CNO sample was 21–27 °C. The sample started to melt as its temperature reached ~21 °C, as recorded by the probe placed at the middle of the sample (the ambient temperature measured close to the sample was 28 °C). When the temperature of R-CNO reached 24.7 °C, all the sample had melted and appeared as viscous, opaque liquid. At T = 27.2 °C, the melted R-CNO sample became a transparent liquid. This melting point range agrees well with the DSC results (Figure S5a–c in Supplementary Materials), indicating that melting is not so prone to sample size influence.
The cooling curve of the R-CNO sample (Figure 6) showed that the temperature decreased to ~22.5 °C then increased to 23.4 °C. This increase in temperature started as the liquid sample became more opaque and viscous, indicating the start of the solidification, with corresponding exothermicity and increase in temperature. When the temperature of the sample decreased again to 22.5 °C, the sample was completely transformed to a soft, white solid (Figure S7 in Supplementary Materials).
In contrast to the DSC results for a ~10 mg sample size, the cooling curve shows that the bulk sample of R-CNO exhibited little supercooling, around 0.9 K as measured from the exothermic peak of the inset of Figure 6. A similar value for supercooling was obtained when the same sample was cooled by blowing cold (10 °C) air on the test tube containing the sample. The solidification of coconut oil is strongly dependent on the cooling rate, as evident from the DSC results at 0.5, 2, and 10 K/min (Figure S5d in Supplementary Materials), with slower cooling giving less supercooling. Most importantly, the bench-top experiment results with 15 mL samples showed that the melting and solidification temperature ranges of coconut oil overlap and that, even when the room temperature was not below 21 °C, liquid coconut oil left to cool down at room temperature solidified after a matter of hours, fully releasing its stored enthalpy of fusion.
In addition to the melting temperature and latent heat of fusion, accurate data concerning the heat capacity and thermal conductivity of a PCM are important, especially when performing feasibility studies and numerical simulations for a PCM-based thermal energy storage system. The heat capacity as a function of temperature of R-CNO was measured by DSC between 0 and 50 °C, for both the solid, Cp,s(T), and liquid, Cp,l(T), phases (Figure 7a). For the solid coconut oil, Cp,s varies between 1.6 and 1.7 J K−1 g−1 and in the liquid phase, Cp,l is almost temperature-independent at 2.2 J K−1 g−1. The values of the heat capacities for the solid and liquid phases are similar to results for fatty acid PCMs determined with the same technique [44]. We also measured the thermal conductivity of R-CNO as a function of temperature, κ(T), in the temperature range −10 to 50 °C. As shown in Figure 7b, the thermal conductivities of both the solid and liquid phases are low, 0.19 ± 0.03 W K−1 m−1 for solid R-CNO and slightly less, 0.17 ± 0.03 W K−1 m−1, for the liquid phase. As for other organic PCMs, the thermal conductivity of coconut oil is low and does not have a strong temperature dependence within the range measured here.
3.3. Thermal Energy Storage with Coconut Oil in a Residential Greenhouse
The thermal properties and thermal behavior after several melt-freeze cycles of the five measured edible oils (Table 3) showed that coconut oil is the most suitable among the materials considered as an off-the-shelf PCM for a consumer-designed thermal energy storage system. One potential application of coconut oil as PCM is utilization inside a residential greenhouse or inside a garden shed, to buffer temperature changes. Melting of the PCM can store excess heat inside these structures during hot summer days, to be released at night, when the temperature drops and the PCM solidifies. The phase transition temperature of R-CNO makes it an ideal PCM for such applications in many parts of the world, such as the Canadian summer climate, where a diurnal temperature swing between 10 °C at night and 30 °C during the day can be typical.
We explored the feasibility of using R-CNO as thermal energy storage medium in a greenhouse by estimating the quantity of PCM needed to cool a typical residential greenhouse and by comparing R-CNO to using other PCMs, and also to tanks of water as a sensible heat storage medium. Residential greenhouses of various sizes can be purchased as ready-to-assemble kits from several companies [20,49,50]. Moreover, commercial PCM products designed for greenhouses also are available [20]. Here, we consider a typical residential greenhouse with dimensions of 12 ft. × 10 ft. and with a height of 10 ft. (approximated to: 3.65 m × 3 m × 3 m, see Figure S8 in Supplementary Materials). Since we are interested in a comparative estimation, that is between latent heat TES versus sensible heat storage with water, our calculations for the amount of PCM needed follow a simple static heat transfer model [51]. We do not account for heat losses, heat generated from plants and soil, humidity level of the air inside the greenhouse, variations in solar radiation and other factors that influence the heat load. More complex models and numerical simulations considering all of these factors and their influence on heat storage in greenhouses and residential buildings containing PCMs are available in the literature [52,53,54,55,56]. Note that the CNO PCM is only feasible and cost effective if it remains stable for several years, but the shelf life could be extended by adding stabilizing agents and/or by use in sealed metal tubes. Encapsulation in sealed metal tubes would help with heat transfer and also prevent photodegradation and oxidation of the PCM, and keep parasites away from the CNO [27,28].
In our simple calculations, we consider that the temperature outside the greenhouse changes from 30 °C during the day to 10 °C during the night. Assuming that it is desirable to maintain the temperature inside the greenhouse at 20 °C, the difference in temperature between the outside and inside is ΔT = 10 K, both during the day and during the night. We also consider that the heat load, QHL, inside the greenhouse during the day is similar to the heat load needed at night to maintain the inside temperature at 20 °C. The total heat load, QHL, calculated from the heat transfer equation in this simplified model is given by [51]:
where Ac is the total surface area of the greenhouse cover, u is the heat transfer coefficient, and D is the total duration of heating. For a greenhouse with a twin-wall polycarbonate panels [50], we take u ≈ 3.3 W m−2 K−1 [51]. We also consider that the duration of heating is D = 10 h. The total surface area of the polycarbonate cover calculated from the dimensions of the greenhouse under consideration (Figure S8 in Supplementary Materials) is Ac ≅ 60 m2. Therefore, for ΔT = 10 K, the calculated total heat load is QHL = 71.3 MJ. The total heat stored in 1 kg of R-CNO on melting, QR-CNO, is the sum of the sensible heat and latent heat of fusion ΔfusH = 105 kJ/kg (Table 3). If the temperature inside the green house increases during the day from T1 = 20 °C to T2 = 30 °C, QR-CNO is calculated from:
where Tmpt = 24.5 °C, the heat capacity of solid R-CNO is Cp,s = 1.7 kJ K−1 kg−1 and that of the liquid is Cp,l = 2.2 kJ K−1 kg−1, as determined above. (The actual temperature rise should be less, due to the mitigation of the PCM, but note that the dominant term in Equation (2) is due to the enthalpy of fusion.) Therefore, for 1 kg of R-CNO QR-CNO ≅ 125 kJ. Within the same temperature range, 20 to 30 °C, 1 kg of water stores sensible heat only (no phase transition in this range) with a value of Qwater ≅ 42 kJ [57]. Given the calculated value of QR-CNO, the total mass of R-CNO required to store thermal energy equivalent to QHL (71.3 MJ) is 570 kg which is equivalent to a volume of 630 L (considering the density of coconut oil is 0.90 kg/L [58]). For water, the total mass required is 1700 kg (~ 1700 L), almost three times that for R-CNO. Considering the size of the greenhouse, it is not difficult to store the 630 L of R-CNO: if this volume is filled in pipes of 10 cm diameter extending along the length of the greenhouse (3.65 m), in total ca. 25 pipes are needed and all could be stacked on one wall. For this design, it is possible to estimate the total heat transfer from the PCM contained in such pipes to check if all the PCM mass discharges (solidifies) during the night. Considering a heat transfer coefficient u ≈ 5.9 W m−2 K−1 (for low air convection) and given the total surface area of the 25 pipes (3.65 m length, 0.1 m diameter, A ≅ 29 m2), the heat transferred through the PCM pipes for ΔT = 10 K and during 10 h is QHT ≅ 62 MJ (Equation (1)). This heat transfer value indicates that ca. 90% of the PCM solidifies during the night. The PCM containers and their location in the greenhouse could be designed to optimize the heat transfer and the storage and recovery of thermal energy, but this is not within the scope of the present study. Overall, our calculations show that the incorporation of coconut oil in a residential greenhouse to mitigate excessive heat during the day and warm the air during cold nights is feasible. A large volume, ~ 600 L, of R-CNO would be needed for a typical (12 ft. × 10 ft. × 10 ft.) greenhouse, but this volume is approximately three times less than a volume of water that would store the same amount of thermal energy, making CNO much more convenient in terms of space.
In terms of cost, we compare using 630 L of R-CNO as a passive heating and cooling system with two alternatives: using fatty acid PCM from a chemical supplier, and operating an electrical heater to heat the greenhouse during cold nights. (We neglect cooling costs for the latter as we assume that cooling can be done through ventilation from openings in the greenhouse.) The retail cost of refined coconut oil is ~ US$ 6/L (Table 1) but bulk quantities of R-CNO and V-CNO can be had at US$ 2.3/L and US$ 5.8/L, respectively [59] (the commodity cost of coconut oil is even lower, ca. US$ 0.8/L [60]). The total cost for 630 L (at US$ 2.3/L) is ~ US$ 1,500.
An unbranched, saturated fatty acid PCM with Tmpt close to that of R-CNO, 24.5 °C, does not exist [21,22] but a binary eutectic mixture composed of 78 mass% decanoic acid (aka capric acid, [CH3(CH2)8COOH]) and 22 mass% tetradecanoic acid (aka myristic acid, [CH3(CH2)12COOH]) has a peak melting temperature around 24 °C and a ΔfusH of 153 kJ kg−1 [13,22]. A total volume of 533 L of this mixture is needed to store 71.3 MJ. If purchased in kg quantities from a chemical supply company (e.g., Sigma-Aldrich), the total cost of this eutectic mixture PCM is ~ US$ 8,400 (the cost of chemicals needed to prepare 1 kg of the eutectic mixture is US$ 18, the eutectic mixture density is 0.874 kg/L [13]), which is almost six times the cost of coconut oil PCM.
To compare with electric energy cost, we assume that heat is used during the night to provide 71.3 MJ, which is equivalent to 20 kWh per day. At a cost rate of US$ 0.1/kWh, the electric energy cost is US$ 60/month. Therefore, it would take 25 months of operation to recoup the cost of coconut oil, in place of electrical heating, which could correspond to a few years duration, given that the greenhouse thermal buffering would likely only be used for a fraction of the year. Note that if coconut oil can be purchased at the commodity price of US$ 0.8/L, then the total recoup time, compared with electrical heating, would be much shorter.
Although water is the most cost-effective option for thermal energy storage in such a greenhouse, coconut oil PCM provides a more compact thermal energy storage solution and can have a significant advantage if space is limited, opening new possibilities for greenhouse use where they otherwise might be impractical. Moreover, as a bio-based PCM, coconut oil provides a much larger thermal energy storage capacity than, for example, the animal fat-based bio-PCM (ΔfusH = 28.94 J g−1 ) reported recently [61].
4. Conclusions
In this work, we investigated the possibility of using edible oils as PCMs for thermal energy storage in residential applications. We measured the thermal properties of margarine and shortening, both composed mostly of a blend of vegetable oils, and the thermal properties of refined and virgin coconut oil.
The results showed that, despite their long shelf lives, margarine and shortening are not useful as PCMs due to their small latent heats of fusion, ΔfusH, and lack of thermal stability as deduced from the changes in their thermal behaviors after the first melt-freeze cycle.
On the other hand, coconut oil has a relatively large ΔfusH, 105 ± 11 J g−1, and is thermally stable over at least 200 melt-freeze cycle. The melting temperature of coconut oil determined from the peak melting temperature is Tmpt = 24.5 ± 1.5 °C, which is ideal for thermal buffering of buildings. There was no significant difference between the melting properties of refined (R-CNO) and virgin (V-CNO) coconut oil. Further measurements were performed on R-CNO to determine its heat capacity in the solid phase (Cp,s = 1.6 ± 0.2 J K−1 g−1) and in the liquid phase (Cp,l = 2.2 ± 0.2 J K−1 g−1), along with its thermal conductivity in both the solid (κs = 0.19 ± 0.03 W K−1 m−1 ) and liquid (κl = 0.17 ± 0.03 W K−1 m−1 ) phases.
The DSC thermograms showed that a few-mg sample of coconut oil supercools by up to ~20 K when the melt is cooled at 10 K/min and supercooling decreases as the cooling rate decreases. Following this observation, a bench-top setup was used to measure the temperature versus time curve of a 15 mL previously heated and melted R-CNO sample as it was left to cool at room temperature. The temperature-versus-time curve showed that R-CNO supercools by 0.9 K and solidifies in about 2 h after the cooling starts at a room temperature of 21.5 °C. These experiments and the DSC results demonstrated that during slow cooling, bulk coconut oil can solidify at a temperature above 20 °C.
The measured thermal properties of R-CNO were used to calculate the amount of coconut oil needed to store heat and maintain the temperature inside a residential greenhouse at 20 °C. Using a simple heat load model, we found that a volume of 630 L of R-CNO is needed to store 71.3 MJ of thermal energy. This is only ~1/3 the volume of water required to store the same amount of energy as sensible heat. While coconut oil offers a more compact thermal energy storage solution, which is an important consideration for small spaces like a greenhouse, the current retail price of coconut oil does not make it useful based on cost alone, when compared to water. However, coconut oil PCM is less expensive compared with other energy-dense phase-change materials such as fatty acids and commercially available greenhouse PCM products. Compared to electrical energy cost for a heater heating the greenhouse, coconut oil is more cost effective if it maintains its thermal and chemical stability for more than 2 years.
Supplementary Materials
The following are available online at https://0-www-mdpi-com.brum.beds.ac.uk/2076-3417/9/8/1627/s1: Figure S1: Edible oils studied; Figure S2: Bench-top setup for bulk heating/cooling curves; Figure S3: DSC curve for margarine M2 at 2 K/min; Figure S4: DSC curves for vegetable shortening at 2 K/min; Figure S5: DSC curves for coconut oil (refined and virgin) at 0.5 and 2 K/min; Figure S6: Heating curve for melting of refined coconut oil; Figure S7: Photos of refined coconut oil during melting; and Figure S8: Schematic diagram of domestic greenhouse used for calculations.
Author Contributions
Conceptualization, M.A.W.; methodology, S.K. and M.A.W.; software, S.K.; formal analysis, S.K. and M.A.W.; investigation, S.K. and M.A.W.; writing—original draft preparation, S.K.; writing—review and editing, S.K. and M.A.W.; visualization, S.K. and M.A.W.; supervision, M.A.W.; project administration, M.A.W.; funding acquisition, M.A.W.
Funding
This research was funded by NSERC Canada, grant number RGPIN-2015-04593.
Acknowledgments
The authors thank G. Aleman for loan of apparatus to measure temperature-time curves for bulk samples, M. Johnson for assistance, and the Clean Technologies Research Institute for use of facilities.
Conflicts of Interest
The authors declare no conflict of interest.
References
- Noël, J.A.; Kahwaji, S.; Degrosseilliers, L.; Groulx, D.; White, M.A. Phase Change Materials. In Storing Energy: With Special Reference to Renewable Energy Sources; Letcher, T.M., Ed.; Elsevier: Amsterdam, The Netherlands, 2016; pp. 249–272. ISBN 9780128034408. [Google Scholar]
- Sharma, A.; Tyagi, V.V.; Chen, C.R.; Buddhi, D. Review on thermal energy storage with phase change materials and applications. Renew. Sustain. Energy Rev. 2009, 13, 318–345. [Google Scholar] [CrossRef]
- Mehling, H.; Cabeza, L. Heat and Cold Storage with PCM; Springer: Berlin/Heidelberg, Germany, 2008; ISBN 9783540685562. [Google Scholar]
- Suppes, G.J.J.; Goff, M.J.J.; Lopes, S. Latent heat characteristics of fatty acid derivatives pursuant phase change material applications. Chem. Eng. Sci. 2003, 58, 1751–1763. [Google Scholar] [CrossRef]
- Rozanna, D.; Chuah, T.G.; Salmiah, A.; Choong, T.S.Y.; Sa’ari, M. Fatty Acids as Phase Change Materials (PCMs) for Thermal Energy Storage: A Review. Int. J. Green Energy 2005, 1, 495–513. [Google Scholar] [CrossRef]
- Yuan, Y.; Zhang, N.; Tao, W.; Cao, X.; He, Y. Fatty acids as phase change materials: A review. Renew. Sustain. Energy Rev. 2014, 29, 482–498. [Google Scholar] [CrossRef]
- Nikolić, R.; Marinović-Cincović, M.; Gadžurić, S.; Zsigrai, I. New materials for solar thermal storage—Solid/liquid transitions in fatty acid esters. Sol. Energy Mater. Sol. Cells 2003, 79, 285–292. [Google Scholar] [CrossRef]
- Feldman, D.; Banu, D.; Hawes, D. Low chain esters of stearic acid as phase change materials for thermal energy storage in buildings. Sol. Energy Mater. Sol. Cells 1995, 36, 311–322. [Google Scholar] [CrossRef]
- Alper Aydin, A. High-chain fatty acid esters of 1-octadecanol as novel organic phase change materials and mathematical correlations for estimating the thermal properties of higher fatty acid esters’ homologous series. Sol. Energy Mater. Sol. Cells 2013, 113, 44–51. [Google Scholar] [CrossRef]
- Peippo, K.; Kauranen, P.; Lund, P.D. A multicomponent PCM wall optimized for passive solar heating. Energy Build. 1991, 17, 259–270. [Google Scholar] [CrossRef]
- Feldman, D.; Banu, D.; Hawes, D.W. Development and application of organic phase change mixtures in thermal storage gypsum wallboard. Sol. Energy Mater. Sol. Cells 1995, 36, 147–157. [Google Scholar] [CrossRef]
- Cabeza, L.F.; Castell, A.; Barreneche, C.; de Gracia, A.; Fernández, A.I. Materials used as PCM in thermal energy storage in buildings: A review. Renew. Sustain. Energy Rev. 2011, 15, 1675–1695. [Google Scholar] [CrossRef]
- Kahwaji, S.; Johnson, M.B.; Kheirabadi, A.C.; Groulx, D.; White, M.A. Stable, low-cost phase change material for building applications: The eutectic mixture of decanoic acid and tetradecanoic acid. Appl. Energy 2016, 168, 457–464. [Google Scholar] [CrossRef]
- Gervajio, G.C. Fatty Acids and Derivatives from Coconut Oil. In Bailey’s Industrial Oil and Fat Products; John Wiley & Sons, Inc.: Hoboken, NJ, USA, 2005; ISBN 9780471678496. [Google Scholar]
- Orsavova, J.; Misurcova, L.; Vavra Ambrozova, J.; Vicha, R.; Mlcek, J. Fatty acids composition of vegetable oils and its contribution to dietary energy intake and dependence of cardiovascular mortality on dietary intake of fatty acids. Int. J. Mol. Sci. 2015, 16, 12871–12890. [Google Scholar] [CrossRef] [PubMed]
- Otamiri, F.O.; Ogugua, V.N.; Joshua, P.E.; Odiba, A.S.; Ukegbu, C.Y. Physicochemical Characterization of Coconut Copra (Dry Flesh) oil and Production of Biodiesel from Coconut Copra Oil. Jökull J. Univ. Niger. Nsukka 2014, 64, 201–236. [Google Scholar]
- Noël, J.A.; Allred, P.M.; White, M.A. Life cycle assessment of two biologically produced phase change materials and their related products. Int. J. Life Cycle Assess. 2014, 20, 367–376. [Google Scholar] [CrossRef]
- PureTemp LLC-Global Authority on Phase Change Material. Available online: http://www.puretemp.com/ (accessed on 27 January 2017).
- Phase Change Material Products Limited. Available online: http://www.pcmproducts.net/Phase_Change_Material_Products.htm (accessed on 18 February 2019).
- Ceres Greenhouse Solutions. Available online: https://ceresgs.com/climate-control/phase-change/ (accessed on 18 February 2019).
- Kahwaji, S.; White, M.A. Prediction of the properties of eutectic fatty acid phase change materials. Thermochim. Acta 2018, 660, 94–100. [Google Scholar] [CrossRef]
- Kahwaji, S.; White, M.A. Data supporting the prediction of the properties of eutectic organic phase change materials. Data Br. 2018, 17, 724–730. [Google Scholar] [CrossRef] [PubMed]
- United States Department of Agriculture—National Nutrient Database for Standard Reference 1 Release April. 2018; Basic Report: 04047, Oil, Coconut. Available online: https://ndb.nal.usda.gov/ndb/search/list (accessed on 18 February 2019).
- Prapun, R.; Cheetangdee, N.; Udomrati, S. Characterization of virgin coconut oil (VCO) recovered by different techniques and fruit maturities. Int. Food Res. J. 2016, 23, 2117–2124. [Google Scholar]
- Srivastava, Y.; Semwal, A.D.; Sajeevkumar, V.A.; Sharma, G.K. Melting, crystallization and storage stability of virgin coconut oil and its blends by differential scanning calorimetry (DSC) and Fourier transform infrared spectroscopy (FTIR). J. Food Sci. Technol. 2017, 54, 45–54. [Google Scholar] [CrossRef]
- Tan, C.; Che Man, Y. Differential scanning calorimetric analysis of palm oil, palm oil based products and coconut oil: Effects of scanning rate variation. Food Chem. 2002, 76, 89–102. [Google Scholar] [CrossRef]
- Jayadas, N.H.; Nair, K.P. Coconut oil as base oil for industrial lubricants—Evaluation and modification of thermal, oxidative and low temperature properties. Tribol. Int. 2006, 39, 873–878. [Google Scholar] [CrossRef]
- Moigradean, D.; Poiana, M.-A.; Gogoasa, I. Quality characteristics and oxidative stability of coconut oil during storage. J. Agroaliment. Process. Technol. 2012, 18, 272–276. [Google Scholar]
- Putri, W.A.; Fahmi, Z.; Sutjahja, I.M.; Kurnia, D.; Wonorahardjo, S. Thermophysical parameters of coconut oil and its potential application as the thermal energy storage system in Indonesia. J. Phys. Conf. Ser. 2016, 739. [Google Scholar] [CrossRef]
- Saleel, C.A.; Mujeebu, M.A.; Algarni, S. Coconut oil as phase change material to maintain thermal comfort in passenger vehicles. J. Therm. Anal. Calorim. 2018. [Google Scholar] [CrossRef]
- Mettawee, E.S.; Ead, A.I. Energy Saving in Building with Latent Heat Storage. Int. J. Therm. Environ. Eng. 2013, 5, 21–30. [Google Scholar]
- Wonorahardjo, S.; Sutjahja, I.; Kurnia, D.; Fahmi, Z.; Putri, W. Potential of Thermal Energy Storage Using Coconut Oil for Air Temperature Control. Buildings 2018, 8, 95. [Google Scholar] [CrossRef]
- Tipvarakarnkoon, T.; Blochwitz, R.; Senge, B. Rheological properties and phase change behaviors of coconut fats and oils. Annu. Trans. Nord. Rheol. Soc. 2008, 16, 159–166. [Google Scholar]
- Al-Jethelah, M.; Ebadi, S.; Venkateshwar, K.; Tasnim, S.H.H.; Mahmud, S.; Dutta, A. Charging nanoparticle enhanced bio-based PCM in open cell metallic foams: An experimental investigation. Appl. Therm. Eng. 2019, 148, 1029–1042. [Google Scholar] [CrossRef]
- Németh, B.; Németh, Á.S.; Ujhidy, A.; Tóth, J.; Trif, L.; Gyenis, J.; Feczkó, T. Fully bio-originated latent heat storing calcium alginate microcapsules with high coconut oil loading. Sol. Energy 2018, 170, 314–322. [Google Scholar] [CrossRef]
- Lee, H.; Jeong, S.-G.; Chang, S.; Kang, Y.; Wi, S.; Kim, S. Thermal Performance Evaluation of Fatty Acid Ester and Paraffin Based Mixed SSPCMs Using Exfoliated Graphite Nanoplatelets (xGnP). Appl. Sci. 2016, 6, 106. [Google Scholar] [CrossRef]
- Wi, S.; Seo, J.; Jeong, S.-G.; Chang, S.J.; Kang, Y.; Kim, S. Thermal properties of shape-stabilized phase change materials using fatty acid ester and exfoliated graphite nanoplatelets for saving energy in buildings. Sol. Energy Mater. Sol. Cells 2015, 143, 168–173. [Google Scholar] [CrossRef]
- Agarwal, R.K. Extraction Processes of Virgin Coconut Oil. MOJ Food Process. Technol. 2017, 4, 54–56. [Google Scholar] [CrossRef]
- Villarino, B.J.; Dy, L.M.; Lizada, M.C.C. Descriptive sensory evaluation of virgin coconut oil and refined, bleached and deodorized coconut oil. LWT Food Sci. Technol. 2007, 40, 193–199. [Google Scholar] [CrossRef]
- Cassel, R.B. Tzero Technology and Linearity; TA Instruments-TA325; TA Instruments: New Castle, DE, USA, 2005. [Google Scholar]
- Johnson, M.B.; White, M.A. Thermal Methods. In Multi Length-Scale Characterization; Bruce, D.W., O’Hare, D., Walton, R.I., Eds.; Wiley: Hoboken, NJ, USA, 2014. [Google Scholar]
- Höhne, G.; Hemminger, W.; Flammersheim, H.J. Differential Scanning Calorimetry; Springer: Berlin/Heidelberg, Germany, 2003; ISBN 9783540004677. [Google Scholar]
- ASTM Standard E1269-11. Standard Test Method for Determining Specific Heat Capacity by Differential Scanning Calorimetry; ASTM International: West Conshohocken, PA, USA, 2011. [Google Scholar]
- Kahwaji, S.; Johnson, M.B.; Kheirabadi, A.C.; Groulx, D.; White, M.A. Fatty Acids and Related Phase Change Materials for Reliable Thermal Energy Storage at Moderate Temperatures. Sol. Energy Mater. Sol. Cells 2017, 167, 109–120. [Google Scholar] [CrossRef]
- Kenisarin, M.M. Thermophysical properties of some organic phase change materials for latent heat storage. A review. Sol. Energy 2014, 107, 553–575. [Google Scholar] [CrossRef]
- Feldman, D.; Shapiro, M.M.; Banu, D.; Fuks, C.J. Fatty acids and their mixtures as phase-change materials for thermal energy storage. Sol. Energy Mater. 1989, 18, 201–216. [Google Scholar] [CrossRef]
- Hawes, D.W.; Feldman, D.; Banu, D. Latent heat storage in building materials. Energy Build. 1993, 20, 77–86. [Google Scholar] [CrossRef]
- Kenisarin, M.; Mahkamov, K. Passive thermal control in residential buildings using phase change materials. Renew. Sustain. Energy Rev. 2016, 55, 371–398. [Google Scholar] [CrossRef]
- Greenhouse Megastore. Available online: https://www.greenhousemegastore.com/structures/greenhouse-kits/ (accessed on 18 February 2019).
- Greenhouses Canada. Available online: http://www.greenhousescanada.com/Palram-Glory-Grey-8-x-12-10mm-TwinWall-Glazing.html (accessed on 18 February 2019).
- Boulard, T.; Razafinjohany, E.; Baille, A.; Jaffrin, A.; Fabre, B. Performance of a greenhouse heating system with a phase change material. Agric. For. Meteorol. 1990, 52, 303–318. [Google Scholar] [CrossRef]
- Dutil, Y.; Rousse, D.; Lassue, S.; Zalewski, L.; Joulin, A.; Virgone, J.; Kuznik, F.; Johannes, K.; Dumas, J.-P.; Bédécarrats, J.-P.; et al. Modeling phase change materials behavior in building applications: Comments on material characterization and model validation. Renew. Energy 2014, 61, 132–135. [Google Scholar] [CrossRef]
- Dutil, Y.; Rousse, D.R.; Salah, B.; Phane Lassue, S.; Zalewski, L. A review on phase-change materials: Mathematical modeling and simulations. Renew. Sustain. Energy Rev. 2010, 15, 112–130. [Google Scholar] [CrossRef]
- Charvát, P.; Klimeš, L.; Ost, M. Numerical and experimental investigation of a PCM-based thermal storage unit for solar air systems. Energy Build. 2014, 68, 488–497. [Google Scholar] [CrossRef]
- Mavrigiannaki, A.; Ampatzi, E. Latent heat storage in building elements: A systematic review on properties and contextual performance factors. Renew. Sustain. Energy Rev. 2016, 60, 852–866. [Google Scholar] [CrossRef] [Green Version]
- Tardieu, A.; Behzadi, S.; Chen, J.J.J.; Farid, M.M. Computer simulation and experimental measurments for an experimental PCM-impregnated office building. In Proceedings of the Building Simulation 2011: 12th Conference of International Building Performance Simulation Association, Sydney, Australia, 14–16 November 2011; pp. 56–63. [Google Scholar]
- Chase, M.W. NIST-JANAF Themochemical Tables, Fourth Edition. (Journal of Physical and Chemical Reference Data Monographs); NIST: Gaithersburg, MD, USA, 1998; pp. 1–1951. [Google Scholar]
- Noureddini, H.; Teoh, B.C.; Clements, L.D.C. Densities of vegetable oils and Fatty Acids. Chem. Biomol. Eng. Res. Publ. 1992, 69, 1184–1188. [Google Scholar] [CrossRef]
- Bulk Apothecary—Refined Coconut Oil. Available online: https://www.bulkapothecary.com/raw-ingredients/bulk-natural-oils/coconut-oil-76-degree/ (accessed on 18 February 2019).
- IndexMundi. Available online: https://www.indexmundi.com/commodities/?commodity=coconut-oil (accessed on 19 February 2019).
- Fabiani, C.; Pisello, A.; Barbanera, M.; Cabeza, L.; Cotana, F.; Fabiani, C.; Pisello, A.L.; Barbanera, M.; Cabeza, L.F.; Cotana, F. Assessing the Potentiality of Animal Fat Based-Bio Phase Change Materials (PCM) for Building Applications: An Innovative Multipurpose Thermal Investigation. Energies 2019, 12, 1111. [Google Scholar] [CrossRef]
Figure 1.
Differential scanning calorimeter (DSC) thermograms of (a) margarine sample M1 (Parkay®) and (b) margarine sample M2 (Imperial®). The first and third cycles are shown.
Figure 1.
Differential scanning calorimeter (DSC) thermograms of (a) margarine sample M1 (Parkay®) and (b) margarine sample M2 (Imperial®). The first and third cycles are shown.

Figure 2.
DSC thermograms showing heating and cooling curves of vegetable shortening sample measured at 10 K/min for two melt-freeze cycles.
Figure 2.
DSC thermograms showing heating and cooling curves of vegetable shortening sample measured at 10 K/min for two melt-freeze cycles.

Figure 3.
DSC thermograms of (a) refined coconut oil (R-CNO) and (b) virgin coconut oil (V-CNO) measured at 10 K/min for Cycle 1 (first melt of a fresh sample) and after 5, 100, and 200 melt-freeze cycles. For both R-CNO and V-CNO, the widths of the endothermic (melting) and the shapes of the exothermic (solidification) peaks changed slightly after cycling but values of ΔfusH and Tmpt derived from the endothermic peaks of all cycles remain within the uncertainty of the measurements. (c) Regardless of the number of thermal cycles, the first melt DSC curve for each coconut oil sample featured a main peak and a shoulder peak that merged into a single peak in the subsequent melting curves (see also Figure S5 of Supplementary Materials).

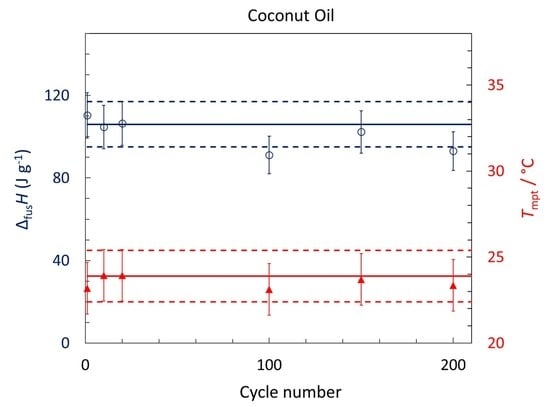
Figure 4.
Latent heats of fusion, ΔfusH, (in blue) and melting temperatures, Tmpt, (in red) of (a) refined coconut oil (R-CNO) and (b) virgin coconut oil (V-CNO) as functions of thermal cycle. Although a small change was observed after the first cycle, all values were within the uncertainties of the measurements over the 200 melt-freeze cycles. The solid lines correspond to the average values of ΔfusH and Tmpt (calculated from the first 20 heating curves of a fresh sample) and the dashed lines show the range of their uncertainties: ± 10% for ΔfusH and ± 1.5 °C for Tmpt.

Figure 5.
DSC thermograms of R-CNO and V-CNO after 5 and 200 melt-freeze cycles show similar changes in melting (endothermic) peaks in response to thermal cycling and similar melting behavior for a given cycle but different solidification (exothermic) behavior for the two types of coconut oil.
Figure 5.
DSC thermograms of R-CNO and V-CNO after 5 and 200 melt-freeze cycles show similar changes in melting (endothermic) peaks in response to thermal cycling and similar melting behavior for a given cycle but different solidification (exothermic) behavior for the two types of coconut oil.

Figure 6.
Temperature versus time curve from 21.5 °C to 40 °C collected while heating a 15 mL sample of R-CNO by hot air and then letting the sample cool at room temperature. The cooling started at time t = 0.13 h. The inset shows a close-up of the solidification region, with a measured supercooling of 0.9 °C.

Figure 7.
(a) Heat capacity at constant pressure as a function of temperature, Cp(T), of R-CNO measured by DSC. Data points in the region of the solid-liquid transition approach infinity and are omitted. (b) Thermal conductivity, κ, of R-CNO as a function of temperature measured by a Physical Property Measurement System (PPMS). The arrows indicate the DSC peak melting temperature, Tmpt, of R-CNO.


Table 1.
Edible fats and oils tested in this study. The abbreviation is the sample name used in the text. The cost is the approximate average retail cost of the brands tested in this study and the composition is from the ingredients specified on the product label.
Table 1.
Edible fats and oils tested in this study. The abbreviation is the sample name used in the text. The cost is the approximate average retail cost of the brands tested in this study and the composition is from the ingredients specified on the product label.
| Product | Abbreviation | Cost (US $/kg) | Main Composition |
|---|---|---|---|
| Parkay® Margarine | M1 | 2 | Non-hydrogenated oil blend (68%), modified milk ingredients (18%) and water (12%) |
| Imperial® Margarine | M2 | 2 | Non-hydrogenated oil blend (60%), milk ingredients and water (unspecified amounts) |
| Crisco® Vegetable Shortening | VS | 4 | Fully and partially hydrogenated soybean and palm oils, mono and diglycerides |
| Refined Coconut Oil (Suraj® brand) | R-CNO | 6 | Coconut oil |
| Virgin Coconut Oil (Our Finest® brand) | V-CNO | 11 | 100% virgin coconut oil |
Table 2.
Values of the latent heat of fusion, ΔfusH, and melting temperature, Tmpt, of coconut oil determined in this work and as reported in the literature.
Table 2.
Values of the latent heat of fusion, ΔfusH, and melting temperature, Tmpt, of coconut oil determined in this work and as reported in the literature.
| Reference | Measurement Method | ΔfusH/(J g−1) | Tmpt /°C |
|---|---|---|---|
| This work–refined coconut oil (R-CNO) | DSC | 105 ± 11 | 24.5 ± 1.5 |
| This work–virgin coconut oil (V-CNO) | DSC | 106 ± 11 | 23.9 ± 1.5 |
| [25] | DSC | 72.01 ± 0.21 | 24.73 ± 0.12 |
| [26] | DSC | 120.6 ± 2.0 | 21.05 |
| [29] | T-history | 249 | not reported |
| [33] | DSC | 97 - 102 | 26.2–26.7 |
| [34] | DSC | 103 ± 1 | 24 ± 1 |
| [35] | DSC | 115.3 | 23.9 |
| [36] | DSC | 110.4 | 26.78 |
Table 3.
Summary of the thermal properties results obtained for the edible oils investigated in this study.
Table 3.
Summary of the thermal properties results obtained for the edible oils investigated in this study.
| Sample | ΔfusH /J g−1 | Tmpta /°C | Comment |
|---|---|---|---|
| M1 | 8 ± 1 | 35.5 ± 1.5 | Small ΔfusH value. Thermally unstable after the first melt. Supercools by about 20 K in the DSC. |
| M2 | 7 ± 1 | 33.0 ± 1.5 °C | Small ΔfusH value. Thermally unstable after the first melt. Supercools by about 20 K in the DSC. |
| VS | 12 ± 1 | 44.8 ± 1.5 | Small ΔfusH value. Better thermal stability than margarine. Supercools by about 15 K in the DSC. |
| R-CNO | 105 ± 11 | 24.5 ± 1.5 | Large ΔfusH. Thermally stable after 200 melt-freeze cycle. Supercooling decreases as the cooling rate decreases, and can be negligible for a bulk sample. Cp,s = 1.6 ± 0.2 J K−1 mol−1; Cp,l = 2.2 ± 0.2 J K−1 mol−1; κs = 0.19 ± 0.2 W m−1 K−1; κl = 0.17 ± 0.2 W m−1 K−1. |
| V-CNO | 106 ± 11 | 23.9 ± 1.5 | Large ΔfusH. Thermally stable after 200 melt-freeze cycle. Supercooling decreases as the cooling rate decreases. Thermal properties similar to those of R-NCO. |
a Based on peak temperature from DSC results.
© 2019 by the authors. Licensee MDPI, Basel, Switzerland. This article is an open access article distributed under the terms and conditions of the Creative Commons Attribution (CC BY) license (http://creativecommons.org/licenses/by/4.0/).
Share and Cite
MDPI and ACS Style
Kahwaji, S.; White, M.A. Edible Oils as Practical Phase Change Materials for Thermal Energy Storage. Appl. Sci. 2019, 9, 1627. https://0-doi-org.brum.beds.ac.uk/10.3390/app9081627
AMA Style
Kahwaji S, White MA. Edible Oils as Practical Phase Change Materials for Thermal Energy Storage. Applied Sciences. 2019; 9(8):1627. https://0-doi-org.brum.beds.ac.uk/10.3390/app9081627
Chicago/Turabian StyleKahwaji, Samer, and Mary Anne White. 2019. "Edible Oils as Practical Phase Change Materials for Thermal Energy Storage" Applied Sciences 9, no. 8: 1627. https://0-doi-org.brum.beds.ac.uk/10.3390/app9081627
Note that from the first issue of 2016, this journal uses article numbers instead of page numbers. See further details here.