Investigating the Effects of Chiropractic Spinal Manipulation on EEG in Stroke Patients

 ,
,  , ,
, ,  ,
, 
Abstract
:1. Introduction
2. Methods
2.1. Subjects
2.2. Experimental Protocol
2.3. Interventions
2.3.1. Chiropractic Manipulation
2.3.2. Control Manipulation
2.4. Median Nerve Stimulation
2.5. EEG
2.5.1. Resting-State EEG
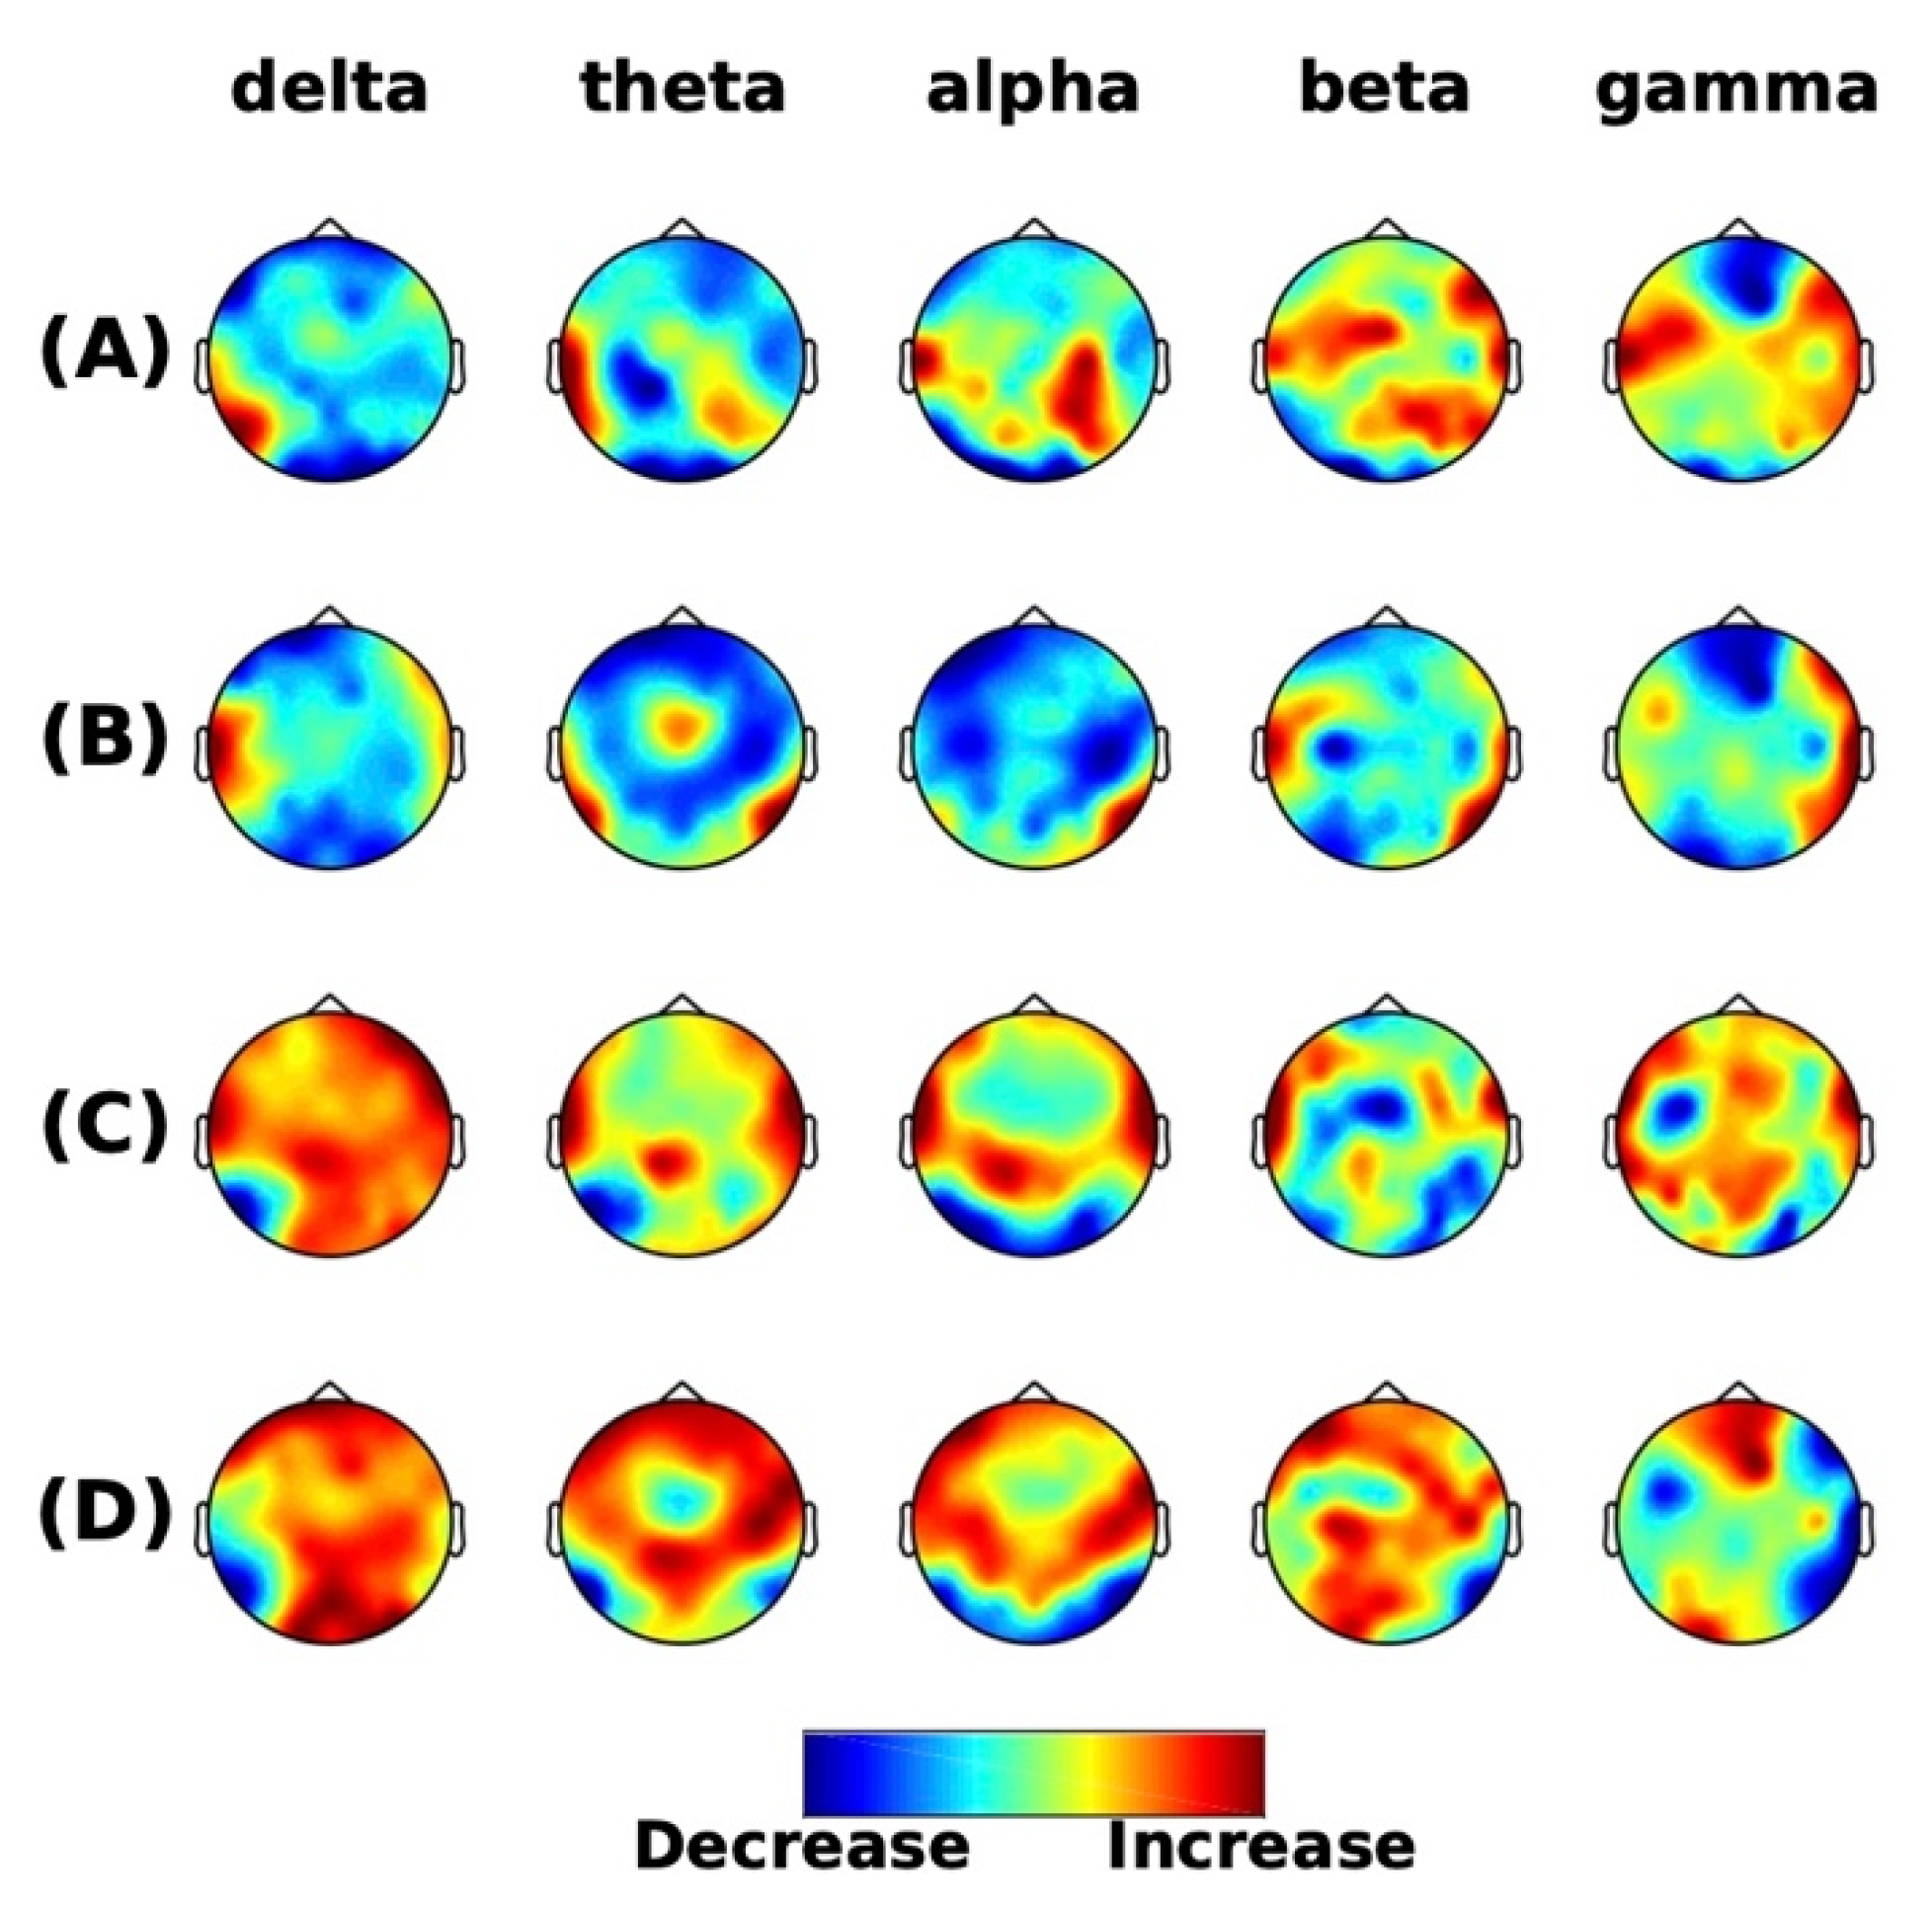
Spatio-Spectral Power
DAR
BSI
Source Localization
2.5.2. SEPs
SEP Peaks
Source Localization
2.5.3. Artifact Removal
2.6. Statistics
3. Results
3.1. Resting-State EEG
3.1.1. Spatio-Spectral Power
3.1.2. DAR
3.1.3. BSI
3.1.4. Source Localization
3.2. SEPs
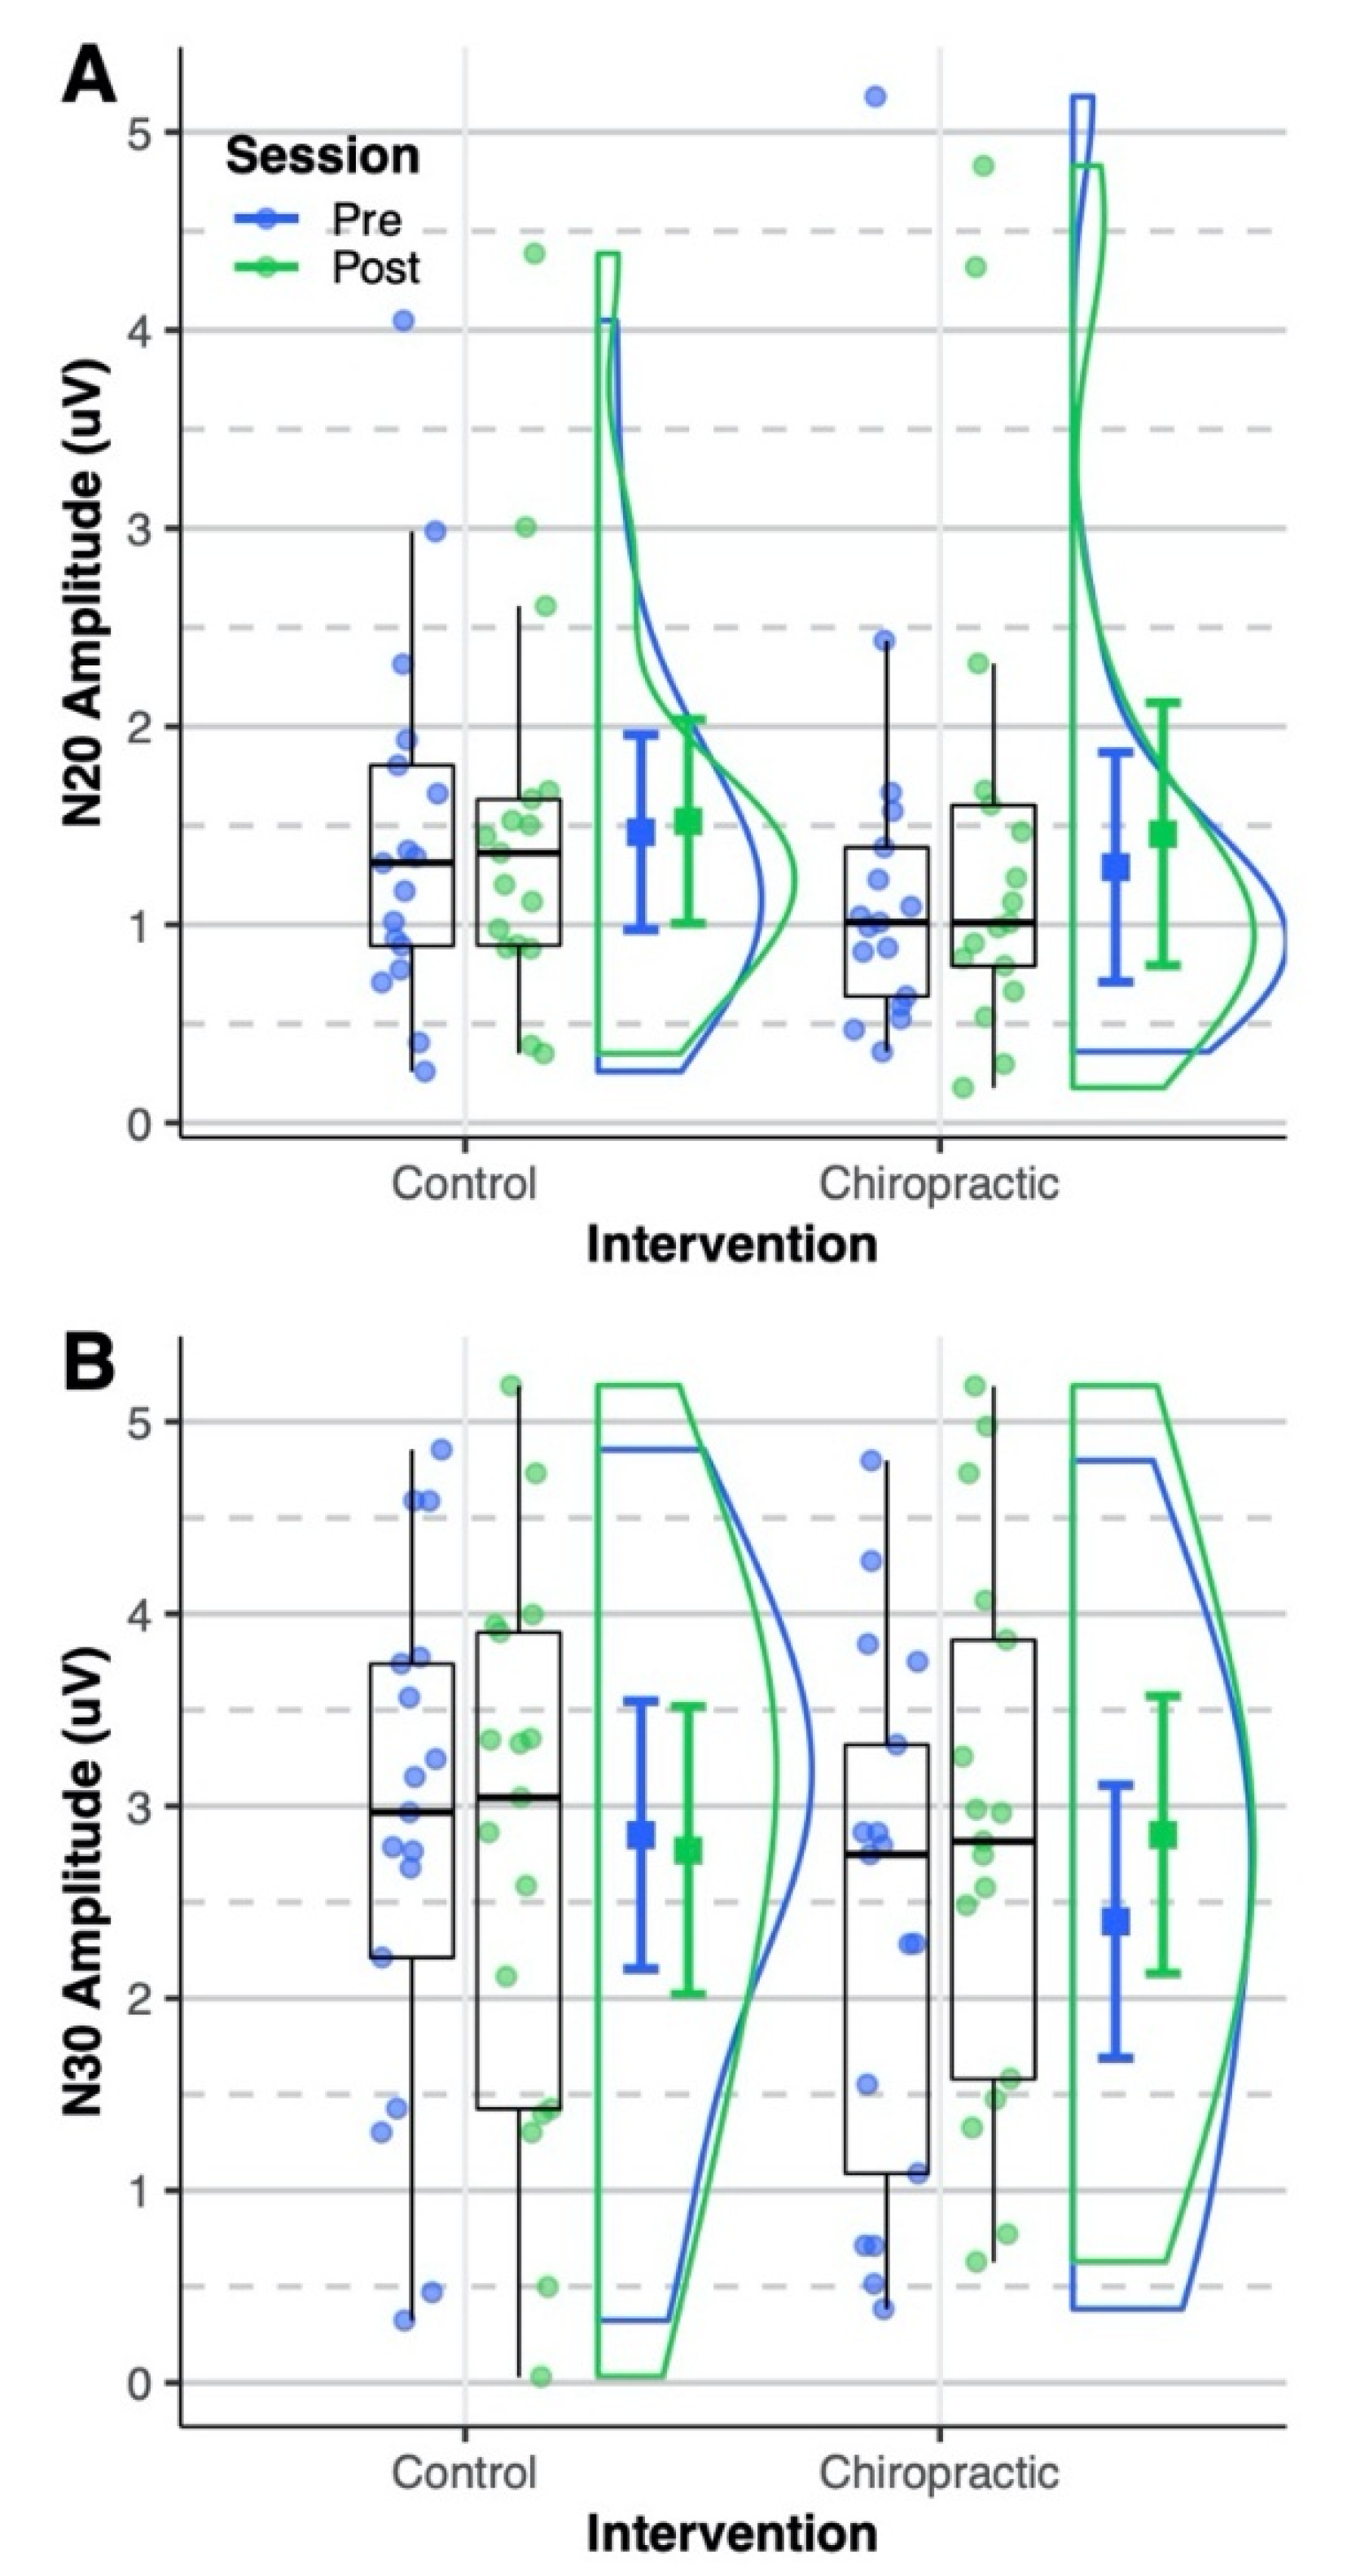
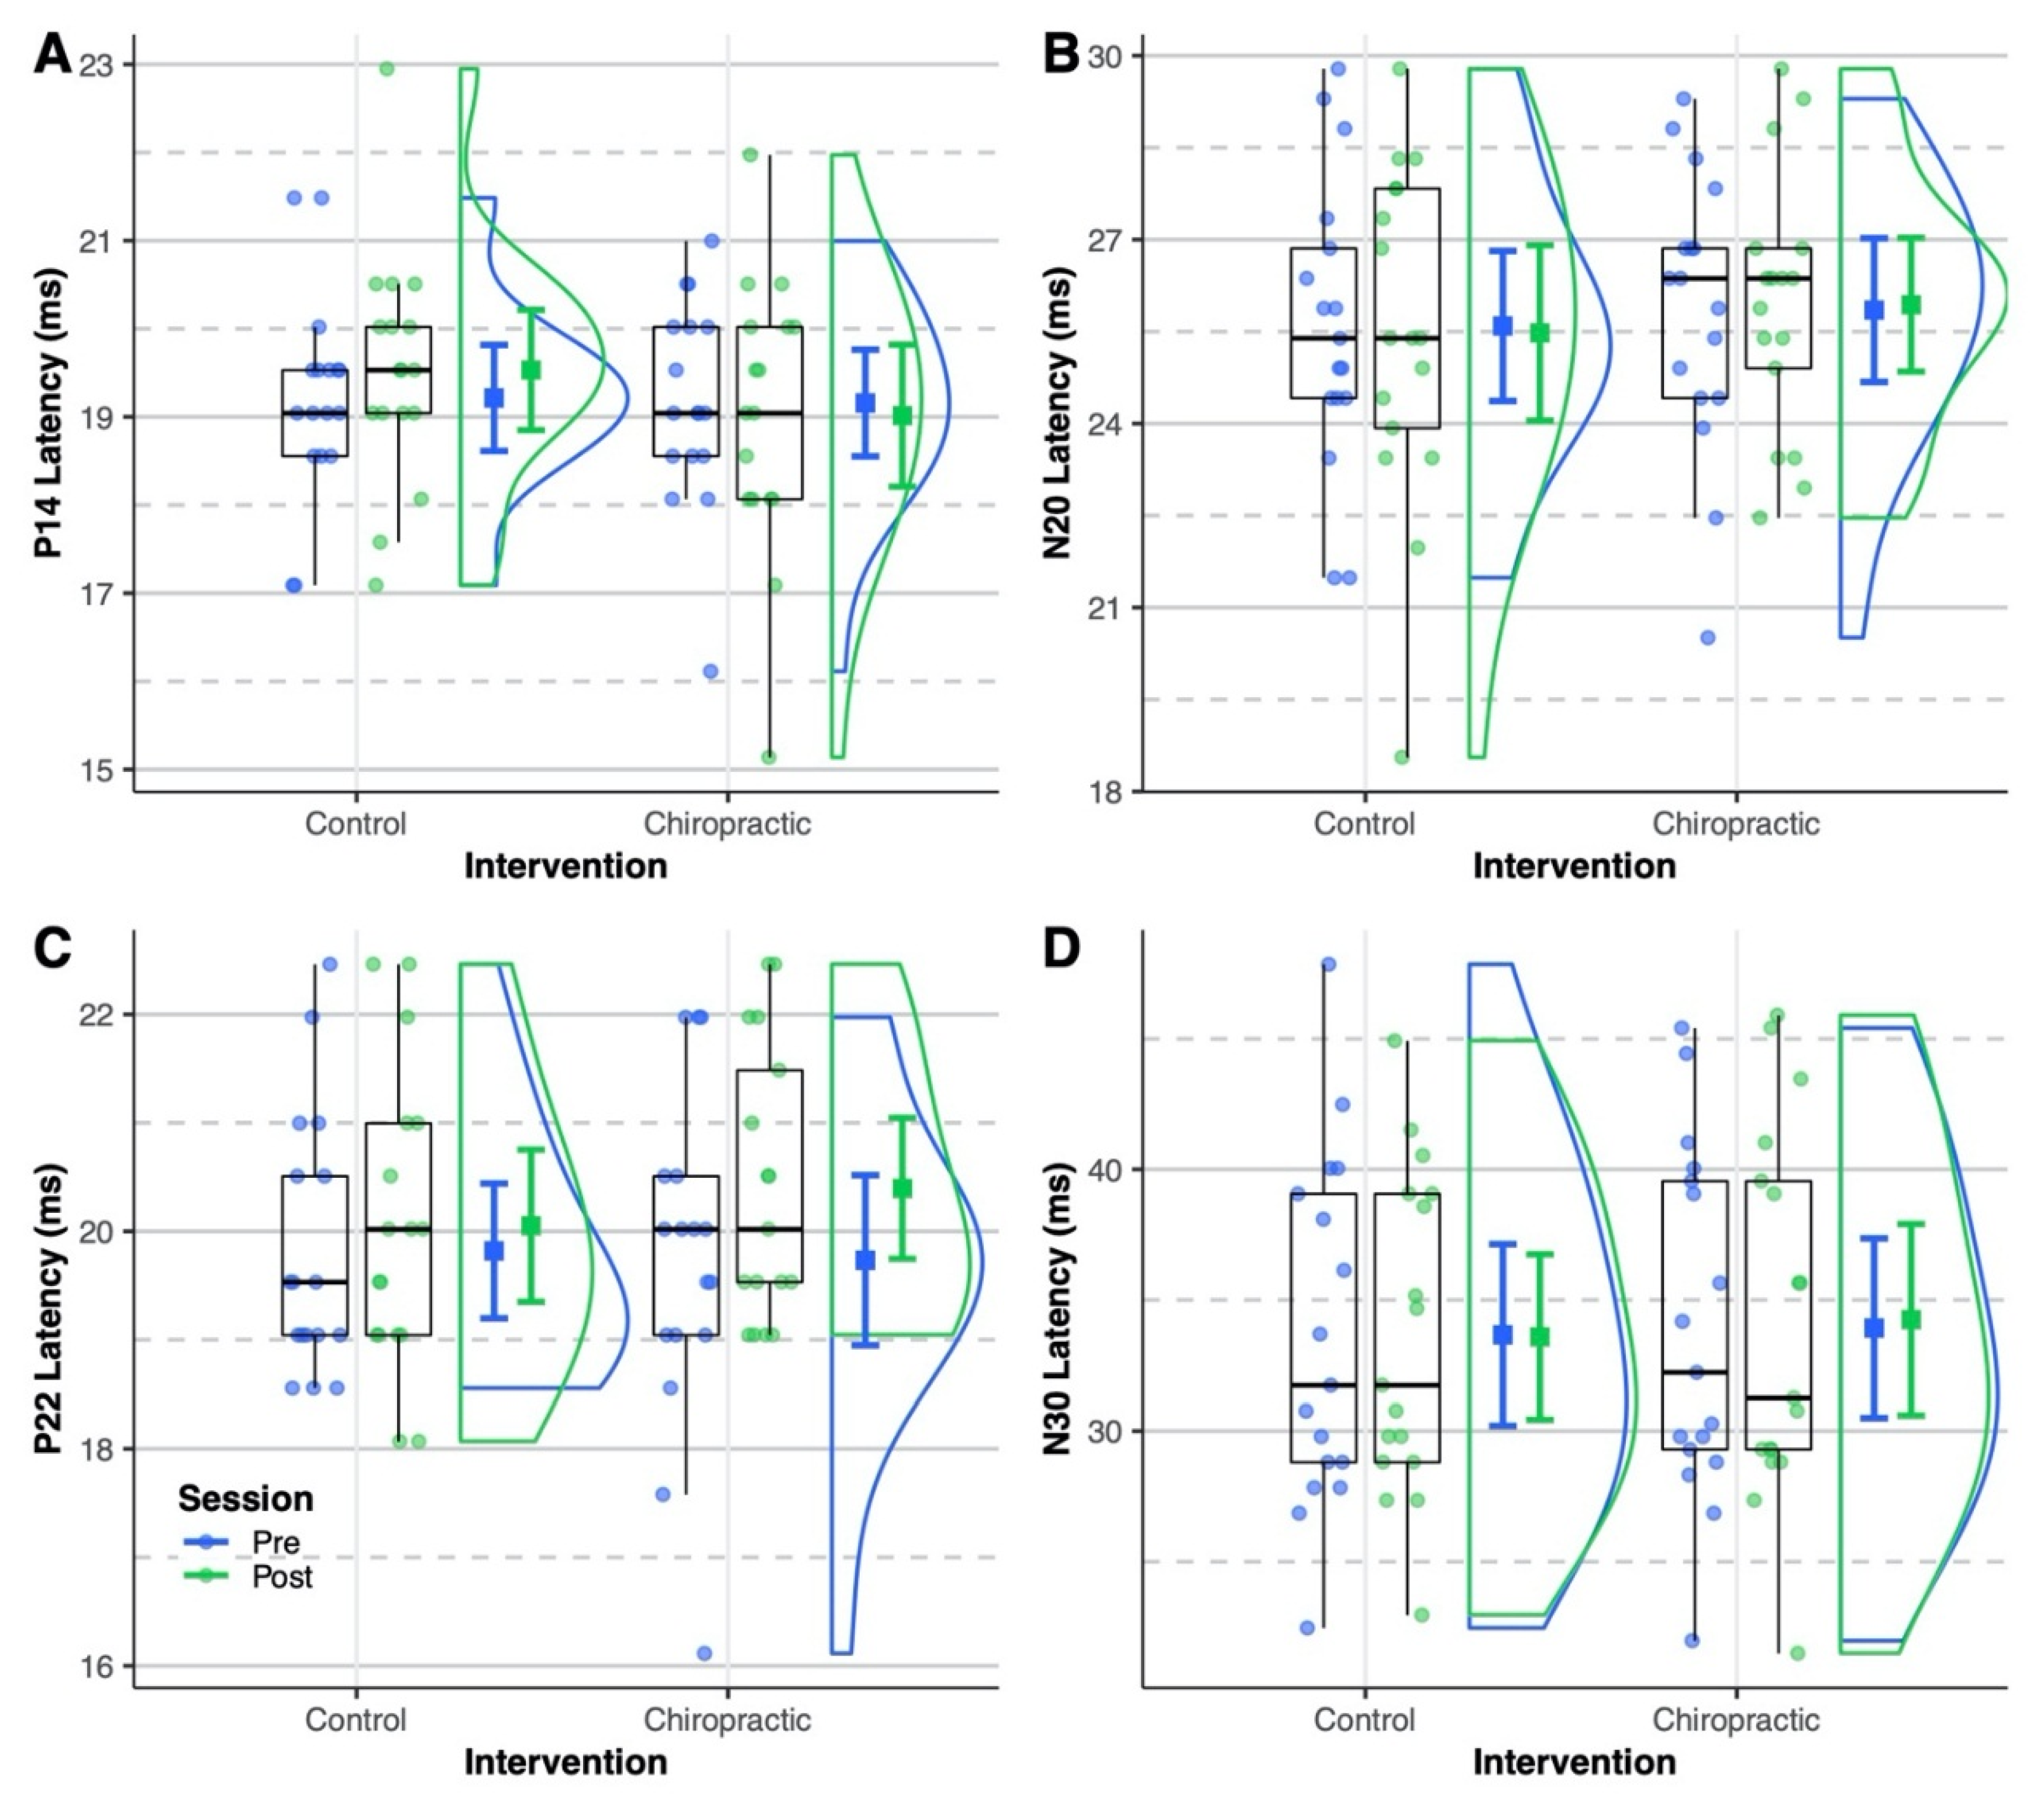
3.2.1. SEP Peaks
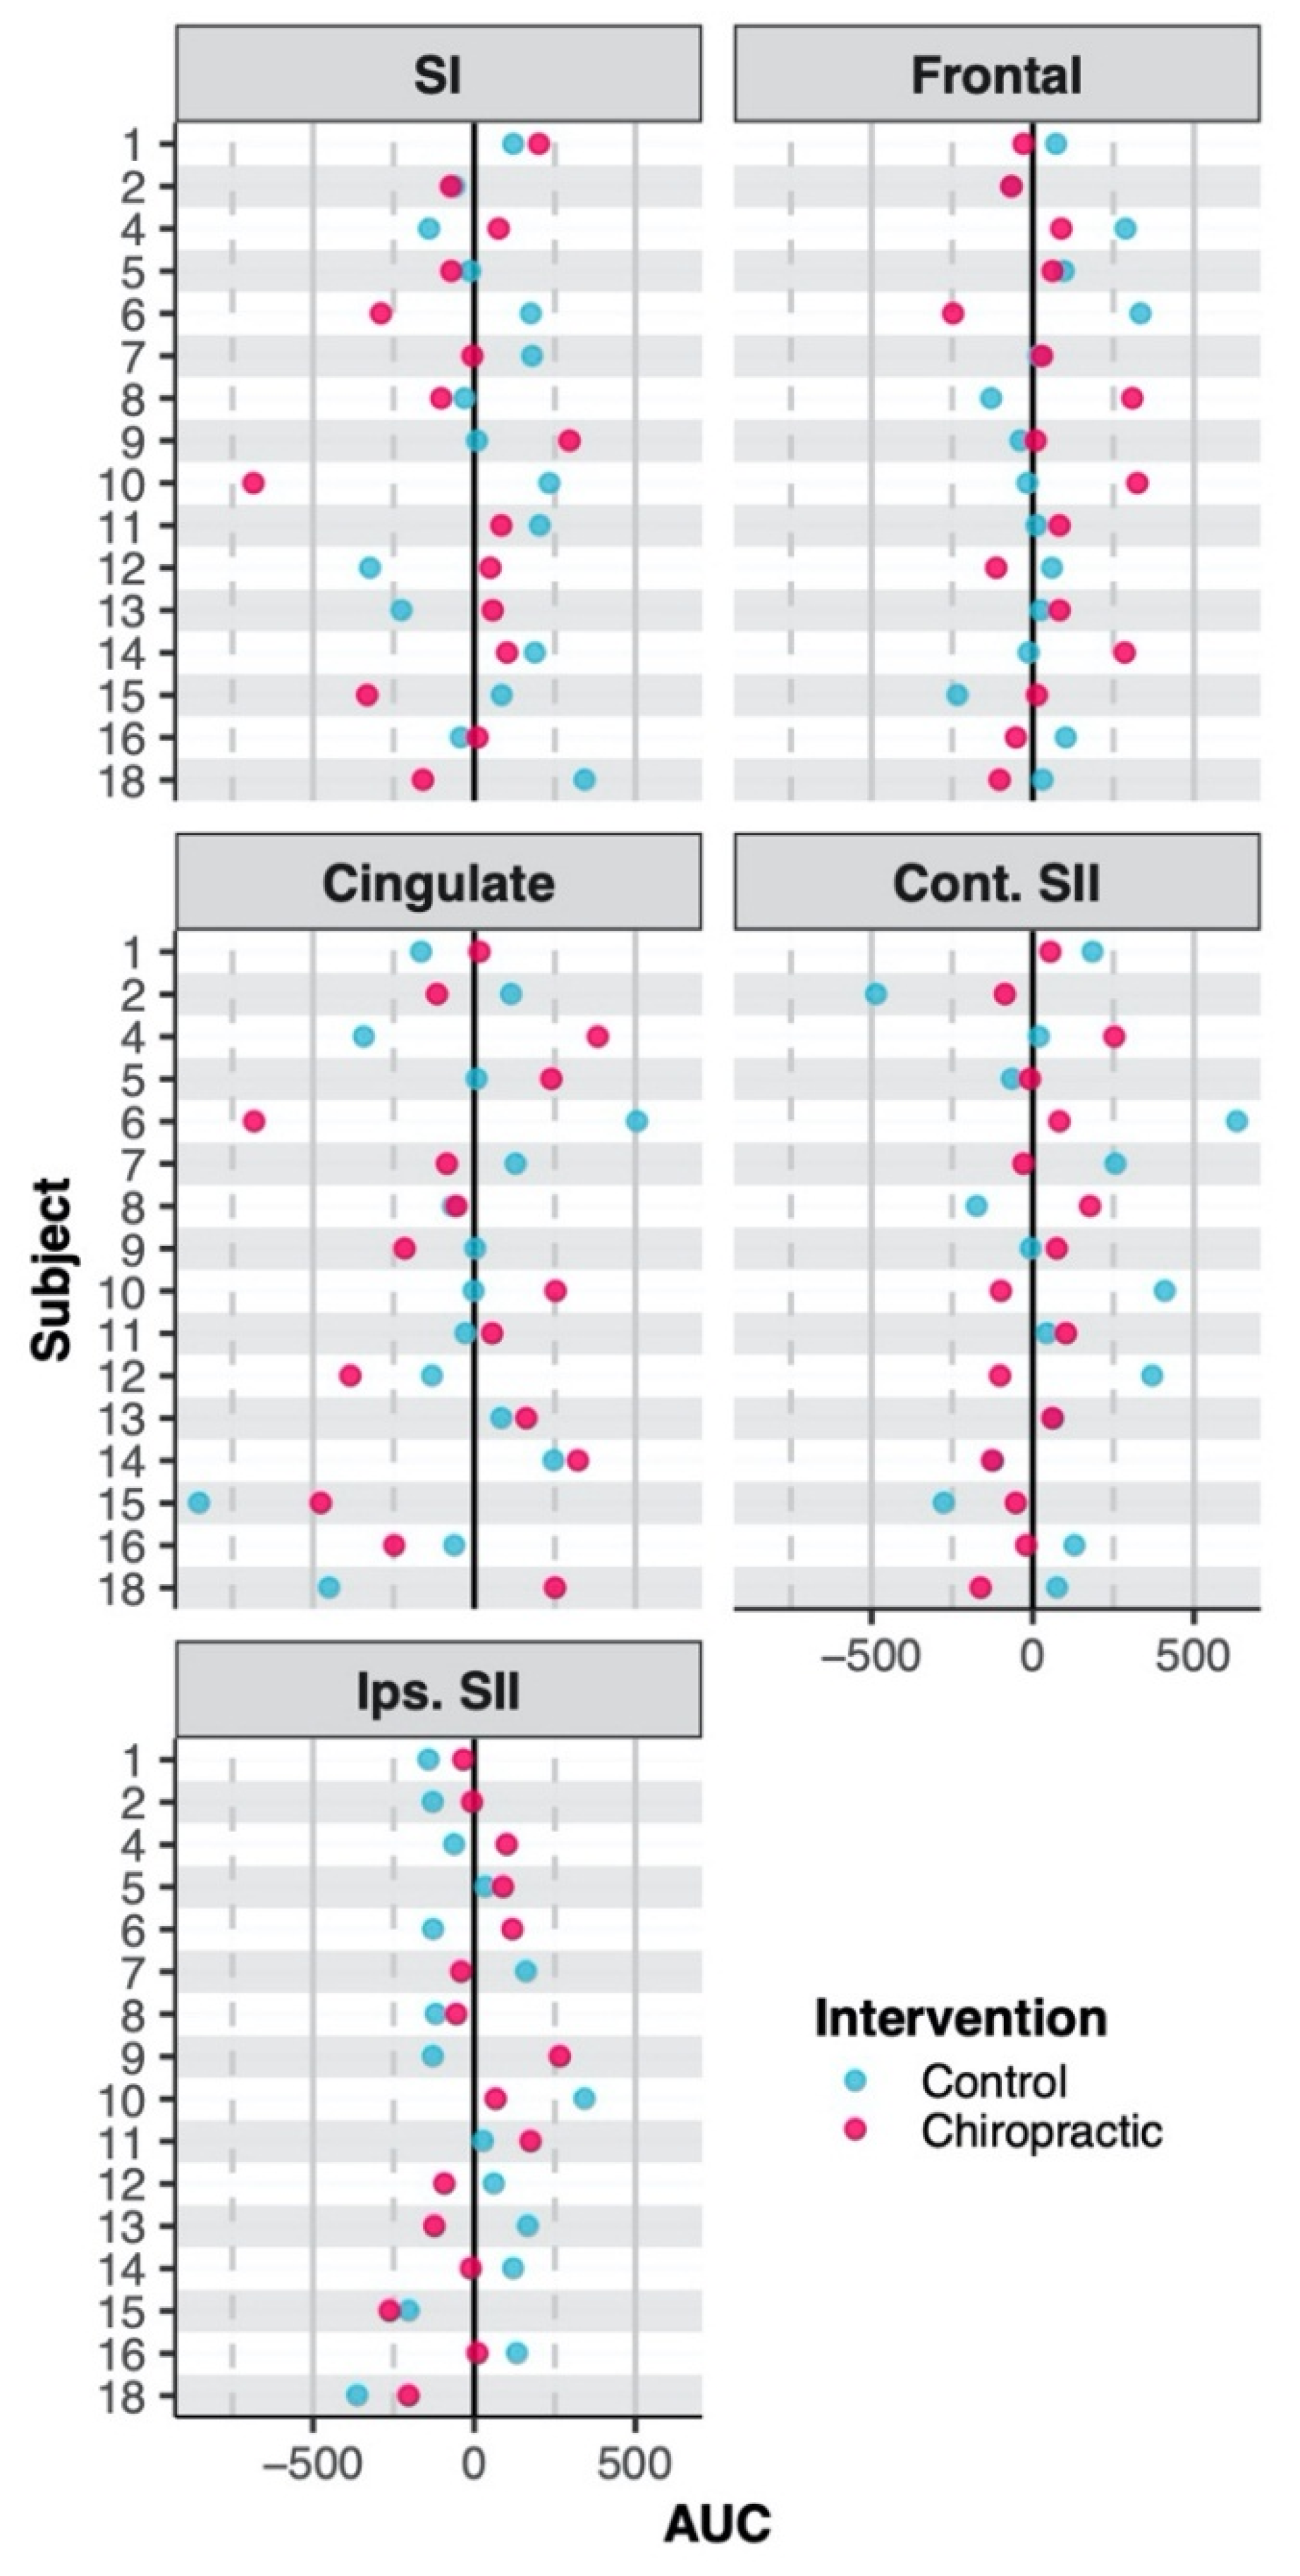
3.2.2. Source Localization
4. Discussion
4.1. Resting-State
4.2. SEPs
5. Study Considerations
6. Conclusions
Author Contributions
Funding
Acknowledgments
Conflicts of Interest
References
- Benjamin, E.J.; Virani, S.S.; Callaway, C.W.; Chamberlain, A.M.; Chang, A.R.; Cheng, S.; Chiuve, S.E.; Cushman, M.; Delling, F.N.; Deo, R.; et al. Heart disease and stroke statistics - 2018 update: A report from the American Heart Association. Circulation 2018, 137, E67–E492. [Google Scholar] [CrossRef] [PubMed]
- Thrift, A.G.; Thayabaranathan, T.; Howard, G.; Howard, V.J.; Rothwell, P.M.; Feigin, V.L.; Norrving, B.; Donnan, G.A.; Cadilhac, D.A. Global stroke statistics. Int. J. Stroke 2017, 12, 13–32. [Google Scholar] [CrossRef] [PubMed]
- Gustavsson, A.; Svensson, M.; Jacobi, F.; Allgulander, C.; Alonso, J.; Beghi, E.; Dodel, R.; Ekman, M.; Faravelli, C.; Fratiglioni, L.; et al. Cost of disorders of the brain in Europe 2010. Eur. Neuropsychopharmacol. 2011, 21, 718–779. [Google Scholar] [CrossRef] [Green Version]
- Pollock, A.; George, B.S.; Fenton, M.; Firkins, L. Top 10 research priorities relating to life after stroke - consensus from stroke survivors, caregivers, and health professionals. Int. J. Stroke 2014, 9, 313–320. [Google Scholar] [CrossRef] [PubMed]
- Meyer, S.; De Bruyn, N.; Lafosse, C.; Van Dijk, M.; Michielsen, M.; Thijs, L.; Truyens, V.; Oostra, K.; Krumlinde-Sundholm, L.; Peeters, A.; et al. Somatosensory Impairments in the Upper Limb Poststroke: Distribution and Association With Motor Function and Visuospatial Neglect. Neurorehabilit. Neural Repair 2016, 30, 731–742. [Google Scholar] [CrossRef] [PubMed]
- Haupt, W.F.; Chopan, G.; Sobesky, J.; Liu, W.C.; Dohmen, C. Prognostic value of somatosensory evoked potentials, neuron-specific enolase, and S100 for short-term outcome in ischemic stroke. J. Neurophysiol. 2016, 115, 1273–1278. [Google Scholar] [CrossRef] [PubMed] [Green Version]
- Zeman, B.D.; Yiannikas, C. Functional prognosis in stroke: Use of somatosensory evoked potentials. J. Neurol. Neurosurg. Psychiatry 1989, 52, 242–247. [Google Scholar] [CrossRef] [Green Version]
- Keren, O.; Ring, H.; Solzi, P.; Pratt, H.; Groswasser, Z. Upper limb somatosensory evoked potentials as a predictor of rehabilitation progress in dominant hemisphere stroke patients. Stroke 1993, 24, 1789–1793. [Google Scholar] [CrossRef] [Green Version]
- Lee, S.Y.; Lim, J.Y.; Kang, E.K.; Han, M.K.; Bae, H.J.; Paik, N.J. Prediction of good functional recovery after stroke based on combined motor and somatosensory evoked potential findings. J. Rehabilitation Med. 2010, 42, 16–20. [Google Scholar] [CrossRef] [Green Version]
- Al-Rawi, M.A.W.; Hamdan, F.B.; Abdul-Muttalib, A.K. Somatosensory evoked potentials as a predictor for functional recovery of the upper limb in patients with stroke. J. Stroke Cerebrovasc. Dis. Off. J. Natl. Stroke Assoc. 2009, 18, 262–268. [Google Scholar] [CrossRef]
- Triccas, L.T.; Meyer, S.; Mantini, D.; Camilleri, K.; Falzon, O.; Camilleri, T.; Verheyden, G. A systematic review investigating the relationship of electroencephalography and magnetoencephalography measurements with sensorimotor upper limb impairments after stroke. J. Neurosci. Methods 2019, 311, 318–330. [Google Scholar] [CrossRef] [PubMed]
- Yoon, H.S.; Cha, Y.J.; Sohn, M.K.; You, J.H. Effect of rehabilitation on the somatosensory evoked potentials and gait performance of hemiparetic stroke patients. Technol. Health Care 2018, 26, S145–S150. [Google Scholar] [CrossRef] [Green Version]
- Gott, P.S.; Karnaze, D.S.; Fisher, M. Assessment of median nerve somatosensory evoked potentials in cerebral ischemia. Stroke 1990, 21, 1167–1171. [Google Scholar] [CrossRef] [PubMed] [Green Version]
- Feys, H.; Van Hees, J.; Bruyninckx, F.; Mercelis, R.; De Weerdt, W. Value of somatosensory and motor evoked potentials in predicting arm recovery after a stroke. J. Neurol. Neurosurg. Psychiatry 2000, 68, 323–331. [Google Scholar] [CrossRef] [PubMed] [Green Version]
- Guillery, R.W.; Sherman, S.M. The thalamus as a monitor of motor outputs. In Proceedings of the Philosophical Transactions of the Royal Society B: Biological Sciences; Royal Society: London, UK, 2002; Volume 357, pp. 1809–1821. [Google Scholar]
- Urbin, M.A.; Hong, X.; Lang, C.E.; Carter, A.R. Resting-state functional connectivity and its association with multiple domains of upper-extremity function in chronic stroke. Neurorehabilit. Neural Repair 2014, 28, 761–769. [Google Scholar] [CrossRef] [PubMed] [Green Version]
- Saes, M.; Meskers, C.G.M.; Daffertshofer, A.; de Munck, J.C.; Kwakkel, G.; van Wegen, E.E.H. How does upper extremity Fugl-Meyer motor score relate to resting-state EEG in chronic stroke? A power spectral density analysis. Clin. Neurophysiol. 2019, 130, 856–862. [Google Scholar] [CrossRef]
- Carter, A.R.; Shulman, G.L.; Corbetta, M. Why use a connectivity-based approach to study stroke and recovery of function? NeuroImage 2012, 62, 2271–2280. [Google Scholar] [CrossRef] [Green Version]
- Andraus, M.E.C.; Alves-Leon, S.V. Non-epileptiform EEG abnormalities: An overview. Arq. de Neuro-Psiquiatr. 2011, 69, 829–835. [Google Scholar] [CrossRef] [Green Version]
- Van Putten, M.J.A.M.; Tavy, D.L.J. Continuous quantitative EEG monitoring in hemispheric stroke patients using the brain symmetry index. Stroke 2004, 35, 2489–2492. [Google Scholar] [CrossRef] [Green Version]
- Finnigan, S.; van Putten, M.J.A.M. EEG in ischaemic stroke: Quantitative EEG can uniquely inform (sub-)acute prognoses and clinical management. Clin. Neurophysiol. Off. J. Int. Fed. Clin. Neurophysiol. 2013, 124, 10–19. [Google Scholar] [CrossRef]
- Britton, J.W.; Frey, L.C.; Hopp, J.L.; Korb, P.; Koubeissi, M.Z.; Lievens, W.E.; Pestana-Knight, E.M.; Louis, E.K.S. Electroencephalography (EEG): An Introductory Text and Atlas of Normal and Abnormal Findings in Adults, Children, and Infants; Allen Press, Inc.: Lawrence, KS, USA, 2016. [Google Scholar]
- Finnigan, S.; Wong, A.; Read, S. Defining abnormal slow EEG activity in acute ischaemic stroke: Delta/alpha ratio as an optimal QEEG index. Clin. Neurophysiol. Off. J. Int. Fed. Clin. Neurophysiol. 2016, 127, 1452–1459. [Google Scholar] [CrossRef] [Green Version]
- Sheorajpanday, R.V.A.; Nagels, G.; Weeren, A.J.T.M.; van Putten, M.J.A.M.; De Deyn, P.P. Reproducibility and clinical relevance of quantitative EEG parameters in cerebral ischemia: A basic approach. Clin. Neurophysiol. 2009, 120, 845–855. [Google Scholar] [CrossRef] [PubMed]
- Anastasi, A.A.; Falzon, O.; Camilleri, K.; Vella, M.; Muscat, R. Brain symmetry index in healthy and stroke patients for assessment and prognosis. Stroke Res. Treat. 2017, 2017, 8276136. [Google Scholar] [CrossRef] [PubMed]
- Li, S. Spasticity, Motor Recovery, and Neural Plasticity after Stroke. Front. Neurol. 2017, 8, 120. [Google Scholar] [CrossRef] [PubMed] [Green Version]
- Haavik, H.; Murphy, B. The role of spinal manipulation in addressing disordered sensorimotor integration and altered motor control. J. Electromyogr. Kinesiol. 2012, 22, 768–776. [Google Scholar] [CrossRef] [PubMed]
- Niazi, I.K.; Türker, K.S.; Flavel, S.; Kinget, M.; Duehr, J.; Haavik, H. Changes in H-reflex and V-waves following spinal manipulation. Exp. Brain Res. 2015, 233, 1165–1173. [Google Scholar] [CrossRef]
- Pickar, J.G.; Bolton, P.S. Spinal manipulative therapy and somatosensory activation. J. Electromyogr. Kinesiol. 2012, 22, 785–794. [Google Scholar] [CrossRef] [PubMed] [Green Version]
- Haavik, H.; Murphy, B. Subclinical neck pain and the effects of cervical manipulation on elbow joint position sense. J. Manip. Physiol. Ther. 2011, 34, 88–97. [Google Scholar] [CrossRef]
- Taylor, H.H.; Murphy, B.A. Altered cortical integration of dual somatosensory input following the cessation of a 20 min period of repetitive muscle activity. Exp. Brain Res. 2007, 178, 488–498. [Google Scholar] [CrossRef]
- Haavik-Taylor, H.; Murphy, B. Cervical spine manipulation alters sensorimotor integration: A somatosensory evoked potential study. Clin. Neurophysiol. 2007, 118, 391–402. [Google Scholar] [CrossRef]
- Haavik, H.; Murphy, B.A. Transient modulation of intracortical inhibition following spinal manipulation. Chiropr. J. Aust. 2007, 37, 106–116. [Google Scholar]
- Taylor, H.H.; Murphy, B. Altered Sensorimotor Integration With Cervical Spine Manipulation. J. Manip. Physiol. Ther. 2008, 31, 115–126. [Google Scholar] [CrossRef] [PubMed]
- Taylor, H.H.; Murphy, B. Altered Central Integration of Dual Somatosensory Input After Cervical Spine Manipulation. J. Manip. Physiol. Ther. 2010, 33, 178–188. [Google Scholar] [CrossRef] [PubMed]
- Taylor, H.H.; Murphy, B. The Effects of Spinal Manipulation on Central Integration of Dual Somatosensory Input Observed After Motor Training: A Crossover Study. J. Manip. Physiol. Ther. 2010, 33, 261–272. [Google Scholar] [CrossRef]
- Navid, M.S.; Lelic, D.; Niazi, I.K.; Holt, K.; Mark, E.B.; Drewes, A.M.; Haavik, H. The effects of chiropractic spinal manipulation on central processing of tonic pain - a pilot study using standardized low-resolution brain electromagnetic tomography (sLORETA). Sci. Rep. 2019, 9, 6925. [Google Scholar] [CrossRef] [Green Version]
- Marshall, P.; Murphy, B. The effect of sacroiliac joint manipulation on feed-forward activation times of the deep abdominal musculature. J. Manip. Physiol. Ther. 2006, 29, 196–202. [Google Scholar] [CrossRef]
- Lelic, D.; Niazi, I.K.; Holt, K.; Jochumsen, M.; Dremstrup, K.; Yielder, P.; Murphy, B.; Drewes, A.M.; Haavik, H. Manipulation of Dysfunctional Spinal Joints Affects Sensorimotor Integration in the Prefrontal Cortex: A Brain Source Localization Study. Neural Plast. 2016, 2016, 3704964. [Google Scholar] [CrossRef] [Green Version]
- Haavik, H.; Niazi, I.K.; Jochumsen, M.; Sherwin, D.; Flavel, S.; Türker, K.S. Impact of spinal manipulation on cortical drive to upper and lower limb muscles. Brain Sci. 2017, 7, 2. [Google Scholar] [CrossRef] [Green Version]
- Holt, K.; Niazi, I.K.; Nedergaard, R.W.; Duehr, J.; Amjad, I.; Shafique, M.; Anwar, M.N.; Ndetan, H.; Turker, K.S.; Haavik, H. The effects of a single session of chiropractic care on strength, cortical drive, and spinal excitability in stroke patients. Sci. Rep. 2019, 9, 2673. [Google Scholar] [CrossRef]
- Guérit, J.M.; Witdoeckt, C.; de Tourtchaninoff, M.; Ghariani, S.; Matta, A.; Dion, R.; Verhelst, R. Somatosensory evoked potential monitoring in carotid surgery. I. Relationships between qualitative SEP alterations and intraoperative events. Electroencephalogr. Clin. Neurophysiol. 1997, 104, 459–469. [Google Scholar] [CrossRef]
- Fugl-Meyer, A.R. Post-stroke hemiplegia: Assessment of physical properties. Scand. J. Rehabilitation Med. 1980, 12, 85–93. [Google Scholar]
- Cooperstein, R.; Gleberzon, B.J. Technique Systems in Chiropractic; Churchill Livingstone: London, UK, 2004; ISBN 0443074135. [Google Scholar]
- Triano, J.J.; Budgell, B.; Bagnulo, A.; Roffey, B.; Bergmann, T.; Cooperstein, R.; Gleberzon, B.; Good, C.; Perron, J.; Tepe, R. Review of methods used by chiropractors to determine the site for applying manipulation. Chiropr. Man. Ther. 2013, 21, 36. [Google Scholar] [CrossRef] [PubMed] [Green Version]
- Delorme, A.; Makeig, S. EEGLAB: An open source toolbox for analysis of single-trial EEG dynamics including independent component analysis. J. Neurosci. Methods 2004, 134, 9–21. [Google Scholar] [CrossRef] [PubMed] [Green Version]
- Lopez-Calderon, J.; Luck, S.J. ERPLAB: An open-source toolbox for the analysis of event-related potentials. Front. Hum. Neurosci. 2014, 8, 213. [Google Scholar] [CrossRef] [PubMed] [Green Version]
- Oostenveld, R.; Fries, P.; Maris, E.; Schoffelen, J.M. FieldTrip: Open source software for advanced analysis of MEG, EEG, and invasive electrophysiological data. Comput. Intell. Neurosci. 2011, 2011, 1–9. [Google Scholar] [CrossRef] [PubMed]
- Navid, M.S.; Niazi, I.K.; Lelic, D.; Drewes, A.M.; Haavik, H. The Effects of Filter’s Class, Cutoff Frequencies, and Independent Component Analysis on the Amplitude of Somatosensory Evoked Potentials Recorded from Healthy Volunteers. Sensors (Basel, Switzerland) 2019, 19, 2610. [Google Scholar] [CrossRef] [Green Version]
- Bigdely-Shamlo, N.; Mullen, T.; Kothe, C.; Su, K.-M.; Robbins, K.A. The PREP pipeline: Standardized preprocessing for large-scale EEG analysis. Front. Neuroinformatics 2015, 9, 16. [Google Scholar] [CrossRef]
- Pascual-Marqui, R.D. Standardized low-resolution brain electromagnetic tomography (sLORETA): Technical details. Methods Find. Exp. Clin. Pharmacol. 2002, 24 (Suppl. D), 5–12. [Google Scholar]
- Mazziotta, J.; Toga, A.; Evans, A.; Fox, P.; Lancaster, J.; Zilles, K.; Woods, R.; Paus, T.; Simpson, G.; Pike, B.; et al. A probabilistic atlas and reference system for the human brain: International Consortium for Brain Mapping (ICBM). Philos. Trans. R. Soc. Lond. Ser. B Biol. Sci. 2001, 356, 1293–1322. [Google Scholar] [CrossRef]
- Pascual-Marqui, R.D.; Esslen, M.; Kochi, K.; Lehmann, D. Functional imaging with low-resolution brain electromagnetic tomography (LORETA): A review. In Proceedings of the Methods and Findings in Experimental and Clinical Pharmacology; Prous Science: Barcelona, Spain, 2002; Volume 24, pp. 91–95. [Google Scholar]
- Luck, S.J. An Introduction to the Event-related Potential Technique; MIT Press: Cambridge, MA, USA, 2014; ISBN 9780262525855. [Google Scholar]
- Onton, J. High-frequency broadband modulation of electroencephalographic spectra. Front. Hum. Neurosci. 2009, 3, 61. [Google Scholar] [CrossRef] [Green Version]
- Delorme, A.; Palmer, J.; Onton, J.; Oostenveld, R.; Makeig, S. Independent EEG sources are dipolar. PLoS ONE 2012, 7, e30135. [Google Scholar] [CrossRef] [PubMed]
- Jung, T.P.; Makeig, S.; Humphries, C.; Lee, T.W.; Mckeown, M.J.; Iragui, V.; Sejnowski, T.J. Removing electroencephalographic artifacts by blind source separation. Psychophysiology 2000, 37, 163–178. [Google Scholar] [CrossRef] [PubMed]
- Chaumon, M.; Bishop, D.V.M.; Busch, N.A. A practical guide to the selection of independent components of the electroencephalogram for artifact correction. J. Neurosci. Methods 2015, 250, 47–63. [Google Scholar] [CrossRef]
- Maris, E.; Oostenveld, R. Nonparametric statistical testing of EEG- and MEG-data. J. Neurosci. Methods 2007, 164, 177–190. [Google Scholar] [CrossRef] [PubMed]
- Nichols, T.E.; Holmes, A.P. Nonparametric permutation tests for functional neuroimaging: A primer with examples. Hum. Brain Mapp. 2002, 15, 1–25. [Google Scholar] [CrossRef] [Green Version]
- Allen, M.; Poggiali, D.; Whitaker, K.; Marshall, T.R.; Kievit, R.A. Raincloud plots: A multi-platform tool for robust data visualization. Wellcome Open Res. 2019, 4, 63. [Google Scholar] [CrossRef] [Green Version]
- Finnigan, S.P.; Walsh, M.; Rose, S.E.; Chalk, J.B. Quantitative EEG indices of sub-acute ischaemic stroke correlate with clinical outcomes. Clin. Neurophysiol. 2007, 118, 2525–2532. [Google Scholar] [CrossRef]
- Cebolla, A.M.; Palmero-Soler, E.; Dan, B.; Cheron, G. Frontal phasic and oscillatory generators of the N30 somatosensory evoked potential. NeuroImage 2011, 54, 1297–1306. [Google Scholar] [CrossRef]
- Waberski, T.D.; Buchner, H.; Perkuhn, M.; Gobbelé, R.; Wagner, M.; Kücker, W.; Silny, J. N30 and the effect of explorative finger movements: A model of the contribution of the motor cortex to early somatosensory potentials. Clin. Neurophysiol. 1999, 110, 1589–1600. [Google Scholar] [CrossRef]
- Balzamo, E.; Marquis, P.; Chauvel, P.; Régis, J. Short-latency components of evoked potentials to median nerve stimulation recorded by intracerebral electrodes in the human pre- and postcentral areas. Clin. Neurophysiol. 2004, 115, 1616–1623. [Google Scholar] [CrossRef]
- Rossi, S.; Della Volpe, R.; Ginanneschi, F.; Ulivelli, M.; Bartalini, S.; Spidalieri, R.; Rossi, A. Early somatosensory processing during tonic muscle pain in humans: Relation to loss of proprioception and motor “defensive” strategies. Clin. Neurophysiol. 2003, 114, 1351–1358. [Google Scholar] [CrossRef]
- Andrew, D.; Haavik, H.; Dancey, E.; Yielder, P.; Murphy, B. Somatosensory evoked potentials show plastic changes following a novel motor training task with the thumb. Clin. Neurophysiol. 2015, 126, 575–580. [Google Scholar] [CrossRef] [PubMed]
- Treleaven, J. Sensorimotor disturbances in neck disorders affecting postural stability, head and eye movement control. Man. Ther. 2008, 13, 2–11. [Google Scholar] [CrossRef] [PubMed]
- Passmore, S.R.; Murphy, B.; Lee, T.D. The origin, and application of somatosensory evoked potentials as a neurophysiological technique to investigate neuroplasticity. J. Can. Chiropr. Assoc. 2014, 58, 170–183. [Google Scholar] [PubMed]
- Leahy, R.M.; Mosher, J.C.; Spencer, M.E.; Huang, M.X.; Lewine, J.D. A study of dipole localization accuracy for MEG and EEG using a human skull phantom. Electroencephalogr. Clin. Neurophysiol. 1998, 107, 159–173. [Google Scholar] [CrossRef]
- Cuffin, B.N. EEG localization accuracy improvements using realistically shaped head models. IEEE Trans. Bio-Med. Eng. 1996, 43, 299–303. [Google Scholar] [CrossRef]
- Waberski, T.D.; Buchner, H.; Lehnertz, K.; Hufnagel, A.; Fuchs, M.; Beckmann, R.; Rienäcker, A. Properties of advanced headmodelling and source reconstruction for the localization of epileptiform activity. Brain Topogr. 1998, 10, 283–290. [Google Scholar] [CrossRef]
- Wang, L.; Yu, C.; Chen, H.; Qin, W.; He, Y.; Fan, F.; Zhang, Y.; Wang, M.; Li, K.; Zang, Y.; et al. Dynamic functional reorganization of the motor execution network after stroke. Brain 2010, 133, 1224–1238. [Google Scholar] [CrossRef] [Green Version]
- Haavik, H.; Özyurt, M.G.; Niazi, I.K.; Holt, K.; Nedergaard, R.W.; Yilmaz, G.; Türker, K.S. Chiropractic Manipulation Increases Maximal Bite Force in Healthy Individuals. Brain Sci. 2018, 8, 76. [Google Scholar] [CrossRef] [Green Version]


| No. | Age (Years) | Type of Stroke | Area Involved | Affected Hemisphere | FM Score | Time Since Event (Months) |
|---|---|---|---|---|---|---|
| 1 | 54 | Ischemia | MCA | Left | 55 | 24 |
| 2 | 51 | Ischemia | ACA | Left | 57 | 18 |
| 3 | 68 | Hemorrhage | MCA | Left | 41 | 60 |
| 4 | 75 | Ischemia | ACA | Right | 76 | 12 |
| 5 | 36 | Ischemia | MCA | Left | 64 | 18 |
| 6 | 61 | Hemorrhage | MCA | Left | 83 | 5 |
| 7 | 33 | Ischemia | MCA | Left | 55 | 5 |
| 8 | 48 | Ischemia | MCA | Left | 64 | 24 |
| 9 | 56 | Ischemia | MCA | Left | 63 | 5 |
| 10 | 58 | Ischemia | MCA | Left | 76 | 25 |
| 11 | 41 | Hemorrhage | MCA | Right | 64 | 20 |
| 12 | 62 | Ischemia | MCA | Right | 72 | 16 |
| 13 | 46 | Ischemia | MCA | Right | 54 | 13 |
| 14 | 33 | Hemorrhage | MCA | Right | 71 | 46 |
| 15 | 51 | Ischemia | MCA | Right | 46 | 23 |
| 16 | 66 | Ischemia | MCA | Right | 78 | 12 |
| 17 * | 63 | Hemorrhage | ACA | Right | 21 | 50 |
| 18 | 58 | Ischemia | MCA | Left | 63 | 16 |
| 19 * | 38 | Hemorrhage | MCA | Right | 58 | 3 |
| Intervention | Session | DAR | BSI1-25 Hz | BSIdelta | BSItheta | BSIalpha | BSIbeta | BSIgamma | ||||||
|---|---|---|---|---|---|---|---|---|---|---|---|---|---|---|
| Value | dir | Value | dir | Value | dir | Value | dir | Value | dir | Value | dir | |||
| Control | Pre | 2.37 ± 1.70 | 0.44 ± 0.17 | 0.08 ± 0.24 | 0.48 ± 0.17 | 0.11 ± 0.25 | 0.48 ± 0.15 | 0.11 ± 0.27 | 0.47 ± 0.21 | 0.03 ± 0.26 | 0.41 ± 0.16 | 0.01 ± 0.22 | 0.46 ± 0.10 | 0.07 ± 0.22 |
| Post | 2.12 ± 1.55 | 0.42 ± 0.16 | 0.08 ± 0.23 | 0.47 ± 0.17 | 0.11 ± 0.24 | 0.48 ± 0.16 | 0.12 ± 0.27 | 0.44 ± 0.21 | 0.02 ± 0.25 | 0.39 ± 0.14 | −0.01 ± 0.21 | 0.47 ± 0.14 | 0.04 ± 0.28 | |
| Chiropractic | Pre | 2.48 ± 2.20 | 0.38 ± 0.11 | 0.11 ± 0.14 | 0.43 ± 0.15 | 0.15 ± 0.14 | 0.41 ± 0.14 | 0.15 ± 0.16 | 0.40 ± 0.17 | 0.04 ± 0.18 | 0.35 ± 0.08 | −0.01 ± 0.14 | 0.40 ± 0.09 | 0.02 ± 0.21 |
| Post | 2.05 ± 1.14 | 0.44 ± 0.21 | 0.09 ± 0.19 | 0.45 ± 0.18 | 0.11 ± 0.19 | 0.49 ± 0.24 | 0.11 ± 0.19 | 0.51 ± 0.25 | 0.06 ± 0.22 | 0.38 ± 0.21 | 0.01 ± 0.17 | 0.41 ± 0.16 | 0.03 ± 0.16 | |
| Predictor | df_num | df_den | SS_num | SS_den | F | p Value |
|---|---|---|---|---|---|---|
| (Intercept) | 1 | 16 | 501.38 | 112.10 | 71.56 | 0.00 |
| intervention | 1 | 16 | 0.58 | 7.61 | 1.21 | 0.30 |
| session | 1 | 16 | 0.57 | 2.29 | 3.99 | 0.06 |
| intervention × session | 1 | 16 | 1.20 | 3.37 | 5.71 | 0.03 |
| Region | Control | Chiropractic | ||||||||
|---|---|---|---|---|---|---|---|---|---|---|
| X | Y | Z | AUC Pre | AUC Post | X | Y | Z | AUC Pre | AUC Post | |
| SI | 26 ± 11 | −31 ± 9 | 38 ± 7 | 897 ± 492 | 941 ± 482 | 27 ± 6 | −29 ± 11 | 36 ± 7 | 1001 ± 589 | 949 ± 473 |
| Pre Frontal | 3 ± 13 | 44 ± 3 | 16 ± 5 | 349 ± 208 | 383 ± 226 | −4 ± 18 | 44 ± 6 | 11 ± 5 | 376 ± 276 | 418 ± 260 |
| Cingulate | −22 ± 27 | −5 ± 10 | −6 ± 4 | 537 ± 354 | 474 ± 383 | −18 ± 31 | −4 ± 11 | −6 ± 7 | 530 ± 412 | 494 ± 281 |
| Cont. SII | 27 ± 8 | −52 ± 9 | −14 ± 3 | 449 ± 236 | 515 ± 314 | 27 ± 12 | −49 ± 13 | −14 ± 2 | 511 ± 328 | 518 ± 286 |
| Ips. SII | −28 ± 10 | −52 ± 13 | −9 ± 12 | 362 ± 172 | 348 ± 172 | −28 ± 8 | −48 ± 15 | −12 ± 11 | 336 ± 191 | 336 ± 172 |
© 2020 by the authors. Licensee MDPI, Basel, Switzerland. This article is an open access article distributed under the terms and conditions of the Creative Commons Attribution (CC BY) license (http://creativecommons.org/licenses/by/4.0/).
Share and Cite
Navid, M.S.; Niazi, I.K.; Lelic, D.; Nedergaard, R.B.; Holt, K.; Amjad, I.; Drewes, A.M.; Haavik, H. Investigating the Effects of Chiropractic Spinal Manipulation on EEG in Stroke Patients. Brain Sci. 2020, 10, 253. https://0-doi-org.brum.beds.ac.uk/10.3390/brainsci10050253
Navid MS, Niazi IK, Lelic D, Nedergaard RB, Holt K, Amjad I, Drewes AM, Haavik H. Investigating the Effects of Chiropractic Spinal Manipulation on EEG in Stroke Patients. Brain Sciences. 2020; 10(5):253. https://0-doi-org.brum.beds.ac.uk/10.3390/brainsci10050253
Chicago/Turabian StyleNavid, Muhammad Samran, Imran Khan Niazi, Dina Lelic, Rasmus Bach Nedergaard, Kelly Holt, Imran Amjad, Asbjørn Mohr Drewes, and Heidi Haavik. 2020. "Investigating the Effects of Chiropractic Spinal Manipulation on EEG in Stroke Patients" Brain Sciences 10, no. 5: 253. https://0-doi-org.brum.beds.ac.uk/10.3390/brainsci10050253