Salivary Redox Biomarkers in Different Stages of Dementia Severity


 ,
,  and
and
Abstract
:1. Introduction
2. Materials and Methods
2.1. Ethical Issues
2.2. Patients
2.3. Research Material
2.4. Blood Collection
2.5. Saliva Collection
- Between 8 am and 10 am (in order to minimize the effect of daily rhythms on saliva secretion) in a room providing intimate conditions,
- After rinsing the oral cavity three times with distilled water at room temperature,
- In a seated position, with the head slightly inclined downwards, and minimised facial and lip movements,
- The saliva accumulated at the bottom of the oral cavity was spat out into a sterile Falcon tube placed in an ice container. The saliva collected within the first minute was disposed of.
2.6. Dental Examination
2.7. Redox Assays
2.8. Antioxidant Assays
2.9. Oxidative Damage Assays
2.10. Protein Glycoxidation Assays
2.11. Total Protein Assay
2.12. Statistical Analysis
3. Results
3.1. Clinical Characteristics
3.2. Dental Examination
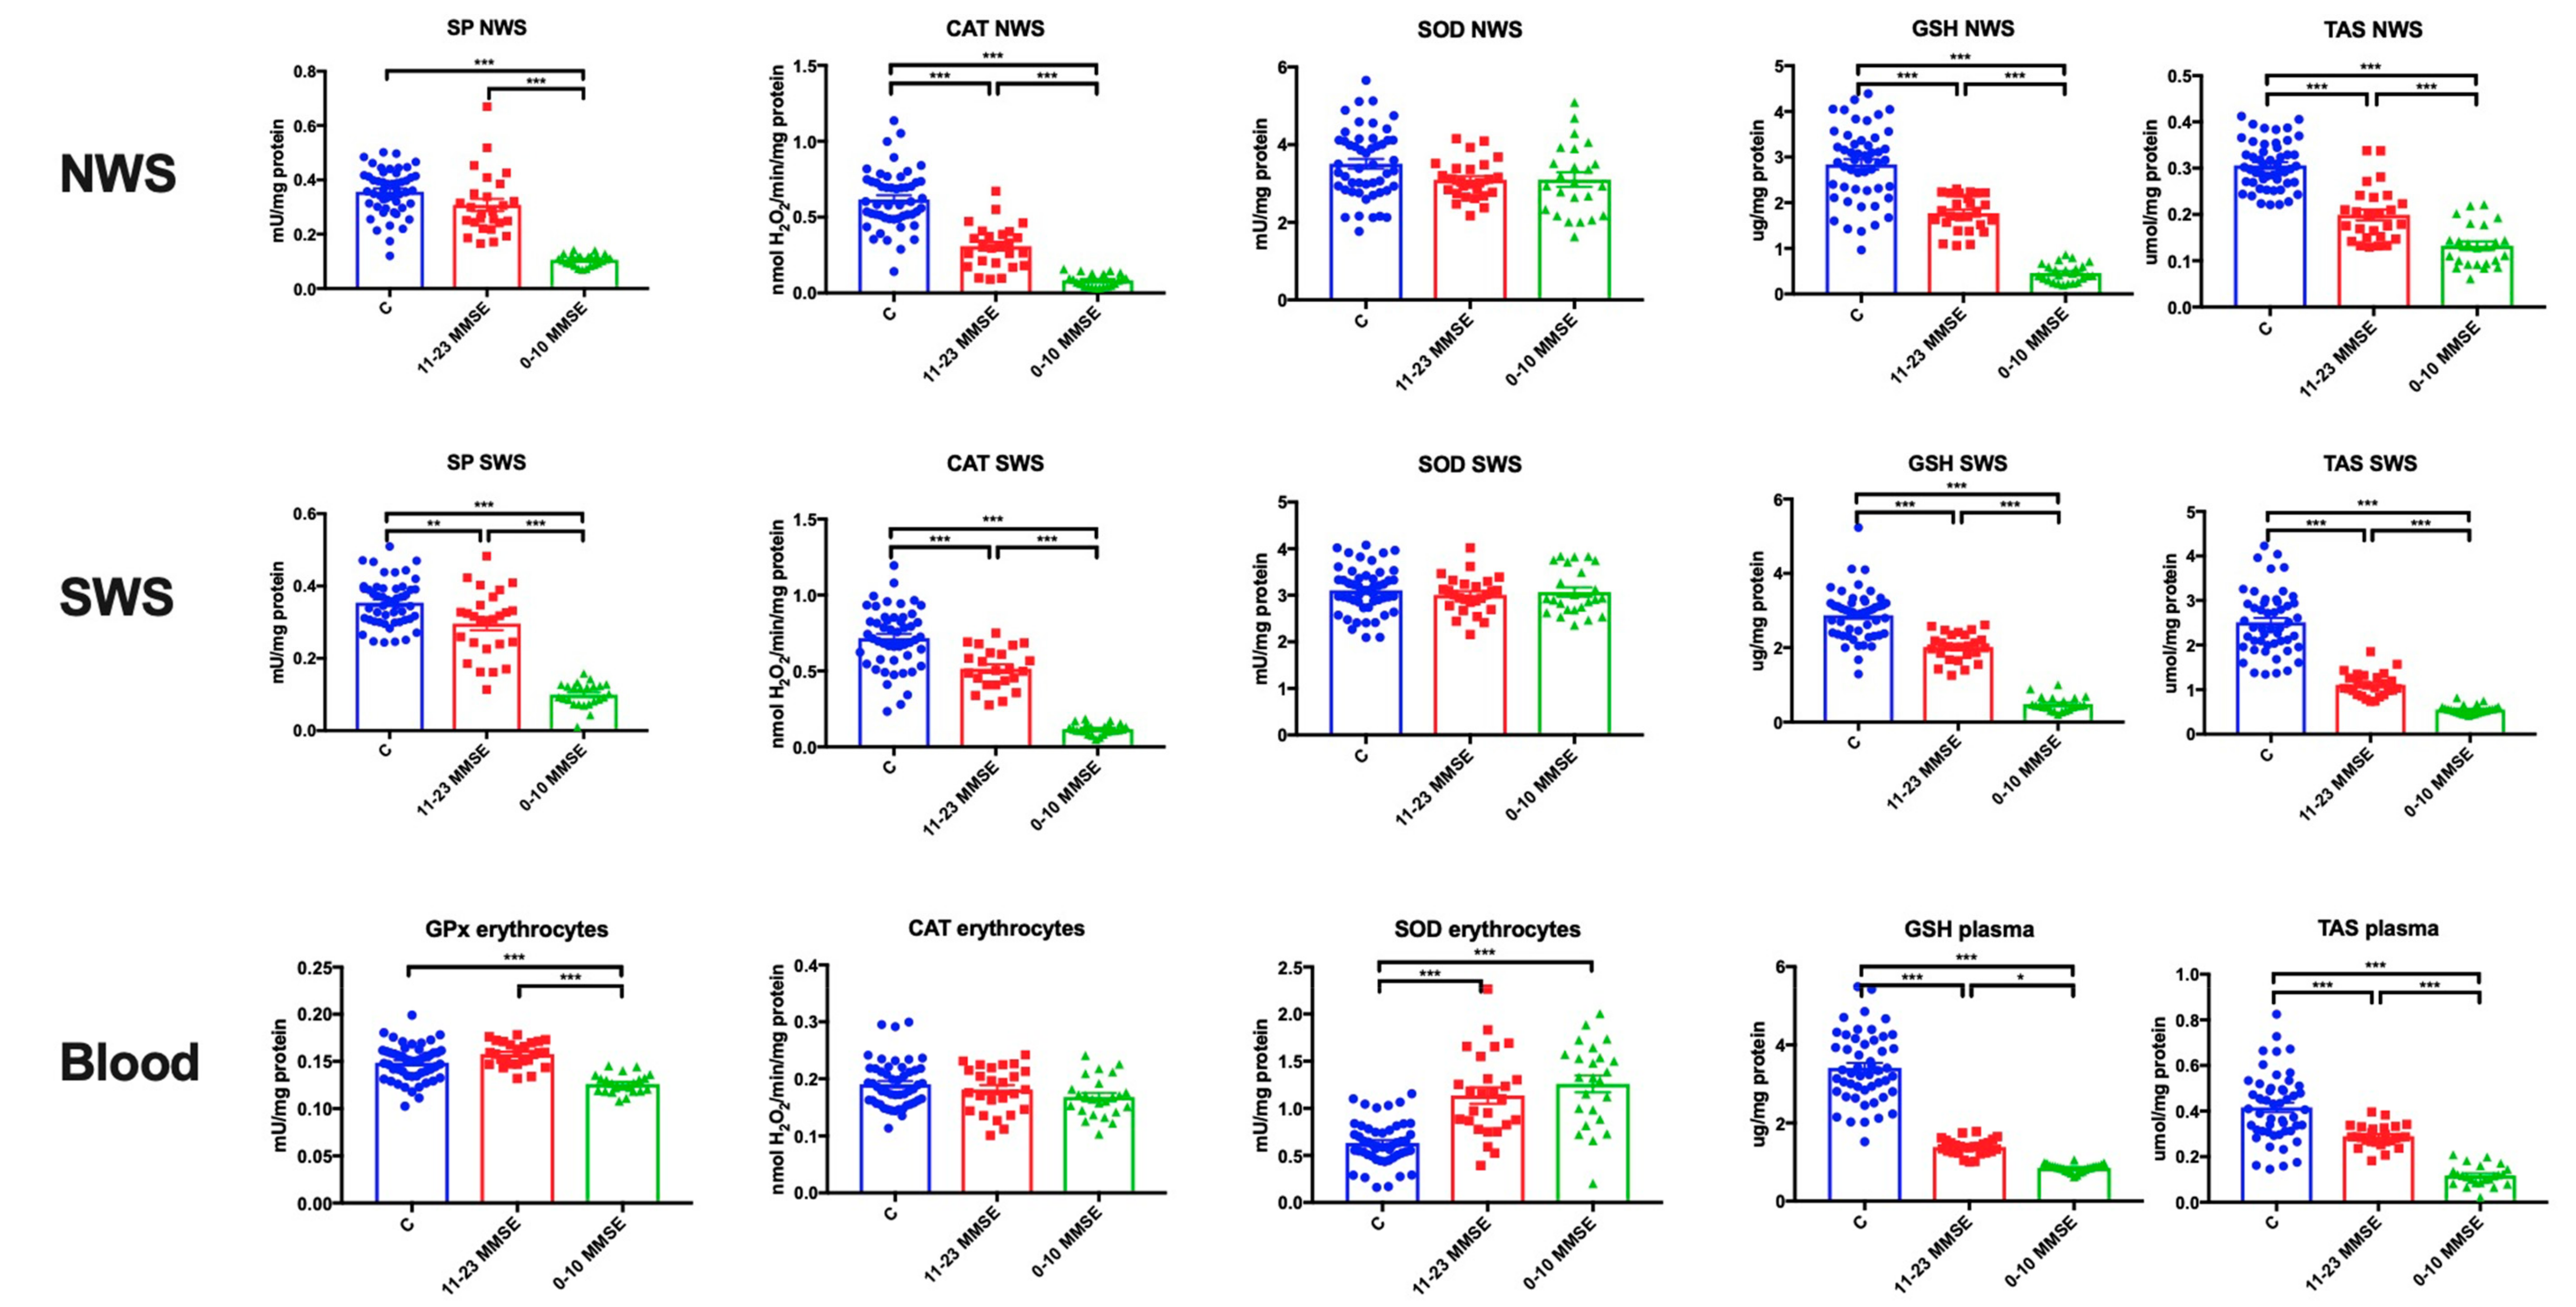
3.3. Antioxidant Defences
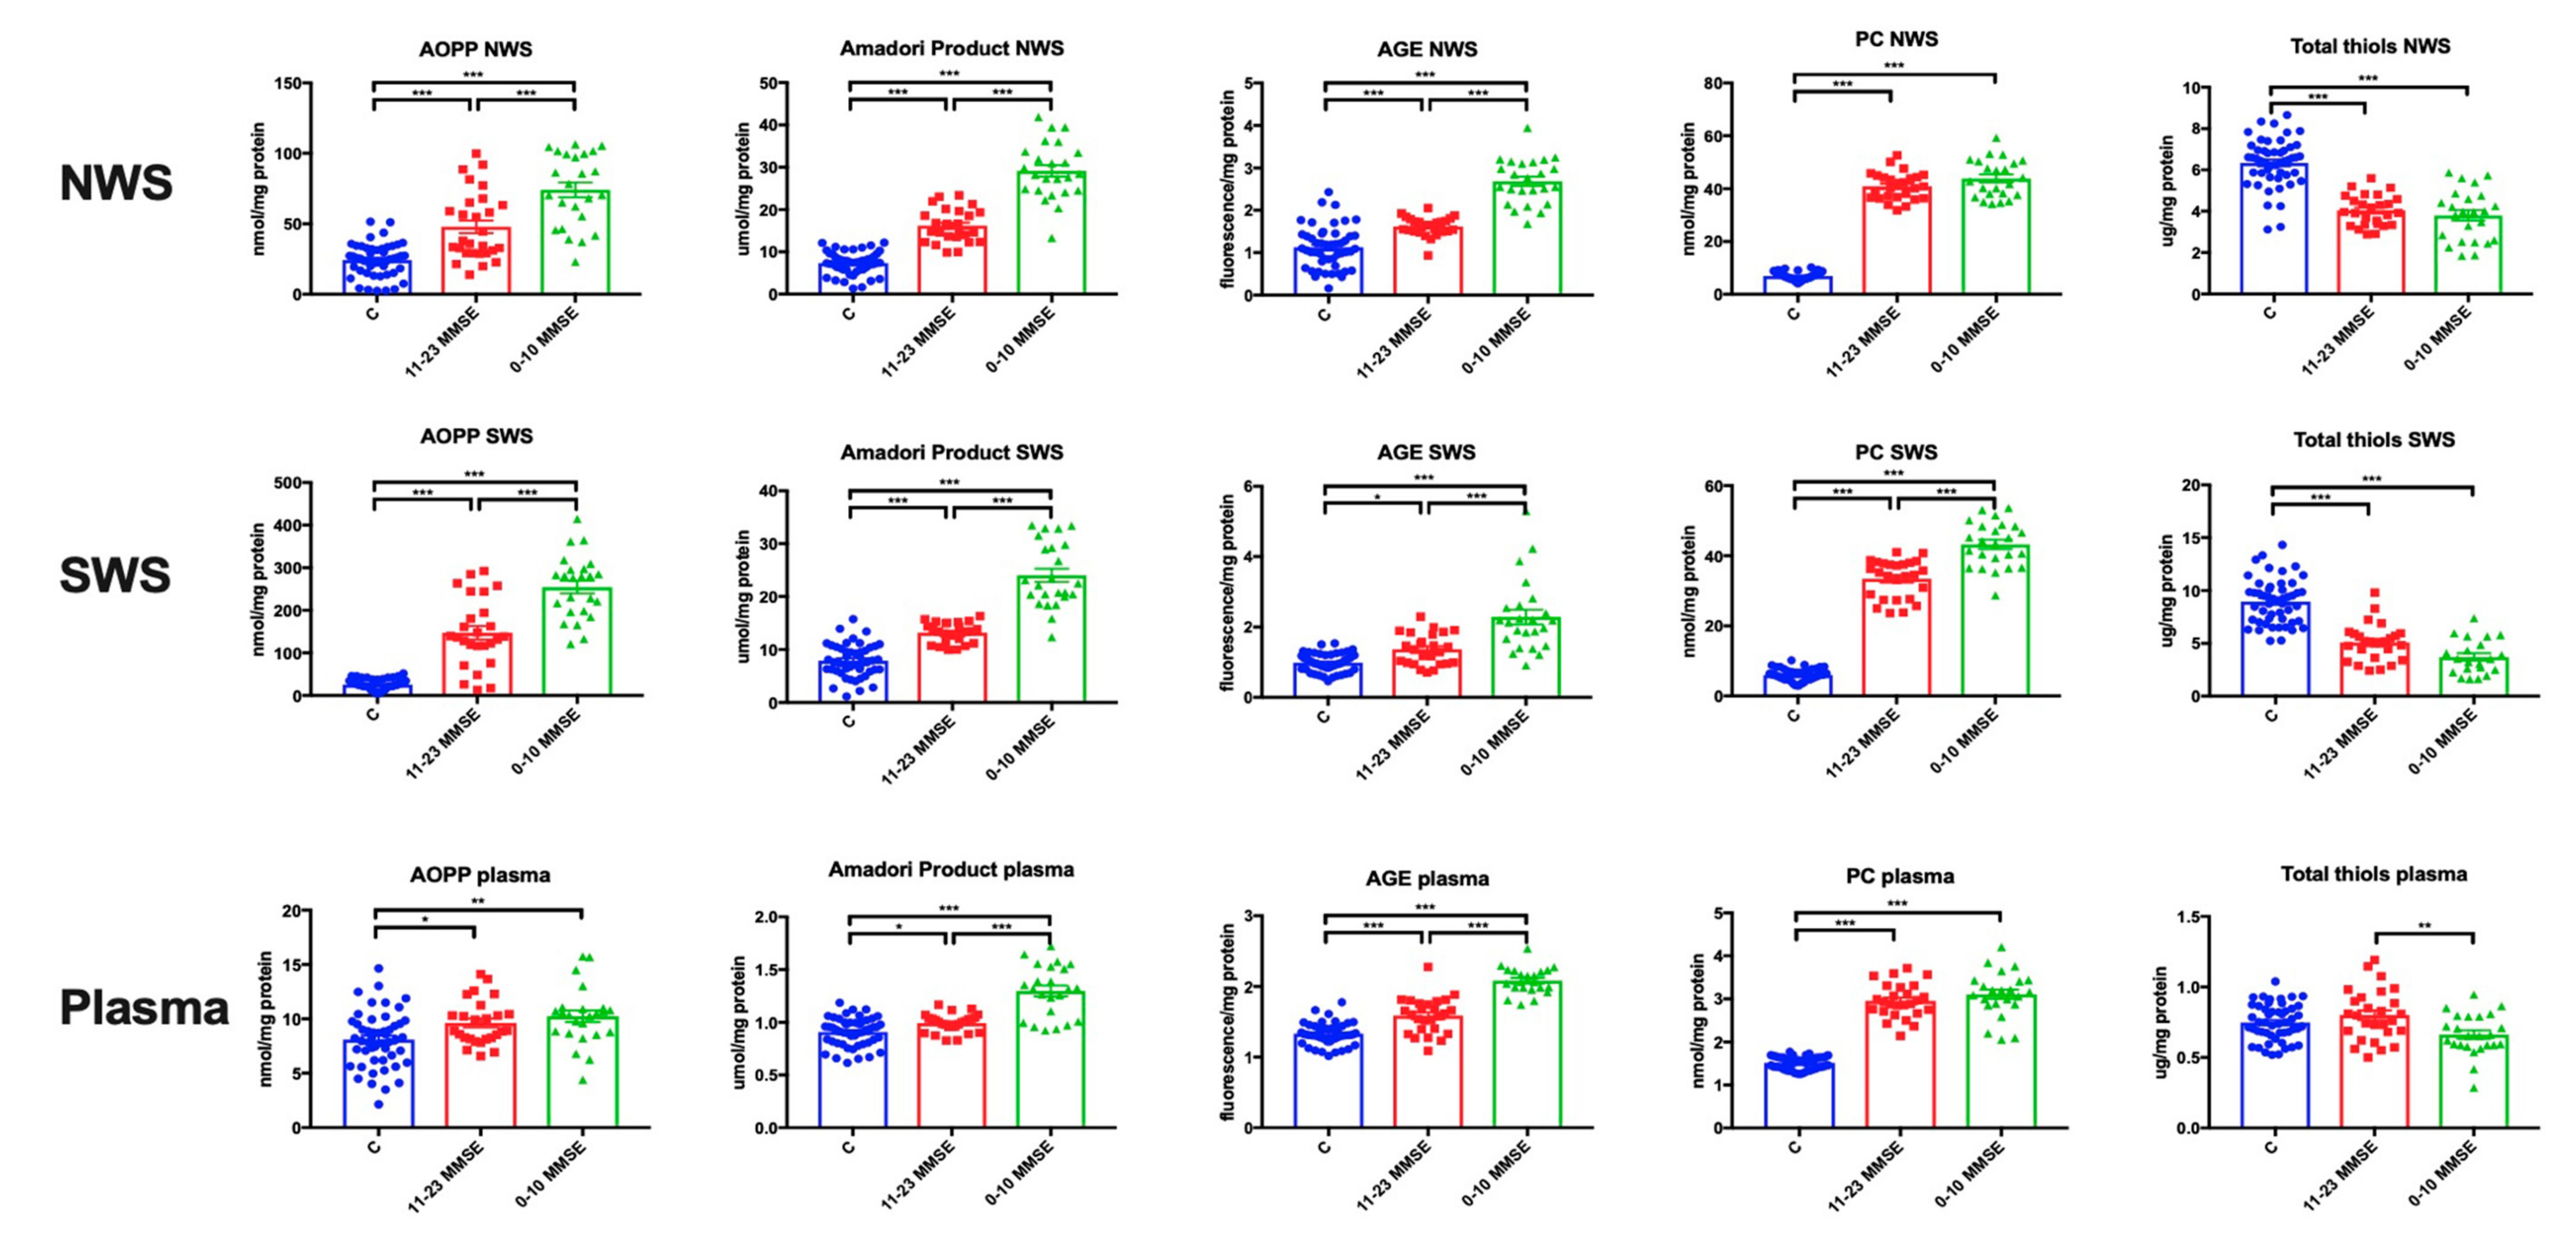
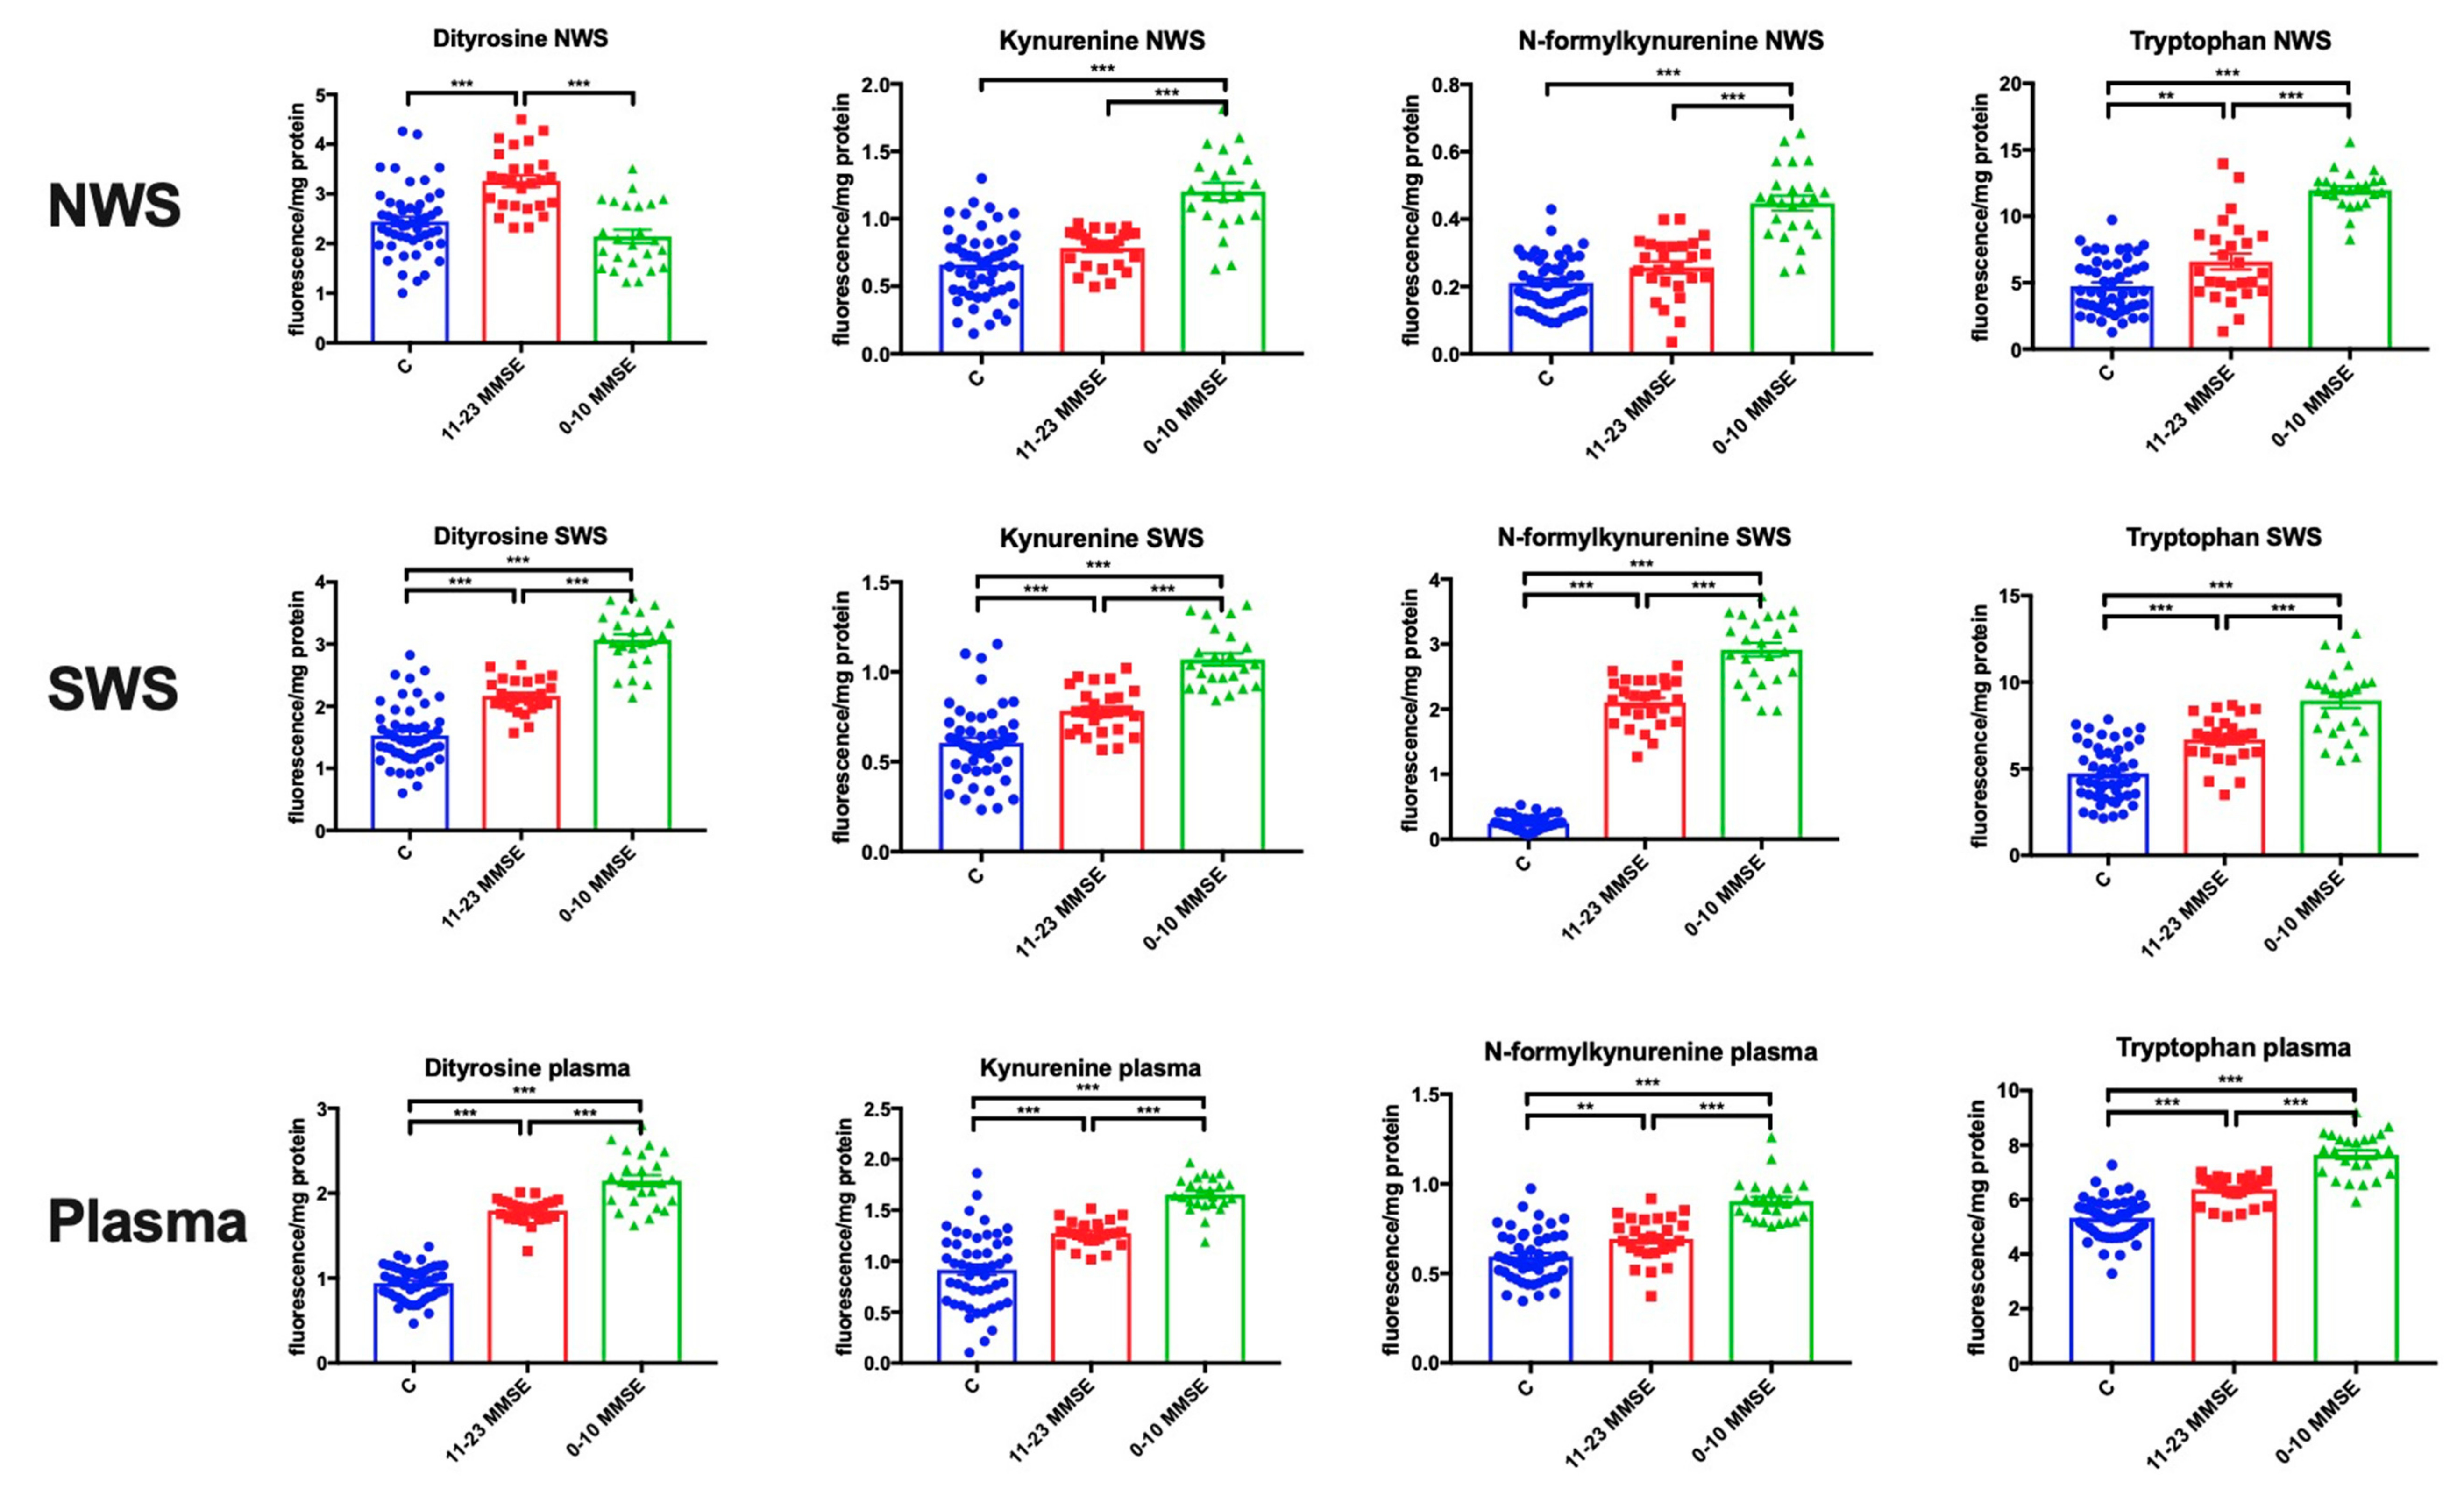
3.4. Oxidative Damage to Proteins
3.5. Protein Glycoxidation
3.6. Effects of the Type of Dementia, Gender and Age of Patients
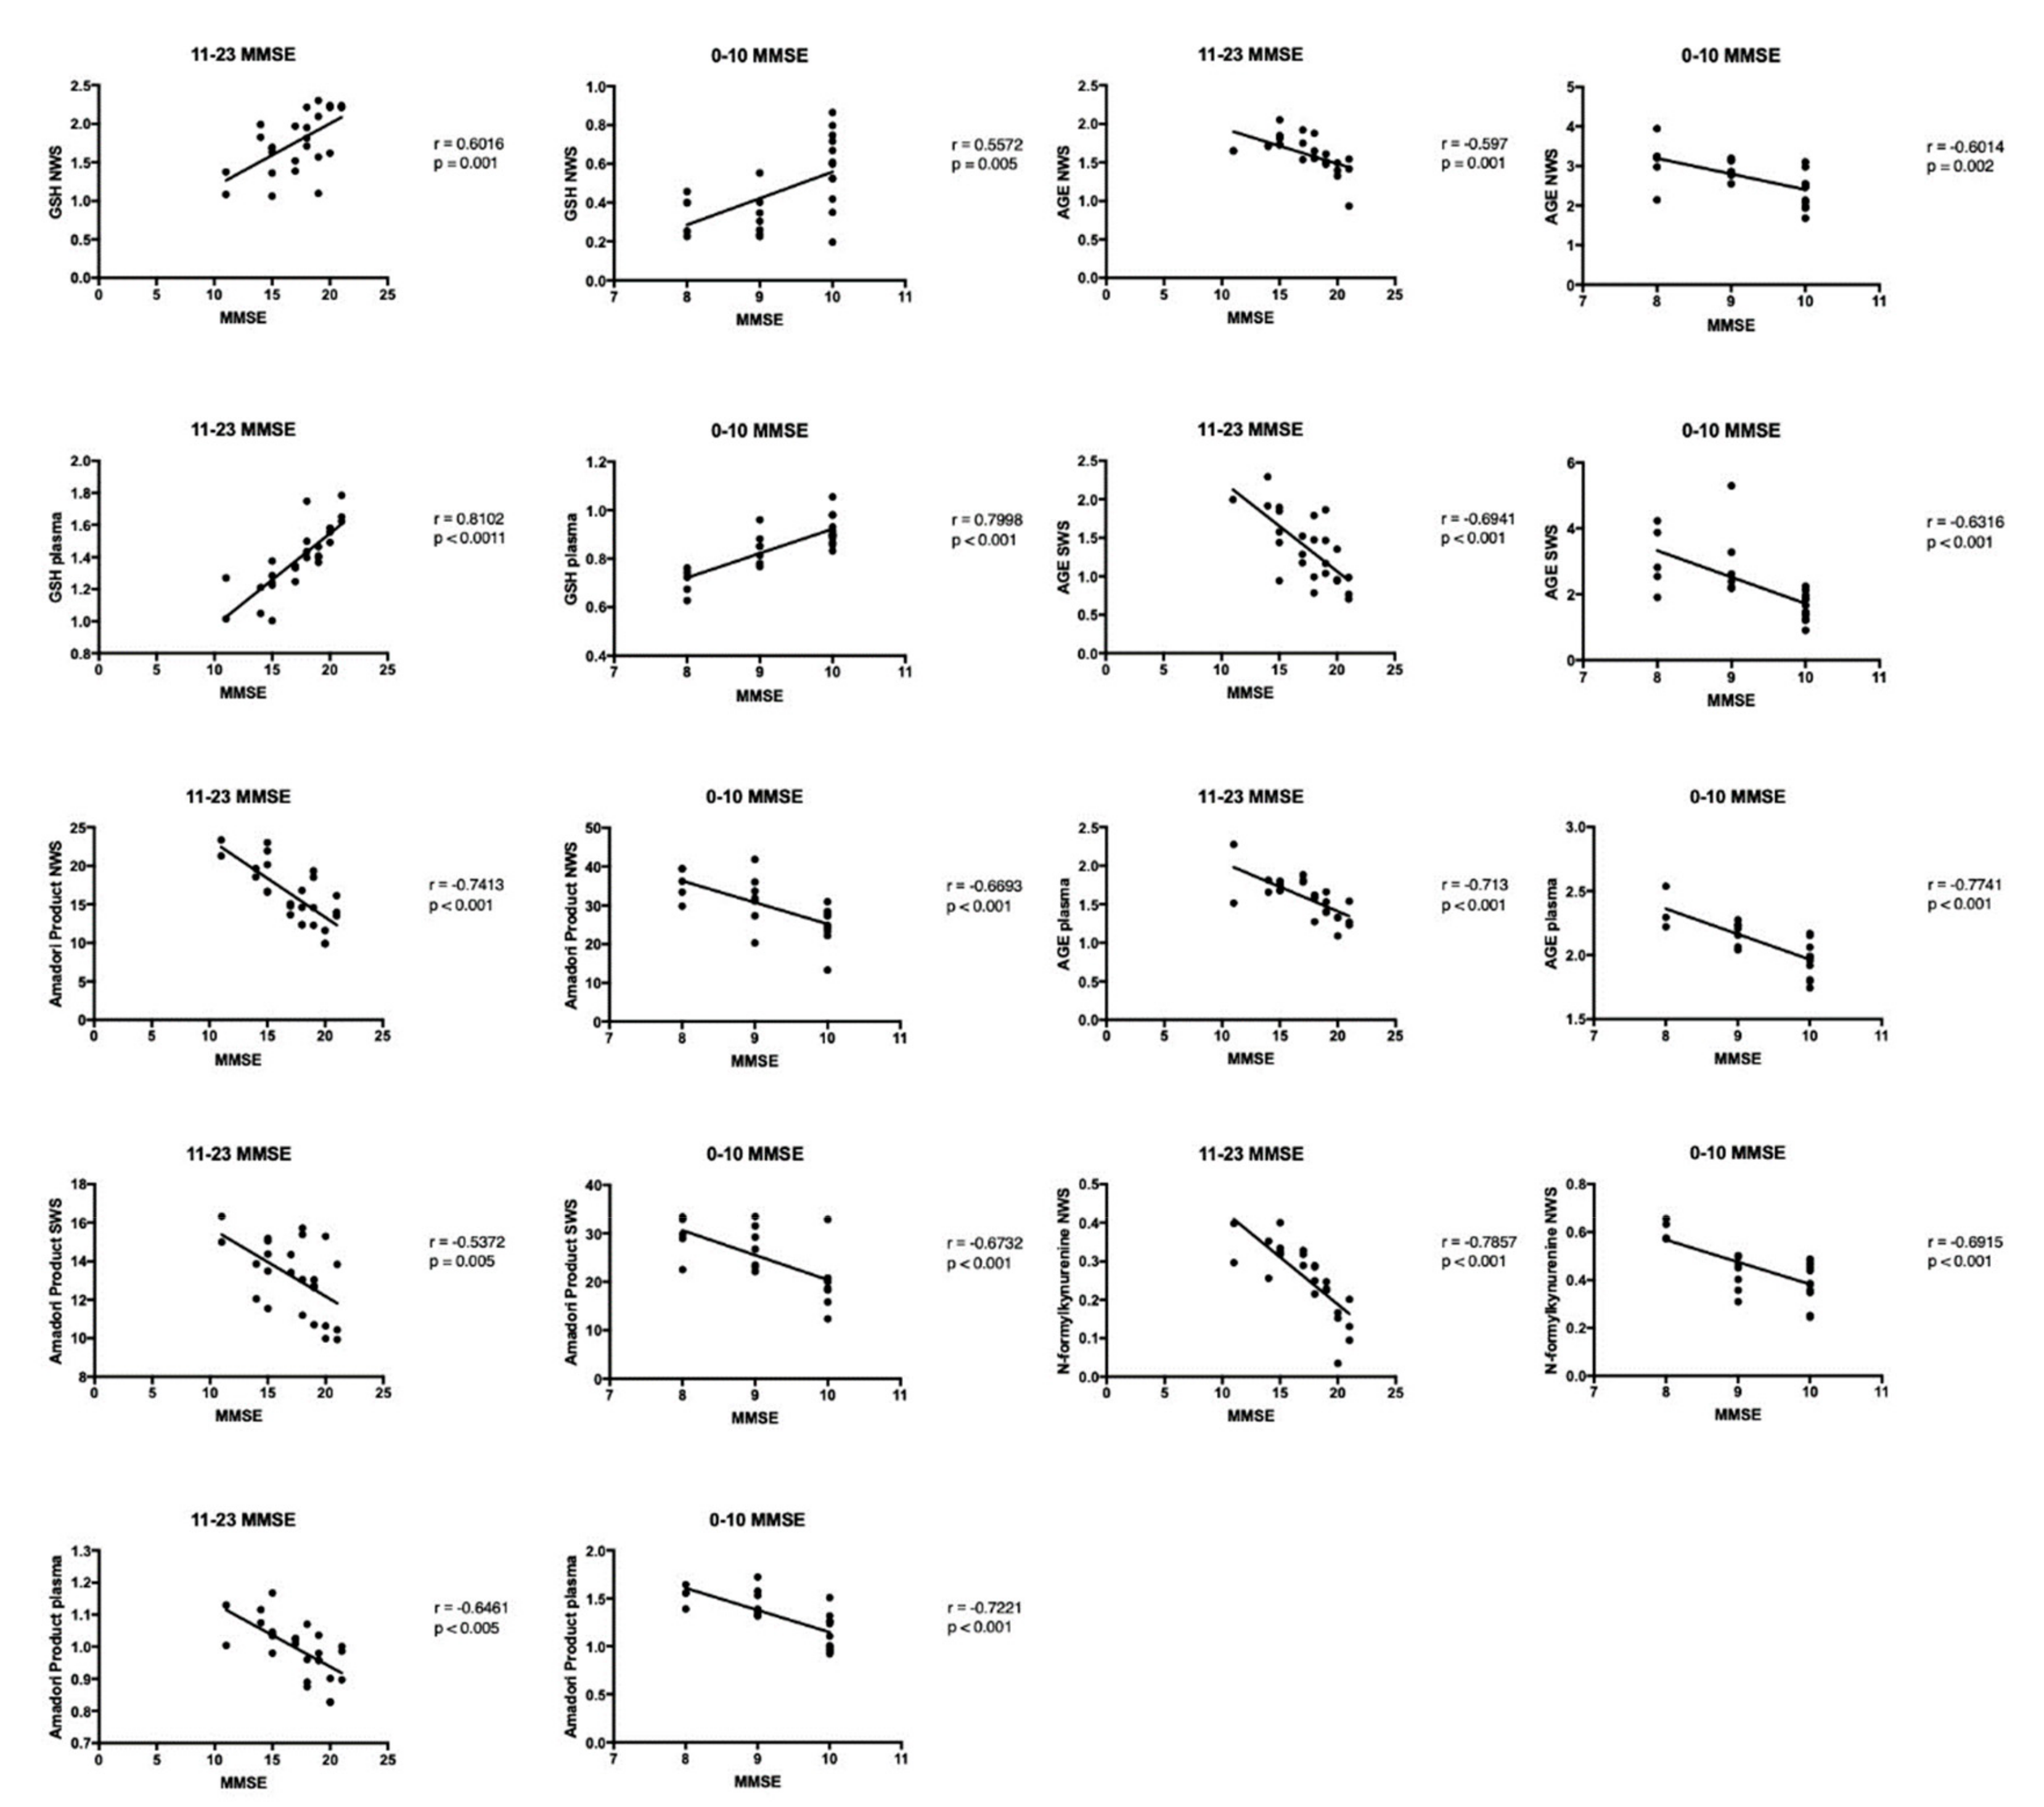
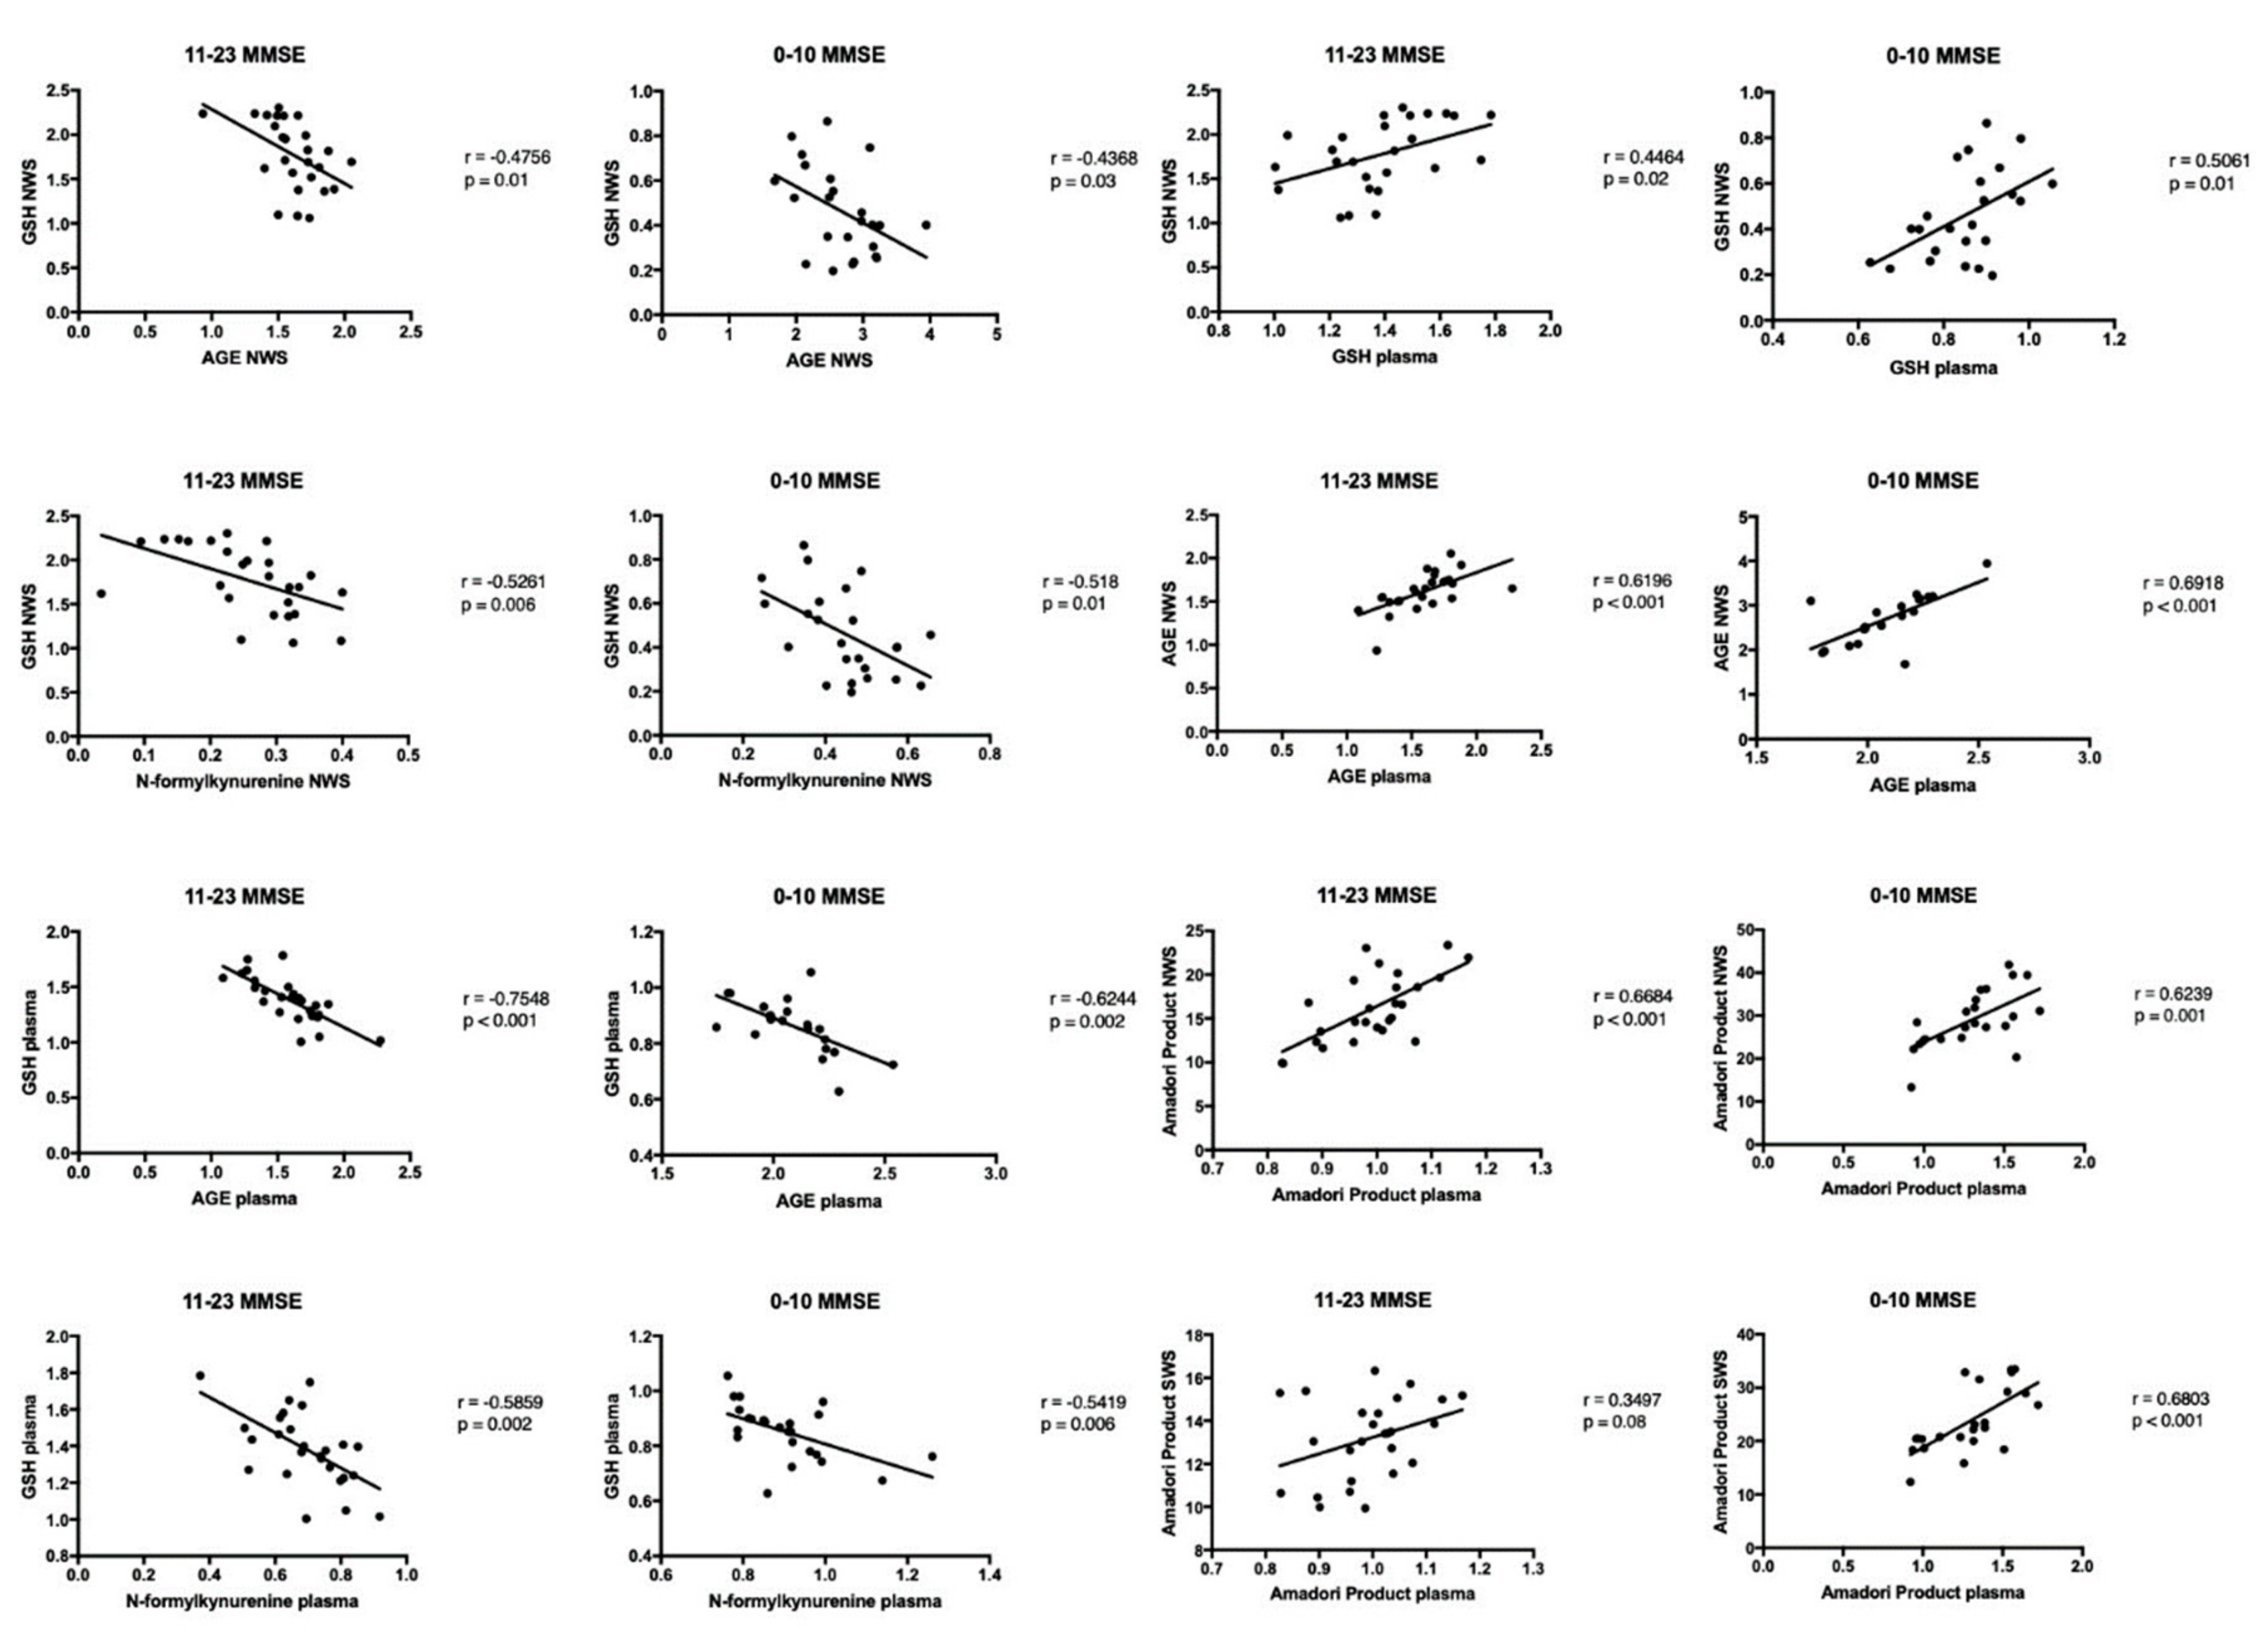
3.7. Correlations
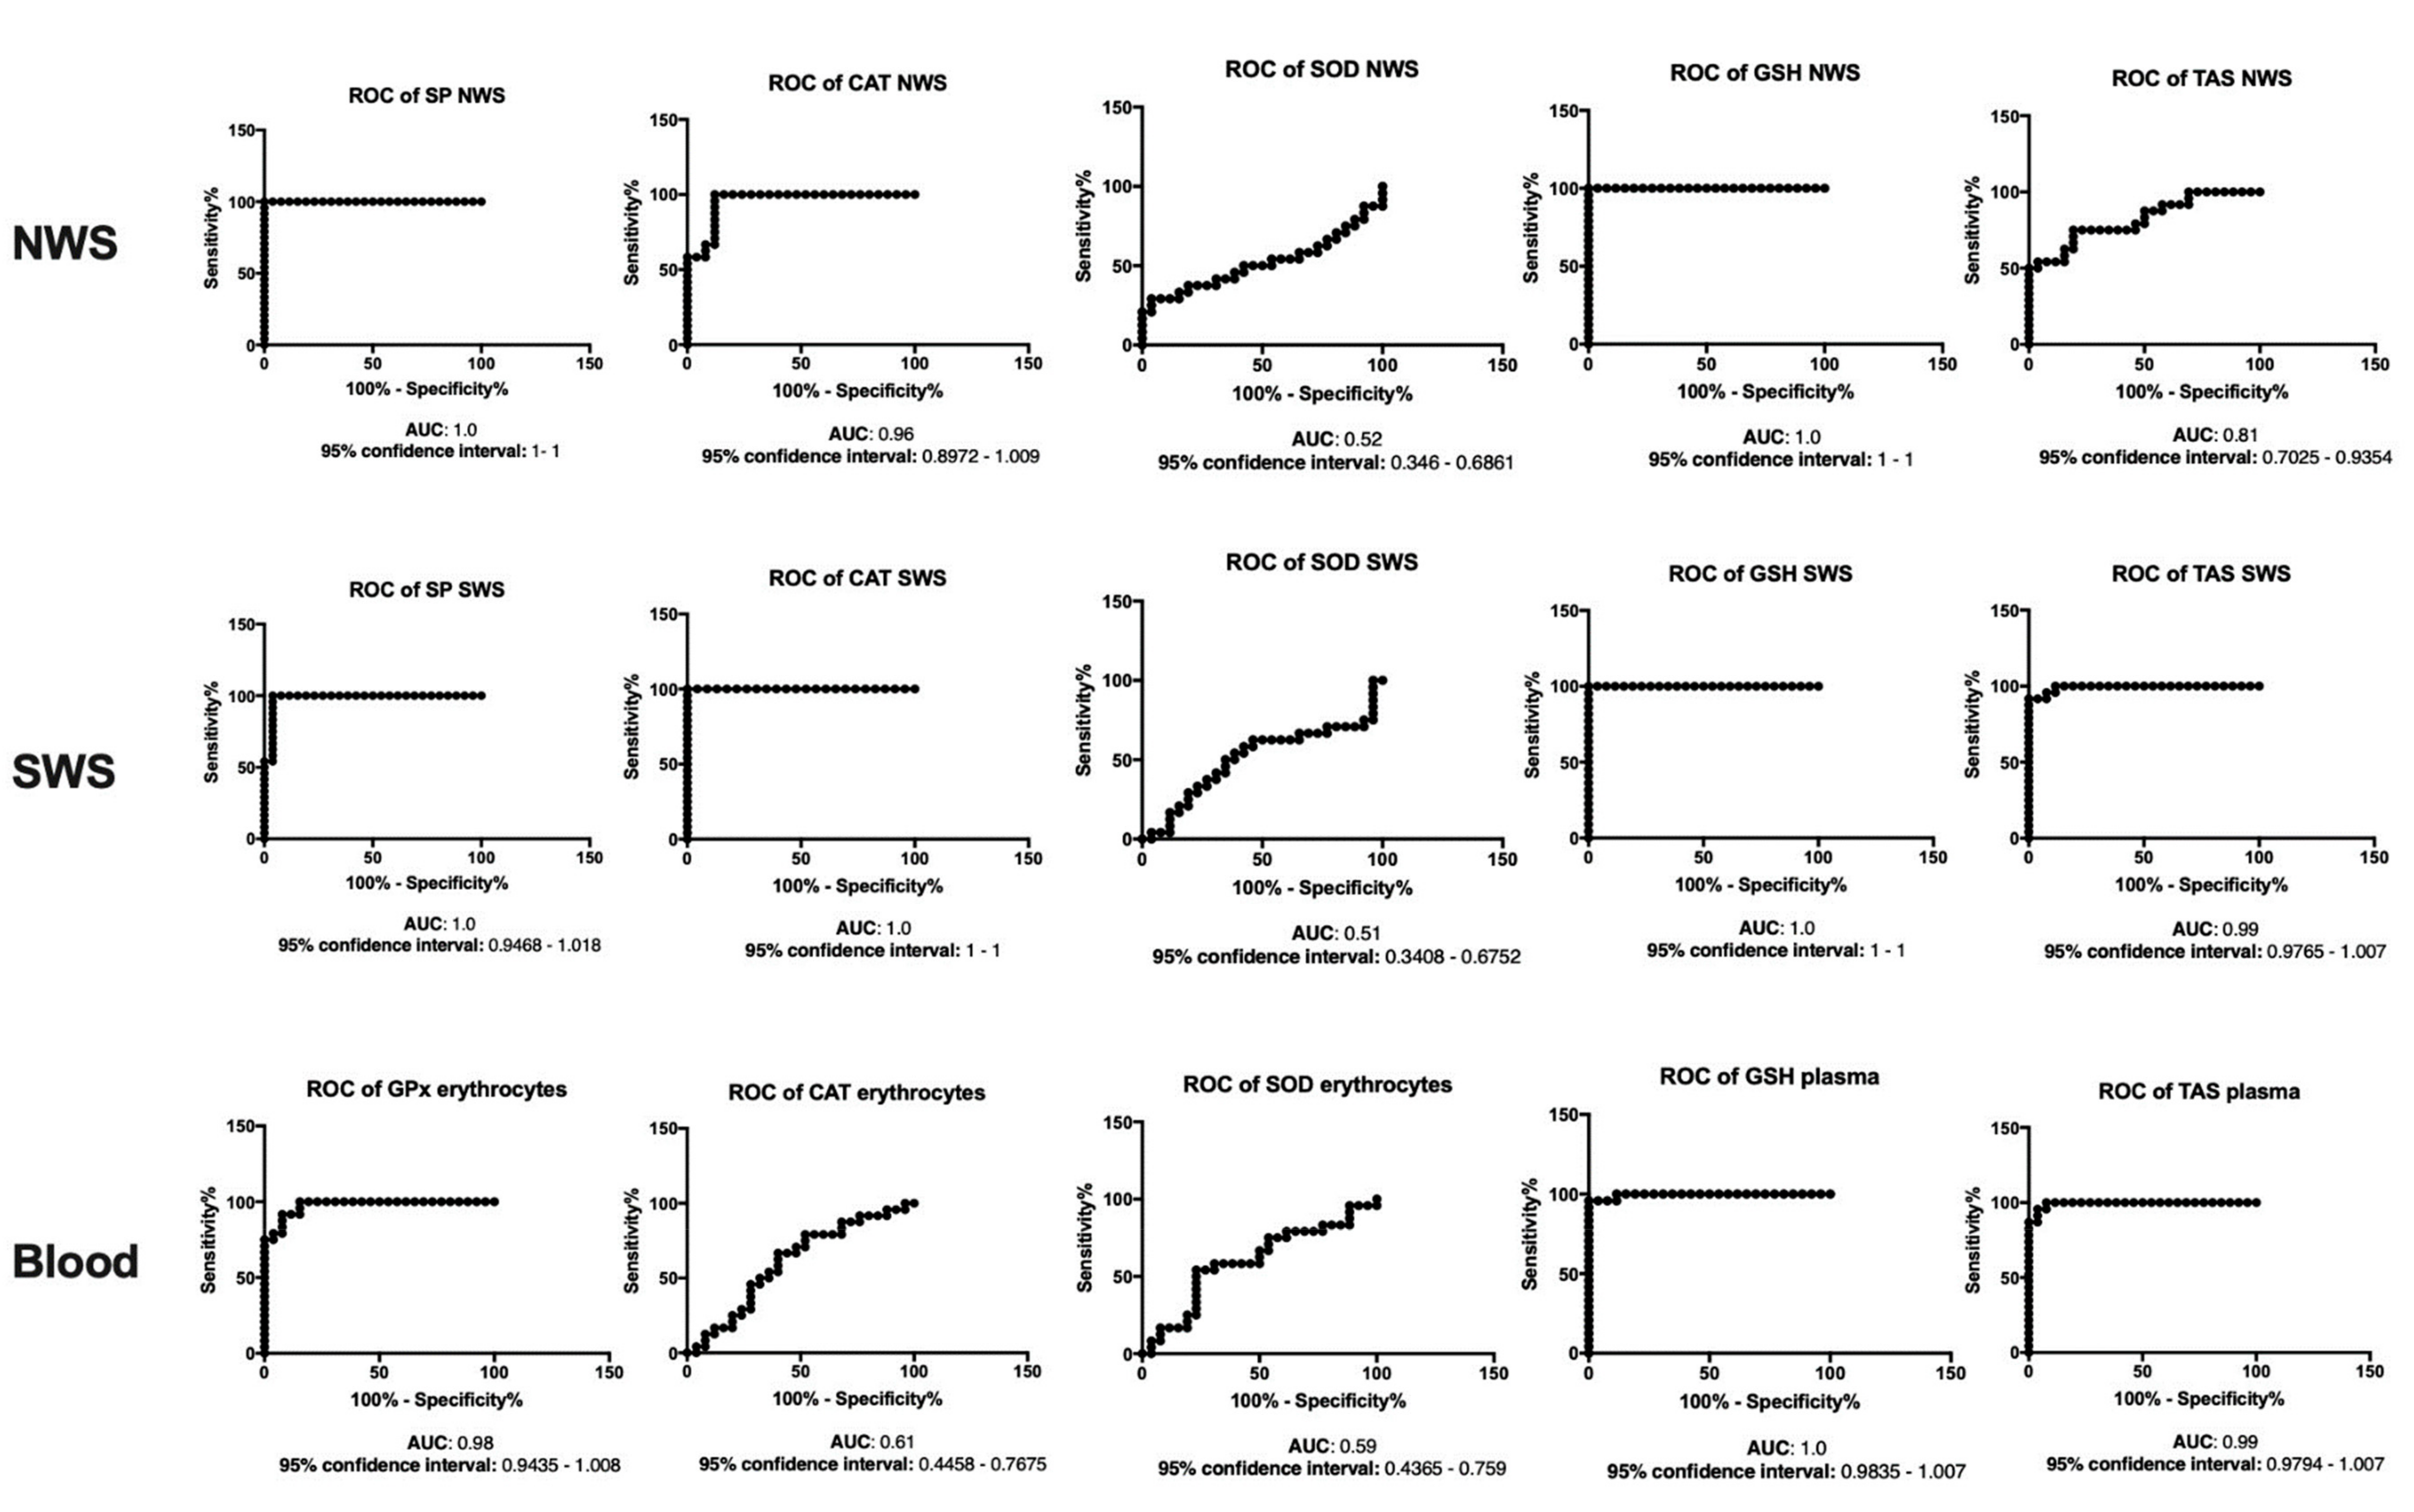
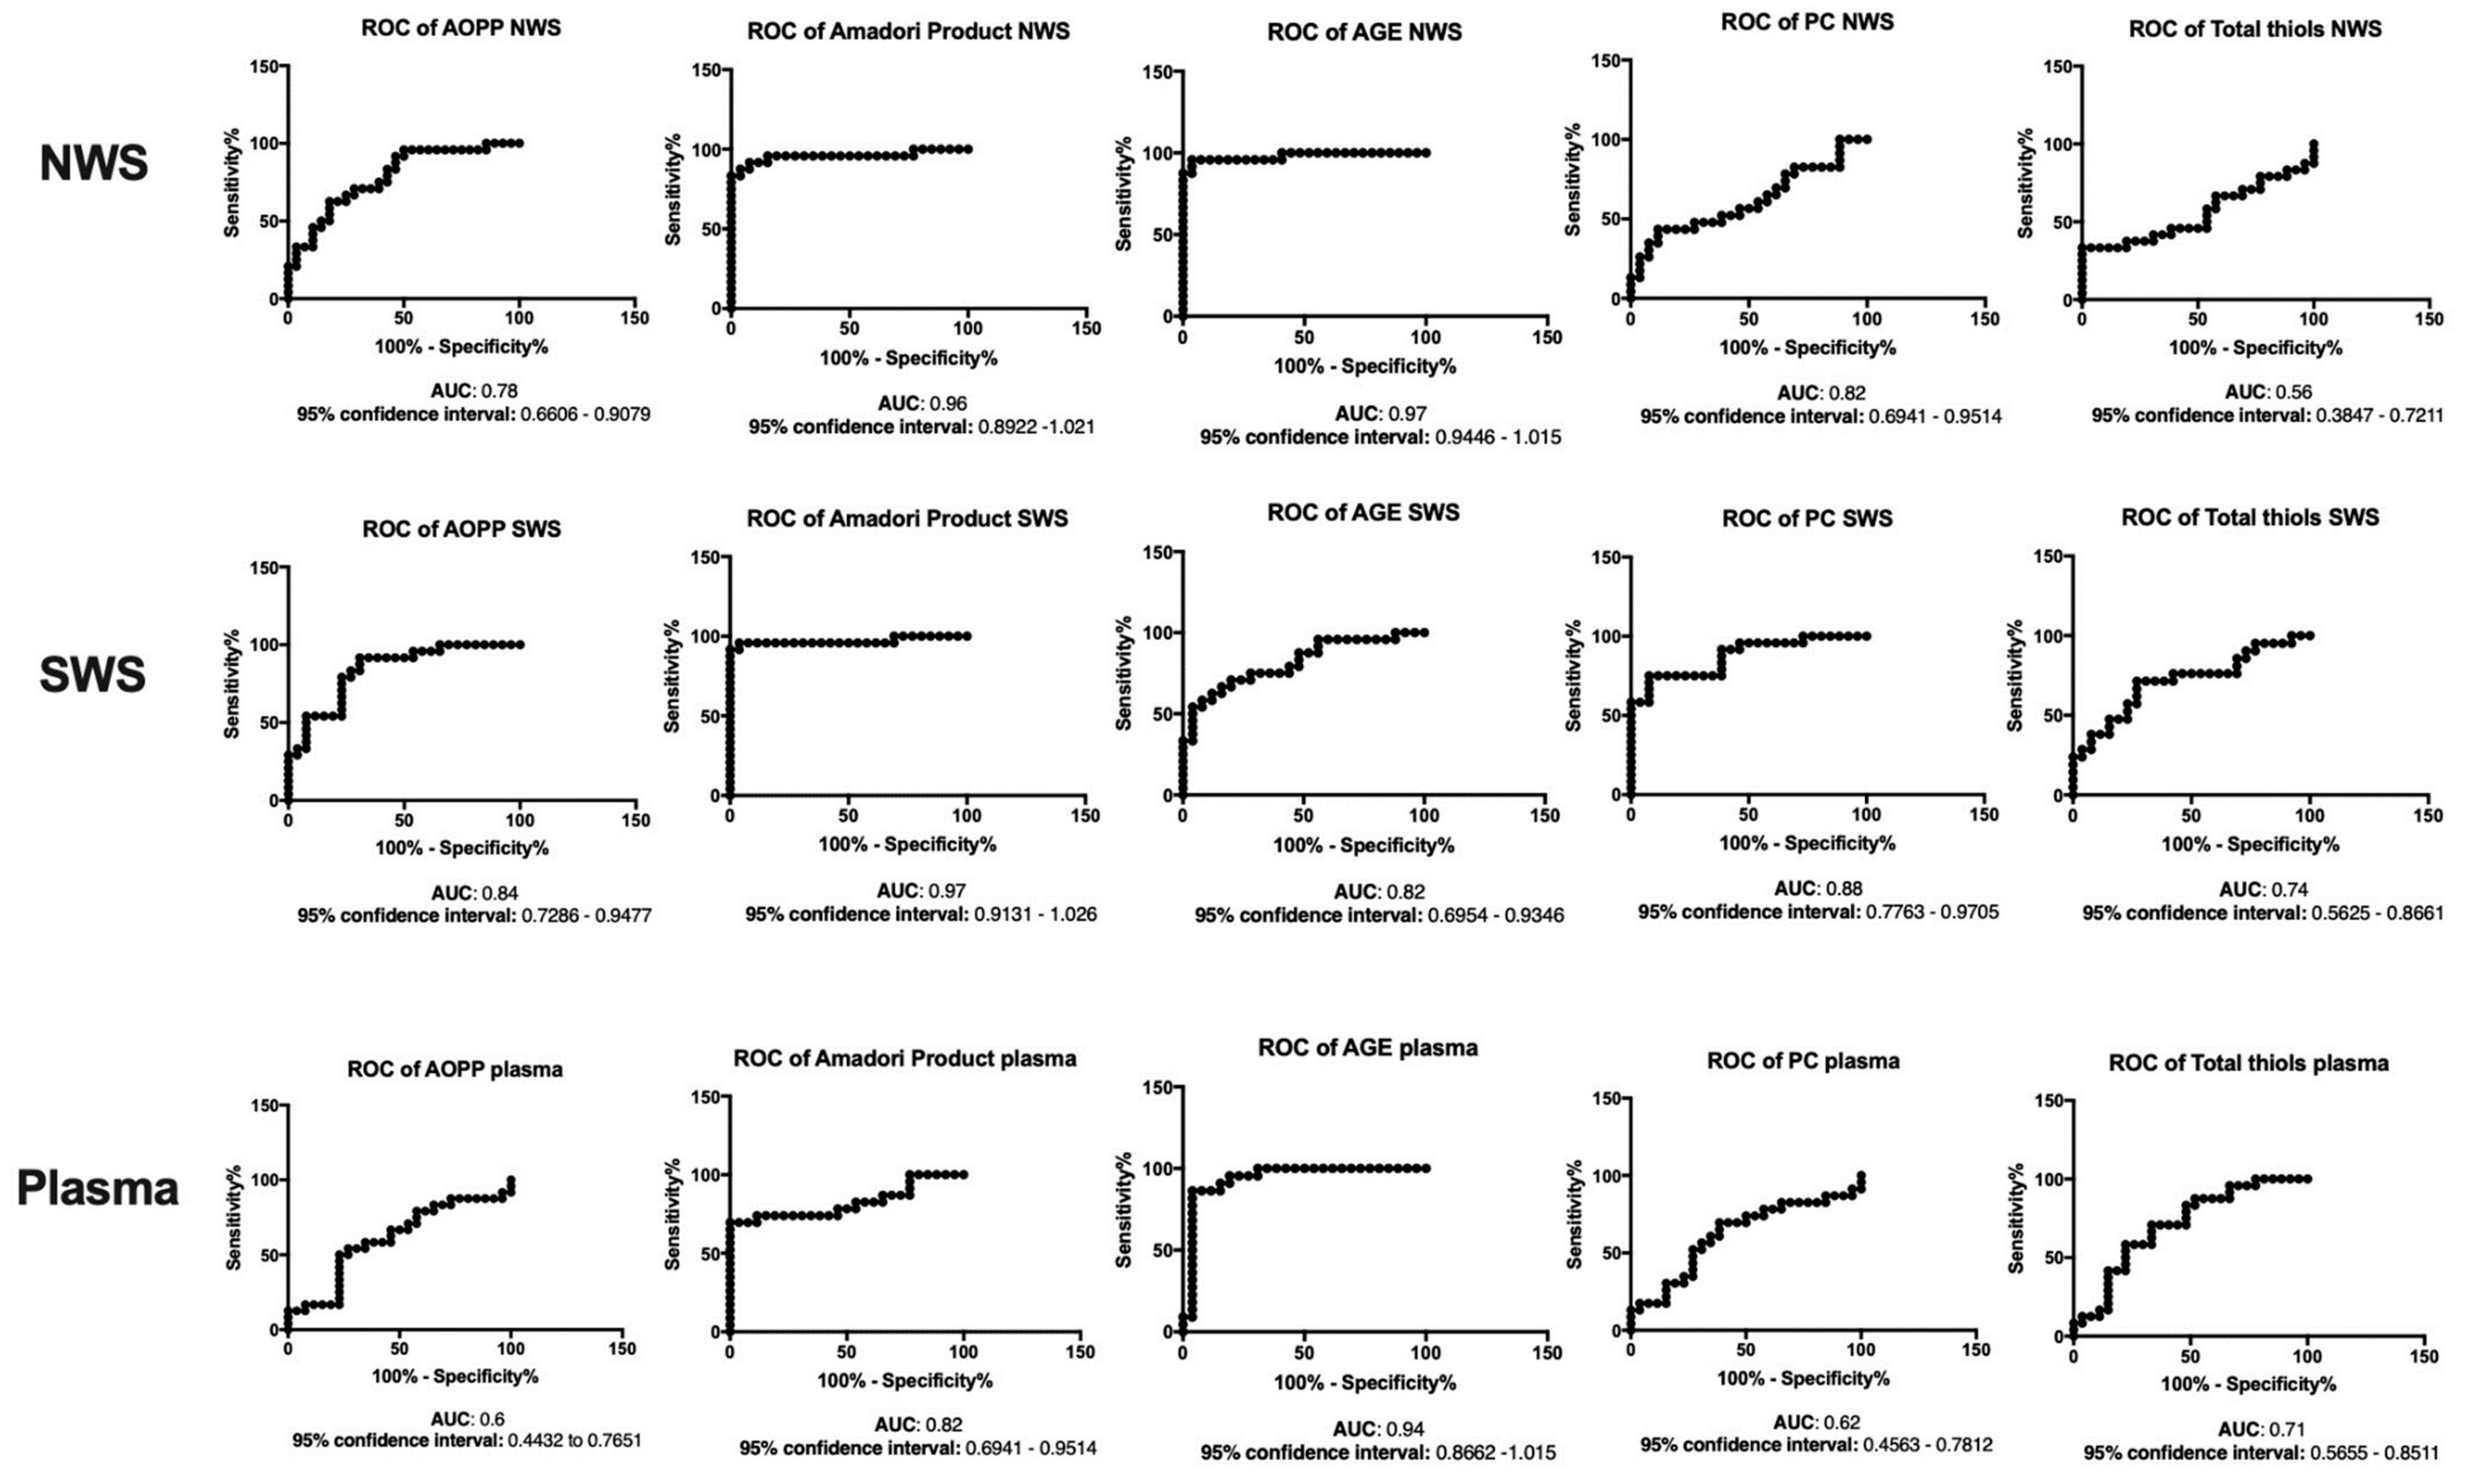
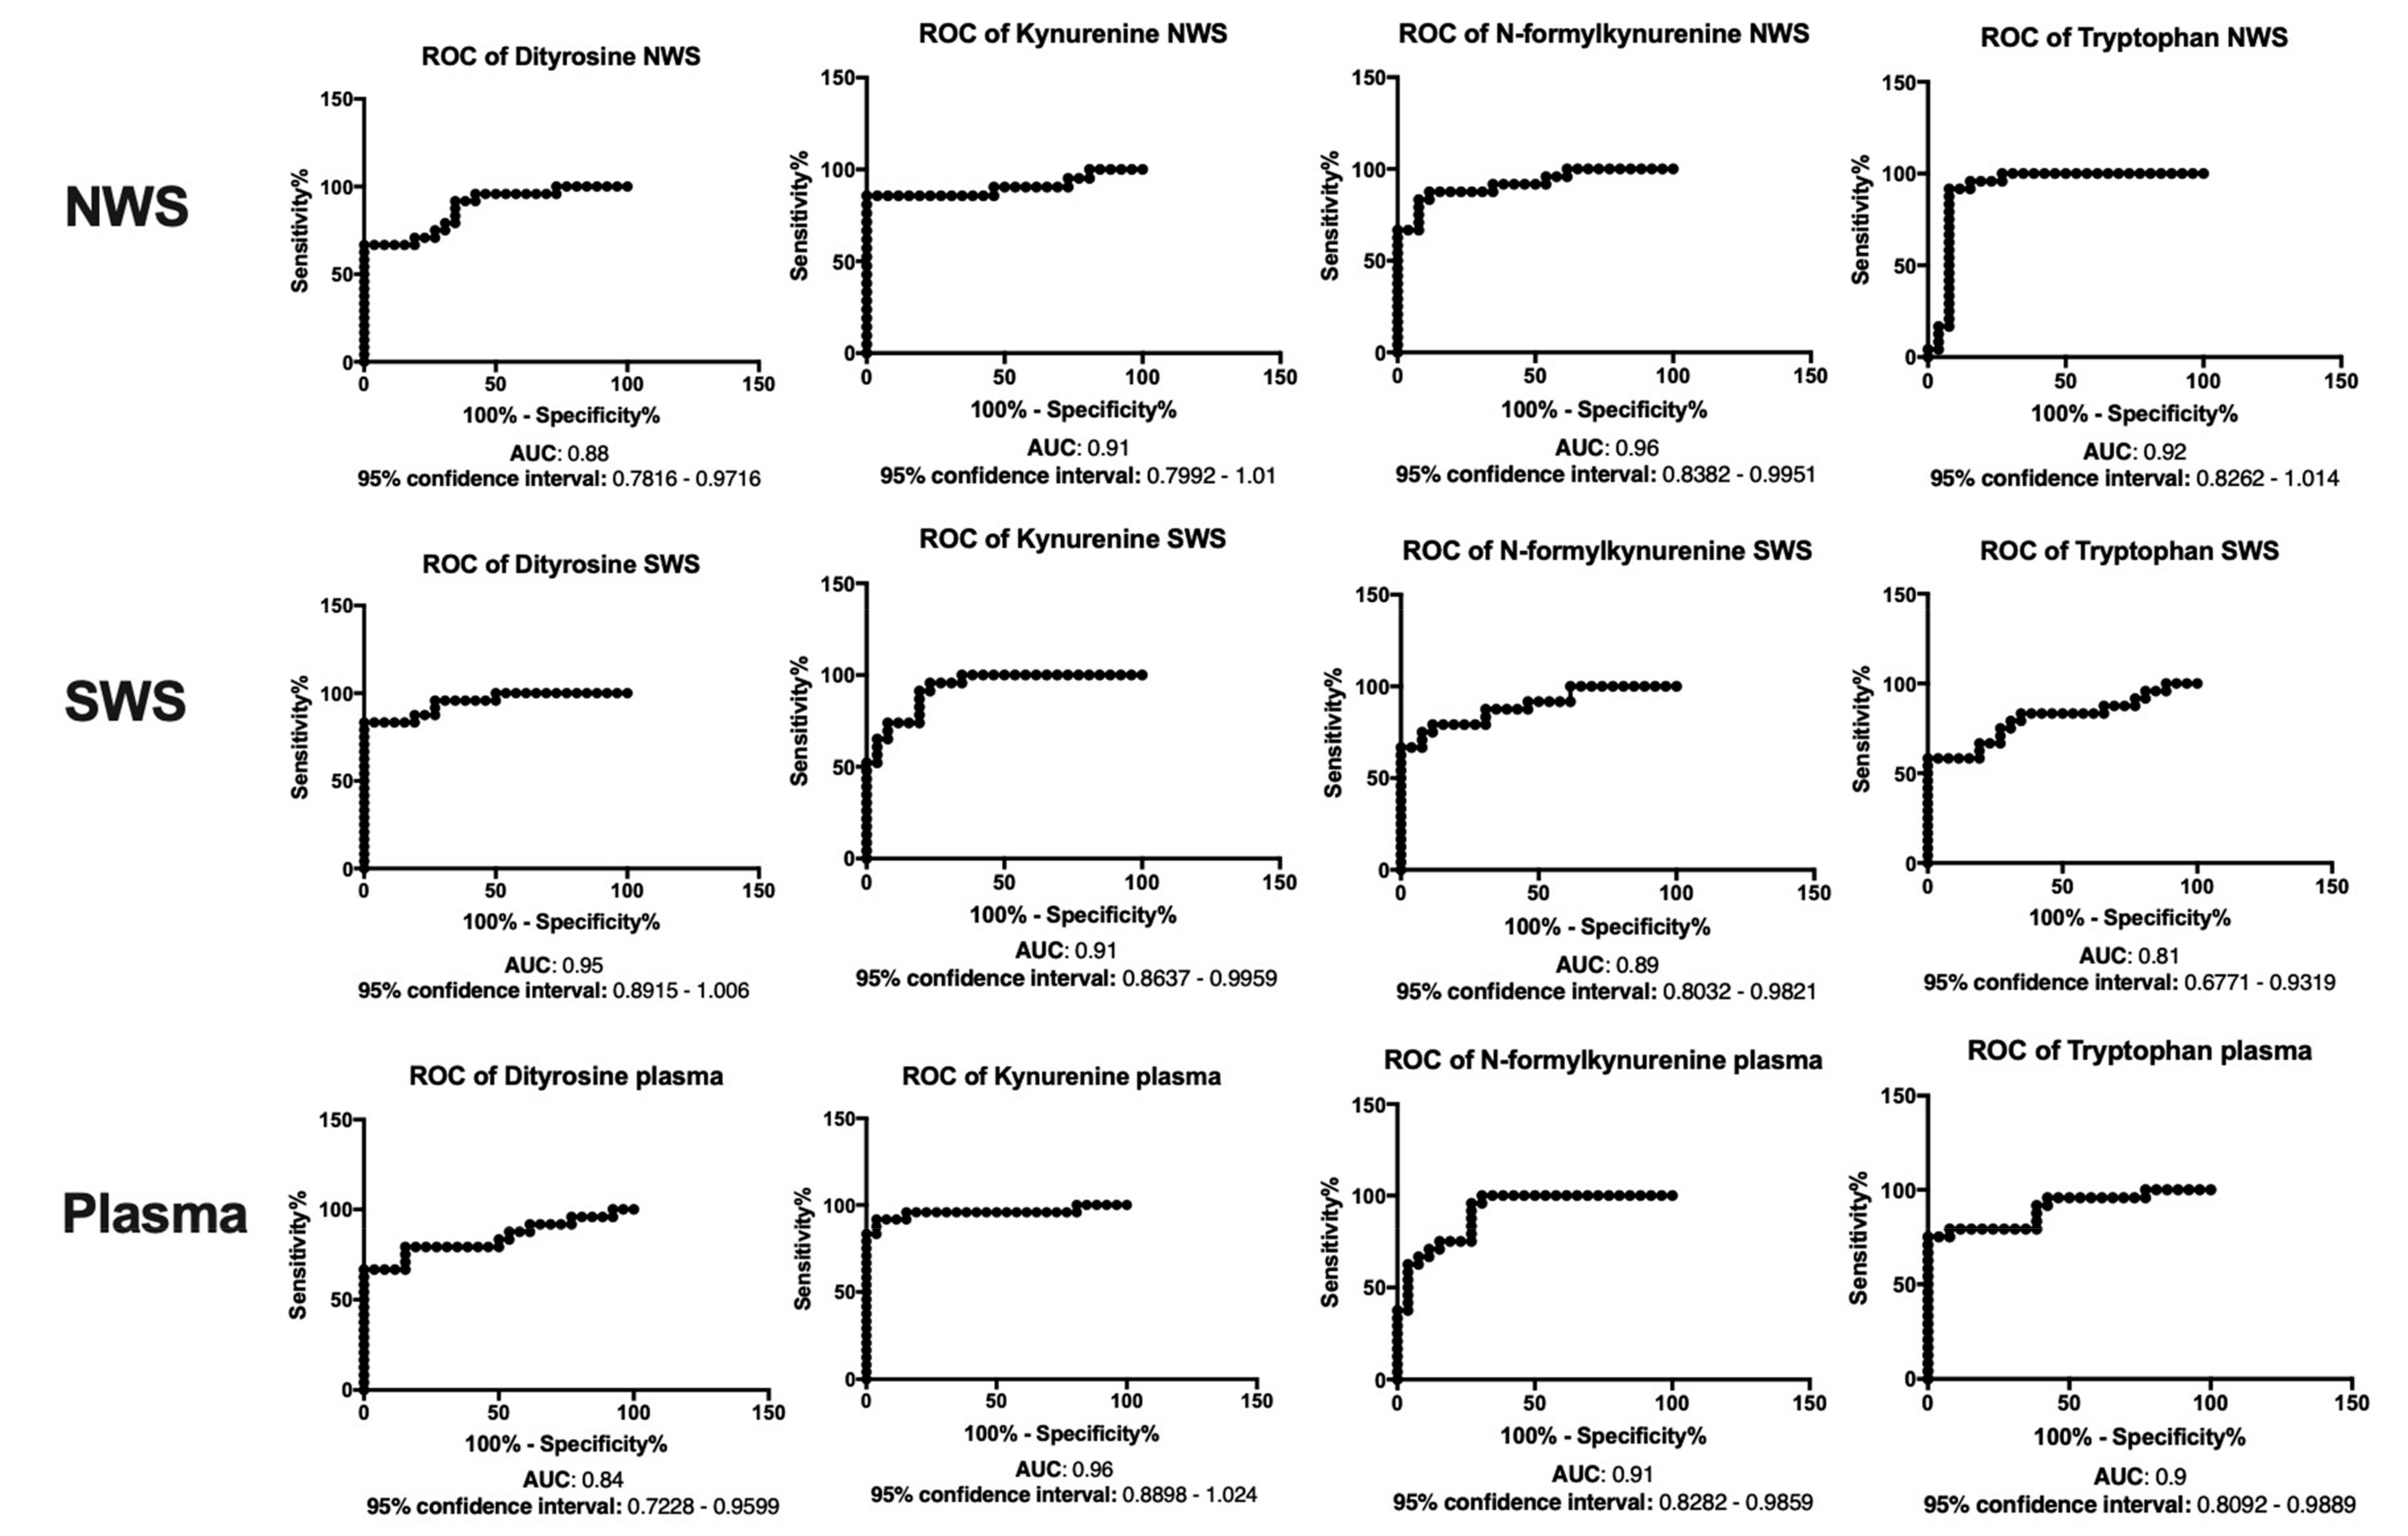
3.8. ROC Analysis
4. Discussion
5. Conclusions
Author Contributions
Funding
Conflicts of Interest
References
- Larson, E.B.; Yaffe, K.; Langa, K.M. New Insights into the dementia epidemic. N. Engl. J. Med. 2013, 369, 2275–2277. [Google Scholar] [CrossRef] [PubMed]
- Prince, M.; Comas-Herrera, A.; Knapp, M.; Guerchet, M.; Karagiannidou, M. World Alzheimer Report 2016 Improving Healthcare for People Living with Dementia. Coverage, Quality and Costs Now and In the Future; ADI: London, UK, 2016. [Google Scholar]
- Livingston, G.; Sommerlad, A.; Orgeta, V.; Costafreda, S.G.; Huntley, J.; Ames, D.; Ballard, C.; Banerjee, S.; Burns, A.; Cohen-Mansfield, J.; et al. Dementia prevention, intervention, and care. Lancet 2017, 390, 2673–2734. [Google Scholar] [CrossRef] [Green Version]
- Butterfield, D.A.; Reed, T.; Newman, S.F.; Sultana, R. Roles of amyloid β-peptide-associated oxidative stress and brain protein modifications in the pathogenesis of Alzheimer’s disease and mild cognitive impairment. Free Radic. Biol. Med. 2007, 43, 658–677. [Google Scholar] [CrossRef] [PubMed]
- Mao, P. Oxidative Stress and its clinical applications in dementia. J. Neurodegener. Dis. 2013, 2013, 319898. [Google Scholar] [CrossRef] [PubMed]
- Cobb, C.A.; Cole, M.P. Oxidative and nitrative stress in neurodegeneration. Neurobiol. Dis. 2015, 84, 4–21. [Google Scholar] [CrossRef] [PubMed] [Green Version]
- Dasuri, K.; Zhang, L.; Keller, J.N. Oxidative stress, neurodegeneration, and the balance of protein degradation and protein synthesis. Free Radic. Biol. Med. 2013, 62, 170–185. [Google Scholar] [CrossRef] [PubMed]
- Robaszkiewicz, A.; Bartosz, G.; Soszyński, M. N-chloroamino acids cause oxidative protein modifications in the erythrocyte membrane. Mech. Ageing Dev. 2008, 129, 572–579. [Google Scholar] [CrossRef]
- Gonos, E.S.; Kapetanou, M.; Sereikaite, J.; Bartosz, G.; Naparlo, K.; Grzesik, M.; Sadowska-Bartosz, I. Origin and pathophysiology of protein carbonylation, nitration and chlorination in age-related brain diseases and aging. Aging 2018, 10, 868. [Google Scholar] [CrossRef]
- Kułak-Bejda, A.; Waszkiewicz, N.; Bejda, G.; Zalewska, A.; Maciejczyk, M. Diagnostic value of salivary markers in neuropsychiatric disorders. Dis. Markers 2019, 2019, 1–6. [Google Scholar] [CrossRef]
- Chang, Y.-T.; Chang, W.-N.; Tsai, N.-W.; Huang, C.-C.; Kung, C.-T.; Su, Y.-J.; Lin, W.-C.; Cheng, B.-C.; Su, C.-M.; Chiang, Y.-F.; et al. The roles of biomarkers of oxidative stress and antioxidant in Alzheimer’s disease: A systematic review. Biomed. Res. Int. 2014, 2014, 14. [Google Scholar] [CrossRef]
- Choromańska, M.; Klimiuk, A.; Kostecka-Sochoń, P.; Wilczyńska, K.; Kwiatkowski, M.; Okuniewska, N.; Waszkiewicz, N.; Zalewska, A.; Maciejczyk, M. Antioxidant defence, oxidative stress and oxidative damage in saliva, plasma and erythrocytes of dementia patients. Can salivary AGE be a marker of dementia? Int. J. Mol. Sci. 2017, 18, 2205. [Google Scholar] [CrossRef] [PubMed]
- Javaid, M.A.; Ahmed, A.S.; Durand, R.; Tran, S.D. Saliva as a diagnostic tool for oral and systemic diseases. J. Oral Biol. Craniofacial Res. 2016, 6, 67–76. [Google Scholar] [CrossRef] [PubMed]
- Wang, J.; Schipper, H.M.; Velly, A.M.; Mohit, S.; Gornitsky, M. Salivary biomarkers of oxidative stress: A critical review. Free Radic. Biol. Med. 2015, 85, 95–104. [Google Scholar] [CrossRef] [PubMed]
- Żukowski, P.; Maciejczyk, M.; Waszkiel, D. Sources of free radicals and oxidative stress in the oral cavity. Arch. Oral Biol. 2018, 92, 8–17. [Google Scholar] [CrossRef] [PubMed]
- Tothova, L.; Kamodyova, N.; Cervenka, T.; Celec, P. Salivary markers of oxidative stress in oral diseases. Front. Cell. Infect. Microbiol. 2015, 5, 73. [Google Scholar] [CrossRef] [PubMed] [Green Version]
- Borys, J.; Maciejczyk, M.; Antonowicz, B.; Krętowski, A.; Waszkiel, D.; Bortnik, P.; Czarniecka-Bargłowska, K.; Kocisz, M.; Szulimowska, J.; Czajkowski, M.; Waszkiewicz, N.; Zalewska, A. Exposure to Ti4Al4V titanium alloy leads to redox abnormalities, oxidative stress, and oxidative damage in patients treated for mandible fractures. Oxid. Med. Cell. Longev. 2018, 2018, 10. [Google Scholar] [CrossRef]
- Maciejczyk, M.; Szulimowska, J.; Skutnik, A.; Taranta-Janusz, K.; Wasilewska, A.; Wiśniewska, N.; Zalewska, A. Salivary biomarkers of oxidative stress in children with chronic kidney disease. J. Clin. Med. 2018, 7, 209. [Google Scholar] [CrossRef]
- Fejfer, K.; Buczko, P.; Niczyporuk, M.; Ładny, J.R.; Hady, H.R.; Knaś, M.; Waszkiel, D.; Klimiuk, A.; Zalewska, A.; Maciejczyk, M. Oxidative modification of biomolecules in the nonstimulated and stimulated saliva of patients with morbid obesity treated with bariatric surgery. Biomed. Res. Int. 2017, 2017, 8. [Google Scholar] [CrossRef]
- Knaś, M.; Maciejczyk, M.; Sawicka, K.; Hady, H.R.; Niczyporuk, M.; Ładny, J.R.; Matczuk, J.; Waszkiel, D.; Żendzian-Piotrowska, M.; Zalewska, A. Impact of morbid obesity and bariatric surgery on antioxidant/oxidant balance of the unstimulated and stimulated human saliva. J. Oral Pathol. Med. 2016, 45, 455–464. [Google Scholar] [CrossRef]
- World Health Organization. Oral Health Surveys: Basic Methods; WHO: Genewa, Switzerland, 2013; ISBN 9789241548649. [Google Scholar]
- Mansson-Rahemtulla, B.; Baldone, D.C.; Pruitt, K.M.; Rahemtulla, F. Specific assays for peroxidases in human saliva. Arch. Oral Biol. 1986, 31, 661–668. [Google Scholar] [CrossRef]
- Paglia, D.E.; Valentine, W.N. Studies on the quantitative and qualitative characterization of erythrocyte glutathione peroxidase. J. Lab. Clin. Med. 1967, 70, 158–169. [Google Scholar] [PubMed]
- Aebi, H. Catalase in vitro. In Methods in Enzymology; Academic Press: New York, NY, USA, 1984; Volume 105, pp. 121–126. ISBN 9780121820053. [Google Scholar]
- Misra, H.P.; Fridovich, I. The role of superoxide anion in the autoxidation of epinephrine and a simple assay for superoxide dismutase. J. Biol. Chem. 1972, 247, 3170–3175. [Google Scholar] [PubMed]
- Griffith, O.W. Determination of glutathione and glutathione disulfide using glutathione reductase and 2-vinylpyridine. Anal. Biochem. 1980, 106, 207–212. [Google Scholar] [CrossRef]
- Kalousová, M.; Skrha, J.; Zima, T. Advanced glycation end-products and advanced oxidation protein products in patients with diabetes mellitus. Physiol. Res. 2002, 51, 597–604. [Google Scholar] [PubMed]
- Johnson, R.; Baker, J. Assay of serum fructosamine: Internal vs. external standardization. Clin. Chem. 1987, 33, 1955–1956. [Google Scholar] [PubMed]
- Reznick, A.Z.; Packer, L. Oxidative damage to proteins: Spectrophotometric method for carbonyl assay. Methods Enzymol. 1994, 233, 357–363. [Google Scholar] [CrossRef] [PubMed]
- Ellman, G.L. Tissue sulfhydryl groups. Arch. Biochem. Biophys. 1959, 82, 70–77. [Google Scholar] [CrossRef]
- Borys, J.; Maciejczyk, M.; Krȩtowski, A.J.; Antonowicz, B.; Ratajczak-Wrona, W.; Jablonska, E.; Zaleski, P.; Waszkiel, D.; Ladny, J.R.; Zukowski, P.; et al. The redox balance in erythrocytes, plasma, and periosteum of patients with titanium fixation of the jaw. Front. Physiol. 2017, 8, 386. [Google Scholar] [CrossRef]
- Lushchak, V.I. Free radicals, reactive oxygen species, oxidative stress and its classification. Chem. Biol. Interact. 2014, 224c, 164–175. [Google Scholar] [CrossRef]
- Poprac, P.; Jomova, K.; Simunkova, M.; Kollar, V.; Rhodes, C.J.; Valko, M. Targeting free radicals in oxidative stress-related human diseases. Trends Pharmacol. Sci. 2017, 38, 592–607. [Google Scholar] [CrossRef]
- Peluso, I.; Raguzzini, A. Salivary and urinary total antioxidant capacity as biomarkers of oxidative stress in humans. Patholog. Res. Int. 2016, 2016, 14. [Google Scholar] [CrossRef] [PubMed]
- Cobley, J.N.; Fiorello, M.L.; Bailey, D.M. 13 Reasons why the brain is susceptible to oxidative stress. Redox Biol. 2018, 15, 490–503. [Google Scholar] [CrossRef] [PubMed]
- Maciejczyk, M.; Żebrowska, E.; Chabowski, A. Insulin resistance and oxidative stress in the brain: What’s new? Int. J. Mol. Sci. 2019, 20, 874. [Google Scholar] [CrossRef] [PubMed]
- Aoyama, K.; Nakaki, T. Impaired glutathione synthesis in neurodegeneration. Int. J. Mol. Sci. 2013, 14, 21021–21044. [Google Scholar] [CrossRef] [PubMed]
- Johnson, W.M.; Wilson-Delfosse, A.L.; Mieyal, J.J. Dysregulation of glutathione homeostasis in neurodegenerative diseases. Nutrients 2012, 4, 1399–1440. [Google Scholar] [CrossRef] [PubMed]
- Mandal, P.K.; Tripathi, M.; Sugunan, S. Brain oxidative stress: Detection and mapping of anti-oxidant marker “Glutathione” in different brain regions of healthy male/female, MCI and Alzheimer patients using non-invasive magnetic resonance spectroscopy. Biochem. Biophys. Res. Commun. 2012, 417, 43–48. [Google Scholar] [CrossRef] [PubMed]
- Sultana, R.; Piroddi, M.; Galli, F.; Butterfield, D.A. Protein levels and activity of some antioxidant enzymes in hippocampus of subjects with amnestic mild cognitive impairment. Neurochem. Res. 2008, 33, 2540–2546. [Google Scholar] [CrossRef]
- Dringen, R.; Hirrlinger, J. Glutathione pathways in the brain. Biol. Chem. 2003, 384, 505–516. [Google Scholar] [CrossRef]
- Liu, Y.; Hyde, A.S.; Simpson, M.A.; Barycki, J.J. Emerging regulatory paradigms in glutathione metabolism. Adv. Cancer Res. 2014, 122, 69–101. [Google Scholar] [CrossRef]
- Ott, C.; Jacobs, K.; Haucke, E.; Navarrete Santos, A.; Grune, T.; Simm, A. Role of advanced glycation end products in cellular signaling. Redox Biol. 2014, 2, 411–429. [Google Scholar] [CrossRef] [Green Version]
- Cai, Z.; Yan, L.-J. Protein oxidative modifications: Beneficial roles in disease and health. J. Biochem. Pharmacol. Res. 2013, 1, 15–26. [Google Scholar] [CrossRef] [PubMed]
- Tramutola, A.; Lanzillotta, C.; Perluigi, M.; Butterfield, D.A. Oxidative stress, protein modification and Alzheimer disease. Brain Res. Bull. 2017, 133, 88–96. [Google Scholar] [CrossRef] [PubMed]
- Maciejczyk, M.; Żebrowska, E.; Zalewska, A.; Chabowski, A. Redox balance, antioxidant defense, and oxidative damage in the hypothalamus and cerebral cortex of rats with high fat diet-induced insulin resistance. Oxid. Med. Cell. Longev. 2018, 2018, 1–11. [Google Scholar] [CrossRef] [PubMed]
- Juranek, J.; Ray, R.; Banach, M.; Rai, V. Receptor for advanced glycation end-products in neurodegenerative diseases. Rev. Neurosci. 2015, 26, 691–698. [Google Scholar] [CrossRef] [PubMed]
- Morgan, M.J.; Liu, Z.G. Crosstalk of reactive oxygen species and NF-κB signaling. Cell Res. 2011, 1, 103. [Google Scholar] [CrossRef] [PubMed]
- Wautier, M.-P.; Chappey, O.; Corda, S.; Stern, D.M.; Schmidt, A.M.; Wautier, J.-L. Activation of NADPH oxidase by AGE links oxidant stress to altered gene expression via RAGE. Am. J. Physiol. Metab. 2001, 280, E685–E694. [Google Scholar] [CrossRef] [PubMed]


| Inclusion Criteria | Exclusion Criteria | |
|---|---|---|
| Control and Study group | - written informed consent to participate in the study - BMI 18.5–24.5 - normal results of blood morphological tests (erythrocytes, leukocytes, haemoglobin, platelets, haematocrit) and biochemical tests (sodium, potassium, creatinine, ASPAT, ALAT, International Normalized Ratio (INR), CRP as well as normal concentration of TSH, calcium, vitamin B12 and folic acid) - no history of psychoactive substance abuse | - presence of chronic systemic diseases (except hypertension, type 2 diabetes, arteriosclerosis and osteoporosis), autoimmune diseases, lung, thyroid, liver, kidney, digestive tract, infectious diseases and immune disorders (HCV and HIV infections) - periodontal diseases - smoking - alcohol misuse disorder - taking any antibiotics, glucocorticoids, dietary supplements and vitamins for the last 3 months - chronic use of non-steroidal anti-inflammatory drugs (NSAIDs) |
| Study group | - decreased cognitive performance with undisturbed consciousness, visible in the clinical picture and confirmed by the Mini Mental State Examination (MMSE, 30-point scale) in patients with mild to moderate (11–23) and severe (0–10) stage of dementia -at least 6 months of positive history of cognitive disorders | - acute haemorrhagic states and ischaemia, tumours of the central nervous system and normal pressure hydrocephalus in a computed tomography scan of the head |
| Control group | - no cognitive impairment in the clinical examination - no dementia (MMSE > 27) | - MMSE < 27 |
| Patient Characteristics | Control n = 50 | 11–23 MMSE n = 26 | 0–10 MMSE n = 24 | ANOVA p | |
|---|---|---|---|---|---|
| Sex | Male n (%) | 15 (30) | 8 (30) | 7 (30) | - |
| Female n (%) | 35 (70) | 18 (70) | 17 (70) | - | |
| Age | 80.82 ± 1.15 | 80.85 ± 1.25 | 81.17 ± 0.82 | 0.15 | |
| Formal education in years | 7.52 ± 0.65 | 7.81 ± 0.77 | 5.11 ± 0.58 | 0.006 | |
| MMSE score | 27.42 ± 0.52 | 17.12 ± 0.58 | 9.28 ± 0.23 | ˂0.001 | |
| Type of dementia | Alzheimer n (%) | - | 8 (30.77) | 7 (29.17) | - |
| Vascular n (%) | - | 11 (42.31) | 8 (33.33) | - | |
| Mixed n (%) | - | 7 (26.92) | 9 (37.5) | - | |
| Ca2+ (mEq/L) | 4.25 ± 0.11 | 4.48 ± 0.08 | 4.42 ± 0.04 | 0.10 | |
| B12 (pg/mL) | 323.40 ± 82.84 | 378.10 ± 53.17 | 483.90 ± 83.40 | 0.34 | |
| Folic acid (ng/mL) | 6.23 ± 0.81 | 5.99 ± 0.89 | 5.40 ± 0.61 | 0.71 | |
| TSH (uIU/mL) | 1.08 ± 0.16 | 1.39 ± 0.23 | 1.59 ± 0.22 | 0.26 | |
| CRP | 3.16 ± 0.79 | 3.16 ± 0.98 | 5.04 ± 1.24 | 0.34 | |
| RBC | 4.51 ± 0.14 | 4.43 ± 0.14 | 4.47 ± 0.09 | 0.90 | |
| Hb | 13.76 ± 0.32 | 13.55 ± 0.34 | 13.45 ± 0.27 | 0.77 | |
| Hematocrit | 40.88 ± 1.08 | 40.37 ± 1.08 | 40.33 ± 0.83 | 0.91 | |
| MCV | 91.20 ± 1.02 | 91.61 ± 1.10 | 90.46 ± 0.99 | 0.72 | |
| MCH | 33.62 ± 0.18 | 33.60 ± 0.21 | 33.37 ± 0.16 | 0.54 | |
| RDW | 14.90 ± 0.20 | 14.90 ±0.30 | 15.14 ± 0.25 | 0.72 | |
| PLT | 268.80 ± 15.15 | 243.70 ± 18.80 | 260.10 ± 14.23 | 0.56 | |
| MPV | 7.95 ± 0.17 | 8.40 ± 0.22 | 8.13 ± 0.15 | 0.23 | |
| PCT | 0.21 ± 0.01 | 0.20 ± 0.01 | 0.21 ± 0.01 | 0.83 | |
| PDW | 13.54 ±0.34 | 13.95 ± 0.36 | 13.95 ± 0.21 | 0.54 | |
| WBC | 7.40 ± 0.39 | 7.11 ± 0.53 | 7.25 ± 0.40 | 0.91 | |
| Na+ | 140.90 ± 0.50 | 141.20 ± 0.48 | 137.40 ± 4.36 | 0.61 | |
| K+ | 4.20 ± 0.07 | 4.24 ± 0.08 | 4.29 ± 0.09 | 0.74 | |
| AST | 20.04 ± 1.17 | 21.30 ± 1.56 | 24.53 ± 1.73 | 0.10 | |
| ALT | 13.79 ± 1,69 | 17.17 ± 1.81 | 18.38 ± 1.87 | 0.19 | |
| Glucose | 111.50 ± 4.04 | 111.00 ± 2.77 | 106.90 ± 4.07 | 0.62 | |
| Creatinine | 0.90 ± 0.04 | 0.81 ± 0.04 | 0.91 ± 0.05 | 0.26 | |
| Urea | 39.79 ± 2.79 | 39.35 ± 2.46 | 45.31 ± 2.41 | 0.17 | |
| Hypertension n (%) | 21 (42) | 17 (65.38) | 11 (45.83) | - | |
| Diabetes n (%) | 6 (12) | 4 (15.38) | 4 (16.67) | - | |
| CHD n (%) | 9 (18) | 7 (26.92) | 1 (4.17) | - | |
| Atherosclerosis n (%) | 6 (12) | 3 (11.54) | 2 (8.33) | - | |
| Osteoporosis n (%) | 2 (4) | 1 (3.85) | 1 (4.17) | - | |
| Medications | <5 drugs/day n (%) | 27 (54) | 12 (46.15) | 10 (41.67) | - |
| ≥5 drugs/day n (%) | 6 (12) | 4 (15.38) | 4 (16.67) | - | |
| Patient Characteristics | Control n = 50 | 11–23 MMSE n = 26 | 0–10 MMSE n = 24 |
|---|---|---|---|
| NWS flow rate (mL/min) | 0.5 ± 0.04 | 0.07 ± 0.01 * | 0.06 ± 0.01 * |
| SWS flow rate (mL/min) | 1.34 ± 0.07 | 0.083 ± 0.01 * | 0.07 ± 0.01 * |
| NWS total protein (µg/mL) | 3414 ± 326.1 | 4806 ± 416.5 * | 4537 ± 431.6 * |
| SWS total protein (µg/mL) | 2390 ± 83.57 | 4449 ± 345.6 * | 4718 ± 496.4 * |
| DMFT | 29.32 ± 0.53 | 29.96 ± 0.89 | 30.09 ± 0.69 |
| PBI | 1.09 ± 0.07 | 1.52 ± 0.27 | 2.07 ± 0.24 |
| GI | 1.58 ± 0.06 | 2.06 ± 0.15 | 2.18 ± 0.14 |
| CR | 0.28 ± 0.73 | 0.13 ± 0.1 | 0.7 ± 0.48 |
© 2019 by the authors. Licensee MDPI, Basel, Switzerland. This article is an open access article distributed under the terms and conditions of the Creative Commons Attribution (CC BY) license (http://creativecommons.org/licenses/by/4.0/).
Share and Cite
Klimiuk, A.; Maciejczyk, M.; Choromańska, M.; Fejfer, K.; Waszkiewicz, N.; Zalewska, A. Salivary Redox Biomarkers in Different Stages of Dementia Severity. J. Clin. Med. 2019, 8, 840. https://0-doi-org.brum.beds.ac.uk/10.3390/jcm8060840
Klimiuk A, Maciejczyk M, Choromańska M, Fejfer K, Waszkiewicz N, Zalewska A. Salivary Redox Biomarkers in Different Stages of Dementia Severity. Journal of Clinical Medicine. 2019; 8(6):840. https://0-doi-org.brum.beds.ac.uk/10.3390/jcm8060840
Chicago/Turabian StyleKlimiuk, Anna, Mateusz Maciejczyk, Magdalena Choromańska, Katarzyna Fejfer, Napoleon Waszkiewicz, and Anna Zalewska. 2019. "Salivary Redox Biomarkers in Different Stages of Dementia Severity" Journal of Clinical Medicine 8, no. 6: 840. https://0-doi-org.brum.beds.ac.uk/10.3390/jcm8060840