
Study on Livelihood Vulnerability and Adaptation Strategies of Farmers in Areas Threatened by Different Disaster Types under Climate Change


Abstract
:1. Introduction
2. Theoretical Background
- (1)
- What are the characteristics and differences of household livelihood vulnerability and livelihood strategy choice in different natural-disaster-threatened areas (landslide, debris flow and flood)?
- (2)
- What is the correlation between household livelihood vulnerability and livelihood strategy choice in different natural-disaster-threatened areas (landslide, debris flow and flood)?
3. Theoretical Analysis and Research Hypothesis
4. Data and Methods
4.1. Data Collection
4.2. Index Selection
4.3. Calculation
4.3.1. The Entropy Method
4.3.2. Econometric Model
5. Results and Analysis
5.1. Descriptive Statistical Analysis of Livelihood Vulnerability
5.2. Results of the Econometric Model
6. Discussions
7. Conclusions
Author Contributions
Funding
Institutional Review Board Statement
Informed Consent Statement
Data Availability Statement
Acknowledgments
Conflicts of Interest
References
- Intergovernmental Panel on Climate Change (IPCC). Managing the Risks of Extreme Events and Disasters to Advance Climate Change Adapatation; Cambridge University Press: Cambridge, MA, USA, 2012. [Google Scholar]
- Intergovernmental Panel on Climate Change (IPCC). Observations: Atmosphere and Surface. In Climate Change 2013: The Physical Science Basis. Contribution of Working Group I to the Fifth Assessment Report of the Intergovernmental Panel on Climate Change; Cambridge University Press: Cambridge, MA, USA, 2013. [Google Scholar]
- Archer, D.R.; Fowler, H.J. Characterising flash flood response to intense rainfall and impacts using historical information and gauged data in Britain. J. Flood Risk Manag. 2015, 11, S121–S133. [Google Scholar] [CrossRef]
- Arnbjerg-Nielsen, K.; Willems, P.; Olsson, J.; Beecham, S.; Pathirana, A.; Bülow Gregersen, I.; Madsen, H.; Nguyen, V.T.V. Impacts of climate change on rainfall extremes and urban drainage systems: A review. Water Sci. Technol. 2013, 68, 16–28. [Google Scholar] [CrossRef] [PubMed]
- Fadhel, S.; Rico-Ramirez, M.A.; Han, D. Sensitivity of peak flow to the change of rainfall temporal pattern due to warmer climate. J. Hydrol. 2018, 560, 546–559. [Google Scholar] [CrossRef] [Green Version]
- Li, H.C.; Xie, J.B.; Guo, L.; Kuang, S.F. A review of the study on flash flood early warning in China. Pearl River 2017, 38, 29–35. (In Chinese) [Google Scholar]
- Huang, C.H.; Li, G.P.; Zhang, F.L.; Gao, H.Z.; Wang, M.Y.; Guo, S.Y. Evolution characteristics of mountain rainstorm events in Sichuan under the influence of climate change in recent 10 years. Rainstorm Disaster 2020, 39, 335–343. (In Chinese) [Google Scholar]
- CNSB (China National Statistical Bureau). China Yearbook of Household Survey in 2017; China Statistical Press: Beijing, China, 2018. (In Chinese)
- Zhou, W.; Ma, Z.; Guo, S.; Deng, X.; Xu, D. Livelihood capital, evacuation and relocation willingness of residents in earthquake stricken areas of rural China. Saf. Sci. 2021, 141, 105350. [Google Scholar] [CrossRef]
- Xue, K.; Guo, S.; Liu, Y.; Liu, S.; Xu, D. Social Networks, Trust, and Disaster-Risk Perceptions of Rural Residents in a Multi-Disaster Environment: Evidence from Sichuan, China. Int. J. Environ. Res. Public Health 2021, 18, 2106. [Google Scholar] [CrossRef]
- Ma, Z.; Guo, S.; Deng, X.; Xu, D. Community resilience and resident’s disaster preparedness: Evidence from China’s earthquake-stricken areas. Nat. Hazards 2021, 108, 567–591. [Google Scholar] [CrossRef]
- Qing, C.; Guo, S.; Deng, X.; Xu, D. Farmers’ Disaster Preparedness and Quality of Life in Earthquake-prone Areas: The Mediating Role of Risk Perception. Int. J. Disaster Risk Reduct. 2021, 59, 102252. [Google Scholar] [CrossRef]
- Yang, X.; Guo, S.; Deng, X.; Xu, D. Livelihood Adaptation of Rural Households under Livelihood Stress: Evidence from Sichuan Province, China. Agriculture 2021, 11, 506. [Google Scholar] [CrossRef]
- Bao, X.L.; Zhang, F.W.; Deng, X.; Xu, D.D. Can Trust Motivate Farmers to Purchase Natural Disaster Insurance? Evidence from Earthquake-Stricken Areas of Sichuan, China. Agriculture 2021, 11, 783. [Google Scholar] [CrossRef]
- Wu, J.J.; Deng, X.; Xu, D.D. Rural households’ disaster risk perception and willingness to evacuate and relocate in earthquake-stricken areas: Evidence from Sichuan, China. J. Mt. 2021, 39, 552–562. (In Chinese) [Google Scholar]
- Doocy, S.; Daniels, A.; Murray, S.; Kirsch, T.D. The human impact of floods: A historical review of events 1980-2009 and systematic literature review. PLoS Curr. 2013, 5, 1. [Google Scholar] [CrossRef] [PubMed]
- Piers, B.; Terry, C.; Ian, D.; Ben, W. At Risk: Natural Hazards, People’s Vulnerability and Disasters; Taylor and Francis: London, UK, 2014. [Google Scholar]
- Cian, F.; Giupponi, C.; Marconcini, M. Integration of earth observation and census data for mapping a multi-temporal flood vulnerability index: A case study on Northeast Italy. Nat. Hazards 2021, 1, 22. [Google Scholar] [CrossRef]
- Kendra, J.M. Review of American Hazardscapes: The Regionalization of Hazards and Disasters edited by Susan, L. Cutter. Nat. Hazards Rev. 2003, 4, 222–223. [Google Scholar] [CrossRef]
- Cutter, S.L.; Finch, C. Temporal and spatial changes in social vulnerability to natural hazards. Proc. Natl. Acad. Sci. USA 2008, 105, 2301–2306. [Google Scholar] [CrossRef] [PubMed] [Green Version]
- Chambers, R. Vulnerability, coping and policy (Editorial Introduction). IDS Bull. 1989, 20, 1–7. [Google Scholar] [CrossRef] [Green Version]
- Intergovernmental Panel on Climate Change (IPCC). Climate Change 2001: Impacts, Adaptation, and Vulnerability. Contribution of Working Group II to the Third Assessment Report of the Intergovernmental Panel on Climate Change, Working Group II Impacts Adaptation and Vulnerability; Cambridge University Press: Cambridge, UK, 2001. [Google Scholar]
- De Lange, H.J.; Sala, S.; Vighi, M.; Faber, J.H. Ecological vulnerability in risk assessment—a review and perspectives. Sci. Total Environ. 2010, 408, 3871–3879. [Google Scholar] [CrossRef]
- McKinney, M.L. Extinction vulnerability and selectivity: Combining ecological and paleontological views. Annu. Rev. Ecol. Syst. 1997, 28, 495–516. [Google Scholar] [CrossRef]
- Stella, J.S.; Pratchett, M.S.; Hutchings, P.A.; Jones, G.P. Coral-associated invertebrates: Diversity, ecological importance and vulnerability to disturbance. Oceanogr. Mar. Biol. 2011, 49, 43–104. [Google Scholar] [CrossRef]
- Bouzarovski, S. Energy poverty in the European Union: Landscapes of vulnerability. Wiley Interdiscip. Rev. Energy Environ. 2014, 3, 276–289. [Google Scholar] [CrossRef]
- Middlemiss, L.; Gillard, R. Fuel poverty from the bottom-up: Characterising household energy vulnerability through the lived experience of the fuel poor. Energy Res. Soc. Sci. 2015, 6, 146–154. [Google Scholar] [CrossRef] [Green Version]
- Moser, C.O. The asset vulnerability framework: Reassessing urban poverty reduction strategies. World Dev. 1998, 26, 1–19. [Google Scholar] [CrossRef]
- Harvey, C.A.; Rakotobe, Z.L.; Rao, N.S.; Dave, R.; Razafimahatratra, H.; Rabarijohn, R.H.; Rajaofara, H.; MacKinnon, J.L. Extreme vulnerability of smallholder farmers to agricultural risks and climate change in Madagascar. Philos. Trans. R. Soc. B 2014, 369, 20130089. [Google Scholar] [CrossRef] [PubMed] [Green Version]
- Luers, A.L.; Lobell, D.B.; Sklar, L.S.; Addams, C.L.; Matson, P.A. A method for quantifying vulnerability, applied to the agricultural system of the Yaqui Valley, Mexico. Glob. Environ. Chang. 2003, 13, 255–267. [Google Scholar] [CrossRef]
- Reilly, J.M.; Schimmelpfennig, D. Agricultural impact assessment, vulnerability, and the scope for adaptation. Clim. Chang. 1999, 43, 745–788. [Google Scholar] [CrossRef]
- Wang, B.; Ke, R.Y.; Yuan, X.C.; Wei, Y.M. China’s regional assessment of renewable energy vulnerability to climate change. Renew. Sustain. Energy Rev. 2014, 40, 185–195. [Google Scholar] [CrossRef]
- Gatto, A.; Busato, F. Energy vulnerability around the world: The global energy vulnerability index (GEVI). J. Clean. Prod. 2020, 253, 118691. [Google Scholar] [CrossRef]
- Adger, W.N.; Hughes, T.P.; Folke, C.S.R.; Rockstrom, J. Social–ecological resilience to coastal disasters. Science 2005, 309, 1036–1039. [Google Scholar] [CrossRef] [Green Version]
- Hahn, M.B.; Riederer, A.M.; Foster, S.O. The Livelihood Vulnerability Index: A pragmatic approach to assessing risks from climate variability and change—A case study in Mozambique. Glob. Environ. Chang. 2009, 19, 74–88. [Google Scholar] [CrossRef]
- Poudel, S.; Funakawa, S.; Shinjo, H.; Mishra, B. Understanding households’ livelihood vulnerability to climate change in the Lamjung district of Nepal. Environ. Dev. Sustain. 2020, 22, 8159–8182. [Google Scholar] [CrossRef]
- Aryal, S.; Cockfield, G.; Maraseni, T.N. Vulnerability of Himalayan transhumant communities to climate change. Clim. Chang. 2014, 125, 193–208. [Google Scholar] [CrossRef]
- Bhattacharjee, K.; Behera, B. Determinants of household vulnerability and adaptation to floods: Empirical evidence from the Indian State of West Bengal. Int. J. Disast. Risk Res. 2018, 31, 758–769. [Google Scholar] [CrossRef]
- Ashikin, A.N.; Diana, M.N.; Siwar, C.; Alam, M.; Yasar, M. Community Preparation and Vulnerability Indices for Floods in Pahang State of Malaysia. Land 2021, 10, 198. [Google Scholar] [CrossRef]
- Nguyen, M.H.; Le, D.P.; Vo, T.T. Vulnerability to Natural Disaster and Welfare Effect: A Case Study of Flood Risk in Vietnam’s North Central Region. J. Asian Afr. Stud. 2021, 1, 0021909621993499. [Google Scholar] [CrossRef]
- Nguyen, T.A.; Nguyen, B.T.; Van Ta, H.; Nguyen, N.T.P.; Hoang, H.T.; Nguyen, Q.P.; Hens, L. Livelihood vulnerability to climate change in the mountains of Northern Vietnam: Comparing the Hmong and the Dzao ethnic minority populations. Environ. Dev. Sustain. 2021, 1, 21. [Google Scholar] [CrossRef]
- Zhu, R.; Fang, Y.; Neupane, N.; Koirala, S.; Zhang, C. Drought stress and livelihood response based on evidence from the Koshi river basin in Nepal: Modeling and applications. Water 2020, 12, 1610. [Google Scholar] [CrossRef]
- Hulssiep, M.; Thaler, T.; Fuchs, S. The influence of humanitarian assistance on post Disaster social vulnerabilities: Early reflection on the nepal earthquake 2015. Disasters 2021, 45, 577–603. [Google Scholar] [CrossRef]
- Jaman, T.; Dharanirajan, K.; Sharma, S.S. Assessment of impact of cyclone hazard on social vulnerability of Bhadrak District of Odisha State during Phailin Cyclone in 2013 and Titli Cyclone in 2018 using multi-criteria analysis and geospatial techniques. Int. J. Disast. Risk Reduct. 2021, 53, 101997. [Google Scholar] [CrossRef]
- Lee, S.; Ham, Y. Probabilistic framework for assessing the vulnerability of power distribution infrastructures under extreme wind conditions. Sustain. Cities Soc. 2021, 65, 102587. [Google Scholar] [CrossRef]
- McIntosh, R.D.; Becker, A. Expert evaluation of open-data indicators of seaport vulnerability to climate and extreme weather impacts for US North Atlantic ports. Ocean Coast. Manag. 2019, 180, 104911. [Google Scholar] [CrossRef]
- Eakin, H.C.; Lemos, M.C.; Nelson, D.R. Differentiating capacities as a means to sustainable climate change adaptation. Glob. Environ. Chang. 2014, 27, 1–8. [Google Scholar] [CrossRef]
- Guo, S.L.; Li, C.J.; Wei, Y.L.; Zhou, K.; Liu, S.Q.; Xu, D.D.; Li, Q.Y. Impact of land expropriation on farmers’ livelihoods in the mountainous and hilly regions of Sichuan, China. J. Mt. Sci. 2019, 16, 2484–2501. [Google Scholar] [CrossRef]
- Guo, S.; Lin, L.; Liu, S.; Wei, Y.; Xu, D.; Li, Q.; Su, S. Interactions between sustainable livelihood of rural household and agricultural land transfer in the mountainous and hilly regions of Sichuan, China. Sustain. Dev. 2019, 27, 725–742. [Google Scholar] [CrossRef]
- DFID, U.K. Sustainable Livelihoods Guidance Sheets; DFID: London, UK, 1999; p. 445.
- Rusciano, V.; Civero, G.; Scarpato, D. Social and Ecological High Influential Factors in Community Gardens Innovation: An Empirical Survey in Italy. Sustainability 2020, 12, 4651. [Google Scholar] [CrossRef]
- Kuang, F.; Jin, J.; He, R.; Ning, J.; Wan, X. Farmers’ livelihood risks, livelihood assets and adaptation strategies in Rugao City, China. J. Environ. Manag. 2020, 264, 110463. [Google Scholar] [CrossRef]
- Xu, D.; Deng, X.; Guo, S.; Liu, S. Sensitivity of livelihood strategy to livelihood capital: An empirical investigation using nationally representative survey data from rural China. Soc. Indic. Res. 2019, 144, 113–131. [Google Scholar] [CrossRef]
- Yang, H.X.; Huang, K.; Deng, X.; Xu, D.D. Livelihood Capital and Land Transfer of Different Types of Farmers: Evi-dence from Panel Data in Sichuan Province, China. Land 2021, 10, 532. [Google Scholar] [CrossRef]
- Zeng, X.Y.; Guo, S.L.; Deng, X.; Xu, D.D. Livelihood risk and adaptation strategies of farmers in earthquake hazard threatened areas: Evidence from Sichuan province, China. Int. J. Disaster Risk Reduct. 2020, 51, 101971. [Google Scholar] [CrossRef]
- Zeng, X.; Fu, Z.; Deng, X.; Xu, D. The Impact of Livelihood Risk on Farmers of Different Poverty Types: Based on the Study of Typical Areas in Sichuan Province. Agriculture 2021, 11, 768. [Google Scholar] [CrossRef]
- Nguyen, Y.T.B.; Leisz, S.J. Determinants of livelihood vulnerability to climate change: Two minority ethnic communities in the northwest mountainous region of Vietnam. Env. Sci. Policy 2021, 123, 11–20. [Google Scholar] [CrossRef]
- Mainali, J.; Pricope, N.G. Mapping the need for adaptation: Assessing drought vulnerability using the livelihood vulnerability index approach in a mid-hill region of Nepal. Clim. Dev. 2019, 11, 607–622. [Google Scholar] [CrossRef]
- Barrios, S.; Ouattara, B.; Strobl, E. The impact of climatic change on agricultural production: Is it different for Africa? Food Policy 2008, 33, 287–298. [Google Scholar] [CrossRef] [Green Version]
- Ortiz-Bobea, A.; Ault, T.R.; Carrillo, C.M.; Chambers, R.G.; Lobel, D.B. Anthropogenic climate change has slowed global agricultural productivity growth. Nat. Clim. Chang. 2021, 11, 306–312. [Google Scholar] [CrossRef]
- Wang, F.T.; Liu, W.Q. A preliminary study on climatic vulnerability of agricultural production in the Loess Plateau. Clim. Environ. Res. 2003, 8, 91–100. (In Chinese) [Google Scholar]
- Piya, L.; Joshi, N.P.; Maharjan, K.L. Vulnerability of Chepang households to climate change and extremes in the Mid-Hills of Nepal. Clim. Chang. 2016, 135, 521–537. [Google Scholar] [CrossRef]
- Intergovernmental Panel on Climate Change (IPCC). Climate Change 2007: Impacts, Adaptation and Vulnerability: Contribution of Working Group II to the Fourth Assessment Report of the IPCC; Cambridge University Press: Cambridge, UK, 2007. [Google Scholar]
- Intergovernmental Panel on Climate Change (IPCC). Climate Change 2014: Impacts, Adaptation, and Vulnerability. Part A: Global and Sectoral Aspects. Contribution of Working Group II to the Fifth Assessment Report; Cambridge University Press: Cambridge, UK, 2014. [Google Scholar]
- Gentle, P.; Thwaites, R.; Race, D.; Alexander, K. Differential impacts of climate change on communities in the middle hills region of Nepal. Nat. Hazards 2014, 74, 815–836. [Google Scholar] [CrossRef]
- Panthi, J.; Aryal, S.; Dahal, P.; Bhandari, P.; Krakauer, N.Y.; Pandey, V.P. Livelihood vulnerability approach to assessing climate change impacts on mixed agro-livestock smallholders around the Gandaki River Basin in Nepal. Reg. Environ. Chang. 2016, 16, 1121–1132. [Google Scholar] [CrossRef]
- Zhou, W.; Guo, S.; Deng, X.; Xu, D. Livelihood resilience and strategies of rural residents of earthquake-threatened areas in Sichuan Province, China. Nat. Hazards 2021, 106, 255–275. [Google Scholar] [CrossRef]
- Fussel, H.M.; Klein, R.J.T. Climate Change Vulnerability Assessments: An Evolution of Conceptual Thinking. Clim. Chang. 2006, 75, 301–329. [Google Scholar] [CrossRef]
- Xu, D.; Zhou, W.; Deng, X.; Ma, Z.; Yong, Z.; Qing, C. Information credibility, disaster risk perception and evacuation willingness of rural households in China. Nat. Hazards 2020, 103, 2865–2882. [Google Scholar] [CrossRef]
- Xu, D.D.; Qing, C.; Deng, X.; Yong, Z.L.; Zhou, W.F.; Ma, Z.X. Disaster Risk Perception, Sense of Pace, Evacuation Willingness, and Relocation Willingness of Rural Households in Earthquake-Stricken Areas: Evidence from Sichuan Province, China. Int. J. Environ. Res. Public Health 2020, 17, 602. [Google Scholar] [CrossRef] [Green Version]
- Xu, D.D.; Zhuang, L.M.; Deng, X.; Qing, C.; Yong, Z.L. Media Exposure, Disaster Experience, and Risk Perception of Rural Households in Earthquake-Stricken Areas: Evidence from Rural China. Int. J. Environ. Res. Public Health 2020, 17, 3246. [Google Scholar] [CrossRef] [PubMed]
- Zhuang, L.; He, J.; Yong, Z.; Deng, X.; Xu, D. Disaster information acquisition by residents of China’s earthquake-stricken areas. Int. J. Disaster Risk Reduct. 2020, 51, 101908. [Google Scholar] [CrossRef]
- Yong, Z.L.; Zhuang, L.M.; Liu, Y.; Deng, X.; Xu, D.D. Differences in the Disaster-Preparedness Behaviors of the General Public and Professionals: Evidence from Sichuan Province, China. Int. J. Environ. Res. Public Health 2020, 17, 5254. [Google Scholar] [CrossRef]
- Xu, D.; Yong, Z.; Deng, X.; Liu, Y.; Huang, K.; Zhou, W.; Ma, Z. Financial Preparation, Disaster Experience, and Disaster Risk Perception of Rural Households in Earthquake-Stricken Areas: Evidence from the Wenchuan and Lushan Earthquakes in China’s Sichuan Province. Int. J. Environ. Res. Public Health 2019, 16, 3345. [Google Scholar] [CrossRef] [Green Version]
- Xu, D.; Guo, S.; Xie, F.; Liu, S.; Cao, S. The impact of rural laborer migration and household structure on household land use arrangements in mountainous areas of Sichuan Province, China. Habitat Int. 2017, 70, 72–80. [Google Scholar] [CrossRef]
- Yohe, G.; Tol, R.S. Indicators for social and economic coping capacity—moving toward a working definition of adaptive capacity. Glob. Environ. Chang. 2002, 12, 25–40. [Google Scholar] [CrossRef]
- Debortoli, N.S.; Camarinha, P.; Marengo, J.A.; Rodrigues, R.R. An index of brazil’s vulnerability to expected increases in natural flash flooding and landslide disasters in the context of climate change. Nat. Hazards 2017, 86, 557–582. [Google Scholar] [CrossRef]
- Peng, L.; Xu, D.; Wang, X. Vulnerability of rural household livelihood to climate variability and adaptive strategies in landslide-threatened western mountainous regions of the Three Gorges Reservoir Area, China. Clim. Dev. 2019, 11, 469–484. [Google Scholar] [CrossRef]
- Lim, S.J.; Park, H.J.; Kim, H.S.; Park, S.I.; Han, S.S.; Kim, H.J.; Lee, S.H. Vulnerability assessment of forest landslide risk using GIS adaptation to climate change. For. Sci. Technol. 2016, 12, 207–213. [Google Scholar] [CrossRef]
- Hoq, M.S.; Raha, S.K.; Hossain, M.I. Livelihood vulnerability to flood hazard: Understanding from the flood-prone Haor Ecosystem of Bangladesh. Environ. Manag. 2021, 67, 532–552. [Google Scholar] [CrossRef]
- Xu, D.; Liu, E.; Wang, X.; Tang, H.; Liu, S. Rural Households’ Livelihood Capital, Risk Perception, and Willingness to Purchase Earthquake Disaster Insurance: Evidence from Southwestern China. Int. J. Environ. Res. Public Health 2018, 15, 1319. [Google Scholar] [CrossRef] [Green Version]
- Zeng, G.A.; Yang, P.H. The impact of natural disasters on the income gap among households in China: A study based on CFPS (2014) survey data. Fujian Forum 2018, 5, 5–16. (In Chinese) [Google Scholar]
- Mottaleb, K.A.; Mohanty, S.; Hoang, H.T.K.; Rejesus, R.M. The effects of natural disasters on farm household income and expenditures: A study on rice farmers in Bangladesh. Agric. Syst. 2013, 121, 43–52. [Google Scholar] [CrossRef]
- Wu, X.H.; Guo, J. Study on Impact Assessment of Meteorological Disaster on Industrial Economic System. In Proceedings of the Sixth Forum on Rain, Snow and Frost Disaster in Shenyang; Chinese Meteorological Society, Beijing, China, 12 September 2012; p. 13. (In Chinese). [Google Scholar]
- Iqbal, M.A.; Rizwan, M.; Abbas, A.; Makhdum, M.S.A.; Kousar, R.; Nazam, M.; Samie, A.; Nadeem, N.A. Quest for Livelihood Sustainability? Patterns, Motives and Determinants of Non-Farm Income Diversification among Agricultural Households in Punjab Pakistan. Sustainability 2021, 13, 9084. [Google Scholar] [CrossRef]
- Carpenter, S.; Walker, B.; Anderies, J.M.; Abel, N. From metaphor to measurement: Resilience of what to what? Ecosystems 2001, 4, 765–781. [Google Scholar] [CrossRef]
- Adger, W.N.; Kelly, P.M. Social Vulnerability to Climate Change and the Architecture of Entitlements. Mitig. Adapt. Strateg. Glob. Chang. 1999, 4, 253–266. [Google Scholar] [CrossRef]
- Liu, Y.; Zhao, M.; Liu, D. Exposure, sensitivity, and social adaptive capacity related to climate change: Empirical research in China. Chin. J. Popul. Resour. Environ. 2017, 15, 209–219. [Google Scholar] [CrossRef]
- Iglesias, A. Climate change and agriculture: An economic analysis of global impacts, adaptation and distributional effects. Eur. Rev. Agric. Econ. 2010, 37, 421–423. [Google Scholar] [CrossRef]
- Yang, L.; Liu, M.C.; Min, Q.W. Natural Disasters, Public Policies, Family Characteristics, or Livelihood Assets? The Driving Factors of Farmers’ Livelihood Strategy Choices in a Nature Reserve. Sustainability 2019, 11, 5423. [Google Scholar] [CrossRef] [Green Version]
- Alam, G.M. Livelihood cycle and vulnerability of rural households to climate change and hazards in Bangladesh. Environ. Manag. 2017, 59, 777–791. [Google Scholar] [CrossRef]
- Sarker, M.N.I.; Wu, M.; Alam, G.M.; Shouse, R.C. Livelihood vulnerability of riverine-island dwellers in the face of natural disasters in Bangladesh. Sustainability 2019, 11, 1623. [Google Scholar] [CrossRef] [Green Version]
- Sujakhu, N.M.; Ranjitkar, S.; He, J.; Schmidt-Vogt, D.; Su, Y.; Xu, J. Assessing the livelihood vulnerability of rural indigenous households to climate changes in Central Nepal, Himalaya. Sustainability 2019, 11, 2977. [Google Scholar] [CrossRef] [Green Version]
- Malakar, K.; Mishra, T.; Patwardhan, A. Perceptions of multi-stresses impacting livelihoods of marine fishermen. Mar. Policy 2018, 97, 18–26. [Google Scholar] [CrossRef]
- Pandey, R.; Jha, S.K.; Alatalo, J.M.; Archie, K.M.; Gupta, A.K. Sustainable livelihood framework-based indicators for assessing climate change vulnerability and adaptation for Himalayan communities. Ecol. Indic. 2017, 79, 338–346. [Google Scholar] [CrossRef]
- Zhao, X.Y.; Jie, Y.Q.; He, Y.Q.; He, X.F.; Mu, F.F.; Su, H.Z.; Lan, H.X. Livelihood adaptability of farmers in key ecological function areas under multiple pressures: A case study of the Yellow River water supply area in Gannan. Popul. Res. Environ. 2020, 30, 140–149. (In Chinese) [Google Scholar]
- Thulstrup, A.W. Livelihood resilience and adaptive capacity: Tracing changes in household access to capital in Central Vietnam. World Dev. 2015, 74, 352–362. [Google Scholar] [CrossRef]
- Liu, W.; Li, J.; Ren, L.; Xu, J.; Li, C.; Li, S. Exploring livelihood resilience and its impact on livelihood strategy in rural China. Soc. Indic. Res. 2020, 150, 977–998. [Google Scholar] [CrossRef]
- Azam, G.; Huda, M.E.; Bhuiyan, M.A.H.; Mohinuzzaman, M.; Bodrud-Doza, M.; Islam, S.D.U. Climate Change and Natural Hazards Vulnerability of Char Land (Bar Land) Communities of Bangladesh: Application of the Livelihood Vulnerability Index (LVI). Glob. Soc. Welfare 2019, 1, 13. [Google Scholar] [CrossRef]
- Gerlitz, J.Y.; Macchi, M.; Brooks, N.; Pandey, R.; Banerjee, S.; Jha, S.K. The multidimensional livelihood vulnerability index–an instrument to measure livelihood vulnerability to change in the Hindu Kush Himalayas. Clim. Dev. 2017, 9, 124–140. [Google Scholar] [CrossRef]
- Shah, K.U.; Dulal, H.B. Household capacity to adapt to climate change and implications for food security in Trinidad and Tobago. Reg. Environ. Chang. 2015, 15, 1379–1391. [Google Scholar] [CrossRef]
- Li, Y.; Wang, Y. Study on multidimensional Poverty Decomposition of Farmers with different livelihood strategies in western China. J. Xi ‘an Univ. Financ. Econ. 2021, 2, 73–80. (In Chinese) [Google Scholar]
- Zhou, Y.; Wang, H.L.; Liu, Z.H. Research on the influencing factors of non-agricultural employment of rural households relocated to inhospitable areas under the framework of livelihood resilience: Based on the investigation of Kizilsu Kirgiz Autonomous Prefecture in Xinjiang. Arid Land Resour. Environ. 2020, 11, 29–35. (In Chinese) [Google Scholar]
- Ghimire, Y.N.; Shivakoti, G.P.; Perret, S.R. Household-level vulnerability to drought in hill agriculture of Nepal: Implications for adaptation planning. Int. J. Sustain. Dev. World Ecol. 2010, 17, 225–230. [Google Scholar] [CrossRef]
- Cattivelli, V.; Rusciano, V. Social Innovation and Food Provisioning during COVID-19: The Case of Urban–Rural Initiatives in the Province of Naples. Sustainability 2020, 12, 4444. [Google Scholar] [CrossRef]
- Cisco, G.; Gatto, A. Climate Justice in an Intergenerational Sustainability Framework: A Stochastic OLG Model. Economies 2021, 9, 47. [Google Scholar] [CrossRef]


| IPCC Contributing Factor | Major Dimensions | Subdimensions | Explanation | Source |
|---|---|---|---|---|
| Exposure | Natural disaster | Landslide, debris flow or flood shock | The number of landslides, debris flow or flood shock | Developed for the purposes of this questionnaire |
| Injury | Whether the family was injured as a result of the disaster (landslide, debris flow or flood) (0 = no, 1 = yes) | [91] | ||
| Circumstances of households that do not receive a warning before a natural disaster (landslide, debris flow or flood) | Whether an early warning has been received prior to a natural disaster (landslide, debris flow or flood) (0 = no, 1 = yes) | [91] | ||
| Climate variability | Facing gradually increasing natural disasters in recent years | Whether there been any changes in the frequency of disasters in recent years (0 = no, 1 = yes) | [91] | |
| Concerns about climate change | How worried are you about the possible effects of climate change on your home? (1 = not worried at all, 5 = very worried) | Developed for the purposes of this questionnaire | ||
| Degree of soil and water loss | Degree of soil erosion of home land (1 = not serious, 5 = very serious) | Developed for the purposes of this questionnaire | ||
| Sensitivity | Consumption | Annual per capita household consumption | Annual per capita consumption expenditure (Yuan 1) | [78] |
| Debt | Household debt | Whether the household borrowed from financial channels or from relatives and friends during the previous five years (0 = no, 1 = yes) | [78] | |
| Area of mountainous area | The ratio of mountain area to total area of family | The percentage of the total area of the home that is mountainous | Developed for the purposes of this questionnaire | |
| Health | Genetic disorder | Whether anyone in the family has a genetic disease/major genetic disorder (0 = no, 1 = yes) | [92,93] | |
| Sanitary latrine | Whether there is a sanitary latrine in your home (0 = no, 1 = yes) | [92,93] | ||
| The number of people who need help | Whether there are people in the family who need help because they are old/unable to move well (0 = no, 1 = yes) | Developed for the purposes of this questionnaire | ||
| New Rural Cooperative Medical Insurance | Whether the family has purchased the new rural cooperative medical insurance (the so-called medical insurance) (0 = no, 1 = yes) | Developed for the purposes of this questionnaire | ||
| Food | Whether the crops have been affected/reduced by the disaster/weather | Have the crops have been affected/reduced by the disaster/weather? (0 = no, 1 = yes) | Developed for the purposes of this questionnaire | |
| Water | Availability of Water Resources | Whether the present water resources can meet the basic needs of production and living (0 = no, 1 = yes) | [35,91] | |
| Livelihood Resilience | Human capital | Education level | Ratio of Population with High School Education or above to Total Population (%) | [94,95,96] |
| Proportion of population in the labor force | Labor force to total population ratio (%) | [94,95,96] | ||
| Skills | Ratio of people with skills to total population (%) | [94,95,96] | ||
| Natural capital | Per capita cultivated land area | Ratio of cultivated land area in operation to total population (Mu 2/person) | [94,95,96] | |
| Per capita forestland area | Ratio of operating forestland area to total population (Mu 2/person) | [94,95,96] | ||
| Financial capital | Per capita annual income | Ratio of total cash income to total number of persons (Yuan 1/person) | [94,95,96] | |
| Deposits | Whether they have a deposit (no = 0, yes = 1) | [94,95,96] | ||
| Social capital | Participate in association organization | Number of associations they participate in (number) | [94,95,96] | |
| Social network | Number of families visiting relatives and friends during the Spring Festival (number) | [94,95,96] | ||
| Members of employment | Whether they have relatives in the village or township cadres or in roles as other public officials (such as teachers, civil servants) (number) | [94,95,96] | ||
| Physical capital | Present value of fixed assets | Present value of agriculture, housing and other fixed assets | [94,95,96] |
| IPCC Contributing Factor | Major Dimensions | Subdimensions | Mean | SD | Weight |
|---|---|---|---|---|---|
| Exposure | Natural disaster | Landslide, debris flow or flood shock | 8.58 | 12.70 | 0.04239 |
| Injury | 0.20 | 0.40 | 0.10753 | ||
| Circumstances of households that do not receive a warning before a natural disaster (landslide, debris flow or flood) | 0.22 | 0.41 | 0.01616 | ||
| Climate variability | Facing gradually increasing natural disasters in recent years | 0.76 | 0.43 | 0.01852 | |
| Concerns about climate change | 3.51 | 1.24 | 0.01119 | ||
| Degree of soil and water loss | 2.84 | 1.36 | 0.02279 | ||
| Sensitivity | Consumption | Annual per capita household consumption | 10,053.94 | 11,633.08 | 0.02365 |
| Debt | Household debt | 0.56 | 0.50 | 0.03795 | |
| Area of mountainous area | The ratio of mountain area to total area of home | 0.27 | 0.43 | 0.08095 | |
| Health | Genetic disorder | 0.33 | 0.47 | 0.07370 | |
| Sanitary latrine | 0.71 | 0.45 | 0.08223 | ||
| The number of people who need help | 0.21 | 0.41 | 0.10258 | ||
| New Rural Cooperative Medical Insurance | 0.68 | 0.47 | 0.07432 | ||
| Food | Whether the crops have been affected/reduced by the disaster/weather | 0.52 | 0.50 | 0.04279 | |
| Water | Availability of Water Resources | 0.95 | 0.22 | 0.19050 | |
| Livelihood Resilience | Human capital | Education level | 0.16 | 0.21 | 0.00067 |
| Proportion of population in the labor force | 0.58 | 0.30 | 0.02132 | ||
| Skills | 0.24 | 0.24 | 0.00364 | ||
| Natural capital | Per capita cultivated land area | 0.82 | 2.28 | 0.00027 | |
| Per capita forestland area | 7.56 | 18.48 | 0.00088 | ||
| Financial capital | Per capita annual income | 16,440.90 | 18241.39 | 0.00037 | |
| Deposits | 0.46 | 0.50 | 0.04051 | ||
| Social capital | Participate in association organization | 0.16 | 0.38 | 0.00179 | |
| Social network | 5.27 | 8.15 | 0.00036 | ||
| Members of the employment | 1.50 | 2.99 | 0.00127 | ||
| Physical capital | Present value of fixed assets | 45.86 | 67.29 | 0.00166 |
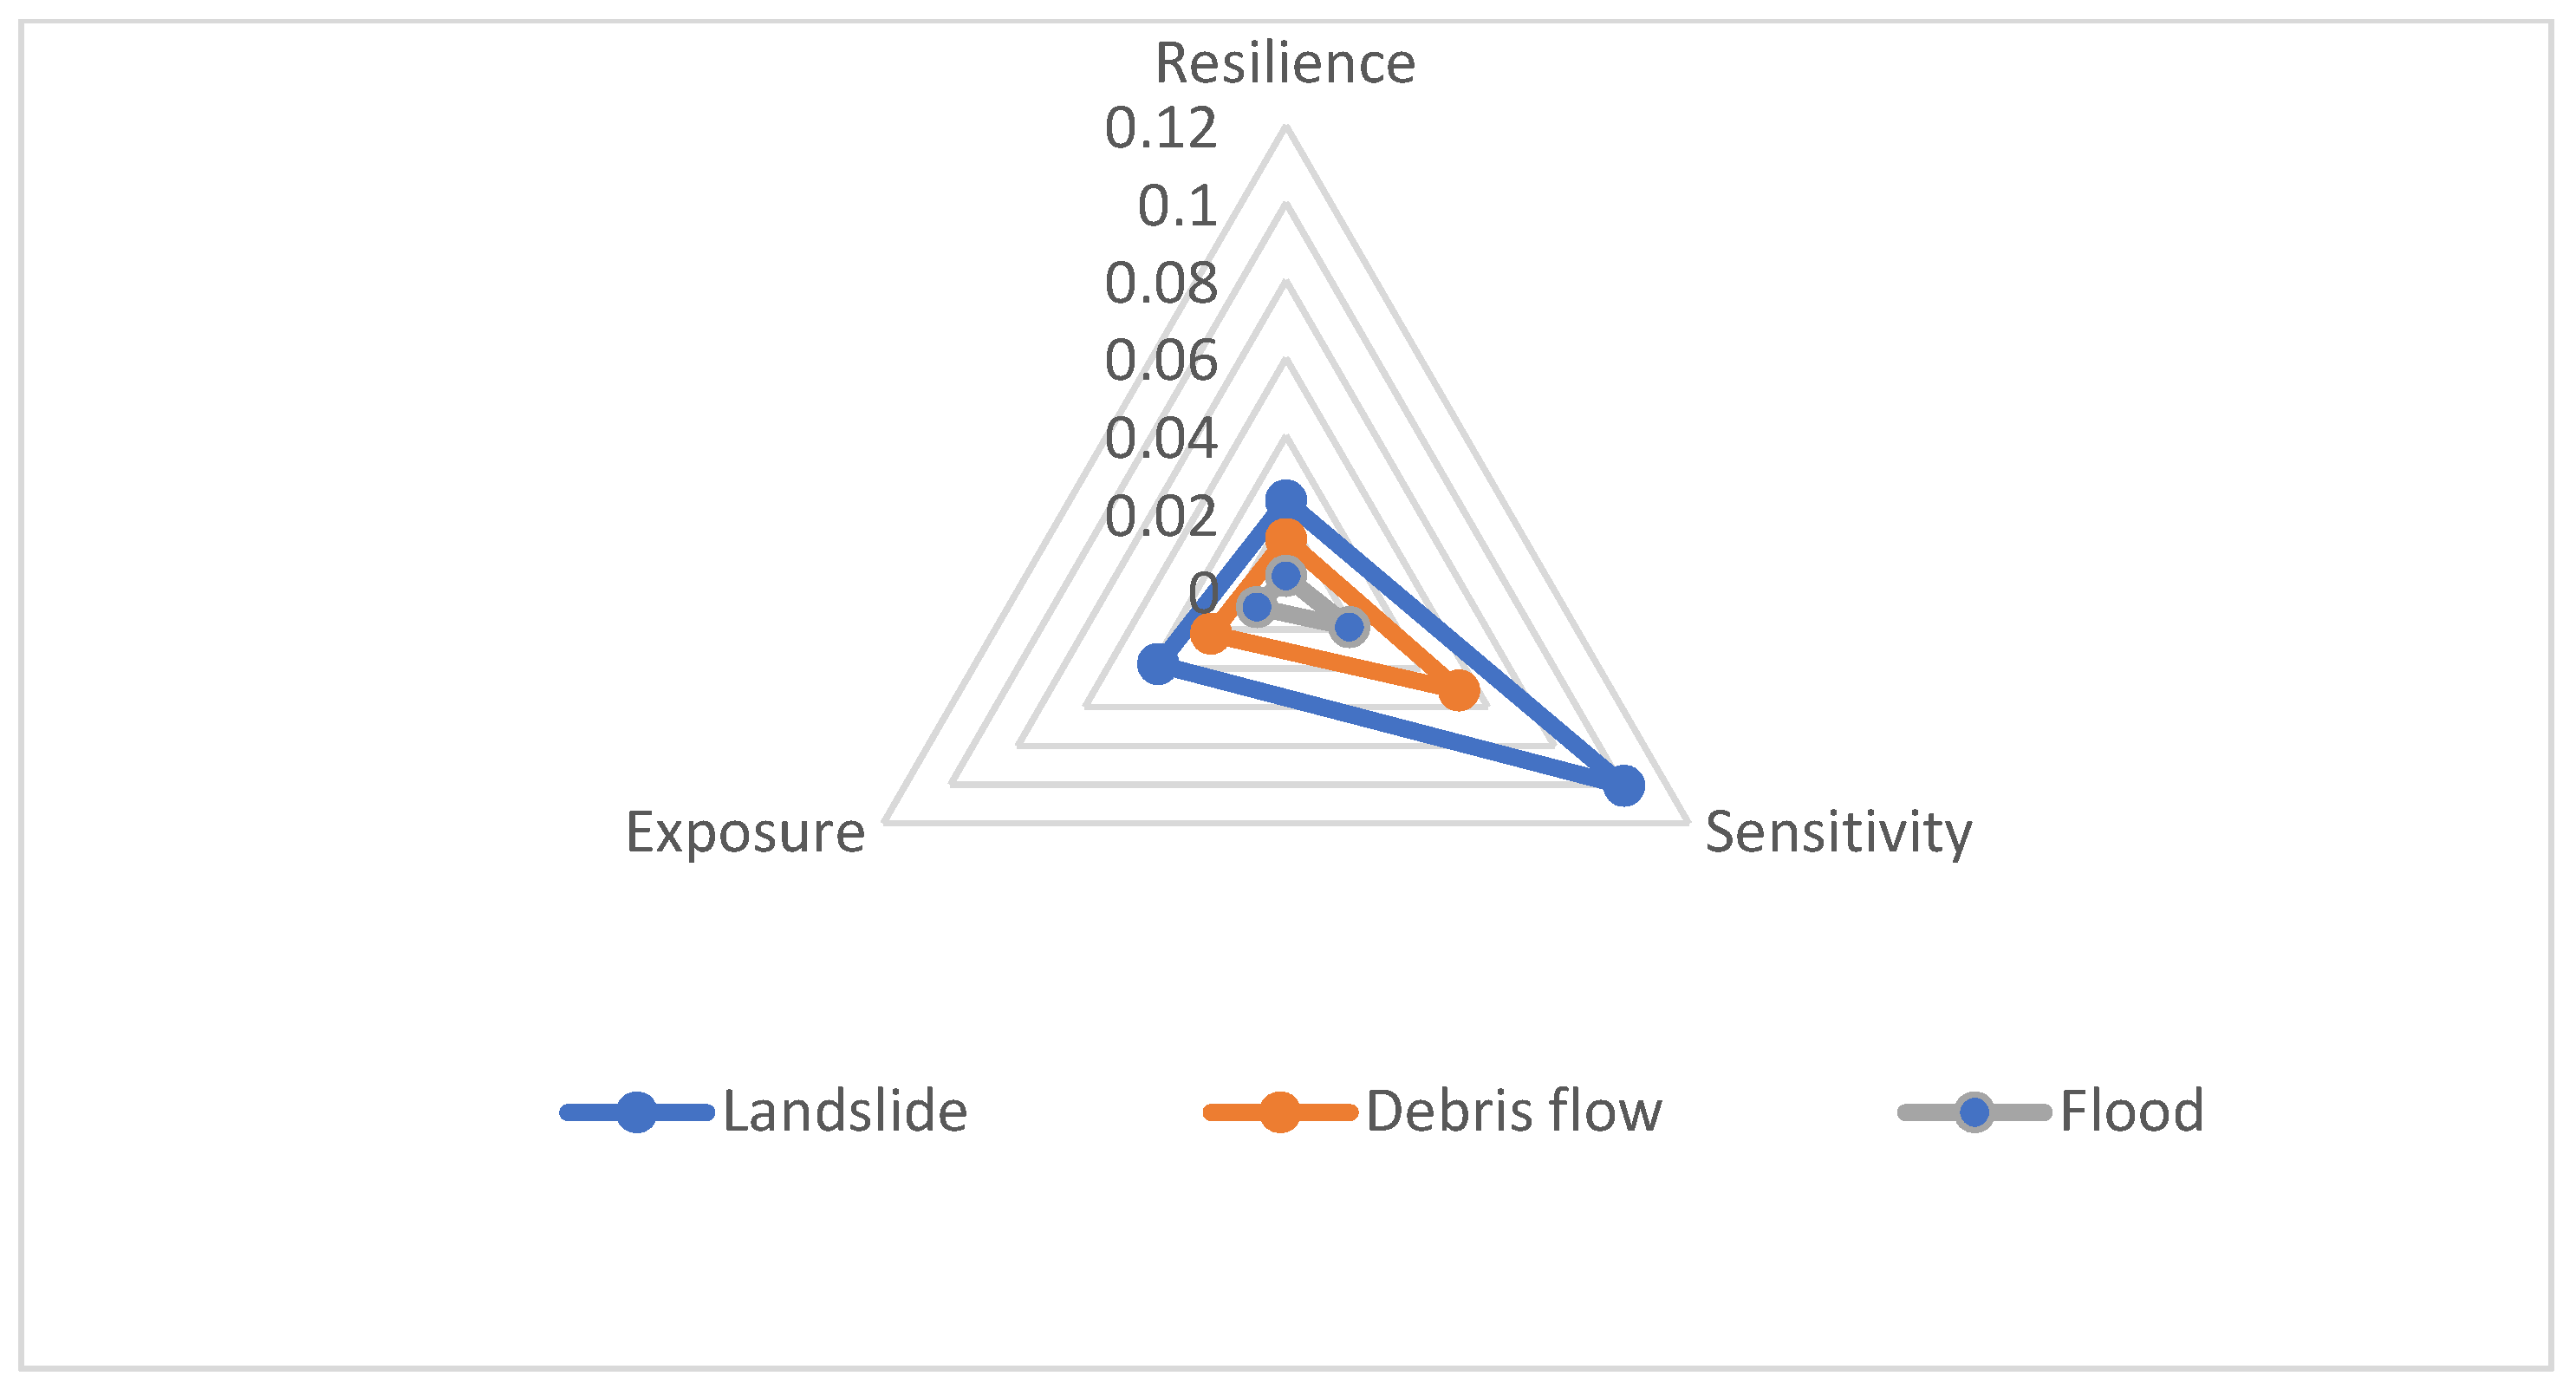
| IPCC Contributing Factor | IPCC Contributing Factor Value | Major Components | Major Component Value | ||||
|---|---|---|---|---|---|---|---|
| Landslide | Debris Flow | Flood | Landslide | Debris Flow | Flood | ||
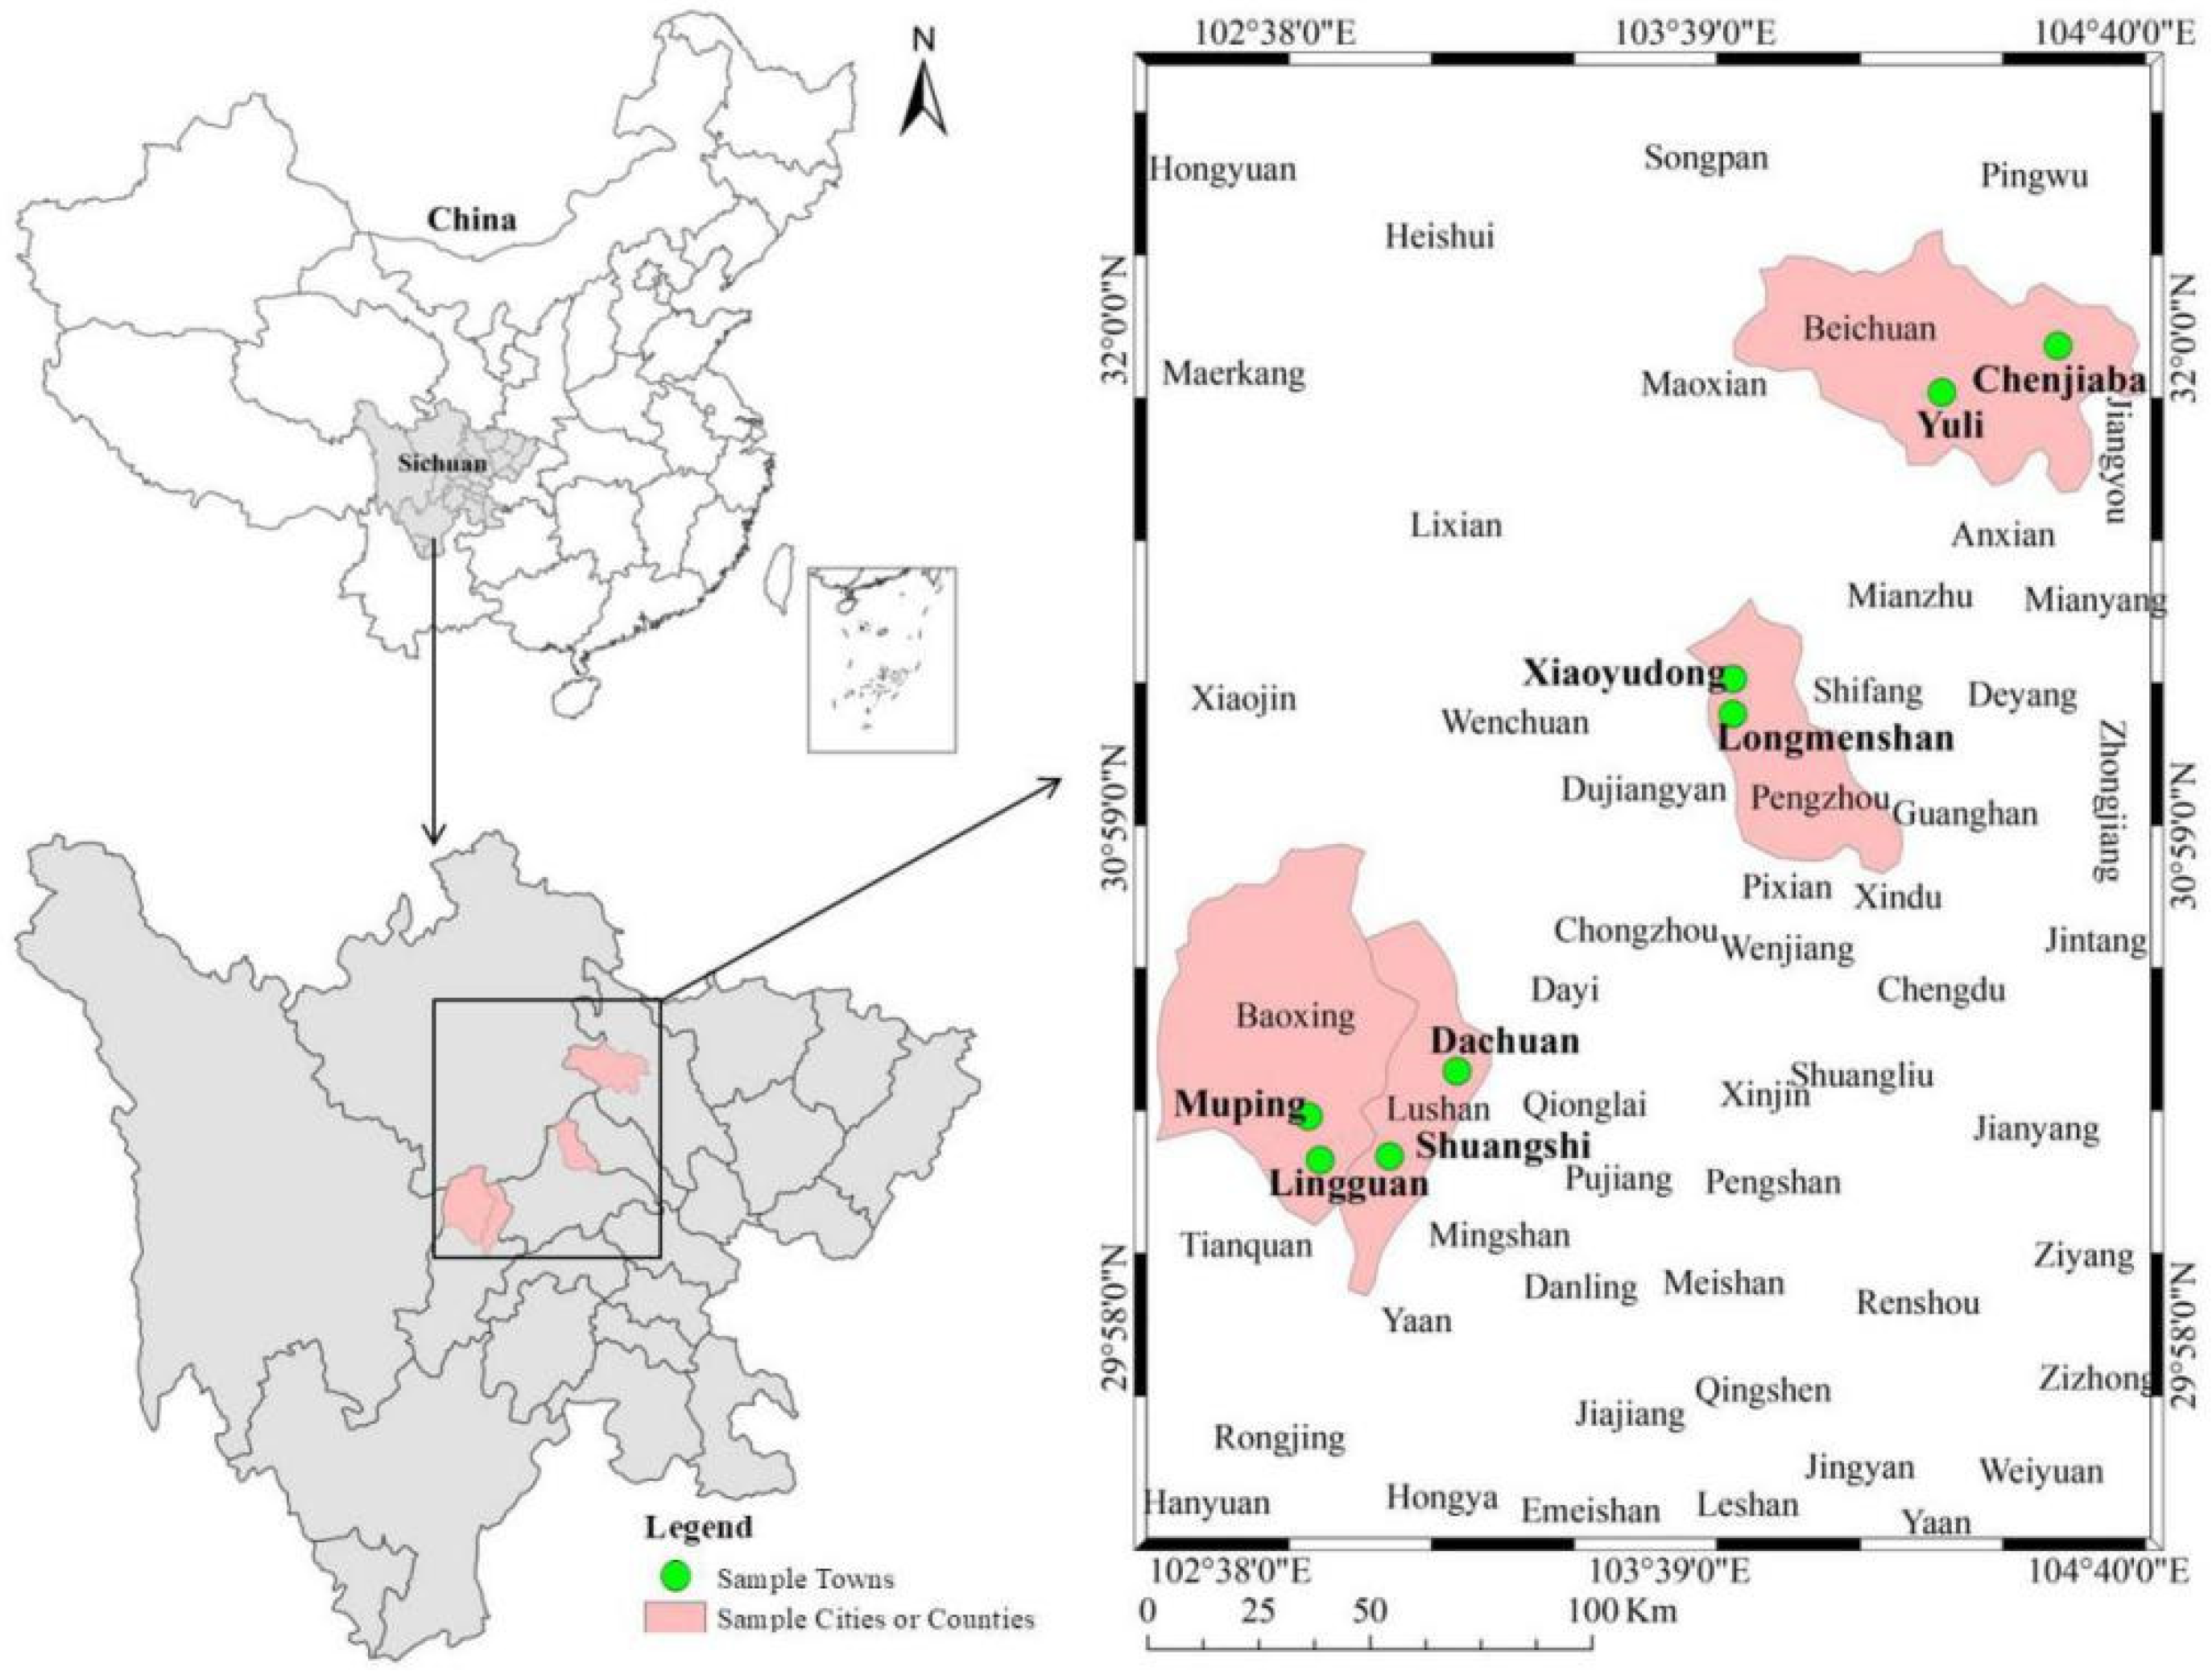
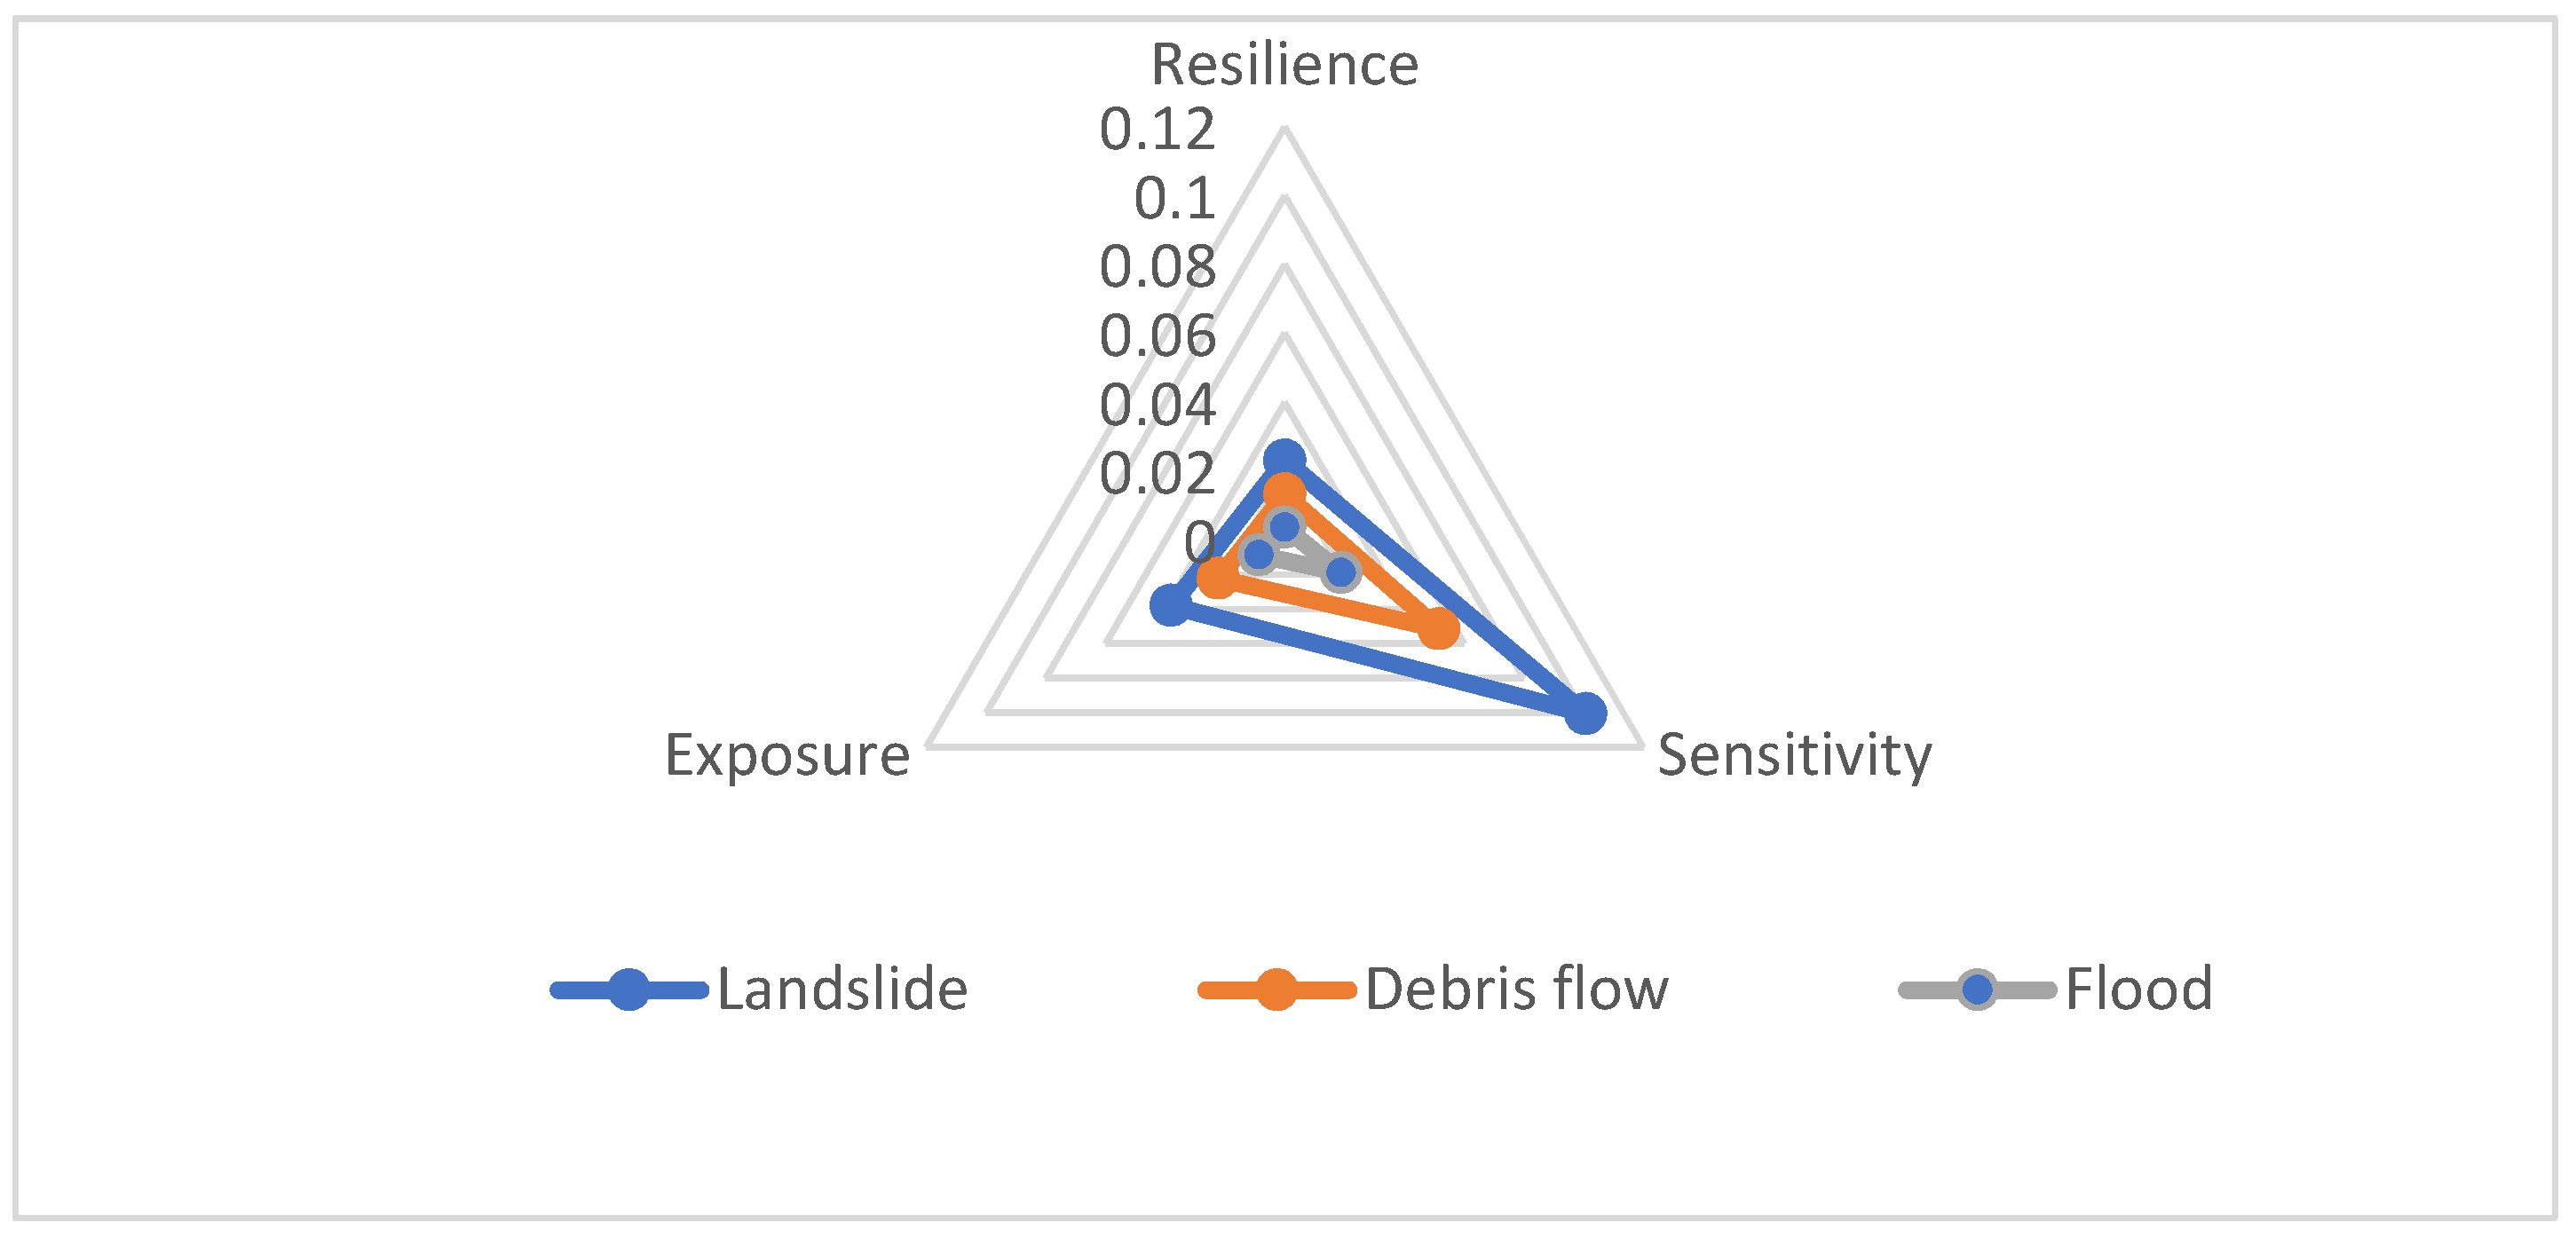
| Livelihood Resilience | 0.0232 | 0.0133 | 0.0037 | Human capital | 0.0071 | 0.0038 | 0.0013 |
| Natural capital | 0.0006 | 0.0003 | 0.0001 | ||||
| Financial capital | 0.0128 | 0.0078 | 0.0017 | ||||
| Social capital | 0.0018 | 0.0010 | 0.0004 | ||||
| Physical capital | 0.0008 | 0.0005 | 0.0002 | ||||
| Sensitivity | 0.1008 | 0.0516 | 0.0189 | Consumption | 0.0008 | 0.0005 | 0.0001 |
| Debt | 0.0123 | 0.0063 | 0.0028 | ||||
| Area of mountainous area | 0.0125 | 0.0070 | 0.0026 | ||||
| Health | 0.0553 | 0.0289 | 0.0093 | ||||
| Food | 0.0128 | 0.0067 | 0.0029 | ||||
| Water | 0.0070 | 0.0023 | 0.0012 | ||||
| Exposure | 0.0380 | 0.0223 | 0.0086 | Natural disaster | 0.0207 | 0.0121 | 0.0045 |
| Climate variability | 0.0173 | 0.0101 | 0.0040 | ||||
| IPCC-LVI | 0.1155 | 0.0605 | 0.0238 | ||||
| IPCC Contributing Factor | IPCC Contributing Factor Value | Major Components | Major Component Value | ||||
|---|---|---|---|---|---|---|---|
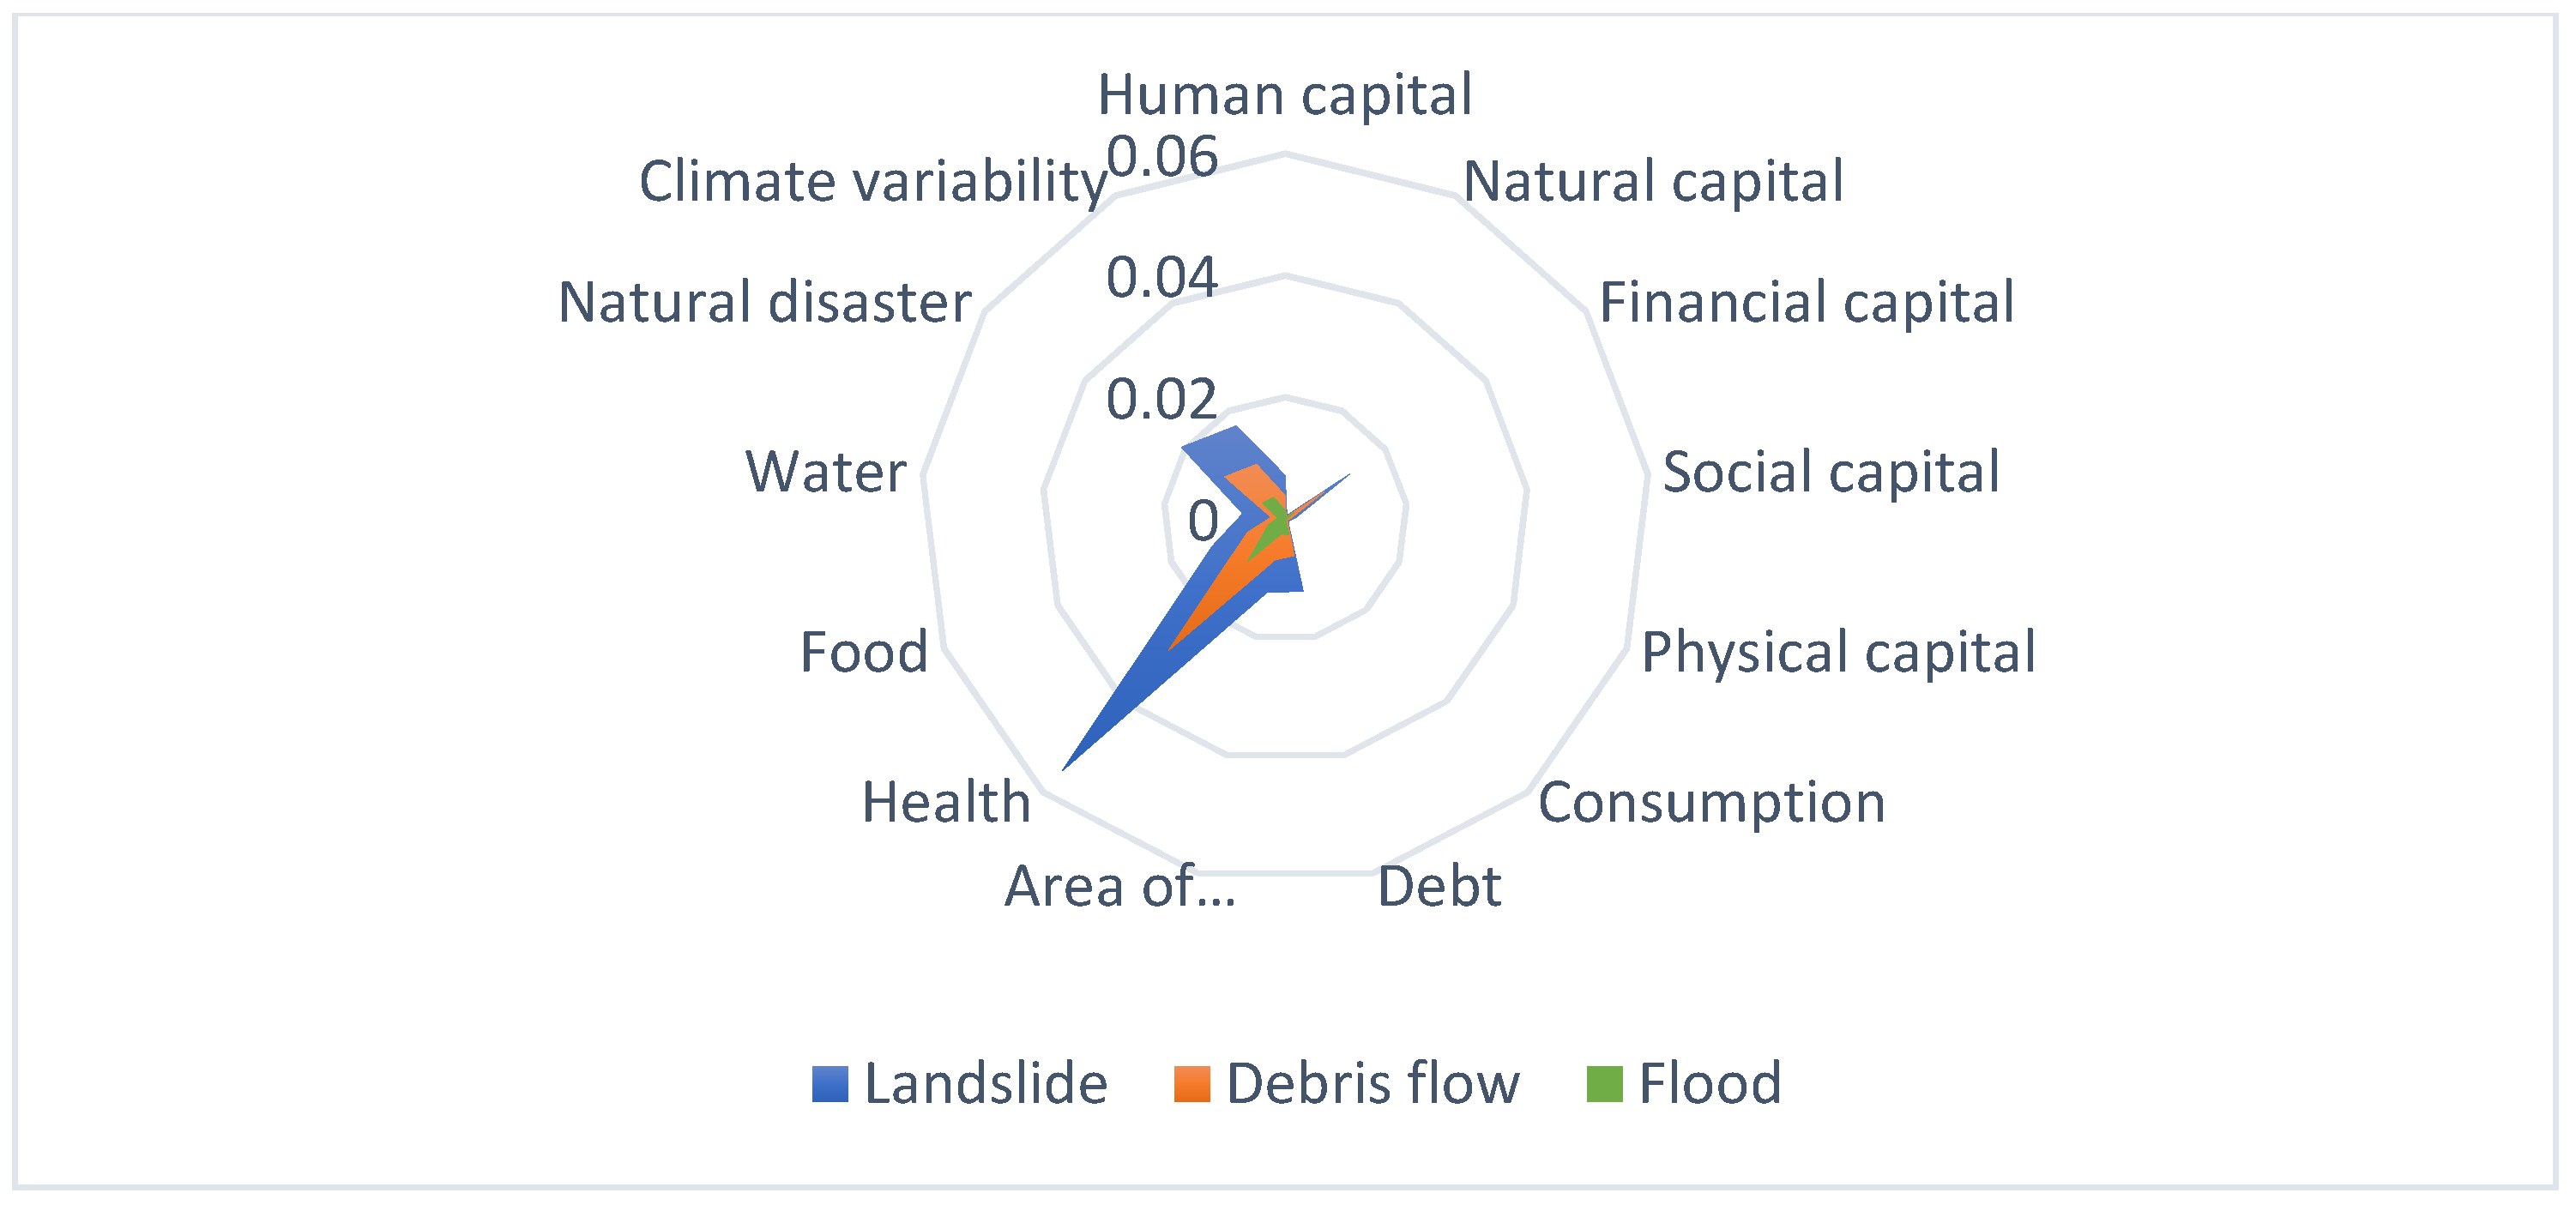
| Nonfarming Household | Part-Time Household | Farming Household | Nonfarming Household | Part-Time Household | Farming Household | ||
| Livelihood Resilience | 0.0352 | 0.0019 | 0.0031 | Human capital | 0.0109 | 0.0005 | 0.0008 |
| Natural capital | 0.0010 | 0.0000 | 0.0001 | ||||
| Financial capital | 0.0191 | 0.0011 | 0.0020 | ||||
| Social capital | 0.0028 | 0.0001 | 0.0002 | ||||
| Physical capital | 0.0013 | 0.0001 | 0.0001 | ||||
| Sensitivity | 0.1533 | 0.0069 | 0.0111 | Consumption | 0.0013 | 0.0000 | 0.0001 |
| Debt | 0.0196 | 0.0007 | 0.0010 | ||||
| Area of mountainous area | 0.0194 | 0.0012 | 0.0015 | ||||
| Health | 0.0847 | 0.0030 | 0.0058 | ||||
| Food | 0.0202 | 0.0008 | 0.0014 | ||||
| Water | 0.0082 | 0.0012 | 0.0012 | ||||
| Exposure | 0.0616 | 0.0029 | 0.0042 | Natural disaster | 0.0336 | 0.0015 | 0.0022 |
| Climate variability | 0.0280 | 0.0014 | 0.0021 | ||||
| IPCC-LVI | 0.0042 | 0.0002 | 0.0002 | ||||
| Variable | Types of Natural Disasters | The Overall Sample | ||
|---|---|---|---|---|
| Landslide | Debris Flow | Flood | ||
| Exposure | −4.0388 | 9.9804 | 5.4835 | −0.1218 |
| (−5.4787) | (−7.0540) | (−12.6898) | (−3.7563) | |
| Sensitivity | −2.0608 | 1.2832 | 5.0520 | −0.5770 |
| (−2.4139) | (−4.9882) | (−4.6718) | (−2.0442) | |
| Livelihood Resilience | 38.6358 ** | 55.98425 *** | −21.6745 | 24.33493 ** |
| (−15.4285) | (−19.1197) | (−32.4878) | (−10.2524) | |
| IPCC-LVI | −43.53353 | 31.47006 | 5.687566 | −10.7671 |
| (33.00933) | (31.21301) | (59.93277) | (22.5154) | |
| N | 189 | 99 | 39 | 327 |
| Prob > chi2 | 0.0917 | 0.0000 | 0.7397 | 0.0918 |
| R2 | 0.0655 | 0.1127 | 0.0289 | 0.0290 |
Publisher’s Note: MDPI stays neutral with regard to jurisdictional claims in published maps and institutional affiliations. |
© 2021 by the authors. Licensee MDPI, Basel, Switzerland. This article is an open access article distributed under the terms and conditions of the Creative Commons Attribution (CC BY) license (https://creativecommons.org/licenses/by/4.0/).
Share and Cite
Yang, X.; Guo, S.; Deng, X.; Wang, W.; Xu, D. Study on Livelihood Vulnerability and Adaptation Strategies of Farmers in Areas Threatened by Different Disaster Types under Climate Change. Agriculture 2021, 11, 1088. https://0-doi-org.brum.beds.ac.uk/10.3390/agriculture11111088
Yang X, Guo S, Deng X, Wang W, Xu D. Study on Livelihood Vulnerability and Adaptation Strategies of Farmers in Areas Threatened by Different Disaster Types under Climate Change. Agriculture. 2021; 11(11):1088. https://0-doi-org.brum.beds.ac.uk/10.3390/agriculture11111088
Chicago/Turabian StyleYang, Xue, Shili Guo, Xin Deng, Wei Wang, and Dingde Xu. 2021. "Study on Livelihood Vulnerability and Adaptation Strategies of Farmers in Areas Threatened by Different Disaster Types under Climate Change" Agriculture 11, no. 11: 1088. https://0-doi-org.brum.beds.ac.uk/10.3390/agriculture11111088