
Choices in Sustainable Food Consumption: How Spanish Low Intake Organic Consumers Behave


1
Centre for Research and Development in Agrifood Systems and Sustainability (CISAS), Instituto Politécnico de Viana do Castelo (IPVC), 4900-347 Viana do Castelo, Portugal
2
Escola Superior Agrária (ESA), Instituto Politécnico de Viana do Castelo (IPVC), 4900-347 Viana do Castelo, Portugal
3
Escola Superior de Tecnologia e Gestão (ESTG), Instituto Politécnico de Viana do Castelo (IPVC), 4900-347 Viana do Castelo, Portugal
4
Laboratorio de Historia de los Agroecosistemas (LHA), Universidad Pablo de Olavide, 41013 Sevilha, Spain
*
Author to whom correspondence should be addressed.
Agriculture 2021, 11(11), 1125; https://0-doi-org.brum.beds.ac.uk/10.3390/agriculture11111125
Submission received: 20 September 2021
/
Revised: 2 November 2021
/
Accepted: 3 November 2021
/
Published: 10 November 2021
(This article belongs to the Special Issue Agricultural Food Marketing, Economics and Policies)
Abstract
:The consumption of organic products has consistently increased over the last decades, covering increasingly diversified consumers, both in the characteristics and the reasons associated with consumption. This heterogeneity evidences the need to examine in depth the reasons for the purchase and consumption of these products. The core aim of this study is related to the motivational drivers of organic consumption. The survey included 250 respondents from Andalusia (Spain) who completed an online questionnaire and personal interviews. A convenience sampling method was applied, and the best-worst scaling method allowed us to analyze ten attributes of organic purchasing behavior. Health benefits and environmental impact are the key attributes explaining the consumption of organic products. To deeply understand organic consumer motivations, we studied the influence of six classification variables over the studied attributes. Applying ordinal regressions, we found that having children under 18 at home and a consumer’s academic level contribute in a relevant way to explain the valorization of the health benefits attribute. Also, the place to purchase organic food and academic level correlates with the valuation of GMOs in food. Andalusia is one of the largest European regions for organic production but with minor relevance in consumption. Nevertheless, despite this apparent paradox, the results of the present study point to a consumer profile very similar to other European countries with consolidated organic consumption.
1. Introduction
The production and consumption of organic products have increased continuously and consistently, somewhat worldwide [1,2,3,4]. Spain has played a relevant role in this trend. Currently, Spain is the largest organic crop producer in Europe, with 2.4 million dedicated hectares [5]. Despite this, domestic consumption does not stand out, with a per capita value of 46 €/year, much lower than the 344 € in Denmark or 338 € in Switzerland [5], and an organic consumption of only 1.69% of the total food intake [6].
These low demand dynamics have contributed to increased difficulty in developing this emerging market [7]. One of the main reasons seems to be the concentration of sales in specialized retail channels, making it hard to accomplish economies of scale and consequent reduction of the price differential between organic and conventional products, preventing the generalization of their consumption [8].
This significant discrepancy between production and domestic consumption encourages further studies on Spanish consumer behavior, particularly understanding the reasons and barriers to the consumption of organic products.
Over the past few years, around the world, the growth of the organic products market and the increasingly widespread interest of consumers have made their consumption increasingly normalized and has triggered the development of multiple investigations to enlighten the motivations and organic consumer’s behavior [1,2,3,4,9,10,11,12,13].
Across the majority of existing studies, it is demonstrated that consumers often base their choice of organic products on intangible attributes [14,15]. Health, environmental and nutritional issues are perceived as more relevant in organic than in conventional food [5,10,16]. Called credence attributes, these predictors play a decisive role in the purchasing process. However, its evaluation before, during, or after purchase reveals itself to be challenging to achieve.
Most studies point to a consensus regarding the essential attribute for the purchase or consumption of organic products: the higher forecaster of organic consumer behavior is centered on its health and safety insurance [2,3,16,17,18,19,20,21,22]. Also, health concern is the first reason for Spanish consumers to start consuming organic products as this kind of food is associated with more natural and superior quality [23]. Another intangible attribute often pointed out is the perception that organic production is more respectful of the environment and biodiversity, making consuming these products an act of social consciousness. There are more and more consumers sensitive to the impact that their consumption has on issues such as environmental protection, fair trade, or animal welfare [1,19,24,25,26,27,28,29,30]. Another credence attribute often referred to as encouraging the consumption of organic products is the belief that these products contain better and healthier ingredients than non-organic food [31,32,33].
Despite the importance of credence attributes in buying/consuming organic products, there are other attributes, objective and measurable, equally relevant for consumers of organic products. These are defined as search and experience attributes. As opposed to credence attributes, these influencers are accessible to and can be evaluated before or after purchase or consumption [2,34,35].
The experience that results from the consumption of organic products is commonly associated with more significant and more pleasant intensity in the taste of these foods. Effectively among the attributes of experience, taste assumes an utmost relevance because organic food tastes more natural than conventional [19,36], and production methods are more environmentally friendly [3].
Search attributes, i.e., those that are observable before purchase, constitute a significant set of factors consumers use in the decision-making process to purchase organic products. Paired with the low availability of these products in conventional wholesale and retail chains is the usually higher price of organic compared to conventional products. In Spain, these are the two main obstacles [23] that must be overcome to increase the development of organic business. [3]. In a study conducted in Andalusia (the central organic production region in Spain), price and availability are clearly pointed out as the main barriers to consumption [37]. Still, these attributes have been somehow mitigated by improvements in distribution channels for organic food [38]. Indeed, in most urban areas (where the consumption of organic products is more significant), the greater availability, and consequent decrease in price, have given rise to a new and pragmatic consumer, for whom price becomes one of the primary decision factors [19]. This “new consumer” is price sensitive, buying organic only when price dissimilarity between organic and conventional is small [39].
Although significant developments in the availability of organic products are a reality, it is still not sufficient to stop being a barrier to consumption, as it often hinders or impedes the purchase of these products [40]. Availability is even more significant for rational consumers as they easily switch off for conventional when organic products are absent.
On the contrary, certification guarantees acts as an inductor of organic consumption, increasing consumers’ confidence [3,12,19,38,41]. Most of the relevant attributes of organic products are intangible, challenging to identify and distinguish from conventional products [42]. Consumers must have confidence in the production practices used in these products, and certification is usually the only guarantee of the authenticity of organic products. Most foods in Europe do not indicate the presence (or absence) of Genetically Modified Organisms (GMOs), which prevents consumers from using this information in their purchasing or consumption process. According to European legislation, cross-contamination of products by GMOs is strongly constrained. Therefore, the EU organic label reinforces the confidence in GMOs’ absence among consumers [2,43].
The product’s origin is a search attribute relevant to organic consumers, especially for those consumers who associate their consumption with ideological issues and ethical motivations. Freshness, seasonal production, and short supply chains are strongly related to where products are coming from [19,39,44].
Analyzing the diversity of studies conducted in recent years, we can conclude that the relevant attributes for the choice and consumption of organic food have become more complex and less linear, anticipating the appearance of a “new consumer” with a new set of motivations.
Over the last years, academic research on factors affecting organic consumer’s choices reveals a notorious growth. For this purpose, several and diverse statistical methods were used to collect and treat the information. Among the most used, empirical tests [45], correlation and regression methods [46], ordered probit models [29,47], descriptive statistics, chi-square, ANOVA, factor analysis [36,48], and Kruskal-Wallis tests [49], must be highlight (for a more in-depth analysis see [3]. Recent literature analyzing organic consumer purchasing behavior, including works on Spanish consumers, used fuzzy theory [50], the theory of planned behavior [51], focus groups [37,39], qualitative comparative analyses [52], and, above all, Likert-type scales [2,7,27,31,53,54,55]. Using inquiry methods based on the simple ordering of attributes, such as Likert scales, has been subject to substantial criticism. In fact, among other limitations and shortcomings, the responses obtained through Likert scales method may provide weak insights and conclusions, therefore compromising the practician’s and marketeer’s decisions [56].
We consider Best-Worst Scaling (BWS) to be an accurate method for collecting and analyzing information. As far as we know, this method has been used only once to analyze the guiding principles that constrain the demand for organic products [57]. Therefore, applying the BWS scaling method in this study is a pioneering action with results that are intended to be precise, innovative, and challenging.
Since Spain is the major European producer of organic products, it is of especial interest to analyze what motivates or hinders the consumption of these products, particularly in the regions where the majority of production is concentrated. To this end, we have developed a questionnaire, which has been applied in the four main areas of organic production and which are, at the same time, areas where per capita consumption is lower in Spain.
2. Methodology
2.1. Questionnaire Design
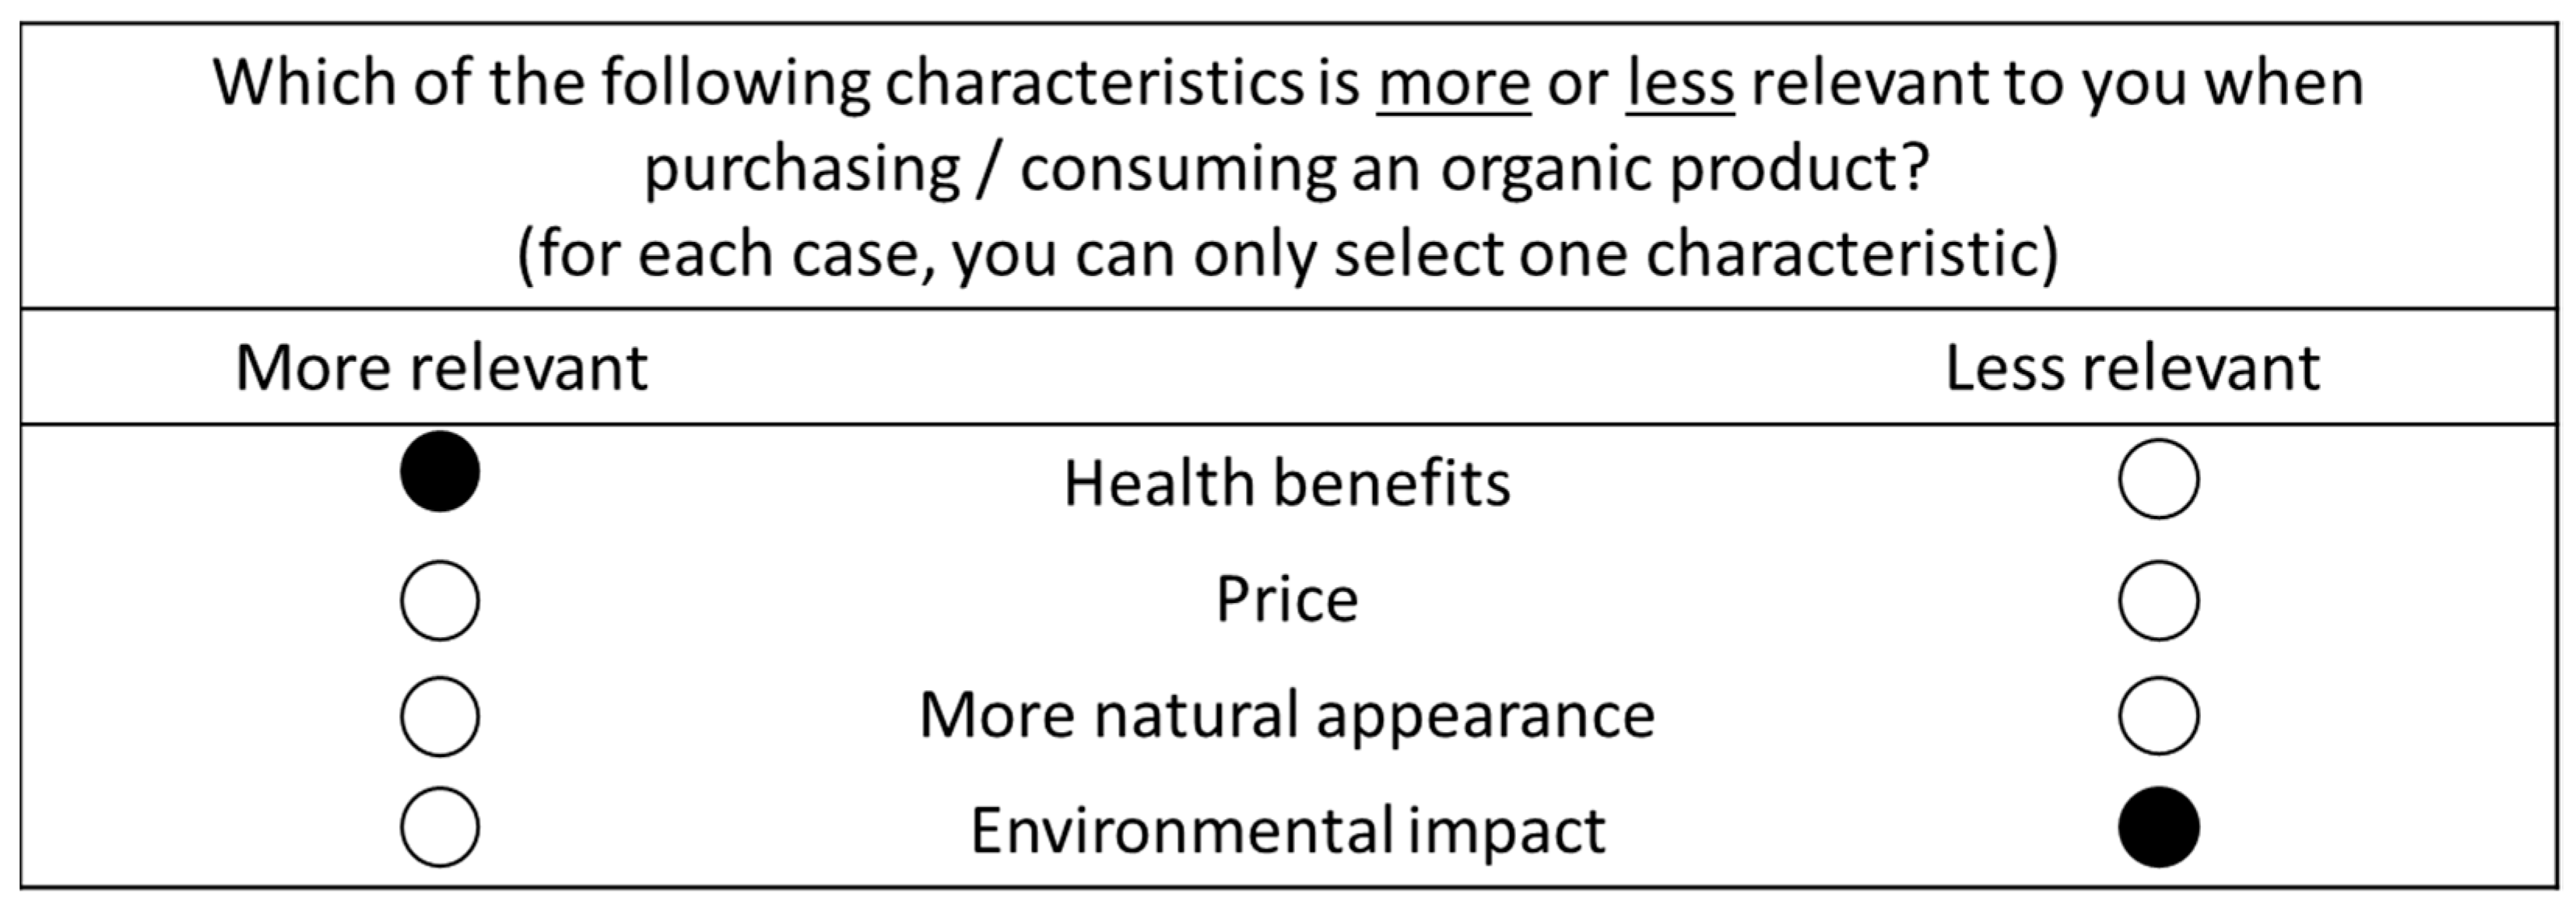
The questionnaire used has two sections. The first one consists of six classification variables: age, gender, education level, place of residence, children living at home, and place of organic product purchase. The second part of the survey measured the importance of the attributes related to the consumption of organic products using the BWS method. For this, ten attributes used in the buying decision process were selected (Table 1). These attributes were chosen based on the literature review presented in the previous section and included three credence attributes, i.e., health benefits [16,17,20], environmental impact [27,29], and nutritional value [31,33]; one experience attribute, i.e., the expectation of better taste [19,36]; and six search attributes, i.e., price [3,19,37], more natural appearance [47,58], certification warranty (EU logo) [38,59], origin [44,60], availability [37,61], and absence of GMOs [2,43] (Appendix A). We used the MaxDiff SSI Web statistical package (Sawtooth Software, Provo, UT, USA). Accordingly, the question itself, the choice sets (eight) and the number of items (organic attributes) by set (four) repeated in all circumstances. However, as the association of attributes is different in each inquiry this means each respondent complete its own and unique questionnaire. Figure 1 below is an example of a choice set.
2.2. Best-Worst Scaling Methodology
To overcome procedural limitations mainly related to Likert scales method, Louviere and Woodworth developed the best-worst method [62]. Also recognized as Max-diff, respondents must choose the best/strong and the worst/fragile items (attributes, in our study) in each subset of items, therefore performing a specific number of repeated and unequal subsets. The definition of items in each subgroup and the number of subsets depends on the total quantity of items and how accurate the analysis is intended. However, excessive items (above fifteen) and more than five items per subset may result in respondent fatigue and cause a high dropout level. BWS, also known as maximum difference (Max-Diff) scaling, is a relatively new statistical method that attempts to measure the perceptions of various types of respondents, particularly consumers, users, and patients. When in the presence of several sets of attributes, respondents are forced to identify and choose, in each set, the best (biggest/most relevant) attribute and the worst (least/least relevant) attribute. This particular aspect reduces the bias of typical rating-based methods and increases the robustness of the preferences exposed by respondents. Proposed by Louviere and Woodworth and formally applied for the first time by Finn and Louviere, this method has gained popularity due to its more straightforward applicability, the lower cognitive effort of analysis [63,64,65], and its greater discriminatory power over other scale measures [66]. In summary, the BWS method recovers the relative metric differences between the items, makes it possible to obtain discriminatory measures of preference and importance, avoids the bias resulting from scales, and improves market segmentation and forecasts [67]. Since its initial application, this method has been primarily used in health sciences [68,69,70], but also in multiple research frameworks, including animal welfare [71], landscape architecture [72,73,74], elderly wellbeing [75], perception of success in professional carriers, corporate social responsibility, consumer behavior towards agri-food products [76,77,78], agricultural policies [79], and consumers’ functional app requirements [80].
2.3. Sampling Method and Survey Administration
In this study, we used quota sampling, where the respondents recognized the organic food context and were selected through convenience sampling. The model was constructed proportionally according to the metropolitan area of residence, gender, and the number of children under 18 living at parents’ homes. 70% of the sample elements answered by filling an online questionnaire, and the remaining were interviewed in person. The latter responded to exactly the same survey and in an environment as close as possible to the context of responding to online surveys not in person. The survey links were first distributed through email, and personal interviews were undertaken in urban organic fairgrounds. We asked participants to send it to their personal connections in Sevilla, Malaga, Cordoba, and Granada to spread the survey. These metropolitan areas were chosen because they represent 45.6% of Spanish organic production [81]. People who consume less than three categories of organic products (vegetables, fruits, dairy products, meat, groceries, etc.) were excluded from the survey for final data analysis.
Although using a convenience sample, the exploratory nature of this study and BWS robustness compared to others allows for credible and accurate conclusions [82]. From a total of 526 responses, 250 completed questionnaires were chosen, according to demographic quota sampling. The survey occurred between October 2019 and March 2020, and the summary demographic data are presented in Appendix B.
3. Results and Discussion
3.1. The Best and the Worst Preferred Attributes
Frequently, for a clear interpretation of the results, best-worst raw scores are rescaled. Most researchers will pay most attention to the probability scale scores as they are easiest to interpret and present to others. These individual-level item scores are positive values ranging from 0 to 100 that sum to 100. This approach has the valuable property of ratio-scaling. That is to say, an item with a score of 20 is twice as important (or preferred) as an item with a score of 10 [83]. For better understanding, this means that, in the table below, the attribute health benefits has almost twice the predictive force than the second attribute, environmental impact.
The clearest indicator that results from a BWS survey is the number of times respondents selected a specific attribute as the one that would be the most relevant (Times Selected Best) and the least relevant (Times Selected Worst). Considering that we have 250 respondents and each respondent responds to eight sets of attributes, we will have a sum for each of the first two columns of 2000 tasks. However, this indicator only gives us absolute values, so it is necessary to calculate a ratio scale index (Table 2). The analysis of the attributes for the standardized ratio scale, ranging from the most critical/robust attribute to the least essential/feeble attribute. Sirieix and colleges [66] stated that the standardized ratio scale is a consistent index since any less relevant characteristic can be interpreted as a ratio relative to the most significant attribute.
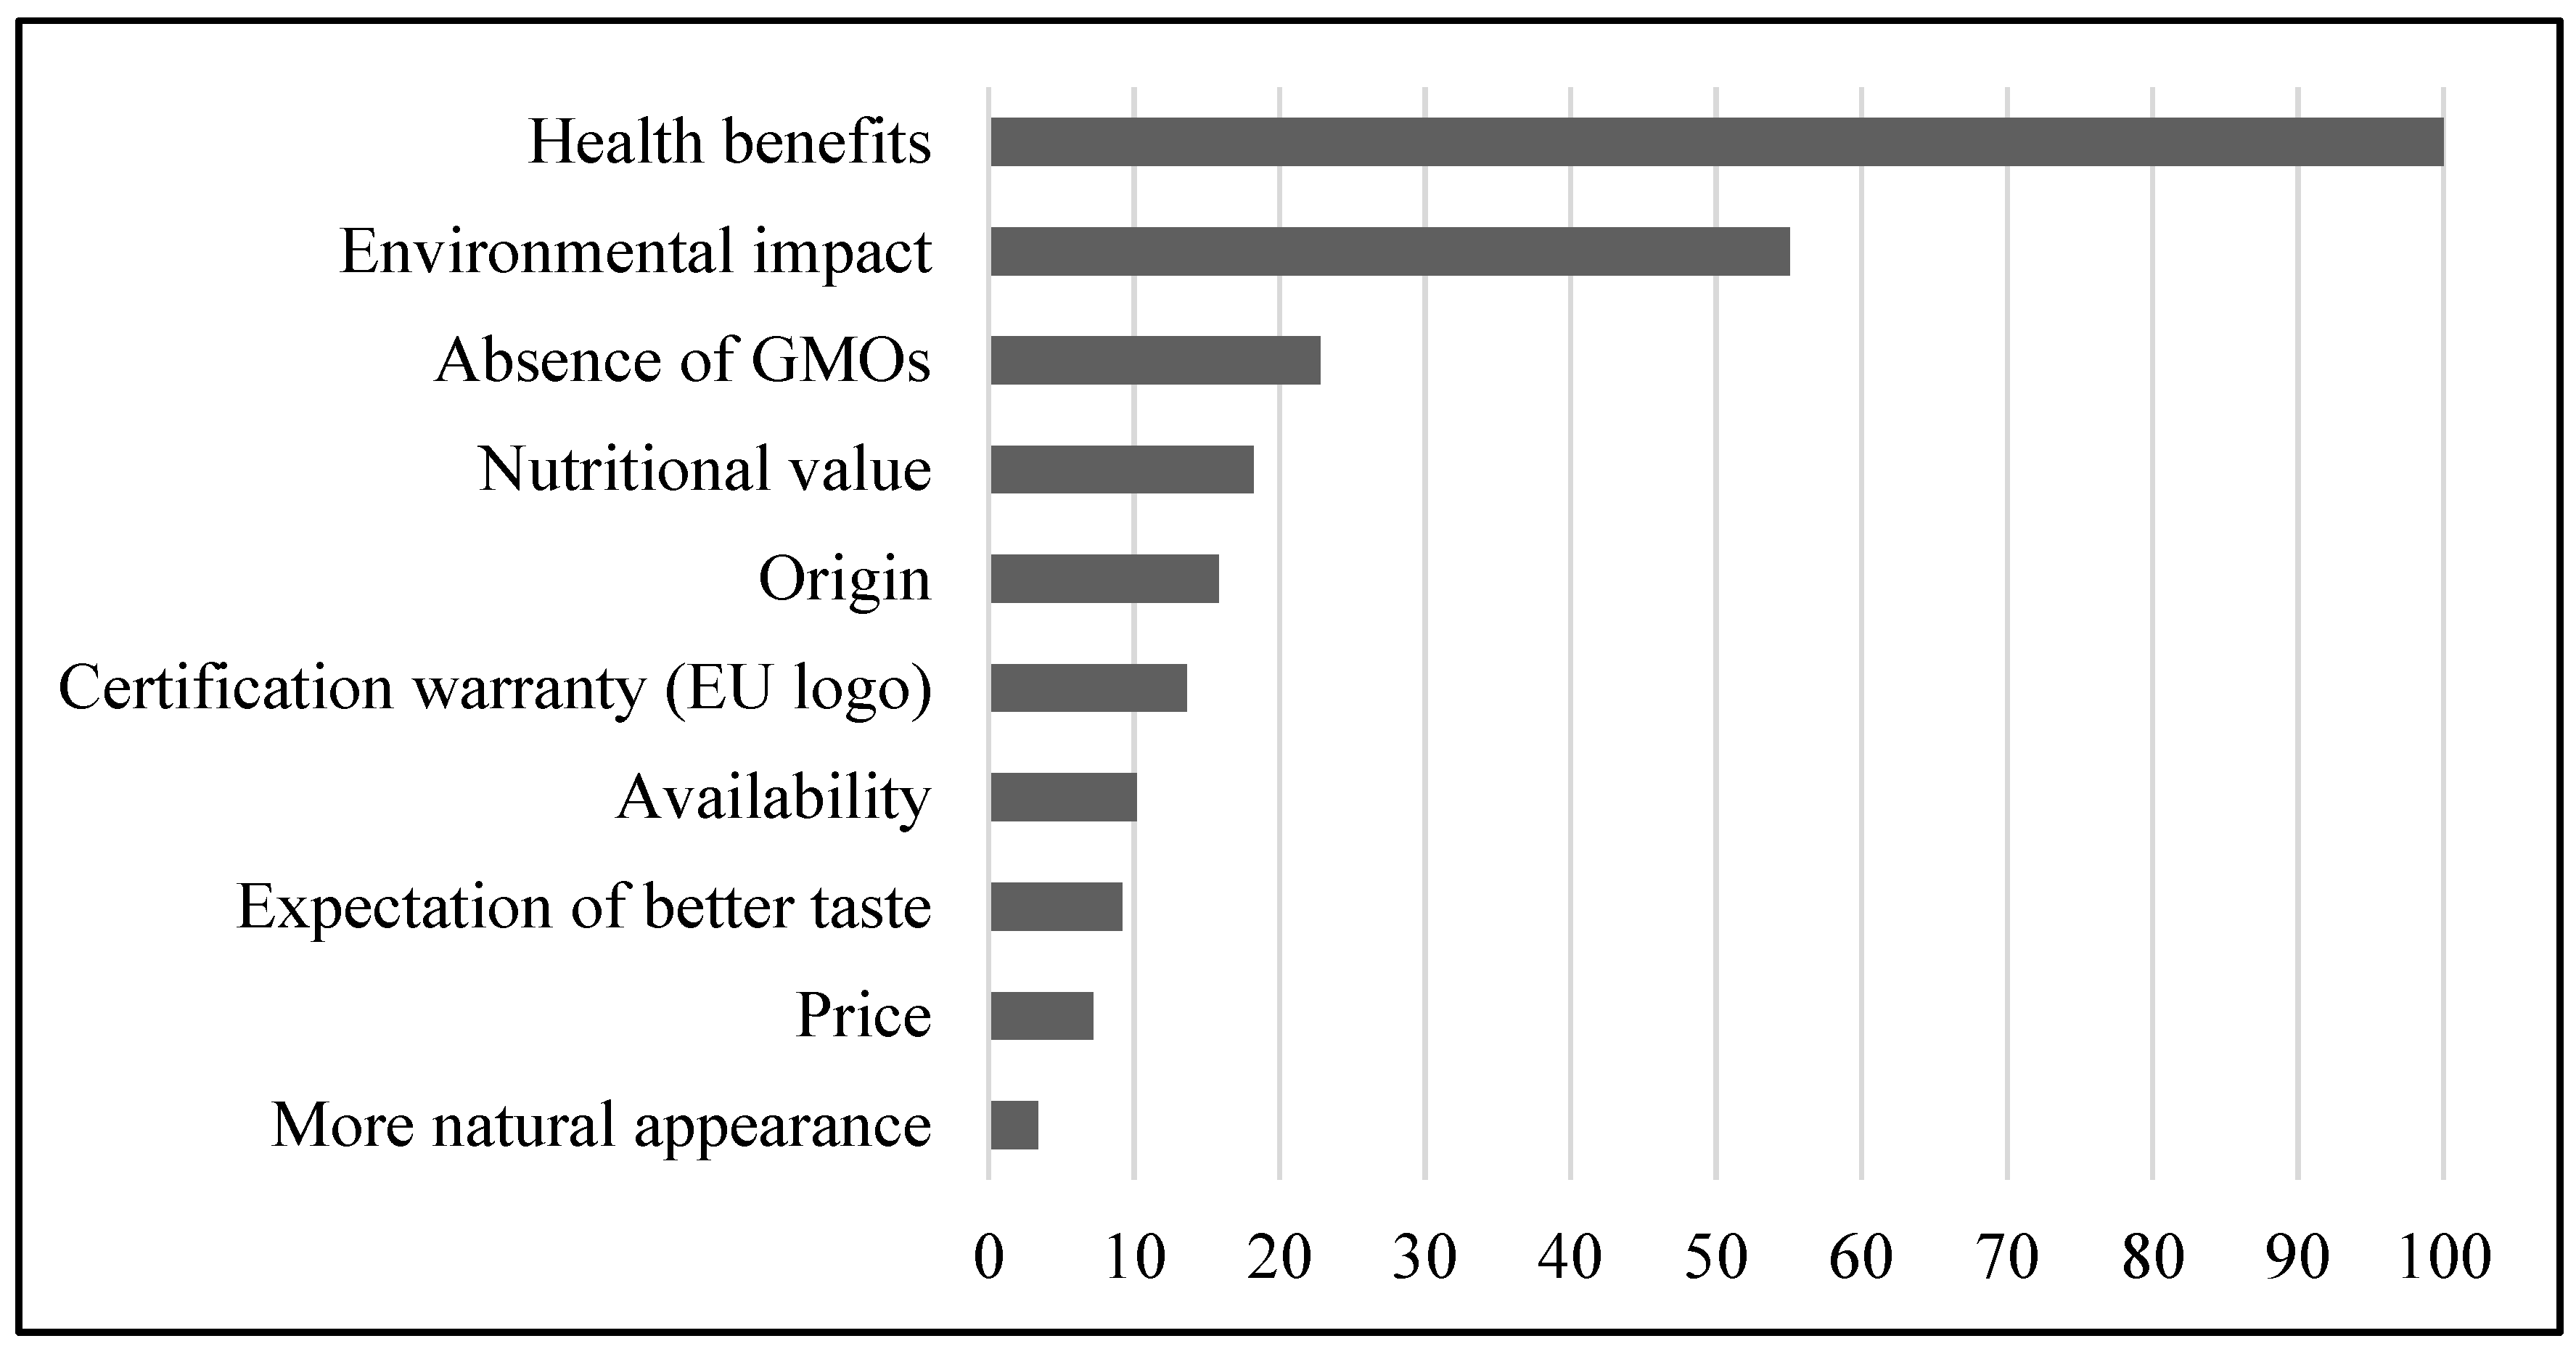
For a more straightforward interpretation, Figure 2 shows attributes using the standardized ratio scale ranked by diminishing level of relative significance.
According to the best-worst standardized approach, the most significant attribute in our study—health benefits—is equaled to 100, all others being a ratio of the first. Consequently, as environmental impact, the second most significant attribute, represents a ratio of only 55.1 of the first, this fact demonstrates the dominant power of the health concerns in the purchase process of organic products. Although with significantly different relative weights these two attributes determine in a majority way the consumption of organic products in Andalusia. More, if we consider the indicator times selected best (see Table 2), that is, the frequency that a given attribute is chosen as being the most relevant/strong in each set of attributes presented, the issues related to health benefits and the environmental impact, taken as a whole, account for almost half (44.6%) of respondents’ choices. As reported and confirmed by recent works [57,84], health benefits are the organic consumers’ leading drivers in food purchase. Indeed, as in many other countries and regions, consumers in Andalusia are deeply concerned about health issues, thus giving more importance to this specific credence attribute at the moment to buy organic food.
A pool of four attributes with intermediate predictive strength follows. This set is headed by concerns about the presence or absence of GMOs (22.8), followed by the attributes nutritional value (18.2), origin (15.8), and finally, certification warranty (13.6). Although classified in third place in the general set of all the characteristics considered, the low weight of the absence of GMOs attribute should be noted. No less surprising is the position of the nutritional value attribute (ranked fourth). Concerns about the nutritional value of organic food are recurrently considered core aspects of determining organic consumption. In any case, it is essential to remember that the BWS method does not reflect a logic of absolute values but, instead, a relative weighting of the measured items [57]. Although the nutritional value is relevant, respondents assume its predictive buying power is significantly lower than health concerns (18.2 vs. 100).
With a purchasing power less than almost 1/10 of the most important attribute, the remaining four attributes appear. Availability (10.2) leads, followed by expectation of better taste (9.2), price (7.2), and more natural appearance (3.4). The times selected best for this set of four attributes represents no more than 15.8%. Accordingly, the number of times respondents chose price as the most critical item of the total best answers was only 3.5%. This last but one price position is somewhat unexpected, as it seems to point to a leave-taking from the current association between organic products and consumers with greater purchasing power.
3.2. Impact of Classification Variables on Attributes
Three cut points (thresholds) were applied in order to identify relationships among classification variables and attributes. Next, four ordinal and mutually exclusive classes resulted from the assembled rescaled scores. A chi-square test was applied for independence between the attributes and the classification variables. Nevertheless, some cells counted for less than one, and more than 20% frequently had counts of less than five. To solve this constraint, we combined the classes of some classification variables (Table 3) to raise expected values and apply Monte Carlo simulation techniques. Concerning age, two major sets were defined: the first group, with people less than 54 years old (the younger ones); followed by a second one, with responders older than 55 (the oldest group). The cutting point is 54 years old as a result of two primary reasons: first, we applied this questionnaire and methodology previously in Portugal [57], and we intend to compare the results in both situations; second, this cut-point is the middle of the four initial age categories (Appendix B). Regarding the area of residence, the grouping choice was based on population proportions of Sevilla, Cordoba, Malaga, and Granada residential areas. Regarding V.6, the two groups considered in Table 3 distinguish two clear typologies regarding the places where organic products can be purchased. The “Generalists” group refer to places not specialized in the sale of organic products, which means that we can find mostly conventional products, but also, although to a lesser extent, organic food. Oppositely, the “organic” set refers to places and/or types of sale dedicated exclusively (or mostly) to organic products.
Table 4 displays the significance of the relationship between the attributes and the classification variables. Table 4 shows no statistically significant differences between any classification variables and the attributes price and environmental impact. The ordinal regression model was applied to assess which independent variables are relevant to explaining each attribute’s importance and the meaning of the existing relationship.
3.3. Applying Ordinal Regression Models
In the first moment, we applied an ordinal regression model to each of the dependent variables (attributes) and the classification variables to analyze which variables are statistically significant for each of the attributes. Next, we analyze with deeper detail ordinal regressions for the two most important attributes with statistically significant relationships with variables: health benefits and the absence of GMOs. The choice of the link function in the model adjustment must consider the type of distribution of the dependent variable’s classes. In SPSS, five-link functions are available, whose use in the ordinal model is applied according to the type of probability distribution that the classes of the dependent variable have. Choosing an inappropriate link function can compromise the significance of the model and its predictive capacity [85,86,87] (Table 5).
3.4. Health Benefits Attribute
Ordinal regression was applied with the link function Complementary Log-log to assess whether age, gender, academic level, area of residence, children under 18 at home, and place to purchase organic food have a statistically significant effect on the response probabilities to the attribute health benefits. The model is statistically significant (; p = 0.018), even though the size of the effect is somewhat reduced (R2 of Cox and Snell, ; R2 of Nagelkerke, ; R2 of McFadden, ). Thus, one can assume that at least one independent variable has a relevant contribution to explaining the variation in the attribute health benefits. The model fits to data (; p = 0.999 and ; p = 1.000). Then we analyze the significance of the independent variables (Table 6) and identify that the coefficients associated with the variables academic level and children under 18 at home are significant, for a significance level of 5% (; p = 0.030 and ; p = 0.010).
Applying an ordinal regression only with the significant independent variables, academic level and children under 18 at home, the statistical analysis shows that the model is statistically significant (; p = 0.005), even though the size of the effect is somewhat reduced (; ; ).
This highlights that the two independent variables contribute in a relevant way to explain the variation in the dependent variable. The model fits data (; p = 0.475 and ; p = 0.263). The estimates of the regression coefficients of Academic Level and Children Under 18 at Home variables are 0.999 and 0.541, respectively. For a significance level of 5%, as shown in Table 7, the contribution of these two variables is significant.
Finally, applying the test of parallel lines, the assumption of the slope homogeneity model was validated, and as required, slopes are thus homogeneous (; p = 0.077).
As we demonstrate above, two independent variables, academic level and having or not children under 18 at home, contribute in a relevant way to explain the variation in the dependent variable, health benefits. Both independent variables have a positive effect on the health benefits attribute. According to Table 7, regarding the academic level, it is observed that for the not superior academic level category relative to the superior academic level reference category, the lower order classes of the dependent variable are less likely than higher-order classes. This fact reveals that consumers with lower education backgrounds agree more with the health benefits of organic products than consumers with a higher education background. Somehow, this association can support the assumption that those with a high education degree are less conditioned by health benefits when choosing organic food. Because people who have less information and knowledge can be more suspicious about what kind of food they are eating, concerns related to healthy products assume higher relevance for this group of organic consumers. These findings are relevant as higher levels of education are often mentioned as having a positive impact on organic consumption [88,89,90,91,92]. This assertion being true, the novelty of the present study relies on the fact that less-educated organic consumers are notoriously more concerned about health issues than educated purchasers. Similar unexpected conclusions were found by Bellows and her colleagues [88]. They discovered that the less educated respondents were, the greater their concerns about (suitable) production methods when deciding what to eat. Both situations might be explained by improved knowledge security that gives informed people the capacity to recognize a priori the different (and better) ways organic products are created.
Having or not having children at home also positively impacts the health benefit influencer. In this case, results are as expected since interviewers with children at home give more relevance to health issues than those who have not. These findings align with prolific and consistent literature showing a positive association between child nutrition concerns and organic food, perceived as safer and healthier [50,93].
3.5. Absence of GMOs Attribute
After applying an ordinal regression with link function Cauchit it was found that the model is statistically significant (; p = 0.006), even though the size of the effect is somewhat reduced (; ; ). Thus, one can assume that at least one independent variable contributes to explaining the variation in the attribute Absence of GMOs. The model fits data (; p = 0.354 and ; p = 0.159). Then we analyze the significance of the independent variables (Table 8) and identify that the coefficients associated with the variables academic level and place to purchase organic food are significant, for a significance level of 5% (; p = 0.007 and ; p = 0.006).
Applying an ordinal regression only with the significant independent variables, academic level and place to purchase organic food, the statistical analysis shows that the model is statistically significant (; p = 0.001), even though the size of the effect is somewhat reduced (; ; ). These results show that the two independent variables contribute in a relevant way to explain the variation in the dependent variable. The model fits data (; p = 0.126 and ; p = 0.130). The estimates of the regression coefficients of academic level and place to purchase organic food variables are 0.742 and −0.734, respectively. For a significance level of 5%, as shown in Table 9, the contribution of these two variables is significant.
Finally, applying the test of parallel lines, the assumption of the slope homogeneity model was validated, and as required, slopes are thus homogeneous (; p = 0.057).
Regarding the academic level, it is observed that for the not superior academic level category relative to the superior academic level reference category, the lower order classes of the dependent variable are less likely than higher-order classes, so we can say that people with a non-university degree consider the absence of GMOs more relevant than people with a university degree. On the other hand, those who buy organic food at fairs/producer markets and general super/hypermarkets consider less relevant the absence of GMOs than those who buy in organic supermarkets, home delivery baskets, and natural/local stores. Consumers with lower educational qualifications value more the absence of GMOs in organic food can be related to an attempt to simplify the purchasing process, as organic certification guarantees for itself the absence (or limited presence) of GMOs. Indeed, when choosing organic products, consumers do not need to search for additional specific information about the presence (or absence) of GMOs, as organic products act as a “double certification”. The increased valorization of the absence of GMOs by consumers with lower academic qualifications may also be associated with an expected higher scientific illiteracy related to GMOs. This association leads consumers to avoid consumption [94] because GMOs harm their health [95]. Moreover, once again, the presence of an organic certifying label allows them to reach the food safety they are looking for (food without GMOs). We also found a correlation between the place of purchase and the valuation of the GMO attribute. Consumers who are willing to search for specialized organic stores value the GMO attribute more than consumers who buy organic products in undifferentiated stores, like general super or hypermarkets. In fact, consumers who integrate the purchase of organic products in their generalist shopping routines give less value to the presence of GMO, privileging other attributes. On the contrary, the more “specialist” and informed are the consumers, the more they value the guarantee of absence of GMOs in food. This difference may be associated with the level of involvement in the purchasing process, as the asymmetry of information and the misunderstanding of the term ‘organic’ is more evident as lower the level of consumer knowledge is [2]. Indeed, consumers who go to specialized stores probably have a higher level of knowledge about these products, thus perceiving genetically modified food as significantly more negative than others concerning food safety, controlling, health as well as environmental and ethical aspects. In this way, it is understandable that they value more the absence of this attribute. Consumers who buy organic products in mixed stores (with organic and conventional food), integrated into their general shopping routine, tend to have a more pragmatic purchasing decision process. Therefore, they value broadly the availability of products [57] as often buy organic products only when the price is lower than conventional products [19].
3.6. Limitations and Future Paths for Research
The main limitation of the present study is the impossibility of spreading its results to the entire organic consumers in the Andalusia region of Spain. However, both BWS robustness and applying a quota sampling method allowed diminish this constraint and permitted obtain valuable and workable results. Minor limitation lye in the fact that the majority of the respondents answered through email. Although it may introduce some bias on the sampling process accuracy, we can assume this restraint has a reduced impact on final results since organic buyers in developed countries commonly use electronic platforms nowadays. As future work, the authors are keen to spread this methodology to other Spanish regions, mainly those where organic consumption is much higher than in Andalusia. Indeed, it is a stimulant scientific challenge to find out how different is the organic consumer profile between regions with different productions levels and diverse perceptions about the relevance of consuming organic. Finally, other studies should compare these results with those from other regions in Europe and abroad.
4. Conclusions
In line with the previous literature review, we conclude that the belief in obtaining health-related benefits is the primary determinant in the choice/consumption of organic products. Environmental impact is the second most important attribute on the purchase process, but nearly half of health issues. Together, these two attributes explain the main motivations to buy organic products in Andalusia. The remaining eight attributes—the absence of GMOs, nutritional value, origin, certification warranty (EU logo), availability, expectation of better taste, price, and more natural appearance—have negligible importance when compared with the former two. Furthermore, they are also very similar in their relative weight.
We have further deepened the analysis of these attributes and found that some are particularly important in specific segments of consumers. Specifically, two of the “top three” attributes have correlations with some independent variables. We can conclude that consumers’ academic level and having children under 18 at home contribute in a relevant and unique way to explain the main relevant attribute: health benefits. In particular, we find that the lower the academic level, the more relevant is this issue as it acts as a booster to health improvement. Additionally, consumers with children give more importance to the health impact associated with organic product consumption.
We also found that the academic level of consumers and the place where they buy organic products explain the importance of the absence of GMOs. The lower the academic degree, the greater importance this attribute assumes, as the organic certification label is associated with the absence of GMOs.
It is essential to highlight the significant difference between educated and less educated organic consumers. Regarding health and GMOs, people without a superior degree reveal more suspicions than those with a higher academic degree. Considering consumers without a superior academic degree are the majority of organic consumers, marketers and public authorities must develop strategies that overcome this relative apprehension and boost organic consumption.
We can also find a relationship between the place of purchase of organic products and the presence (or absence) of GMOs in food. In fact, we can conclude that consumers who shop organic food in specialty stores value this attribute more than consumers who buy these products in super or hypermarkets. This differentiated behavior reveals different degrees of involvement in consumer’s decision-making process.
These results are of especial interest as they allow a deeper understanding of organic consumer behavior and the possibility of communicating more effectively and directly with different consumers.
Author Contributions
Conceptualization, F.N., T.M., J.V. and P.S.-D.; methodology, F.N., T.M. and J.V.; formal analysis, F.N., T.M. and J.V.; writing—original draft preparation, F.N., T.M. and J.V. All authors have read and agreed to the published version of the manuscript.
Funding
This work is supported by National Funds by the Portuguese Foundation for Science and Technology (FCT), under the project UIDB/05937/2020.
Institutional Review Board Statement
Not applicable.
Informed Consent Statement
Not applicable.
Acknowledgments
The authors would like to thank the anonymous reviewers for their valuable comments and suggestions to improve the quality of the paper.
Conflicts of Interest
The authors declare no conflict of interest.
Appendix A

Table A1.
Credence, Search and Experience Attributes Used in the Questionnaire.
| Attribute Category | Perception | Authors |
|---|---|---|
| Credence | Health benefits | Chekima et al. (2017); Ditlevsen et al. (2018); Rana and Paul (2020) |
| Environmental impact | Nguyen et al. (2019); Kushwah et al. (2019) | |
| Nutritional value | Apaolaza et al. (2018); Srednicka-Tobel et al. (2016) | |
| Search | price | Rana and Paul (2017); Hjelmar (2011); Hernández et al. (2019) |
| More natural appearance | Kuhar et al. (2012); Rodríguez-Bermudez et al. (2020) | |
| Certification warranty (EU logo) | De- Magistris et al. (2017); Lee et al. (2017) | |
| Origin | Siegrist and Hartmann (2019); Hempel and Hamm (2016) | |
| Availability | Hernández et al. (2019); Caldwell et al. (2009) | |
| Absence of GMO | Massey, Cass and Otahal (2018); Mauracher et al. (2013) | |
| Experience | Better taste | Hjelmar (2011) |
Appendix B
Table A2.
Summary Demographics for Survey Interviewees.
| Classification Variable | Modality | N | (%) | Total | |
|---|---|---|---|---|---|
| N | (%) | ||||
| V.1—Age | 15–34 years’ old | 14 | 5.6 | ||
| 35–54 years’ old | 154 | 61.6 | |||
| 55–69 years’ old | 71 | 28.4 | |||
| 70 years’ old or more | 11 | 4.4 | 250 | 100 | |
| V.2—Gender | Male | 83 | 33.2 | ||
| Female | 167 | 66.8 | 250 | 100 | |
| V.3—Academic level | None | 4 | 1.6 | ||
| Professional Qualification | 21 | 8.4 | |||
| Compulsory Secondary Education | 20 | 8.0 | |||
| Superior (Degree or more) | 205 | 82.0 | 250 | 100 | |
| V.4—Area of residence | Metropolitan Area of Sevilla | 150 | 60.0 | ||
| Metropolitan Area of Malaga | 25 | 10.0 | |||
| Metropolitan Area of Cordoba | 35 | 14.0 | |||
| Metropolitan Area of Granada | 40 | 16.0 | 250 | 100 | |
| V.5—Do you have children under 18 living with you? | Yes | 122 | 48.8 | ||
| No | 128 | 51.2 | 250 | 100 | |
| V.6—What is the best place to purchase certified organic products? | Fairs/Producer markets (no certified organic) | 56 | 22.4 | ||
| Organic supermarkets | 53 | 21.2 | |||
| Generalist super and hypermarkets | 28 | 11.2 | |||
| Home delivery organic baskets | 37 | 14.8 | |||
| Natural/local stores (mostly certified organic) | 76 | 30.4 | 250 | 100 | |
References
- Basha, M.B.; Mason, C.; Shamsudin, M.F.; Hussain, H.I.; Salem, M.A. Consumers Attitude towards Organic Food. Procedia Econ. Financ. 2015, 31, 444–452. [Google Scholar] [CrossRef] [Green Version]
- Massey, M.; O’Cass, A.; Otahal, P. A meta-analytic study of the factors driving the purchase of organic food. Appetite 2018, 125, 418–427. [Google Scholar] [CrossRef]
- Rana, J.; Paul, J. Consumer behavior and purchase intention for organic food: A review and research agenda. J. Retail. Consum. Serv. 2017, 38, 157–165. [Google Scholar] [CrossRef]
- Singh, A.; Verma, P. Factors influencing Indian consumers’ actual buying behaviour towards organic food products. J. Clean. Prod. 2017, 167, 473–483. [Google Scholar] [CrossRef]
- IFOAM. The World of Organic Agriculture; IFOAM: Bonn, Germany, 2021. [Google Scholar]
- Ecological. El Sector Ecológico en España 2018. 2018. Available online: https://www.ecological.bio/es/sectorbio2018/ (accessed on 8 June 2020).
- Robina-Ramírez, R.; Chamorro-Mera, A.; Moreno-Luna, L. Electronic Commerce Research and Applications Organic and online attributes for buying and selling agricultural products in the e-marketplace in Spain. Electron. Commer. Res. Appl. 2020, 42, 100992. [Google Scholar] [CrossRef]
- Hernández, J.L.S.; Seguí, A.E. ¿Alternativa o Adaptación? Los Grupos de Consumo de Alimentos Ecológicos en el Área Urbana de Alicante; Universitat de Barcelona: Barcelona, Spain, 2014; Volume VI, pp. 1–13. [Google Scholar]
- Grzybowska-Brzezinska, M.; Grzywinska-Rapca, M.; Zuchowski, I.; Borawski, P. Organic Food Attributes Determing Consumer Choices. Eur. Res. Stud. J. 2017, 20, 164–176. [Google Scholar] [CrossRef] [Green Version]
- Jang, Y.; Bonn, M. Consumer Purchase Intentions of Organic Wines; Florida State University: Tallahassee, FL, USA, 2011; Volume 2008, Available online: http://scholarworks.umass.edu/gradconf_hospitality/2011/Poster/26/ (accessed on 7 April 2020).
- Lee, H.-J.; Yun, Z.-S. Consumers’ perceptions of organic food attributes and cognitive and affective attitudes as determinants of their purchase intentions toward organic food. Food Qual. Prefer. 2015, 39, 259–267. [Google Scholar] [CrossRef]
- Schleenbecker, R.; Hamm, U. Consumers’ perception of organic product characteristics. A review. Appetite 2013, 71, 420–429. [Google Scholar] [CrossRef] [PubMed]
- Voon, J.P.; Ngui, K.S.; Agrawal, A. Determinants of willingness to purchase organic food: An exploratory study using structural equation modeling. Int. Food Agribus. Manag. Rev. 2011, 14, 103–120. [Google Scholar] [CrossRef]
- Anacleto, C.A.; Catarina, S.; Pacheco, E. The quality attributes for organic food: Exploratory factor analysis. In Proceedings of the POMS 25th Annual Conference, Atlanta, GA, USA, 9–12 May 2014; pp. 1–10. [Google Scholar]
- Pearson, D.; Henryks, J.; Jones, H. Organic food: What we know (and do not know) about consumers. Renew. Agric. Food Syst. 2011, 26, 171–177. [Google Scholar] [CrossRef] [Green Version]
- Chekima, B.; Oswald, A.I.; Wafa, S.A.W.S.K.; Chekima, K. Narrowing the gap: Factors driving organic food consumption. J. Clean. Prod. 2017, 166, 1438–1447. [Google Scholar] [CrossRef]
- Ditlevsen, K.; Sandøe, P.; Lassen, J. Healthy food is nutritious, but organic food is healthy because it is pure: The negotiation of healthy food choices by Danish consumers of organic food. Food Qual. Prefer. 2019, 71, 46–53. [Google Scholar] [CrossRef] [Green Version]
- Hansen, T.; Sørensen, M.I.; Eriksen, M.-L.R. How the interplay between consumer motivations and values influences organic food identity and behavior. Food Policy 2018, 74, 39–52. [Google Scholar] [CrossRef] [Green Version]
- Hjelmar, U. Consumers’ purchase of organic food products. A matter of convenience and reflexive practices. Appetite 2011, 56, 336–344. [Google Scholar] [CrossRef] [PubMed]
- Rana, J.; Paul, J. Health motive and the purchase of organic food: A meta-analytic review. Int. J. Consum. Stud. 2019, 44, 162–171. [Google Scholar] [CrossRef]
- Shaharudin, M.R.; Pani, J.J.; Mansor, S.W.; Elias, S. Purchase Intention of Organic Food; Perceived Value Overview. Can. Soc. Sci. 2010, 6, 70–79. [Google Scholar] [CrossRef]
- Vermeir, I.; Verbeke, W. Sustainable Food Consumption: Exploring the Consumer “Attitude-Behavioral Intention” Gap. J. Agric. Environ. Ethics 2006, 19, 169–194. [Google Scholar] [CrossRef]
- Ministerio de Agricultura; Alimentación y Medio Ambiente. Evolución de la Caracterización de la Tipología y Perfil Sociodemográfico del Consumidor de Alimentos Ecológicos en España. 2014; p. 72. Available online: https://cpage.mpr.gob.es/producto/evolucion-de-la-caracterizacion-de-la-tipologia-y-perfil-sociodemografico-del-consumidor-de-alimentos-ecologicos-en-espana/ (accessed on 10 November 2021).
- Hwang, J. Organic food as self-presentation: The role of psychological motivation in older consumers’ purchase intention of organic food. J. Retail. Consum. Serv. 2016, 28, 281–287. [Google Scholar] [CrossRef]
- Ling, C.Y. Consumers’ purchase intention of green products: An investigation of the drivers and moderating variable. Elixir Mark. Manag. 2013, 1, 14503–14509. [Google Scholar]
- Mostafa, M.M. Gender differences in Egyptian consumers? green purchase behaviour: The effects of environmental knowledge, concern and attitude. Int. J. Consum. Stud. 2007, 31, 220–229. [Google Scholar] [CrossRef]
- Nguyen, H.V.; Nguyen, N.; Nguyen, B.K.; Lobo, A.; Vu, P.A. Organic Food Purchases in an Emerging Market: The Influence of Consumers’ Personal Factors and Green Marketing Practices of Food Stores. Int. J. Environ. Res. Public Health 2019, 16, 1037. [Google Scholar] [CrossRef] [PubMed] [Green Version]
- Ottman, J.A.; Stafford, E.R.; Hartman, C.L. Avoiding Green Marketing Myopia: Ways to Improve Consumer Appeal for Environmentally Preferable Products. Environ. Sci. Policy Sustain. Dev. 2006, 48, 22–36. [Google Scholar] [CrossRef]
- Kushwah, S.; Dhir, A.; Sagar, M. Ethical consumption intentions and choice behavior towards organic food. Moderation role of buying and environmental concerns. J. Clean. Prod. 2019, 236, 117519. [Google Scholar] [CrossRef]
- Paul, J.; Rana, J. Consumer behavior and purchase intention for organic food. J. Consum. Mark. 2012, 29, 412–422. [Google Scholar] [CrossRef]
- Apaolaza, V.; Hartmann, P.; D’Souza, C.; López, C.M. Eat organic-Feel good? The relationship between organic food consumption, health concern and subjective wellbeing. Food Qual. Prefer. 2018, 63, 51–62. [Google Scholar] [CrossRef]
- Aschemann-Witzel, J.; Maroscheck, N.; Hamm, U. Are organic consumers preferring or avoiding foods with nutrition and health claims? Food Qual. Prefer. 2013, 30, 68–76. [Google Scholar] [CrossRef]
- Średnicka-Tober, D.; Barański, M.; Seal, C.; Sanderson, R.; Benbrook, C.; Steinshamn, H.; Gromadzka-Ostrowska, J.; Rembiałkowska, E.; Skwarło-SońtaK.; Eyre, M.; et al. Composition differences between organic and conventional meat: A systematic literature review and meta-analysis. Br. J. Nutr. 2016, 115, 994–1011. [Google Scholar] [CrossRef]
- Gracia, A.; de Magistris, T. The demand for organic foods in the South of Italy: A discrete choice model. Food Policy 2008, 33, 386–396. [Google Scholar] [CrossRef]
- Wirth, F.F.; Stanton, J.L.; Wiley, J.B. The Relative Importance of Search versus Credence Product Attributes: Organic and Locally Grown. Agric. Resour. Econ. Rev. 2011, 40, 48–62. [Google Scholar] [CrossRef]
- Lucas, M.R.V.; Röhrich, K.; Marreiros, C.; Fragoso, R.; Kabbert, R.; Clara, A.M.; Martins, I.; Böhm, S. Quality, Safety and Consumer Behaviour towards Organic Food in Germany and Portugal; University of Evora: Évora, Portugal, 2008; pp. 1–26, CEFAGE-UE Work. Pap. [Google Scholar]
- Hernández, D.G.; Saracho-Domínguez, H.; Rivera-Ferré, M.G.; Vara-Sánchez, I. Eating Well with Organic Food: Everyday (Non-Monetary) Strategies for a Change in Food Paradigms: Findings from Andalusia, Spain. Sustainability 2019, 11, 1003. [Google Scholar] [CrossRef] [Green Version]
- Lee, H.-C.; Chang, C.-T.; Cheng, Z.-H.; Chen, Y.-T. Will an organic label always increase food consumption? It depends on food type and consumer differences in health locus of control. Food Qual. Prefer. 2018, 63, 88–96. [Google Scholar] [CrossRef]
- Jensen, J.D.; Christensen, T.; Denver, S.; Ditlevsen, K.; Lassen, J.; Teuber, R. Heterogeneity in consumers’ perceptions and demand for local (organic) food products. Food Qual. Prefer. 2019, 73, 255–265. [Google Scholar] [CrossRef]
- Zundel, C.; Kilcher, L. Organic Agriculture and Food Availability. In Proceedings of the International Conference on Organic Agriculture and Food Security, Rome, Italy, 3–5 May 2007. [Google Scholar]
- Deliana, Y. Market Segmentation for Organic Products in Bandung West Java, Indonesia. Res. J. Recent Sci. 2012, 1, 48–56. Available online: www.isca.in (accessed on 27 July 2019).
- Briz, T.; Ward, R. Consumer awareness of organic products in Spain: An application of multinominal logit models. Food Policy 2009, 34, 295–304. [Google Scholar] [CrossRef]
- Mauracher, C.; Tempesta, T.; Vecchiato, D. Consumer preferences regarding the introduction of new organic products. The case of the Mediterranean sea bass (Dicentrarchus labrax) in Italy. Appetite 2013, 63, 84–91. [Google Scholar] [CrossRef]
- Siegrist, M.; Hartmann, C. Impact of sustainability perception on consumption of organic meat and meat substitutes. Appetite 2019, 132, 196–202. [Google Scholar] [CrossRef] [PubMed]
- Grimmer, M.; Kilburn, A.P.; Miles, M.P. The effect of purchase situation on realized pro-environmental consumer behavior. J. Bus. Res. 2016, 69, 1582–1586. [Google Scholar] [CrossRef]
- Mohsen, M.G.; Dacko, S. An extension of the benefit segmentation base for the consumption of organic foods: A time perspective. J. Mark. Manag. 2013, 29, 1701–1728. [Google Scholar] [CrossRef]
- Kuhar, A.; Slabe, A.; Juvanci, L. Determinants of Purchasing Behaviour for Organic and Integrated Fruits and Vegetables: The Case of the Post Socialist Economy. In Organic Food and Agriculture—New Trends and Developments in the Social Sciences; IntechOpen: Rijeka, Croatia, 2012. [Google Scholar] [CrossRef] [Green Version]
- Santhi, P.; Jerinabi, U.; Gandhi, N. Green Consumerism-Issues and Implications. Indian J. Mark. 2007, 37. Available online: http://indianjournalofmarketing.com/index.php/ijom/article/view/34411 (accessed on 6 September 2020).
- Tsakiridou, E.; Boutsouki, C.; Zotos, Y.; Mattas, K. Attitudes and behaviour towards organic products: An exploratory study. Int. J. Retail. Distrib. Manag. 2008, 36, 158–175. [Google Scholar] [CrossRef]
- Azzurra, A.; Massimiliano, A.; Angela, M. Measuring sustainable food consumption: A case study on organic food. Sustain. Prod. Consum. 2019, 17, 95–107. [Google Scholar] [CrossRef]
- Chekima, B.; Chekima, K.; Chekima, K. Understanding factors underlying actual consumption of organic food: The moderating effect of future orientation. Food Qual. Prefer. 2019, 74, 49–58. [Google Scholar] [CrossRef]
- Rabadán, A.; Díaz, M.; Brugarolas, M.; Bernabéu, R. Why don’t consumers buy organic lamb meat? A Spanish case study. Meat Sci. 2020, 162, 108024. [Google Scholar] [CrossRef]
- Koklic, M.K.; Golob, U.; Podnar, K.; Zabkar, V. The interplay of past consumption, attitudes and personal norms in organic food buying. Appetite 2019, 137, 27–34. [Google Scholar] [CrossRef]
- Shin, J.; Mattila, A.S. When organic food choices shape subsequent food choices: The interplay of gender and health consciousness. Int. J. Hosp. Manag. 2019, 76, 94–101. [Google Scholar] [CrossRef]
- Molinillo, S.; Vidal-Branco, M.; Japutra, A. Understanding the drivers of organic foods purchasing of millennials: Evidence from Brazil and Spain. J. Retail. Consum. Serv. 2020, 52, 101926. [Google Scholar] [CrossRef]
- Finn, A.; Louviere, J.J. Determining the Appropriate Response to Evidence of Public Concern: The Case of Food Safety. J. Public Policy Mark. 1992, 11, 12–25. [Google Scholar] [CrossRef]
- Nunes, F.; Madureira, T.; Veiga, J. The Organic Food Choice Pattern: Are Organic Consumers Becoming More Alike? Foods 2021, 10, 983. [Google Scholar] [CrossRef] [PubMed]
- Rodríguez-Bermúdez, R.; Miranda, M.; Orjales, I.; Ginzo-Villamayor, M.J.; Al-Soufi, W.; López-Alonso, M. Consumers’ perception of and attitudes towards organic food in Galicia (Northern Spain). Int. J. Consum. Stud. 2019, 44, 206–219. [Google Scholar] [CrossRef]
- De-Magistris, T.; Gracia, A.; Barreiro-Hurle, J. Do consumers care about European food labels? An empirical evaluation using best-worst method. Br. Food J. 2017, 119, 2698–2711. [Google Scholar] [CrossRef]
- Hempel, C.; Hamm, U. How important is local food to organic-minded consumers? Appetite 2016, 96, 309–318. [Google Scholar] [CrossRef]
- Caldwell, E.M.; Kobayashi, M.M.; DuBow, W.; Wytinck, S. Perceived access to fruits and vegetables associated with increased consumption. Public Health Nutr. 2009, 12, 1743–1750. [Google Scholar] [CrossRef] [PubMed] [Green Version]
- Louviere, J.; Woodworth, G. Best-Worst Scaling: A Model for Largest Difference Judgments; Working Paper; Faculty of Business, University of Alberta: Edmonton, AB, Canada, 1990. [Google Scholar]
- Burke, P.F.; Schuck, S.; Aubusson, P.; Buchanan, J.; Louviere, J.J.; Prescott, A. Why do early career teachers choose to remain in the profession? The use of best-worst scaling to quantify key factors. Int. J. Educ. Res. 2013, 62, 259–268. [Google Scholar] [CrossRef]
- Erdem, S.; Rigby, D.; Wossink, A. Using best-worst scaling to explore perceptions of relative responsibility for ensuring food safety. Food Policy 2012, 37, 661–670. [Google Scholar] [CrossRef]
- Jones, A.; Jones, D.; Edwards-Jones, G.; Cross, P. Informing decision making in agricultural greenhouse gas mitigation policy: A Best-Worst Scaling survey of expert and farmer opinion in the sheep industry. Environ. Sci. Policy 2013, 29, 46–56. [Google Scholar] [CrossRef]
- Sirieix, L.; Remaud, H.; Lockshin, L.; Thach, L.; Lease, T. Determinants of restaurant’s owners/managers selection of wines to be offered on the wine list. J. Retail. Consum. Serv. 2011, 18, 500–508. [Google Scholar] [CrossRef]
- Orme, B. How Good Is Best-Worst Scaling? Quirk’s Mark. Res. 2018, 32, 20–23. [Google Scholar]
- Flynn, T.N.; Louviere, J.J.; Peters, T.; Coast, J. Using discrete choice experiments to understand preferences for quality of life. Variance-scale heterogeneity matters. Soc. Sci. Med. 2010, 70, 1957–1965. [Google Scholar] [CrossRef] [PubMed]
- Marti, J. A best-worst scaling survey of adolescents’ level of concern for health and non-health consequences of smoking. Soc. Sci. Med. 2012, 75, 87–97. [Google Scholar] [CrossRef]
- Paquin, R.S.; Fischer, R.; Mansfield, C.; Mange, B.; Beaverson, K.; Ganot, A.; Martin, A.S.; Morris, C.; Rensch, C.; Ricotti, V.; et al. Priorities when deciding on participation in early-phase gene therapy trials for Duchenne muscular dystrophy: A best-worst scaling experiment in caregivers and adult patients. Orphanet J. Rare Dis. 2019, 14, 102. [Google Scholar] [CrossRef] [Green Version]
- Ochs, D.; Wolf, C.A.; Widmar, N.J.; Bir, C. Is There a cage-free lunch in U.S. Egg production? Public views of laying-hen housing attributes. J. Agric. Resour. Econ. 2019, 44, 345–361. [Google Scholar] [CrossRef]
- Madureira, H.; Nunes, F.; Oliveira, J.V.; Cormier, L.; Madureira, T. Urban residents’ beliefs concerning green space benefits in four cities in France and Portugal. Urban For. Urban Green. 2015, 14, 56–64. [Google Scholar] [CrossRef]
- Sever, I.; Verbič, M. Assessing recreational values of a peri-urban nature park by synthesizing perceptions and preferences of trail users. J. Environ. Psychol. 2019, 63, 101–108. [Google Scholar] [CrossRef]
- Shoji, Y.; Kim, H.; Kubo, T.; Tsuge, T.; Aikoh, T.; Kuriyama, K. Understanding preferences for pricing policies in Japan’s national parks using the best–worst scaling method. J. Nat. Conserv. 2021, 60, 125954. [Google Scholar] [CrossRef]
- Ratcliffe, J.; Cameron, I.; Lancsar, E.; Walker, R.; Milte, R.; Hutchinson, C.L.; Swaffer, K.; Parker, S. Developing a new quality of life instrument with older people for economic evaluation in aged care: Study protocol. BMJ Open 2019, 9, e028647. [Google Scholar] [CrossRef] [PubMed]
- Cohen, E. Applying best-worst scaling to wine marketing. Int. J. Wine Bus. Res. 2009, 21, 8–23. [Google Scholar] [CrossRef]
- Dekhili, S.; Sirieix, L.; Cohen, E. How consumers choose olive oil: The importance of origin cues. Food Qual. Prefer. 2011, 22, 757–762. [Google Scholar] [CrossRef]
- Nunes, F.; Madureira, T.; Oliveira, J.V.; Madureira, H. The consumer trail: Applying best-worst scaling to classical wine attributes. Wine Econ. Policy 2016, 5, 78–86. [Google Scholar] [CrossRef] [Green Version]
- Muunda, E.; Mtimet, N.; Schneider, F.; Wanyoike, F.; Dominguez-Salas, P.; Alonso, S. Could the new dairy policy affect milk allocation to infants in Kenya? A best-worst scaling approach. Food Policy 2021, 101, 102043. [Google Scholar] [CrossRef]
- Hartwell, H.; Appleton, K.M.; Bray, J.; Price, S.; Mavridis, I.; Giboreau, A.; Perez-Cueto, F.J.; Ronge, M. Shaping smarter consumer food choices: The Food SMART project. Nutr. Bull. 2019, 44, 138–144. [Google Scholar] [CrossRef] [Green Version]
- MAPA. Informe Sobre Evaluación Y Medio Rural Español. 2019. Available online: http://publicacionesoficiales.boe.es/ (accessed on 23 February 2020).
- Flyvbjerg, B. Five Misunderstandings about Case-Study Research. Qual. Inq. 2006, 12, 219–245. [Google Scholar] [CrossRef] [Green Version]
- Sawtooth Software. The MaxDiff System, Technical Paper; Sawtooth Software: Orem, Utah, 2013. [Google Scholar]
- Rizzo, G.; Borrello, M.; Guccione, G.D.; Schifani, G.; Cembalo, L. Organic Food Consumption: The Relevance of the Health Attribute. Sustainability 2020, 12, 595. [Google Scholar] [CrossRef] [Green Version]
- Agresti, A. Categorical Data Analysis, 2nd ed.; John Wiley & Sons: New York, NY, USA, 2002. [Google Scholar]
- Norusis, M. SPSS 14.0 Advanced Statistical Procedures Companion; Prentice Hall: New York, NY, USA, 2006. [Google Scholar]
- Long, J.S.; Freese, J. Regression Models for Categorical Dependent Variables Using Stata, 2nd ed.; Stata Press: College Station, TX, USA, 2006. [Google Scholar]
- Bellows, A.C.; Onyango, B.; Diamond, A.; Hallman, W. Understanding Consumer Interest in Organics: Production Values vs. Purchasing Behavior. J. Agric. Food Ind. Organ. 2008, 6. [Google Scholar] [CrossRef]
- Wier, M.; Andersen, L.M.; Millock, K. Consumer Demand for Organic Foods—Attitudes, Values and Purchasing Behaviour. 2014. Available online: https://orgprints.org/id/eprint/4754/ (accessed on 26 March 2020).
- Roitner-Schobesberger, B.; Darnhofer, I.; Somsook, S.; Vogl, C.R. Consumer perceptions of organic foods in Bangkok, Thailand. Food Policy 2008, 33, 112–121. [Google Scholar] [CrossRef]
- Di Vita, G.; Pappalardo, G.; Chinnici, G.; La Via, G.; D’Amico, M. Not everything has been still explored: Further thoughts on additional price for the organic wine. J. Clean. Prod. 2019, 231, 520–528. [Google Scholar] [CrossRef]
- Hansmann, R.; Baur, I.; Binder, C.R. Increasing organic food consumption: An integrating model of drivers and barriers. J. Clean. Prod. 2020, 275, 123058. [Google Scholar] [CrossRef]
- Boizot-Szantai, C.; Hamza, O.; Soler, L.-G. Organic consumption and diet choice: An analysis based on food purchase data in France. Appetite 2017, 117, 17–28. [Google Scholar] [CrossRef]
- Mielby, H.; Sandøe, P.; Lassen, J. The role of scientific knowledge in shaping public attitudes to GM technologies. Public Underst. Sci. 2012, 22, 155–168. [Google Scholar] [CrossRef]
- Magnusson, M.K.; Hursti, U.-K.K. Consumer attitudes towards genetically modified foods. Appetite 2002, 39, 9–24. [Google Scholar] [CrossRef]
Figure 1.
Choice Set illustration. In this example, the respondent chooses the attribute “Health benefits” as the most relevant, and the attribute “Environmental impact” as the least relevant, and no more circles can be selected.
Figure 1.
Choice Set illustration. In this example, the respondent chooses the attribute “Health benefits” as the most relevant, and the attribute “Environmental impact” as the least relevant, and no more circles can be selected.

Figure 2.
The ten organic attributes presented as standardized ratio scale.

Table 1.
Organic attributes.
| 1 | Price |
| 2 | More natural appearance |
| 3 | Certification warranty (EU logo) |
| 4 | Origin |
| 5 | Expectation of better taste |
| 6 | Availability |
| 7 | Health benefits |
| 8 | Environmental impact |
| 9 | Nutritional value |
| 10 | Absence of GMOs |
Table 2.
Raw best-worst, average best-worst, and standardized aggregated importance weights.
| Attribute | Times Selected Best | Times Selected Worst | (B-W)/n | Sqrt (B/W) | Standardized Ratio Scale | Standardized Importance Weights (%) | Rescaled Scores Average | 95% Lower | 95% Upper |
|---|---|---|---|---|---|---|---|---|---|
| Health benefits | 572.0 | 13.0 | 2.236 | 6.63 | 100.0 | 39.147 | 24.1 | 23.5 | 24.7 |
| Environmental impact | 320.0 | 24.0 | 1.184 | 3.65 | 55.1 | 21.550 | 18.0 | 17.2 | 18.8 |
| Absence of GMOs | 249.0 | 109.0 | 0.560 | 1.51 | 22.8 | 8.920 | 14.0 | 12.9 | 15.2 |
| Nutritional value | 171.0 | 117.0 | 0.216 | 1.21 | 18.2 | 7.135 | 9.9 | 9.1 | 10.8 |
| Origin | 185.0 | 168.0 | 0.068 | 1.05 | 15.8 | 6.193 | 9.7 | 8.7 | 10.8 |
| Certification warranty (EU logo) | 188.0 | 230.0 | −0.168 | 0.90 | 13.6 | 5.336 | 9.0 | 7.9 | 10.1 |
| Availability | 123.0 | 270.0 | −0.588 | 0.67 | 10.2 | 3.983 | 5.7 | 4.9 | 6.6 |
| Expectation of better taste | 97.0 | 261.0 | −0.656 | 0.61 | 9.2 | 3.598 | 4.7 | 4.0 | 5.5 |
| Price | 70.0 | 306.0 | −0.944 | 0.48 | 7.2 | 2.823 | 3.8 | 3.0 | 4.5 |
| More natural appearance | 25.0 | 502.0 | −1.908 | 0.22 | 3.4 | 1.317 | 1.0 | 0.7 | 1.2 |
Table 3.
Modified sample structure.
| Classification Variable | Modality | N | |
|---|---|---|---|
| V.1—Age | ≤54 years old | 168 | 250 |
| ≥55 years old | 82 | ||
| V.2—Gender | Male | 83 | 250 |
| Female | 167 | ||
| V.3—Academic level | Not superior | 45 | 250 |
| Superior (degree or more) | 205 | ||
| V.4—Area of residence | Metropolitan Area 1 = Sevilla | 150 | 250 |
| Metropolitan Area 2 = Malaga, Cordoba, Granada | 100 | ||
| V.5—Do you have children under 18 living with you? | Yes | 122 | 250 |
| No | 128 | ||
| V.6—What is the best place to purchase certified organic products? | Generalist = fairs/producer markets, general super, and hypermarkets (no certified organic) | 84 | 250 |
| Organic = organic supermarkets, home delivery baskets, natural/local stores (mostly certified organic) | 166 | ||
Table 4.
Chi-square test for independence (p-values).
| Classification Variable | ||||||
|---|---|---|---|---|---|---|
| Attribute | Age | Gender | Academic Level | Area of Residence | Children Under 18 at Home | Place to Purchase Organic Food |
| p | ||||||
| Price | 0.248 | 0.341 | 0.161 | 0.531 | 0.249 | 0.210 |
| More natural appearance | 0.629 | 0.354 | 0.097 b | 0.237 | 0.470 | 0.012 a |
| Certification warranty (EU logo) | 0.022 a | 0.157 | 0.447 | 0.207 | 0.760 | 0.225 |
| Origin | 0.013 a | 0.971 | 0.033 a | 0.408 | 0.978 | 0.774 |
| Expectation of better taste | 0.436 | 0.957 | 0.179 | 0.022 a | 0.020 a | 0.182 |
| Availability | 0.850 | 0.049 a | 0.650 | 0.544 | 0.011 a | 0.645 |
| Health benefits | 0.262 | 0.982 | 0.097 b | 0.823 | 0.064 b | 0.031 a |
| Environmental impact | 0.533 | 0.516 | 0.450 | 0.607 | 0.905 | 0.965 |
| Nutritional value | 0.109 | 0.980 | 0.915 | 0.245 | 0.501 | 0.006 a |
| Absence of GMOs | 0.380 | 0.273 | 0.071 b | 0.529 | 0.852 | 0.001 a |
Cells marked with (a) mean significant relationships (p < 0.05) and cells marked with (b) mean tendentiously relevant relationships (0.05 < p < 0.1).
Table 5.
Ordinal regression models of the attributes vs. classification variables.
| Attribute | Link Function | −2LL Sig. | Pearson Sig. | Parallel Sig. | Significance Levels of the Explanatory Variables with p < 0.05 | −2LL with Significant var. | Level of Importance | ||||||
|---|---|---|---|---|---|---|---|---|---|---|---|---|---|
| Age | Gender | Academic Level | Area of Residence | Children Under 18 at Home | Place to Purchase Organic Food | ||||||||
| 1 | Price | 1 | 0.506 | 0.128 | - | - | - | - | - | - | - | - | 9 |
| 2 | More natural appearance | 1 | 0.025 | 1.000 | 0.148 | - | - | - | - | - | 0.013 a | 0.009 | 10 |
| 3 | Certification warranty (EU logo) | 1 | 0.007 | 0.186 | 0.250 | 0.005 b | - | - | 0.055 b | - | 0.050 a | 0.006 | 6 |
| 4 | Origin | 1 | 0.008 | 0.546 | 0.310 | 0.029 a | - | 0.020 b | - | - | - | 0.001 | 5 |
| 5 | Expectation of better taste | 1 | 0.018 | 0.697 | 0.408 | - | - | - | 0.005 a | - | - | 0.003 | 8 |
| 6 | Availability | 1 | 0.627 | 0.000 | - | - | - | - | - | - | - | - | 7 |
| 7 | Health benefits | 2 | 0.018 | 0.999 | 0.077 | - | - | 0.021 a | - | 0.032 a | - | 0.005 | 1 |
| 8 | Environmental impact | 2 | 0.768 | 0.540 | - | - | - | - | - | - | - | - | 2 |
| 9 | Nutritional value | 1 | 0.046 | 0.122 | 0.083 | - | - | - | - | - | 0.005 b | 0.003 | 4 |
| 10 | Absence of GMOs | 3 | 0.006 | 0.354 | 0.057 | - | - | 0.006 a | - | - | 0.001 b | 0.001 | 3 |
| Desirable value of p | <0.050 | >0.050 | >0.050 | <0.050 | <0.050 | <0.050 | <0.050 | <0.050 | <0.050 | <0.050 | |||
Link Function: 1—Negative Log-log; 2—Complementary Log-log; 3—Cauchit. Significance Levels: (a)—The variable-ratio is positive (variation in direct order); (b)—The variable-ratio is negative (variation in reverse order).
Table 6.
Significance of the independent variables.
| Estimate | Std. Error | Wald | df | Sig. | 95% Confidence Interval | |||
|---|---|---|---|---|---|---|---|---|
| Lower Bound | Upper Bound | |||||||
| Threshold | (HBenef = 1) | −4.823 | 0.620 | 60.511 | 1 | 0.000 | −6.038 | −3.607 |
| (HBenef = 2) | −3.336 | 0.440 | 57.557 | 1 | 0.000 | −4.198 | −2.474 | |
| (HBenef = 3) | −1.820 | 0.382 | 22.658 | 1 | 0.000 | −2.569 | −1.071 | |
| Location | (Age ≤ 54) | −0.412 | 0.297 | 1.929 | 1 | 0.165 | −0.994 | 0.169 |
| (Age ≥ 55) | 0 a | 0 | ||||||
| (Gender = M) | 0.029 | 0.266 | 0.012 | 1 | 0.912 | −0.492 | 0.550 | |
| (Gender = F) | 0 a | 0 | ||||||
| (Acadlevel = NSup) | 0.957 | 0.440 | 4.722 | 1 | 0.030 | 0.094 | 1.821 | |
| (Acadlevel = Sup) | 0 a | 0 | ||||||
| (Residence = Area1) | 0.005 | 0.261 | 0.000 | 1 | 0.984 | −0.506 | 0.516 | |
| (Residence = Area2) | 0 a | 0 | ||||||
| (Children = No) | −0.685 | 0.264 | 6.712 | 1 | 0.010 | −1.203 | −0.167 | |
| (Children = Yes) | 0 a | 0 | ||||||
| (Place = Generalist) | −0.388 | 0.258 | 2.252 | 1 | 0.133 | −0.894 | 0.119 | |
| (Place = Organic) | 0 a | 0 | ||||||
(a) This parameter is set to zero because it is redundant.
Table 7.
Parameter estimates.
| Estimate | Std. Error | Wald | df | Sig. | 95% Confidence Interval | |||
|---|---|---|---|---|---|---|---|---|
| Lower Bound | Upper Bound | |||||||
| Threshold | (HBenef = 1) | −4.309 | 0.524 | 67.539 | 1 | 0.000 | −5.336 | −3.281 |
| (HBenef = 2) | −2.830 | 0.290 | 95.491 | 1 | 0.000 | −3.397 | −2.262 | |
| (HBenef = 3) | −1.325 | 0.198 | 44.830 | 1 | 0.000 | −1.713 | −0.937 | |
| Location | (Acadlevel = NSup) | 0.999 | 0.432 | 5.344 | 1 | 0.021 | 0.152 | 1.846 |
| (Acadlevel = Sup) | 0 a | 0 | ||||||
| (Children = No) | −0.541 | 0.252 | 4.620 | 1 | 0.032 | −1.035 | −0.048 | |
| (Children = Yes) | 0 a | 0 | ||||||
(a) This parameter is set to zero because it is redundant.
Table 8.
Significance of the independent variables.
| Estimate | Std. Error | Wald | df | Sig. | 95% Confidence Interval | |||
|---|---|---|---|---|---|---|---|---|
| Lower Bound | Upper Bound | |||||||
| Threshold | (AbsenceGMO = 1) | −1.046 | 0.328 | 10.168 | 1 | 0.001 | −1.689 | −0.403 |
| (AbsenceGMO = 2) | −0.368 | 0.305 | 1.459 | 1 | 0.227 | −0.966 | 0.229 | |
| (AbsenceGMO = 3) | 0.537 | 0.317 | 2.864 | 1 | 0.091 | −0.085 | 1.158 | |
| Location | (Age ≤ 54) | −0.135 | 0.236 | 0.328 | 1 | 0.567 | −0.597 | 0.327 |
| (Age ≥ 55) | 0 a | 0 | ||||||
| (Gender = M) | 0.350 | 0.216 | 2.618 | 1 | 0.106 | −0.774 | 0.074 | |
| (Gender = F) | 0 a | 0 | ||||||
| (Acadlevel = NSup) | 0.757 | 0.280 | 7.324 | 1 | 0.007 | 0.209 | 1.305 | |
| (Acadlevel = Sup) | 0 a | 0 | ||||||
| (Residence = Area1) | −0.038 | 0.209 | 0.034 | 1 | 0.855 | −0.447 | 0.371 | |
| (Residence = Area2) | 0 a | 0 | ||||||
| (Children = No) | −0.142 | 0.214 | 0.438 | 1 | 0.508 | −0.561 | 0.278 | |
| (Children = Yes) | 0 a | 0 | ||||||
| (Place = Generalist) | −0.623 | 0.227 | 7.532 | 1 | 0.006 | −1.068 | −0.178 | |
| (Place = Organic) | 0 a | 0 | ||||||
(a) This parameter is set to zero because it is redundant.
Table 9.
Parameter estimates.
| Estimate | Std. Error | Wald | df | Sig. | 95% Confidence Interval | |||
|---|---|---|---|---|---|---|---|---|
| Lower Bound | Upper Bound | |||||||
| Threshold | (AbsenceGMO = 1) | −0.747 | 0.163 | 21.098 | 1 | 0.000 | −1.066 | −0.428 |
| (AbsenceGMO = 2) | −0.082 | 0.131 | 0.391 | 1 | 0.532 | −0.337 | −0.174 | |
| (AbsenceGMO = 3) | 0.813 | 0.173 | 22.064 | 1 | 0.000 | 0.474 | 1.152 | |
| Location | (Acadlevel = NSup) | 0.742 | 0.271 | 7.477 | 1 | 0.006 | 0.210 | 1.274 |
| (Acadlevel = Sup) | 0 a | 0 | ||||||
| (Place = Generalist) | −0.734 | 0.224 | 10.732 | 1 | 0.001 | −1.172 | −0.295 | |
| (Place = Organic) | 0 a | 0 | ||||||
(a) This parameter is set to zero because it is redundant.
Publisher’s Note: MDPI stays neutral with regard to jurisdictional claims in published maps and institutional affiliations. |
© 2021 by the authors. Licensee MDPI, Basel, Switzerland. This article is an open access article distributed under the terms and conditions of the Creative Commons Attribution (CC BY) license (https://creativecommons.org/licenses/by/4.0/).
Share and Cite
MDPI and ACS Style
Madureira, T.; Nunes, F.; Veiga, J.; Saralegui-Diez, P. Choices in Sustainable Food Consumption: How Spanish Low Intake Organic Consumers Behave. Agriculture 2021, 11, 1125. https://0-doi-org.brum.beds.ac.uk/10.3390/agriculture11111125
AMA Style
Madureira T, Nunes F, Veiga J, Saralegui-Diez P. Choices in Sustainable Food Consumption: How Spanish Low Intake Organic Consumers Behave. Agriculture. 2021; 11(11):1125. https://0-doi-org.brum.beds.ac.uk/10.3390/agriculture11111125
Chicago/Turabian StyleMadureira, Teresa, Fernando Nunes, José Veiga, and Pablo Saralegui-Diez. 2021. "Choices in Sustainable Food Consumption: How Spanish Low Intake Organic Consumers Behave" Agriculture 11, no. 11: 1125. https://0-doi-org.brum.beds.ac.uk/10.3390/agriculture11111125
Note that from the first issue of 2016, this journal uses article numbers instead of page numbers. See further details here.