Article

Heritable Variation, Genetic and Phenotypic Correlations for Tuber Traits and Host Plant Resistance to Late Blight for Potato Breeding in Scandinavian Testing Sites

1
Department of Plant Breeding, Swedish University of Agricultural Sciences (SLU), Sundvagen 10 Box 190, SE 23422 Lomma, Sweden
2
International Maize and Wheat Improvement Center (CIMMYT), Carretera México-Veracruz Km. 45, El Batán, Texcoco 56237, Mexico
3
Colegio de Postgraduados, Montecillos 56230, Mexico
4
Universidad de Quintana Roo, Chetumal 77019, Mexico
*
Author to whom correspondence should be addressed.
Submission received: 2 November 2021 / Revised: 6 December 2021 / Accepted: 15 December 2021 / Published: 17 December 2021
(This article belongs to the Section Genotype Evaluation and Breeding)

Abstract

:
Potato breeding aims to improve crop productivity, quality and resilience based on heritable characteristics. Estimating the trait heritability and correlations—both genetic and phenotypic—among characteristics in a target population of environments allows us to define the best breeding method that leads to selection gains. Breeding clones (47) and released cultivars (209) were grown using simple lattice designs at three testing sites in northern and southern Sweden to estimate the best linear unbiased predictors (BLUPs) derived from mixed linear models for characteristics such as tuber weight (total and according to sizes), host plant resistance to late blight (caused by the oomycete Phytophthora infestans) and tuber quality (starch percentage based on specific gravity measurements and reducing sugars). There was significant heritable variation for all the characteristics investigated. Tuber starch percentage and total tuber weight were the traits with the highest broad-sense heritability (H2), while the weight for the smallest size (<40 mm) had the highest H2 among the different tuber categories. These results show the potential for further improving these traits for Scandinavia through recombination and selection in segregating offspring. The genetic and phenotypic correlations among the tuber weight characteristics were significant (p ≤ 0.05) irrespective of their sizes, but none were significant (p > 0.05) with tuber starch percentage. Host plant resistance to late blight was negatively and significantly associated with tuber weight and starch percentage, thereby showing the strong effects of this disease on the productivity and quality of the potatoes.

1. Introduction

Potato (Solanum tuberosum L.) remains among the three most important crops directly feeding the global human population [1]. This tetraploid polysomic crop (2n = 4x = 48 chromosomes), however, faces various challenges, e.g., its vulnerability to various pests such as late blight caused by the oomycete Phytophthora infestans (Mont.) de Bary, which is the most important threat to potato production worldwide [2]. If left unchecked, P. infestans rapidly destroys a potato crop due to its elevated virulence. This pathogen infects the entire plant, including the stems, leaves and tubers, leading to significant global tuber yield loss that translates into several USD billion annually.
Productivity, quality for different end-users and resilience in the target population of stressful environments under a changing climate have been the most common goals for the genetic amelioration of potatoes [1]. Nonetheless, the traits determining such characteristics may not always show positive associations, and the useful genetic variation available for selection may be reduced. For example, maturity and specific gravity (determined by tuber weight under water) show a negative correlation [3], thus suggesting that early maturing cultivars have a low dry matter and starch content. Hence, there is a need to determine both the trait heritability and the genetic/phenotypic correlations among them. Furthermore, the characteristics showing a low trait heritability that are significantly associated with those showing a high heritability may benefit from indirect selection on the latter [4].
The true variance and covariance components are unknown but can be estimated from multi-site trial data. They are used for estimating the trait heritability and correlations among characteristics. This knowledge will further assist on guiding the potato breeding strategy and how to apply selection for desired characteristics in the target population of environments. Furthermore, in recent years, the best linear unbiased predictors (BLUPs) derived from mixed linear models are increasingly being used for the genetic assessment of segregating breeding populations [5,6,7]. The BLUPs facilitate the comparison of breeding clones from different populations evaluated in distinct environments, as well as analyzing unbalanced datasets resulting from testing trials [8]. The BLUPs predict random effects that show a covariance structure. They are ‘best’ because they minimize the sampling variance of what being predicted and are ‘linear’ owing to being linear functions of the data. Moreover, ‘unbiased’ refers to the expectations of the predictions being zero. Likewise, the BLUPs adjust means values by correcting for the genotype × environment interaction when using multi-environment trial data. The use of the BLUPs led to the identification of a set of potato breeding clones performing well under a water deficit [9].
The aim of this research was to determine the extent of heritable variation for tuber traits (productivity and quality) and quantitative host plant resistance to late blight in both breeding clones and cultivars under the long days of Scandinavia. Furthermore, the genetic and phenotypic correlations were also estimated to investigate the breeding trade-offs [10] between productivity, quality and resilience characteristics in potatoes.

2. Materials and Methods

The trials included 256 clones from Svensk potatisföradling of the Swedish University of Agricultural Sciences (SLU) and cultivars released for farming throughout western Europe during the last 200 years (Supplementary Table S1) planted in both Mosslunda and Umeå, and a subset of 169 of them planted in Helgegården. The cultivars included, as checks, the high tuber yielding ‘Connect’, ‘Carolus’ (used often in crossing blocks) and, the most preferred cultivars, ‘King Edward’ and ‘Bintje’, (as per their area of certified tuber-seed production in Sweden [11]), as well as ‘Solist’ (the most grown early cultivar in Sweden).
The multi-site field trials were in Helgegården, Mosslunda and Umeå. Helgegården and Mosslunda are rural sites in a main potato producing area near the city of Kristianstad (56°01′46″ N 14°09′24″ E, Skåne, southern Sweden), and the third rural site was near Umeå (63°49′30″ N 20°15′50″ E), which is a city in northern Sweden. The main differences between the northern and southern sites during the cropping season are daylength (11.5–17.5 h in Skåne versus 14.5–21 h in Umeå), period (3.5–4 months versus 3 months from planting to harvest) and average daily temperature (12–18 °C versus 12.5–16 °C), while average monthly rainfall ranges overlap (42–64 mm and 48–75mm).
The experimental designs were a 13 × 13 simple lattice in Helgegården, and a 16 × 16 simple lattice in both Mosslunda and Umeå. The plots included 10 plants with 0.3 m spacing among them and 0.7–0.75 m spacing between rows. Such a plot size suffices to obtain quality data in potato trials [3]. A fungicide was used throughout the cropping season in Helgegården against Phytophthora infestans, which causes late blight in potatoes, to assess the tuber yield potential in this site. The tuber characteristics evaluated were total yield per plot and as per size (<40 mm, 40–50 mm, 50–60 mm, >60 mm; kg), flesh starch (% as determined measuring specific gravity) and reducing sugars in the flesh defined with the aid of a potato glucose strip test [12]. Likewise, host plant resistance to Phytophthora infestans (only in Mosslunda) as measured by area under disease progress curve or AUDPC [13] was assessed. Late blight is ubiquitous and severe at Mosslunda (as noted throughout the spreader rows of the susceptible cultivar ‘Bintje’ throughout the trial), thus artificial inoculation was not used for field screening against Phytophthora infestans.

2.1. BLUPs and H2

The BLUPs using mixed models were calculated for all characteristics in each site and across all testing sites. The broad-sense heritability (H2), based on the plot means, from the single-environment model was estimated as follows:
H 2 = σ c 2 σ c 2 + σ e 2 R
where σ c 2 , σ e 2 and R are the genetic variance, the residual variance and the number of replications (=2) in each multi-site trial, respectively.
The broad-sense heritability (H2), based on the plot means, from the multi-environment model was estimated as follows:
H 2 = σ G 2 σ G 2 + σ G E 2 s + σ e 2 S R
where σ G 2 , σ G E 2 , σ e 2 , R and S are the genetic variance, the genotype × environment variance, the residual variance, the number of replications (=2) in each multi-site trial and the number of sites (=3), respectively.

2.2. Genetic Correlations betwee Environments and between Traits

The genetic correlations among environments were calculated as follows:
ρ g ( j j ) = ρ p ( j j ) h j h j
where ρ p ( j j ) is the phenotypic correlation between locations j and j ; and h j and h j are the heritabilities of locations j and j , respectively.
On the other hand, the genetic correlation between traits was calculated directly because the experimental designs were the same for all environments. The formula was
ρ g = σ g ( j j ) ¯ σ g ( j ) σ g ( j ) ¯
where σ g ( j j ) ¯ is the aritmetic mean of all pairwise genotypic covariances between trait j and j , and σ g ( j ) σ g ( j ) ¯ is the arithmetic average of all pairwise geometric means among the genotypic variance components of the traits.

2.3. Data Analysis

The models described above were analyzed using the R programs for multi-environment analysis of plant breeding trials or META-R [14], which is a suite of R codes for analyzing multi-environment trials. META-R calculated the BLUPs for all traits, as well as variance components for the different terms included in the models, the grand mean of genotypes, the least significant difference (LSD), the coefficient of variation and broad-sense heritability. META-R performed the analyses for each testing site with all available trial data, and across testing sites for the balanced data set of 169 breeding clones and released cultivars using the restricted maximum likelihood (REML) method. META-R was also used to estimate genetic and phenotypic correlations between traits across and within sites.

3. Results

The combined analysis of variance across sites included balanced datasets for 169 testing breeding clones and released cultivars revealed highly significant (p < 0.001) genotype, environment and genotype × environment interaction terms for all the traits evaluated. Tuber starch percentage and total tuber yield had the lowest coefficient of variation across the trial sites (6.04 and 17.94%, respectively), while the coefficient of variation was high for tuber weight by grading sizes (above 25%). The low coefficient of variation for tuber starch percentage indicates the high precision of the experiment for this characteristic. There were highly significant differences among the BLUPs of breeding clones and released cultivars for all the traits (Supplementary Table S2) across and within the sites. These results clearly show the great heritable variation for traits evaluated, particularly tuber starch percentage and total tuber weight, and potential for further improving these through selection and recombination. Of the 10 best performing potatoes across the sites, according to their BLUPs for total tuber weight per plot, seven were breeding clones and three were released cultivars (Table 1). The cultivar check Connect was, on average, the top yielding in the field trials, while the tuber yield of the other four cultivar checks was below that of the best performing breeding clones and cultivars. SLU 1402009 and SLU 1314015 were rated among the breeding clones that were most highly resistant to late blight at Mosslunda, where the oomycete Phytophthora infestans was ubiquitous. Both were also among the top yielding breeding clones and cultivars at the high yield potential site under fungicide treatment in Helgegården, but the former was unselected for the table potato market due to the very high percentage (>2/3) of tubers in the largest size (60 mm). Their reducing sugar content were the same (0.25%), but cultivar checks such as ‘Bintje’ and ‘King Edward (0.175%) were lower. Hence, these breeding clones do not seem to be appropriate for crisps because a reading above 0.1% when using the color chart potato glucose test paper will likely produce a dark color.
Table 2 lists the estimates of variance components and broad-sense heritability (H2), which confirm the significant genetic variation available in Svensk potatisföradling clones and European released cultivars. Tuber starch percentage and total tuber weight were the traits with the highest H2, while the weight for the smallest tuber size (<40 mm) has the highest H2 among the different tuber size categories. The H2 estimates within each site were larger than those across sites (Table 3), thus confirming the importance of the significant genotype × environment interaction. The highest estimates were at the high yield potential testing site in Helgegården, except for the total tuber weight and for the weight of tubers 50–60 mm in size, both of which had the largest H2 in the long daylength testing site at Umeå. This difference could result from true genetic variation between the sites since the coefficients of variation for both tuber weight and for weight of tubers 50–60 mm in size were smaller in Helgegården (12.32 and 22.98%, respectively) than in Umeå (13.78 and 33.46%, respectively). Mosslunda had the smallest H2 estimates (Table 3) and the highest coefficient of variation (>25%—except for tuber starch: 6.74) for all the characteristics. In this late blight-prone site, the H2 estimates for total tuber weight and tuber starch percentages were smaller (0.7522 and 0.9174, respectively), after adjusting their BLUPs using the area under the disease progress curve (AUDPC) as a co-variate, thus showing the effect of the disease on both traits. The H2 for reducing sugars in the tuber was 0.79 at Umeå, while it was 0.94 for host plant resistance to late blight, as measured by the AUDPC in Mosslunda. The smallest coefficient of variation in each site was always for tuber starch percentage (ranging from 3.60% at Helgegården to 8.44 at Umeå), while it was 8.64% for AUDPC in Mosslunda. As indicated by the H2 estimates, there was enough genetic variation for selecting for starch content tuber weight (varying on sizes) across the sites, reducing sugars in Umeå and host plant resistance to late blight in Skåne. When using large sample sizes (N > 150), the H2 estimates remain relatively high in both sites in Skåne, even when late blight occurs.
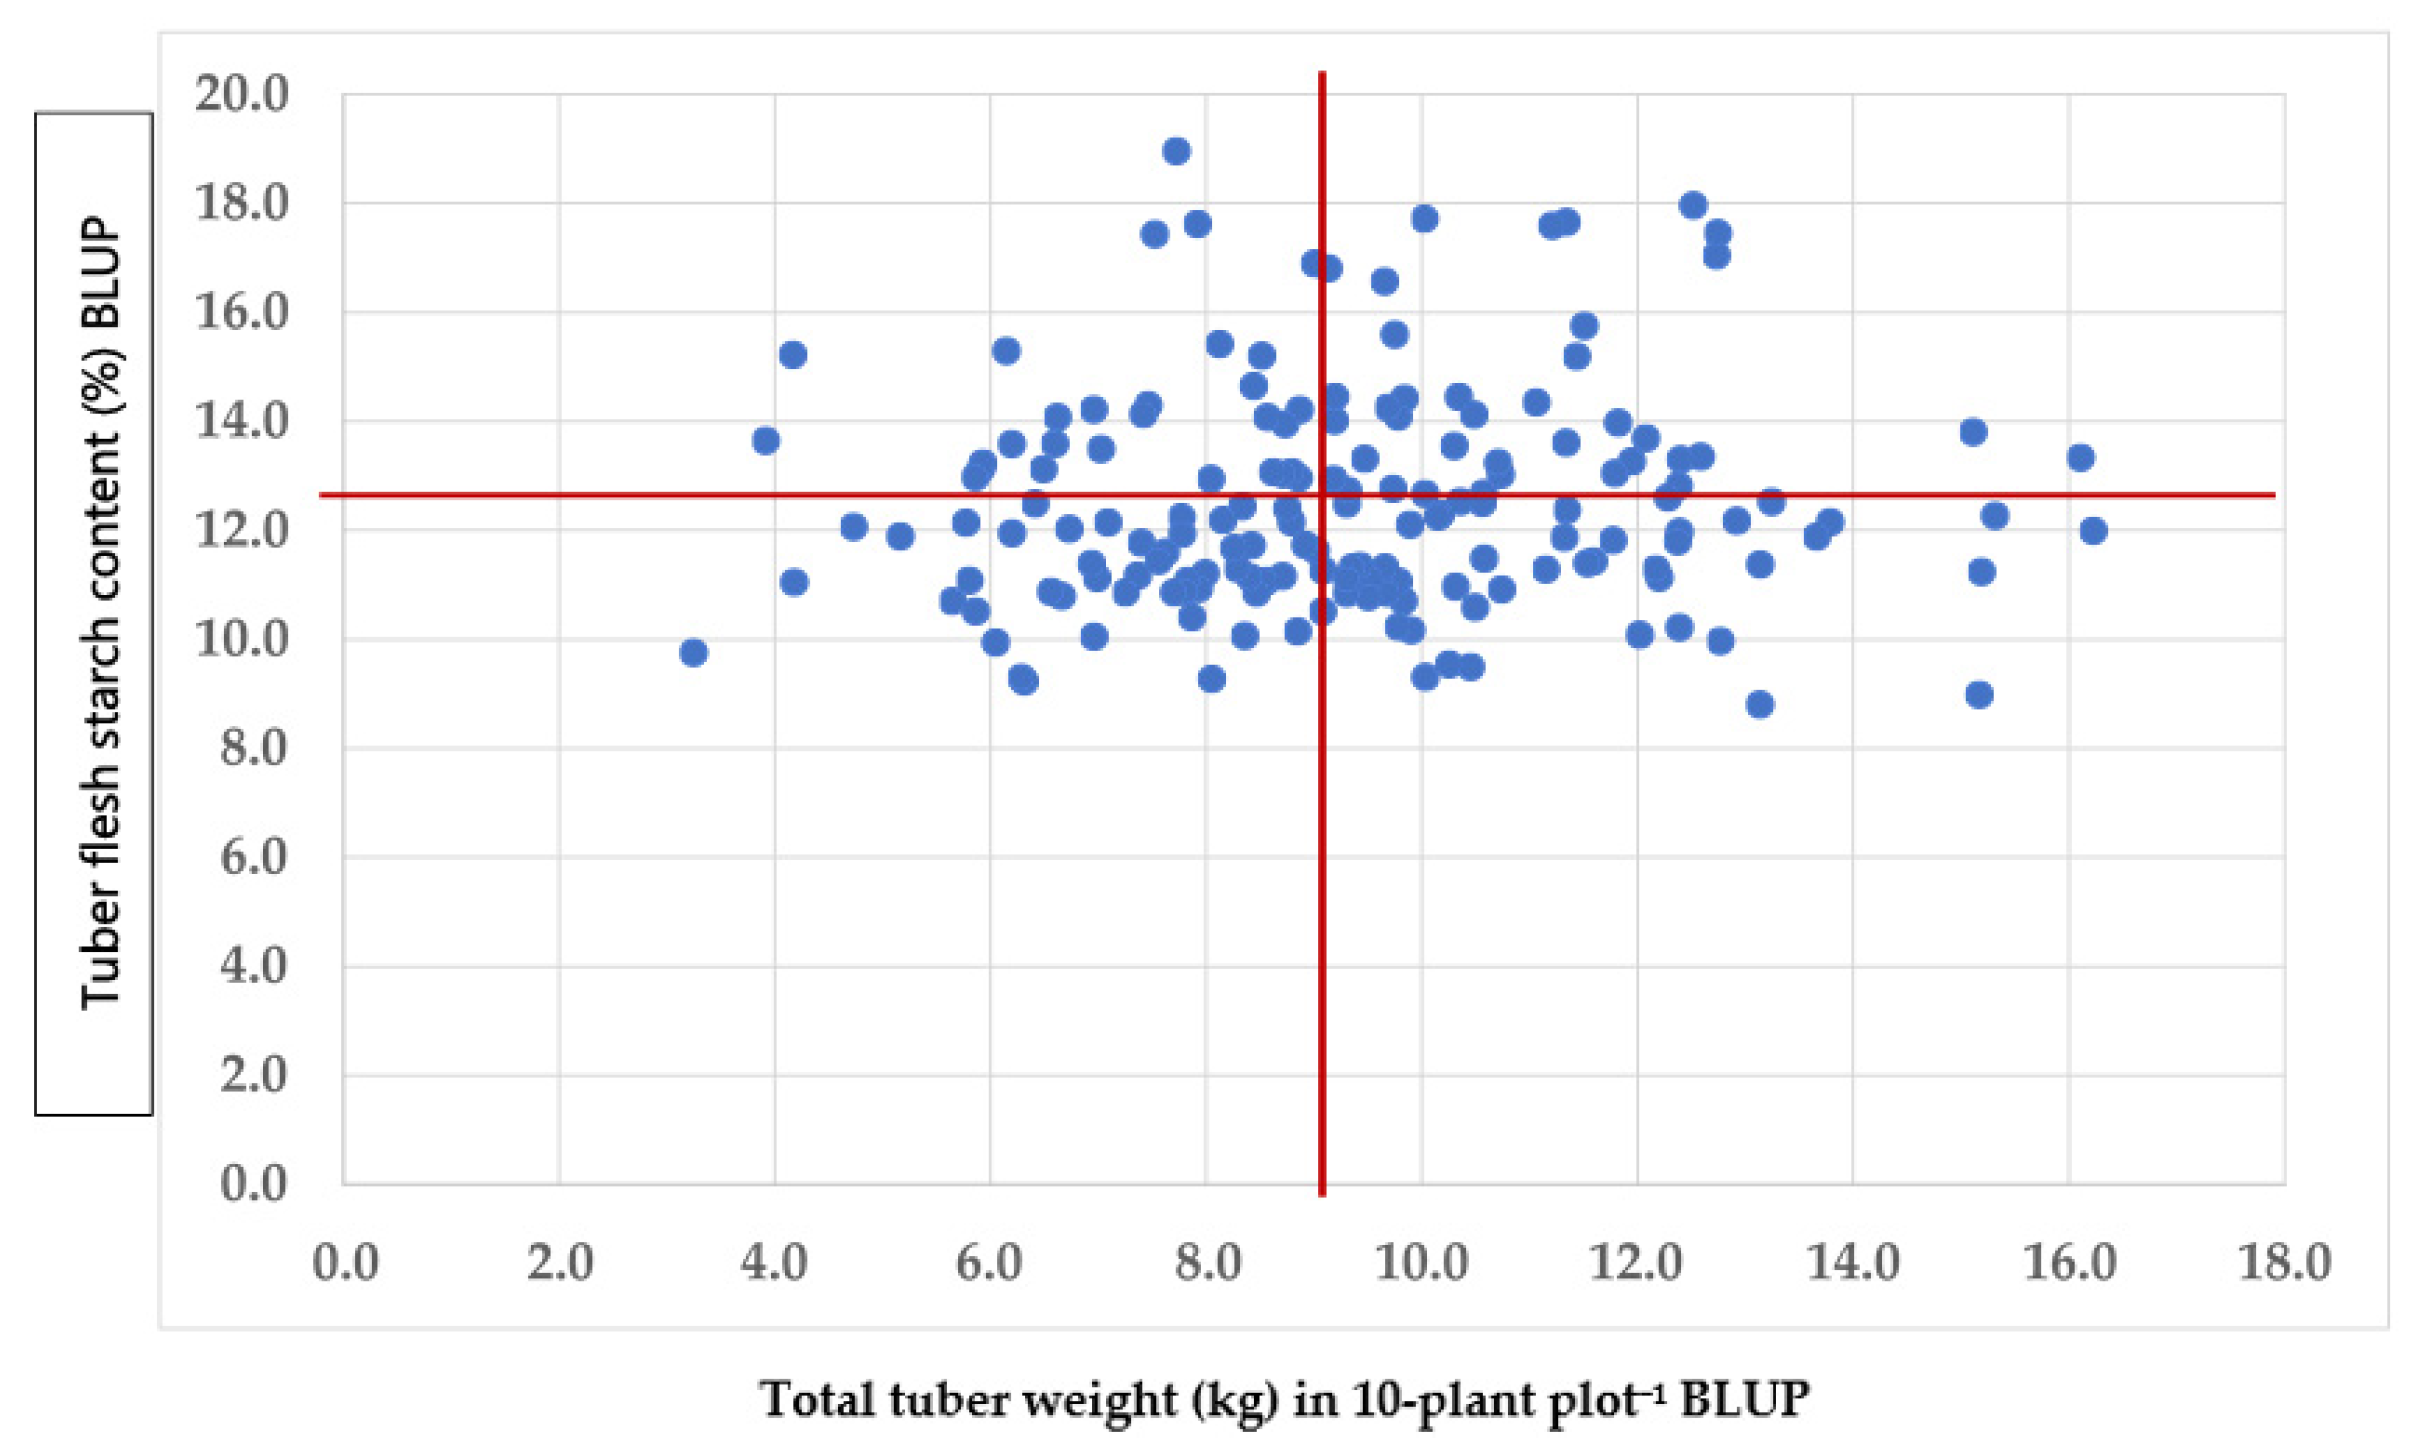
There were significant (p ≤ 0.05) genetic and phenotypic correlations among the tuber weight characteristics irrespective of their sizes, but none were significant (p > 0.05) with tuber starch percentages (Table 4, Figure 1). Most genetic correlations were larger than their respective phenotypic correlations when they were estimated across sites or within each site. The correlations among the tuber weight characteristics were not always significant in each site (Table 5, Table 6 and Table 7). The genetic and phenotypic correlations between tuber starch percentage and tuber weight (total and for different sizes) in the three testing sites, or between tuber weight with reducing sugars at Umeå were not significant (
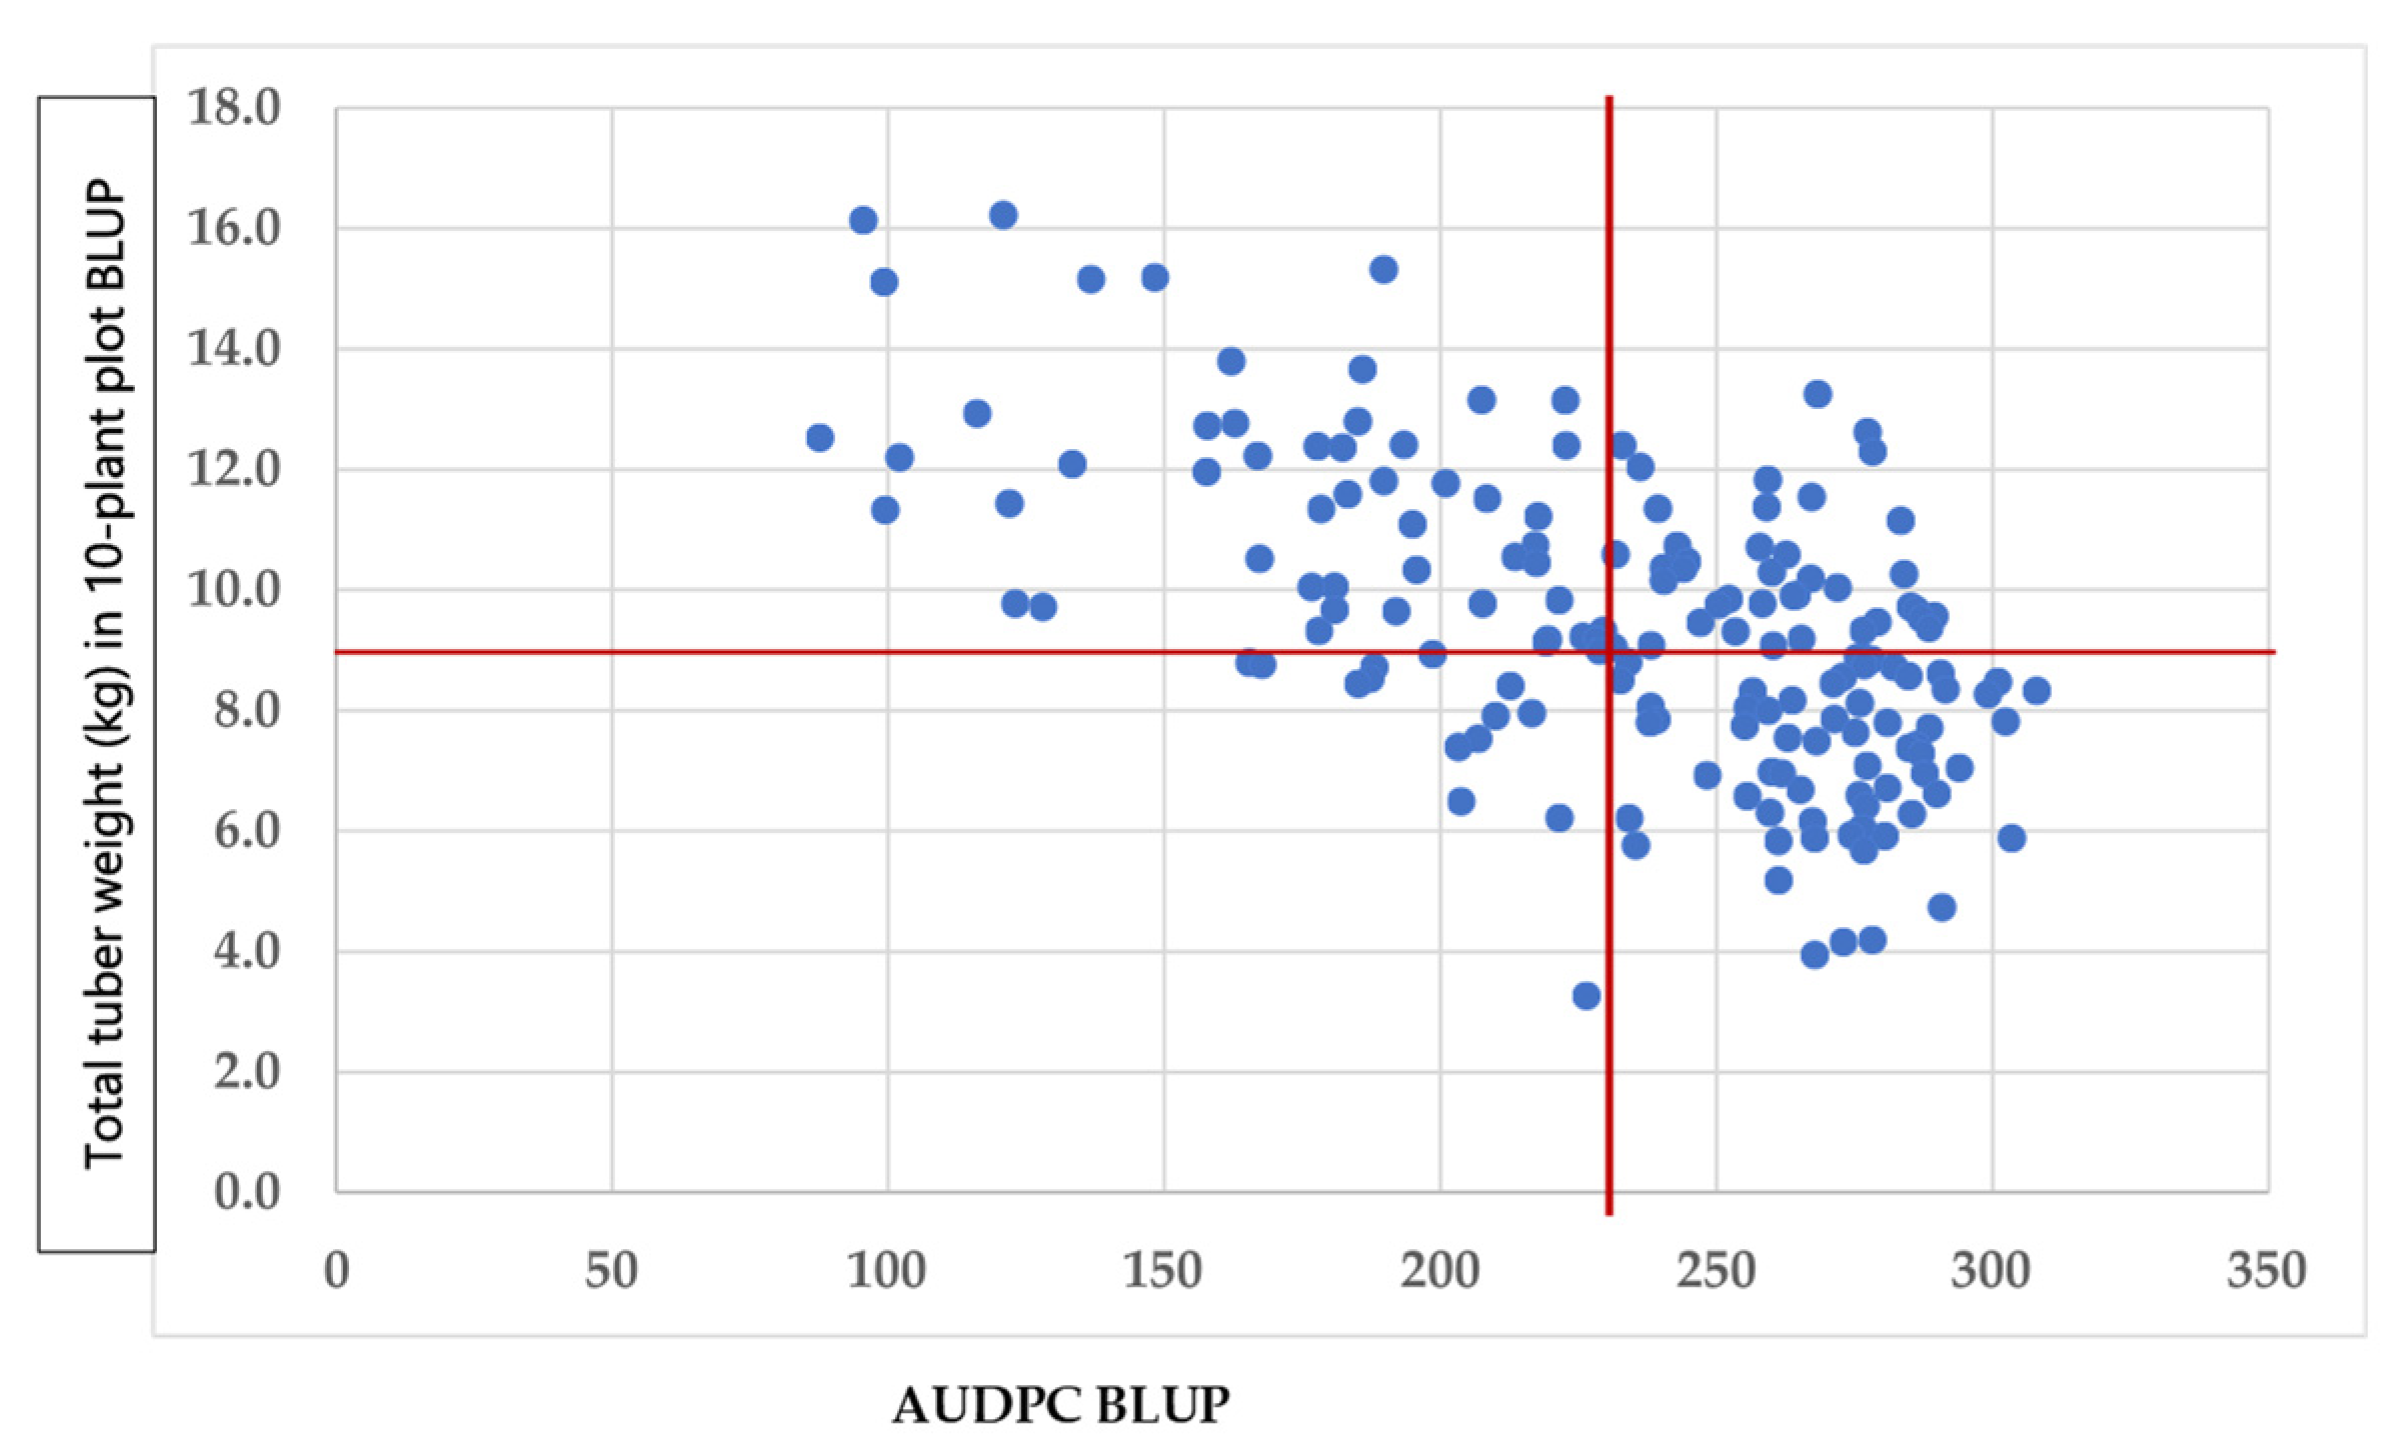
p > 0.05). Hence, the quality traits of the tubers may be improved without affecting the tuber weight. The AUDPC had negative and significant (p < 0.05) genetic (ranging from −0.25 to −0.78) and phenotypic (varying from −0.19 to −0.71) correlations with the tuber traits, except for the weight of tubers 40 mm in size (0.08 and 0.07, respectively) at Mosslunda. These results indicate that the lower the area under disease progress, i.e., partial resistance, the higher the tuber weight (total and for tubers above 40 mm size) or starch percentage (Figure 2).

4. Discussion

To the best of our knowledge (based on a thorough literature search), this appears to be the first time that the BLUPs, as well as their broad-sense heritability and genetic/phenotypic correlations, have been estimated for advanced potato breeding clones and released cultivars grown in the Nordic region of Europe. The BLUPs led to identifying SLU 1314015 as the most promising breeding clone due to its host plant resistance to late blight, high tuber yield, desired tuber size and tuber flesh starch. Its tuber yield and quality did not differ significantly to the highest yielding cultivar ‘Connect’ and the most preferred table potato in Sweden, ‘King Edward’, respectively. It is also worth highlighting that the host plan resistance to late blight, tuber yield and flesh starch of SLU 1314015 were above those of its parent cultivar ‘Carolus’. Svensk potatisförädling has advanced SLU 1314015 to the cultivar pipeline for further testing and potential release. The BLUPs also allow for the selection of other breeding clones for crossing blocks, e.g., SLU 1402009, that do not show the right tuber size for the table potato market but show both late blight resistance and a high tuber yield.
Estimates of broad-sense trait heritability are useful to determine the extent of genetic variation in a breeding population and the influence of the genotype × environment interaction in the expression of a characteristic, thus allowing us to predict how much improvement may be possible through selection. The high H2 estimates for tuber weight found in our trials agree with those previously reported [15,16,17,18,19,20,21].
The genetic gains owing to selection (R) are defined by the following equation:
R = i × H2 × sP
where i is the selection intensity in standardized units and sP is the phenotypic standard deviation of the selected characteristic. These genetic gains, therefore, depend upon a broad heritable variation and a high intensity of selection. The genetic variation found in the breeding clones selected in Sweden and the EU cultivars grown in the testing trials suggest the potential for improving the tuber characteristics for productivity and quality as well as host plant resistance to late blight.
The analysis of genetic and phenotypic correlations among characters gives the opportunity to understand such associations and how to use them when selecting an offspring that combines high productivity, desired quality and resilience to a changing environment. For example, Haynes [22] found high heritability for tuber yield and low heritability for specific gravity in a diploid population (S. tuberosum Gp. Phureja–Stenotomun) in which both characteristics were correlated significantly, thus suggesting that they can be improved simultaneously until the yield potential achieves its limits. In the field trials, we found that a high total tuber weight was always strongly associated with a high tuber weight for big sized tubers (50–60 and >60 mm) across the sites. Hence, it will be difficult to breed high yielding potato cultivars with small tuber sizes (<40 mm) based on the germplasm included in the trials. Perhaps the breeding progress for tuber yield with the desired size may be achieved by changing to within-row spacing to promote the production of medium size tubers or with a potato germplasm selected for producing large sets of medium size tubers.
In our testing sites, most of the genetic correlations were higher in magnitude than the phenotypic correlation among tuber weights (total and grading by size), which agrees with previous research [23,24]. These results clearly indicate the inherent association among these characteristics, as well as indicting that the environment may modify the expression of the association among them.
The high heritability for both total tuber yield and starch percentage and the lack of correlation among them allows for the selection of breeding clones with a high tuber yield and desired starch percentage according to the end-users’ needs. These can be further used as parents in the potato breeding program. Significant correlations (ρ) between the characteristics may suggest that there is an opportunity for trying indirect selection for the characteristic with the largest H2 to maximize genetic gains. The indirect selection based on secondary characteristic (Y) will give a larger response in target characteristic (X) if
iY ρXY HY2 > iX HX
However, the significant positive correlation with tuber weight for large sizes (>50 mm), calls for the development of a restricted selection index [25] that helps to avoid high yielding breeding clones with tuber sizes above the demand for a table potato.

5. Conclusions

Our research shows the genetic variation available for productivity, quality and host plant resistance to late blight that will allow selection according to their BLUPs promising potato germplasm for growing in Scandinavia. It further highlights that estimating both H2 and ρ from multi-site trials in the target population of environments helps when deciding on the best potato breeding strategy for desired characteristic(s) meeting end user demands.

Supplementary Materials

The following are available online at https://0-www-mdpi-com.brum.beds.ac.uk/article/10.3390/agriculture11121287/s1. Table S1: List of SLU’s Svensk potatisförädling breeding clones and cultivars available for cultivation in Sweden included in field trials in 2020. Table S2. Best linear unbiased predictors (BLUPs) and estimators (BLUEs) of potato breeding clones and cultivars across Helgegarden, Mosslunda and Umeå.

Author Contributions

R.O., F.R. and J.C. (José Crossa), conceptualization and field-testing layouts; F.R., field data recording; J.C. (José Crossa) and J.C. (Jaime Cuevas), methodology for data analysis; R.O., J.C. (José Crossa) and J.C. (Jaime Cuevas), writing first manuscript draft; R.O., F.R., J.C. (José Crossa) and J.C. (Jaime Cuevas), review and editing draft; R.O., project grants acquisition and management. All authors have read and agreed to the published version of the manuscript.

Funding

This research was possible through funding provided for Sveriges potatisförädling by the Swedish University of Agricultural Sciences (SLU) and from the Swedish Research Council Formas for both Sveriges potatisförädling (since 2011) and project Genomisk prediktion i kombination med högkapacitetsfenotypning för att öka potatisens knölskörd i ett föränderligt klimat (2020–2022).

Institutional Review Board Statement

Not applicable.

Informed Consent Statement

Not applicable.

Data Availability Statement

Any inquiry regarding access to data used for this research can be directed to the corresponding author of this manuscript.

Acknowledgments

The authors acknowledge the field work for planting and managing the multi-site trials by Boel Sandström and other staff of SLU in Umeå and to Hushallningssallskapet staff at both Helgegården and Mosslunda.

Conflicts of Interest

The authors declare no conflict of interest.

References

  1. Jansky, S.; Spooner, D. The evolution of potato breeding. Plant Breed. Rev. 2018, 41, 169–214. [Google Scholar]
  2. Stockstad, E. The new potato. Science 2019, 363, 574–578. [Google Scholar] [CrossRef] [PubMed]
  3. D’hoop, B.B.; Paulo, M.J.; Visser, R.G.F.; van Eck, H.J.; Eeuwijk, F. Phenotypic analyses of multi-environment data for two diverse tetraploid potato collections: Comparing an academic panel with an industrial panel. Potato Res. 2011, 54, 157–181. [Google Scholar] [CrossRef] [Green Version]
  4. Hill, J.; Becker, H.C.; Tigerstedt, P.M.A. Quantitative and Ecological Aspects of Plant Breeding; Springer: Dordrecht, The Netherlands, 1998; 275p. [Google Scholar]
  5. Bernardo, R. Breeding for Quantitative Traits in Plants, 3rd ed.; Stemma Press: Woodbury, MN, USA, 2020; 422p. [Google Scholar]
  6. Ticona-Benavente, C.A.; da Silva Filho, D.F. Comparison of BLUE and BLUP/REML in the selection of clones and families of potato (Solanum tuberosum). Genet. Mol. Res. 2015, 14, 18421–18430. [Google Scholar] [CrossRef] [PubMed]
  7. Pacheco, J.E.; Urquijo, J.S.; Darghan, A.E.; Rodríguez, L.E. BLUP (best linear unbiased predictors) analysis for the selection of superior yellow diploid potato genotypes (Solanum tuberosum Group Phureja). Rev. Colomb. Cienc. Hortícolas 2020, 14, 125–134. [Google Scholar] [CrossRef]
  8. Mijić, Z.; Kozumplik, V.; Šarčević, H.; Meglić, B.; Varnica, I.; Čupić, T. Stability analysis of tuber yield using unbalanced data from potato variety trials. Genetika 2019, 51, 151–1164. [Google Scholar] [CrossRef]
  9. Tagliotti, M.E.; Bedogni, M.C.; Cendoya, M.G.; Ortego, J.; Huarte, M.A. Multitrait differential response in a diverse potato panel under contrasting water regimes. Crop Sci. 2020, 60, 1–14. [Google Scholar] [CrossRef]
  10. Dwivedi, S.L.; Reynolds, M.P.; Ortiz, R. Mitigating trade-offs in plant breeding. iScience 2021, 10, 102965. [Google Scholar] [CrossRef]
  11. Eriksson, D.; Carlson-Nilsson, U.; Ortiz, R.; Andreasson, E. Overview and breeding strategies of table potato production in Sweden and the Fennoscandian region. Potato Res. 2016, 59, 279–294. [Google Scholar] [CrossRef] [Green Version]
  12. Mann, D.J.; Lammerink, J.P.; Coles, G.D. Predicting potato crisp darkening: Two methods for analysis of glucose. N. Z. J. Crop Hort. Sci. 1991, 19, 199–201. [Google Scholar] [CrossRef]
  13. Fry, W.E. Quantification of general resistance of potato cultivars and fungi-cide effects for integrated control of late blight. Phytopathology 1978, 68, 1650–1655. [Google Scholar] [CrossRef]
  14. Alvarado, G.; Rodríguez, F.M.; Pacheco, A.; Burgueño, J.; Crossa, J.; Vargas, M.; Pérez-Rodríguez, P.; Lopez-Cruz, M.A. META-R: A software to analyze data from multi-environment plant breeding trials. Crop J. 2020, 8, 745–756. [Google Scholar] [CrossRef]
  15. Chaudhary, S.K.; Sharma, S.K. Genetic variability for yield and its components in potato breeding material. Indian J. Agric. Sci. 1984, 54, 941–942. [Google Scholar]
  16. Luthra, S.K. Heritability, genetic advance and character association in potato. J. Indian Potato Assoc. 2001, 28, 1–3. [Google Scholar]
  17. Roy, A.K.; Singh, P.K. Genetic variability, heritability and genetic advance for yield in potato (Solanum tuberosum L.). Int. J. Plant Sci. 2006, 2, 282–285. [Google Scholar]
  18. Asefa, G.; Mohammed, W.; Abebe, T. Genetic variability studies in potato (Solanum tuberosum L.) genotypes in Bale Highlands, South Eastern Ethiopia. J. Biol. Agric. Healthc. 2016, 6, 117–119. [Google Scholar]
  19. Seid, E.; Mohammed, W.; Abebe, T. Genetic variability, heritability and genetic advance in potato (Solanum Tuberosum L.) for processing quality, yield and yield related traits. Int. J. Plant Breed Crop Sci. 2020, 7, 928–936. [Google Scholar]
  20. Ozturk, G.; Yildirim, Z. Heritability estimates of some quantitative traits in potato. Turk. J. Field Crop. 2014, 19, 262–267. [Google Scholar] [CrossRef] [Green Version]
  21. Mishra, S.; Singh, J.; Sharma, P.K. Studies on parameters of genetic variability for yield and its attributing traits in potato (Solanum tuberosum L.). Biosci. Biotechnol. Res. Asia 2017, 14, 489–495. [Google Scholar] [CrossRef]
  22. Haynes, K.G. Variance components for yield and specific gravity in 2× potato population after two cycles of recurrent selection. Am. J. Potato Res. 2001, 78, 69–75. [Google Scholar] [CrossRef]
  23. Addisu, F.; Yohannes, P.; Habtamu, Z. Genetic variability and association between agronomic characters in some potato (Solanum tuberosum L.) genotypes in SNNPRS, Ethiopia. Int. J. Biodivers. Conserv. 2013, 5, 523–528. [Google Scholar]
  24. Sattar, M.A.; Sultana, N.; Hossain, M.M.; Rashid, M.H.; Islam, K.M.A. Genetic variability, correlation and path analysis in potato (Solanum tuberosum L.). Bangladesh J. Plant Breed. Genet. 2007, 20, 33–38. [Google Scholar] [CrossRef] [Green Version]
  25. Kempthorne, O.; Nordskog, A.W. Restricted selection indices. Biometrics 1959, 15, 10–19. [Google Scholar] [CrossRef]
Figure 1. Total tuber weight (kg) in 10-plant plot−1 best linear unbiased predictor (BLUP) versus Tuber flesh starch content (%) BLUP.
Agriculture 11 01287 g001
Figure 2. Late blight area under disease progress curve (AUDPC) best linear unbiased predictor (BLUP) versus total tuber weight (kg) in 10-plant plot−1 BLUP.
Agriculture 11 01287 g002
Table 1. Testing the germplasm bred, along with checks (C) across testing sites in Scandinavia according to their best linear unbiased predictors (BLUPs) for total tuber yield (kg in 10-plant plot−1).
Breeding Clone or Released CultivarGeneration (Pedigree), Crossing or Country Release YearTuber YieldWeight within Each Tuber Size (kg)Tuber Flesh’s Starch (%)AUDPC z
<40 mm40–50 mm50–60 mm>60 mm
‘Connect’ (C)YP 98-3 × ‘Satina’ The Netherlands 201216.220.582.314.198.6811.99120.99
SLU 1402009T5 [(04-3262 × ‘Ora’) × ‘Satina’)]16.130.302.023.6510.8713.3295.63
SW 0101011T8 (93-1015 × ‘Vivaldi’)15.310.382.804.028.9212.26189.74
2-IV-4T6 [(grr × ‘Superb’) × MPI50.140.5)]15.181.214.214.503.1011.23148.64
SLU-SW 0502047T9 (‘Superb’ × ‘Fakse’)15.150.422.875.016.018.98137.02
SLU 1314015T6 (D09 1:2 1701 × ‘Carolus’)15.100.402.403.908.6913.8099.16
‘Galactica’‘Torridon’ × ‘Picasso’ Ireland 200313.790.462.754.116.8012.14162.32
SW 0003022T8 (93-1015 × 93-1081)13.650.442.453.807.5711.88185.66
‘Linda’‘Clivia’ × ‘Hansa’ Germany 197413.241.573.943.301.8512.52268.41
SLU 1414011T5 (C08II69 × ‘Sarpo Mira’)13.150.742.823.575.128.80207.54
‘Maestro’‘Agria’ × G81TT155.1 France 200113.140.362.693.886.7011.37222.88
‘Carolus’(C)‘Agria’ × AR 00- 94-17 The Netherlands 201211.950.613.183.873.6813.26157.73
‘Solist’(C)Unknown Germany 19999.560.313.224.051.5711.08289.33
‘Bintje’ (C)’Munstersen’ × ’Jaune D’or’ The Netherlands 19108.600.783.122.410.9613.06290.37
‘King Edward’ (C)’Magnum Bonum’ × ’ Beauty of Hebron’Great Britain 19008.550.622.952.911.7014.07272.61
Trials’ grand mean9.360.722.662.802.6212.49234.24
LSD0.053.690.631.211.472.651.5540.33
Coefficient of variation (%)17.9441.0726.6829.7447.886.048.65
Z Area under disease progress curve due to oomycete Phytophthora infestans causing late blight.
Table 2. Variance components and broad-sense heritability estimates for the best linear unbiased predictors (BLUPs) for potato trials in Hellegården (high yield potential), Mosslunda (late blight stress) and Umeå (long daylength) in 2020.
StatsTuber Weight 10-Plant Plot−1 (kg)Starch (%)
Tubers < 40 mmTubers 40–50 mmTubers 51–60 mmTubers > 60 mmTotal Weight
Genetic variance0.2900.4471.2202.8306.3244.370
Genotype by environment variance0.1560.7160.7181.6332.6050.654
Residual variance0.1050.5040.6951.1422.2200.569
Heritability0.8060.5810.7740.7940.8360.933
Table 3. Broad-sense heritability estimates in high yield potential (Hellegården) and stressful environments (Mosslunda due to late blight and Umeå owing to long daylength).
StatsTuber Weight 10-Plant Plot−1 (kg)Starch (%)Reducing SugarsLate Blight AUDPC 1
Tubers < 40 mmTubers 40–50 mmTubers 51–60 mmTubers > 60 mmTotal Weight
Hellegården0.92530.87750.83200.90230.90310.9756N/AN/A
Mosslunda0.80760.79140.85470.87110.86540.9335N/A0.9354
Umeå0.92240.80100.86780.84440.91550.91690.7880N/A
1 Area under disease progress curve.
Table 4. Genetic (above diagonal) and phenotypic (below diagonal) correlations among tuber traits across Hellegården, Mosslunda and Umeå among 169 EU cultivars and SLU’s Svensk Potatisförädling.
TraitTuber WeightTuber < 40 mmTuber 40–50 mmTuber 51–60 mmTuber > 60 mmStarch (%)
Tuber weight1.000−0.364 **0.445 **0.935 **0.808 **−0.134 NS
Tuber < 40−0.265 **1.0000.525 **−0.577 **−0.701 **−0.006 NS
Tuber 40–50 0.378 **0.408 **1.0000.392 **−0.171 *0.037 NS
Tuber 51–60 0.869 **−0.517 **0.291 **1.0000.758 **−0.008 NS
Tuber > 600.773 **−0.556 **−0.245 **0.622 **1.000−0.156 *
Starch (%)−0.055 NS0.020 NS0.093 NS0.062 NS−0.130 NS1.000
NS, * and ** indicate non-significant, or significant correlation at p > 0.05, p ≤ 0.05 and p ≤ 0.01, respectively.
Table 5. Genetic (above diagonal) and phenotypic (below diagonal) correlations among tuber yield traits in Hellegården (N = 169).
TraitTuber WeightTuber < 40 mmTuber 40–50 mmTuber 51–60 mmTuber > 60 mm
Tuber weight1.000−0.300 **−0.103 NS0.806 **0.754 **
Tuber < 40−0.282 **1.0000.613 **−0.481 **−0.539 **
Tuber 40–50−0.069 NS0.577 **1.000−0.031 NS−0.667 **
Tuber 51–600.766 **−0.435 **−0.031 NS1.0000.438 **
Tuber > 600.739 **−0.518 **−0.628 **0.353 **1.000
NS, and ** indicate non-significant, or significant correlation at p > 0.05, p ≤ 0.05 and p ≤ 0.01, respectively.
Table 6. Genetic (above diagonal) and phenotypic (below diagonal) correlations among tuber yield traits in Mosslunda (N = 256).
TraitTuber WeightTuber < 40 mmTuber 40–50 mmTuber 51–60 mmTuber > 60 mm
Tuber weight1.000−0.226 **0.392 **0.849 **0.826 **
Tuber < 40−0.147 *1.0000.520 **−0.526 **−0.466 **
Tuber 40–500.403 **0.483 **1.0000.269 **−0.152 *
Tuber 51–600.825 **−0.436 **0.276 **1.0000.629 **
Tuber > 600.810 **−0.401 **−0.146 *0.572 **1.000
* and ** indicate non-significant, or significant correlation at p > 0.05, p ≤ 0.05 and p ≤ 0.01, respectively.
Table 7. Genetic (above diagonal) and phenotypic (below diagonal) correlations among tuber yield traits in Umeå (N = 255).
TraitTuber WeightTuber < 40 mmTuber 40–50 mmTuber 51–60 mmTuber > 60 mm
Tuber weight1.000−0.030 NS0.794 **0.814 **0.571 **
Tuber < 40−0.006 NS1.0000.181 **−0.597 **−0.580 **
Tuber 40–500.755 **0.161*1.0000.480 **0.002 NS
Tuber 51–600.778 **−0.537 **0.395 **1.0000.800 **
Tuber > 600.541 **−0.515 **−0.033 NS0.690 **1.000
NS, * and ** indicate non-significant, or significant correlation at p > 0.05, p ≤ 0.05 and p ≤ 0.01, respectively.
Publisher’s Note: MDPI stays neutral with regard to jurisdictional claims in published maps and institutional affiliations.

