
Quantitative Evaluation of China’s Pork Industry Policy: A PMC Index Model Approach


1
College of Public Administration, Huazhong Agricultural University, Wuhan 430070, China
2
College of Economics and Management, Huazhong Agricultural University, Wuhan 430070, China
3
Walker College of Business, Appalachian State University, Boone, NC 28608, USA
*
Author to whom correspondence should be addressed.
Agriculture 2021, 11(2), 86; https://0-doi-org.brum.beds.ac.uk/10.3390/agriculture11020086
Submission received: 1 December 2020
/
Revised: 5 January 2021
/
Accepted: 5 January 2021
/
Published: 20 January 2021
/
Corrected: 14 January 2022
(This article belongs to the Section Agricultural Economics, Policies and Rural Management)
Abstract
:To ease the fluctuation of hog prices and maintain the hog market’s stability, the central government of China has issued a series of hog price control policies. This paper, supplemented by co-word analysis and LDA thematic modeling, constructed 9 first-level indicators and 36 second-level indicators and used a PMC index model to conduct quantitative research on the selected 74 policies and regulations of China’s pig price regulation policies from July 2007 to April 2020. The research concludes that the research tool system of China’s hog price control is formed. The overall design of the hog price control policy is relatively reasonable, but there are still the following problems: the subject of China’s pig price control policy is singular, so it is difficult to form a resultant force; the policy pays attention to the price regulation in the short term, but ignores the long-term industrial structure adjustment; it emphasizes market supervision, but insufficient support for slaughtering and processing; it focuses on production and management to improve the development quality and efficiency of the pig industry, but does not take social equity into account. Finally, some policy suggestions are put forward: multi-department division of labor and close cooperation; adjusting the industrial structure of hog and carrying out appropriate large-scale breeding; establishing the operation mode of slaughtering and processing in the producing area to reduce the circulation cost of the pig industry; ensuring the consumption of pork by low-income groups and giving consideration to social efficiency and equity.
1. Introduction
Pork is the largest meat product consumed by Chinese residents. China is the world’s largest producer of pigs. The price of pigs has always been the focus of the government and society. Ensuring the pork market’s sustainable pig production and orderly operation is the efficiency goal pursued by the government. Simultaneously, to ensure the income of pig farmers and residents of pork consumption is the government’s pursuit, which is a fair goal. Therefore, the government should shoulder the economic function of countercyclical adjustment to the pig market and macro-control to control pork prices’ fluctuation within a reasonable range.
However, judging from the current effects of the government’s macro-control measures, the government’s intervention measures have a complex impact on the stabilization of hog prices. While restraining the recent hog price rise, it may also lead to the excessive decline of the next round of hog prices. This is closely related to the government’s lack of a systematic and supportive comprehensive policy and regulation system. Therefore, existing policies and regulations should be systematically sorted out to find their existing problems and provide a reference for the government to formulate and improve relevant policy and regulation systems. This paper mainly studies China’s pork price regulation policies and their effects, uses text mining methods and LDA (Latent Dirichlet Allocation) [1] subject modeling, and combines a PMC (Policy Modeling Consistency) index model [2] to conduct quantitative analysis and evaluation of pork price regulation policies. Overall, this research fills the policy evaluation gaps in bridging LDA with the PMC method with the most recent data. This research contributes to the understanding of agriculture policy analysis.
1.1. Research on the Control Policy of Pig Price
Tan and Zeng [3] found that although the reserve spider web model provides theoretical insights, it shows that the government’s implementation of reserve policy tools to control price volatility will increase price volatility. Still, the empirical results show that the policy induces high correction and increases price volatility, especially in the asymmetric transmission of price information. Therefore, the Chinese government should reduce excessive intervention in pork prices and let the market play a role in the pig and pork market. By decomposing the structure of the pig supply chain, Lu et al. [4] constructed a dynamic model of the pig industry system and found that reducing pig breeding cost is the most effective long-term strategy to stabilize pig price. Ngarava and Mushunje [5] found that Zimbabwe’s pork industry participants’ pricing strategy was short-sighted when they studied the pricing strategy in the dynamic institutional environment of land reform and innovation policy in Zimbabwe. It is suggested that the pork industry players should shift from the short-sighted pricing target of profit and survival to a new pricing strategy based on sales and competitive pricing. There is also a need to reduce rigidity in flexible price policies to take advantage of the dynamic external environment. Öhlund et al. [6] advocated using public procurement as a driving force to promote more sustainable pork production to solve or cope with the contradictory goals in pig raising. Zhang et al. [7] used microscopic data collected from pig farms in Jiangsu Province, using a two-step meta-frontal model and original system methods. They came to the following conclusion: the ongoing structural changes can promote the growth of China’s pig industry output and also help reduce production costs and improve the competitiveness of the Chinese pig industry.
1.2. Policy Evaluation Theory
Policy evaluation is a complex system project that comprehensively examines the policy system and its process and judges and measures policy plans by relying on scientific standards and methods [8]. In the early 1970s, the policy evaluation tended to be empirical, emphasizing social planning utilizing social experiments and mathematical analysis. Since the 1970s, policy evaluation has gradually shifted from empirical standards to normative standards, emphasizing value judgments, represented by Poland’s “three E” evaluation classification framework [9] and Suchman, E.’s five types of evaluation [10]. Hannoura et al. [11] believed that classical policy evaluation should start with revealing the causal mechanism of policies to judge the effects of policies and their impact on all social parties. The PMC index model is an international advanced policy text evaluation method. It is the consistency index model of policy modeling research proposed by Ruiz Estrada et al. based on the Omnia mobilis hypothesis. They believe that everything is connected and has the characteristics of the movement, and the variables should be widely taken into account when studying the policy model [2,12]. Carreira and Teixeira [13] advocate studying policies with different objectives from four perspectives: legal regulation, decisions and incentives, technological economic effects, and information content. Taking policy objectives and characteristics as the entry point, Nag divided policy types into three categories: emergency policy, mandatory policy, and general policy, and proposed corresponding evaluation indicators [14].
In the research of quantitative analysis and policy evaluation, American scholar Libecap [15] made a pioneering exploration. He compared existing policies with previous policies and scored the two policies before and after (policy improvement is a bonus item). By sorting out the scores of all policies throughout the year, a legal change index was formed to evaluate the mining laws of Nevada, the United States. Prior, et al. [16] used text mining and semantic network analysis to reveal the basic elements and characteristics of policy text content and made a comparative analysis of health care policies in England, Northern Ireland, Scotland, Wales, and other regions in the U.K. from 2000 to 2009. Cotton, et al. [17] divided the shale gas policies promulgated at the national level in the U.K. into three types and drew research conclusions through discourse analysis of policies. Based on 42 indicators of “Food Environmental Policy and Infrastructure Support” and referring to common international practices, Vandevijvere, et al. [18] constructed the Food Environmental Policy Index (FOOD-EPI) to evaluate the implementation strength of the New Zealand government in the field of food environmental health. Pattyn and Brans [19] distinguish three dimensions of policy evaluation—evaluation behavior, evaluation law and evaluation quality, and use the necessity function in QCA to evaluate the policies of 27 organizations in the Flemish public sector in Belgium. Ferrer, et al. [20] set up the Social Policy Index (SPI) through dimension division, data standardization and weight assignment, and reviewed and compared the social policy status of three countries with different welfare systems. Turpin, et al. [21] decompose a package of policies at the European, national and regional levels into strategic objectives, operational objectives, policy measures and expected impacts, and assess the relationship between these policy elements and land interests. Dantas, et al. [22] evaluated Brazil’s smart grid policies using the Delphi method, pointing out that all policies positively impact the development of a smart grid in Brazil. The only difference is that each policy has a different priority. Aiming at the “financial vacancy” in existing climate policy evaluation methods, Stolbova, et al. [23] propose a financial macro network method, and take the euro area as a specific object to empirically analyze the feedback cycle between the financial sector and the real economy, thus providing a more comprehensive perspective for evaluating the economic impact of climate policy. Elizalde-San Miguel, et al. [24] decomposed the family policy into Education Service (SSI), Parental Leave Index (PLI) and Property Transfer Index (MTR), and then formed a Weighted Family Policy Index (XFPI) to compare the support of family policies for families with children aged 0–3 years in Spain and Norway. At present, most of the foreign quantitative evaluation methods are points, while other quantitative evaluation methods are still in the exploration stage.
2. Materials and Methods
2.1. Analysis of Pig Price Control Policy Tools
2.1.1. Data Source and Collection
The pig price control policy is a series of measures taken by all government departments to ease the pig price fluctuation and adjust the balance of supply and demand in the pig market. Following the principles of openness, authority, and representativeness, and in order to ensure the comprehensiveness of the policy text, this article uses “live pig price”, “pork price” and “live pig agricultural product price” as keywords. Full text fuzzy search is carried out on the National Development and Reform Commission and other departments’ official websites, as well as the Peking University and the central legal interpretation database. To ensure the timeliness of the policy, this article takes the policy-oriented “Opinions on Promoting the Development of Live Pig Production and Stabilizing Market Supply” issued by the State Council in 2007 as the node and selects the selection of China’s live pig price regulation from July 2007 to April 2020. More than 400 central normative documents from the central government filter out repetitive documents and policy texts that are not closely related to the regulation of live pig prices in China, and sort out 74 central normative documents closely related to research topics (excluding local government policies). These policies are issued separately or jointly by central governments such as the State Council, the National Development and Reform Commission, the Ministry of Agriculture and Rural Affairs, and their directly affiliated institutions.
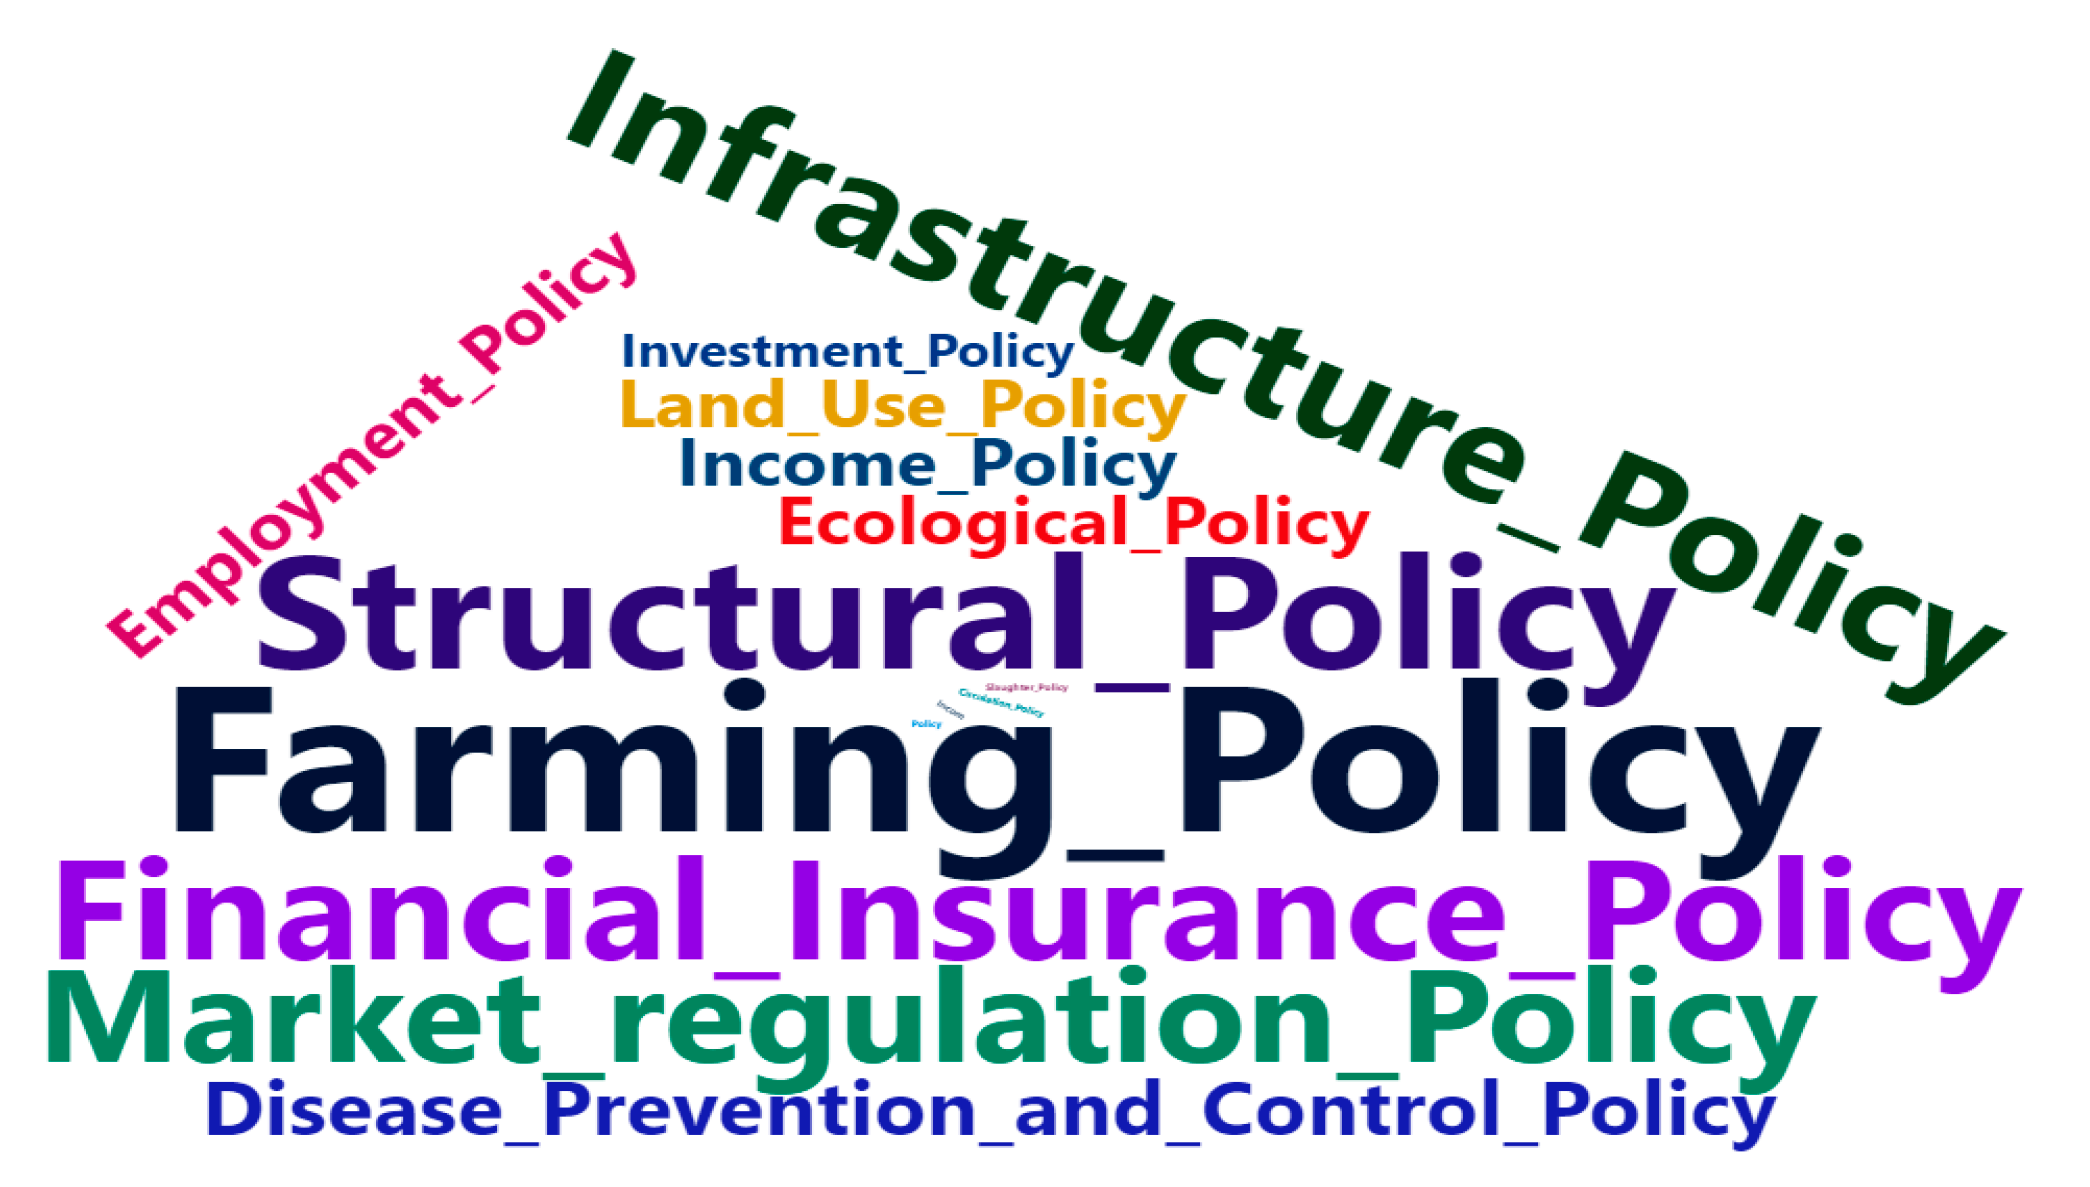
The 74 pork industry policies selected by the author cover economic or administrative means, especially some policies which regulate pig prices from multiple angles. Therefore, the contents are limited to the policy of direct control of pig price and the policy of indirect control of pig price in other areas. Figure 1 and Table 1 below provide information on the policy types of 74 Chinese pork industry policies, and generates the following statistical chart of policy attributes. The larger the font, the more the number of policies with this attribute; the smaller the font, the less the number of policies with this attribute.
2.1.2. Word Segmentation and Word Frequency Statistics
After intensive manual reading of the policy text, the policy text’s core keywords were extracted with the help of a common word analysis software. The keywords’ extraction was mainly divided into the following three steps: The first step was automatic recognition. The 74 domestic pig price control policy documents were imported into the text mining database of ROSTCM6 software, and the document set formed processed by word segmentation, and the characteristic word frequency was counted according to the order of word frequency from high to low. The second step was manual filtering. Software automatic recognition will extract some keywords of no obvious function, and needed to rely on human intervention to ensure scientific rationalization. Since the sample was selected as China’s pig price control policy, high-frequency words such as agriculture, rural areas, and agriculture had no significant influence on the analysis results of policy characteristics and so needed to be eliminated. Frequent adverbs of degree—very, significant, special, etc.—as well as verbs—increase, strengthen, decrease, etc.—also have no practical significance to the analysis result and needed to be eliminated. The third step was to merge the specifications. In the statistical process, keywords with similar meanings were merged and adjusted. For example, ‘breeding’, ‘livestock industry’, ‘livestock and poultry’, and ‘livestock’ are merged into ‘livestock breeding industry’; live pigs, pork, and sows are merged into ‘live pig agricultural products’. For the same keyword that appeared multiple times in the same policy, it was only recorded once. After eliminating the interference of redundant words, effective high-frequency words was sorted out. The top 40 words are listed in Table 2 below.
2.1.3. Map Analysis of Social Networks
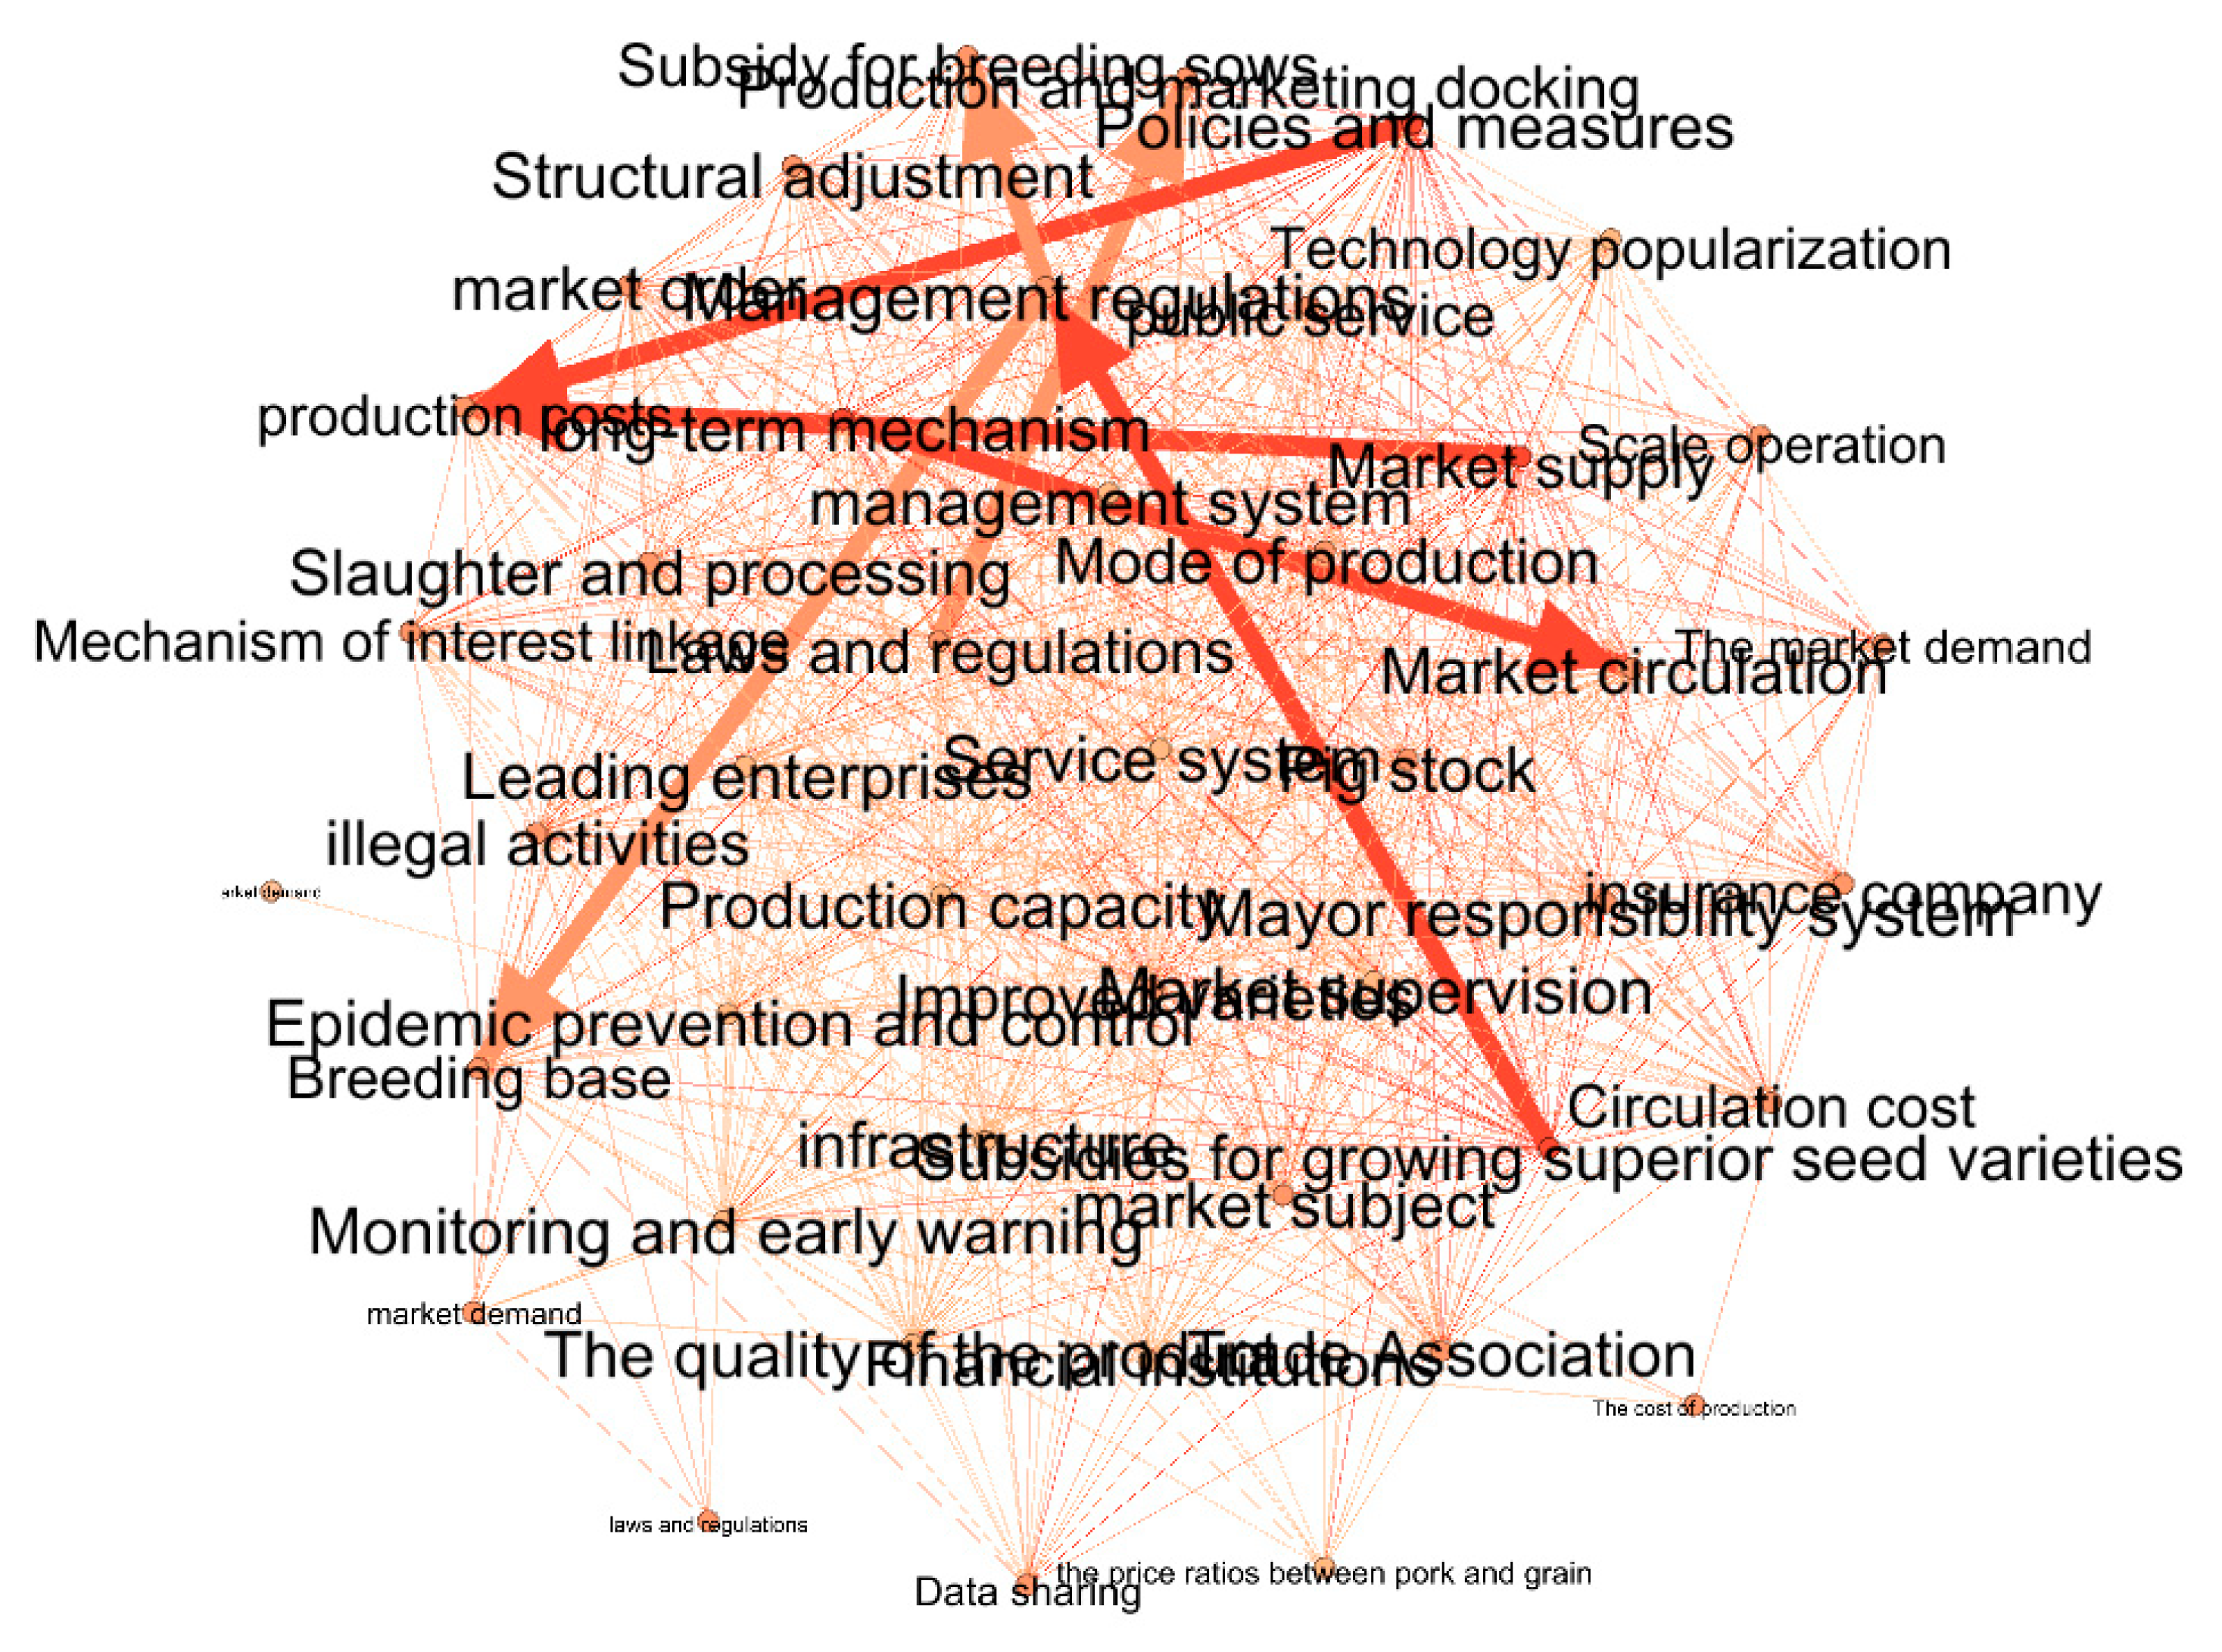
The statistical keywords were imported into ROST Content Mining 6 software (Wuhan University, Hubei, China) to form a 40– by –40 keyword co-word matrix. Based on the co-word matrix obtained, the visual network map of China’s pig price regulation policies was drawn with the Netdraw mapping function in Ucinet software. The social network relationship between policies was analyzed in depth.
As shown in Figure 2 below, each interconnected policy formed an overall network of China’s pig price regulation policies. Nodes represent theme keywords. Larger nodes mean more frequent co-occurrence of theme keywords. The line thickness reflects the relationship strength of the theme keywords. The thicker the line is, the stronger the correlation is. The node’s position represents the importance in the social network, and the key words in the central position are more important in this field. The figure’s nodes have relatively dense connections, indicating that the whole network is relatively concentrated, and the correlation between subject and keywords is relatively high. The research tool system in the field of hog price control in China has mostly formed. Market supervision, management regulations, management system, and service system are at the center of the network, indicating that these systems greatly influence the field of pig price regulation in China. On the premise of respecting the market rules, the government should improve relevant management rules and regulations, build a scientific and reasonable management system, and do an excellent job in market supervision and government services. Only when the hog price fluctuates, and the market regulation fails can the government better fulfill its economic functions. The large number of nodes such as subsidies for improved varieties, infrastructure, leading enterprises, and market supply represents a high frequency of co-occurrence of these thematic keywords. The state often uses improved varieties of subsidies in live pig price control policies. It pays close attention to the market supply of live pigs, developing leading pig companies and vigorously supporting the construction of related infrastructure. Large-scale operations, data sharing, breeding bases, slaughter and processing, distribution costs, and other nodes are relatively small in size and are located at the edge of the entire network, indicating that these aspects are relatively lacking and weak Chinese live pig price control policy. It will be introduced in the future. We must make up for shortcomings in China’s live pig price control policy to make China’s live pig price control policy more perfect.
2.2. Establishment of PIG Price Control Policy PMC Model
2.2.1. PMC Index Model Concept
Early policy evaluation models were based on the Assumption that all other conditions were the same (Ceterirs Paribus Assumption) and studied the cumulative effect of each independent variable on overall change. Ruiz Estrada put forward the Omnia Mobilis hypothesis, which holds that everything in the world is moving and connected [12]. Therefore, the policy evaluation model should not ignore any relevant variables, and the selection of variables should consider all relevant variables broadly and comprehensively. The PMC index model is proposed based on the Omnia Mobilis hypothesis and can not only analyze the internal consistency of a policy but also highlights the advantages and disadvantages of a policy, the overall situation of the policy and the specific situation of each single policy through the PMC index and PMC surface intuitive show. Based on the PMC index model, this paper conducts quantitative research on China’s pig price regulation policy. The construction of a PMC index model includes: (1) establishment of variable index system; (2) construction of multi-input and output tables; (3) the calculation of PMC index; and finally, (4) the generation of a PMC surface [2].
2.2.2. Establishment of PMC Index System
In this paper, China’s pig price regulation policies were taken as the research object, and the PMC model was used to conduct a quantitative evaluation. The variables were set according to the policy evaluation research based on Estrada [2]. The secondary variable is the refinement of the primary variable. Firstly, word segmentation and word frequency statistics are carried out on the selected 74 samples of China’s pig price regulation policies through ROSTCM 6.0 software to obtain the secondary variable’s general framework (see Table 1). They are then complemented by the LDA-generated results from the deep learning framework Tensor Flow. By word segmentation of all policy texts, the author then uses Python software to generate 5 categories of subject words. Equation (1) is the expression of Dirichlet distribution; thus, the conditional distribution of documents is calculated, as shown in Equation (2). Then, Equation (3) is used to obtain the joint distribution of the subject words. Finally, the conditional probability of Gibbs sampling for each calculated word corresponding to the topic, as shown in Equation (4), can be referred to the flow chart of the calculation as follows. Figure 3 provides additional information.
Through modeling, the following LDA results are generated (see Table 3). Finally, 36 secondary indexes were determined based on China’s hog price control policies (see Table 4). After each policy’s PMC score is calculated, the policies are graded according to the rating Table 5.
The core of this research is to conduct a quantitative evaluation of hog price control policies. This paper proposes four basic operations: (1) excluding some emergency temporary pig policies, such as the pig assistance program for earthquake stricken areas; (2) excluding the pig policy formulated solely for a specific purpose, such as the low-cost credit policy for poor mothers; (3) excluding pig policies used to adjust special festivals, such as the Spring Festival; and (4) when choosing policies, try to choose vertical comparison at different times at the same level, or horizontal comparison at the same time at different levels, with two dimensions to ensure that the studies are comparable (see Table 5). Pork plays a vital role in the diet structure of Chinese residents, and the price of pork has a direct impact on people’s daily life. To ensure the pork market’s supply and maintain the fluctuation of pork prices within the normal range, the state will issue relevant live pig price control policies in a targeted manner every time. We should improve the overall development of the pig industry and ensure that people can afford pork. Of course, we should also ensure pork’s quality and maintain good order in the pig market. We will conduct an empirical analysis on five specific pig policies and use the PMC index model to conduct a quantitative evaluation of the policy text. It helps find out the remaining problems of the policies themselves, and provide suggestions for future pig policy formulation. The five policy texts selected in this paper have an inherent logic. From the point of view of the institutions that issue policies, two are policies of the State Council, two are policies of the Ministry of Agriculture, and one is a policy of industrial and commercial administration. From the point of view of the launch date of the policy, 2007, 2011, and 2019 are three important time nodes, and the policies of these three years also have their own characteristics. For example, in 2007, due to the outbreak of blue-ear disease in pigs in southern China, the national pork output was sharply reduced, and the price of pork soared accordingly. The government quickly introduced several hog price control policies to stabilize the supply of pigs in the market. In 2009, the pig price was at a low point. After the government introduced a series of pig price control policies in 2009, the effect of the control showed through the adjustment and recovery in 2010, and the pig price rose successively and reached the peak in 2011. Therefore, the pig price regulation policy introduced after 2011 is mainly aimed at promoting stable and healthy pig production, ensuring market supply, and stabilizing pork prices. Since 2019, due to the global impact of African swine fever, China’s pig production has been reduced, and the price has been continuously rising. The government has successively introduced relevant price control policies to deal with the impact of African swine fever on China’s pig market. See Table 6 for the five typical pig price control policies selected as the standard.
2.3. PMC Index Calculation
2.3.1. Variable Assignment Method
In this paper, all secondary variables in Table 3 are given the same weight. In the PMC model, binary 0 and 1 are used to set the value of secondary variables. When the policy meets the conditions, the score is 1; when the policy does not meet the conditions, the score is 0, as shown in Equation (5). Secondly, the second-level variable is weighted to obtain the value of its corresponding first-level variable, as shown in Equation (6). Finally, according to Equation (7), the PMC index of each pig price control policy is calculated.
where i is the ordinal number of second-level variable, t is the ordinal number of first-level variable, Nt is the number of second-level variables under the first-level variable corresponding to the t and m is the number of first-order variables.
X ~ [0,1]
2.3.2. Independent Variable Selection and Coding
According to the 9 first-level variables and 36 second-level variables set, the analysis framework was constructed from multiple dimensions to conduct a quantitative analysis on China’s pig price control policies. See Table 7 for the formed multi-input and output tables. Table 8 provides a summary of PMC index of five pig price control policies.
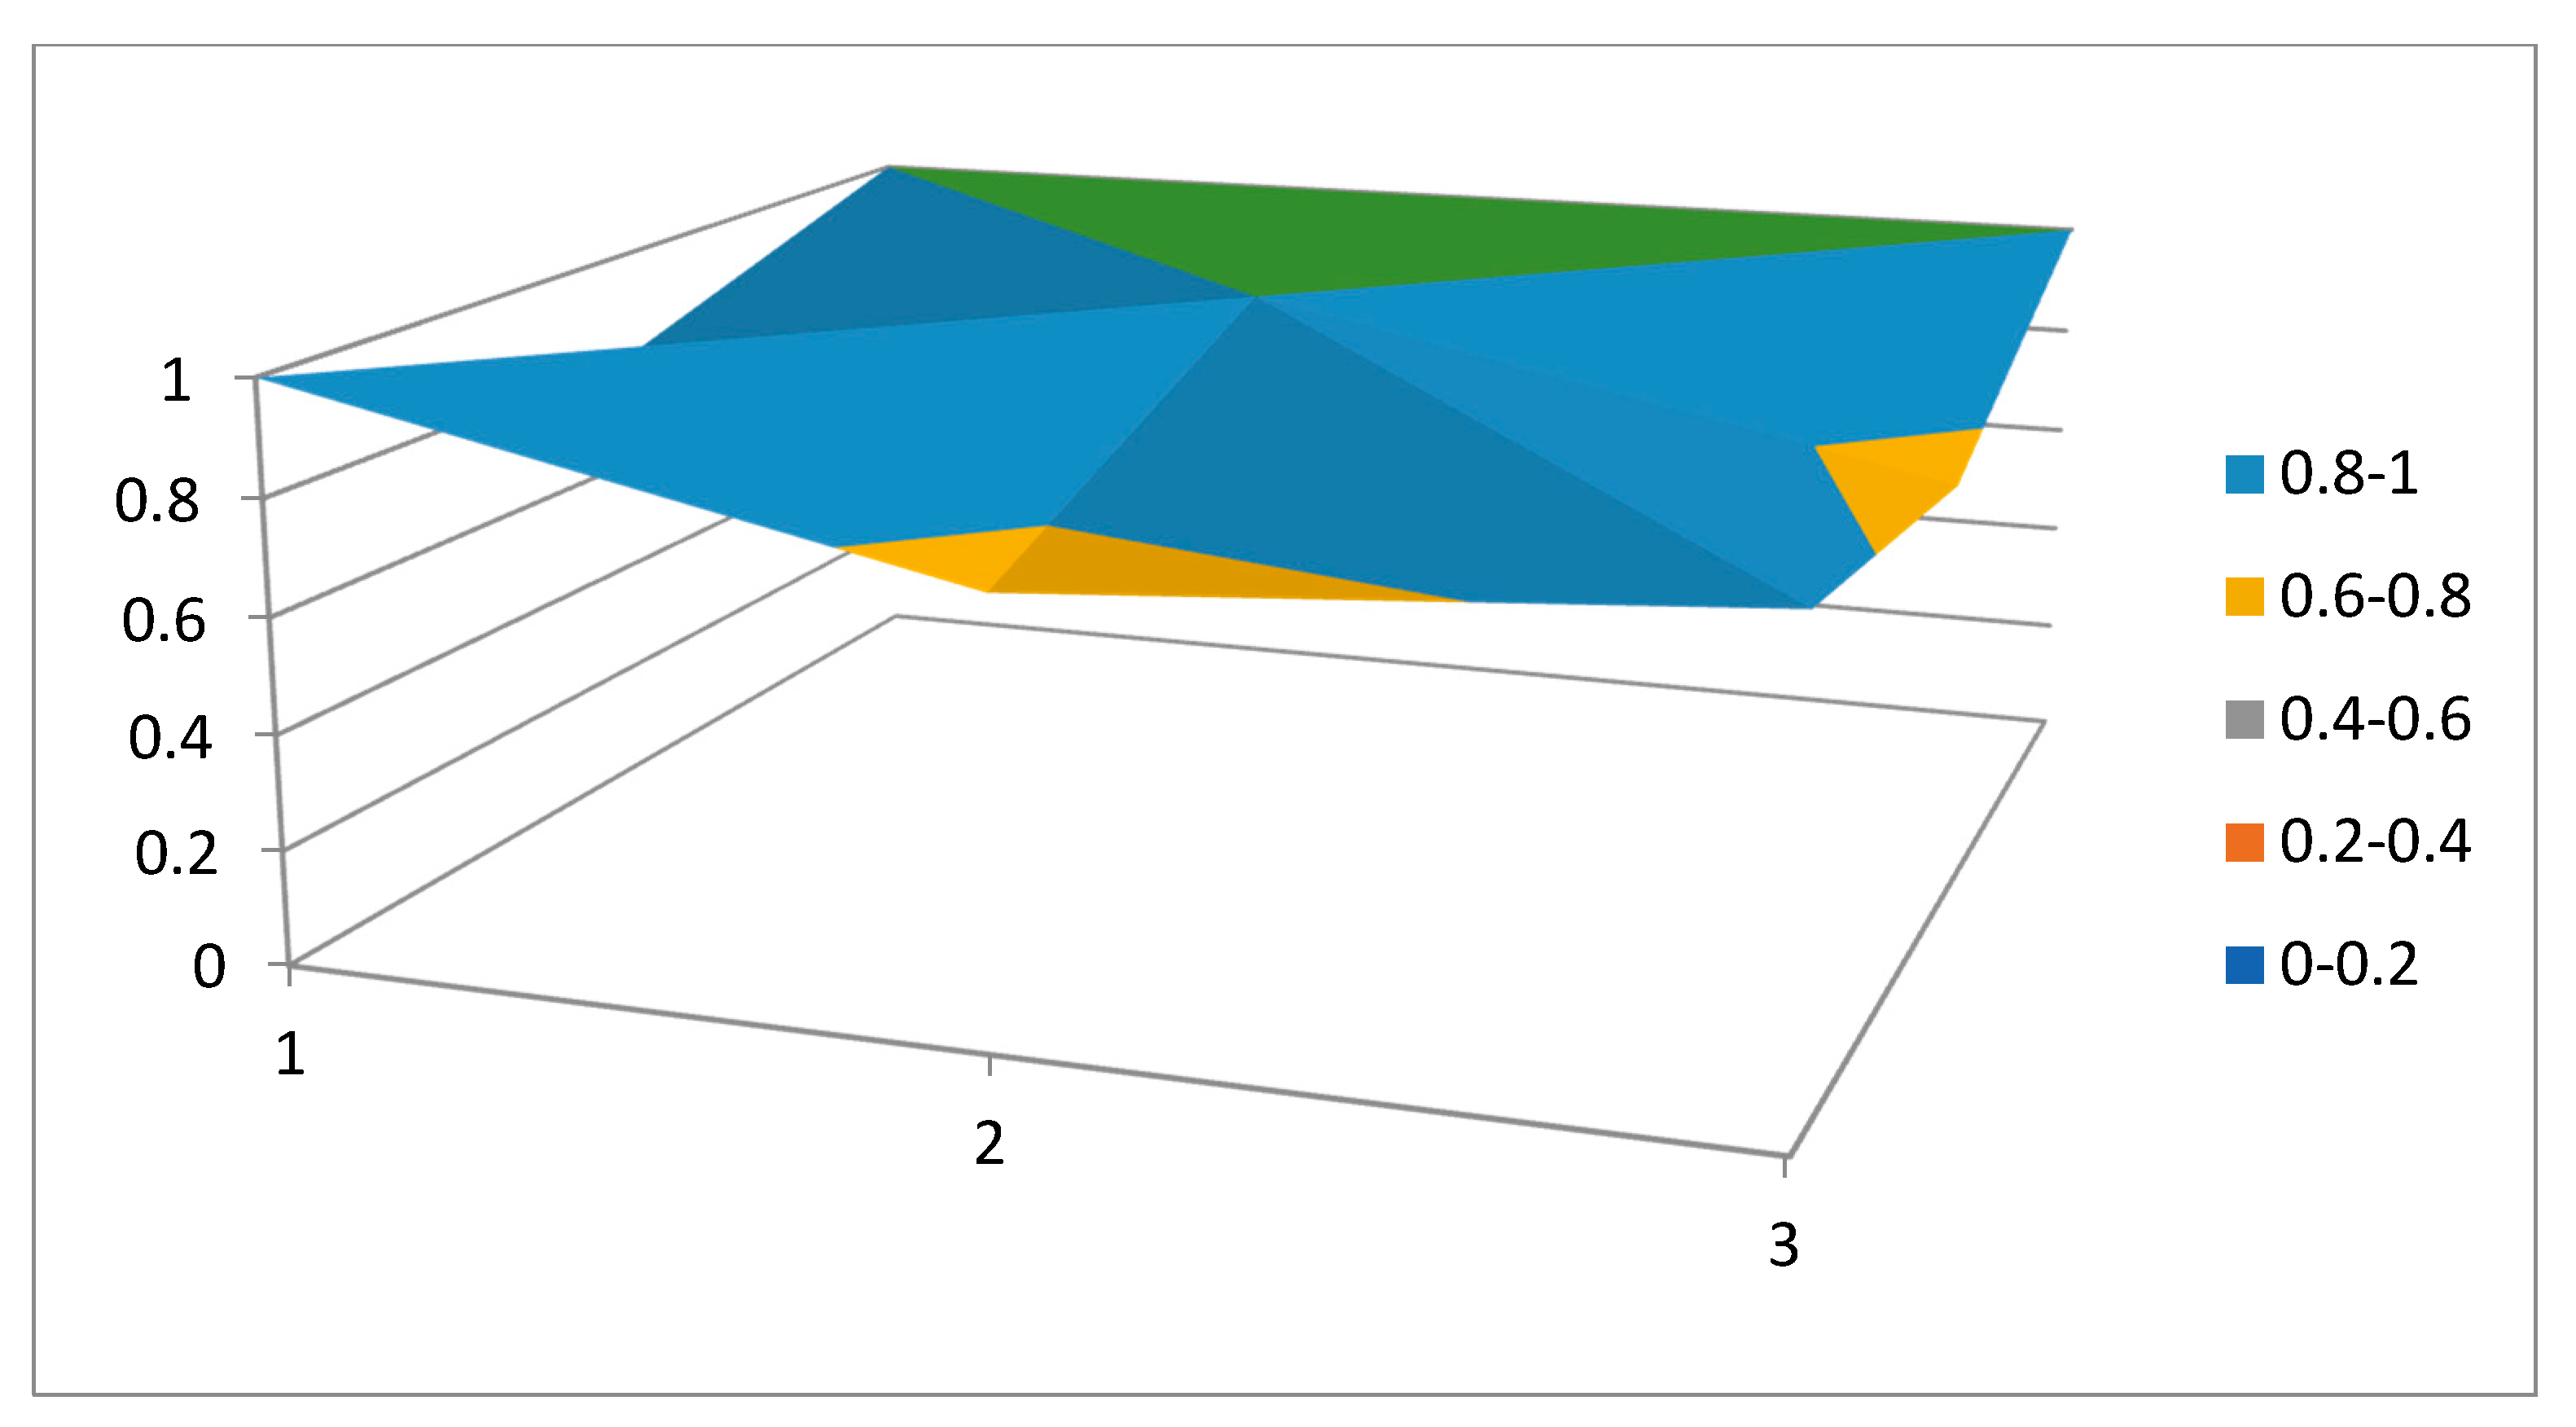
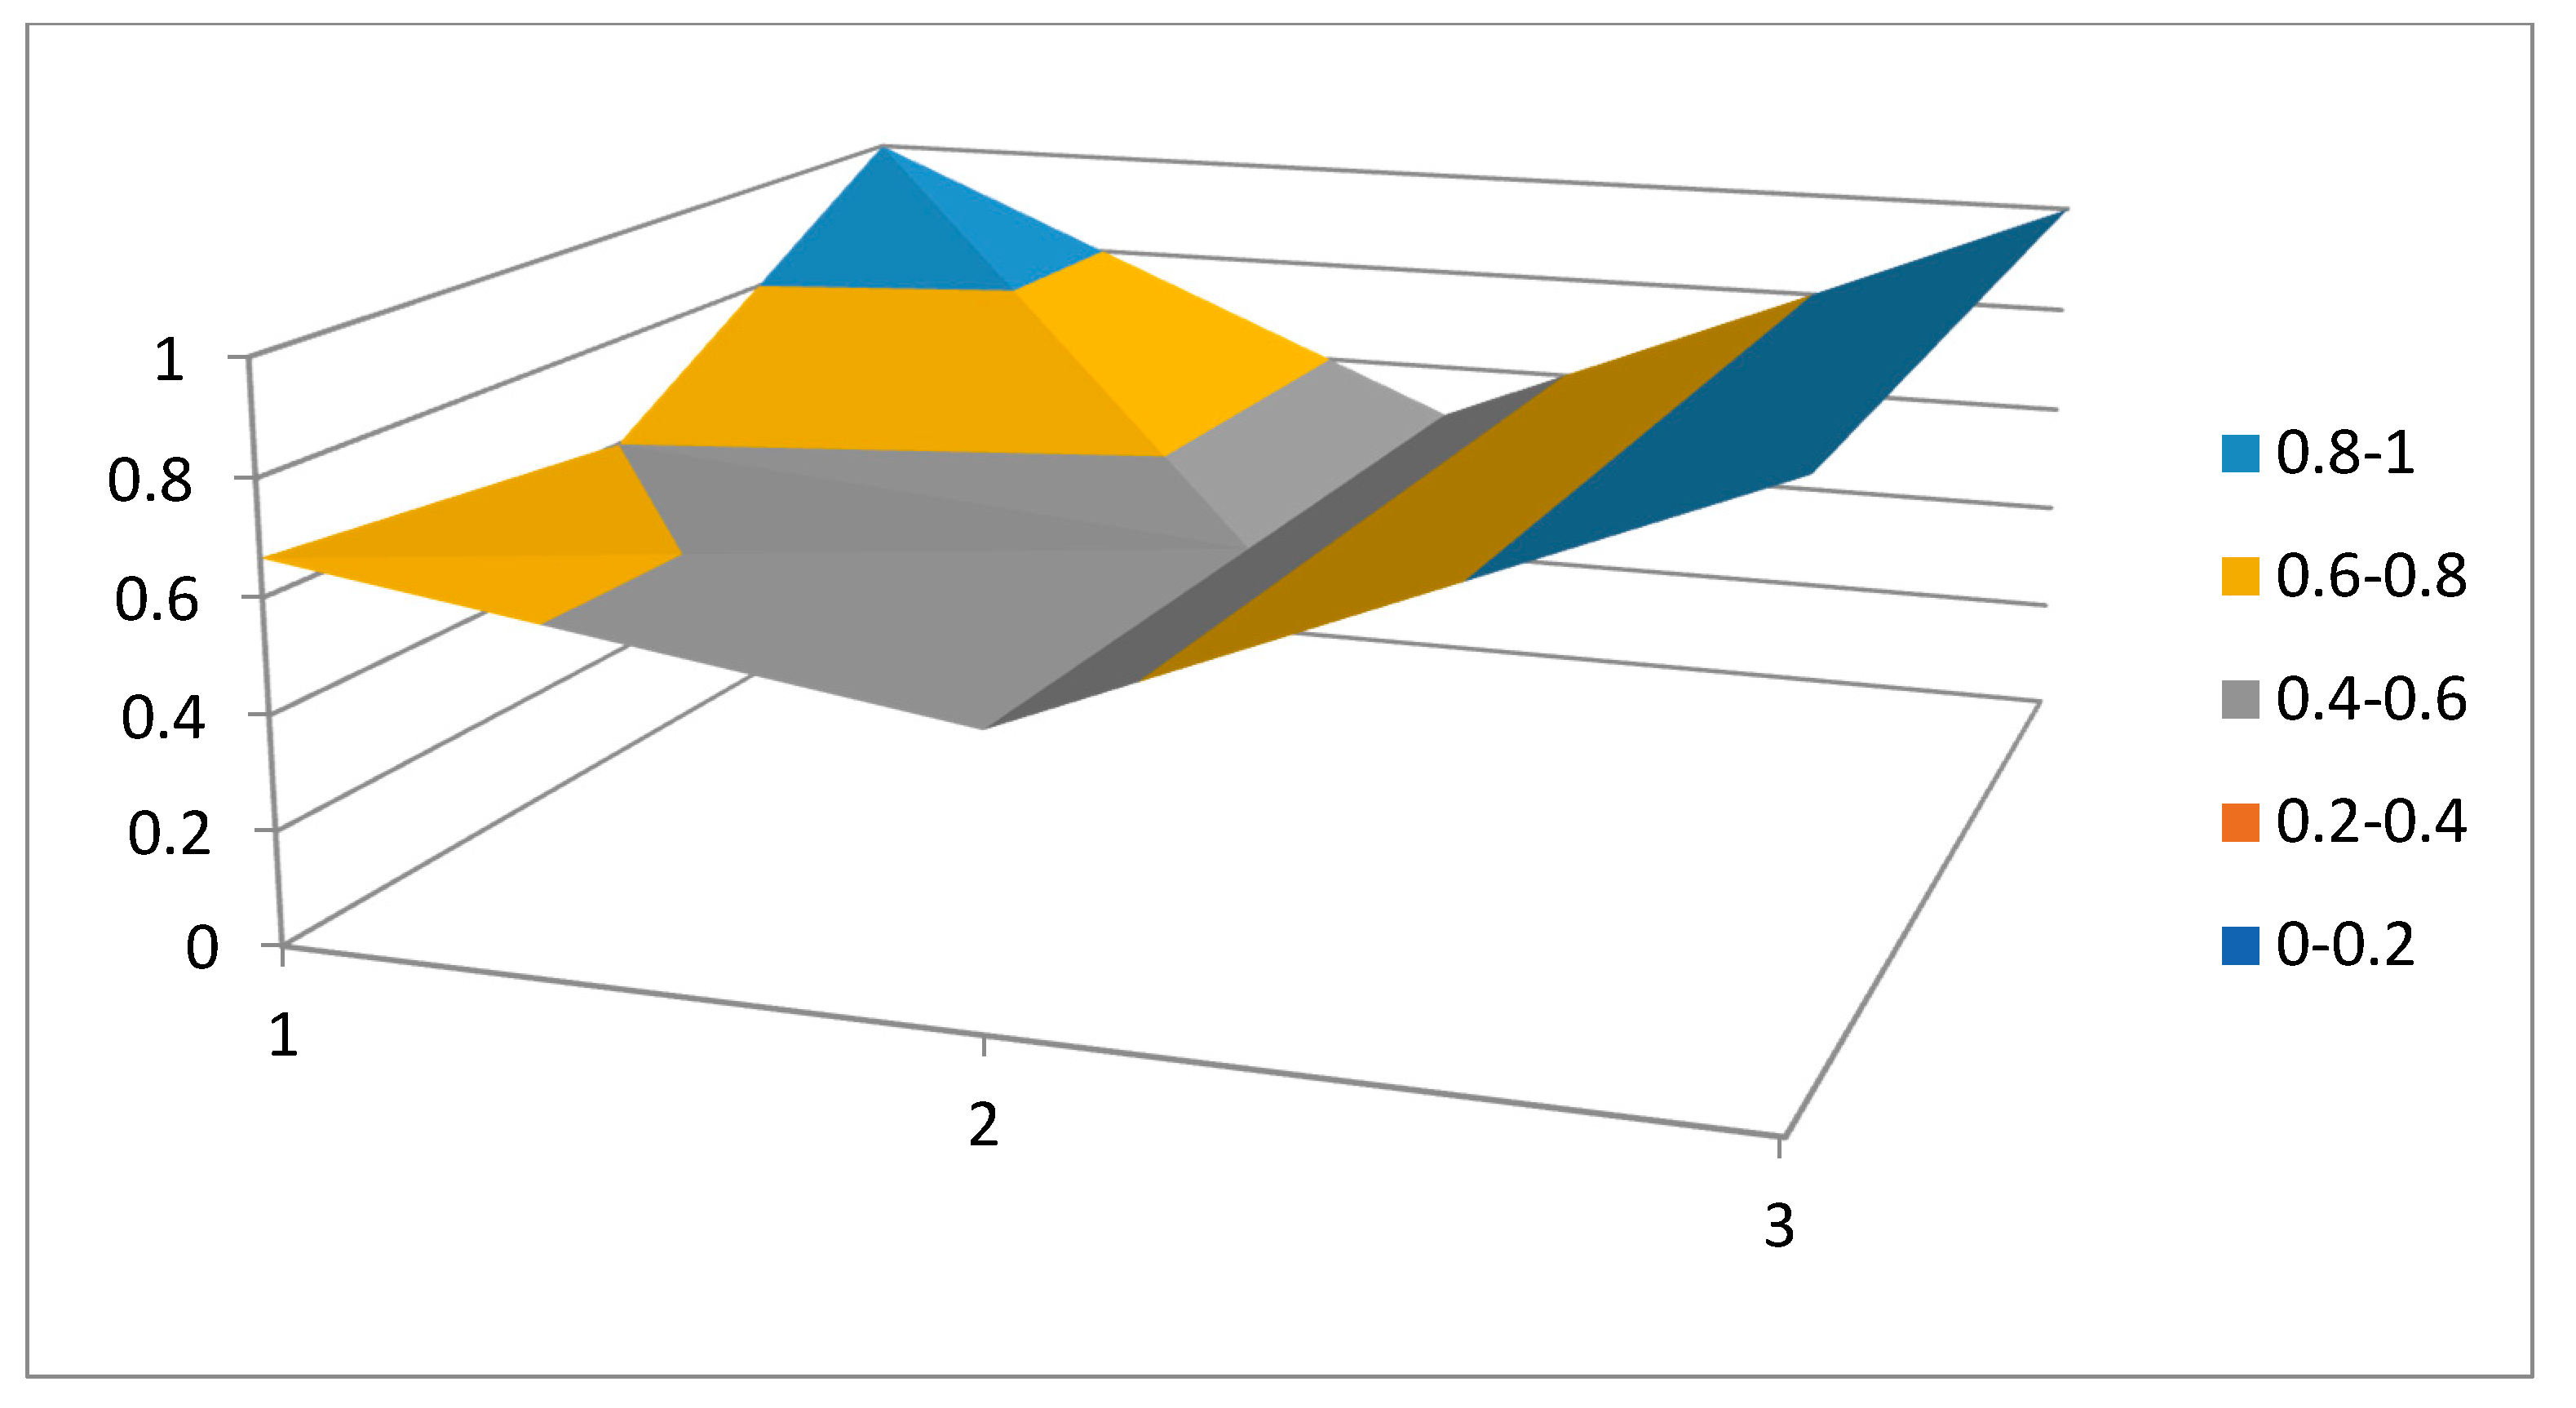
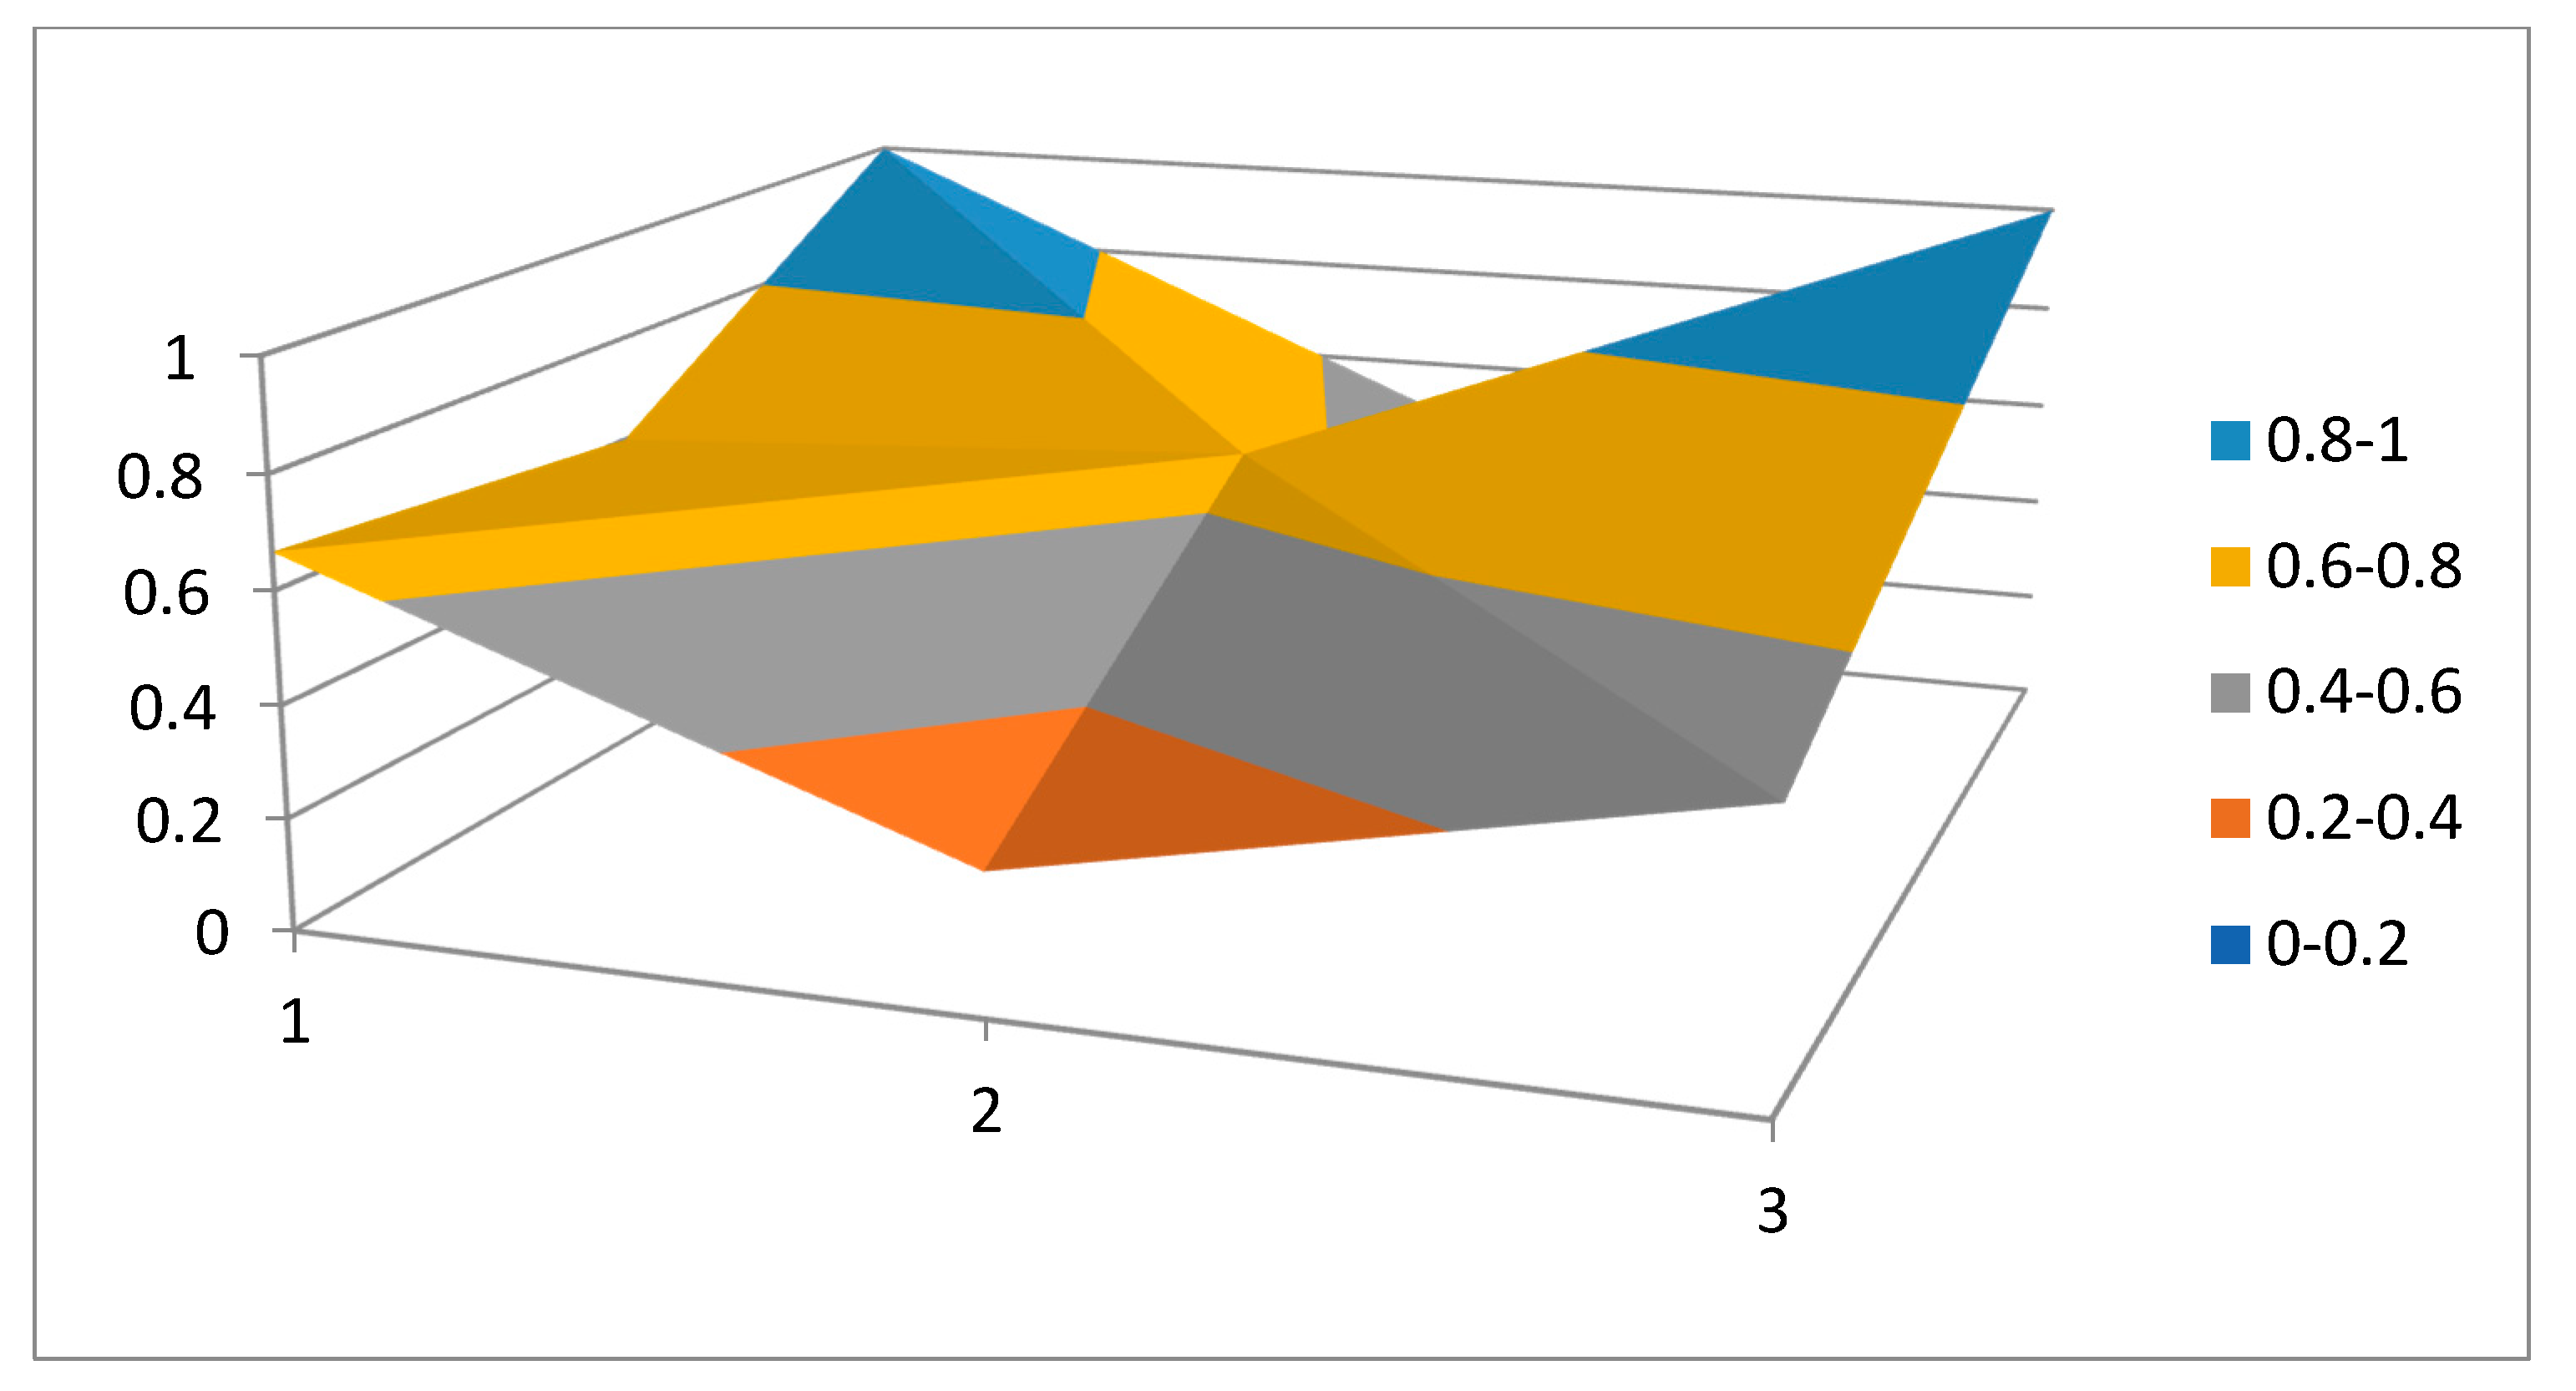
2.4. Construction of PMC Surface
PMC surface can show a PMC index in the form of image, which shows the quantitative evaluation effect of policy. The establishment of a PMC matrix is the basis of PMC surface construction. The text forms a square matrix of order 3 with 9 first-level variables, and then the PMC surface graph is drawn in Microsoft Excel 2019 Mso (16.0.13530.20132) 64-bit. The calculation equation is as follows in Equation (8):
3. Results
By calculating the PMC index of the above five policies, as shown in Figure 4, Figure 5, Figure 6, Figure 7 and Figure 8, it can be concluded that the overall average score of the five policies is 6.78, which is good in the rating table. The policies have basically played a corresponding role, but there are still some aspects that need to be strengthened. Among the five policies, P2 is ‘excellent’, P1, P3 and P4 are ‘good’, and only P5 is ‘acceptable’, with scores of 8.133, 6.8, 6.267, 6.77 and 5.934, respectively.
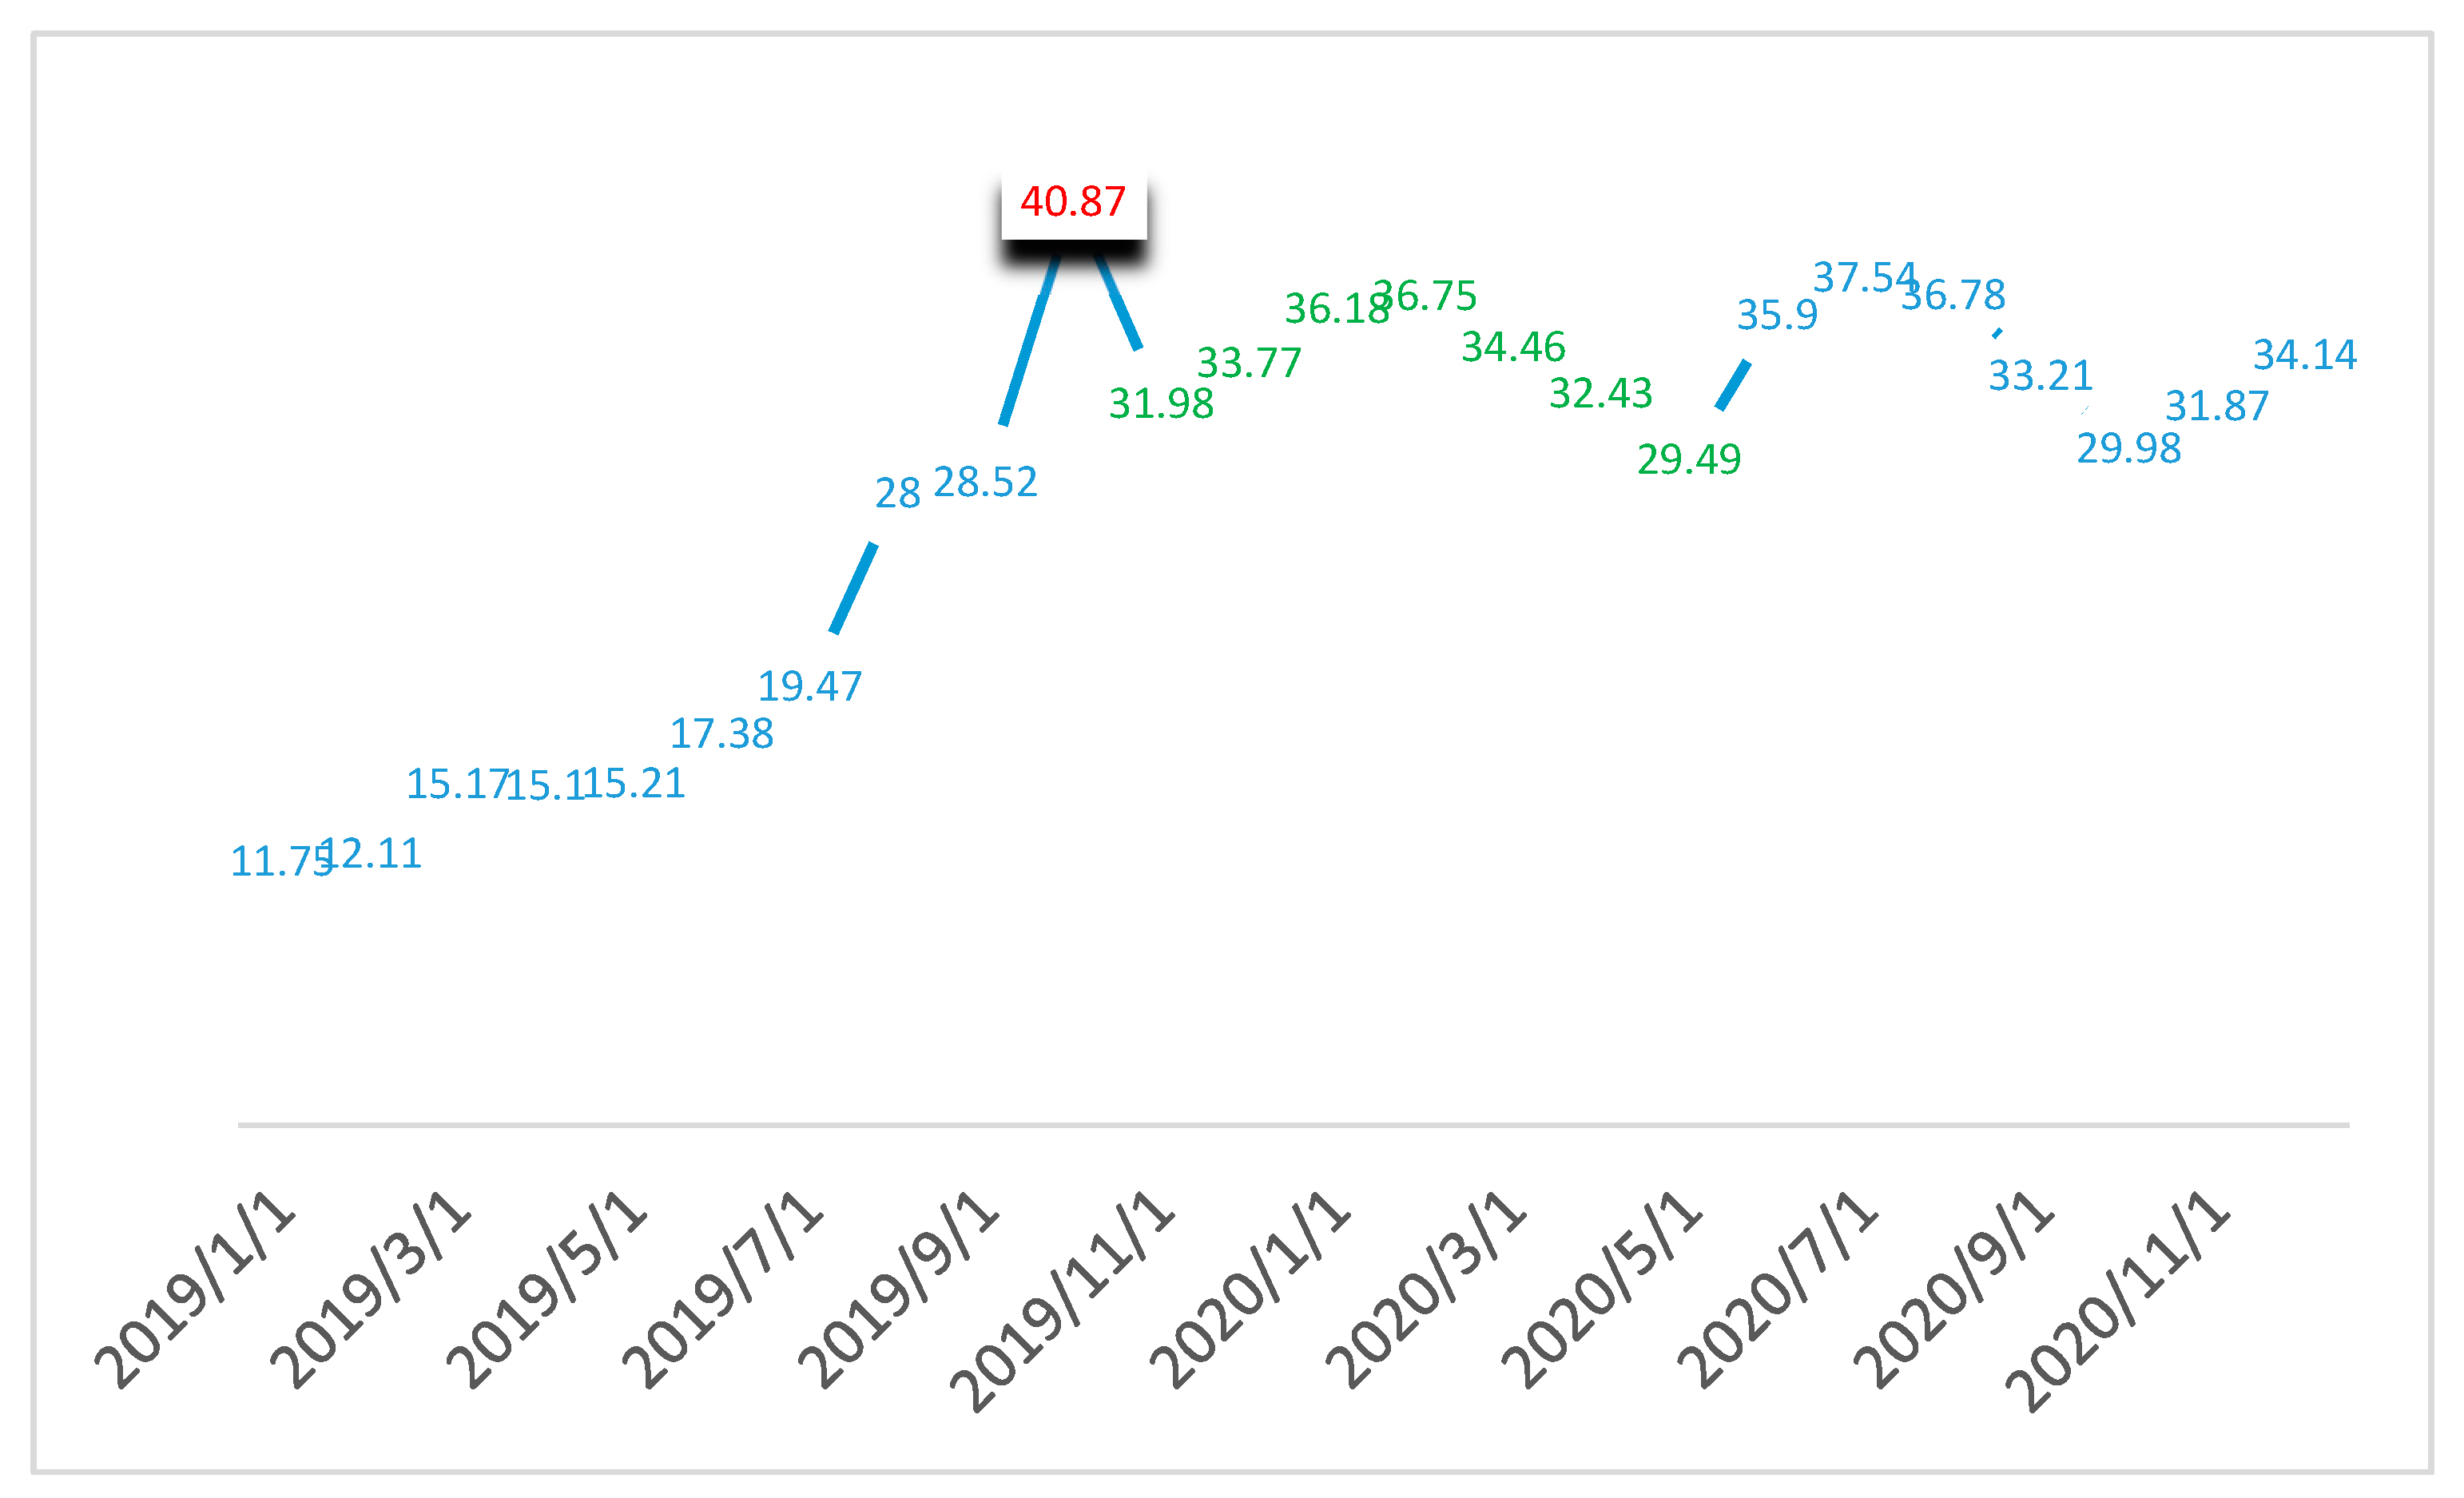
The previous scoring and evaluation of five policies were used to obtain the scores of each policy. Then, whether China’s pork industry policies have a regulatory effect on the price of live pigs, so, according to the introduction of various policies, the relevant live pig prices are crawled to verify the policy’s validity. Based on Figure 9, it can be seen that African swine fever was introduced to China around August 2018. There were only sporadic cases of infection, which were not severe and had not attracted enough attention. Entering 2019, especially during the end of the year, the number of infections across the country increased. As a result, the P2 policy was introduced in September 2019. After introducing the P2 policy, there will be a period for the implementation of the policy. This policy has a more comprehensive approach to China from all angles. The live pig price policy has been regulated, and the results of the adjustment are also significant. It can be seen that since November, the fluctuation of live pig prices has been relatively flat. Under the conditions of large fluctuations in global live pig prices, the Chinese government held the bottom line and controlled its increase, which is much smaller than the increase in international live pig prices. Later, in March 2020, the pig industry policy was promulgated, which is a further supplement to the P1 policy. From the content, the P1 policy is more substantial. These two policies complement and coordinate with each other and jointly regulate the fluctuation of live pig prices. Based on the international background, China’s live pig price policy will inevitably affect global live pig prices. However, starting from the existing domestic conditions, China can use a series of policies to ensure live pigs’ production and adjust abnormal price fluctuations.
Among the five pig price control policies, the opinion on stabilizing pig production, promoting transformation and upgrading, issued by the Chinese State Council in 2019, is the highest score. The possible reason for this is to better deal with the impact of African swine fever on China’s pig industry. In addition, based on the summary of so many years of experience, the policy consideration should be specific and detailed. The one with the lowest score was the sound long-term mechanism of pork market supervision released by industry and commerce in 2007. The possible reason for this is that this policy has a relatively singular target. Although other aspects are also involved, its coverage is small, so it focuses on market supervision while ignoring other aspects, leading to its lowest score. In addition, the ministry of Agriculture and the State Council in Beijing, China issued a more comprehensive policy, covering a wider range, so the score is higher, in the ‘good’ grade.
The selected five policies calculated their respective PMC indexes according to the model. To better compare and analyze the policies on the whole, the corresponding mean values of the nine first-level indexes were further calculated. From a macro perspective, the average value of X1′s policy quality is 0.734. All policies have the characteristics of monitoring, establishment and guidance, but only P2 and P3 have the characteristic of soundness, which indicates that other policies need to be strengthened in terms of improving relevant laws and regulations. The average timeliness of X2 policies is 0.45, and all policies are deficient in effectiveness. Most policies are of a long-term and current year nature, but none of them have a mid-term or short-term nature. It can be seen that the five policies are all based on a long period of time and have long-term policy planning, rather than just for a specific time. At the same time, it also pays attention to solving practical problems this year, but lacks medium- and short-term transitional policies. The mean value of X3 policy measures is 0.833, which is quite high. All five policies are specific in terms of measures. Basically, they include subsidies, insurance, quality, supervision, credit, information and other policies. The average value of X4 policy field is 0.68, P1 has little involvement in social life, P4 and P5 policies lack technology, while P3 and P4 policies include political fields. The mean value of X5 policy link is 0.733. All five policies involve the market link, while P3 and P4 do not include circulation and slaughtering, which need to be strengthened. The average value of X6 policy objects is 0.75, almost all involving farmers, dealers, and relevant management departments. However, P3 does not involve dealers or consumers, resulting in a score of only 0.5, which reduces the average score. In terms of X7 policy evaluation and X9 openness, the mean value is 1, which indicates that the five selected policies have a sufficient basis, clear goals, scientific programs and are all open policies. The mean value of X8 policy is 0.6, all of which have the effect of price regulation, but P1, P3, P4, and P5 lack measures related to structural adjustment.
The above is the overall grasp of the nine first-level indicators, and then the PMC score of the five specific policies will be analyzed one by one and put forward suggestions for improvement. The discussion section below provides a detailed discussion on each of the policies.
4. Discussion
The PMC index of pig price control policy P1 is 6.8, ranking second with ‘good’. Through the interpretation of PMC index and PMC curved surface, we can more accurately analyze the shortcomings of a certain policy, and analyze the problems, which can provide reference for the government to make decisions. In addition to the X1 policy nature, X2 policy prescription and X8 policy effect below the average level, all the others are above or equal to the average level. P1 policy is used mainly to promote and support private enterprises to develop hog production, but there is a lack of specific safeguard measures, and the improvement of laws and regulations also needs to be strengthened. In addition, this policy lacks short-, medium- and long-term planning, and is limited to this year, with timeliness to be strengthened, and lacks structural adjustment. If we want to improve the policy, we can take the above deficiencies as a breakthrough point, improve relevant laws and regulations, improve the guarantee of private enterprises’ pig production, and also have medium- and long-term goals to make the policy more effective. The order of improvement of this policy is: X1.4–x1.2–X2–x8.2. Of course, this is not absolute and is only for reference.
The PMC index of pig price control policy P2 is 8.133, ranking first in the index and being rated as ‘excellent’. It is also the only one of the five policies rated as ‘excellent’. From the policy point of view, there is a lot to be said for it. The background of this policy is the spread of African swine fever around the world, the policy is vital and has also played a role to a certain extent. The only drawback is that the policy is based on the short term, but can have a medium-term plan to promote the pig market expansion. Also, we should pay attention to the survival and development of many pig enterprises, their contribution to the economy is not small and cannot be ignored. If we want to improve the policy, we can make a medium- and long-term plan, pay attention to the pressure faced by large pig farmers, and take more specific subsidy measures to reduce losses. The improvement sequence of this policy is X2.2–X4.1–X6.3, which is for reference only.
The PMC index of pig price control policy P3 is 6.267, ranking the fourth in the index and being rated as ‘good’. The value of five first-level indicators under the policy is lower than the average. In the policy nature of X1, there is a lack of guarantee measures, only emphasizing the stable production of pigs, without providing guarantee measures for consumers and dealers. In the field of X4 policy, there is a lack of social life and political level, and the focus is on hog market economy and technology. More attention should be paid to ordinary people’s lives, especially low-income groups, and both efficiency and fairness should be taken into account. In the X5 policy link, breeding is emphasized while ignoring the circulation and slaughter links, which will lead to the loss of the other and fail to achieve the overall effect optimization. The X6 policy’s target is also more inclined to pig farmers and less involved in dealers and consumers, which are important subjects in the pig market. If we want to supplement this policy, we can pay more attention to consumer groups, pay more attention to circulation and slaughtering links, and increase preferential policies for farmers. This policy’s improvement sequence is X6–X5–x1–x4–x8, which is for reference only.
The PMC index of the pig price control policy P4 is 6.77, ranking the third and being rated as ‘good’, which is in line with the five groups’ average. This policy has some merits. After all, it promoted the stable development of the pig market in 2011. However, from the PMC index perspective, there are still many areas that need to be strengthened. X3 policy measures, X6 policy objects, X7 policy evaluation, and X9 policy disclosure are equal to 1. All these aspects are highlights. But some areas need to be further improved. For example, in the policy nature of X1, there is a lack of perfection of relevant laws and regulations. X2 highlights the long-term plan while ignoring the short- and medium-term goals. X4 lacks technical and political design in the policy field, and only pays attention to the pig market and the social life of ordinary people. X5 policy ignored the links of circulation, slaughtering, and management so that the implementation effect would be greatly reduced. It is suggested to pay attention to relevant laws and regulations to further enhance the technical support. The order of improvement of this policy is X1–X5–x4–x8, which is for reference only.
The PMC index of pig price regulation policy P5 is 5.934, ranking fifth and ‘acceptable’, it is the only policy rated as acceptable. As far as the policy itself is concerned, it has indeed played a role in the pig market’s supervision, but as far as the price control policy of pigs is concerned, there are still many deficiencies. The possible reason is that the policy was issued at the earliest time. The policy has a relatively singular target and is only issued for the industrial and commercial sector, with fewer constraints. Among the nine first-level indicators determined, a total of six indicators are far below the average. Such a result is also inevitable. Particularly, in terms of the timeliness of X2 policy, short-, medium- and long-term plans and goals are lacking and are limited to the current year. In terms of X3 policies and measures, subsidies, insurance, credit and other policies are not involved because the focus is on market regulation. X5 policy also lacks breeding, disease prevention and control, and other links. All of these can be strengthened and improved. The improvement sequence of this policy is X2–X3–x5–x1–x4–x8, which is for reference only.
5. Conclusions
5.1. Summary
With the help of the PMC index model, through the quantitative research on China’s pig price regulation policies from July 2007 to April 2020, it was found that: the research tool system of China’s pig price regulation was basically formed, the overall design of pig price regulation policies was relatively reasonable, and the five policies were all above the acceptable level. The PMC rated one policy as ‘excellent’, three as ‘good’ and only one as ‘acceptable’. On the whole, China’s pig price regulation policy has promoted the development of the pig industry to some extent, but there are still some problems to be improved upon.
5.2. Recommendations
First, division of work and close cooperation among different departments. Of the five policies, only one was published jointly, while the other four were published separately. Because different departments focus on different areas, a single publishing department cannot give consideration to all aspects of the policy and often fails to achieve the overall effect optimization. China’s hog market management system involves pig breeding, circulation, slaughtering, marketing, epidemic prevention and control and other links, with the participation of the Ministry of Agriculture, the Ministry of Commerce, the General Office of the State Council, the National Development and Reform Commission (All in Beijing, China) and other departments. At present, China’s hog price control policies are mainly published separately, and there is a lack of effective coordination among various departments, which makes each policy work in its own way. The management mode of ‘segmentation’ makes it difficult for all policies to form synergy. Too many subjects of policy implementation lead to poor coordination of department responsibilities, the phenomenon of decentralized use and repeated investment of resources coexist, and the policy effect is greatly reduced. Therefore, under the unified leadership of the State Council, we should adhere to the dominant position of the market; give full play to the macro-control function of the government; strengthen the ‘vegetable basket’ mayor responsibility system; emphasize the regulatory mode of territorial management, division of labor and close cooperation, multi department coordination and joint action; and control the market price of pork through credit support, variety subsidies and other forms.
Second, we should adjust the structure of pig industry and carry out appropriate large-scale breeding. The average effect of X8 policy is 0.6. All five policies have the effect of price regulation, but only one policy, P2, involves the adjustment of the industrial structure. Although in the short run, direct price regulation is more effective, the adjustment of the industrial structure is more conducive to maintaining the balance of supply and demand in the hog market in the long run. At present, China’s pig breeding industry has always been dominated by small-scale free-range farming households and pig production lacks scale benefits, which, on the one hand, hinders the improvement of production efficiency, and on the other hand, is not conducive to farmers’ resistance to market risks. Small-scale free-range farmers have a poor ability to cope with market risks and tend to focus on short-term interests. They follow the trend of production, blindly expanding production when the price of pigs rises, and ‘swarm’ to reduce investment when the price falls, which exacerbates the fluctuation of pig market price. Therefore, the Chinese government should pay attention to the adjustment of China’s hog industrial structure, the establishment of high-quality modern pig breeding base, the implementation of appropriate large-scale breeding, and the improvement of pig production’s overall organization. At the same time, it should give full play to the role of pig associations and other industry associations; promote the exchange, cooperation and modernization of the pig breeding industry; and improve the large-scale operation level of the pig breeding industry.
Third, we should establish the operation mode of slaughtering and processing in producing area to reduce the circulation cost of pig industry. The X5 policy link of the mean value of 0.733, in the breeding, circulation, slaughtering, market, disease prevention and control and comprehensive management of the whole price chain link policy five is involved in the market, but neither P3 nor P4 are involved in slaughtering and circulation, which reflects China as a whole in the field of slaughter pig price controls—circulation policy support is not strong enough. In recent years, the large-scale production of pigs in China has focused on the upstream breeding link, but the slaughtering and processing capacity has not been able to keep up. On the one hand, the transportation of live pigs has increased transportation costs, which is not conducive to the added value of the industry. On the other hand, it also increases the hidden danger of meat safety. The establishment of a supply chain operation model with slaughter and processing at the origin as the core, the establishment of slaughterhouses in the producing areas, the improvement of slaughtering and processing capacity in the main producing areas, the strengthening of cold chain infrastructure and the promotion of the development of meat product processing industry can reduce transport costs, promote industrial value-added and guarantee pork food safety.
Lastly, we should ensure that both social efficiency and equity in the consumption of pork by low-income groups. The average of X6 policy objects is 0.75. Four of the five policies involve farmers, distributors, and relevant management departments, indicating that the Chinese government pays attention to improving the pig industry’s development quality and efficiency from the aspects of production and management. However, both P2 and P3 policies did not involve consumers, which lowered the overall average distribution, reflecting that China’s pig price regulation policies need to be strengthened in terms of social equity. It is the responsibility of the government to ensure the supply of pork, stabilize the market price of pigs and reduce the living burden of consumers. We should promptly launch a mechanism to link social assistance and social security standards with price rises, issue temporary price subsidies in a timely manner, increase pork consumption subsidies to the disadvantaged groups and properly arrange basic living conditions for the poor. At the same time, it is necessary to supply and reserve food at designated points, implement the financial aid policy for students from poor families, strengthen the management of student canteens, and in other ways ensure that the price of student canteen food is basically stable.
5.3. Strengths and Limitations
This paper takes 74 policies and regulations of China’s pig price regulation policies from July 2007 to April 2020 as the research object, uses a PMC index model to conduct quantitative evaluation on 74 policies, and selects five representative policies of China’s pig price regulation policies for empirical analysis. In terms of the construction of the indicator system, based on the policy evaluation research of Estrada [2] and the modification combined with the characteristics of China’s pig price regulation policy, 9 first-level indicators and 36 second-level indicators were established. In terms of research methods, based on policy documents, text mining method and LDA subject modeling are used to conduct quantitative analysis and evaluation of pork price regulation policies combined with the PMC index model, which objectively reflects the overall situation of policies and the specific situation of each individual policy.
The significance of using a PMC index model to evaluate China’s pig price regulation policy lies in the PMC index model’s characteristic of traceability. According to PMC surface and PMC index, it can quickly highlight the advantages and disadvantages of a policy and show the characteristics of the policy text in a more intuitive and targeted way. The specific scores of the primary and secondary indexes in the model can help policy makers to quickly identify the weak links of policies and adjust and optimize different types of policies in a targeted way. For policies that are still in the formulation stage, the PMC index model can also be used to identify and evaluate the effectiveness of the policy text in a multi-dimensional manner, so as to provide a basis for the establishment, reform and rejection of China’s pig price regulation policies.
The limitations of this paper are mainly reflected in the determination of variables, and the dimensions and extensibility of variables need to be further studied. In the later stage, the author will adjust and optimize the current PMC index system. On the one hand, some standard variables will be improved to enhance the universality of the PMC index model. On the other hand, some non-standard variables are preset, and specific problems are analyzed to enhance the pertinence of the PMC index model. The following research will further select the hog price control policies of different cities in China, and conduct in-depth analysis on the relationship between specific city characteristics and PMC index. At the same time, it is considered to introduce the synergies between policies into the PMC index method, so that it cannot only evaluate individual policies but also conduct in-depth discussion on the synergies between policies, so as to provide decision-making support for the formulation of relevant policies more comprehensively.
Author Contributions
Conceptualization, Y.L. and C.L.; methodology, Y.L.; software, R.H.; validation, J.L.; formal analysis, J.L.; investigation, R.H.; resources, Y.L.; data curation, R.H.; writing—original draft preparation, R.H.; writing—review and editing, J.X., Y.L.; visualization, J.L.; supervision, C.L.; project administration, Y.L.; funding acquisition, C.L. All authors have read and agreed to the published version of the manuscript.
Funding
This work was supported partly by the MOE (Ministry of Education in China) Project of Humanities and Social Sciences (Project No. 20YJC790069), the National Social Science Foundation of China (Project No. 13CJY104), the Earmarked Fund for Modern Agro-industry Technology Research System (Project No. CARS-23-F01 and No. CARS-21), and Hubei Province Humanities and Social Sciences Key Research Base Dabie Mountain Tourism Economic and Cultural Research Center, under the project “Research on Stability and Countermeasures of China’s Agricultural Virtual Water Trade” Project No. 202014504.
Institutional Review Board Statement
Not applicable.
Informed Consent Statement
Not applicable.
Data Availability Statement
Publicly available datasets were analyzed in this study. This data can be found here: http://law1.law-star.com/.
Acknowledgments
We would also like to express our high gratitude for reviewers for their illuminative suggestions.
Conflicts of Interest
The authors declare no conflict of interest.
References
- Blei, D.M.; Ng, A.Y.; Jordan, M.I. Latent dirichlet allocation. J. Mach. Learn. Res. 2003, 3, 993–1022. [Google Scholar]
- Ruiz Estrada, M.A. Policy modeling: Definition, classification and evaluation. J. Policy Modeling 2011, 33, 523–536. [Google Scholar] [CrossRef]
- Tan, Y.; Zeng, H. Price transmission, reserve regulation and price volatility. China Agric. Econ. Rev. 2019, 11, 355–372. [Google Scholar] [CrossRef] [Green Version]
- Lu, C.; Fang, J.; Fu, S. A New Equilibrium Strategy of Supply and Demand for the Supply Chain of Pig Cycle. Math. Probl. Eng. 2020, 2020, 2093593. [Google Scholar] [CrossRef]
- Ngarava, S.; Mushunje, A. Determinants of pricing objectives and price flexibility policies of pork-based agro-businesses in Mashonaland Central province, Zimbabwe. South Afr. J. Econ. Manag. Sci. 2018, 21, 1–11. [Google Scholar] [CrossRef]
- Öhlund, E.; Hammer, M.; Björklund, J. Managing conflicting goals in pig farming: Farmers’ strategies and perspectives on sustainable pig farming in Sweden. Int. J. Agric. Sustain. 2017, 15, 693–707. [Google Scholar] [CrossRef]
- Zhang, X.; Chu, F.; Yu, X.; Zhou, Y.; Tian, X.; Geng, X.; Yang, J. Changing structure and sustainable development for China’s hog sector. Sustainability 2017, 9, 69. [Google Scholar] [CrossRef] [Green Version]
- Brock, W.A.; Durlauf, S.N.; West, K.D. Model uncertainty and policy evaluation: Some theory and empirics. J. Econom. 2007, 136, 629–664. [Google Scholar] [CrossRef] [Green Version]
- Poland, O.F. Program evaluation and administrative theory. Public Adm. Rev. 1974, 34, 333–338. [Google Scholar] [CrossRef]
- Suchman, E.A. Evaluative Research: Principles and Practice in Public Service & Social Action Programs; Russell Sage Foundation: New York, NY, USA, 1968. [Google Scholar]
- Hannoura, A.P.; Cothren, G.M.; Khairy, W.M. The development of a sustainable development model framework. Energy 2006, 31, 2269–2275. [Google Scholar] [CrossRef]
- Ruiz Estrada, M.A.; Yap, S.F.; Nagaraj, S. Beyond the ceteris paribus assumption: Modeling demand and supply assuming omnia mobilis. Int. J. Econ. Res. 2008, 5, 185–194. [Google Scholar]
- Carreira, C.; Teixeira, P. Entry and exit as a source of aggregate productivity growth in two alternative technological regimes. Struct. Chang. Econ. Dyn. 2011, 22, 135–150. [Google Scholar] [CrossRef]
- Nag, R.; Corley, K.G.; Gioia, D.A. The intersection of organizational identity, knowledge, and practice: Attempting strategic change via knowledge grafting. Acad. Manag. J. 2007, 50, 821–847. [Google Scholar] [CrossRef]
- Libecap, G.D. Economic variables and law development: A case of western mineral property. Econ. Hist. J. 1978, 38, 23–37. [Google Scholar] [CrossRef]
- Prior, L.; Hughes, D.; Peckham, S. The discursive turn in policy analysis and the validation of policy stories. J. Soc. Policy 2012, 41, 271–289. [Google Scholar] [CrossRef] [Green Version]
- Cotton, M.; Rattle, I.; Van Alstine, J. Shale gas policy in the United Kingdom: An argumentative discourse analysis. Energy Policy 2014, 73, 427–438. [Google Scholar] [CrossRef]
- Vandevijvere, S.; Dominick, C.; Devi, A.; Swinburn, B. The healthy food environment policy index: Findings of an expert panel in New Zealand. Bull. World Health Organ. 2015, 93, 294–302. [Google Scholar] [CrossRef]
- Pattyn, V.; Brans, M. Organisational analytical capacity: Policy evaluation in Belgium. Policy Soc. 2015, 34, 183–196. [Google Scholar] [CrossRef] [Green Version]
- Ferrer, J.G.; Rigla, F.R.; Figueroa, C.V. Application of Social Policy Index (SPI) Amended in Three OECD Countries: Finland, Spain and Mexico. Soc. Indic. Res. 2016, 127, 529–539. [Google Scholar] [CrossRef]
- Turpin, N.; Ten Berge, H.; Grignani, C.; Guzmán, G.; Vanderlinden, K.; Steinmann, H.-H.; Siebielec, G.; Spiegel, A.; Perret, E.; Ruysschaert, G. An assessment of policies affecting Sustainable Soil Management in Europe and selected member states. Land Use Policy 2017, 66, 241–249. [Google Scholar] [CrossRef]
- Dantas, G.d.A.; de Castro, N.J.; Dias, L.; Antunes, C.H.; Vardiero, P.; Brandão, R.; Rosental, R.; Zamboni, L. Public policies for smart grids in Brazil. Renew. Sustain. Energy Rev. 2018, 92, 501–512. [Google Scholar] [CrossRef]
- Stolbova, V.; Monasterolo, I.; Battiston, S. A financial macro-network approach to climate policy evaluation. Ecol. Econ. 2018, 149, 239–253. [Google Scholar] [CrossRef] [Green Version]
- Elizalde-San Miguel, B.; Gandasegui, V.D.; García, M.T.S. Family Policy Index: A tool for policy makers to increase the effectiveness of family policies. Soc. Indic. Res. 2019, 142, 387–409. [Google Scholar] [CrossRef]
Figure 1.
Policy attribute statistics chart.

Figure 2.
Keyword Network Map of China’s Live Pig Price Control Policy.

Figure 3.
Establishment of PMC Index System.

Figure 4.
PMC surface of pig price control policy P1.

Figure 5.
PMC surface of pig price control policy P2.

Figure 6.
PMC surface of pig price regulation policy P3.

Figure 7.
PMC surface of pig price control policy P4.

Figure 8.
PMC surface of pig price regulation policy P5.

Figure 9.
Line chart of monthly fluctuations of China’s live pig prices. Data source: https://zhujia.zhuwang.cc/zhuping.shtml.
Figure 9.
Line chart of monthly fluctuations of China’s live pig prices. Data source: https://zhujia.zhuwang.cc/zhuping.shtml.


Table 1.
Policy Type and Numbers.
| Policy Type | Number |
|---|---|
| Farming Policy | 22 |
| Circulation Policy | 1 |
| Slaughter Policy | 1 |
| Market regulation Policy | 14 |
| Disease Prevention and Control Policy | 8 |
| Investment Policy | 5 |
| Infrastructure Policy | 15 |
| Structural Policy | 17 |
| Income Policy | 8 |
| Fiscal Policy | 35 |
| Employment Policy | 7 |
| Poverty Alleviation Policy | 13 |
| Ecological Policy | 7 |
| Financial Insurance Policy | 15 |
| Land Use Policy | 7 |
Table 2.
China’s pig price regulation policy text key words frequency statistics table.
| Serial Number | Keywords | Frequency | The Serial Number | Keywords | Frequency |
|---|---|---|---|---|---|
| 1 | Subsidies for growing superior seed varieties | 189 | 21 | Improved varieties | 31 |
| 2 | Infrastructure | 134 | 22 | Laws and regulations | 29 |
| 3 | Leading enterprises | 118 | 23 | Market subject | 27 |
| 4 | Market supply | 104 | 24 | The public service | 26 |
| 5 | Disease prevention and control | 99 | 25 | Scale operation | 25 |
| 6 | Production capacity | 80 | 26 | Pig stock | 25 |
| 7 | The quality of the product | 67 | 27 | The cost of production | 25 |
| 8 | Market regulation | 64 | 28 | The insurance company | 24 |
| 9 | The price ratios between pork and grain | 62 | 29 | Mayor responsibility system | 22 |
| 10 | Financial institutions | 58 | 30 | Industry association | 21 |
| 11 | Monitoring and early warning | 49 | 31 | The market demand | 21 |
| 12 | The management system | 49 | 32 | Mechanism of interest linkage | 20 |
| 13 | Technology popularization | 47 | 33 | Management regulations | 19 |
| 14 | Service system | 46 | 34 | Mode of production | 19 |
| 15 | Policies and measures | 41 | 35 | Market circulation | 19 |
| 16 | Slaughter and processing | 37 | 36 | Subsidy for breeding sows | 19 |
| 17 | Illegal behavior | 34 | 37 | Production and marketing docking | 17 |
| 18 | The market order | 34 | 38 | Data sharing | 16 |
| 19 | A long-term mechanism | 32 | 39 | Breeding base | 15 |
| 20 | Organization adjustment | 31 | 40 | Circulation cost | 6 |
Table 3.
LDA Topic Modeling Results.
| Theme Settings | The Theme Describes | Indicators to Join |
|---|---|---|
| 1. Infrastructure | 1.1 production | No |
| 1.2 base | ||
| 1.3 strengthening | ||
| 1.4 standardized | ||
| 1.5 establish | ||
| 2. Information flows | 2.1 information | Yes |
| 2.2 data | ||
| 2.3 system | ||
| 2.4 market | ||
| 2.5 release | ||
| 3. Regional planning | 3.1 region | No |
| 3.2 area | ||
| 3.3 focus | ||
| 3.4 planning | ||
| 3.5 demonstration | ||
| 3.6 layout | ||
| 4. Quality control | 4.1 quality | Yes |
| 4.2 brand | ||
| 4.3 security | ||
| 4.4 improved variety | ||
| 4.5 high quality | ||
| 4.6 guarantee | ||
| 5. Price monitoring | 5.1 monitoring | No |
| 5.2 price | ||
| 5.3 mechanism | ||
| 5.4 guide | ||
| 5.5 sound |
Table 4.
Comparison Table of China’s Pig price control Policy Variables and Indexes.
| Level Indicators | The Secondary Indicators | Define | |
|---|---|---|---|
| X1 Nature of the policy | X1:1 | monitoring | Judge whether the policy has the nature of monitoring and warning for the future market |
| X1:2 | guarantee | Judge whether the policy has safeguard function | |
| X1:3 | establish | Judge whether the policy involves the establishment of a breeding base and other mechanisms | |
| X1:4 | sound | Judge whether the policy involves the improvement of relevant laws and regulations | |
| X1:5 | guide | Judge whether the policy involves guiding the hog market price to stabilize | |
| X1:6 | other | Judge if the policy is of a different nature (such as an emergency) | |
| X2 Policy limitation | X2:1 | for a long time | The policy is longer than 5 years old |
| X2:2 | metaphase | The policy prescription is 3–5 years | |
| X2:3 | in the short term | The policy is valid for 1–3 years | |
| X2:4 | in this year | The policy covers only this year | |
| X3 Policies and measures | X3:1 | subsidies | Judge whether it involves subsidies for superior seeds, subsidies for large counties of pigs and other incentives |
| X3:2 | insurance | Judge whether the policy involves measures such as agricultural insurance | |
| X3:3 | quality | Judge whether the policy has meat food safety and other quality assurance | |
| X3:4 | regulatory | Judge whether the policy involves the hog market regulation and other contents | |
| X3:5 | credit | Judge whether the policy has credit support and other financial measures | |
| X3:6 | information | Judge whether the policy involves the information flow of the production, supply and marketing system | |
| X4 Policy areas | X4:1 | economic | Judge whether the policy will contribute to economic growth (in terms of pig industry) |
| X4:2 | social life | Judge whether the policy affects people’s social life (pork consumption) | |
| X4:3 | technology | Judge whether the policy involves new technologies in the pig industry | |
| X4:4 | politics | Judge if the policy has a political component | |
| X4:5 | environment | Judge if the policy has environmental implications (e.g., livestock manure disposal) | |
| X5 Policy link | X5:1 | farming | Judge whether the policy involves farming |
| X5:2 | circulation | Judge whether the policy involves circulation | |
| X5:3 | slaughter | Determine if the policy involves slaughtering | |
| X5:4 | market | Judge whether the policy involves market trading | |
| X5:5 | disease prevention and control | Judge whether the policy involves the link of pig disease prevention and control | |
| X5:6 | integrated management | Judge whether the policy involves integrated management | |
| X6 Policy object | X6:1 | farmers | Judge whether the policy involves pig farmers |
| X6:2 | dealers | Judge if the policy involves dealers | |
| X6:3 | consumers | Judge if the policy involves consumers | |
| X6:4 | management department, | Judge whether the policy involves agriculture bureau, industrial and commercial bureau and other relevant administrative departments | |
| X7 Policy evaluation | X7:1 | on the basis of fully | Judge whether the policy is based on sufficient evidence |
| X7:2 | specific goals | Judge whether the policy’s objectives are clear | |
| X7:3 | scheme of science | Judge whether the policy is scientific | |
| X8 Policy role | X8:1 | price controls | Judge whether the policy has played a role in price regulation |
| X8:2 | structural adjustment | Judge whether the policy has the effect of industrial structure adjustment | |
| X9 Whether the public | - | Judge if the policy is open | |
Table 5.
Pig price control policy rating table.
| PMC Score | 0–3.99 | 4–5.99 | 6–7.99 | 8–9 |
| level | bad | acceptable | good | excellent |
Table 6.
Summary table of pig price control policies.
| Serial Number | Policy | Dispatch Time |
|---|---|---|
| P1 | Implementation Opinions of the National Development and Reform Commission and the Ministry of Agriculture and Rural Affairs on supporting private enterprises in developing pig production and related industries | 10 March 2020 |
| P2 | Opinions of the General Office of the State Council on Stabilizing Pig production and Promoting Transformation and Upgrading | 6 September 2019 |
| P3 | Notice of the Ministry of Agriculture on promoting stable, healthy, and sustainable development of pig production and stabilizing market Supply | 1 January 2011 |
| P4 | Notice of the General Office of the State Council on Promoting stable, Healthy and Sustainable Development of Pig Production to prevent large Fluctuations in market Supply and price | 27 July 2011 |
| P5 | Guidelines of the State Administration for Industry and Commerce on Further Establishing and improving the Long-term Supervision Mechanism of the Pork Market | 23 August 2007 |
Table 7.
Multiple input and output table.
| X1 | X2 | |||||||||
|---|---|---|---|---|---|---|---|---|---|---|
| X1.1 | X1.2 | X1.3 | X1.4 | X1.5 | X1.6 | X2.1 | X2.2 | X2.3 | X2.4 | |
| P1 | 1 | 0 | 1 | 0 | 1 | 1 | 0 | 0 | 0 | 1 |
| P2 | 1 | 1 | 1 | 1 | 1 | 1 | 1 | 0 | 1 | 1 |
| P3 | 1 | 0 | 1 | 1 | 1 | 0 | 1 | 0 | 0 | 1 |
| P4 | 1 | 1 | 1 | 0 | 1 | 0 | 1 | 0 | 0 | 1 |
| P5 | 1 | 1 | 0 | 0 | 1 | 1 | 0 | 0 | 0 | 1 |
| - | X3 | |||||||||
| X3.1 | X3.2 | X3.3 | X3.4 | X3.5 | X3.6 | |||||
| P1 | 1 | 1 | 1 | 1 | 1 | 1 | - | - | - | - |
| P2 | 1 | 1 | 0 | 1 | 1 | 1 | - | - | - | - |
| P3 | 1 | 1 | 1 | 1 | 0 | 1 | - | - | - | - |
| P4 | 1 | 1 | 1 | 1 | 1 | 1 | - | - | - | - |
| P5 | 0 | 0 | 1 | 1 | 0 | 1 | - | - | - | - |
| - | X4 | |||||||||
| - | X4.1 | X4.2 | X4.3 | X4.4 | X4.5 | |||||
| P1 | 1 | 0 | 1 | 1 | 1 | - | - | - | - | - |
| P2 | 0 | 1 | 1 | 1 | 1 | - | - | - | - | - |
| P3 | 1 | 0 | 1 | 0 | 1 | - | - | - | - | - |
| P4 | 1 | 1 | 0 | 0 | 1 | - | - | - | - | - |
| P5 | 1 | 1 | 0 | 1 | 0 | - | - | - | - | - |
| - | X5 | X6 | ||||||||
| X5.1 | X5.2 | X5.3 | X5.4 | X5.5 | X5.6 | X6.1 | X6.2 | X6.3 | X6.4 | |
| P1 | 1 | 1 | 1 | 1 | 1 | 0 | 1 | 1 | 1 | 0 |
| P2 | 1 | 1 | 1 | 1 | 1 | 1 | 1 | 1 | 0 | 1 |
| P3 | 1 | 0 | 0 | 1 | 1 | 1 | 1 | 0 | 0 | 1 |
| P4 | 1 | 0 | 0 | 1 | 1 | 0 | 1 | 1 | 1 | 1 |
| P5 | 0 | 1 | 1 | 1 | 0 | 1 | 0 | 1 | 1 | 1 |
| - | X7 | X8 | X9 | |||||||
| X7.1 | X7.2 | X7.3 | X8.1 | X8.2 | X9.1 | |||||
| P1 | 1 | 1 | 1 | 1 | 0 | 1 | - | - | - | - |
| P2 | 1 | 1 | 1 | 1 | 1 | 1 | - | - | - | - |
| P3 | 1 | 1 | 1 | 1 | 0 | 1 | - | - | - | - |
| P4 | 1 | 1 | 1 | 1 | 0 | 1 | - | - | - | - |
| P5 | 1 | 1 | 1 | 1 | 0 | 1 | - | - | - | - |
Table 8.
Summary of PMC index of five pig price control policies.
| Primary Variable | P1 | P2 | P3 | P4 | P5 | Mean Value |
|---|---|---|---|---|---|---|
| X1 | 0.667 | 1 | 0.667 | 0.667 | 0.667 | 0.734 |
| X2 | 0.25 | 0.75 | 0.5 | 0.5 | 0.25 | 0.45 |
| X3 | 1 | 0.833 | 0.833 | 1 | 0.5 | 0.833 |
| X4 | 0.8 | 0.8 | 0.6 | 0.6 | 0.6 | 0.68 |
| X5 | 0.833 | 1 | 0.667 | 0.5 | 0.667 | 0.733 |
| X6 | 0.75 | 0.75 | 0.5 | 1 | 0.75 | 0.75 |
| X7 | 1 | 1 | 1 | 1 | 1 | 1 |
| X8 | 0.5 | 1 | 0.5 | 0.5 | 0.5 | 0.6 |
| X9 | 1 | 1 | 1 | 1 | 1 | 1 |
| Total score | 6.800 | 8.133 | 6.267 | 6.770 | 5.934 | 6.780 |
| Ranking | 2 | 1 | 4 | 3 | 5 | - |
| Level | good | excellent | good | good | acceptable | - |
Publisher’s Note: MDPI stays neutral with regard to jurisdictional claims in published maps and institutional affiliations. |
© 2021 by the authors. Licensee MDPI, Basel, Switzerland. This article is an open access article distributed under the terms and conditions of the Creative Commons Attribution (CC BY) license (http://creativecommons.org/licenses/by/4.0/).
Share and Cite
MDPI and ACS Style
Li, Y.; He, R.; Liu, J.; Li, C.; Xiong, J. Quantitative Evaluation of China’s Pork Industry Policy: A PMC Index Model Approach. Agriculture 2021, 11, 86. https://0-doi-org.brum.beds.ac.uk/10.3390/agriculture11020086
AMA Style
Li Y, He R, Liu J, Li C, Xiong J. Quantitative Evaluation of China’s Pork Industry Policy: A PMC Index Model Approach. Agriculture. 2021; 11(2):86. https://0-doi-org.brum.beds.ac.uk/10.3390/agriculture11020086
Chicago/Turabian StyleLi, Youzhu, Rui He, Jinsi Liu, Chongguang Li, and Jason Xiong. 2021. "Quantitative Evaluation of China’s Pork Industry Policy: A PMC Index Model Approach" Agriculture 11, no. 2: 86. https://0-doi-org.brum.beds.ac.uk/10.3390/agriculture11020086
Note that from the first issue of 2016, this journal uses article numbers instead of page numbers. See further details here.