Article

Development of a Portable Interface System Sharing the Positioning and Heading Information to Support a Berthing Vessel

1
Graduate School of Engineering, Soka University, Tokyo 192-8577, Japan
2
Department of Mechanical System Engineering, Pukyong National University, Busan 48513, Korea
*
Authors to whom correspondence should be addressed.
J. Mar. Sci. Eng. 2022, 10(11), 1637; https://0-doi-org.brum.beds.ac.uk/10.3390/jmse10111637
Submission received: 29 September 2022 / Revised: 18 October 2022 / Accepted: 20 October 2022 / Published: 3 November 2022
(This article belongs to the Special Issue Control and Stability of Ship Motions)

Abstract

:
The study develops a portable interface system to inform berthing operators of the position and heading in relation to the quay when berthing a large vessel equipped with distance-measuring instruments. A portable interface system is indispensable for preventing collisions and improving the efficiency of berthing operations because it allows operators to intuitively grasp the movement status of the vessel based on the distance data measured during berthing. These data can not only be converted into the current position and heading of the vessel relative to the quay, but can also be visualized to predict the movement and speed of the vessel in a few seconds. Therefore, we developed a visualization system using Rviz, a 3D model visualization tool for a robot operating system, and verified the necessity for an interface system through simulations and experiments using a model vessel. Furthermore, we extended the function of the visualization interface using a wireless network, developed a web application to display the vessel’s positioning information on multiple operators’ terminals, and verified the drawing stability at 10 Hz using the extended application.

1. Introduction

The berthing process for loading and unloading large vessels in a port can be simplified as shown in Figure 1. The pilot in Figure 1a guides the vessel by radio to a specific wharf in the harbor, and the tugboat on the left in Figure 1b pushes the vessel to approach the wharf side. Once approaching that wharf at a certain distance, the vessel is moored to a mooring post by the wharf-side staff as shown in Figure 1c, and after fully berthing, as shown in Figure 1d, cargo handling is performed. In particular, those involved in these processes must pay considerable attention to the vessel’s relative position to the quay, such as the vessel’s attitude and course. Natural disturbances, in addition to the fatigue caused by long hours of berthing, not only reduce work efficiency and safety, but also lead to economic losses due to tragic collisions. To prevent such accidents, a visualization system is necessary for operators who facilitate the berthing of large vessels.
Several studies on this subject have been conducted [2,3], but most of them require that the reflectors, transducers, and other targets associated with the system be installed onshore. Although this improves the robustness of the system, it leads to a lack of versatility and universality because the system cannot be used on docks where the associated equipment is not installed. This problem can be solved if the pilot can specify the dockside target and marker required by the system, as shown by Y. Mizuchi [4]. In this study, the system configuration of the interface is based on the premise of reference [4] in specifying shore-side targets; however, notably, the markers are left as they are in this study to verify the robustness of the system.
The distance-measuring instruments used in the interface system have advantages, such as real-time tracking and resistance to weather changes [5,6], but their data are given in numerical values similar to ordinary distance-measuring instruments. Thus, it is difficult for operators or workers to determine the berthing status of large vessels. Therefore, it is necessary to design and develop an interface system that the operator can easily understand. To achieve this, it is effective to visualize information, such as the relative position and destination of the vessel, i.e., the approach speed and the movement vector to the quay, in a way that the operators can intuitively know the situation on a portable terminal. Figure 2 shows a schematic of a portable interface system that attempts to achieve this. This system is an interface for which numerical data measured from two distance-measuring instruments mounted on a large vessel are visualized by Rviz’s 3D model to facilitate the vessel’s berthing for all related operators, such as quayside, pilotage, and tugboats. Here, Rviz is a visualization tool for a robot operating system (ROS) [7] to draw numerical distance data measured using two measuring instruments. Additionally, the interface system extends the functionality of the visualization interface to portable terminals in the hands of operators or workers via a wireless network. Thus, a portable interface system is complete when it can be simultaneously used as a communication tool for operators and workers as needed. In this study, we propose a portable interface system that can determine the positional relationship, location, and orientation between a large ship and wharf for berthing by installing two sets of distance-measuring instruments [4,8,9] based on a stereo camera system on the vessel side, as shown in Figure 2. The background to the development of this system is that, while terminal devices that serve as interface systems [10] are widespread in many industrial fields in general society, there are relatively few interface systems that can be shared among workers in large-scale operations involving many workers, such as port-related berthing operations.

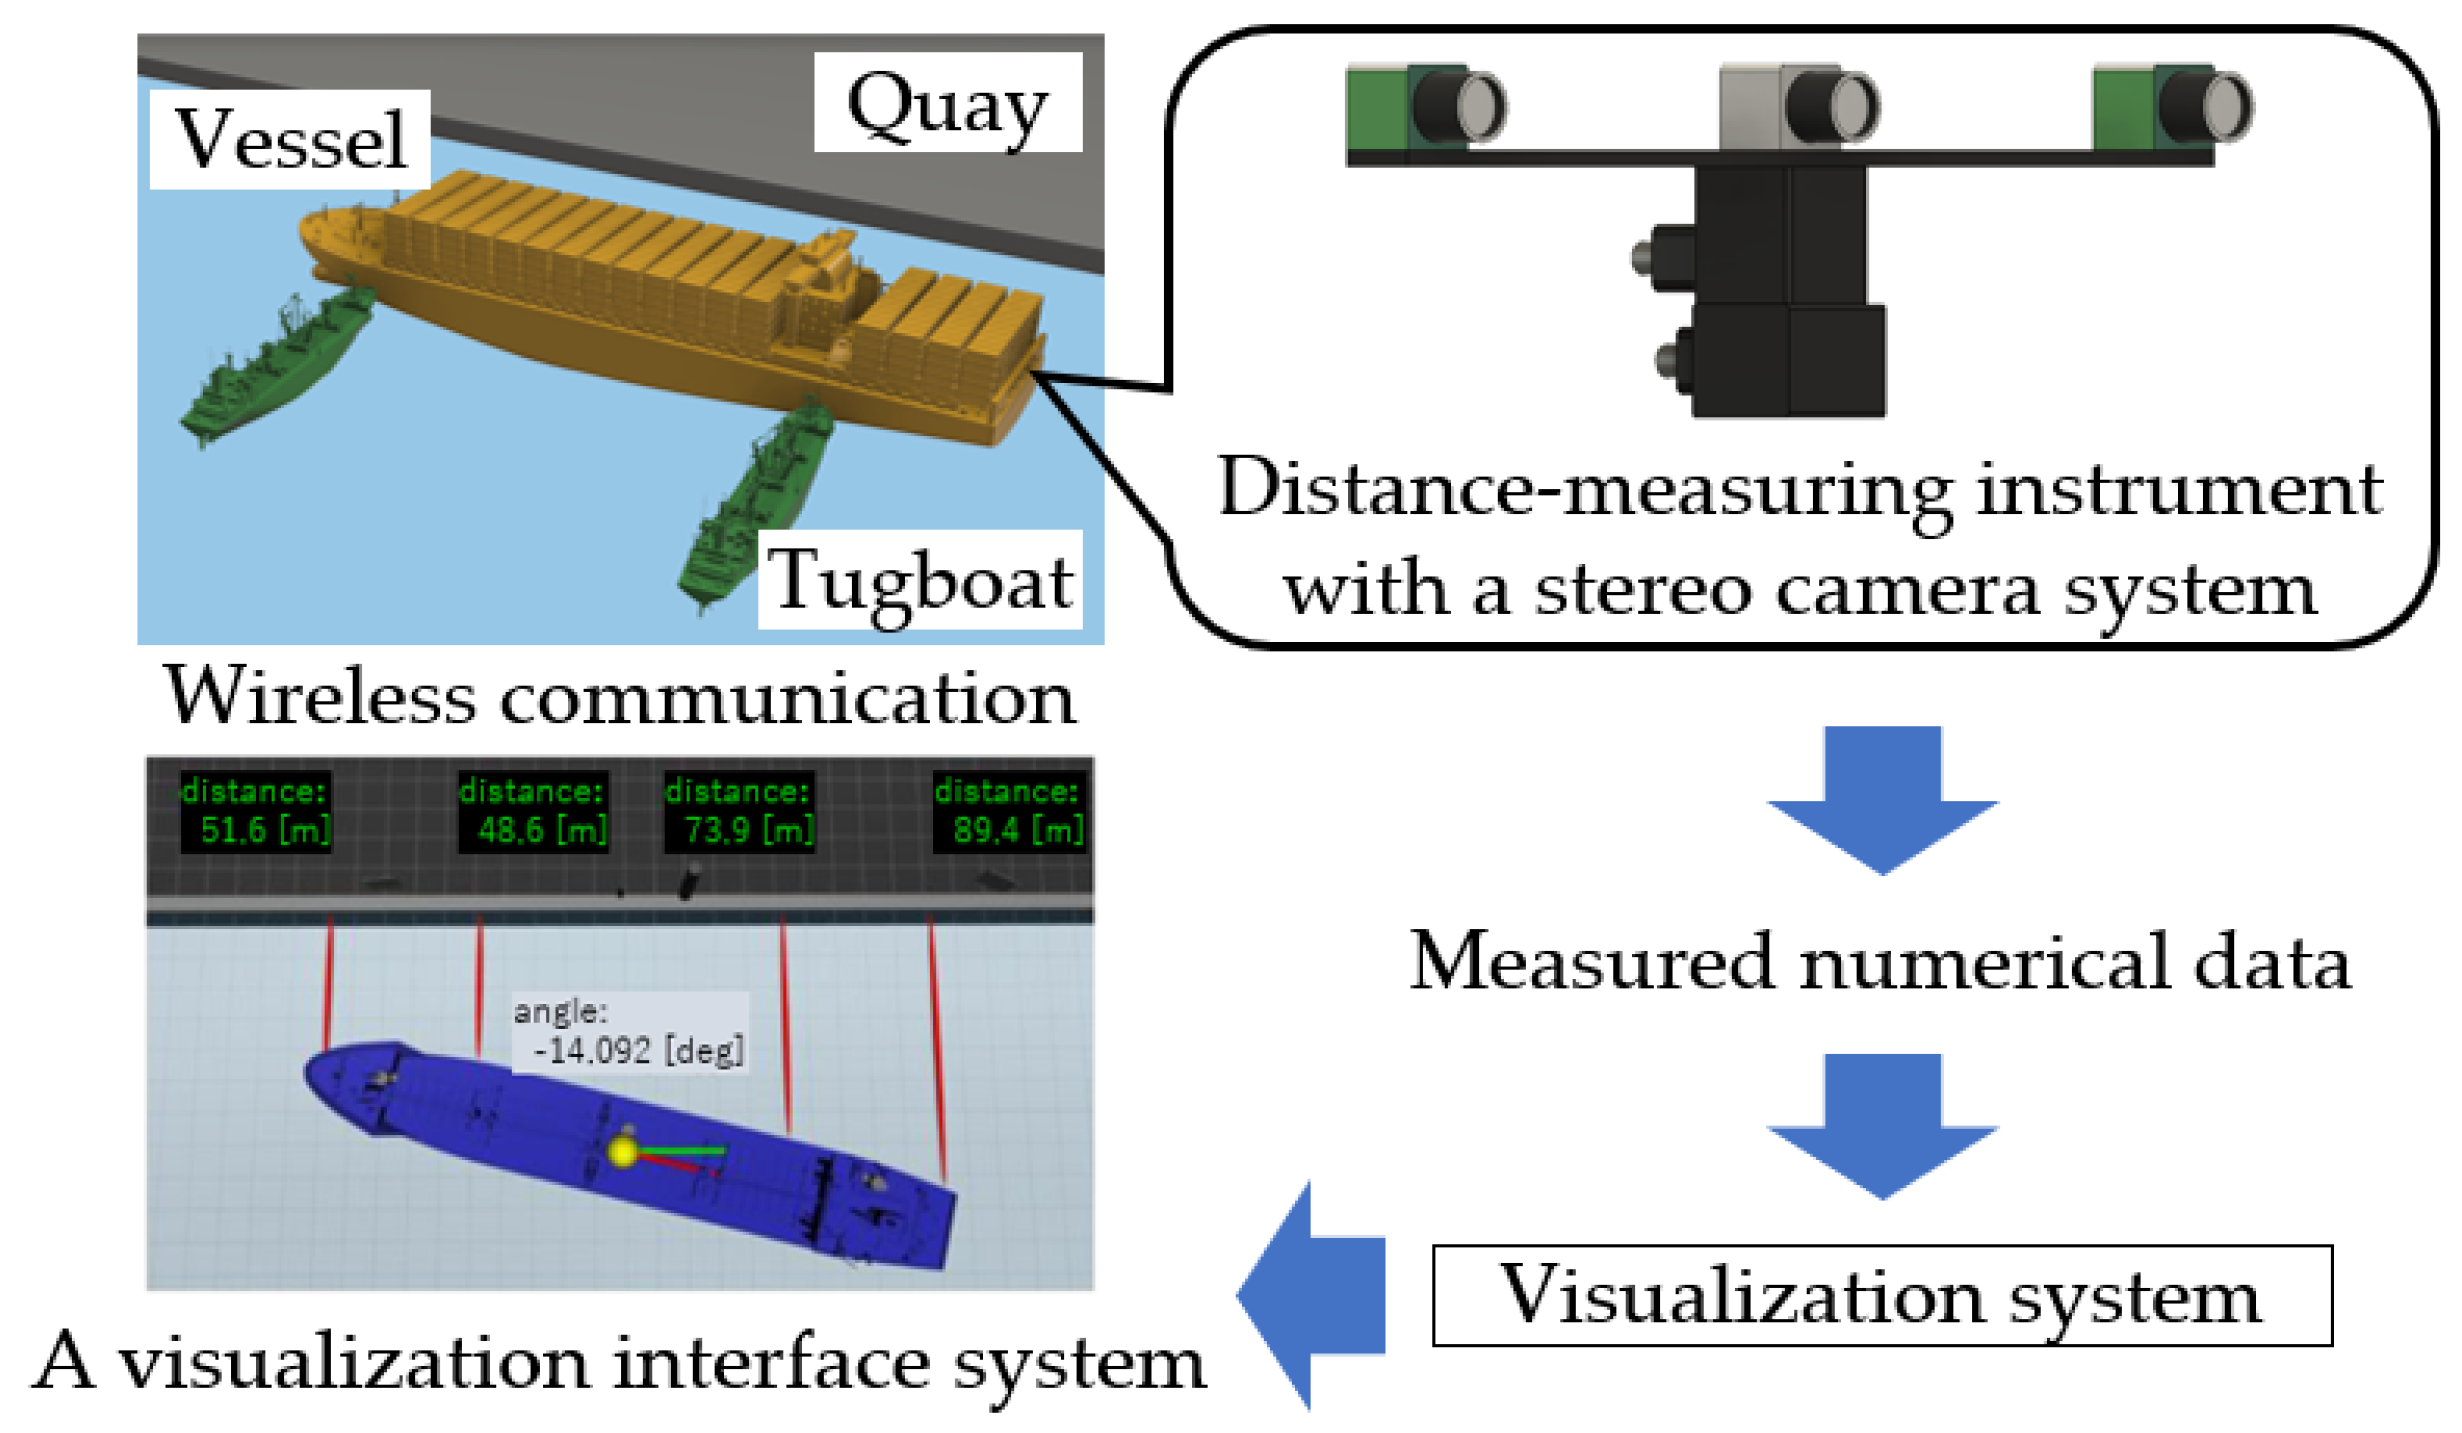
2. Visualization Related to the Quay

Here, we describe how to determine the typical coordinates needed when visualizing a situation to assist in berthing a vessel. This includes calculation methods for representing linear and curvilinear motions. In addition, a method to calculate the predicted position and draw the position after a certain time must also be included.

2.1. Positioning Estimation for a Berthing Vessel

This section explains the calculation of the positional relationship between a vessel and its quay while berthing. As shown in the vessel-based coordinate system in Figure 3a, each distance-measuring instrument installed on the bow and stern of the vessel measures the distances d L and d R to each target installed on the quay side and the respective angles θ L and θ R of the direction to that target. The positioning estimation of the vessel is obtained by transforming the calculated data between each measuring instrument and the target based on the coordinates in Figure 3a to that of the quay-based coordinate system shown in Figure 3b. Therefore, the angle θ between the line connecting the two targets and the line parallel to the quay inside the vessel, as shown in Figure 3a, can be obtained from Equation (1) using the coordinates T L ( x T L , y T L ) and T R ( x T R , y T R ) of the two targets on the quay side. Thus, the attitude θ ^ of the ship, as seen from the quay, is related to Equation (2). To simplify the coordinate system, the coordinate values of the distance-measuring instruments are placed on the centerline of the vessel [2].
θ = tan 1 ( y T R y T L x T R x T L )
θ ^ = θ
Figure 4 shows how to calculate the distances, called margins, between a vessel and its quay. Each margin is defined as the distance perpendicular to the quay from four representative corner points, C 1 , , C 4 , of the ship that may contact the object, as shown in Figure 4a. Figure 4b shows each margin, L 1 , , L 4 , of the distance between the four points and quay wall. Their coordinates are given by Equations (3) and (4), respectively: these coordinates were used to render and visualize them in the 3D model. Additionally, l T in the same figure is the known distance to the position where the target Tc can be placed on the quay side.
C i = C i x C i y , i = 1 , , 4
l i = ( T c x C i x ) sin θ ^ + ( T c y C i y ) cos θ ^ l r , i = 1 , , 4
T c = T c x T c y

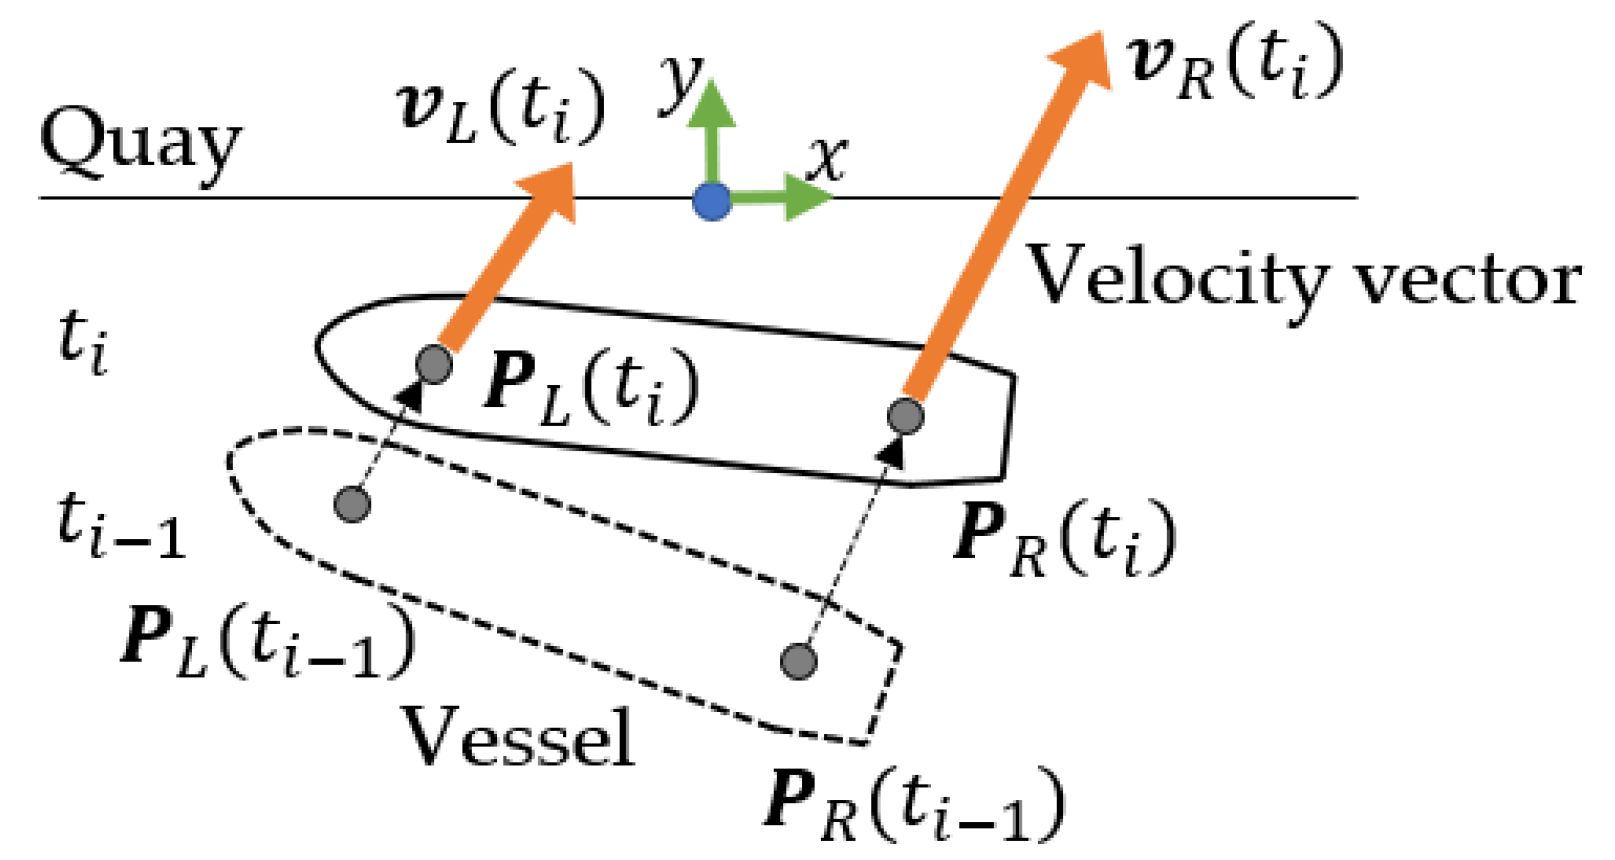
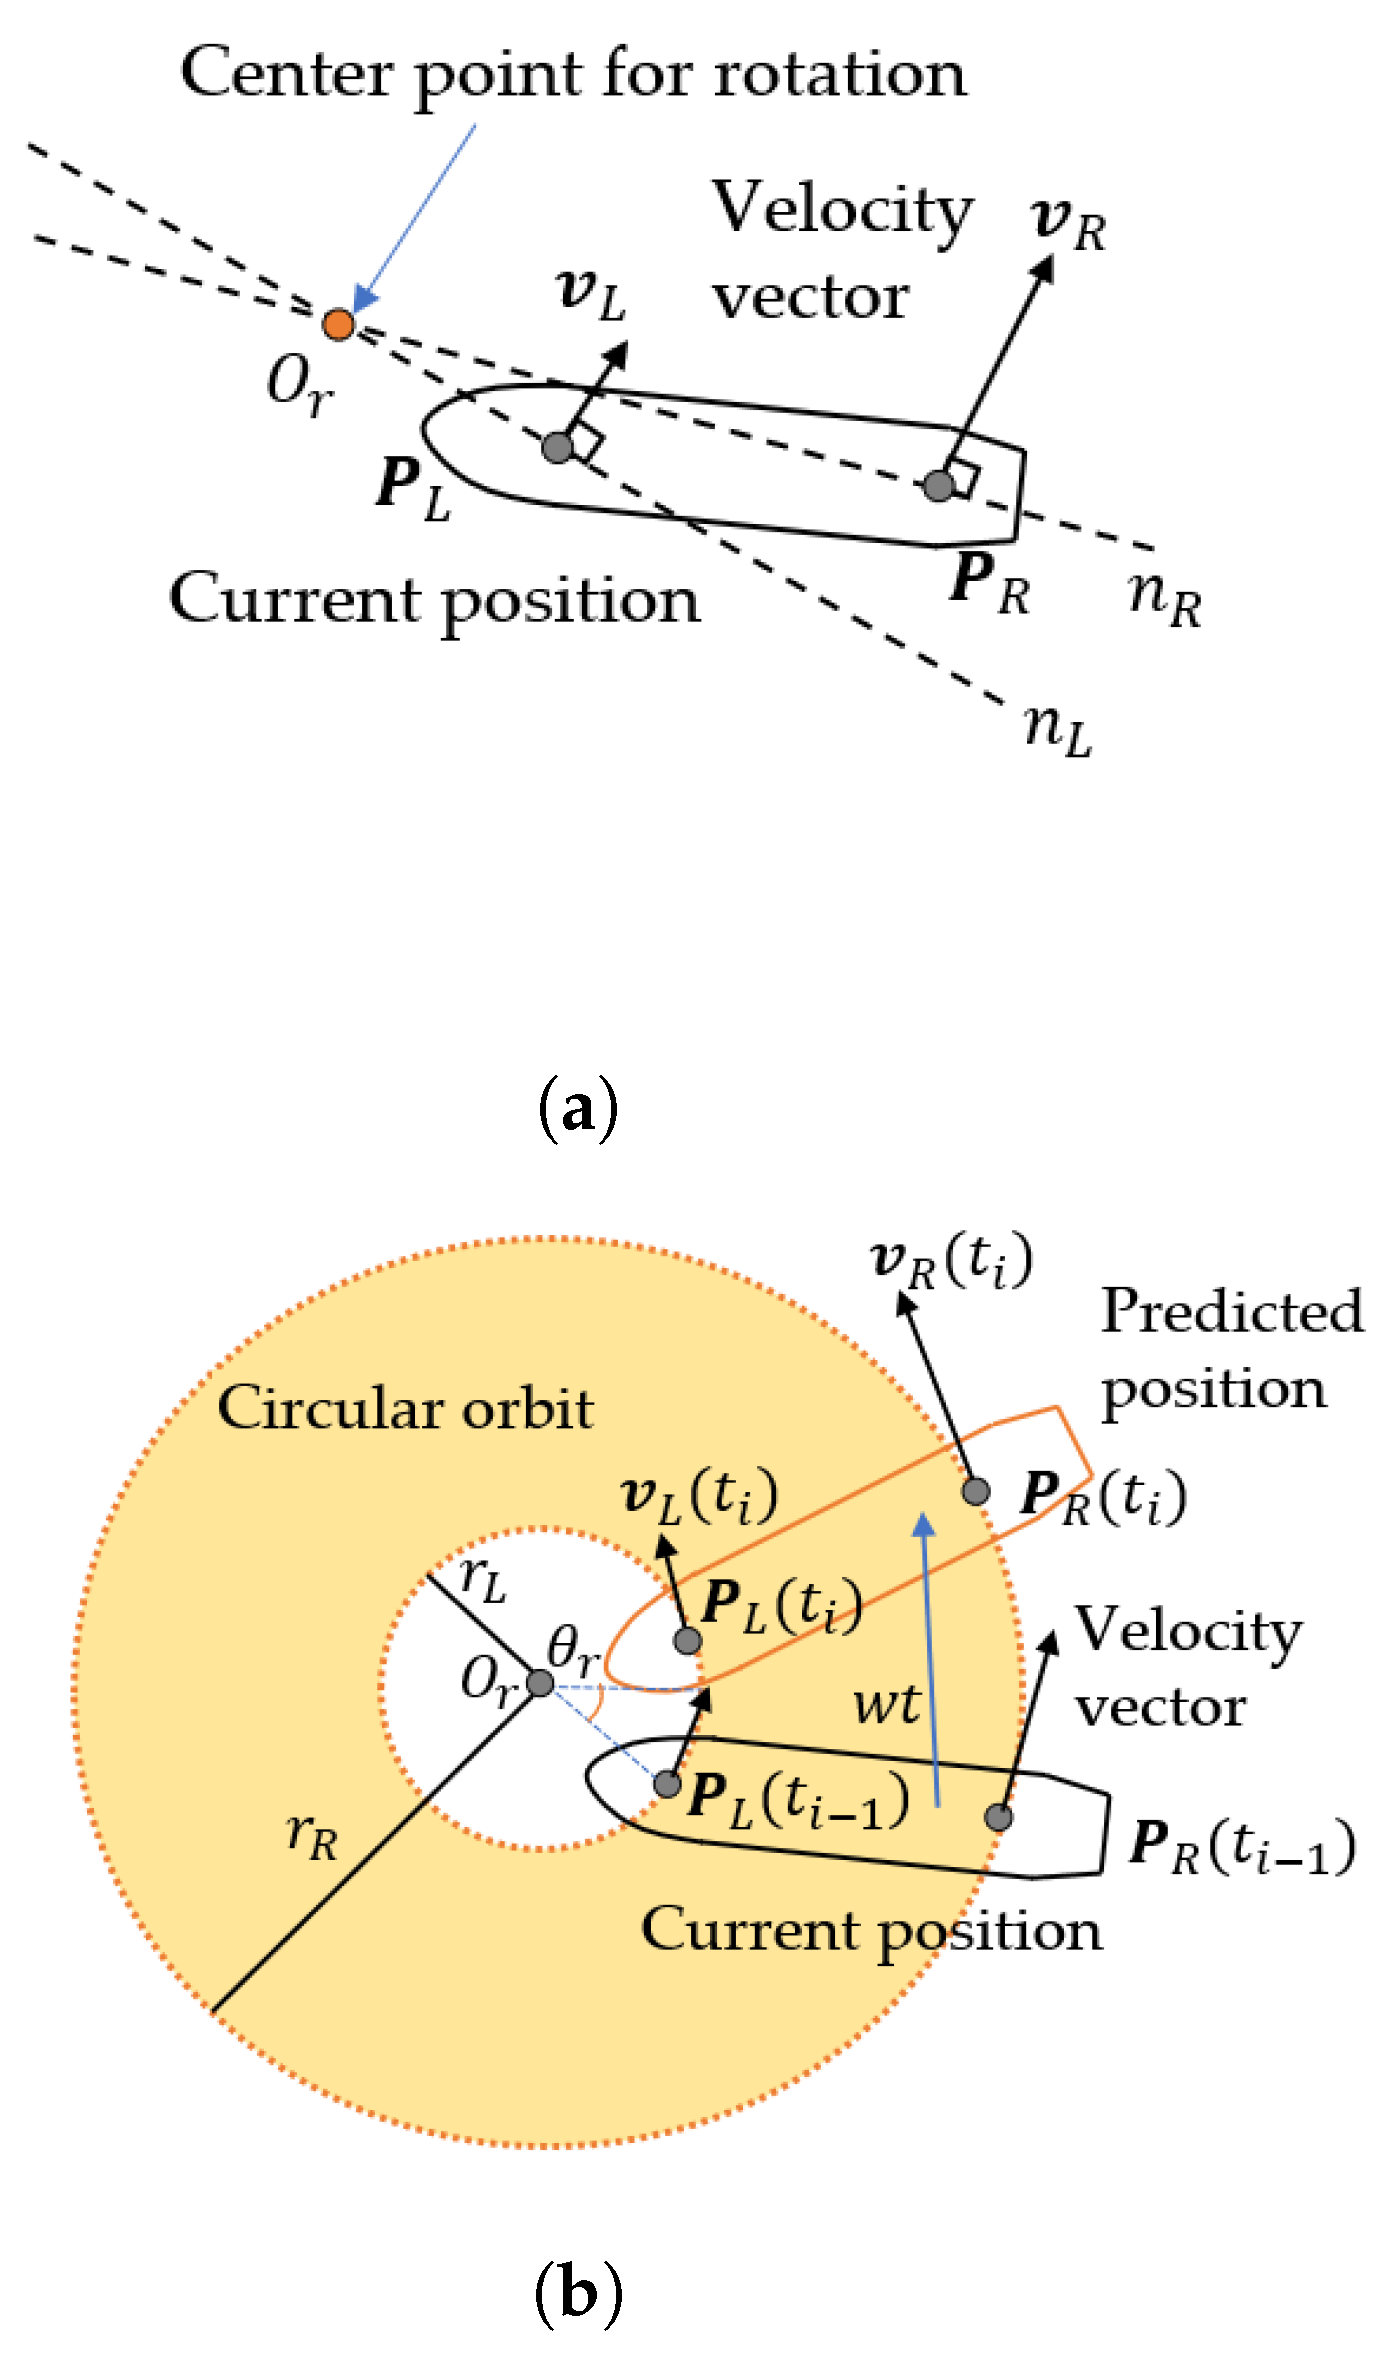
2.2. Motion Estimation for a Berthing Vessel

Figure 5 shows the calculation of the bow and stern velocity vectors. P L and P R refer to the predicted positions, and their velocity vectors are v L and v R , respectively. The velocity vectors v L and v R of P L and P R are obtained using Equations (6) and (7), respectively. They were obtained by dividing the displacements moving in time t from t i 1 to t i Then, the estimated trajectory for linear motion of the vessel only can be easily obtained by Equations (8) and (9) using v L and v R , respectively, but not for curvilinear motion.
v L ( t i ) = P L ( t i ) P L ( t i 1 ) t i t i 1
v R ( t i ) = P R ( t i ) P R ( t i 1 ) t i t i 1
P L ( t i ) = P L ( t i 1 ) v L ( t i ) · t
P R ( t i ) = P R ( t i 1 ) v R ( t i ) · t
To estimate the trajectory of the vessel’s curvilinear motion, it is necessary to find the center point to realize a curvilinear motion. Here, as shown in Figure 6a, point O r , where the two dotted lines, n L and n R , perpendicular to each velocity vector of the bow and stern intersect, is assumed to be the center point for rotating the vessel. In addition to this center point, the radius of rotation and angular velocity at the current positions of the bow and stern are required, and these parameters can be obtained using the respective velocity vectors of the bow and stern.
Figure 6b shows two circular orbits whose radii are from the center point O R to the positions of the distance-measuring instruments installed in the bow and stern. From these circles, radii r L and r R can be determined using the position P L at the bow and P R at the stern, respectively. The radii r L and r R are used to determine the angular velocity w required to estimate the predicted position after a certain time. For example, the predicted vessel position P L ( t i ) after time t can be estimated using radius r L as in Equation (10). This will also be used to simulate and render the predicted position of a vessel using the 3D model Rviz.
r L = | P L ( t i 1 ) O r |
P L ( t i ) = O r + θ r + w · t
θ r = tan 1 ( y T R y T L x T R x T L )
w = | v L ( t i 1 ) | r L

3. Simulation of the Interface System

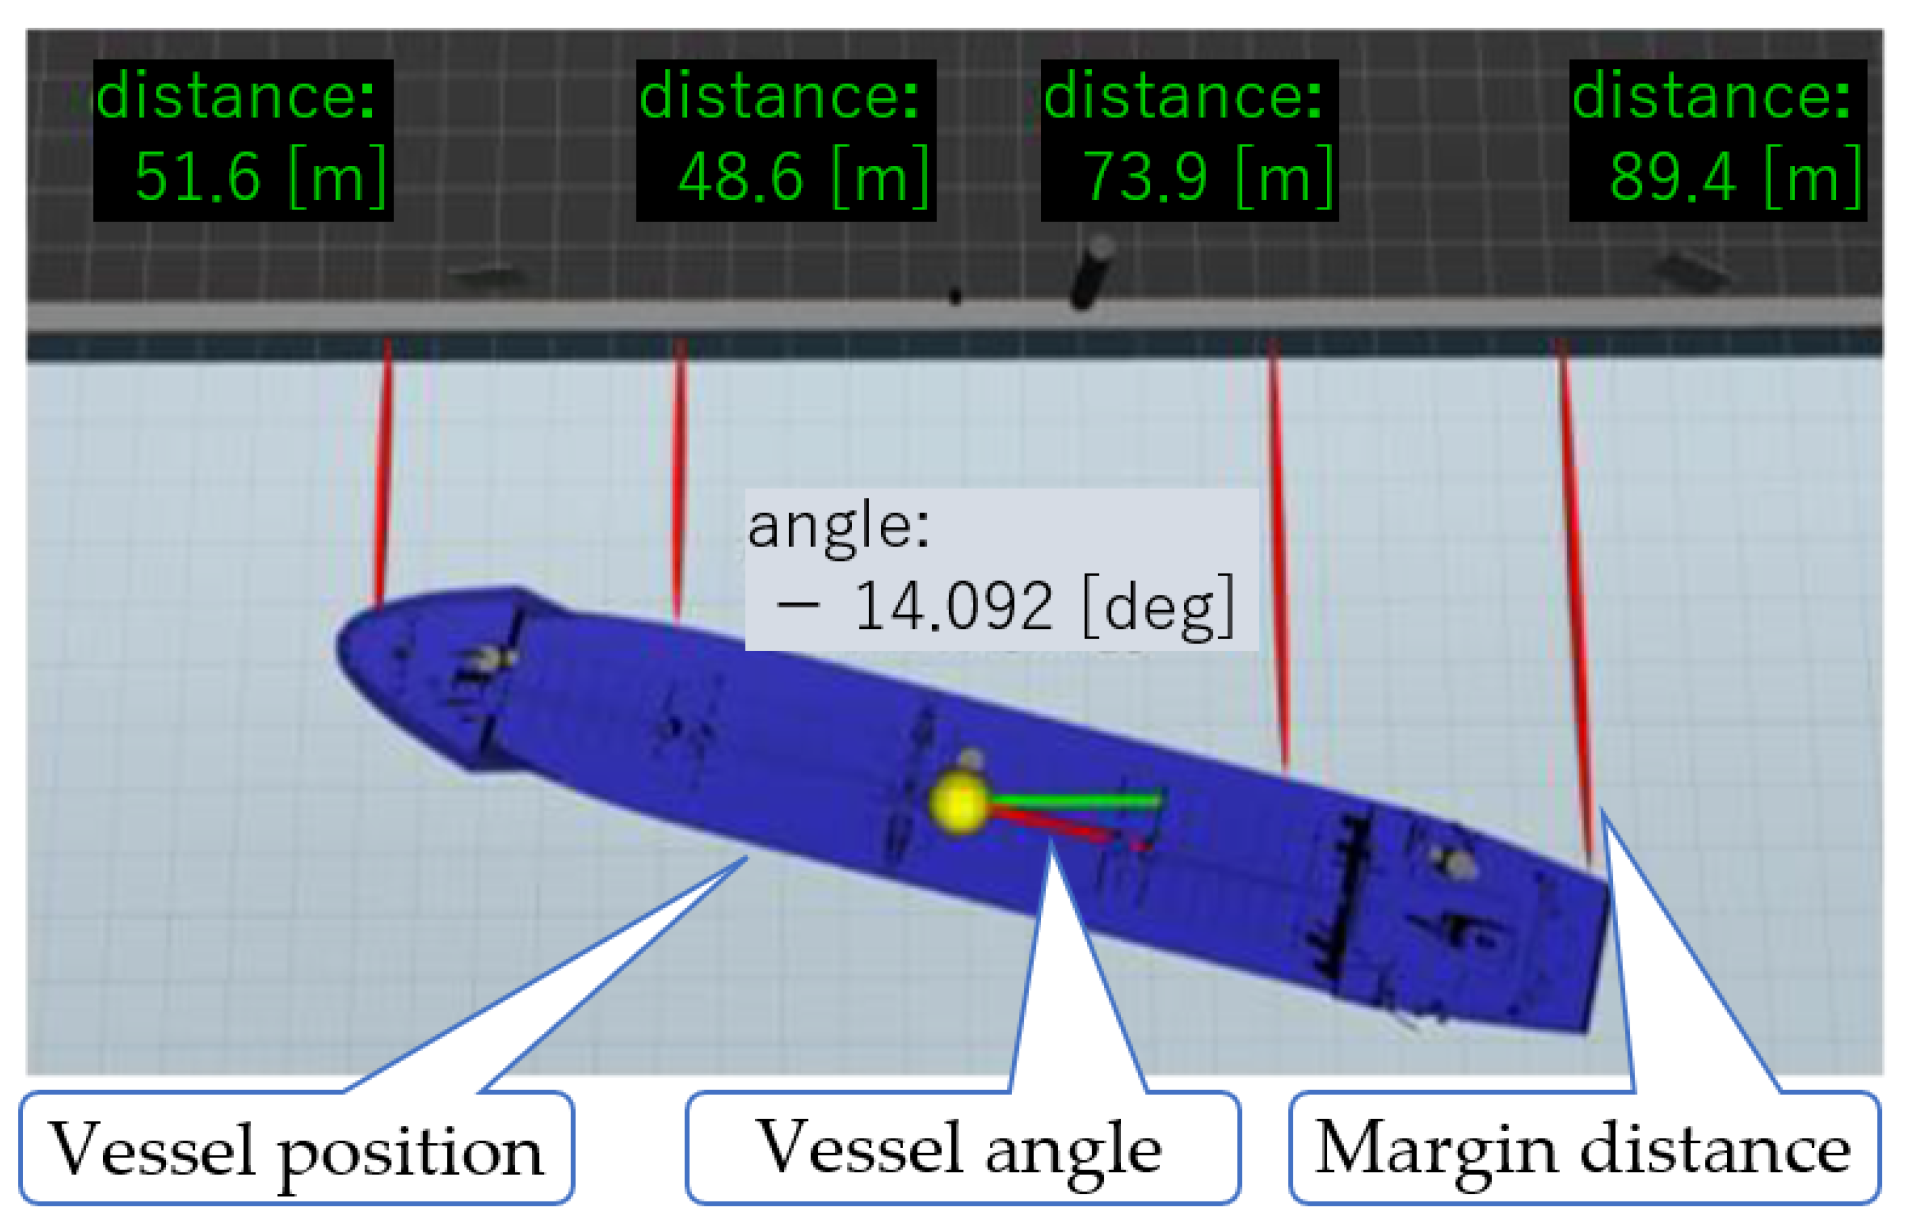
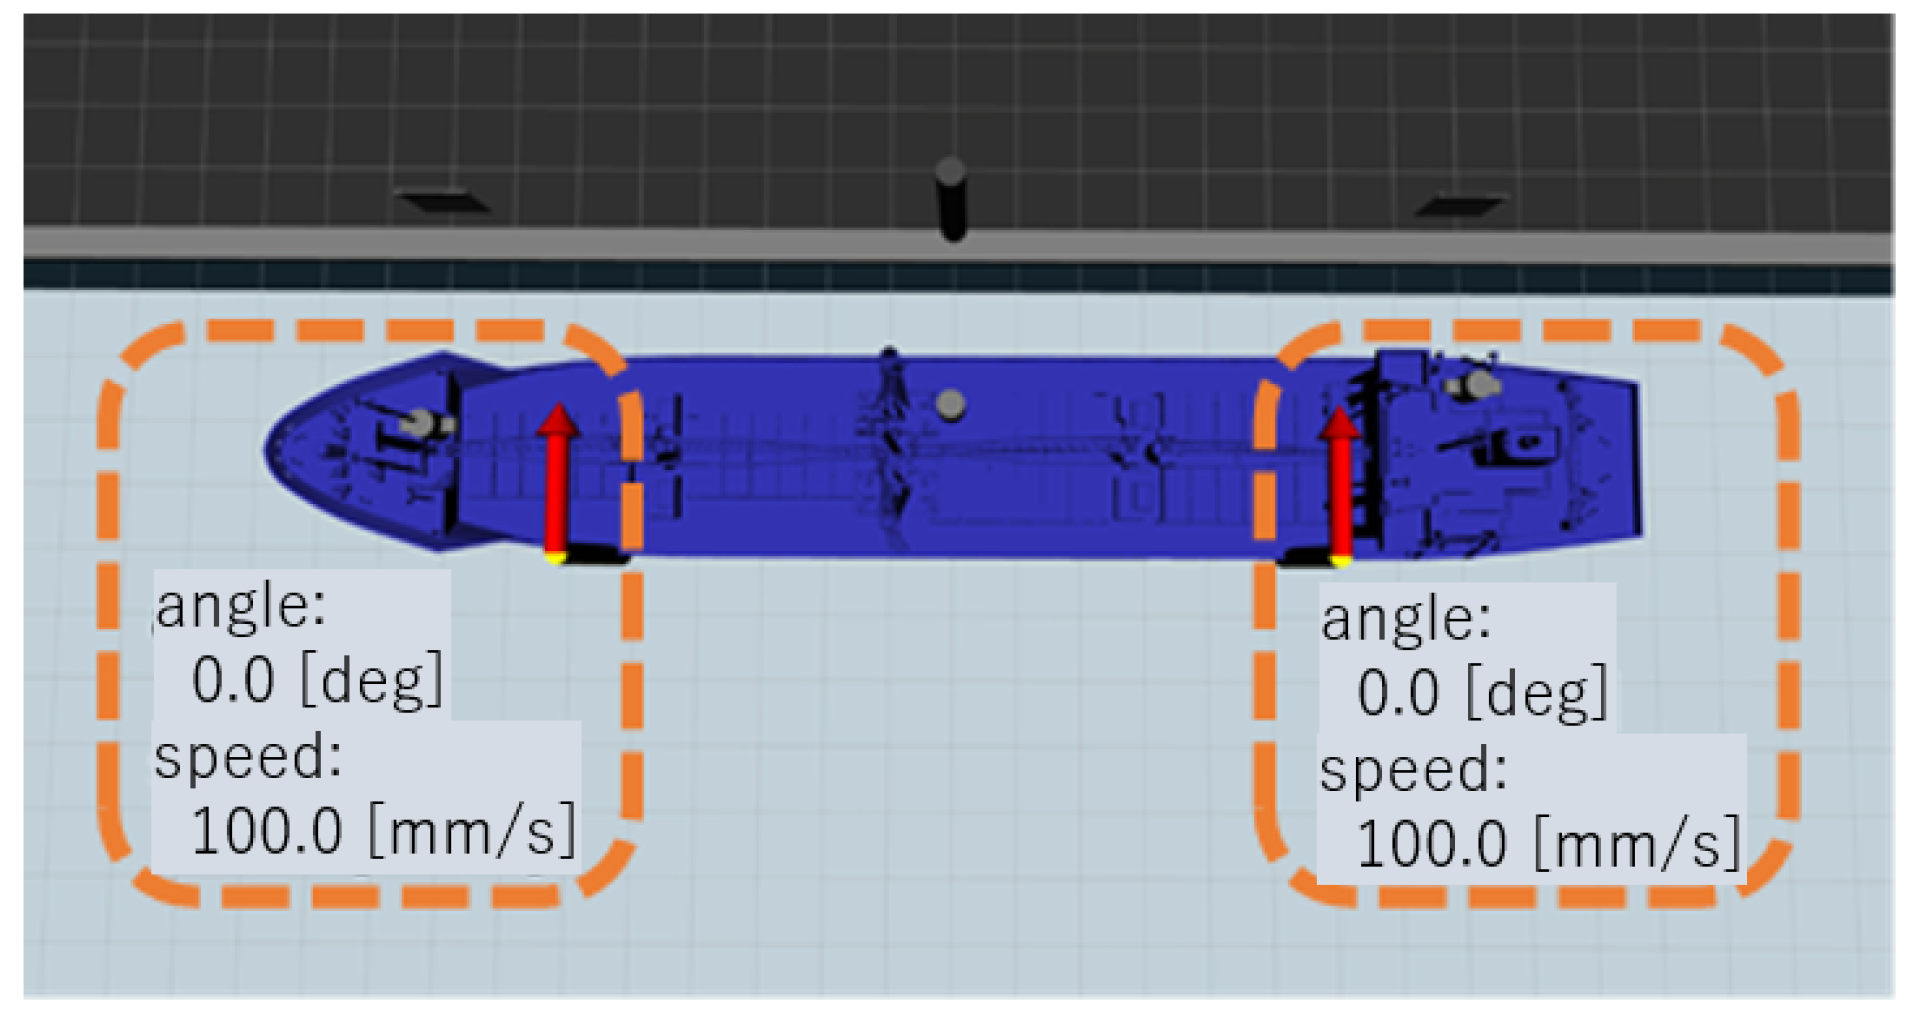
3.1. Visualization for a Vessel Positioning

To verify the representation of the positioning of a vessel, a trial simulation was performed by manually providing distance data for the parameters described in Section 2.1. For example, if the distance data of d L and d R are set to 60 [m] and 100 [m], and the angles of θ L and θ R are set to 0.3 [rad] and −0.2 [rad], respectively, and the vessel’s positioning on the visualization interface can be displayed, as shown in Figure 7. Here, the length, width, and baseline between the distance-measuring instruments of the vessel were 203, 30, and 173 [m], respectively. The four vertical lines between the model vessel and quay shown in Figure 7 represent the margins, with each marginal distance visible above the quay wall. The heading, which is the attitude angle of the model vessel relative to the quay wall, is represented by the angle of −14.092 [deg] in the center of the same figure. From Figure 7, it is confirmed that the visualization interface developed in this study can be represented using distance data to the quay from the two distance-measuring instruments on board the vessel.

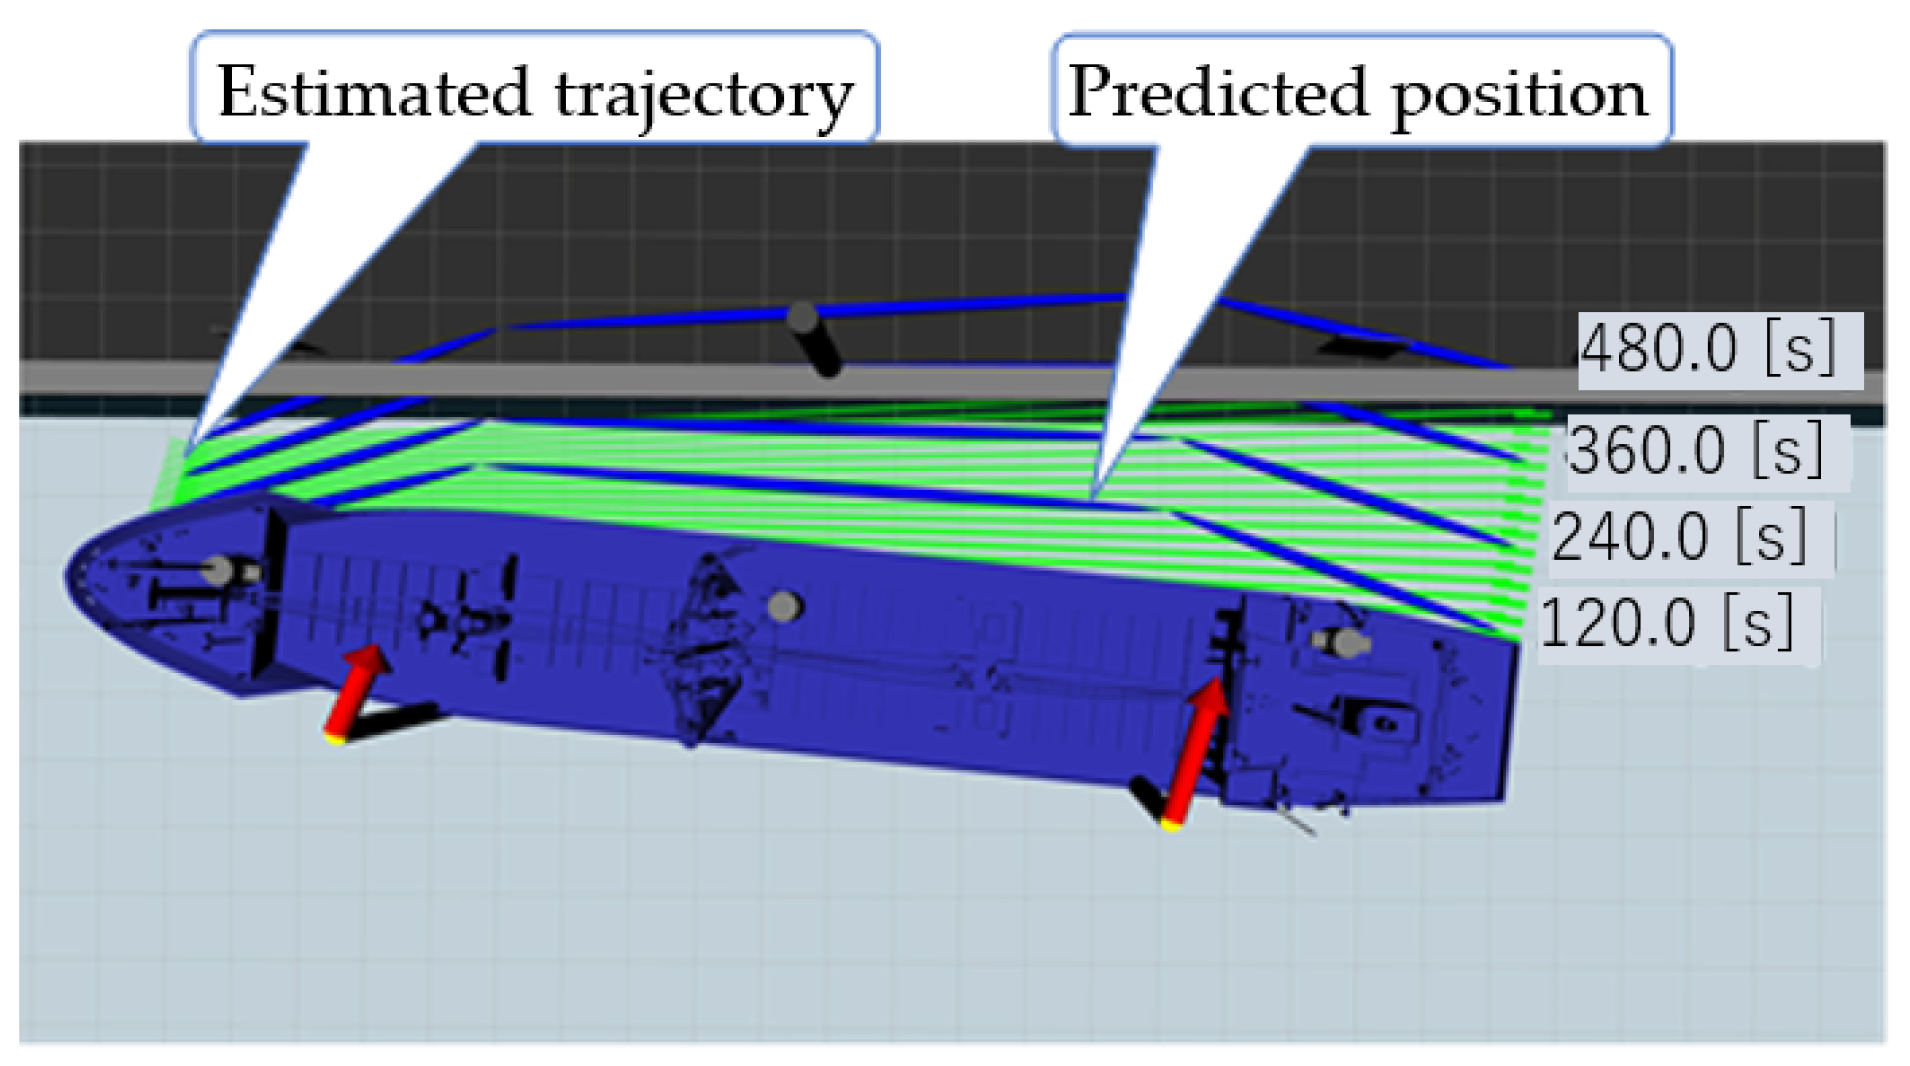
3.2. Visualization for Vessel Motion and Trajectory

To verify that the velocity of a berthing vessel on the visualization interface can be correctly represented as it approaches the quay and its vector, simulation at a certain velocity was tentatively carried out. Figure 8 shows a scene of the visualization interface, where the velocity of 100 [mm/s] and its vector are represented together. The angle 0.0 [deg] and speed 100.0 [mm/s] in the perforated rectangles on the bow and stern sides indicate the velocity of the model vessel approaching the quay and its direction, confirming that the approach velocities v L and v R described in Section 2.2 can be represented visually. The angles and velocities in Figure 8 are also visualized with red arrows and yellow poles, respectively, because they have the potential to serve as a reference for the forces to be pushed by the tugboat.
In addition, to validate the visualization method of the predicted position for the time-mobile berthing vessel described in Section 3.1, the predicted position of the vessel and its estimated trajectory are rendered in Figure 9. The green area between the vessel and quay represents the estimated trajectory of a moving vessel. The blue lines in the green area indicate the predicted position of the vessel after 120, 240, 360, and 480 [s], respectively.
Figure 8 and Figure 9 show that the visualization interface can simulate the motion and trajectory of a berthing vessel using the distance data from the vessel’s onboard distance-measuring instrument to the quay.

3.3. Experiment for the Visualization Interface

The aim of this experiment was to confirm that the position and heading of a berthing vessel could be visualized using distance data measured from two distance-measuring instruments mounted on the model vessel. Figure 10a shows the experimental environment with a 2.0 × 1.0 × 0.75 [m 3 ] model vessel floating in a 2.2 × 2.8 × 0.45 [m 3 ] pool. The distance-measuring instruments were placed at the bow and stern of the model vessel. The two targets measured by each instrument were mounted on a wall 6.0 [m] away from the frame of the pool. The horizontal elevation angle and distance from each instrument to each target were used to visualize the model vessel on the visualization interface. The data were transmitted over a cable for convenience.
Figure 10b shows the rendering results for the position and heading of the model vessel relative to the simulated quay. The upper row of Figure 10b shows the two targets on the quay, and the lower row shows the position and heading of the model vessel at distances of 0.959 [m], 1.014 [m], and −1.6 [deg] to the quay. In other words, as seen by comparison with Figure 10a, the status changes of the vessel’s position and heading can be represented on the visualization interface.

4. Extension to a Portable Interface System

In Section 3, we showed that the location information of berthing vessels can be displayed. However, the scenes shown in Figure 10 become more meaningful when represented in real time on a terminal that is in the hands of the berthing operator. Therefore, the functionality of our visualization interface should be extended such that it can be displayed in real time on the terminal to make it practical for use as an actual interface.
Figure 11 shows the overall configuration for the realization of a portable interface system. The outline of this figure is as follows: The distance and angle data obtained from PC1 and PC2, which have distance-measuring instruments installed at the bow and stern of the vessel, respectively, are sent to PC3 via a router for the wireless network to draw the positional relationship between the vessel and the quay. The distance and angle data are target-specific information for each distance-measuring instrument. In addition, PC3 of a web server is equipped with a visualization system that calculates the vessel’s positioning, and heading relative to the quay, with the measured data sent from the two PCs at any time, and performs the drawing process. This allows the pilot of a large vessel or the operator of a tugboat to access PC3 of the web server from the browser of his terminal unit and view the positioning of the vessel. Thus, the portable interface system consists of two systems: a distance measurement system using two PCs, and a visualization system using PC3 as web server which calculates and draws a vessel’s positioning.

4.1. Decentralization of Each System Function

A realistic way to realize a portable interface system is to subdivide the functions of each system; for example, the distance measurement system and visualization system that we have developed integrate only the data of the necessary functions into the portable interface system by communicating them over a wireless network. The ROS that makes this possible differs from operating systems, such as Linux and Windows, which are generic names of a communication library for interprocess communication and a build system for compiling programs [11]. A program developed in ROS has a single functionality that is managed as a node and operates by communicating data between the nodes via a network. Therefore, the advantage of the ROS is that programs can be easily reused and ported to other machines on a node-by-node basis. To take advantage of this, the two distance measurement systems were subdivided by function and implemented as nodes.
Each system in Figure 12 can be analyzed by functional node: PC1 and PC2 detect markers or targets from images acquired by their respective cameras. For target or marker detection, template matching using the vector code correlation method [12] is used. After the matching process, the distance from each measuring instrument to the target and pan-tilt angle required for tracking the target are calculated, and noise correction is performed on the calculated values. The measured values, distance, and pan-tilt angle, obtained from the two machines PC1 and PC2, are the input to a PC3 equipped with the visualization system, which calculates and draws the vessel’s positioning and heading. At this time, time synchronization is performed between PC1 and PC2 to achieve accurate ship’s position drawing. This process is performed using the message_filters library of ROS, which includes a function called TimeSynchronizer. This function treats data with similar time stamps in the ros_message of distance information as data of the same time. Thus, the measuring and drawing processes are distributed using multiple machines. The PC1 and PC2 used here are commercial Note PCs with 3.6 [GHz] CPUs, and PC3, used as a web server for the visualization system, is a general desktop PC with a GTX1060 GPU.

4.2. Extension of the Functionality to a Portable Terminal

A previous visualization interface [13] used the ROS visualization tool “Rviz” to draw the positioning of the vessel. However, Rviz runs only in an ROS environment built on Ubuntu; therefore, when information needs to be shared by multiple people, such as in berthing operations, it is time consuming to re-build the environment on each terminal. Therefore, we developed a web application that can display a visualization screen in the browser environment of each operator’s terminal. The application written in JavaScript uses the PC3 server in the Ubuntu-based ROS environment and communicates data with WebSocket via Rosbridge of the JSON application program interface (API). This makes it possible to simultaneously display the positioning information of the vessel on the terminal devices of the users. In other words, by connecting the WebSocket to the PC3 server via a wireless network, the operators involved in a vessel berthing can check the situation displayed in the vessel’s 3D model on their terminal whenever necessary, using the results of positioning information calculated from the measured values obtained by the distance measurement system, such as the margins from the corner of the vessel to the quay.

4.3. Experiments for Verification

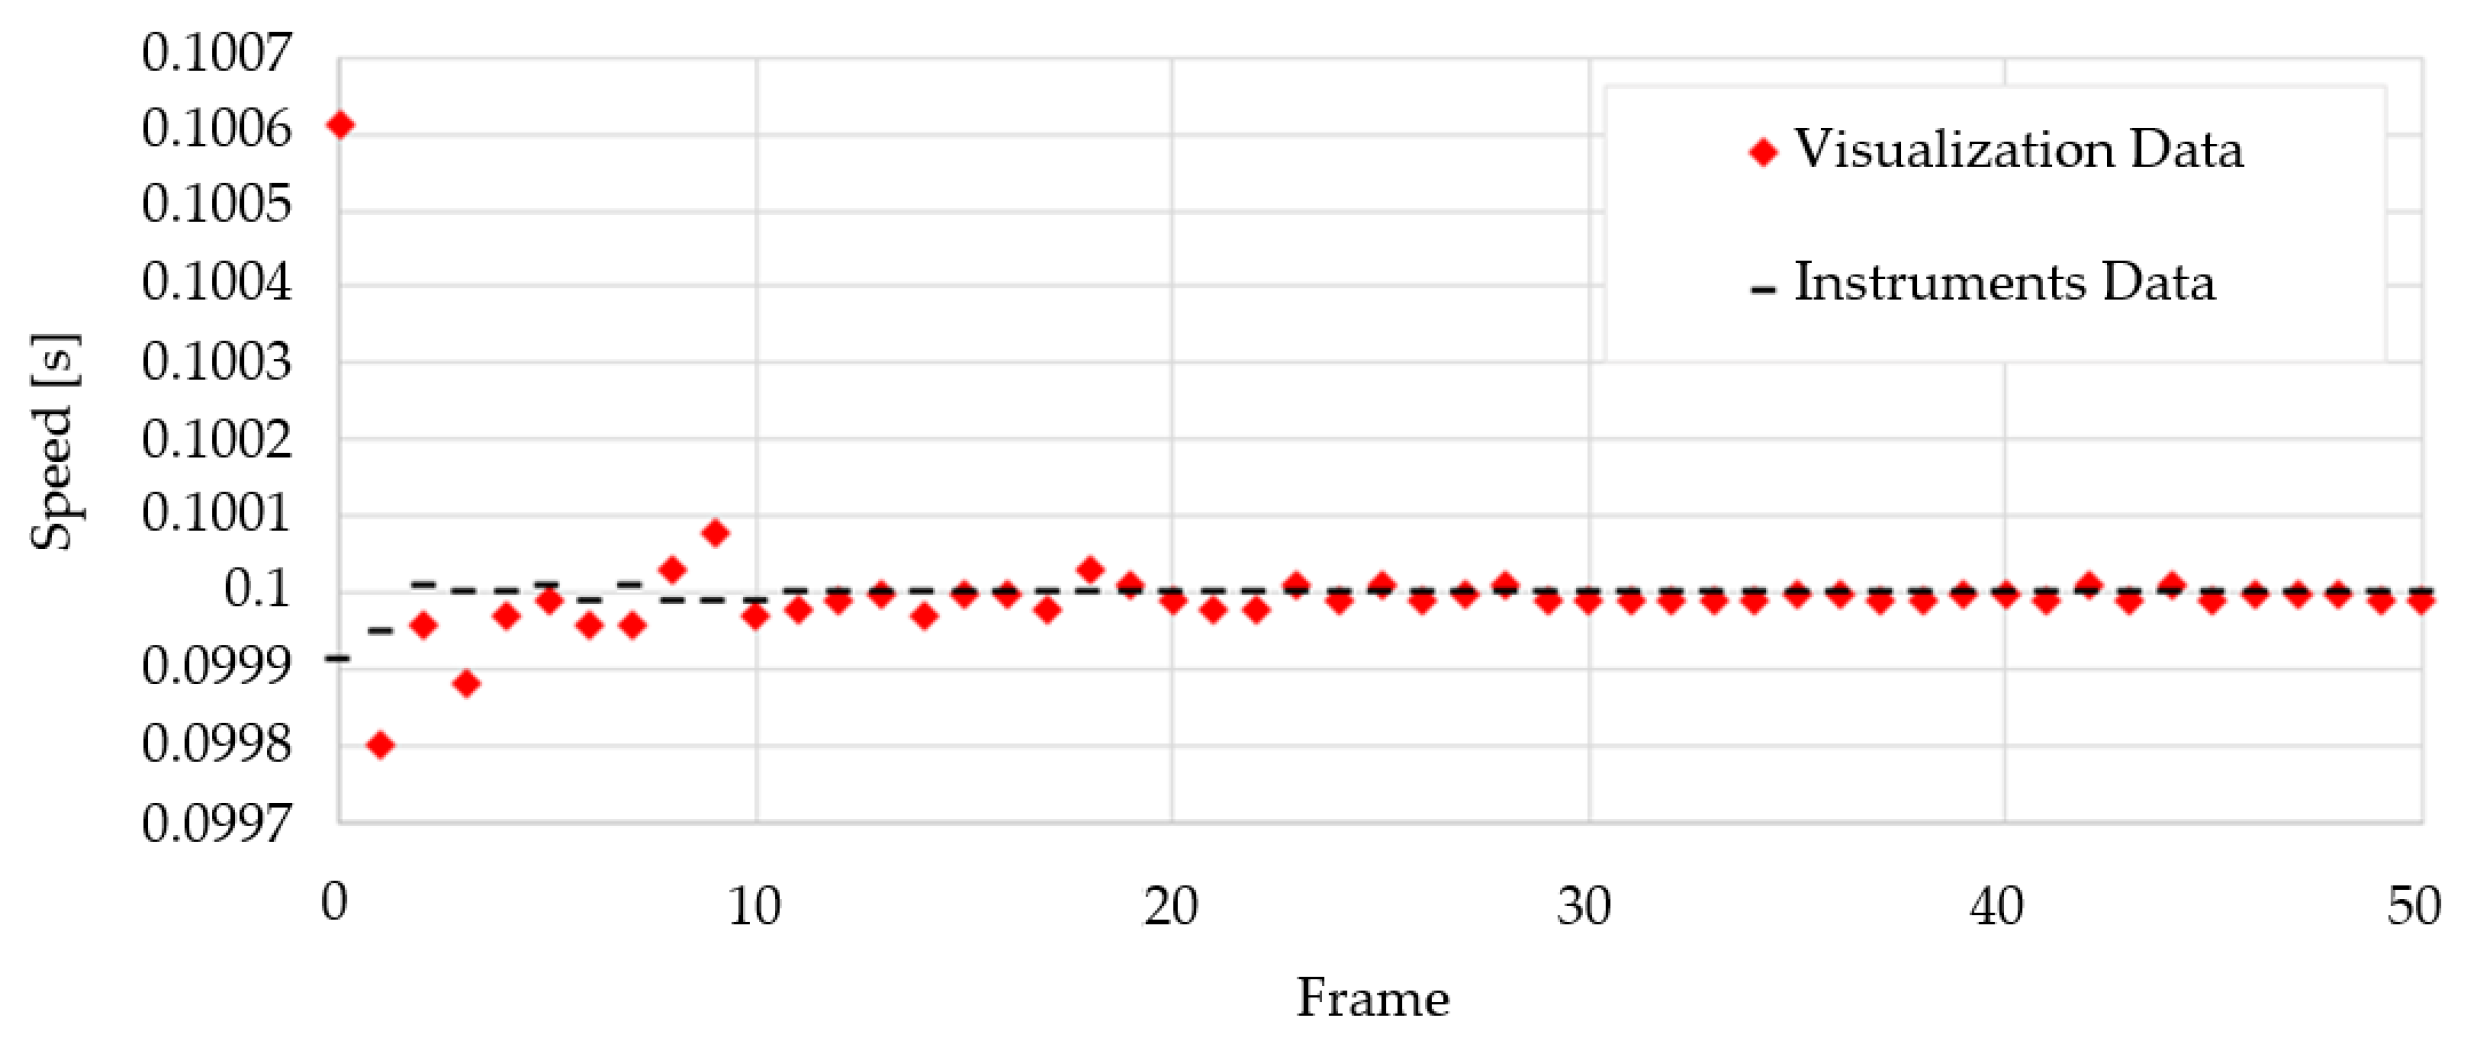
4.3.1. Evaluation of Drawing Stability

To confirm the usefulness of the visualization system when using continuous distance information, we conducted a simulation experiment to evaluate the stability of a drawing over a wireless network. For the simulation, we used two PCs (PC1 and PC2) equipped with measuring instruments, and PC3 for drawing, as described in Section 4.1. The simulation environment was set to reproduce a large vessel, 203 [m] long and 30 [m] wide, as shown in Figure 7 of Section 3.1, and the vessel was assumed to approach the quay at 200 [mm/s]. Essentially, d L , θ L , d R , and θ R described in Section 2.1 are continuously transmitted at 10 Hz from PC1 and PC2 to PC3. We verified whether the vessel’s positioning could be calculated at an appropriate rate by PC3 for these values and whether a stable drawing speed could be maintained. A schematic of the experimental results is shown in Figure 13 wherein the upper gray area indicates the quay, and the green letters indicate the margins, that is, the distances from the corners of the vessel to the quay, as displayed in Figure 4b. The blue area in the middle of Figure 13 represents the vessel. The two red arrows on the vessel indicate the attitude of the vessel toward the quay, and the red letters at the bottom indicate the speed of the vessel and its heading at angle θ in Figure 3b. Focusing on the displayed vessel speed of 200.05 [mm/s], we can see that the value set in the simulator is drawn appropriately.
Figure 14 also shows the speed of drawing successive distance data on the PC3 server, as described in Section 4.1. The first frame of the drawing process for the input values is only delayed by approximately 0.7 [ms]. This delay may be attributable to the start-up process of the visualization system at the beginning of the measurement. Subsequently, the drawing speed is stable at 10 Hz, and it can be confirmed that the drawing is performed at almost the same time as the speed of the input distance data [14]. The drawing speed of 10 Hz here is the target value for input distance data. If the screen display is slower than this, there is a sense of psychological frustration until it is displayed on the screen, so there is no comparison with other systems, and the user cannot use the system stably.

4.3.2. Operation Verification of the Web Application

The purpose of this experiment was to confirm whether the positioning information from the distance measurement system can be displayed on the user’s terminal screen using the constructed visualization system. In the experiment, we constructed a scaled-down experimental environment and verified its display function on a tablet terminal.
In the experimental environment, two distance-measuring instruments were set up on a desk with casters and connected to PC1 (bow side) and PC2 (stern side) for distance measurement. A server for vessel positioning was also installed in PC3, which obtains the distance information from PC1 and PC2 and calculates the vessel’s positioning and heading. The distance between each measuring instrument and target was set to 3 [m] as the initial value. The model vessel moved 1 [m] toward the target, and its behavior was displayed on the browser which confirmed that the positioning information could be displayed correctly on multiple terminals.
Figure 15 shows a scene of the user terminal screen. Figure 15a shows the 3D model of a vessel viewed from above, with the margins in the center of the screen. Figure 15b shows a view from the quay, where the user can zoom in and out of the screen by scrolling and move the viewpoint by dragging. The light-blue area represents the water surface. At the top of the screen, the margins, which are the distance information from the bow and stern to the quay, are output as a table. The pan-tilt angle of each distance-measuring instrument was also fixed at 0 [deg] and is displayed in the table.

4.3.3. Discussion

The experimental results in Section 4.3 show that our visualization system is stable, does not slow down to the target 10 Hz rendering speed for continuous distance data, and can actually display the constructed application on the terminal device. To maintain this functionality when used in a real environment, the specifications of the machine described in Section 4.1 or higher would be required. In addition, it is desirable to expand the information to be displayed on the terminal as described in Section 4.3.2. Specifically, a function to display the future position of a vessel based on its current speed and location, and a notification function that warns with an alarm when a vessel approaches a certain distance to the wharf are necessary.

5. Conclusions

In this study, we developed a portable interface system that can draw a vessel’s positioning using the distance data sent continuously from two measuring instrument parts at the same rate and extended it via a network so that the positioning information of a vessel can be displayed on the terminals of multiple workers or operators. We also confirmed the drawing stability of the interface, which can simultaneously draw continuous distance data of 10 Hz. We call this system a portable interface system. This system visualizes the positional information of a vessel over a network by decentralizing the processing of a "measurement part" that measures the position of the vessel and a "drawing part" that calculates and draws the positional information of the vessel based on the numerical data of the distance obtained from the measurement part. The visualized positioning information of the vessel is an interface that can be displayed on the user’s portable terminal using a developed web application.
In this study, the information represented in the terminal is limited to the vessel’s position, but the function of this system to predict the vessel’s positioning information within a few seconds of the vessel’s current speed is one of the most useful means to prevent possible berthing accidents. In the future, it will be necessary to add functions, such as predicting and displaying future vessel positions based on the speed of movement, and issuing a warning when the vessel reaches the vicinity of the quay.

Author Contributions

Conceptualization, Y.-B.K. and Y.C.; methodology, T.T. and D.Y.; software, T.T. and D.Y.; validation, Y.-B.K. and Y.C.; formal analysis, Y.C.; investigation, T.T. and D.Y.; resources, Y.-B.K.; data curation, T.T. and D.Y.; writing—original draft preparation, T.T. and D.Y.; writing—review and editing, K.I. and Y.C.; visualization, K.I.; supervision, Y.C. All authors have read and agreed to the published version of the manuscript.

Funding

This research received no external funding.

Institutional Review Board Statement

Not applicable.

Informed Consent Statement

Not applicable.

Data Availability Statement

Not applicable.

Acknowledgments

This paper is a tribute to the collaborative research with PKNU that the two students conducted while in school, which was summarized by their advisor and successor after they completed their studies. We would like to thank Editage for English language editing.

Conflicts of Interest

The authors declare no conflict of interest.

References

  1. Port of Kitakyusyu. Available online: http://www.kitaqport.or.jp/index.html (accessed on 16 October 2022).
  2. Oda, H.; Okuyama, E.; Kawamori, Y. New Berthing Support System (NBSS) using high accuracy differential GPS—Application to Safety Navigation Management. Mar. Eng. 2009, 44, 64–69. [Google Scholar] [CrossRef] [Green Version]
  3. Perkovič, M.; Gucma, L.; Bilewski, M.; Muczynski, B.; Dimc, F.; Luin, B.; Vidmar, P.; Lorenčič, V.; Batista, M. Laser-based aid systems for berthing and docking. J. Mar. Sci. Eng. 2020, 8, 346. [Google Scholar] [CrossRef]
  4. Mizuchi, Y.; Ogura, T.; Kim, Y.B.; Hagiwara, Y.; Choi, Y. Vision-based markerless measurement system for relative vessel positioning. IET Sci. Meas. Technol. 2016, 10, 653–658. [Google Scholar] [CrossRef]
  5. Yuen, H.; Choi, Y.; Kim, Y.B. Implementation of Tracking-Learning-Detection for Improving a Stereo-Camera-based Marker-less Distance Measurement System for Vessel Berthing. In Proceedings of the CSPA2020/IEEE Malaysia, Langkawi, Malaysia, 28–29 February 2020; pp. 46–51. [Google Scholar]
  6. Kawai, H.; Kim, Y.B.; Choi, Y. Measurement of a container crane spreader under bad weather conditions by image restoration. IEEE Trans. Instrum. Meas. 2012, 61, 35–42. [Google Scholar] [CrossRef]
  7. Quigley, M.; Gerkey, B.; Conley, K. ROS: An open-source robot operating system. In Proceedings of the ICRA Workshop on Open-Source Software, Kobe, Japan, 12–17 May 2009. [Google Scholar]
  8. Mizuchil, Y.; Ogura, T.; Kim, Y.B.; Hagiwara, Y.; Choi, Y. Camera-based measurement for close-distance relative vessel positioning. J. Mech. Sci. Technol. 2017, 31, 1899–1907. [Google Scholar] [CrossRef]
  9. Ogura, T.; Mizuchi, Y.; Kim, Y.B.; Choi, Y. Highly accurate stereo-based measuring and tracking system for vessel control. In Proceedings of the 15th International Conference on Control Automation and Systems, Busan, Korea, 13–16 October 2015; pp. 763–768. [Google Scholar]
  10. Spandonidis, C.; Giannopoulos, F.; Petsa, A.; Eleftheridis, P.; Sedikos, E. A Data-Driven Situational Awareness System for Enhanced Air Cargo Operations Emergency Control. Smart Cities 2021, 4, 1087–1103. [Google Scholar] [CrossRef]
  11. Okada, K. ROS (Robot Operating System). J. Robot. Soc. Jpn. 2012, 30, 830–835. [Google Scholar] [CrossRef]
  12. Yoshimura, M.; Kawai, H.; Iyota, T.; Choi, Y. Hardware design of vector code correlation method for high-speed template matching. In Proceedings of the International Conference on Control Automation and Systems, Seoul, Korea, 14–17 October 2008; pp. 2529–2532. [Google Scholar]
  13. Yuasa, D.; Choi, Y. Development of an interface visualizing measured distance information for vessel berthing support system. In Proceedings of the SICE Annual Conference, Nara, Japan, 11–14 September 2018. [Google Scholar]
  14. Tsuyuzaki, T.; Choi, Y.; Kim, Y.B. Evaluation of a visualized interface system for vessel berthing. In Proceedings of the 2019 KSPSE Autumn Conference, Jeju, Korea, 13–15 November 2019; pp. 195–197. [Google Scholar]
Figure 1. Berthing operations for large vessels [1]: (a) guiding of the vessel by the pilot; (b) pushing of the vessel by tugboat to approach the wharf side; (c) mooring of the vessel by the wharf-side staff; (d) removing of the containers from the vessel.
Jmse 10 01637 g001
Figure 2. Schematic of the portable interface system.
Jmse 10 01637 g002
Figure 3. Coordinate system for vessel positioning: (a) vessel-based coordinate system; (b) quay-based coordinate system.
Jmse 10 01637 g003
Figure 4. Margin between a vessel and its quay: (a) vessel-based coordinate system; (b) quay-based coordinate system.
Jmse 10 01637 g004
Figure 5. Velocity vectors for a linear motion.
Jmse 10 01637 g005
Figure 6. Vessel positioning predicted with a curve motion: (a) calculation of the center point to rotate a vessel; (b) predicted circular orbit.
Jmse 10 01637 g006
Figure 7. One scene of our visualization interface simulated with distance data.
Jmse 10 01637 g007
Figure 8. Visualization interface to visualize the hull positioning and its velocity vectors.
Jmse 10 01637 g008
Figure 9. Visualization interface to render the predicted position and its trajectory.
Jmse 10 01637 g009
Figure 10. Experimental environment to test our interface representation with the measured distance data: (a) real experimental environment; (b) visualization interface.
Jmse 10 01637 g010
Figure 11. Overall configuration of the portable interface system sharing the positioning information to support a berthing vessel.
Jmse 10 01637 g011
Figure 12. Each distance measurement system subdivided in the functional nodes.
Jmse 10 01637 g012
Figure 13. One scene displayed to verify drawing speed.
Jmse 10 01637 g013
Figure 14. Speed of drawing the vessel’s positioning on our visualization system.
Jmse 10 01637 g014
Figure 15. One scene of the user terminal screen: (a) one screen drawn from the aerial view; (b) one screen zoomed in from the quay of view.
Jmse 10 01637 g015
Publisher’s Note: MDPI stays neutral with regard to jurisdictional claims in published maps and institutional affiliations.

