
Post-Nourishment Changes of an Artificial Gravel Pocket Beach Using UAV Imagery


1
Faculty of Civil Engineering, University of Rijeka, 51000 Rijeka, Croatia
2
Lancaster Environment Centre, Lancaster University, Lancaster LA1 4YW, UK
*
Author to whom correspondence should be addressed.
J. Mar. Sci. Eng. 2022, 10(3), 358; https://0-doi-org.brum.beds.ac.uk/10.3390/jmse10030358
Submission received: 31 December 2021
/
Revised: 17 February 2022
/
Accepted: 28 February 2022
/
Published: 3 March 2022
(This article belongs to the Special Issue Novel Technologies and Solutions for Coastal Evolution and Management)
Abstract
:Monitoring and analysis of changes in the volume and area of nourished beaches is crucial to inform any beach renourishment programme. The aim of this study is to utilise UAV surveys and SfM photogrammetry to assess the beach nourishment performance of an artificial gravel beach exposed to a range of external forcing, including storms. The paper presents results from nineteen UAV surveys conducted between January 2020 and January 2021 at Ploče, an artificial beach in Rijeka (Croatia). The beach was nourished twice and eleven storm events, ranging from weak to strong, were recorded during this period. The Agisoft Metashape software was used to obtain point clouds and digital elevation models (DEMs) from UAV images; Matlab and CloudCompare were used for further analysis of the DEMs. The accuracy and precision of the DEMs was assessed and uncertainty levels of ±5 cm were applied to all derived DEMs. The study provides new insights into the response of the emerged part of the beach to storms. Predictably, the largest changes were recorded after the first storm following beach nourishment. The longshore variability in the beach response to storms was identified from full 3D point clouds. Most of the lost sediment was from the east side of the beach, while the rest of the beach aligned with the predominant wave direction through cross-shore and longshore processes. Offshore/onshore sediment exchange between the lower and upper beach face on the western side manifested itself in beach profile steepening and berm formations. Overall, changes in beach volume and area were small, indicating that this artificial beach is relatively stable. The embayed layout following the natural coastal configuration appears to be effective in retaining nourished sediment on the beach. This work highlights the need to consider pocket embayed beaches in three dimensions, as traditional transect studies can overlook the three-dimensional behaviour. This study also highlighted the wider potential of UAVs and SfM for studies of high-resolution elevation changes on natural and artificial beaches, as well as for coastal monitoring of beach nourishment.
1. Introduction
Artificial beaches, defined as beaches where ‘the shoreline has been moved seaward to a point never been reached naturally before or during the last century’ [1] have been built all along the world’s coastlines. Many are built for recreational purposes (e.g., [1,2,3]) but also for protection from coastal erosion [4,5] and flooding [1].
Understanding the processes that affect their stability and performance in protecting the coastline is important for coastal practitioners involved in design and maintenance of these beaches. Monitoring provides vital information on beach responses to a range of environmental conditions.
There are many factors that affect longevity of beach nourishments such as exposure to waves and in particular storm waves, their shape and other geometric parameters such as length [6,7], width and slope, and quality, density and grain size of fill material. Their stability is often enhanced by groynes, artificial headlands [8] and submerged sills [9,10]. As these beaches are built in environments where coastal erosion is dominant or local environmental conditions do not support the formation of natural beaches, they require regular maintenance and sediment replenishment. In turn, longevity of replenishment is linked to the number of storms and other factors described above as well as placing nourished material on the higher part of the beach and the longshore sediment spreading rate [11]. Previous studies found that initial losses are large [12,13], which is according to the theory of beach nourishment due to large morphodynamic adjustments in initial stages of beach nourishment [7]. This is followed by relatively moderate changes and the beach profile equilibration by wave driven longshore and cross-shore sediment transport. Liu et al. [14] found that equilibration of beach profiles on a micro-tidal beach is dependent on storms and how soon after the nourishment they occur.
In addition to loss of material by coastal processes, the abrasion of gravel sediments can account for a significant share of the total beach sediment loss. The intensity of sediment abrasion depends on local conditions, such as wave action, type and shape of sediment, proportion of time beach been exposed to wave action, etc [15,16,17,18]. The theoretical expression for the evaluation of abrasion of gravel sediments is not defined. Further studies based on in situ measurements are needed to incorporate abrasion into the sediment budget [17].
Performance of nourished projects has been assessed by using beach volumes and volume losses [12,14] but also via assessing other parameters such as beach width [12] and beach orientation [8,19]. Simple models have been developed to predict the performance (e.g., [20]) but these are mostly based on monitoring of sand nourishment projects. Studies of performance of gravel nourishment are rarer (e.g., [19,21,22,23,24]) and based on monitoring of pre- and post-nourishment beach elevations or shoreline positions.
Monitoring and analysis of changes in the volume and width of nourished beaches is crucial to inform any beach re-nourishment programme. A range of newly developed remote sensing technologies and techniques have been applied to monitor evolution of beach nourishment over shorter and longer time-scales. Video monitoring [8,12,13,19] provides information at very high temporal and spatial resolution but it is limited to assessment of beach planform changes in micro-tidal areas. Although, detecting 3D changes and calculation of beach volumes is possible for intertidal area in macro-tidal environments. Advances in satellite imagery [25,26] provide images taken at shorter time intervals (e.g., several days) and of higher spatial resolution (e.g., 10 m), which can then be used for assessment of shoreline changes. The advantage is that these images cover large world areas and are freely available (e.g., Sentinel 2) and available in developing countries. However, only shoreline changes and slopes are assessed from images and the spatial resolution is still too large for assessing changes on small beaches [27,28]. Airborne and terrestrial LiDAR images provide 3D point clouds from which detailed Digital Elevation Models (DEMs) are developed. These still provide the most valuable information, which can be used to analyse a range of parameters such as beach volume, slopes, changes in beach elevation, width and shoreline and other geomorphological features [29], but they are relatively expensive and logistically demanding. In geomorphological studies of the last decades, structure-from-motion (SfM) photogrammetry is increasingly applied. Image acquisition using unmanned aerial vehicles (UAVs) and the structure-from-motion (SfM) photogrammetric approach for image processing have enabled the derivation of high-resolution 3D point clouds and digital elevation models (DEMs). This low cost method is based on the processing of three-dimensional clouds generated from a series of photographs [30,31]. These measurements are fast, relatively inexpensive, and simple in operation and application. It has been shown that in inaccessible locations, the use of SfM photogrammetry has significant advantages over the use of a laser scanner. New developments in SfM photogrammetry have led to an increase in the accuracy of the point clouds at comparable level with LiDAR’s accuracy [30,32,33]. It has been applied in many beach morphological studies in last decade [34,35,36,37,38]. However, monitoring of larger scale features is more challenging. The performance of SfM photogrammetry for monitoring topographic changes in coastal environment is difficult to control as it depends on many factors such as tides and waves, lighting conditions, camera position, surface reflectivity, texture and roughness, all of which will affect accuracy of measurements [33]. This requires extra caution when using SfM photogrammetry for monitoring. James et al. [32,39] suggested that defining a 3D precision map is imperative to reduce or account for the uncertainties in the changes detected.
The motivation for this study is to develop a robust, inexpensive and easy to apply coastal monitoring system based on UAVs and SfM photogrammetry, which would accompany the re-nourishment of natural and artificial beaches in Croatia. Many artificial gravel beaches were built along the East Adriatic coast (EAC) for the purpose of tourism in last decades and they are increasingly becoming a useful form of soft coastal defence. They are designed to mimic natural gravel pocket beaches but their stability is dependent on regular, mostly annual, replenishment [40]. However, volumetric losses and time taken for these losses to occur is not monitored and hence not much is known on stability and longevity of these beaches. Besides, few studies have been conducted on artificial gravel beaches (e.g., [4,41,42]) despite increased research on gravel beaches (e.g., [43]). So far SfM photogrammetry and UAVs have been used in EAC to monitor natural gravel pocket beaches (GPBs) [3,36,44,45], coastal cliffs stability and coastal vulnerability [46,47,48,49,50].
Having detailed point cloud and DEMs rather than just beach profiles has been shown to be advantageous when analysing changes on GPBs in Croatia, due to the dynamic changes in the beach orientation and hence longshore variation in the beach slope and the beach width [3]. DEMs were derived using SfM photogrammetry and images obtained by a hand-held camera [3] and UAVs [44]. The study presented here is an extension of this work.
The aim of this particular study is to utilise UAV surveys and SfM photogrammetry to assess beach nourishment performance of the Ploče beach in storm conditions. The objectives are to evaluate accuracy of UAV surveys, which can then be applied in estimating different beach parameters and to assess beach nourishment performance in terms of beach volumes and other parameters—such as changes in the beach elevation, the shoreline position and the beach areas.
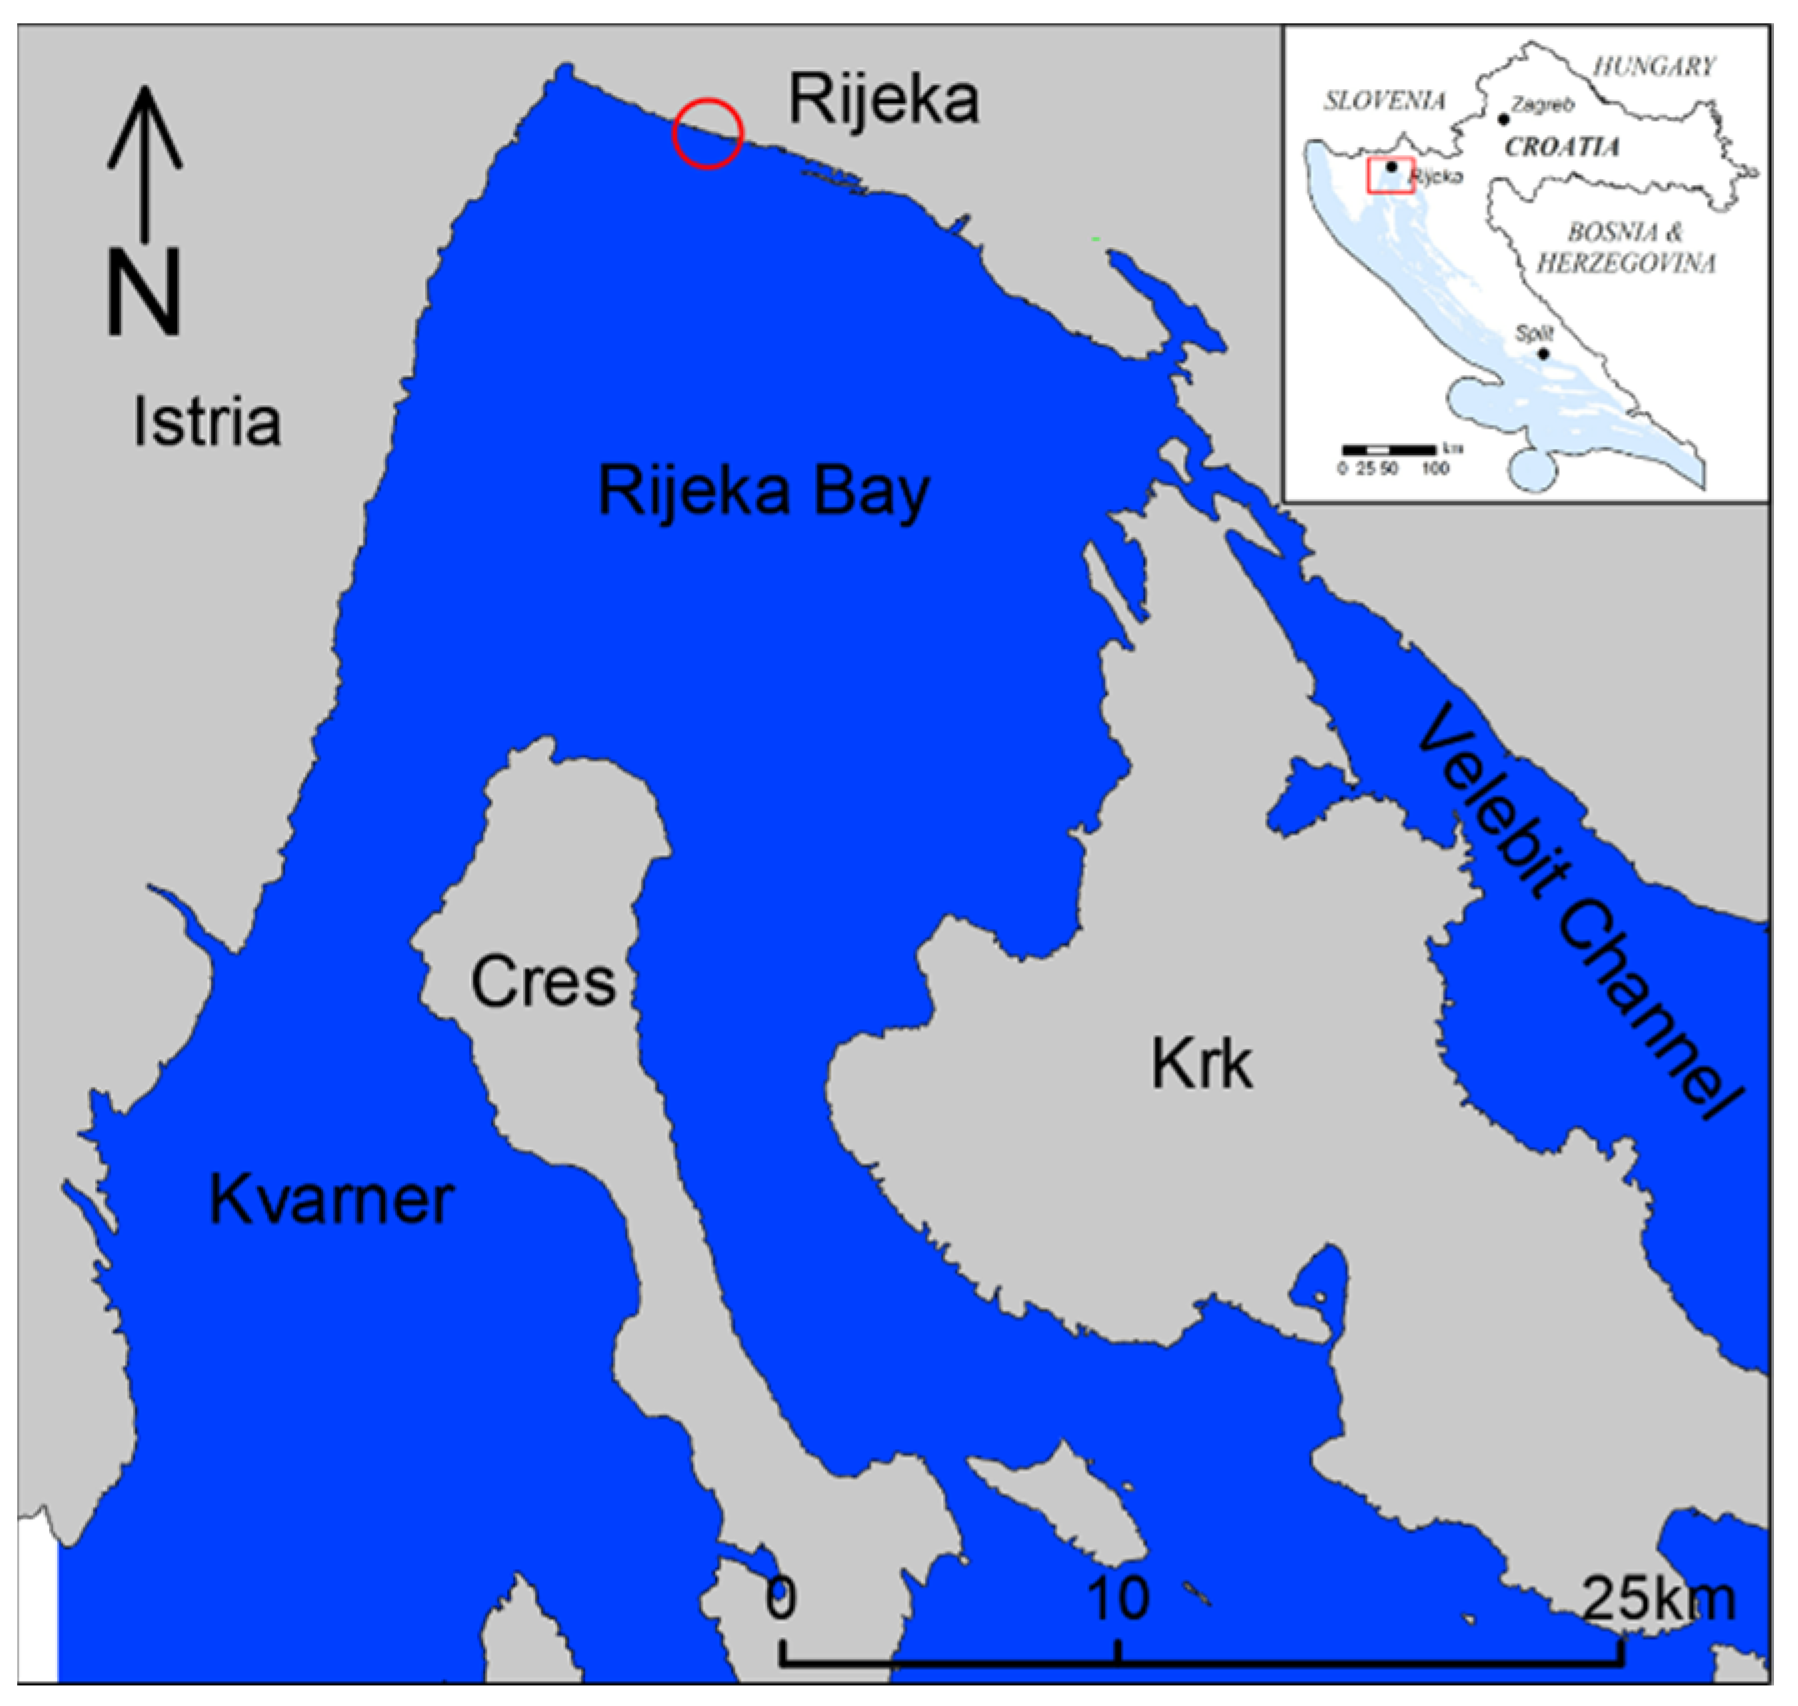
The study contributes to an overall aim of the Beachex project [51], in examining the mechanisms of erosion and restoration of gravel beaches and providing technical support for long-term beach nourishment in Croatia. The ultimate aim is to better understand the response of artificial beaches to the variation in external forcing. Field studies are taking place on the Ploče beach in Rijeka (Figure 1), an artificial urban gravel beach constructed in 2011. The beach is subject to strong erosion, which takes place every autumn/winter season, and a beach nourishment takes place before every summer season.
This paper presents results from nineteen UAV surveys conducted during 2020 to assess the post-nourishment changes at an artificial beach Ploče, resulting from changes in the local wave climate.
The paper is organised as follows: the beach site at Ploče is described in Section 2, followed by a description of the data acquisition, the DEMs, the evaluation of the DEMs’ errors and the methods used for the data analysis. The results of the analysis of beach volumes, beach areas, shoreline position and elevation changes are presented in Section 4. These are linked to storm wave energy. The paper concludes with a discussion of the ability of UAV technology to monitor beach nourishment as well as the performance of beach nourishment in the first phase after nourishment and under the influence of storm waves.
2. Study Site
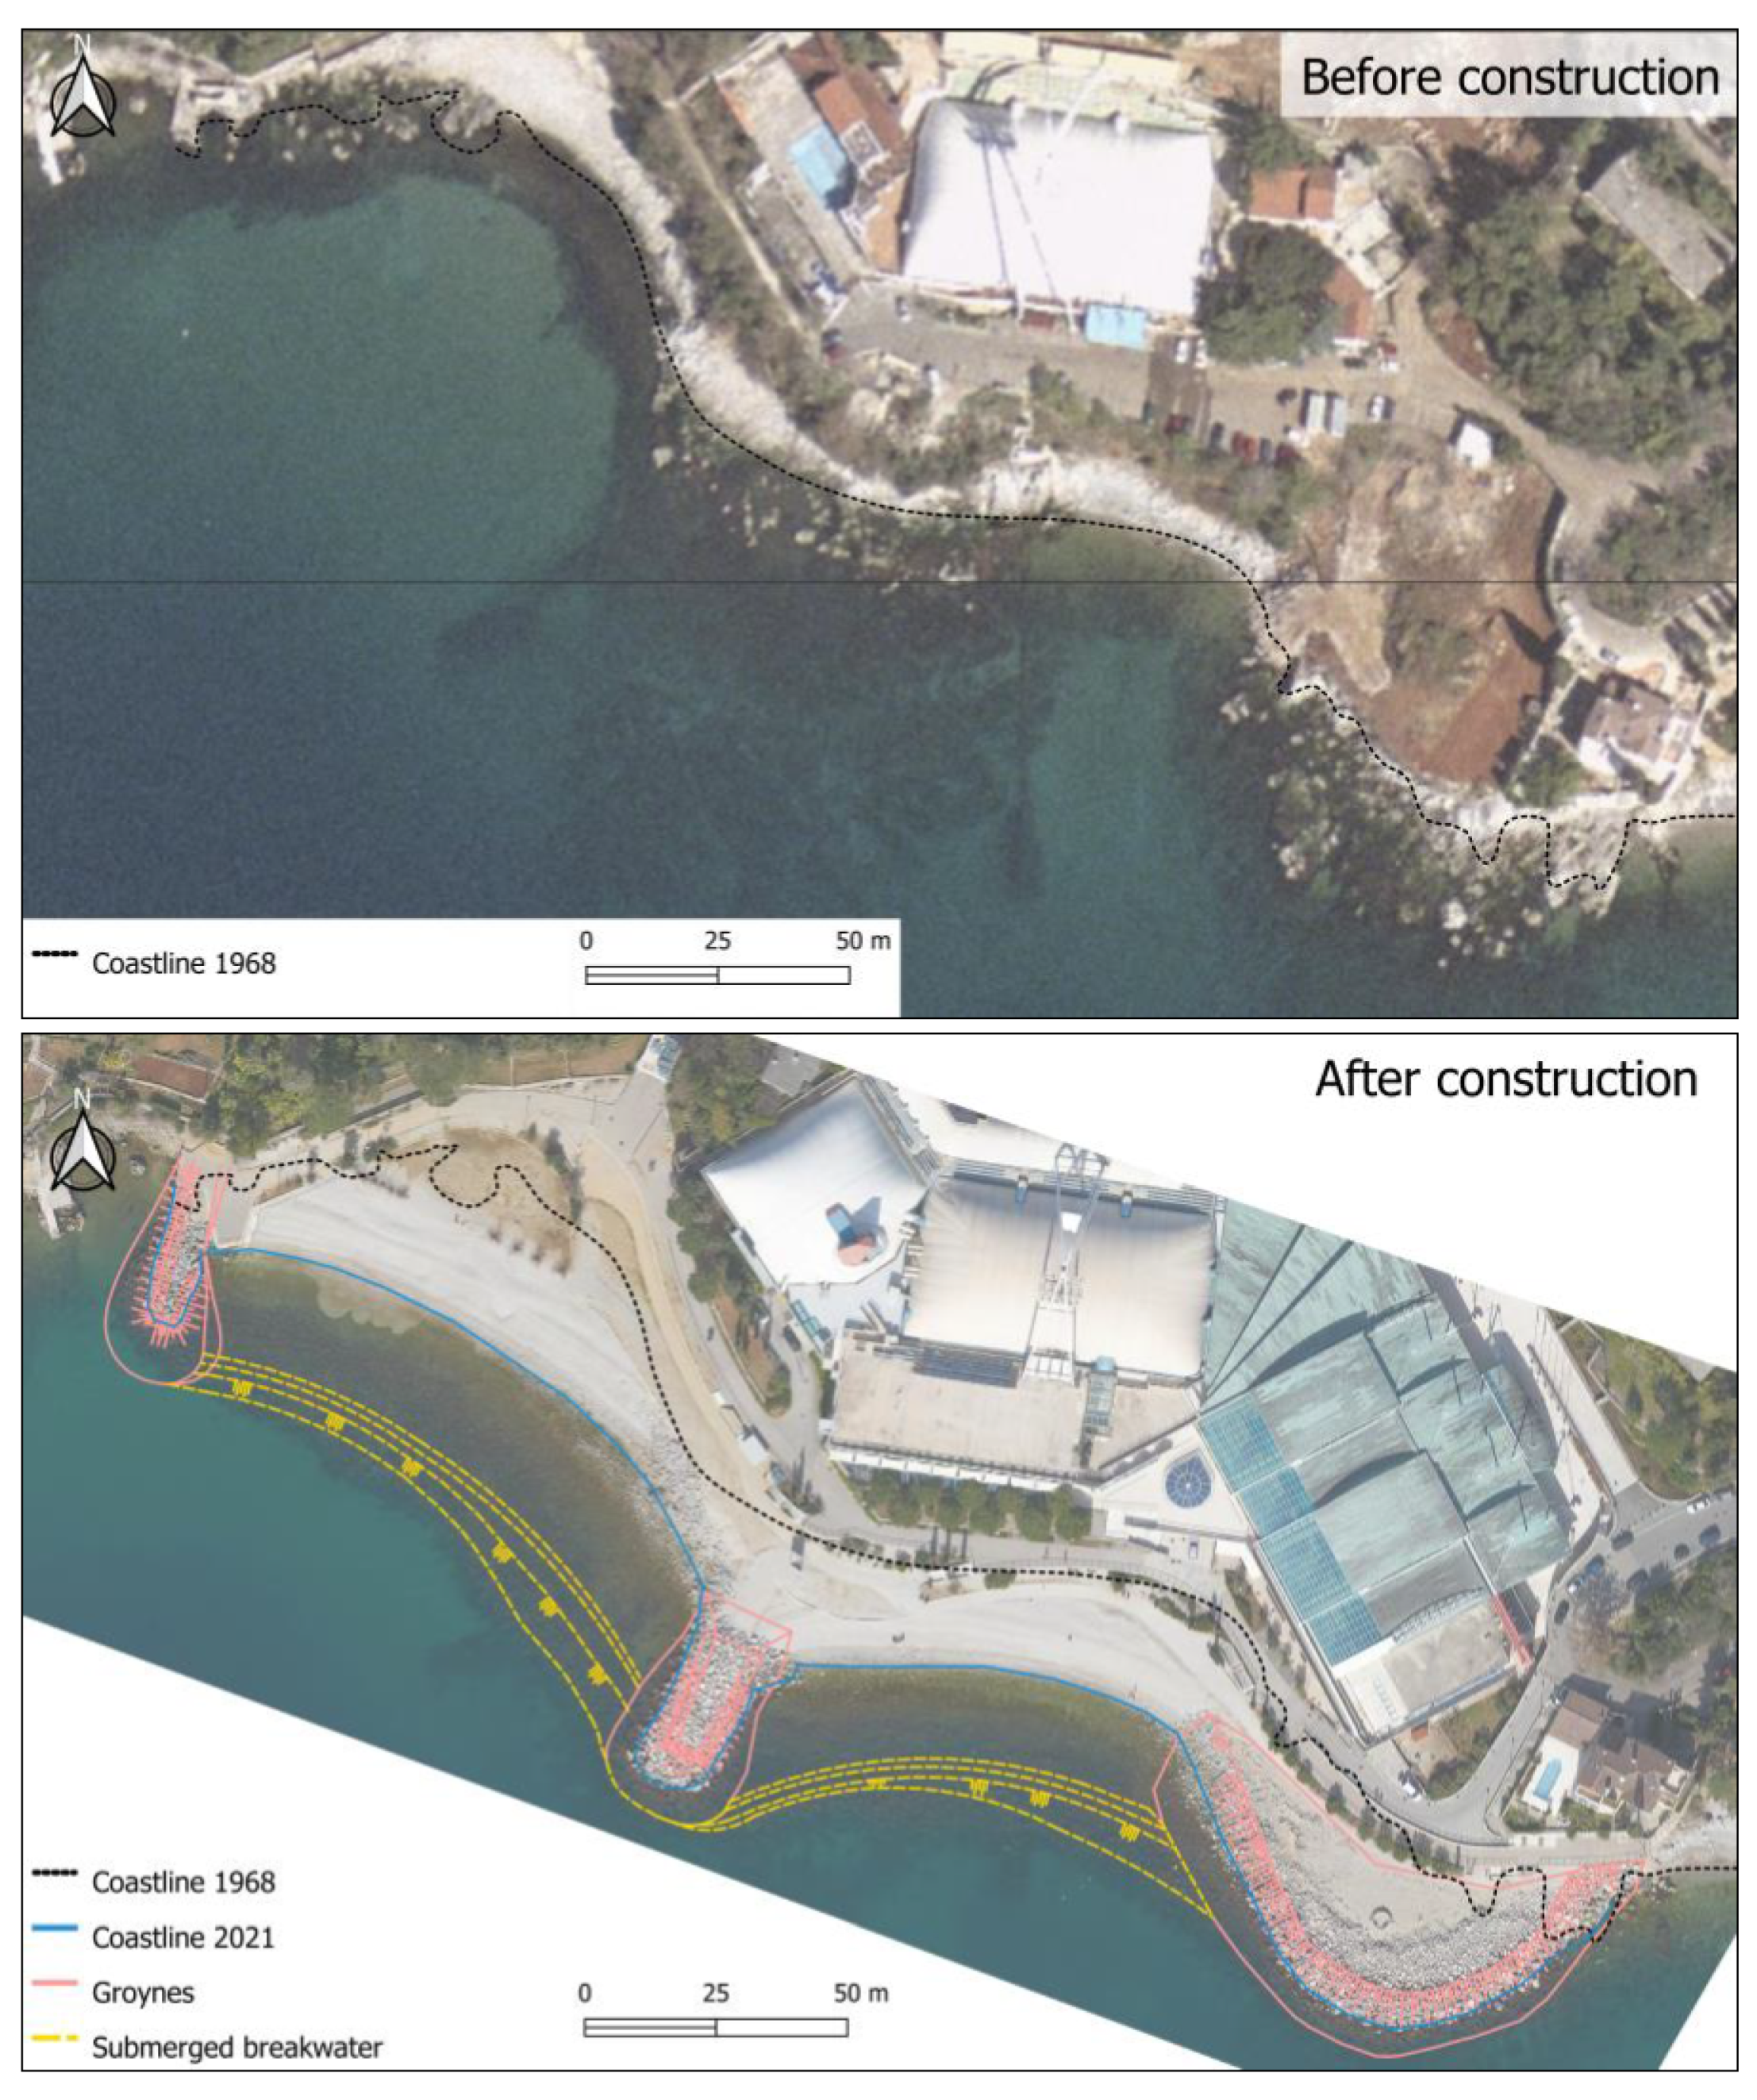
The Ploče beach is the largest beach complex in the city of Rijeka, with a total area of 14,000 m2. The beach is located at the western outskirt, 6 km from the city centre (Figure 1). This artificial beach was built in 2011 as a part of the Rijeka swimming pool complex. The new beach is constructed across two existing natural embayments. It is protected by three groynes, which are extended from existing headlands. The middle groyne separates it into two pocket beaches—the eastern and the western beach, both about 130 m wide (Figure 2). A submerged breakwater about 2 m wide was built at the steep seabed (Figure 2) with the crest at 2.5 m depth. At the landward side, the beach is backed up by a promenade. Once these structures were built, the existing beaches were extended by adding material on the beach. The material used for the construction of the beach is gravel with D50 of 32 mm and supplied from the river Drava in northern Croatia.
Before the summer bathing season, the city of Rijeka replenishes the beach to compensate for material lost during winter season. The main purpose is to maintain the beach area used for sunbathing. The material is placed on the eastern side, while the sediment accumulated on the top of the western side of the beach is distributed across the beach. As a result the beach profiles are flattened. Table 1 shows the amount and size of sediment, as well as the price spent on replenishment in recent years. It is interesting to note that recent amount of replenished sediments reduced and that sediment is sourced from a river in the northern Croatia.
The beach was renourished with approximately 150 m3 of material (D50 = 32 mm) on 31 January 2020, for purposes of this study. The beach was re-nourished again just before the summer season in 2020 with approximately 100 m3 of material. Hence, performance of these two nourishments will be examined. The focus of this study is on the western beach and in the rest of the paper it will be referred as the beach.
The tidal oscillations in the Adriatic Sea are small. The mean daily sea amplitude is 0.35 m measured at the tide gauge station in Bakar about 15 km east of the site, the only tide gauge station in the Kvarner Bay [53]. The region is also known for flooding events or so called acqua alta events. The high sea level during these events is formed by a constructive superposition of tide, storm surge, seiche, and other low-frequency fluctuations [54]. The storm surge is the predominant component, the range of which depends on the location of low-pressure and the strength and direction of the wind (mainly Scirocco). The highest measured water level was 1.27 m on 1 November 2018 [55].
While wave measurements have been carried in the open sea [56,57], measurements in coastal waters in the Adriatic Sea are rare and intermittent [58,59]. The wind waves are dominant in the Kvarner Bay as in the rest of the Adriatic Sea. Weak and moderate winds with frequent periods of calm conditions prevail in the Kvarner region, while storm winds with speeds of over 30 m/s are rare and short-lived [60,61]. Due to relatively limited fetches and the sheltering effect of islands, the wave heights and wave periods are relatively small. The maximum significant wave height of 2.06 m was recorded at a wave buoy deployed offshore of Rijeka, between 2009 and 2011 [59].
3. Methodology
The Ploče beach was surveyed 19 times between 17 January 2020 and 26 February 2021, outside the summer season and mainly after storm events. The waves were measured offshore between 1 January 2020 and 30 January 2021 (see Section 3.4).
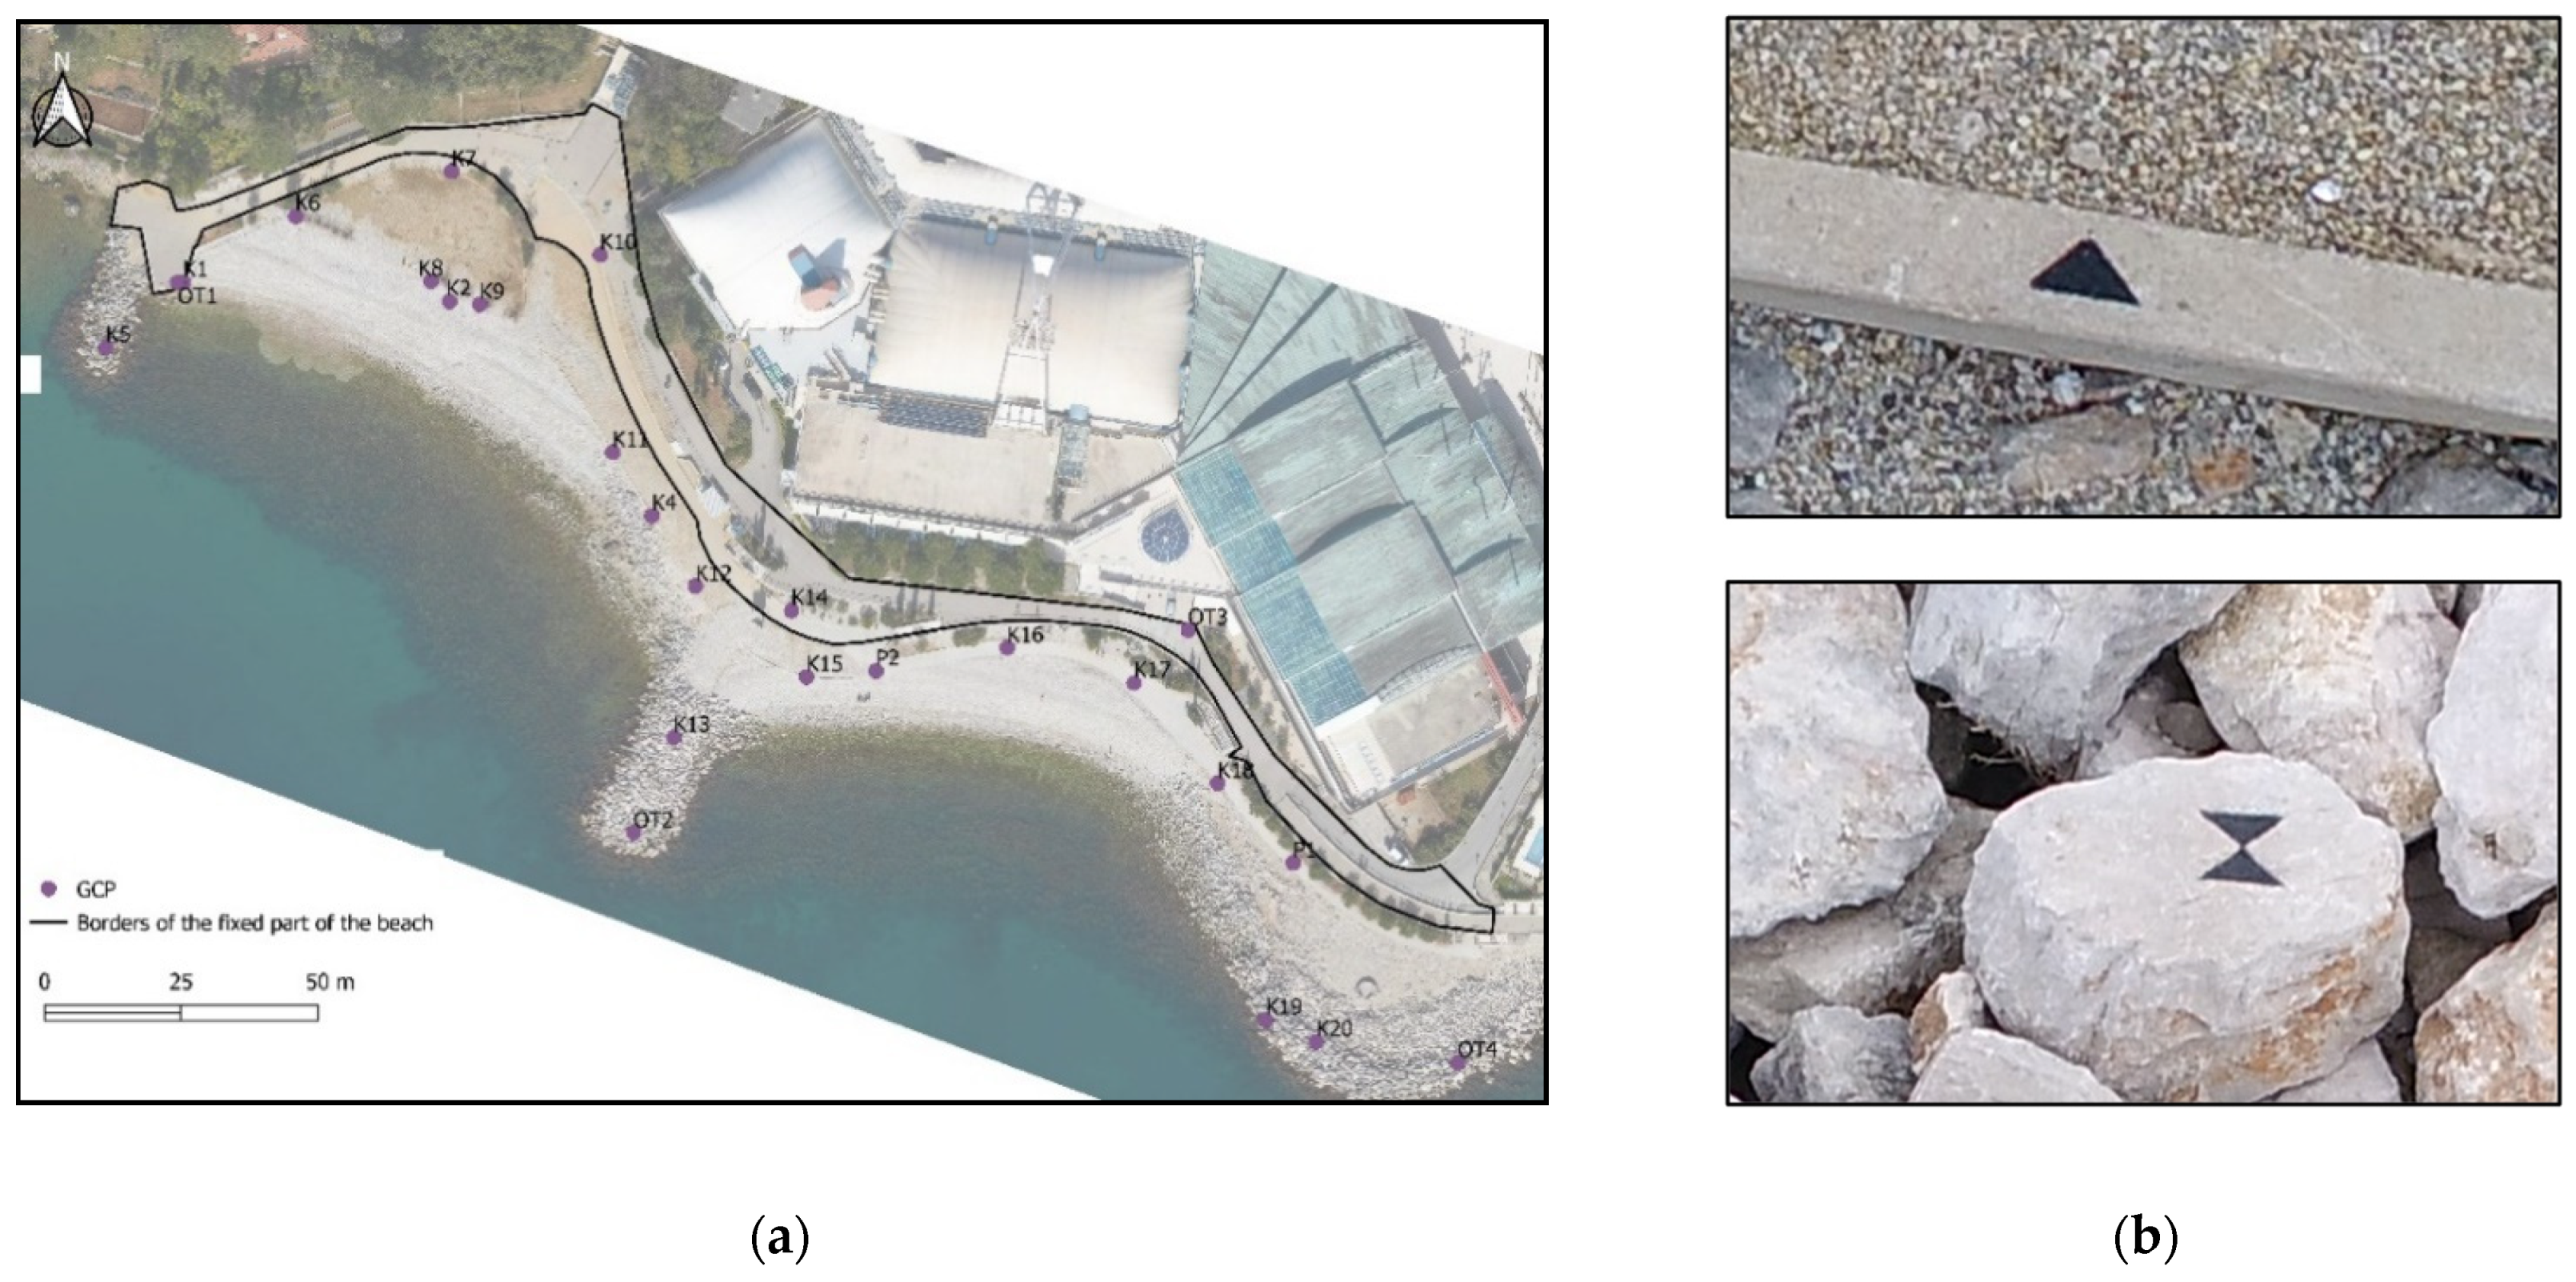
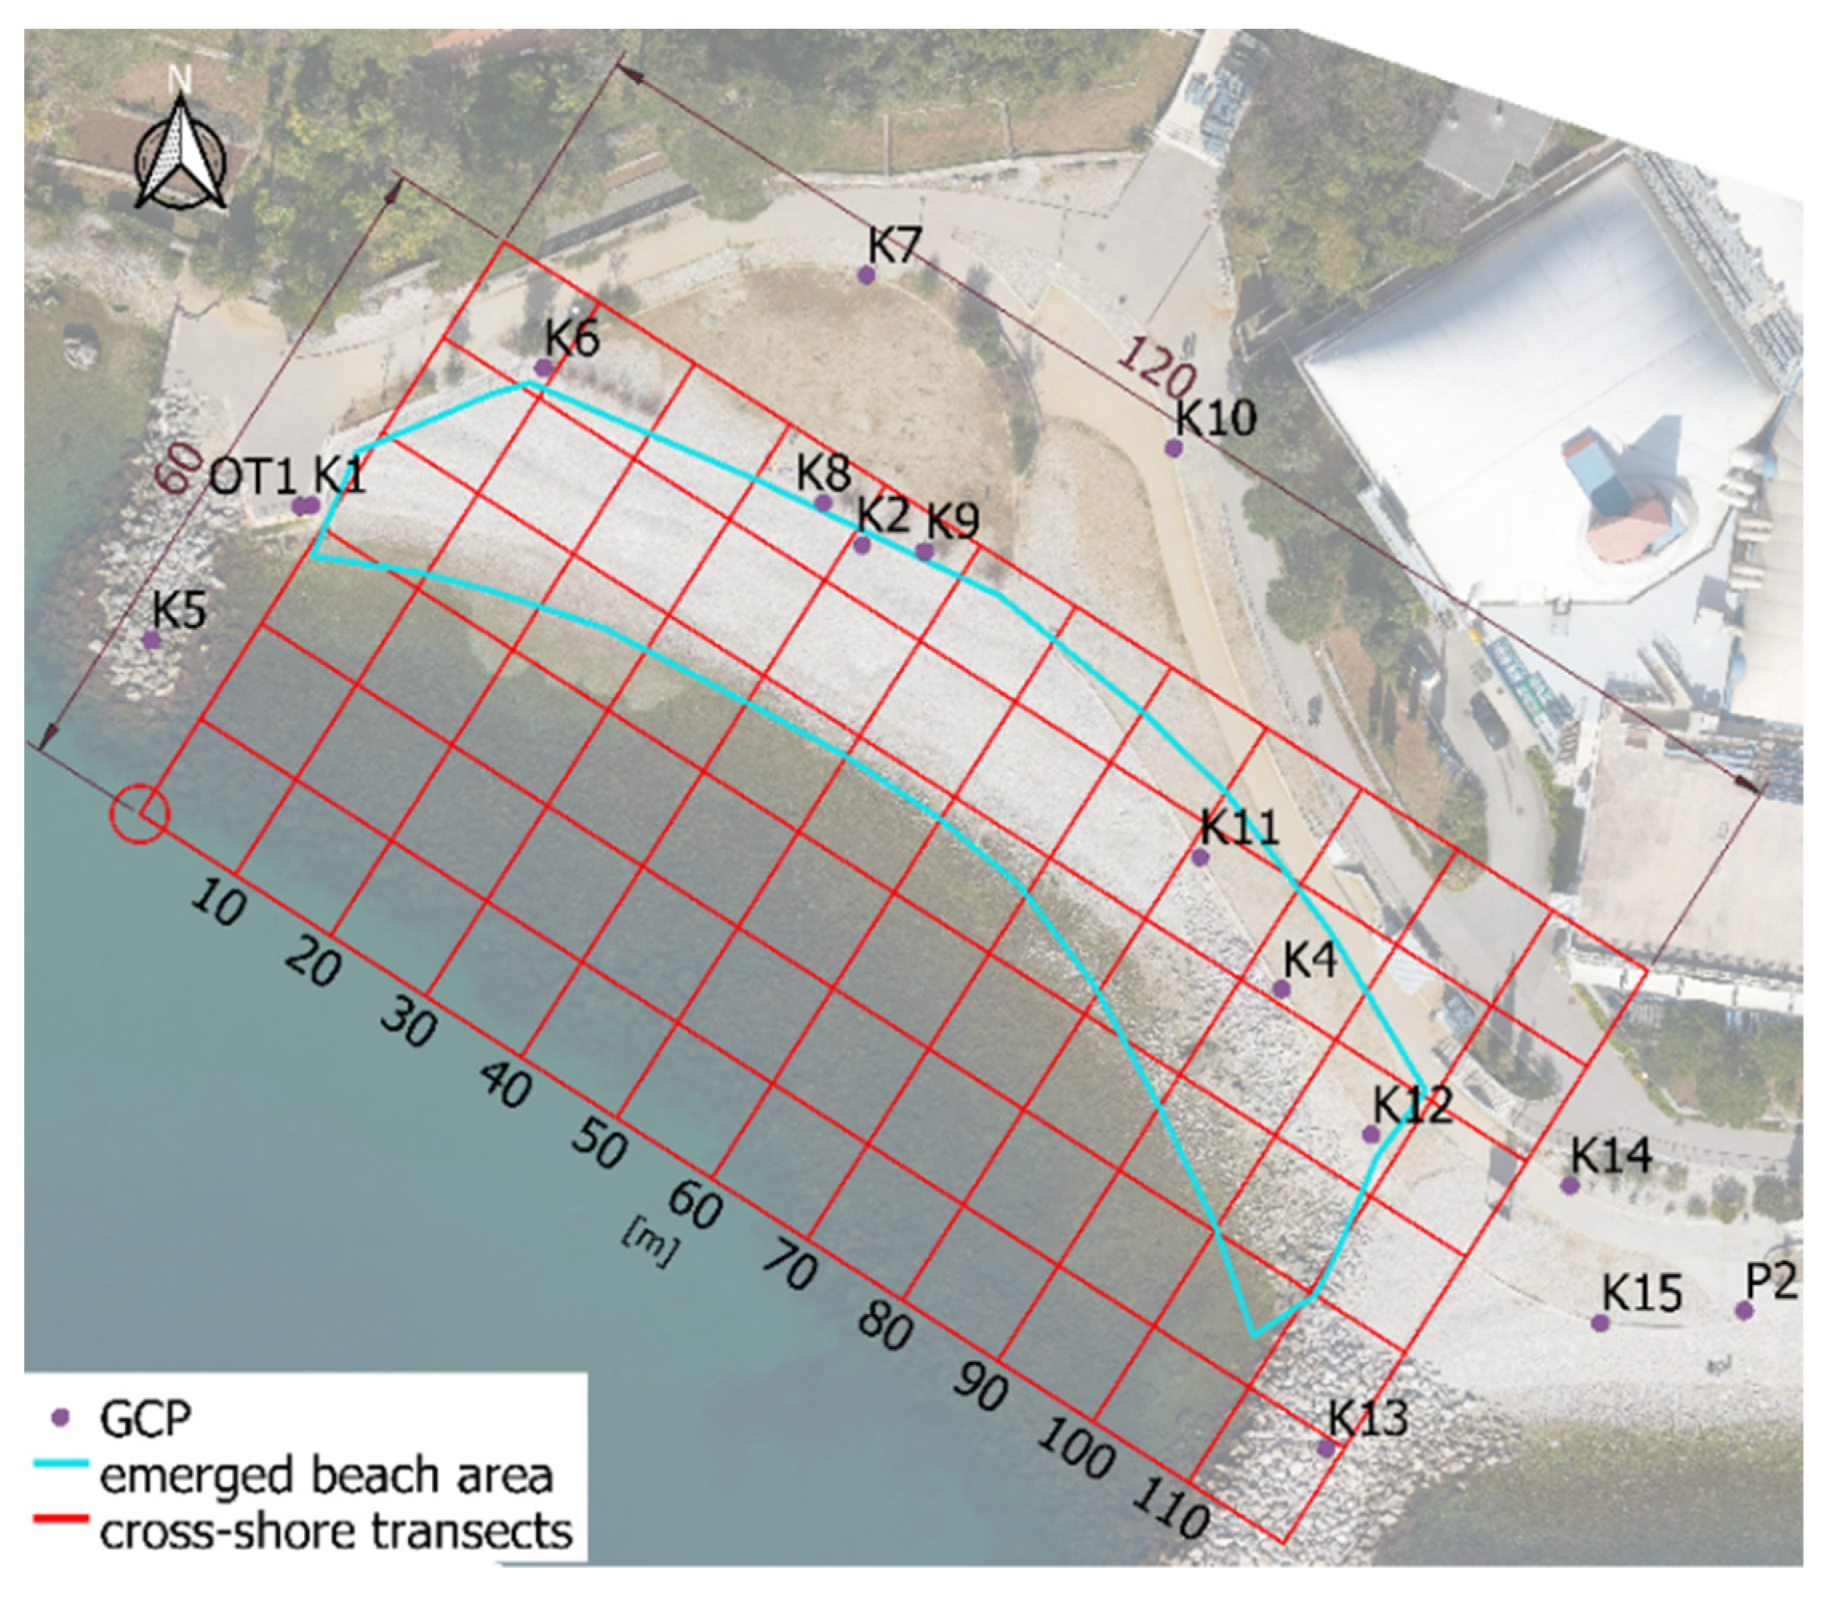
Prior to the first survey, twelve ground control points were marked along stable parts of the beach, namely the promenade and groynes (see Figure 3) by the Geodetic institute Croatia (GZR). Coordinates for the GCPs in the Croatian Terrestrial Reference System HTRS96 (EPSG: 3765) were obtained with a total station Leica FlexLine TS06plus (Leica Geosystems AG, Heerbrugg, Switzerland), which provides the high accuracy of around 1.5 mm [62]. In April 2020, additional 16 GCPs were marked and old GCPs were surveyed again to check whether they remained stable. The GCPs are distributed around the entire analysed beach area to avoid extrapolation in the area of the interest. Once they were marked (Figure 3), the aerial surveys using Unmanned Aerial Vehicles (UAVs) were relatively quick. Usually it would take about an hour to complete the beach survey.
The first and the second survey (UAV_01 and UAV_02) were carried out before and a few days after the aforementioned nourishment of the beach, respectively. The eleventh survey was conducted after the second nourishment before the 2020 summer season. The surveys were conducted during calm periods after the storms and were planned according to the weather forecast of the Croatian Meteorological and Hydrological Service [63] and observed weather and sea conditions.
3.1. Image Acquisition and Processing
The surveys were carried out by two institutions—Geodetic Institute Rijeka (GZR) and the Faculty of Civil Engineering in Rijeka (GradRi). GZR used a Matrice 200 unmanned aerial vehicle (UAV, DJI, Shenzhen, China) with a camera ILCE-7M2 (Sony, Tokyo, Japan) and GradRi used a Phantom 4 Pro UAV (DJI, Shenzhen, China) for the image acquisition. Mainly the camera at nadir was used to capture emerged beach and also shallow water. About 1/4 of the GradRi images were taken from different camera angles to obtain a complex emerged beach from lower flight heights. The overlap between images was kept constant, and more than nine overlapping images were used to cover the whole area. The number of images ranged from 208 to 667 and the flight altitude from 19.2 to 29 m, and 100–103 m for GradRi and GZR surveys respectively. Using cameras of different resolution and taking images from the different flight heights resulted in a range of ground resolution from 5.1 to 19.7 mm/pixel (see Table 2). Both institutions used Agisoft Metashape Professional (formerly Agisoft PhotoScan, Agisoft LLC, St. Petersburg, Russia) to generate point clouds from the captured photos. The workflow is described in several papers (e.g., [64,65]). The reprojection errors (distance between the calculated position of the point and its position marked on the images) after processing of images from both instruments are very similar, allowing comparison of point clouds. Table 2 summarises all surveys and gives details of the reprojection errors. The spacing between cloud points was 20 mm. Point clouds were subsampled to 50 mm, to speed up the Matlab analysis.
3.2. Assessment of Errors
The first assessment of the errors was based on Metashape’s calculation of the root-mean square error (RMSE) on GCPs. Check points were not used due to the insufficient number of GCPs and their coverage with beach sediments at first, and between 6th and 9th survey respectively. However, the RMSE does not distinguish between systematic (accuracy) and random (precision) errors and it is recommended to use an additional approach [66]. The second method used was comparison of point clouds on the fixed part of the scene using the freely available Multiscale Model to Model Cloud Comparison (M3C2) plugin in the CloudCompare software [67,68]. In addition to these quantitative analyses, beach profiles that included a stable promenade were qualitatively examined for any outliers.
Agisoft Metashape calculates the RMSE for X, Y and Z coordinates, the planimetric RMSE (XY) and the total RMSE for the GCPs as well as for some additional independent control points (Figure 3). The equation bellow is given for the total RMSE and the other RMSEs are calculated in a similar way:
where: Xi,meas—measured value for X coordinate for i GCP; Xi—value for X coordinate for i GCP; Yi,meas—measured value for Y coordinate for i GCP; Yi—value for Y coordinate for i GCP; Zi,meas—measured value for Z coordinate for i GCP; Zi—value for Z coordinate for i GCP.
Calculated RMSEs for the GCPs and for all surveys are given in the Table 3. The RMSEs for X and Y are below 8 mm while the planimetric (XY) RMSEs are below 10 mm. The vertical RMSE is on average lower than 10 mm, with the largest total RMSE being 13.4 mm. These values can be used as indicative metrics of survey performance and surveys two, ten and nineteen had the largest vertical RMSE, though still around 10 mm.
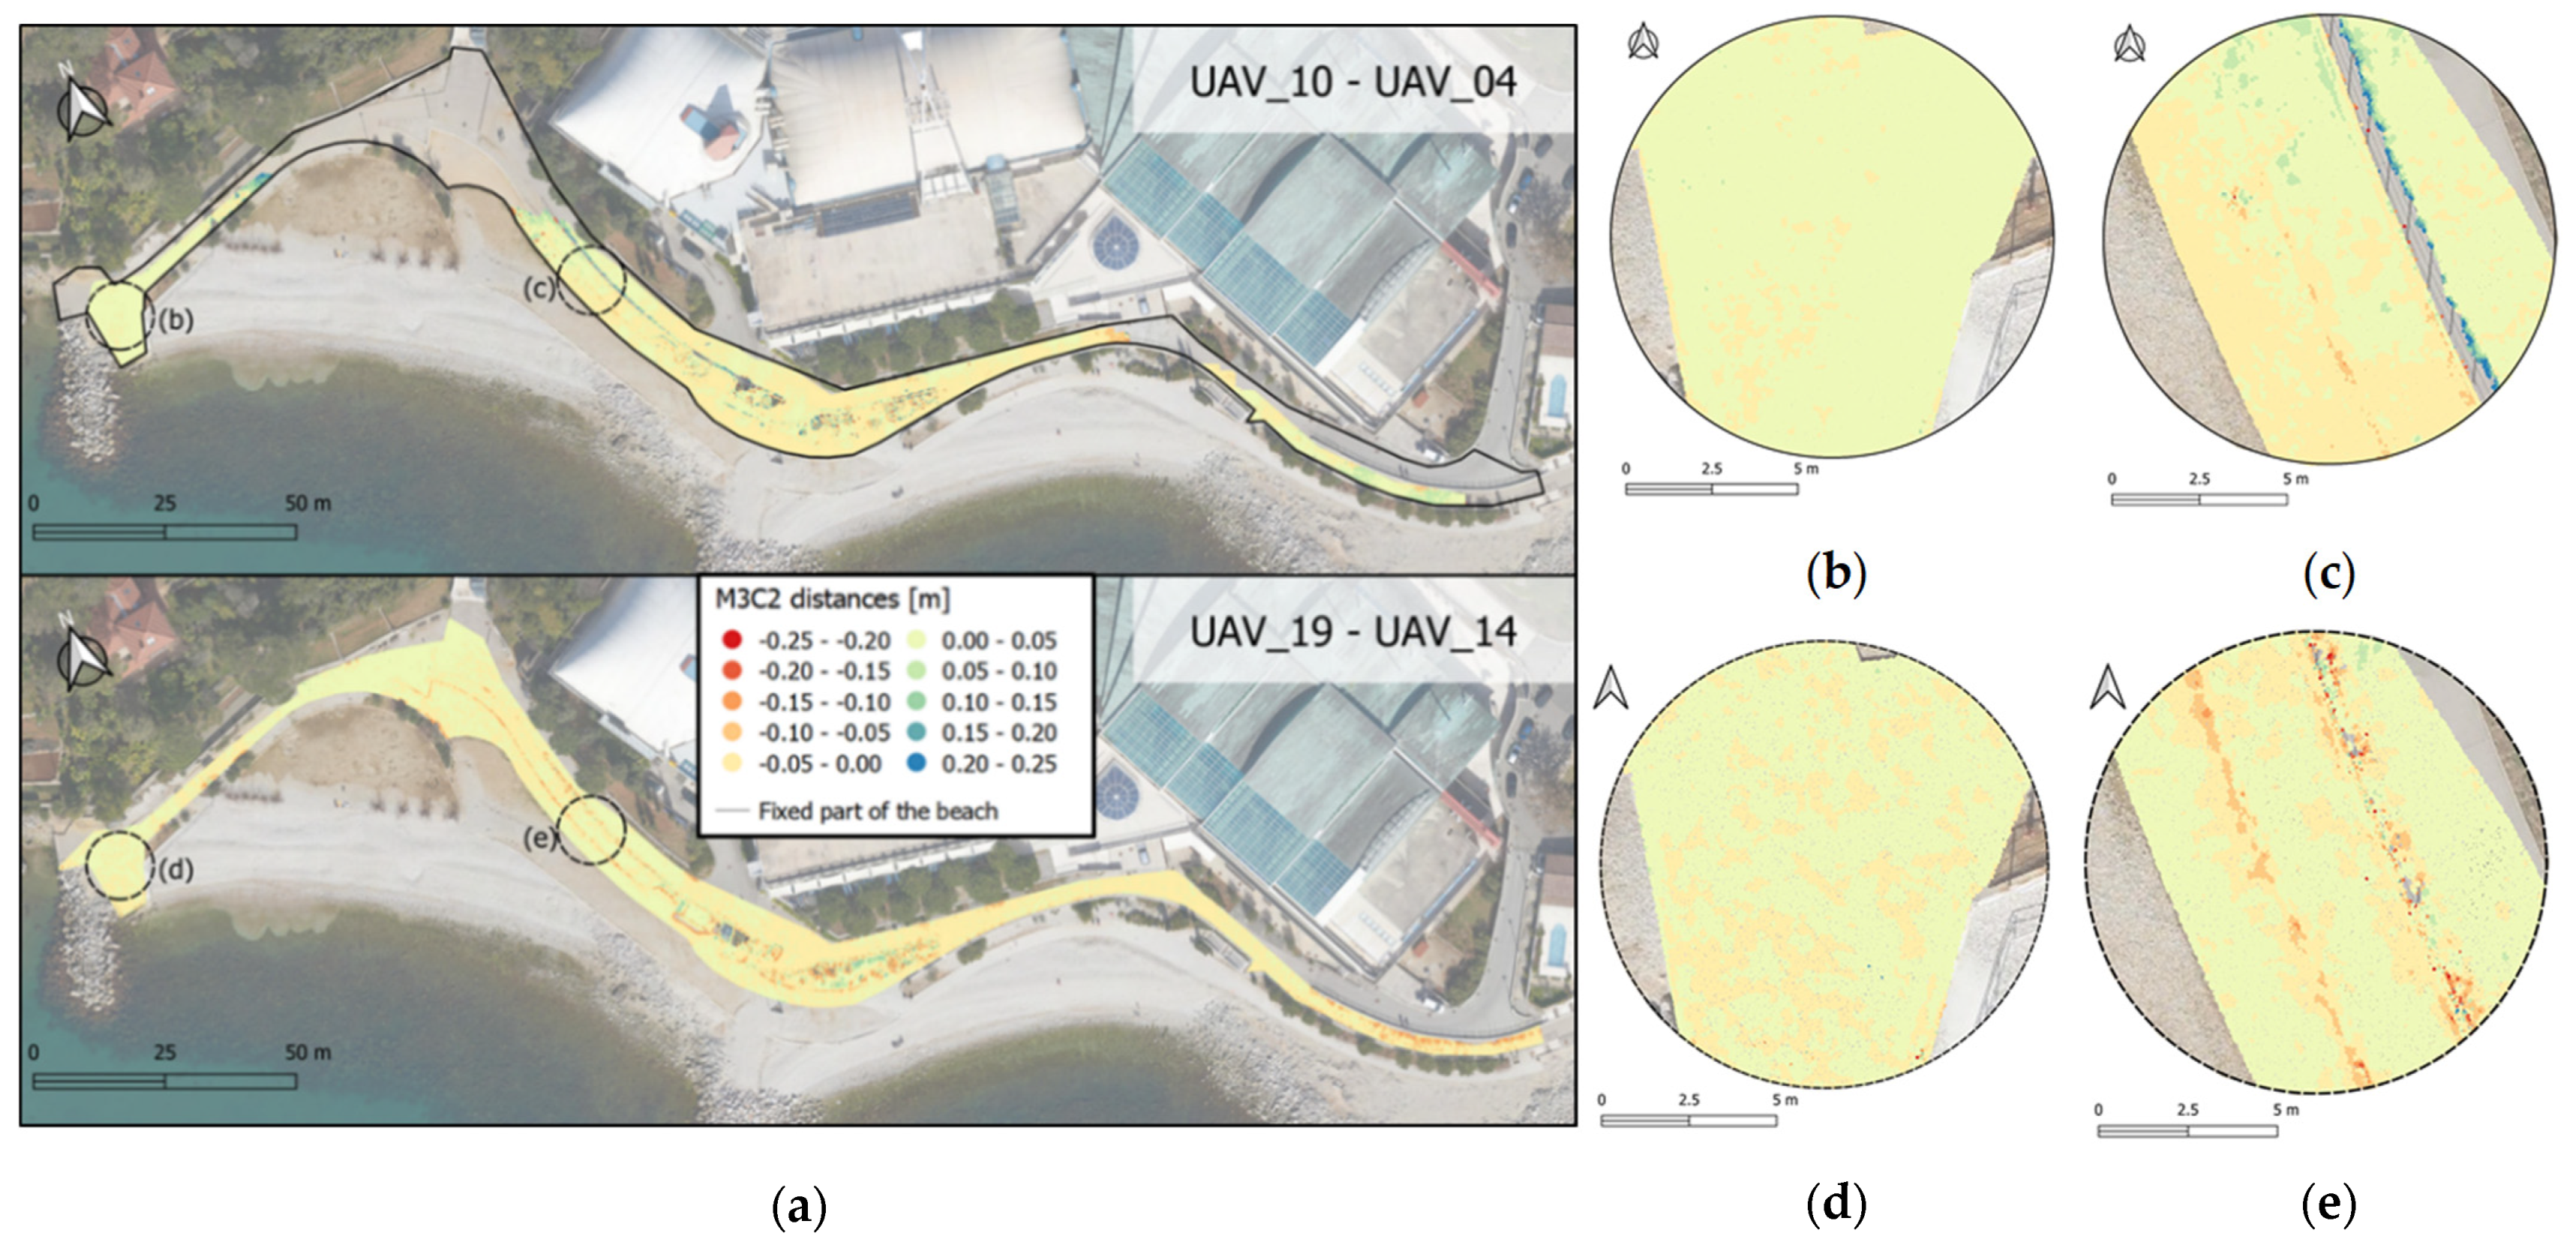
Next, the point clouds of all surveys (UAV_01–UAV_19) were compared on the fixed parts of the scene—along concrete promenade, paths and walls and stairs (Figure 3) using the Multiscale Model to Model Cloud Comparison (M3C2) plugin in the CloudCompare [67,68]. The plugin allows direct comparison of point clouds and detects changes with very little manual work. The algorithm is described in several papers (e.g., [32,68,69,70,71,72]), but the working principle is to find the most appropriate normal direction for points and calculate the distances between point clouds along a cylinder of a given diameter (the projection scale), projected along the normal.
The normal scale was defined as 25 times the average local roughness calculated for a point cloud by the CloudCompare, in accordance with the work of Ferrer-González et al. [71]. In our case, this value was 0.5 m and diameter of the search cylinder was 0.2 m. The mean and standard deviation values for the M3C2 distances were calculated and these are associated with the accuracy and the precision respectively.
Only a few comparison results are given for illustration purposes here; between 10th and 4th and 19th–14th surveys (Figure 4). The mean value of M3C2 distances for these cases were 0.0 and −0.04 m, respectively. The spatial distribution of the M3C2 calculated distances found the accuracies to be mostly between −0.05 and 0.05 m, and the results are shown in Figure 4. Larger values for the distance are only found in places where vegetation, fence or sediment from the beach is present or where an occasional pedestrian was ‘caught’ during the survey.
Based on the analysis of ‘changes’ on the fixed parts, level of detection is defined as ±0.05 m. Hence, the changes above 0.05 m and bellow −0.05 m can be accurately detected from the surveys.
3.3. Assessment of Beach Changes
Emerged beach changes were assessed using a few parameters: the beach elevation, the shoreline position, beach profiles and volumes. Beach elevation changes were calculated with the same M3C2 plugin in CloudCompare described above, comparing two successive surveys. The Matlab code was written to extract the position of the shoreline and cross-shore transects shown in Figure 5 from original point clouds.
Beach elevation changes smaller than the uncertainty levels (±0.05 m) were disregarded [32].
Beach volume calculations were derived from DEMs, which were generated in Matlab by linear interpolation from available point clouds with a resolution of 0.05 m. Volumes were calculated for the emerged beach area marked in Figure 5, integrating the sediment volume for each DEM cell according to reference level set at 0 m.
For volume analyses the error was taken into account. The possible volumetric errors (Err) were defined as follows:
where AUAV is the emerged beach area at the moment of surveying and Herr is previously defined elevation error (±0.05 cm).
3.4. Wave Measurements
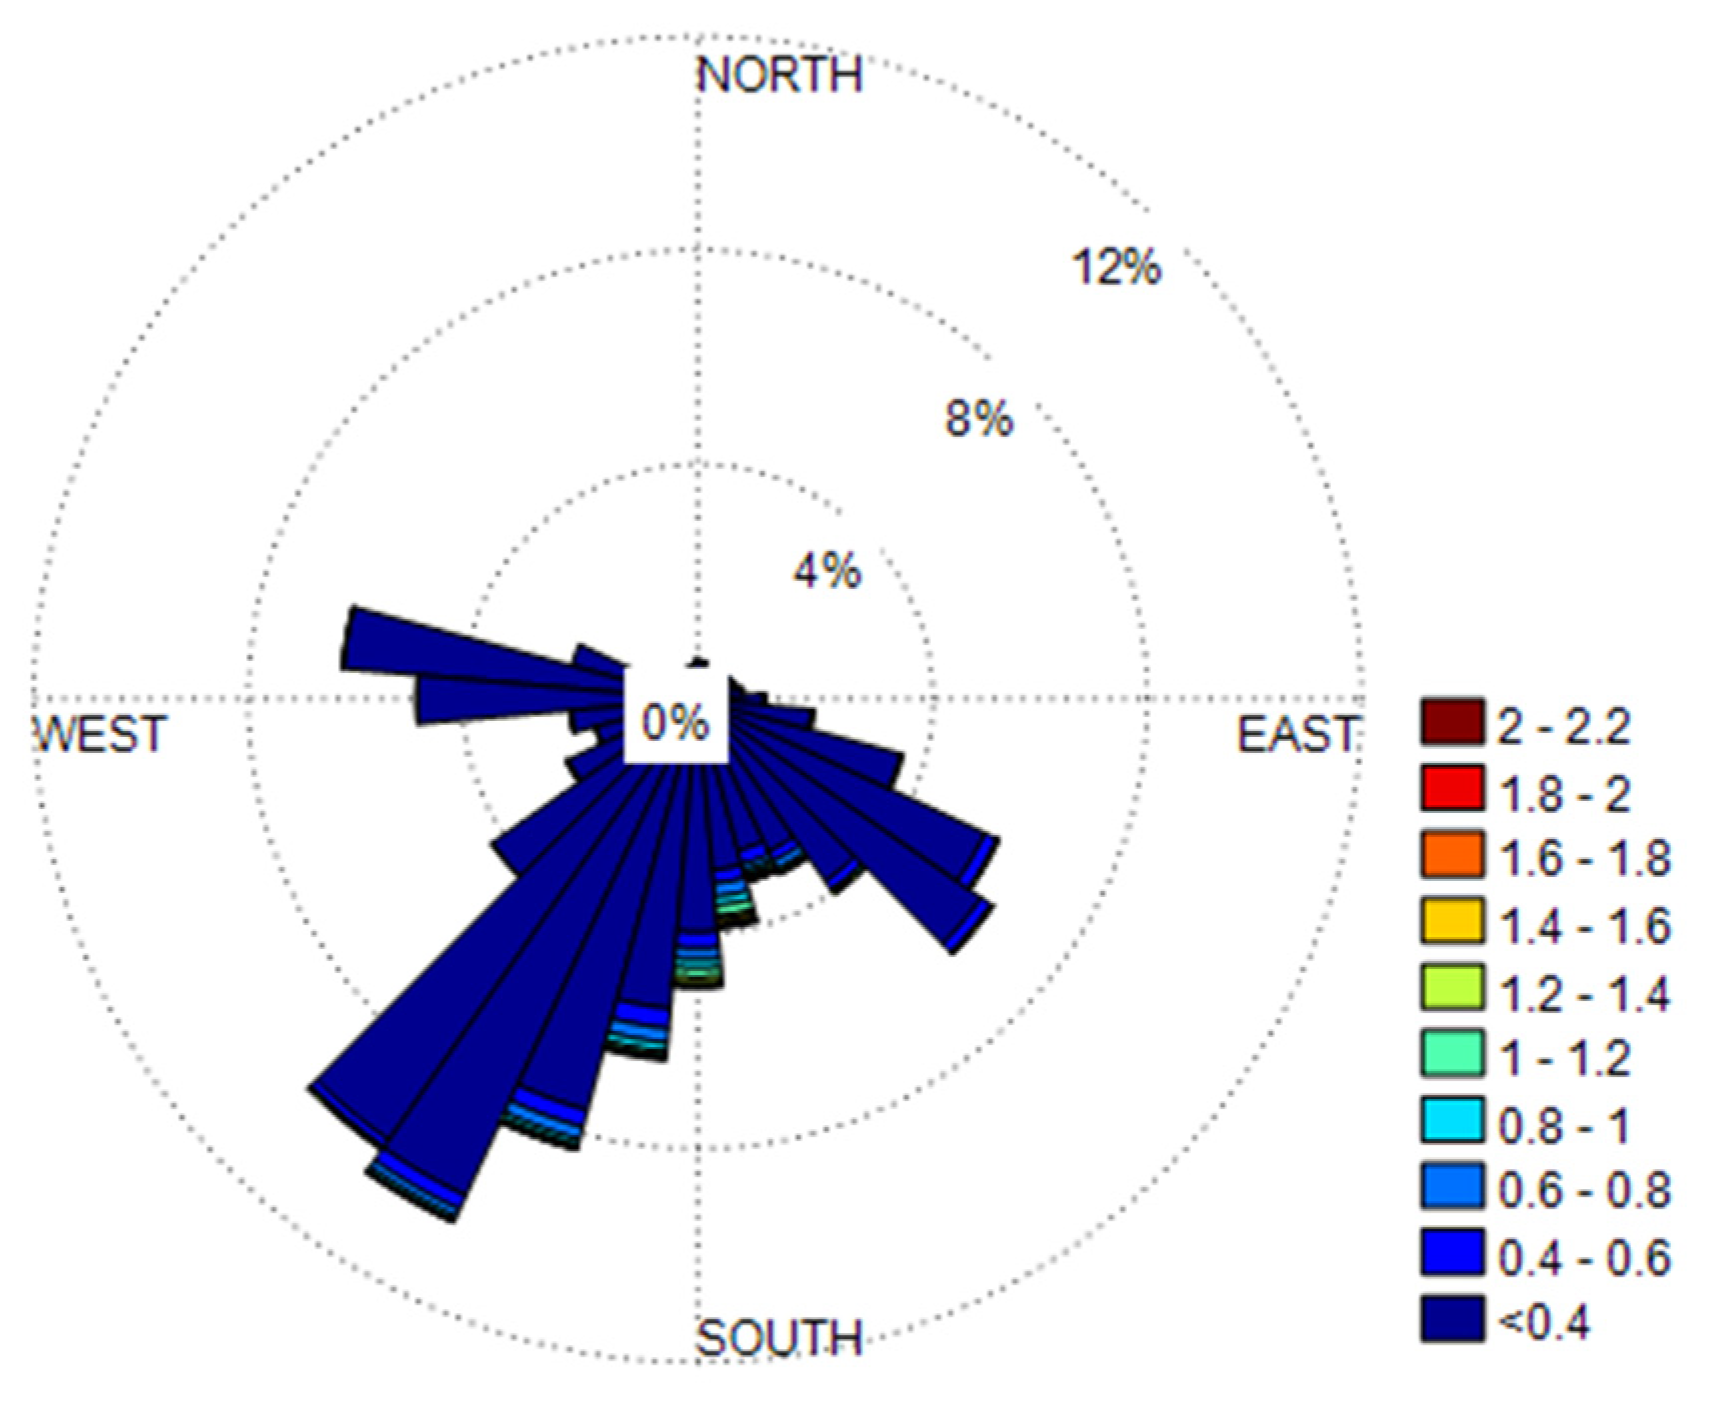
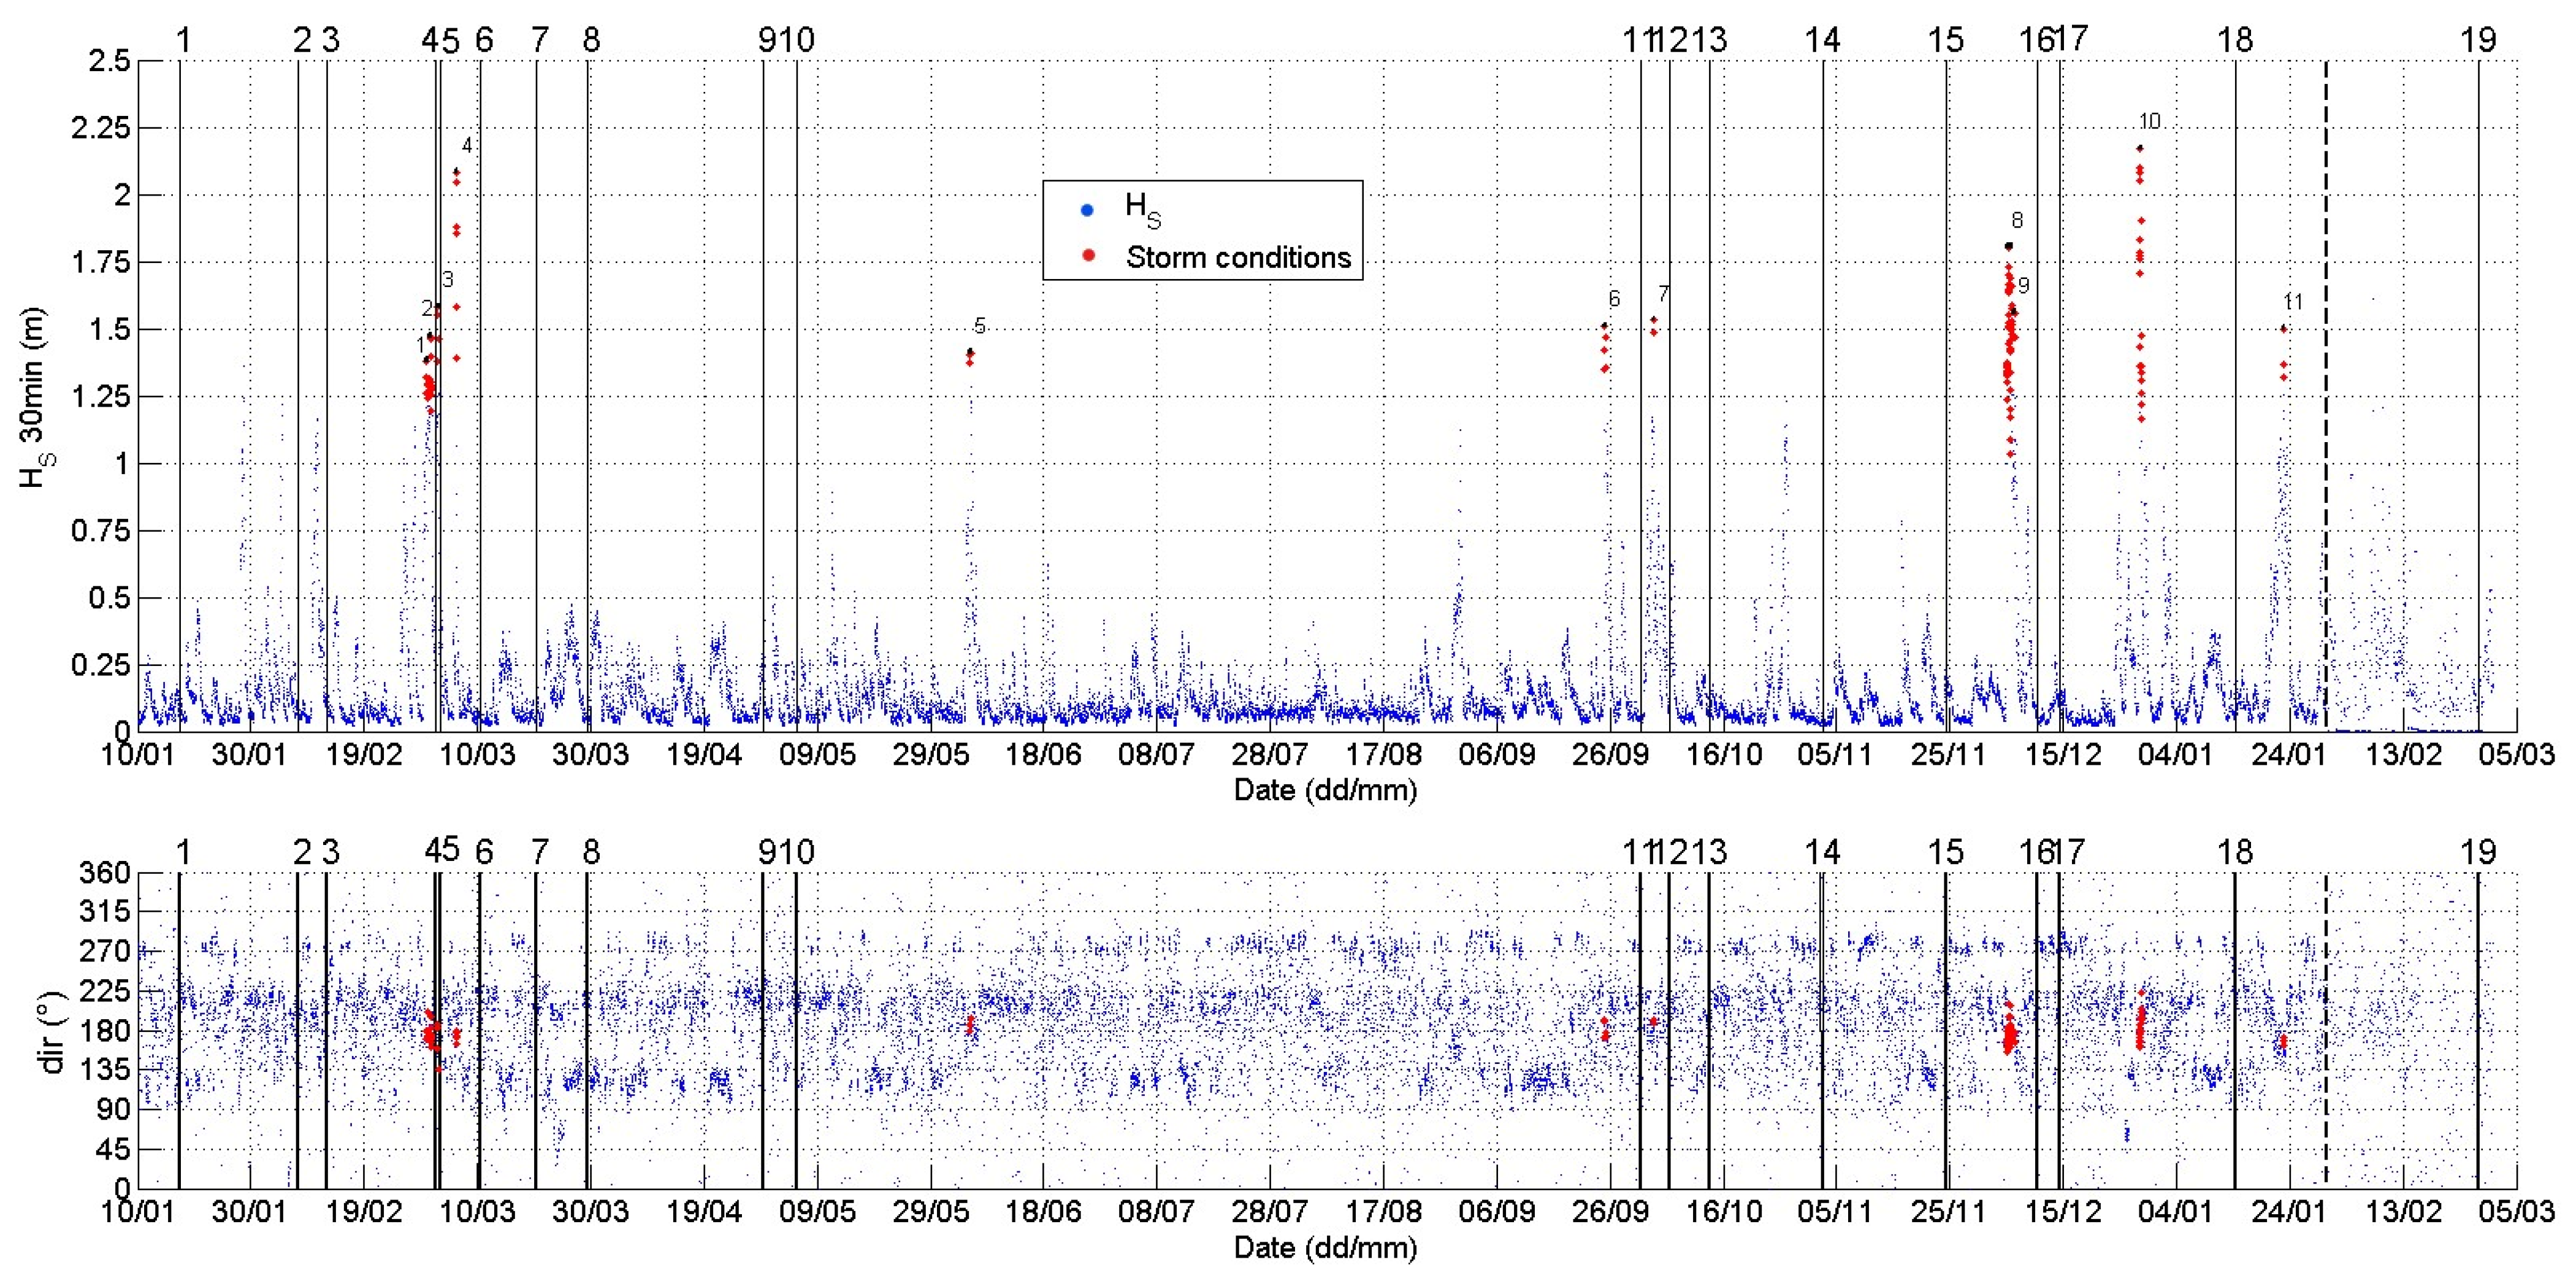
Waves are measured by the Hydrographic Institute of the Republic of Croatia with the Datawell wave rider (type MKIII) in the immediate vicinity of the Ploče beach (45° 19.588′ N; 14° 23.738′ E, WGS 84, free movement within the radius of the position), offshore of port Rijeka [73]. The standard wave statistics is provided every 30 min between 1 January 2020 and 30 January 2021. Additionally, an ADCP was deployed offshore of the beach from 30 January 2021 to spring 2021 but its data were not used in this study. The wave rose in Figure 6 summarizes the wave heights and directions recorded by the wave buoy between 1 January 2020 and the end of January 2021. For the most of time, calm conditions and waves up to 0.4 m height were recorded. Figure 7 shows that the events with higher wave heights take place before April and after September with exception of two short lasting storm during the summer. It is also evident from Figure 7 that the largest recorded waves are from S to SSE directions.
Storm events are identified by using a threshold of the 99.5th percentile of the significant wave height data [74] recorded at the wave buoy, which is 1.26 m. A minimum duration of storm was set to 1 h [75] and the time between storms to 10 h. For the significant wave height threshold of 1.26 m and set duration conditions, eleven storms were identified. This includes weak and strong storms [76,77]. A storm in March (1 March) and two in December (5 and 28 December) lasted for more than 4, 19 and 8 h respectively.
The energy peak for all 11 storm events was calculated using the following expression:
where Hmax represents the maximum significant wave height of the storm and Tp is the wave period at the storm peak [19,78,79].
E = Hmax2 Tp,
The storm power index [80] was also calculated:
where D is the duration of “storm conditions” in hours.
Ps = Hmax2 D,
Table 4 gives a summary of the energy peaks and the storm power indices for all 11 storms. The storms with the largest intensities (8 and 10) took place on 5 and 28 December 2020. The third largest (4) was recorded on 6 March 2020. These are also marked in Figure 7. The wave direction was between 160–180° during all storms except during storms 5, 6, 7. During latter, the wave direction was around 190°. During storm 10, the direction changed from 180–205°. The peak periods were in range from 4.4–6 s. The wave steepness for the peak conditions for all those storms was close to 0.04 except for the storm on 6 March for which the wave steepness was 0.05. During this storm, the wave height increased much more than the wave period (Tp = 5 s), resulting in larger steepness.
4. Results
4.1. Beach Shoreline Changes
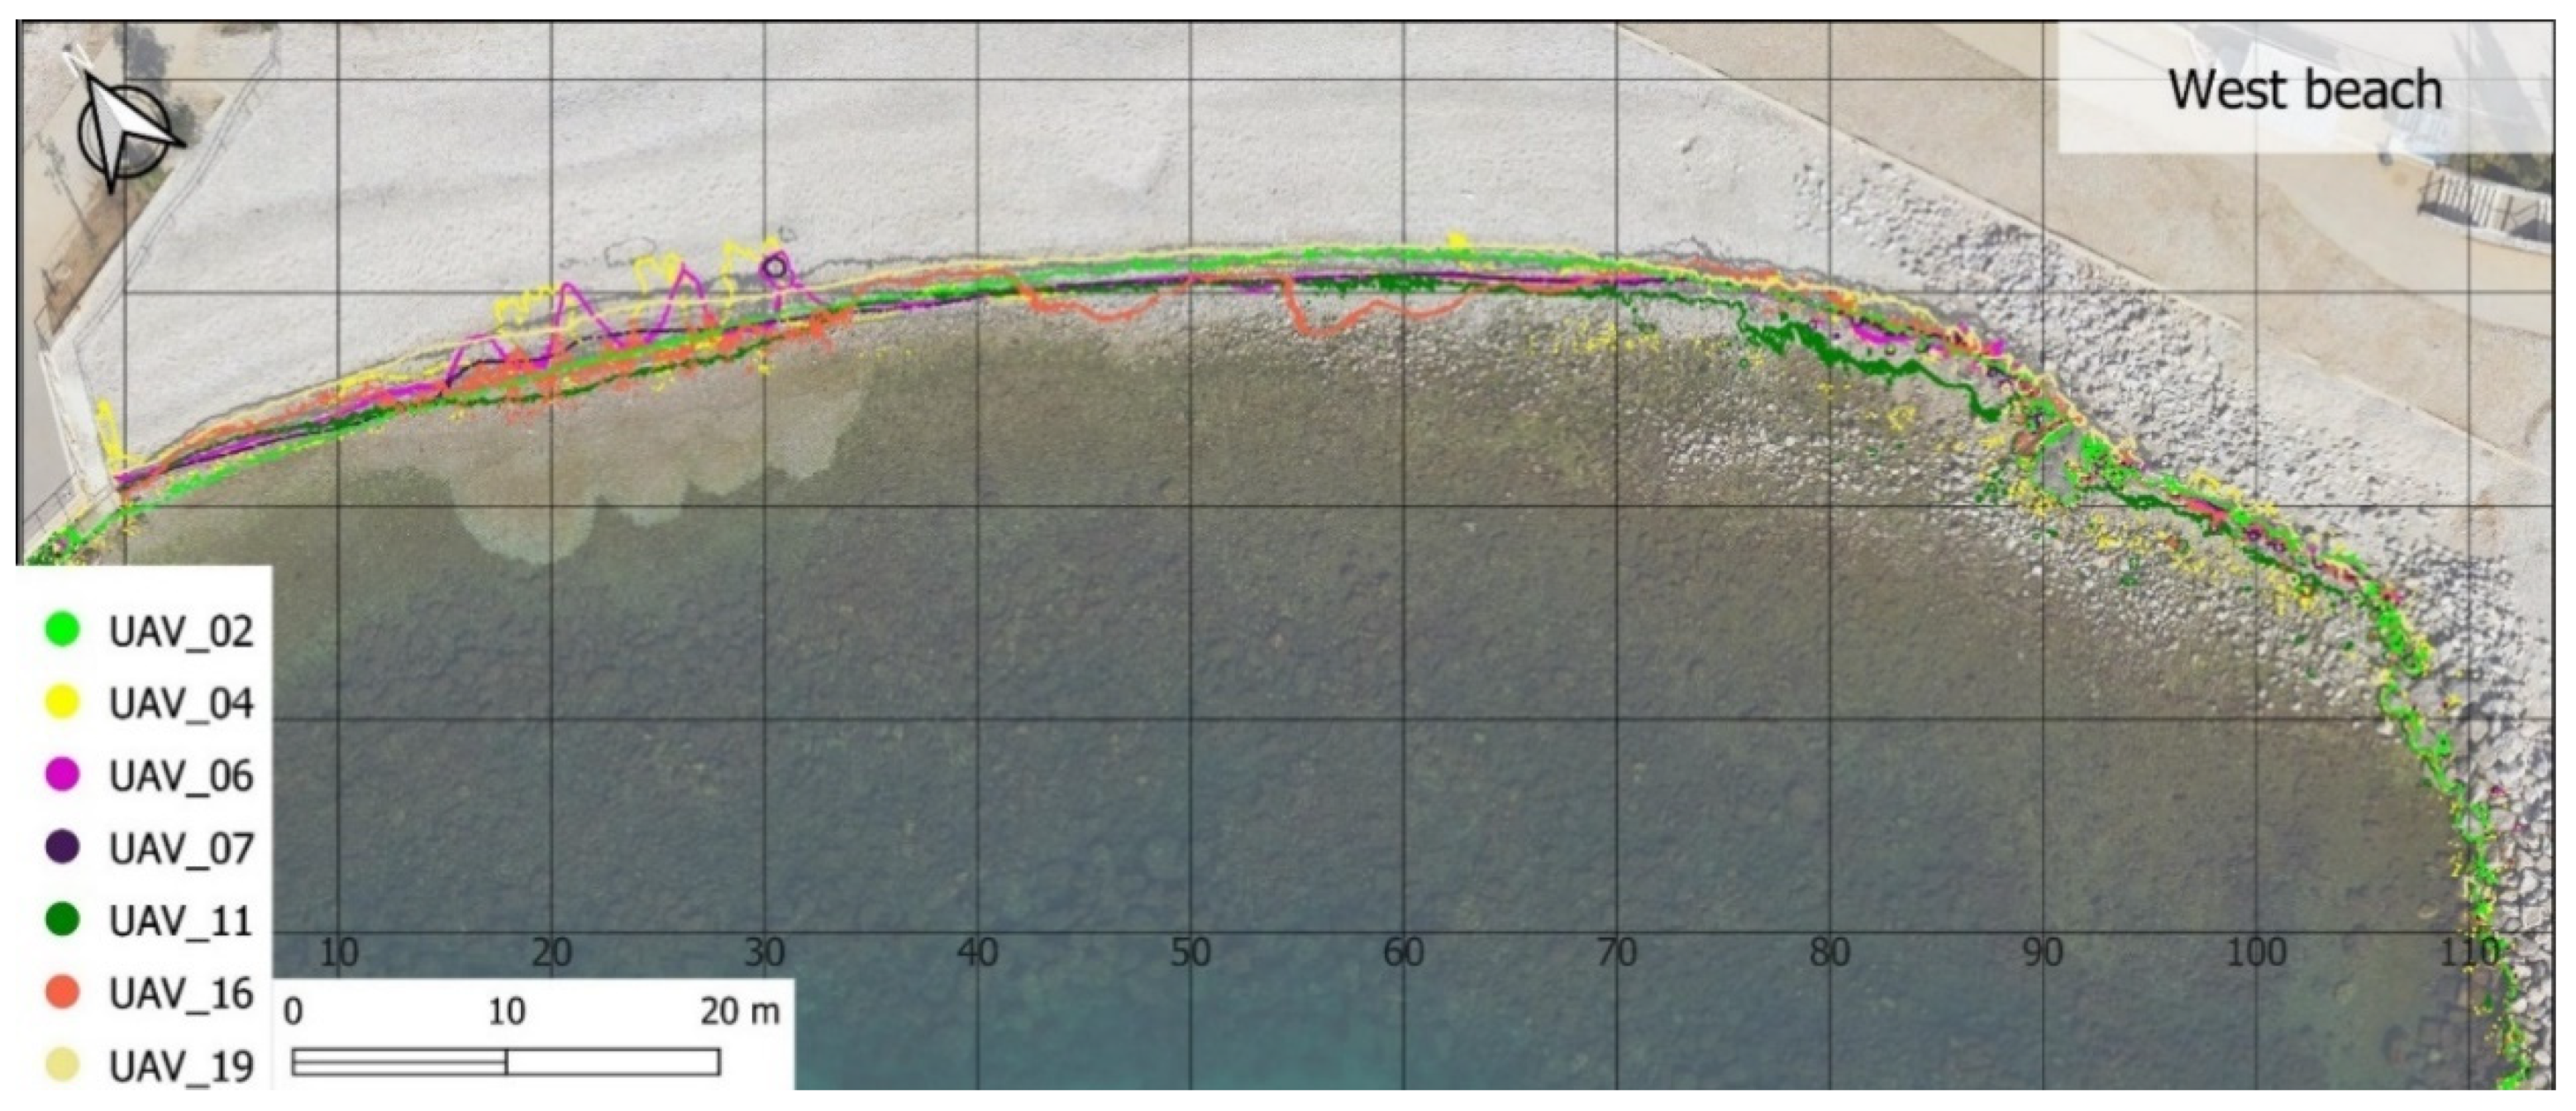
Shoreline changes were analyzed at 0 m above sea level and they are given in the Figure 8. Shorelines derived from surveys after storms and nourishments are shown in colour, while the rest are in grey.
Between the 2nd and 3rd survey, (UAV_02 and UAV_03), the shoreline moved onshore due to first storm after nourishment. It also rotated slightly west (clockwise) on the western part of the beach. The western end of the shoreline moved about 1.8 m inland, while it stayed at approximately the same position on the other side. After the first wave energetic event, the beach stabilize, There was no further rotation and the results generally show pronounced onshore sediment migrations.
Prior to survey UAV_04, three ‘pockets’ formed due to the fresh water springs outbursts through the beach body on the western part of the beach, causing the local erosion and onshore shoreline move by an average of 3.4 m (transects 20–30, Figure 8). Beach recovered by infilling of eroded zones between 6th and 7th survey. Shoreline moved back offshore for almost the same distance (3.47 m). A similar process occurred prior to survey UAV_16, except that this time the spring outbursts took place in the central part of the beach (transects 40–60, Figure 8). This time the shoreline moved offshore due to formation of sediment lobes at fresh water outbursts, with the greatest distances being approximately 2.5 and 3.6 m. In the period up to the 17th survey, the beach stabilized again under smaller waves.
On average, the shoreline changes are between ±40 cm, which are smaller than potential errors. However, the post-storm and post-nourishment shoreline changes can be detected with higher certainty.
4.2. Beach Elevation Changes
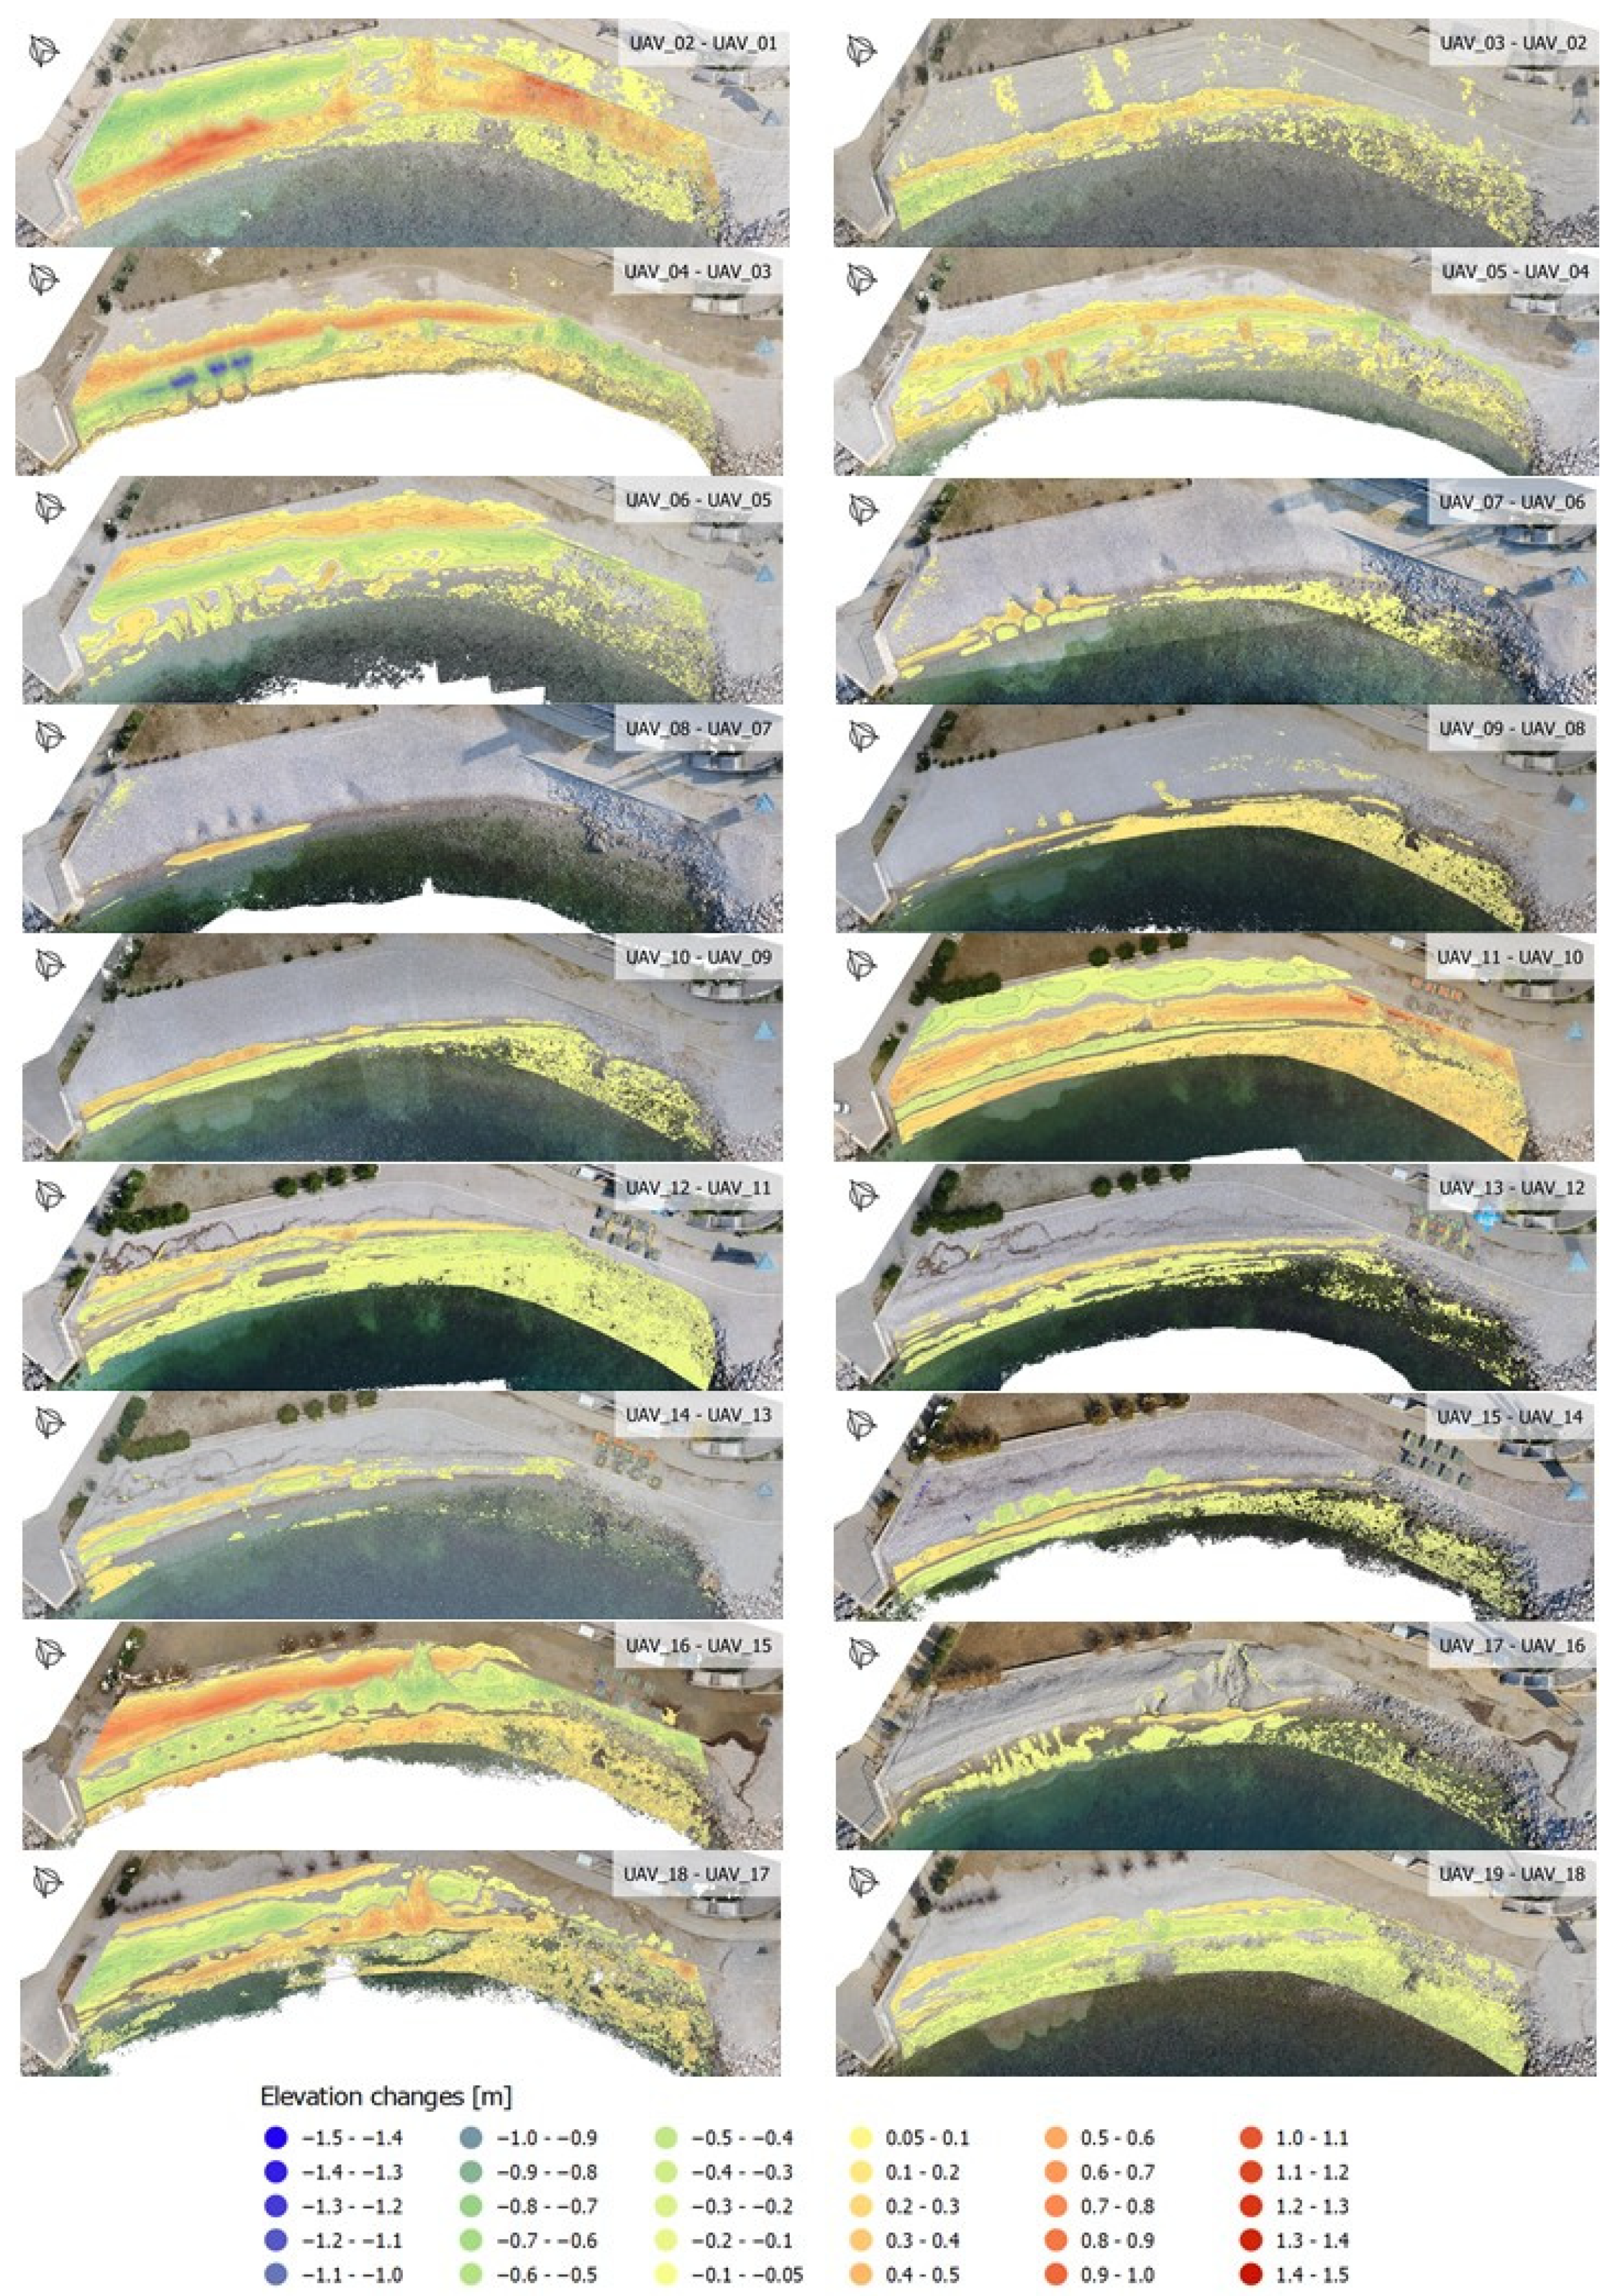
Figure 9 shows beach elevation changes greater than 0.05 m. Eroded areas are represented with shades of blue and green, while the sediment deposition is shown in shades of orange and red.
The beach was nourished between the first two surveys (UAV_02–UAV_01). The beach elevation changes show that, the material was pushed from the higher parts of the beach towards the toe of the beach on the west end. On the eastern side, the material was added to the beach and the positive changes were recorded, shown in red.
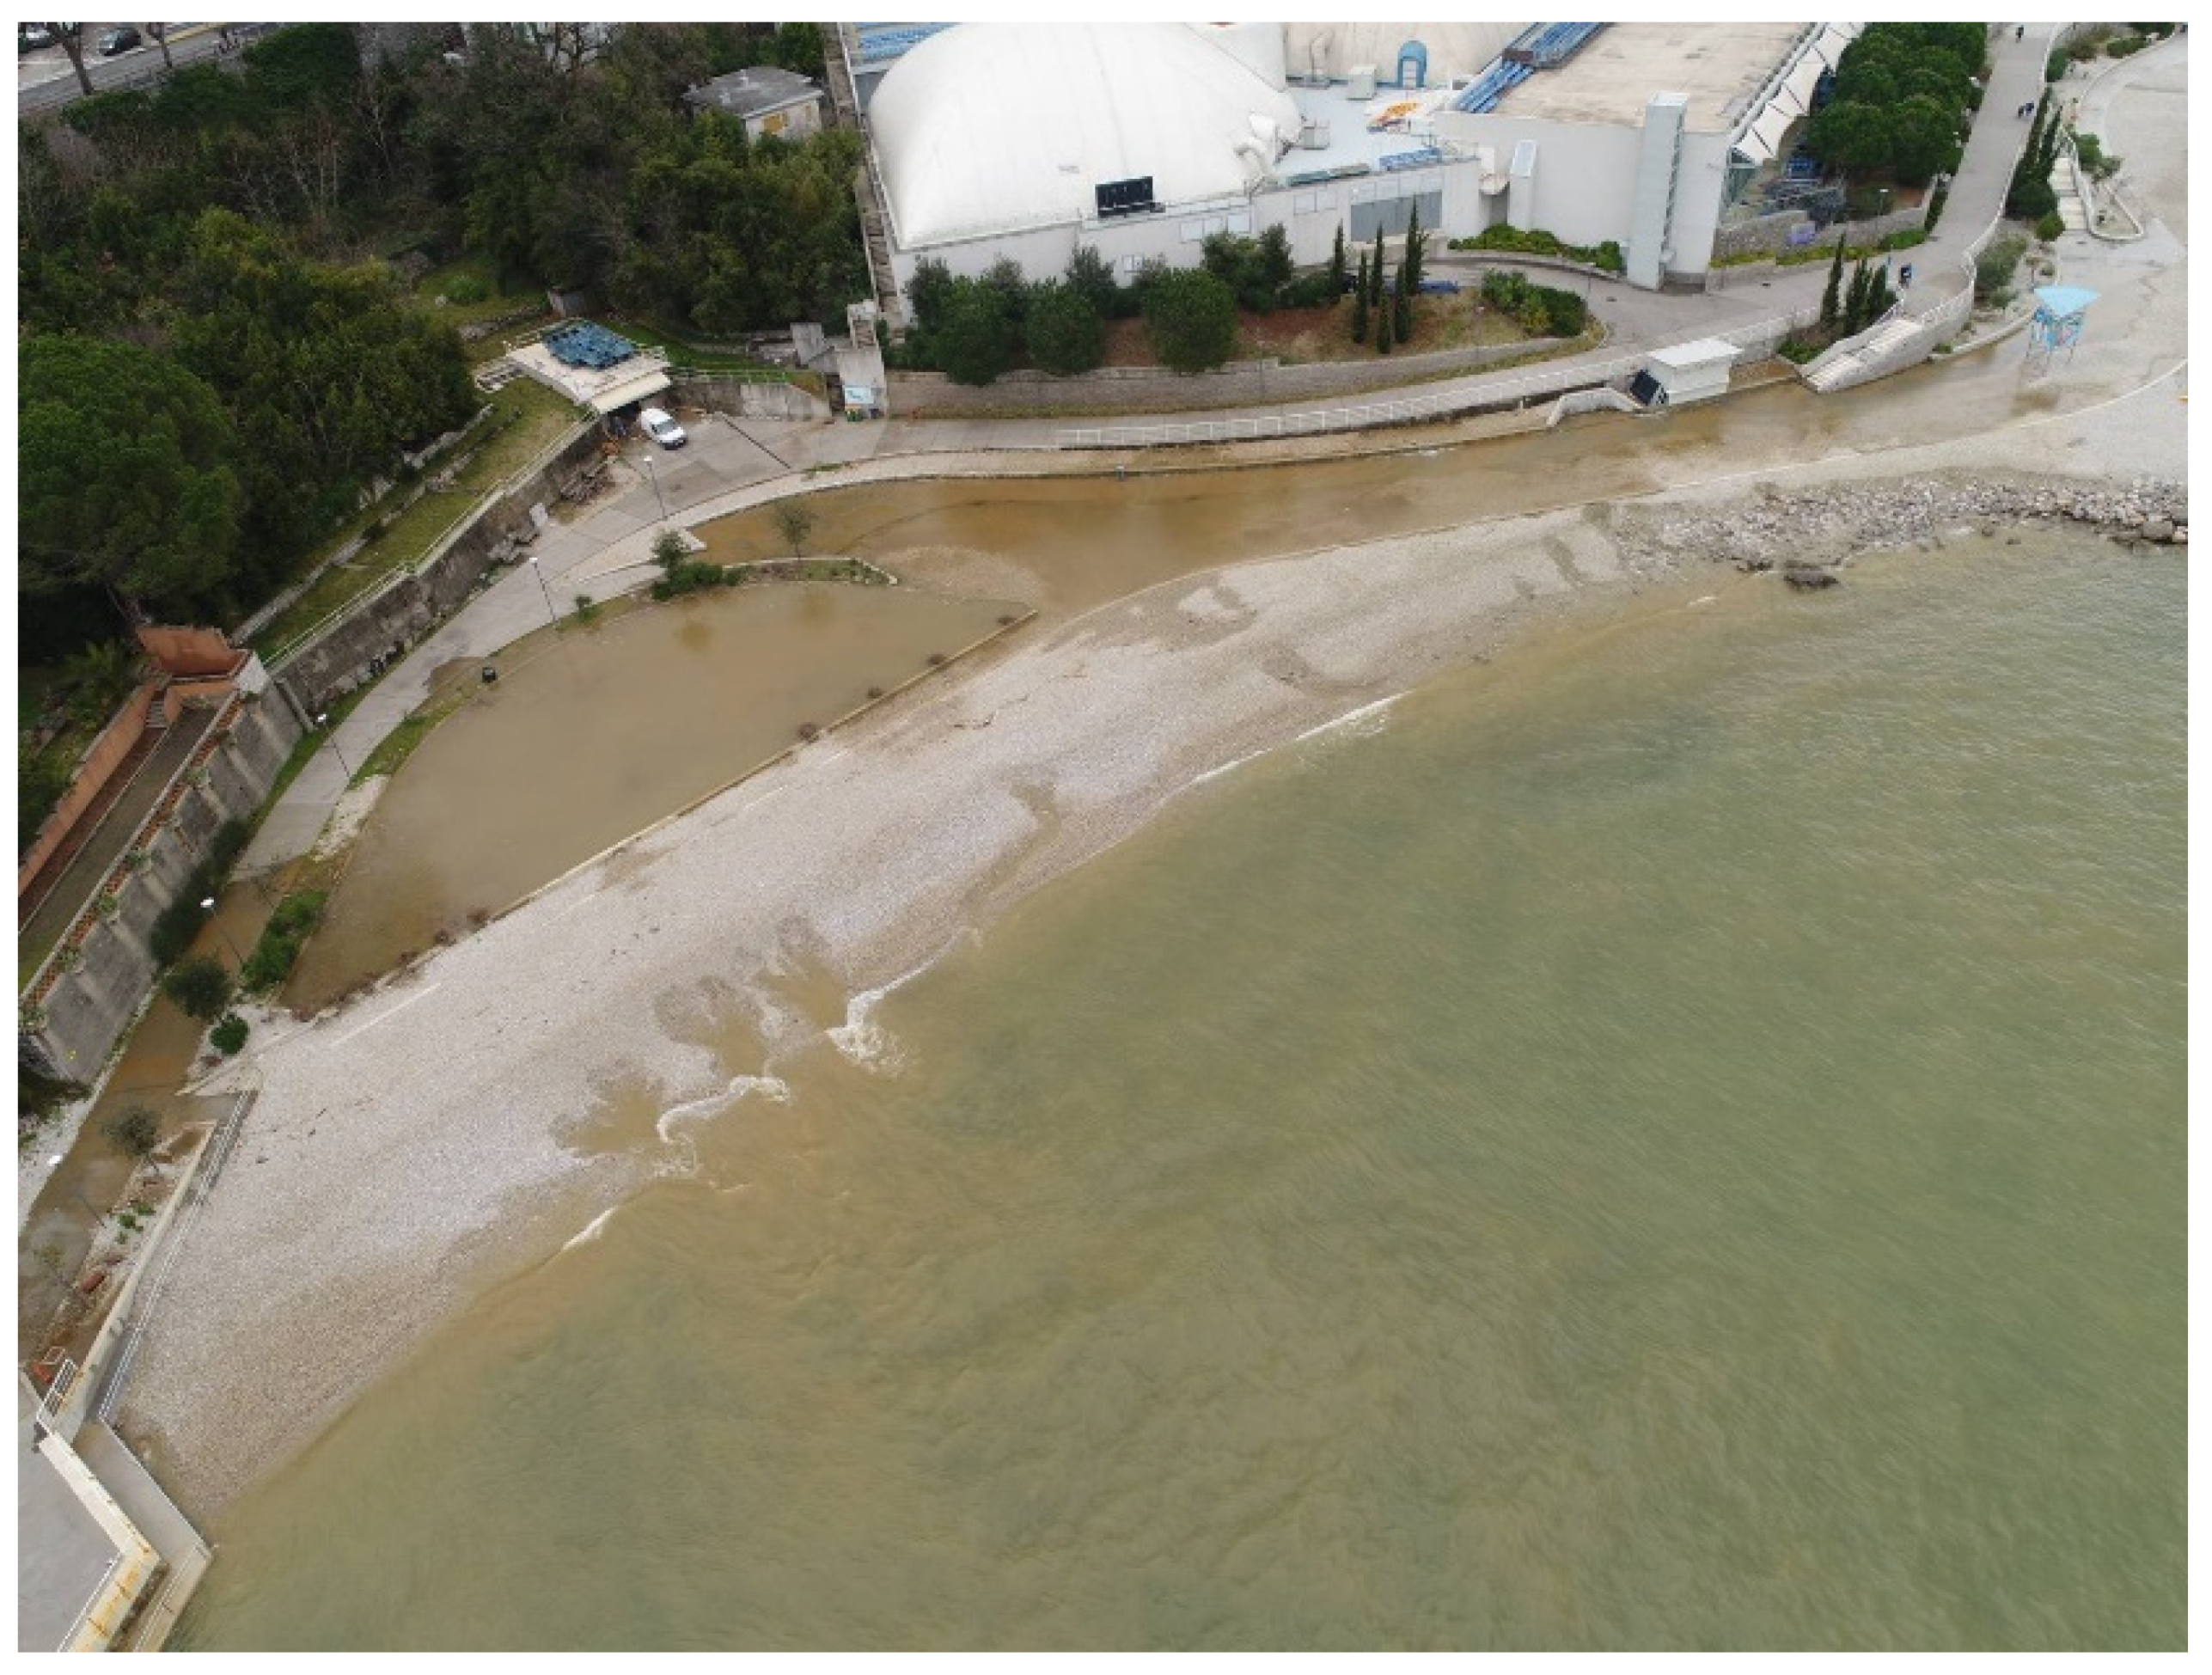
The first significant elevation changes took place between the third and fourth survey caused by the first storm event on 1 March 2020. The measured significant wave height was up to 1.47 m. A berm formed on the higher parts of the beach as a result of the wave activity. The wave action was accompanied by heavy rainfall on 1 and 2 March 2020. Overall 46.3 mm of rain fell in just over 16 h. The promenade on the beach was flooded and there was the fresh water spring outburst through the beach body (Figure 10). Resulting changes were accretion, namely berms, on the upper beach on the western side, and erosion on the eastern side. In addition, the areas of concentrated erosion (1.2 m deep), associated with the fresh water outburst can be seen on the western side of the beach. They are marked in blue in Figure 9 (UAV_04–UAV_03).
Survey UAV_05 was conducted the day after the flood. The wave height increased (Hs,max = 1.56 m) and the fresh water was still flowing through the beach. Formation of the berm higher up on the beach can be seen in Figure 9.
In the period between surveys UAV_05 and UAV_06 great changes were also observed, affecting the whole beach. During this period, another storm formed on 6 March. Incoming wave direction was 177° and the significant wave height was 2.08 m. On the same day, measured tidal elevation was 0.86 m. As result of higher water level and waves of higher wave heights, the berm (about 40 cm high) formed more backshore than in previous surveys. Due to the high sea level, some material was shifted from the beach to the promenade. The erosional ‘pockets’ caused by the fresh water spring in previous events were still present.
Subsequent surveys do not show any significant changes until the summer when the beach was prepared for bathing season. Comparison of surveys UAV_10 and UAV_11 shows results of typical nourishment done during summer, redistributing deposited material from the top to the lower parts of the beach and flattening.
The next storm event on 3 October 2020, between surveys UAV_12 and UAV_11 caused erosion around the base of the groyne on the eastern side and accretion on the opposite end of the beach.
The next three surveys did not record significant changes on the beach. The sixteenth survey conducted on 10 December 2020 shows the scale of damage caused by storm events on 5 and 6 December, when the maximum significant wave height was 1.8 m. Because of the heavy rain the water started to flow through the beach body again, causing concentrated erosion in the middle part of the cell. The material from lower beach was pushed to the upper beach by waves on the western part of the beach. The site was flooded again and some material ended up on the promenade. Only four days later the beach was surveyed again (UAV_17). Because there was no wave activity in this period (Figure 7), the changes were mainly found at the lower parts of the beach.
Between the 18th and 17th survey (UAV_18 and UAV_17), the beach was exposed to the storm with the largest significant wave height of 2.16 m from the southern direction (Figure 7). However, changes shown in Figure 9 are not the result of this storm, as prior to survey UAV_18, the promenade was cleaned and the beach flattened. This explains negative elevation changes on the west end of the beach (Figure 9), and the filled ‘pockets’ in the centre.
Wave activity after UAV_18 caused erosion again around the groyne on the eastern side and accretion of the upper western part of the beach. The observed elevation changes between surveys indicate presence of longshore and cross-shore sediment transport.
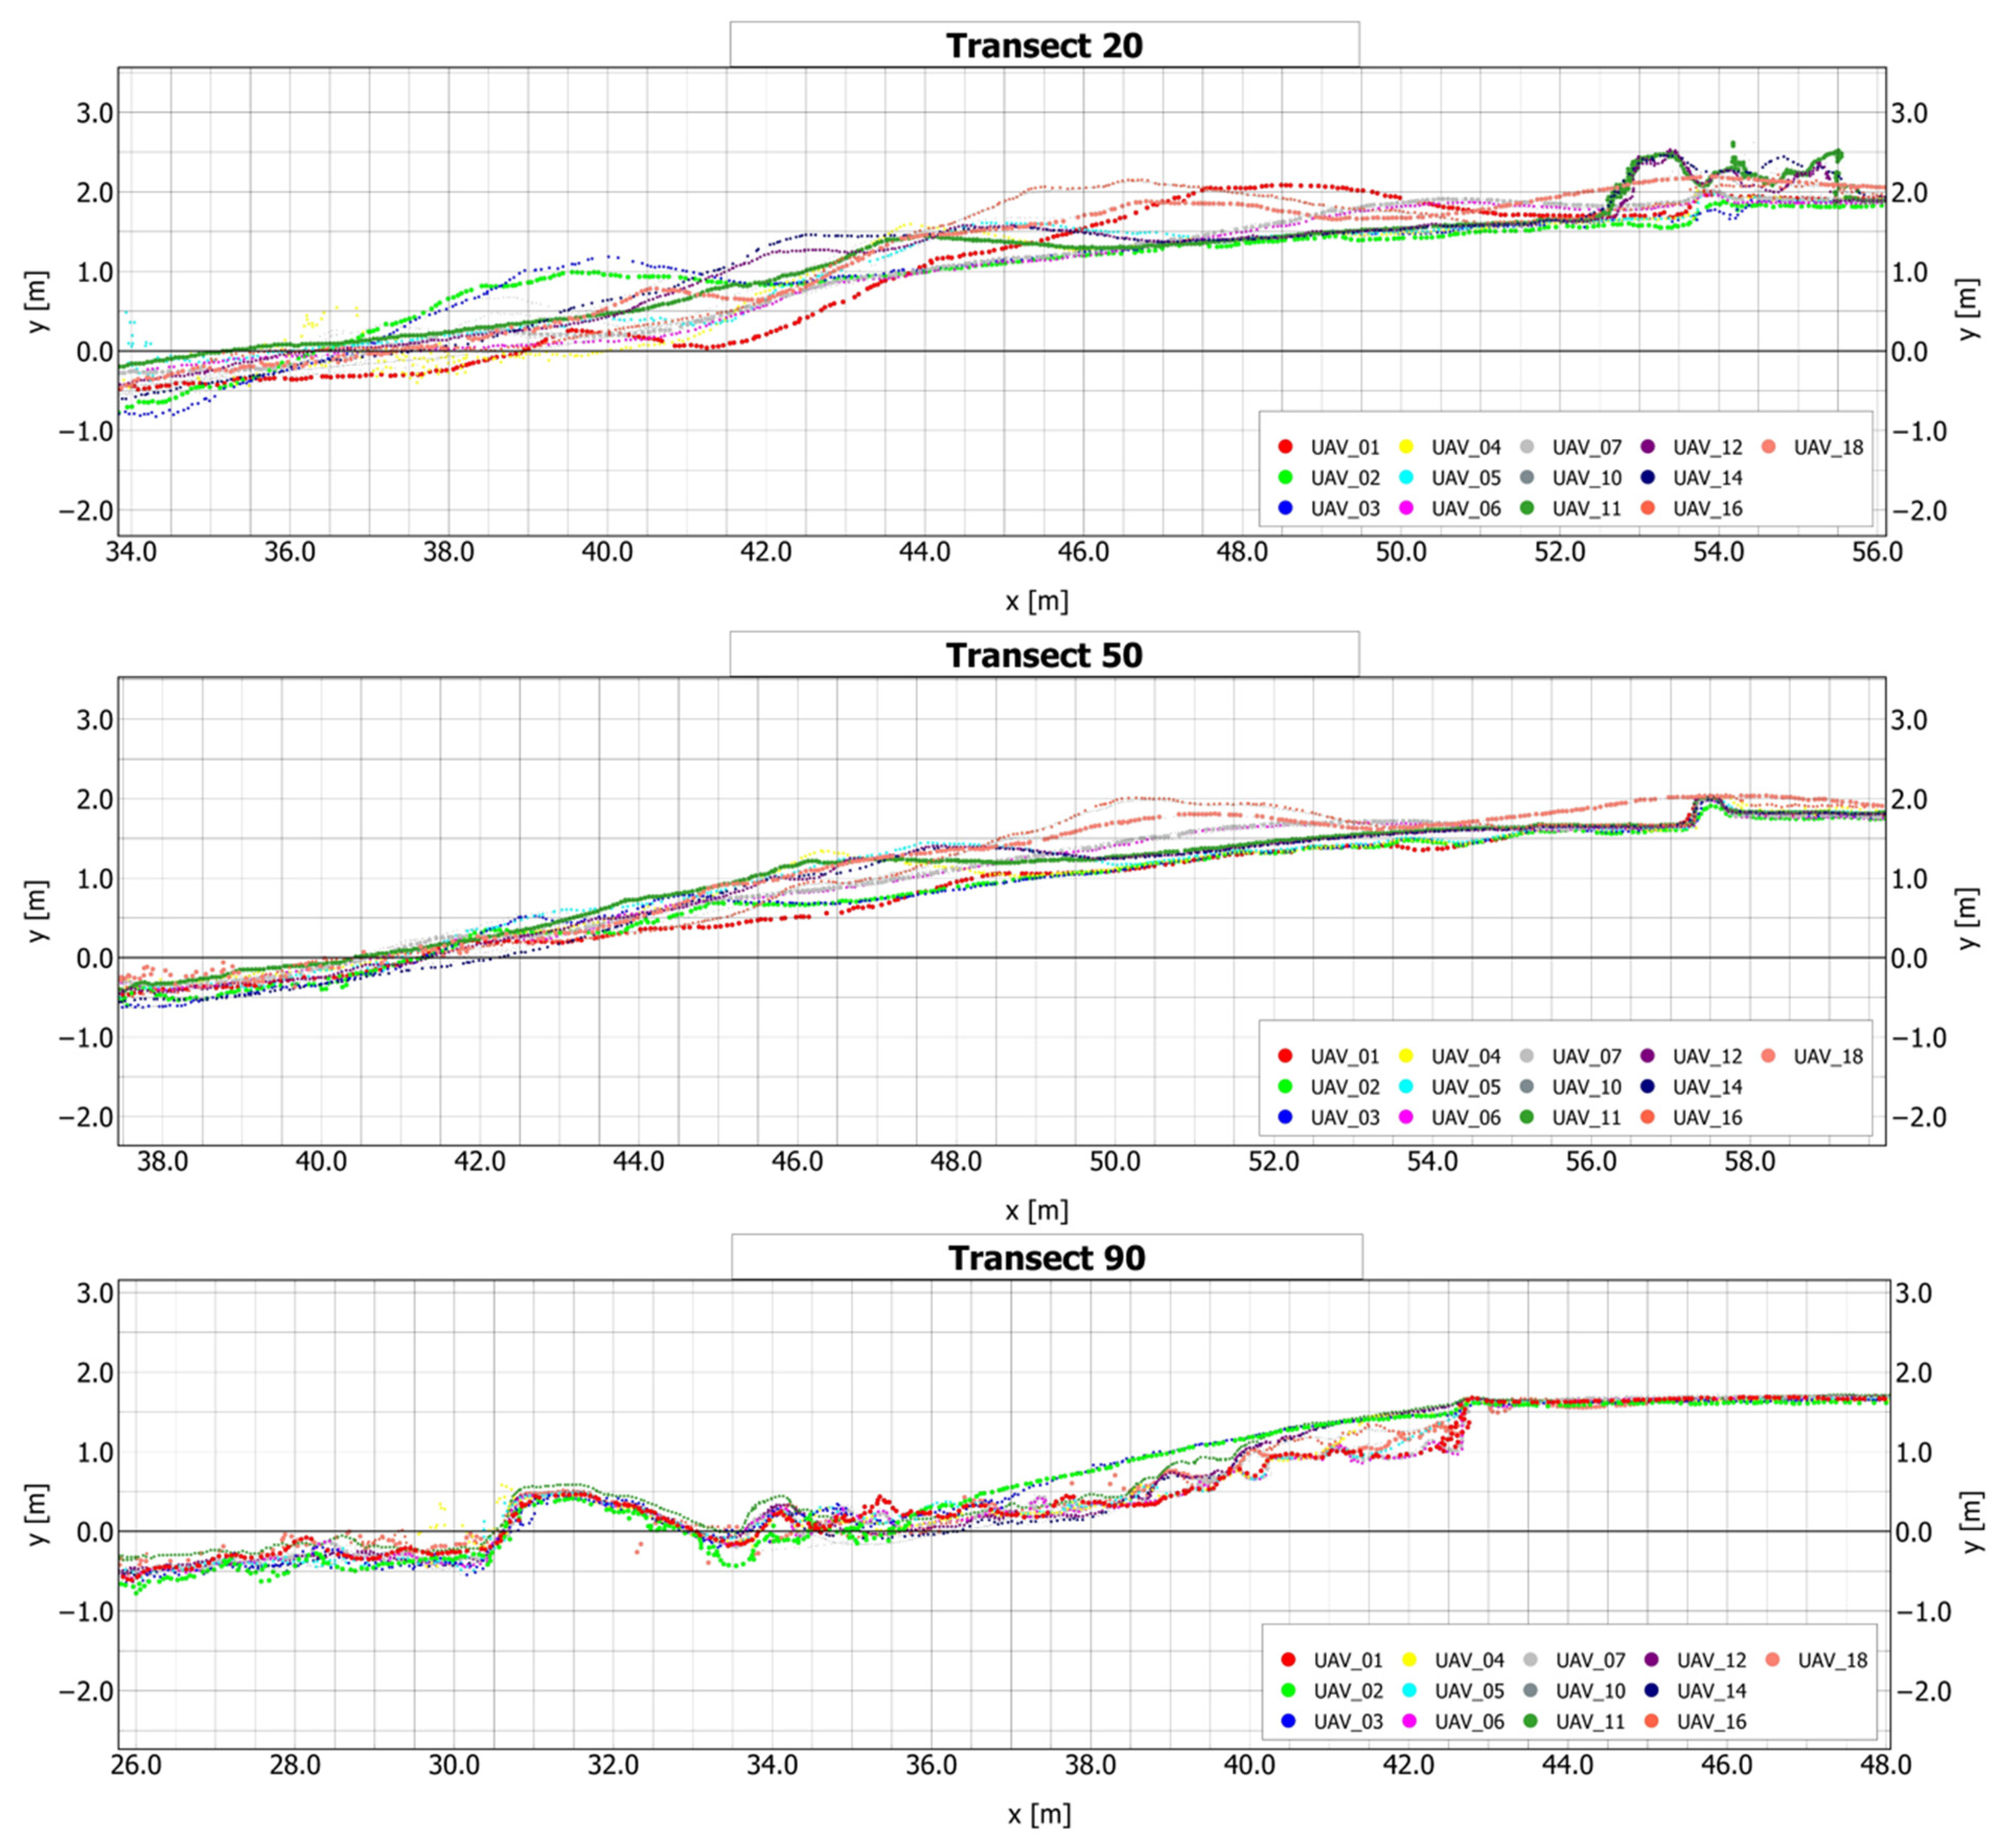
Cross-shore changes are evident in cross-shore transects. Figure 11 shows elevation changes at both ends of the beach and in the middle, at 20, 50 and 90 m (see Figure 5).
Changes in the transects 20 and 50 show that the berms (0.2 m high) form under the influence of waves, immediately after the nourishment (UAV_03 and UAV_12)). They stayed at almost the same places until the stronger storms hit the beach causing them to move further onshore (UAV_04, UAV_06 and UAV_16). In the middle transect, the berm moved (horizontally) for 3.7 m due to steepening of the beach profile by the 4th survey. The material from the lower beach face was moved by wave run-up into a berm on the upper beach. The berm stayed at more or less the same location and was approximately the same size, until the wave conditions changed. At the time of the 6th survey (after storms 3 and 4), it moved further onshore for additional 5.8 m. The storm on 3 October, which took place after the second beach nourishment and flattening (UAV_12), formed the new berm. It moved 1.45 m, and stayed there until the storms on 5 and 6 December, when it moved further offshore for 2.6 m. The strongest waves coming from the south quadrant are often accompanied by higher sea levels [55], causing the berm to form on the higher parts of the beach.
The same pattern of berm formation is observed at the western end (transect 20), while on the eastern side (transect 90) there is no berm. Because of erosion, material added through nourishments is very quickly removed, leaving the rubble underlayer exposed on this side of the beach.
4.3. Beach Volume Changes versus Wave Energy Flux
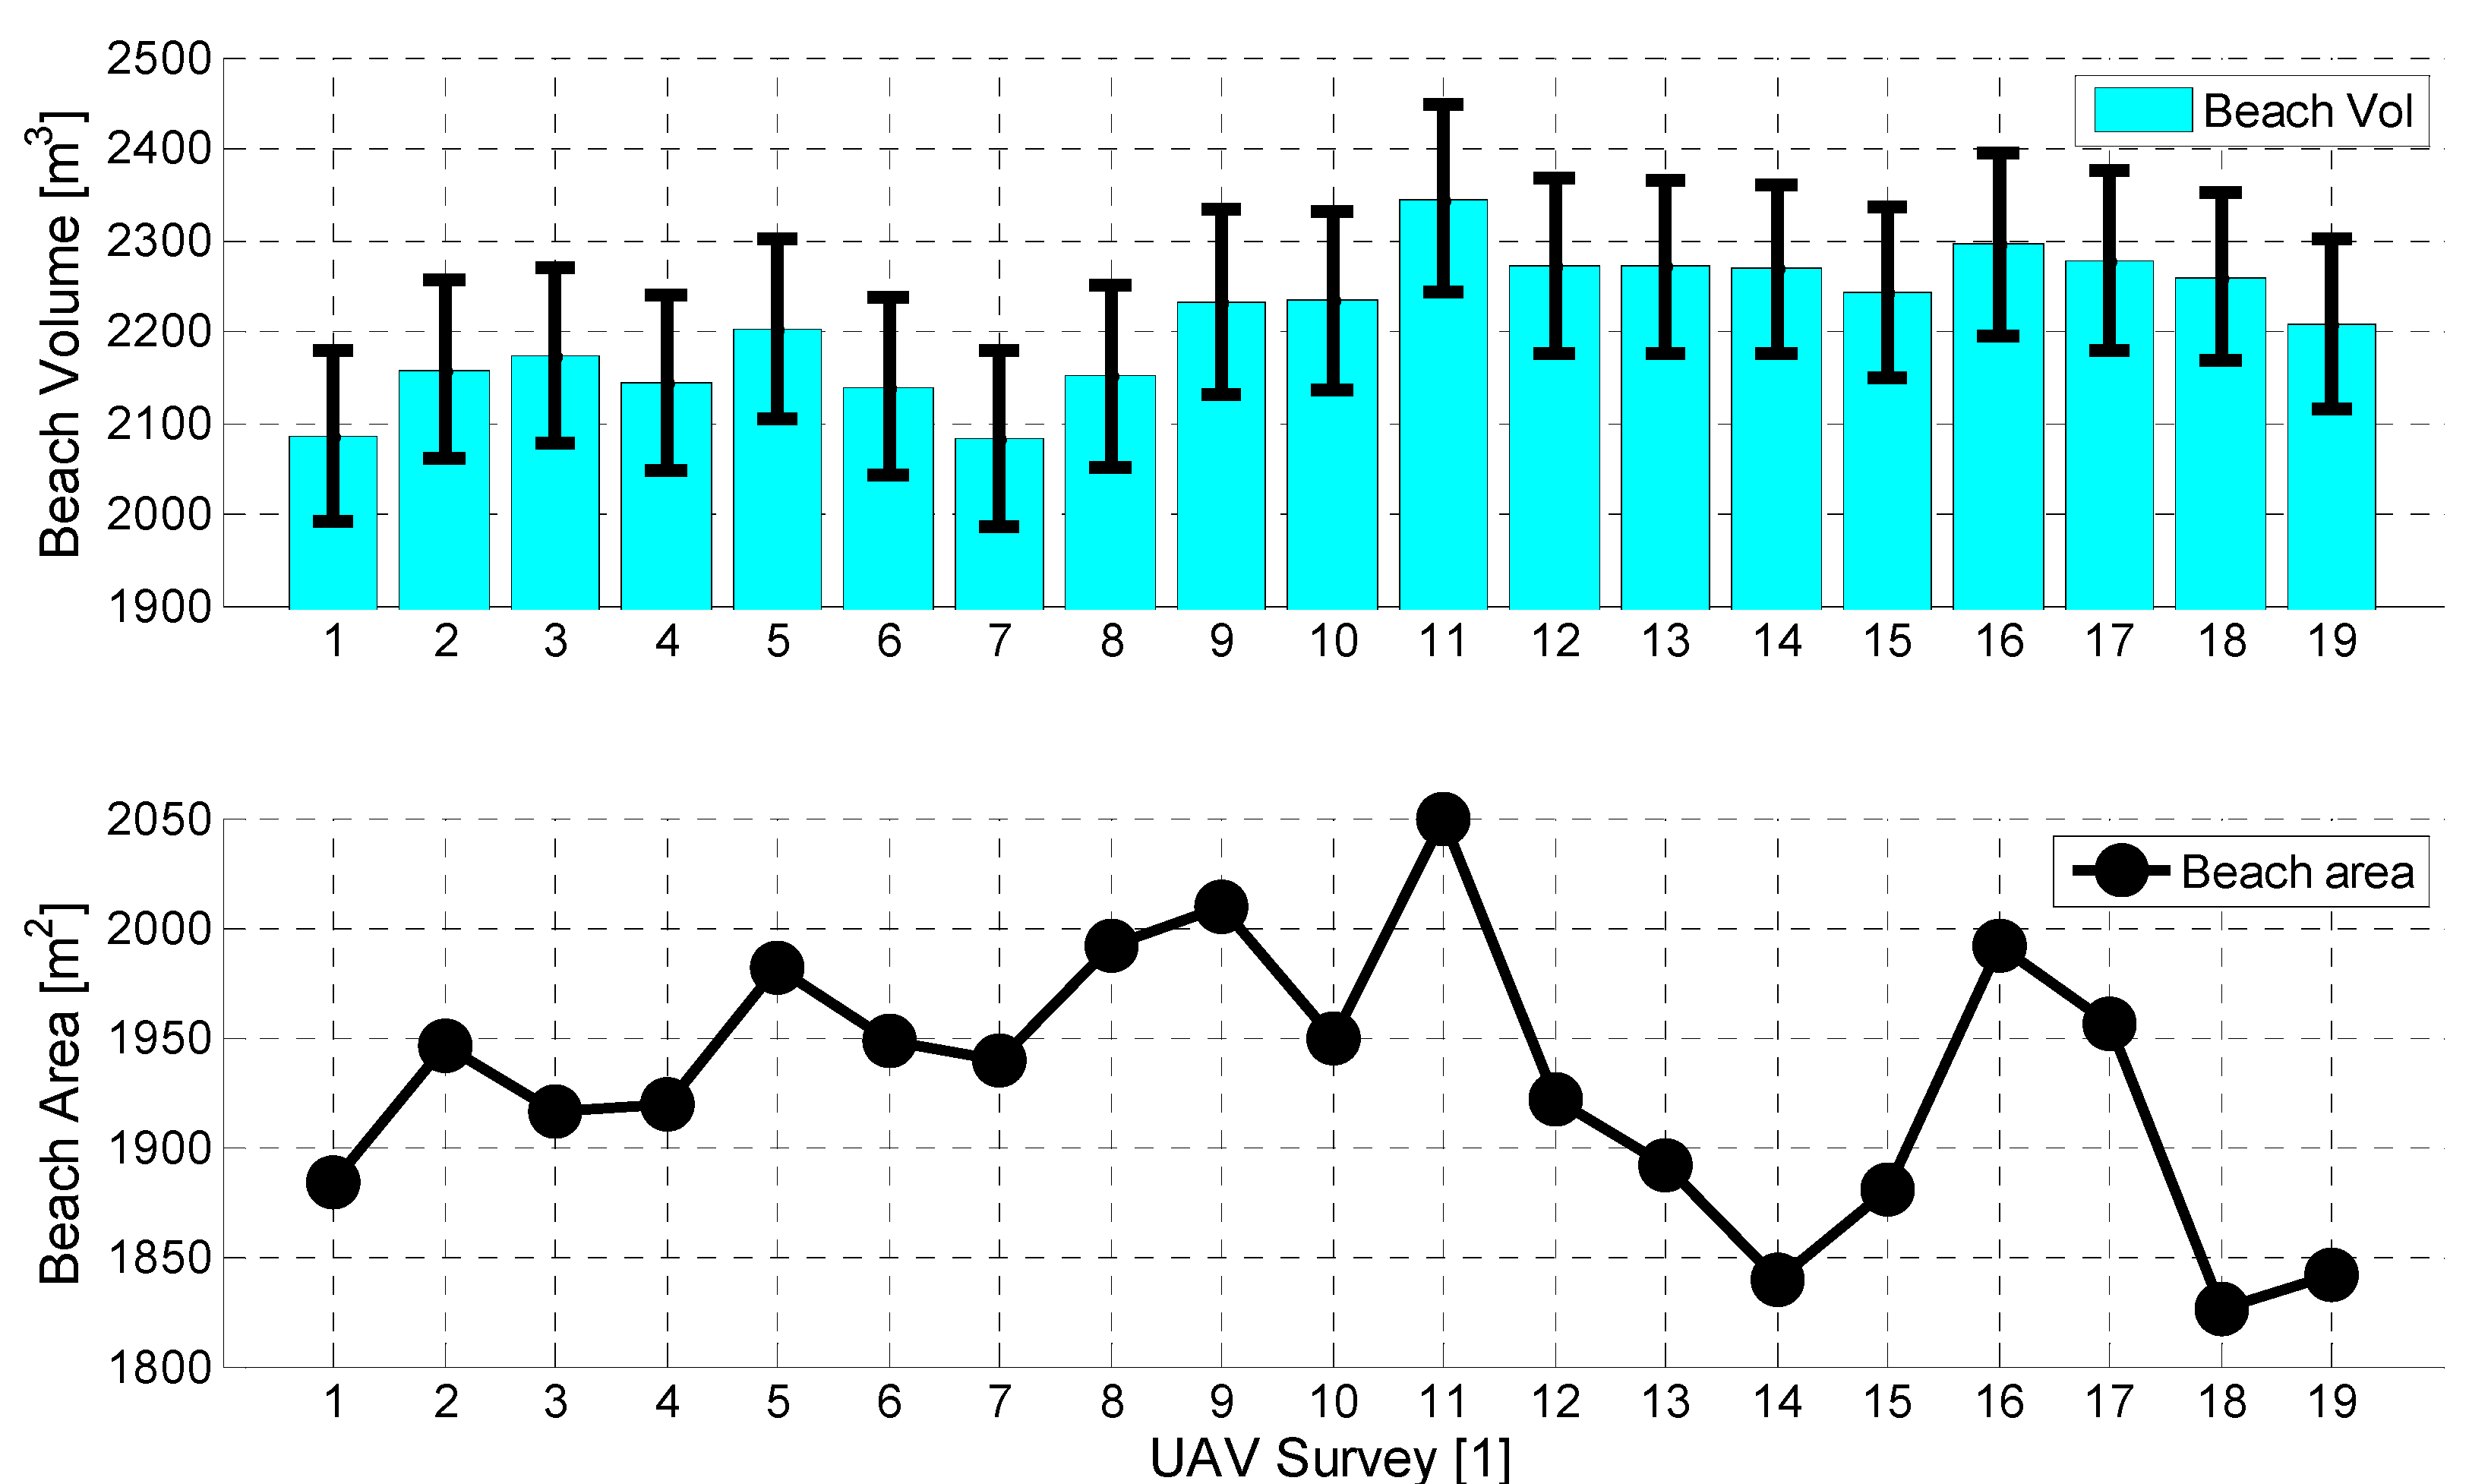
The results of the volume changes, including error bars, are given in Figure 12 top. The beach area was also calculated and shown in the Figure 12 bottom. The average area is about 1900 m2 and it changed only slightly from 1841 m2 in survey UAV_14 to 2049 m2 in UAV_11. The largest area was recorded just after the summer season after the beach was renourished and flattened.
Emerged beach volumes range from 2085 ± 47 m3 (UAV_01) to 2345 ± 51 m3 (UAV_11). The significance of the error estimates is further discussed in Section 5.1.
Although the changes occurring are smaller than acquired accuracy, a certain trend is noticeable. Increases in volume and beach area recorded by surveys UAV_02 and UAV_11 correspond to renourishments and flattening of the beach. There is fluctuation in beach volumes after the first nourishment, which took place in January. The beach volume remained stable for longer period of time after the second beach nourishment, which took place at the end of May.
Decreases in areas following these surveys are a result of wave influence on a flat beach. Under wave activity, the beach face becomes steeper—the material is pushed onshore and a berm is formed. This is especially a case with surveys UAV_11-14, when the beach area continued to decrease under waves from the south, while the volume remained almost the same. This indicates that the beach sediment was redistributed on the emerged beach rather than lost offshore or onshore.
The peak storm wave energy varied between 8 and 27 m2s, whereas the storm intensity index varied between 3 and 62 m2h. The latter is due to the duration of storms, which changes with seasons. The changes in the beach volumes and the beach area are relatively small and independent of these two wave energy parameters. However, the largest changes in beach elevation and in beach profiles are associated with storms, once the beach reaches post-nourishment adjustment.
Next, the offshore wave steepness parameter was examined. The offshore wave steepness (Ho/Lo), was found as potentially useful parameter for explaining offshore versus onshore sediment transport on gravel beaches (see e.g., [43]). A threshold value of 0.01 is used to distinguish onshore (<0.01) and offshore sediment transport (>0.01). For the peak storm waves in this study, the offshore wave steepness is between 0.04 and 0.05 and this would indicate presence of offshore sediment transport. Figure 10 shows that changes in beach elevations vary along the beach and there are several profiles (e.g., between surveys 3 & 4) where sediment loss is larger than sediment gain. However, the survey would need to extend offshore to examine whether these losses are due to offshore sediment transport. Not only cross-shore but also longshore sediment transport and groundwater dynamics affect the sediment gains and losses on these profiles.
5. Discussion
5.1. Use of UAVs for Monitoring of Beach Changes
This study demonstrated the effectiveness of UAVs and SfM photogrammetry for repeating monitoring of beach changes, which can inform coastal management. Measurements were performed quickly once fixed GCPs were set up. They are particularly suitable for targeted surveys of beaches, which experience noticeable changes only after rare high wave energy events. Using full 3D data (point clouds) rather than other 2D parameters such as shoreline position and beach width, is useful for studies of gravel beaches, where changes are spatially and temporally dynamic. For example, changes in the beach elevation due to the formation or erosion of berms and the resulting beach steepening are prominent after storms and important for beach safety [17].
The accuracy and precision of surveys needs to be taken into account when estimating the beach parameters (e.g., [39]). These depend on many factors such as the resolution of camera used, flight height and angle of the survey, and other environmental conditions such as light and wind. In this study, two different camera models were used, different flight heights and different GCP layouts. Hence, it was even more important to perform a detailed analysis of the point clouds to establish horizontal and vertical errors for each survey. Accuracy was tested by comparing point clouds from the stable region around the beach, while precision was tested using ground control points spread over the stable region. The upper part of the beach profiles derived from point clouds, which include a stable promenade, were also qualitatively compared for any outliers. Horizontal RMSEs for all surveys were less than 7 mm and vertical errors varied up to 10 mm. The largest errors were associated with surveys taken during unfavourable environmental conditions (light or presence of water on the beach and promenade). However, this was the case in only two or three of the surveys and it did not affect the quality of images. The results of the accuracy and precision analysis suggest that there is no significant difference between the point clouds delivered from consumer grade (DJI phantom 4) and professional UAV (DJI Matrice 200, Sony ILCE-7M2). Inferior performance of consumer grade UAV is compensated with lower flight altitude and a larger number of images. The conservative uncertainty level values of ±5 cm were used for estimating the beach parameters from point clouds derived from both sets of cameras.
The inaccuracy of surveys was significantly lower than elevation changes measured after storm events. However, as the overall changes in beach volumes, as well as amount of material that is supplied to the beach each summer, are relatively small (50–150 m3), the estimated total volume changes cannot be accurately determined. If the losses or nourished material is evenly spread over the beach surface, it would result in thickness of 2.5 cm for 50 m3 of material. Hence, the accuracy of surveys needs to be less than 2 cm. Instead, DEMs changes that account for accuracy thresholds can be used to estimate volume changes between surveys. This would result in consideration of smaller area of the beach and lead to smaller errors. SfM photogrammetry with UAVs proved itself to be very useful for analyzing and describing changes that occurred on the emerged part of the beach. However, it was observed that there is an offshore/onshore exchange of material from submerged part of the beach. The future work should include reduction of vertical error and underwater surveys.
5.2. Post-Nourishment Changes
The project provided unique opportunity for evaluating behaviour and longevity of beach nourishment as result of storms. Longevity is defined here in a loose sense, meaning time before significant sediment loss occur. As part of the Beachex project, the Ploče beach was nourished at the end of January 2020 and it was exposed to a number of high energy events, including four storm events defined as events with Hs > 1.26 m and duration of at least 1 h. The beach volumes seem to be quite stable, which is evident from analysed beach volumes (Figure 12). A positive trend of the beach area for which uncertainty of estimates are negligible, has been observed between first nourishment and second nourishment. Some fluctuations of the beach area were observed after storm events, but overall the beach area increased until May. The local council re-nourished the beach again in May to extend the bathing area. By the end of the surveys in February 2021, the beach area had decreased as a result of at least five storm events. It is worth mentioning that these changes represent less than 6% of the average beach area. Most of the sediment has been lost from the eastern part of the beach. This is evident from the elevation changes both in plan and through transects (Figure 9 and Figure 11).
The nourishment itself involves flattening of steep beach profiles on the western side and adding material on the eastern side, aligning it with WNW—SSE directions. The main storm events are driven from the direction window SSE—S and after first storm, the western part of the beach rotate slightly to align with dominant wave direction. This was also observed on artificial beach at Marina di Pisa [42]. The eastern part of the beach, all way to almost the middle, erodes down to the rubble underlayer (see Figure 9). The numerical study by Lončar et al. [73,81] showed that this part is exposed directly to SW waves and strong wave generated currents. The numerical study [81] showed that this part of the beach can erode due to strong wave generated currents driven by the SSE waves. After this initial large adjustment, the beach reaches the equilibration [7] until it is exposed to larger waves from slightly different directions.
Beach rotation, which occurs on the western side of the Kvarner Bay [44], has not been observed on this beach. This is partly due to most of the higher waves arriving from more or less the same direction. While there is a loss of sediment from the eastern part of the beach, the western part of the beach remains more stable. Beach rotation was also not observed at Marina di Pisa beach in the study by Grottoli et al. [42]. This has been associated with presence of groynes limiting the natural sediment transport.
The onshore sediment transport was observed on the western side of the beach during storm events (e.g., between surveys UAV_3 and UAV_4 and UAV_5 and UAV_6). During extreme conditions, gravel is pushed all the way to the promenade on the back of the beach (e.g., between surveys UAV_15 and UAV_16). Onshore sediment transport on gravel and pebble beaches during storm events has been registered in studies elsewhere e.g., Marina di Pisa [42,82], and a macrotidal beach at Slapton [83,84]. This results in steepening of beach profiles and formation of berms. Berms were found from the middle of the beach face all the way up to the top of the beach on the western part of the beach. Their locations are related to the extent of the wave run-up and hence the wave height. Sometime a series of parallel berms are formed as results of decreasing wave heights as storms recede. Steep berms and their onshore migrations were also observed by Grottoli et al. [42].
There is no clear relationship between overall changes and wave forcing parameters considered here. Overall changes are relatively small and the beach seems to be stable. Gravel beaches are found generally to be more stable due to their geomorphological characteristics (e.g., see [43]). Onshore sediment transport could not be related to the storm wave steepness, which was found to be higher than 0.01. Study by Ruiz de Alegria and Masselink [85] found that the overall beach volume change (offshore/onshore) depended on the storm wave direction. Furthermore, beach orientation, longshore sediment transport and the grain size [82] can also influence the observed beach response. In addition to wave driven processes, karst springs outburst contributes to shaping the beach. Freshwater springs occur irregularly in several places on the beach. The sediment is carried offshore with streams and once the streams seize down, the sediment is returned to the beach by waves. This phenomenon was also studies at the Uboka beach on the western side of the Kvarner Bay [36]. The 3D UAV surveys managed to capture the areas affected by karst spring outburst and changes affected by them.
5.3. Further Implications
Overall, the Ploče beach was relatively stable throughout the surveyed period and requires very small amount of sediment for its maintenance, unlike some other artificial beaches in Croatia [3]. It is important to stress that adding beach material is primarily to maintain the bathing beach areas as large as possible. Hence, the frequency of nourishment is not informed by the beach stability, though nourishment contributes to stability of the beach. While the findings presented here are derived from an artificial beach in Croatia, these are applicable elsewhere and in particular for monitoring and design of gravel beaches in the fetch limited environments. Design of the beach Ploče utilised two natural embayments and expanded headlands with construction of groynes. The central groyne seems to protect quite well the western beach. The eastern beach, which is not covered in this paper, is more exposed to the prevailing wave conditions but again appears to be relatively stable. Hence, the layout and constructed protection, which follows more or less the natural coastal configuration seems to work reasonably well. Despite of aforementioned limitations with UAV surveys, they were effective and the work is currently on the way to improve accuracy of surveys and beach volume estimates, as well as surveys of the submerged part of the beach. The surveys and wave measurements will be used in the numerical modelling to inform future design of beach nourishment of gravel pocket beaches.
6. Conclusions
This study demonstrates the potential of UAVs and SfM photogrammetry for repeated monitoring of not only beach nourishment, but also beach elevation changes on natural gravel beaches. Once GCPs are set up, surveys are relatively fast—it takes about one hour to survey small pocket beaches found around rocky Eastern Adriatic coast. Uncertainties in the vertical coordinates of the point clouds are ±5 cm regardless of the drone and cameras used—consumer grade (DJI phantom 4) and professional UAV (DJI Matrice 200, Sony ILCE-7M2). The uncertainty levels are significantly lower than the beach elevation changes after storms.
Using full 3D point clouds, the longshore variability and dynamics of an artificial pocket beach were captured based upon nineteen surveys between January 2020 and January 2021. The findings provide new insights into the response of a nourished beach to storms. Clear cross-shore exchange of sediment between lower and upper part of the emerged beach was evident on the western side of the beach, which is exposed directly to the dominant wave direction. Post-nourishment, the beach profile steepens and berms are formed on the upper beach. The locations of berms are related to the extent of wave run-up and thus wave height. Berms are found higher up the beach as wave height increases. In contrast, once sediment is lost from the emerged eastern part of the beach by the first post-nourishment storm, the beach elevations remain low until the next nourishment. Thus, most of the sediment loss comes from the eastern side of the beach, even if it is very small.
While the 3D point clouds are generally useful for estimating total beach volumes, the estimated volume changes between surveys were less than the estimated uncertainty levels of ±46 m3. Similarly, shoreline changes were smaller than estimated uncertainty levels. There are no clear relationships between the beach changes (volume and area) and different wave forcing parameters such as the storm power index. It was found that in addition to wave processes, karst spring outbursts are also responsible for shaping the beach during storms.
Overall, the studied beach was found to be relatively stable. The layout of the artificial beach and its protection by groynes, which follow more or less existing natural embayments, appear to be effective in reducing the losses of nourished material from the beach. Future work will focus on improving the accuracy of UAV surveys and monitoring exchange of sediment between the emerged and submerged beach. Field measurements and numerical modelling will be used to examine relationship between hydrodynamic and observed elevation changes of the beach.
Author Contributions
Conceptualization, A.T., I.R. and S.I.; data curation, A.T., I.R. and N.K.; formal analysis, A.T., I.R. and S.I.; funding acquisition, I.R.; investigation, A.T., I.R., N.K. and S.I.; methodology, A.T., I.R. and S.I.; project administration, I.R.; supervision, I.R., N.K. and S.I.; visualization, A.T. and I.R.; writing—original draft, A.T., I.R. and S.I. All authors have read and agreed to the published version of the manuscript.
Funding
This work has been fully supported by the “Research Cooperability” Program of the Croatian Science Foundation funded by the European Union from European Social Fund under the Operational Programme Efficient Human Resources 2014–2020 (PZS-2019-02-3081) and by the University of Rijeka (project Uniri-tehnic-18-97 1232).
Institutional Review Board Statement
Not Applicable.
Informed Consent Statement
Not Applicable.
Data Availability Statement
Not Applicable.
Acknowledgments
The authors would like to thank the Department of Geophysics, Faculty of Science, University of Zagreb, for providing Bakar tide gauge data, and also the University of Rijeka for funding this research.
Conflicts of Interest
The authors declare no conflict of interest.
References
- Hanson, H.; Brampton, A.; Capobianco, M.; Dette, H.H.; Hamm, L.; Laustrup, C.; Lechuga, A.; Spanhoff, R. Beach nourishment projects, practices, and objectives—A European overview. Coast. Eng. 2002, 47, 81–111. [Google Scholar] [CrossRef]
- Anthony, E.J. The status of beaches and shoreline development options on the French Riviera: A perspective and a prognosis. J. Coast. Conserv. 1997, 3, 169–178. [Google Scholar] [CrossRef]
- Pikelj, K.; Ružić, I.; Ilić, S.; James, M.; Kordić, B. Implementing an efficient beach erosion monitoring system for coastal management in Croatia. Ocean. Coast. Manag. 2018, 156, 223–238. [Google Scholar] [CrossRef] [Green Version]
- Bertoni, D.; Sarti, G. On the profile evolution of three artificial pebble beaches at Marina di Pisa, Italy. Geomorphology 2011, 130, 244–254. [Google Scholar] [CrossRef]
- Leont’yev, I.O. Artificial Beach as a Structure for Protecting a Seacoast from Storm Surge Impact (Based on the Example of the Eastern Gulf of Finland). Oceanology 2019, 59, 267–275. [Google Scholar] [CrossRef]
- Leonard, L.A.; Dixon, K.L.; Pilkey, O.H. A Comparison of Beach Replenishment on the U.S. Atlantic, Pacific, and Gulf Coasts. J. Coast. Res. 1990, SI, 127–140. [Google Scholar]
- Dean, R.G. Beach nourishment: Theory and practice. In Advanced Series on Ocean Engineering; World Scientific: River Edge, NJ, USA, 2002; Volume 18, p. 420. [Google Scholar]
- Ojeda, E.; Guillén, J.; Ribas, F. The morphodynamic responses of artificial embayed beaches to storm events. Adv. Geosci. 2010, 26, 99–103. [Google Scholar] [CrossRef] [Green Version]
- Moreira, A.; Gomes, J.; das Neves, L.; Taveira-Pinto, F.; Lopes, M.L.; Veloso-Gomes, F. Experimental study on the performance of a perched beach constructed with geotextile encapsulated-sand systems. In Proceedings of the Coastal Sediments 2015, San Diego, CA, USA, 11–15 May 2015; Wang, P., Rosati, J.D., Cheng, J., Eds.; World Scientific: San Diego, CA, USA, 2015; pp. 1–11. [Google Scholar]
- das Neves, L.; Moreira, A.; Taveira-Pinto, F.; Lopes, M.L.; Veloso-Gomes, F. Performance of submerged nearshore sand-filled geosystems for coastal protection. Coast. Eng. 2015, 95, 147–159. [Google Scholar] [CrossRef]
- Dean, R.G.; Yoo, C.-H. Beach Nourishment in Presence of Seawall. J. Waterw. Port Coast. Ocean. Eng. 1994, 120, 302–316. [Google Scholar] [CrossRef]
- Elko, N.A.; Holman, R.A.; Gelfenbaum, G. Quantifying the rapid evolution of a nourishment project with video imagery. J. Coast. Res. 2005, 21, 633–645. [Google Scholar] [CrossRef]
- de Schipper, M.A.; de Vries, S.; Ruessink, G.; de Zeeuw, R.C.; Rutten, J.; van Gelder-Maas, C.; Stive, M.J.F. Initial spreading of a mega feeder nourishment: Observations of the Sand Engine pilot project. Coast. Eng. 2016, 111, 23–38. [Google Scholar] [CrossRef] [Green Version]
- Liu, G.; Cai, F.; Qi, H.; Zhu, J.; Liu, J. Morphodynamic evolution and adaptability of nourished beaches. J. Coast. Res. 2019, 35, 737–750. [Google Scholar] [CrossRef]
- Dornbusch, U.; Williams, R.B.G.; Moses, C.; Robinson, D.A. Life expectancy of shingle beaches: Measuring in situ abrasion. J. Coast. Res. 2002, 36, 249–255. [Google Scholar] [CrossRef] [Green Version]
- Hemmingsen, M.A. The abrasion of “greywacke” on a mixed sand and gravel coast. J. Coast. Res. 2001, 278–287. Available online: https://0-www-jstor-org.brum.beds.ac.uk/stable/25736294 (accessed on 15 July 2021).
- Bertoni, D.; Sarti, G.; Grottoli, E.; Ciavola, P.; Pozzebon, A.; Domokos, G.; Novák-szabó, T. Impressive abrasion rates of marked pebbles on a coarse-clastic beach within a 13-month timespan. Mar. Geol. 2016, 381, 175–180. [Google Scholar] [CrossRef]
- Grottoli, E.; Bertoni, D.; Pozzebon, A.; Ciavola, P. Influence of particle shape on pebble transport in a mixed sand and gravel beach during low energy conditions: Implications for nourishment projects. Ocean. Coast. Manag. 2019, 169, 171–181. [Google Scholar] [CrossRef]
- Harley, M.D.; Andriolo, U.; Armaroli, C.; Ciavola, P. Shoreline rotation and response to nourishment of a gravel embayed beach using a low-cost video monitoring technique: San Michele-Sassi Neri, Central Italy. J. Coast. Conserv. 2014, 18, 551–565. [Google Scholar] [CrossRef]
- Work, P.A.; Dean, R.G. Assessment and Prediction of Beach-Nourishment Evolution. J. Waterw. Port Coast. Ocean. Eng. 1995, 121, 182–189. [Google Scholar] [CrossRef]
- Anthony, E.J.; Cohen, O.; Sabatier, F. Chronic offshore loss of nourishment on Nice beach, French Riviera: A case of over-nourishment of a steep beach? Coast. Eng. 2011, 58, 374–383. [Google Scholar] [CrossRef]
- Ciavola, P.; Castiglione, E. Sediment dynamics of mixed sand and gravel beaches at short timescales. J. Coast. Res. 2009, II, 1751–1755. [Google Scholar]
- Bertoni, D.; Dean, S.; Trembanis, A.C.; Sarti, G. Multi-month sedimentological characterization of the backshore of an artificial coarse-clastic beach in Italy. Rend. Lincei 2019, 31, 65–77. [Google Scholar] [CrossRef]
- Cammelli, C.; Jackson, N.L.; Nordstrom, K.F.; Pranzini, E. Assessment of a gravel nourishment project frontin a seawall at Marina di Pisa, Italy. J. Coast. Res. 2006, II, 770–775. [Google Scholar]
- Turner, I.L.; Harley, M.D.; Almar, R.; Bergsma, E.W.J. Satellite optical imagery in Coastal Engineering. Coast. Eng. 2021, 167, 103919. [Google Scholar] [CrossRef]
- Castelle, B.; Masselink, G.; Scott, T.; Stokes, C.; Konstantinou, A.; Marieu, V.; Bujan, S. Satellite-derived shoreline detection at a high-energy meso-macrotidal beach. Geomorphology 2021, 383, 107707. [Google Scholar] [CrossRef]
- Vos, K.; Splinter, K.D.; Harley, M.D.; Simmons, J.A.; Turner, I.L. CoastSat: A Google Earth Engine-enabled Python toolkit to extract shorelines from publicly available satellite imagery. Environ. Model. Softw. 2019, 122, 104528. [Google Scholar] [CrossRef]
- Vos, K.; Harley, M.D.; Splinter, K.D.; Walker, A.; Turner, I.L. Beach slopes from satellite-derived shorelines. Geophys. Res. Lett. 2020, 47, e2020GL088365. [Google Scholar] [CrossRef]
- Miles, A.; Ilić, S.; Whyatt, D.; James, M.R. Characterizing beach intertidal bar systems using multi-annual LiDAR data. Earth Surf. Process. Landf. 2019, 44, 1572–1583. [Google Scholar] [CrossRef] [Green Version]
- James, M.R.; Robson, S. Straightforward reconstruction of 3D surfaces and topography with a camera: Accuracy and geoscience application. J. Geophys. Res. Earth Surf. 2012, 117, F03017. [Google Scholar] [CrossRef] [Green Version]
- Westoby, M.J.; Brasington, J.; Glasser, N.F.; Hambrey, M.J.; Reynolds, J.M. “Structure-from-Motion” photogrammetry: A low-cost, effective tool for geoscience applications. Geomorphology 2012, 179, 300–314. [Google Scholar] [CrossRef] [Green Version]
- James, M.R.; Robson, S.; Smith, M.W. 3-D uncertainty-based topographic change detection with structure-from-motion photogrammetry: Precision maps for ground control and directly georeferenced surveys. Earth Surf. Process. Landf. 2017, 42, 1769–1788. [Google Scholar] [CrossRef]
- Swirad, Z.M.; Rosser, N.J.; Brain, M.J. Identifying mechanisms of shore platform erosion using Structure-from-Motion (SfM) photogrammetry. Earth Surf. Process. Landf. 2019, 44, 1542–1558. [Google Scholar] [CrossRef] [Green Version]
- Casella, E.; Rovere, A.; Pedroncini, A.; Stark, C.P.; Casella, M.; Ferrari, M.; Firpo, M. Drones as tools for monitoring beach topography changes in the Ligurian Sea (NW Mediterranean). Geo-Mar. Lett. 2016, 36, 151–163. [Google Scholar] [CrossRef]
- Harwin, S.; Lucieer, A. Assessing the accuracy of georeferenced point clouds produced via multi-view stereopsis from Unmanned Aerial Vehicle (UAV) imagery. Remote Sens. 2012, 4, 1573–1599. [Google Scholar] [CrossRef] [Green Version]
- James, M.R.; Ilić, S.; Ružić, I. Measuring 3D coastal change with a digital camera. In Proceedings of the 7th International Conference on Coastal Dynamics, Arcachon, France, 24–28 June 2013; pp. 893–904. [Google Scholar]
- Lucieer, A.; Turner, D.; King, D.H.; Robinson, S.A. Using an unmanned aerial vehicle (UAV) to capture micro-topography of antarctic moss beds. Int. J. Appl. Earth Obs. Geoinf. 2013, 27, 53–62. [Google Scholar] [CrossRef] [Green Version]
- Turner, I.L.; Harley, M.D.; Drummond, C.D. UAVs for coastal surveying. Coast. Eng. 2016, 114, 19–24. [Google Scholar] [CrossRef]
- James, M.R.; Chandler, J.H.; Eltner, A.; Fraser, C.; Miller, P.E.; Mills, J.P.; Noble, T.; Robson, S.; Lane, S.N. Guidelines on the use of structure-from-motion photogrammetry in geomorphic research. Earth Surf. Process. Landf. 2019, 44, 2081–2084. [Google Scholar] [CrossRef]
- Bujak, D.; Bogovac, T.; Carević, D.; Ilic, S.; Lončar, G. Application of artificial neural networks to predict beach nourishment volume requirements. J. Mar. Sci. Eng. 2021, 9, 786. [Google Scholar] [CrossRef]
- Komar, P.D. The design of stable and aesthetic beach fills: Learning from nature. In Proceedings of the Coastal Sediments’ 07-6th International Symposium on Coastal Engineering and Science of Coastal Sediment Processes, New Orleans, LA, USA, 13–17 May 2007; pp. 1–14. [Google Scholar]
- Grottoli, E.; Bertoni, D.; Ciavola, P. Short- and medium-term response to storms on three Mediterranean coarse-grained beaches. Geomorphology 2017, 295, 738–748. [Google Scholar] [CrossRef]
- Poate, T.; Masselink, G.; Davidson, M.; McCall, R.; Russell, P.; Turner, I. High frequency in-situ field measurements of morphological response on a fine gravel beach during energetic wave conditions. Mar. Geol. 2013, 342, 1–13. [Google Scholar] [CrossRef]
- Ružić, I.; Benac, Č.; Ilić, S.; Krvavica, N.; Rubinić, J. Geomorphological changes in a miniature beach in the karst. Hrvat. Vode 2018, 26, 27–34. [Google Scholar]
- Pikelj, K.; Ružić, I.; James, M.R.; Ilić, S. Structure-from-Motion (SfM) monitoring of nourished gravel beaches in Croatia. In Proceedings of the COASTS, MARINE STRUCTURES and BREAKWATERS 2017—The Leading International Conference Highlighting Global Marine Engineering Advance, Liverpool, UK, 5–7 September 2017; pp. 112:1–112:4. [Google Scholar]
- Benac, Č.; Dugonjić Jovančević, S.; Ružić, I.; Vivoda, M.; Peranić, J. Marine erosion and slope movements: SE coast of the Krk island. In Proceedings of the Landslide Science for a Safer Geoenvironment: Targeted Landslides, Beijing, China, 2–6 June 2014; Springer: Berlin/Heidelberg, Germany, 2014; Volume 3, pp. 563–567. [Google Scholar]
- Ružić, I.; Benac, Č.; Dugonjić Jovančević, S.; Radišić, M. The application of UAV for the analysis of geological hazard in Krk Island, Croatia, Mediterranean Sea. Remote Sens. 2021, 13, 1790. [Google Scholar] [CrossRef]
- Ružić, I.; Benac, Č.; Marović, I.; Ilić, S. A stability assessment of coastal cliffs using digital imagery. Acta Geotech. Slov. 2015, 12, 25–35. [Google Scholar]
- Ružić, I.; Marović, I.; Benac, Č.; Ilić, S. Coastal cliff geometry derived from structure-from-motion photogrammetry at Stara Baška, Krk Island, Croatia. Geo-Mar. Lett. 2014, 34, 555–565. [Google Scholar] [CrossRef]
- Ružić, I.; Dugonjić Jovančević, S.; Benac, Č.; Krvavica, N. Assessment of the Coastal Vulnerability Index in an Area of Complex Geological Conditions on the Krk Island, Northeast Adriatic Sea. Geosciences 2019, 9, 219. [Google Scholar] [CrossRef] [Green Version]
- Beachex-Sustainable Construction of Artificial Gravel Beaches-Construction of New Beaches and an Increase of Existing Capacity. Available online: http://grad.hr/beachex/en/ (accessed on 8 February 2022).
- DGU Geoportal. Available online: https://geoportal.dgu.hr/ (accessed on 18 November 2021).
- Pasarić, M.; Orlić, M. Long-term meteorological preconditioning of the North Adriatic coastal floods. Cont. Shelf Res. 2001, 21, 263–278. [Google Scholar] [CrossRef]
- Međugorac, I.; Pasarić, M.; Orlić, M. Severe flooding along the eastern Adriatic coast: The case of 1 December 2008. Ocean. Dyn. 2015, 65, 817–830. [Google Scholar] [CrossRef]
- University of Zagreb Faculty of Science. Department of Geophysics. Personal communication, 2021.
- Leder, N.; Smirčić, A.; Vilibić, I. Extreme values of surface wave heights in the northern Adriatic. Geofizika 1998, 15, 1–13. [Google Scholar]
- Leder, N.; Andročec, V.; Čupić, S.; Domijan, N.; Lončar, G. Evolution of surface wave spectra in extreme sea states along the eastern Adriatic open sea and channel areas. In Proceedings of the Rapport du Commission Internationale pour L’exploration Scientifique de la Mer Mediteranee; CIESM Congress, Venice, Italy, 10–14 May 2010; p. 135. [Google Scholar]
- Lončar, G.; Carević, D.; Paladin, M. Analysis of wave deformations before Zagrebačka obala–Port of Rijeka. Hrvat. Vode 2014, 22, 327–336. [Google Scholar]
- Lončar, G.; Leder, N.; Leder, T.D.; Carević, D. Wave energy disbalance as generator of extreme wave occurrence in semi-enclosed coastal waters (Example of Rijeka Bay-Croatia). J. Mar. Sci. Eng. 2019, 7, 420. [Google Scholar] [CrossRef] [Green Version]
- Tabain, T. Standard wind wave spectrum for the Adriatic Sea revisited (1977–1997). Brodogradnja 1997, 45, 303–313. [Google Scholar]
- Penzar, B.; Penzar, I.; Orlić, M. Vrijeme i Klima Hrvatskog Jadrana; Hrvatski Hidrografski Institut, Split: Split, Croatia, 2001; ISBN 953-6235-63-3. [Google Scholar]
- Leica Geosystems. Available online: https://leica-geosystems.com/en-us/products/mobile-mapping-systems/capture-platforms/leica-pegasus_two-ultimate (accessed on 21 December 2021).
- Croatian Meteorological and Hydrological Service. Available online: https://meteo.hr/index_en.php (accessed on 8 February 2022).
- Gonçalves, J.A.; Henriques, R. UAV photogrammetry for topographic monitoring of coastal areas. ISPRS J. Photogramm. Remote Sens. 2015, 104. [Google Scholar] [CrossRef]
- Gonçalves, G.; Gonçalves, D.; Gómez-gutiérrez, Á.; Andriolo, U.; Pérez-alvárez, J.A. 3D reconstruction of coastal cliffs from fixed-wing and multi-rotor uas: Impact of sfm-mvs processing parameters, image redundancy and acquisition geometry. Remote Sens. 2021, 13, 1222. [Google Scholar] [CrossRef]
- James, M.R.; Antoniazza, G.; Robson, S.; Lane, S.N. Mitigating systematic error in topographic models for geomorphic change detection: Accuracy, precision and considerations beyond off-nadir imagery. Earth Surf. Process. Landf. 2020, 45, 2251–2271. [Google Scholar] [CrossRef]
- CloudCompare-M3C2 (Plugin). Available online: https://www.cloudcompare.org/doc/wiki/index.php?title=M3C2_(plugin) (accessed on 8 February 2022).
- Lague, D.; Brodu, N.; Leroux, J. Accurate 3D comparison of complex topography with terrestrial laser scanner: Application to the Rangitikei canyon (N-Z). ISPRS J. Photogramm. Remote Sens. 2013, 82, 10–26. [Google Scholar] [CrossRef] [Green Version]
- Cândido, B.M.; James, M.; Quinton, J.; de Lima, W.; Silva, M.L.N. Sediment source and volume of soil erosion in a gully system using UAV photogrammetry. Rev. Bras. Ciência Solo 2020, 44, 1–14. [Google Scholar] [CrossRef]
- Cook, K.L. An evaluation of the effectiveness of low-cost UAVs and structure from motion for geomorphic change detection. Geomorphology 2017, 278, 195–208. [Google Scholar] [CrossRef]
- Ferrer-González, E.; Agüera-Vega, F.; Carvajal-Ramírez, F.; Martínez-Carricondo, P. UAV photogrammetry accuracy assessment for corridor mapping based on the number and distribution of ground control points. Remote Sens. 2020, 12, 2447. [Google Scholar] [CrossRef]
- Barnhart, T.B.; Crosby, B.T. Comparing two methods of surface change detection on an evolving thermokarst using high-temporal-frequency terrestrial laser scanning, Selawik River, Alaska. Remote Sens. 2013, 5, 2813–2837. [Google Scholar] [CrossRef] [Green Version]
- Lončar, G.; Kalinić, F.; Carević, D.; Bujak, D. Numerical Modelling of the Morphodynamics of the Ploče Gravel Beach in Rijeka. Elektron. Časopis Građevinskog Fak. Osijek 2021, 12, 33–48. [Google Scholar] [CrossRef]
- Ruggiero, P.; Komar, P.D.; Allan, J.C. Increasing wave heights and extreme value projections: The wave climate of the U.S. Pacific Northwest. Coast. Eng. 2010, 57, 539–552. [Google Scholar] [CrossRef]
- Dissanayake, P.; Brown, J.; Wisse, P.; Karunarathna, H. Effects of storm clustering on beach/dune evolution. Mar. Geol. 2015, 370, 63–75. [Google Scholar] [CrossRef]
- Mazas, F.; Hamm, L. A multi-distribution approach to POT methods for determining extreme wave heights. Coast. Eng. 2011, 58, 385–394. [Google Scholar] [CrossRef]
- Bernardara, P.; Mazas, F.; Kergadallan, X.; Hamm, L. A two-step framework for over-threshold modelling of environmental extremes. Nat. Hazards Earth Syst. Sci. 2014, 14, 635–647. [Google Scholar] [CrossRef] [Green Version]
- Archetti, R.; Paci, A.; Carniel, S.; Bonaldo, D. Optimal index related to the shoreline dynamics during a storm: The case of Jesolo beach. Nat. Hazards Earth Syst. Sci. 2016, 16, 1107–1122. [Google Scholar] [CrossRef] [Green Version]
- Guo, J.; Shi, L.; Pan, S.; Ye, Q.; Cheng, W.; Chang, Y.; Chen, S. Monitoring and evaluation of sand nourishments on an embayed beach exposed to frequent storms in eastern China. Ocean. Coast. Manag. 2020, 195, 105284. [Google Scholar] [CrossRef]
- Dolan, R.; Davis, R.E. An intensity scale for Atlantic coast Northeast storms. J. Coast. Res. 1992, 8, 840–853. [Google Scholar]
- Lončar, G.; Carević, D.; Ilić, S.; Krvavica, N.; Kalinić, F. Morfodinamika šljunčanog žala Ploče u uvjetima jakog juga. Hrvat. Vode 2020, 28, 205–216. [Google Scholar]
- Bertoni, D.; Sarti, G.; Benelli, G.; Pozzebon, A. In situ abrasion of marked pebbles on two coarse-clastic beaches (Marina di Pisa, Italy). Ital. J. Geosci. 2012, 131, 205–214. [Google Scholar]
- Austin, M.J.; Masselink, G. Swash-groundwater interaction on a steep gravel beach. Cont. Shelf Res. 2006, 26, 2503–2519. [Google Scholar] [CrossRef]
- Austin, M.J.; Masselink, G. Observations of morphological change and sediment transport on a steep gravel beach. Mar. Geol. 2006, 229, 59–77. [Google Scholar] [CrossRef]
- Ruiz de Alegria-Arzaburu, A.; Masselink, G. Storm response and beach rotation on a gravel beach, Slapton Sands, U.K. Mar. Geol. 2010, 278, 77–99. [Google Scholar] [CrossRef]
Figure 1.
Location of the case study.

Figure 2.
Study site (top) before the construction [52] and (bottom) after construction.
Figure 2.
Study site (top) before the construction [52] and (bottom) after construction.

Figure 3.
(a) Study site with marked locations of ground control points (K1, K2, K4–K20, P1, P2 and OT1–OT4); (b) GCP markers.
Figure 3.
(a) Study site with marked locations of ground control points (K1, K2, K4–K20, P1, P2 and OT1–OT4); (b) GCP markers.

Figure 4.
Vertical accuracy; (a) M3C2 distances on concrete promenade; (b,c) inserts of M3C2 from UAV_10-4; (d,e) inserts of M3C2 from UAV_19-14.
Figure 4.
Vertical accuracy; (a) M3C2 distances on concrete promenade; (b,c) inserts of M3C2 from UAV_10-4; (d,e) inserts of M3C2 from UAV_19-14.

Figure 5.
Location of cross-shore transects marked 10–110; blue polygon shows the extent of the area for beach area and volume calculations.
Figure 5.
Location of cross-shore transects marked 10–110; blue polygon shows the extent of the area for beach area and volume calculations.

Figure 6.
Wave rose for all wave measurements.

Figure 7.
Identified storm events. A dashed line represents the stop of the wave buoy measurement and the start of the ADCP data (30 January 2021).
Figure 7.
Identified storm events. A dashed line represents the stop of the wave buoy measurement and the start of the ADCP data (30 January 2021).

Figure 8.
Shoreline changes.

Figure 9.
Beach elevation changes (emerged) between successive surveys.

Figure 10.
Flooding and outbursts on the beach, 2 March 2020.

Figure 11.
Elevation changes in transects at the west (top), in the middle (middle) and at the east end of the beach (bottom).
Figure 11.
Elevation changes in transects at the west (top), in the middle (middle) and at the east end of the beach (bottom).

Figure 12.
Beach volumes (top) and beach areas (bottom) during surveying.


Table 1.
Annual cost of renourishment for the Ploče beach.
| Year | Cost of Renourishment, before GDP [EUR] | Annual Amount [m3] | Origin of Material | Grain Size [mm] |
|---|---|---|---|---|
| 2020 (summer) | Unknown | 100 | The Drava River | 32 |
| 2020 | 5800.00 | 150 | 32 | |
| 2019 | 2700.00 | 50 | 32 | |
| 2018 | 3100.00 | 92 | 32 | |
| 2017 | 4800.00 | 145 | 32 | |
| 2016 | 2300.00 | 118 | 32 | |
| 2015 | 6700.00 | 150 | 32 |
Table 2.
Survey data from Agisoft Metashape.
| Date | Survey Label | Surveyed by | Coverage Area (km2) | Number of Aligned Images | Flying Altitude (m) | Ground Res. (mm/pix) | Tie Points | Projections | Reprojection Error (pix) |
|---|---|---|---|---|---|---|---|---|---|
| 17 January 2020 | UAV_01 | GZR 1 | 0.065 | 355 | 102.0 | 19.0 | 115,521 | 963,731 | 0.897 |
| 7 February 2020 | UAV_02 | GZR 1 | 0.072 | 467 | 103.0 | 18.8 | 233,105 | 1,445,253 | 0.767 |
| 12 February 2020 | UAV_03 | GZR 1 | 0.063 | 321 | 101.5 | 19.7 | 268,994 | 1,663,459 | 0.693 |
| 2 March 2020 | UAV_04 | GradRi 2 | 0.009 | 602 | 19.2 | 4.7 | 309,557 | 2,183,095 | 0.404 |
| 3 March 2020 | UAV_05 | GradRi 2 | 0.013 | 366 | 28.0 | 7.1 | 206,361 | 1,153,749 | 0.526 |
| 10 March 2020 | UAV_06 | GradRi 2 | 0.016 | 388 | 29.0 | 7.4 | 207,342 | 1,155,296 | 0.508 |
| 20 March 2020 | UAV_07 | GradRi 2 | 0.021 | 613 | 31.3 | 7.9 | 294,521 | 1,465,854 | 0.629 |
| 29 March 2020 | UAV_08 | GradRi 2 | 0.016 | 362 | 27.4 | 7.0 | 171,709 | 1,320,331 | 0.631 |
| 28 April 2020 | UAV_09 | GradRi 2 | 0.025 | 382 | 34.7 | 8.9 | 239,525 | 1,301,030 | 0.708 |
| 5 May 2020 | UAV_10 | GradRi 2 | 0.023 | 383 | 26.2 | 6.6 | 275,779 | 1,381,719 | 0.744 |
| 1 October 2020 | UAV_11 | GradRi 2 | 0.018 | 535 | 28.1 | 7.5 | 300,541 | 1,906,445 | 0.772 |
| 6 October 2020 | UAV_12 | GradRi 2 | 0.020 | 492 | 28.6 | 7.2 | 264,272 | 1,717,020 | 0.826 |
| 13 October 2020 | UAV_13 | GradRi 2 | 0.018 | 538 | 28.5 | 7.1 | 328,053 | 1,875,383 | 0.790 |
| 2 November 2020 | UAV_14 | GZR 1 | 0.080 | 208 | 103.0 | 19.5 | 305,479 | 1,015,135 | 0.733 |
| 24 November 2020 | UAV_15 | GradRi 2 | 0.008 | 278 | 20.5 | 5.1 | 154,838 | 961,184 | 0.515 |
| 10 December 2020 | UAV_16 | GradRi 2 | 0.017 | 600 | 24.3 | 6.1 | 280,890 | 1,840,167 | 0.315 |
| 14 December 2020 | UAV_17 | GZR 1 | 0.060 | 269 | 100.0 | 19.1 | 335,580 | 1,231,250 | 0.724 |
| 14 January 2021 | UAV_18 | GradRi 2 | 0.016 | 560 | 26.7 | 6.6 | 308,839 | 1,653,808 | 0.318 |
| 26 February 2021 | UAV_19 | GZR 1 | 0.060 | 290 | 101.0 | 19.6 | 381,158 | 1,469,166 | 0.791 |
1 Geodetic Institute Rijeka. 2 Faculty of Civil Engineering in Rijeka.
Table 3.
RMSE of point clouds on GCPs—results from Agisoft Metashape.
| Survey Label | No. of GCPs | RMSE [mm] | ||||
|---|---|---|---|---|---|---|
| X | Y | Z | XY | Total | ||
| UAV_01 | 6 | 2.3 | 0.7 | 4.8 | 2.4 | 5.3 |
| UAV_02 | 7 | 4.3 | 1.3 | 10.2 | 4.5 | 11.2 |
| UAV_03 | 6 | 1.0 | 4.7 | 6.2 | 4.8 | 7.8 |
| UAV_04 | 8 | 3.1 | 5.2 | 7.7 | 6.0 | 9.8 |
| UAV_05 | 10 | 8.3 | 6.2 | 5.5 | 10.3 | 11.7 |
| UAV_06 | 6 | 3.3 | 3.4 | 2.1 | 4.8 | 5.2 |
| UAV_07 | 5 | 3.1 | 3.2 | 2.1 | 4.4 | 4.9 |
| UAV_08 | 4 | 0.7 | 0.6 | 0.6 | 0.9 | 1.1 |
| UAV_09 | 4 | 1.1 | 0.8 | 0.9 | 1.3 | 1.6 |
| UAV_10 | 9 | 3.2 | 3.4 | 12.5 | 4.6 | 13.4 |
| UAV_11 | 21 | 4.0 | 5.1 | 9.7 | 6.5 | 11.6 |
| UAV_12 | 23 | 4.9 | 4.4 | 3.5 | 6.6 | 7.5 |
| UAV_13 | 23 | 3.5 | 4.7 | 5.1 | 5.9 | 7.8 |
| UAV_14 | 20 | 7.4 | 7.2 | 5.2 | 10.3 | 11.6 |
| UAV_15 | 8 | 3.7 | 3.1 | 5.0 | 4.8 | 6.9 |
| UAV_16 | 7 | 2.6 | 3.4 | 3.9 | 4.3 | 5.8 |
| UAV_17 | 21 | 2.3 | 0.7 | 4.8 | 2.4 | 5.3 |
| UAV_18 | 13 | 7.4 | 5.5 | 2.3 | 9.3 | 9.5 |
| UAV_19 | 20 | 4.3 | 1.3 | 10.2 | 4.5 | 11.2 |
Table 4.
Energy peaks and storm power indices for 11 defined storm events.
| Storm Event | Start of Storm | End of Storm | Hs,max [m] | Tp [s] | Dirp [°] | Energy Peak [m2 s] | Storm Power Index [m2 h] |
|---|---|---|---|---|---|---|---|
| 1 | 1 March 2020 00:34 | 1 March 2020 04:09 | 1.4 | 4.4 | 170.2 | 8.2 | 5.3 |
| 2 | 1 March 2020 14:29 | 1 March 2020 20:32 | 1.5 | 4.6 | 170.2 | 9.8 | 9.4 |
| 3 | 3 March 2020 00:15 | 3 March 2020 02:28 | 1.6 | 4.6 | 182.8 | 11.3 | 5.5 |
| 4 | 6 March 2020 05:46 | 6 March 2020 08:41 | 2.1 | 5.0 | 177.2 | 21.6 | 12.6 |
| 5 | 5 June 2020 00:21 | 5 June 2020 01:53 | 1.4 | 5.0 | 194.1 | 9.9 | 3.1 |
| 6 | 25 September 2020 01:18 | 25 September 2020 03:41 | 1.5 | 4.6 | 189.8 | 10.3 | 5.4 |
| 7 | 3 October 2020 15:01 | 3 October 2020 16:18 | 1.5 | 4.6 | 191.3 | 10.7 | 3.0 |
| 8 | 5 December 2020 00:53 | 5 December 2020 22:58 | 1.8 | 5.6 | 168.8 | 18.1 | 62.7 |
| 9 | 6 December 2020 08:31 | 6 December 2020 09:43 | 1.6 | 4.6 | 165.9 | 11.1 | 2.9 |
| 10 | 28 December 2020 10:43 | 28 December 2020 20:08 | 2.2 | 5.9 | 180.0 | 27.7 | 39.7 |
| 11 | 23 January 2021 00:03 | 23 January 2021 01:35 | 1.5 | 4.6 | 163.1 | 10.2 | 3.4 |
Publisher’s Note: MDPI stays neutral with regard to jurisdictional claims in published maps and institutional affiliations. |
© 2022 by the authors. Licensee MDPI, Basel, Switzerland. This article is an open access article distributed under the terms and conditions of the Creative Commons Attribution (CC BY) license (https://creativecommons.org/licenses/by/4.0/).
Share and Cite
MDPI and ACS Style
Tadić, A.; Ružić, I.; Krvavica, N.; Ilić, S. Post-Nourishment Changes of an Artificial Gravel Pocket Beach Using UAV Imagery. J. Mar. Sci. Eng. 2022, 10, 358. https://0-doi-org.brum.beds.ac.uk/10.3390/jmse10030358
AMA Style
Tadić A, Ružić I, Krvavica N, Ilić S. Post-Nourishment Changes of an Artificial Gravel Pocket Beach Using UAV Imagery. Journal of Marine Science and Engineering. 2022; 10(3):358. https://0-doi-org.brum.beds.ac.uk/10.3390/jmse10030358
Chicago/Turabian StyleTadić, Andrea, Igor Ružić, Nino Krvavica, and Suzana Ilić. 2022. "Post-Nourishment Changes of an Artificial Gravel Pocket Beach Using UAV Imagery" Journal of Marine Science and Engineering 10, no. 3: 358. https://0-doi-org.brum.beds.ac.uk/10.3390/jmse10030358
Note that from the first issue of 2016, this journal uses article numbers instead of page numbers. See further details here.