Article

Dynamics of Planktonic Microbial Community Associated with Saccharina japonica Seedling

1
Rongcheng Campus, Harbin University of Science and Technology, Weihai 264300, China
2
Key Laboratory of Maricultural Organism Disease Control, Ministry of Agriculture and Rural Affairs, Yellow Sea Fisheries Research Institute, Chinese Academy of Fishery Sciences, Qingdao 266071, China
3
Laboratory for Marine Fisheries Science and Food Production Processes, Pilot National Laboratory for Marine Science and Technology, Qingdao 266071, China
4
Weihai Changqing Ocean Science and Technology Co., Ltd., Weihai 264300, China
5
State Key Laboratory of Marine Environmental Science, College of Ocean and Earth Sciences, Xiamen University, Xiamen 361102, China
6
Key Laboratory of Tropical Aquatic Germplasm of Hainan Province, Sanya Oceanology Institute, Ocean University of China, Sanya 572000, China
*
Author to whom correspondence should be addressed.
J. Mar. Sci. Eng. 2022, 10(6), 726; https://0-doi-org.brum.beds.ac.uk/10.3390/jmse10060726
Submission received: 3 May 2022 / Revised: 15 May 2022 / Accepted: 18 May 2022 / Published: 25 May 2022
(This article belongs to the Special Issue Algal Cultivation and Breeding)

Abstract

:
Macroalgae interact with planktonic microbes in seawater. It remains unclear how planktonic microbes interact with the environment and each other during the cultivation processes of commercially important algal species. Such an interaction is important for developing environment-friendly mariculture methods. In this study, the dynamics of the planktonic microbial community associated with Saccharina japonica were profiled during the seedling production stage, with its environmental correlation and co-occurrence pattern determined simultaneously. Microbial richness increased and positively correlated with light intensity and contents of NO3 and PO43−. A clear temporal succession of the community was observed, which coincided with changes in light intensity, dissolved oxygen, pH, and NO3 content. α-Proteobacteria, Bacteroidetes, γ-Proteobacteria, and the genera prevalent in these taxa dominated the planktonic microbial community, and their relative abundance temporally changed. A profile of keystone taxa that is different from prevalent genera was identified based on betweenness centrality scores. A modularized co-occurrence pattern was determined, in addition to intensified species-to-species interactions at the core of the co-occurrence network. These findings expanded our cognization of the planktonic microbial community in response to S. japonica cultivation.

1. Introduction

The kelp Saccharina japonica (Areschoug) C. E. Lane, C. Mayes, Druehl & G. W. Saunders 2006 is a commercially important Laminariales alga in the sea-farming cultivation industry. It is characterized by fast growth; high yield; low breeding cost; and high comprehensive application values in, for example, the food, medical, and chemical industries [1,2,3]. It also performs ecological functions such as eliminating eutrophication and regulating marine ecological equilibrium, among others [4,5]. Its alternate life history comprises generations of micro-gametophyte and macro-sporophyte [6]. As the most critical components, the seedling production process firstly includes zoospore releasing, attachment and germination, gametophyte differentiation, zygote formation, and young sporophyte development [6]. The young sporophyte should be transferred from the hatcheries and cultivated in the sea field into seedlings. In recent years, diseases have frequently occurred during seedling production, causing either destructive losses or complete failure of cultivation for farmers of China. Several diseases have been frequently characterized during seedling production, which include, for example, sporeling malformation disease and green rot disease [7]. These diseases are found to be either environment- or bacteria-induced [7,8,9,10]. Unfortunately, limited data on environmental variation and in-depth microbial information have been provided to date for S. japonica cultivation in China [11,12].
As compared to terrestrial plants, macroalgae exist in a closer relationship with their surrounding planktonic microbes. On one hand, macroalgal surfaces provide habitats for the colonization of planktonic bacteria [13,14], and the colonized members are capable of functioning either beneficially [15,16,17,18] or harmfully [16,19,20] to the host growth and/or health. On the other hand, the assemblage of bacterioplankton can also be shaped by the host in several ways, with the first being to release large amounts of dissolved organic matter [21,22]. Heterotrophic bacteria can selectively benefit from these carbon sources to multiply and modify themselves [21]. Moreover, alterations in physicochemical properties (e.g., pH and dissolved oxygen) [22], secretion of anti-microbial compounds [23], and dispersal of epibiotic biofilms [24,25] have also been reported to impact the bacterioplankton community. These aspects illustrate the importance of the planktonic microbes in facilitating host–microbiome interactions. Recently, investigations have been extending to economically important macroalgae other than S. japonica, including Gracilaria lemaneiformis [22], Pyropia haitanensis [26], and P. yezoensis [27,28], which have indicated that both biotic and abiotic environmental factors drive bacterioplankton structures, particularly when macroalgae suffer from diseases [28,29]. These studies, however, were carried out either with sparse time points or only to focus on a specific disease, and little is known about how the microbiota changes over the whole seedling or thallus production stage.
The exploration of species-to-species interaction is required for a more integrated understanding of community ecology because relative abundance and species diversity provide limited insights into a structure–function relationship [29]. Recently, co-occurrence networks have provided powerful tools for unraveling the complex interactions among microbes, and the topological features of nodes (i.e., degrees, centralities of betweenness, closeness, and eigenvector) can be used to identify potentially important microbes, such as keystone species [30,31]. High values of the topological features indicate the core and central position of a node in the network, whereas low values indicate a peripheral position [32]. For example, nodes with high closeness centrality values can rapidly affect other nodes, indicating strong links, while nodes with a higher betweenness centrality represents a more potential influence of an individual node on the co-occurrences of other nodes in a network, hence a core and central location [33]. Thus far, the co-occurrence pattern of microbes in macroalgae-associated environments has been scarcely investigated.
In this study, seawater samples were collected from tanks of a kelp seedling hatchery. By sequencing 16S rRNA gene amplicons, we determined the compositional structures, environmental correlation, and co-occurrence pattern for microbial communities during kelp seedling production, aiming to provide information for future studies of the interactions among microbial communities, macroalgae, and environments.

2. Materials and Methods

2.1. Sample Collection and Environmental Characterization

The S. japonica seedling hatchery is located in the city of Weihai, Shandong Province, China (122°34′31″ E, 37°8′58″ N). Approximately 200 tanks, ~20 m2 in size and 0.25 m in depth, were full of seedling collectors, which were managed similarly by irrigating pretreated coastal seawater, supplying stable nutrients, and adjusting sunlight illumination following the recommendation in DB37/T 1190-2009 (Table S1).
The tank culture of seedlings began in August 2018, and seedling collectors were inoculated from the same zoospore batch within isolated zoospore containers prior to transferal to culturing tanks for seedling production. Six time points were selected for seawater sampling according to the seedling production stage (Table 1). At each time point, five randomly selected tanks were sampled, which were approximately 20 m apart from each other. In total, 30 seawater samples were collected. For each tank, the seawater was sampled three times; pooled into approximately 3 L in volume; and pre-filtered through a nylon mesh, 100 μm in pore size. Two liters of pre-filtrated seawater were then filtered again through a hydrophilic polycarbonate membrane, 0.2 µm pore size (Merck Millipore, Tullagreen, Ireland). The membrane was stored at −80 °C. Sunlight illumination, seawater temperature, pH, salinity, and dissolved oxygen (DO) were recorded in situ with a water- quality sampling and monitoring meter (YSI Life Sciences, Yellow Springs, OH, United States) at the middle depth of the culturing seawater. Nutrient concentrations including NO3–N, PO43−–P, NO2–N, and NH4+–N were determined using standard methods with the remaining pre-filtrated seawater, 1 L in volume [34].

2.2. DNA Extraction, PCR Amplification, and Sequencing

Frozen membranes were homogenized twice at 6800 rpm for 30 s with PrecellysTM-24 (Bertin Corp., Rockville, MD, USA), and community DNA was extracted using a DNeasy PowerSoil® Kit (Qiagen, Hilden, Germany) following manufacturer’s instructions. For each sample, an aliquot (50 ng) of DNA was used as the template for amplification. The variable regions V4−V5 of the prokaryotic 16S rRNA gene were amplified using the primer set 515F and 926R [35]. A unique barcode was supplied at the 5′ end of primer 515 F, and PCR amplification was performed using the following conditions: initial denaturation at 98 °C for 2 min, followed by 25–30 cycles of denaturation at 98 °C for 15 s, annealing at 55 °C for 30 s, extension at 72 °C for 30 s, and a final extension at 72 °C for 5 min. PCR amplicon was purified using an AxyPrep DNA Gel Extraction Kit (Axygen, Tewksbury, MA, USA), and quantified using a QuantiT PicoGreen dsDNA Assay Kit with a BioTek FLx800 TBI reader (BioTek Instruments Inc., Winooski, VT, USA). Amplicons of different samples were pooled in equimolar, and pair-end 2 × 300 bp sequencing was performed on the Illumina MiSeq platform with MiSeq Reagent Kit v.3 (Illumina, San Diego, CA, USA).

2.3. Data Analysis

Raw paired-end FASTQ reads were imported into the Quantitative Insights Into Microbial Ecology 2 program (QIIME2, version 2020.2) [36] for microbiome analysis. Paired-end reads were trimmed according to primer length and quality of demultiplexed sequence reads (trimmed left at the 19th sequence base and truncated at position 293rd for forward reads, and trimmed left at the 20th sequence base and truncated at position 299th for reverse reads), merged, and denoised (chimera and singleton removing, and dereplicating) to obtain amplicon sequence variants (ASVs) using the DADA2 plugin [37]. Taxonomic assignment of ASVs was performed using a pre-trained Naive Bayes machine-learning classifier based on the SILVA database (Silva_132_97% OTUs for V4–V5 region corresponding to 515F and 926R primer pairs) [38]. ASVs identified as unassigned, chloroplasts, and mitochondria were removed from further analyses.
Alpha diversity was calculated using observed bacterial/archaeal species (community richness) and Pielou’s evenness (community evenness). Beta diversity was calculated qualitatively based upon Bray–Curtis distance metric. To allow for these comparisons without bias from unequal sequencing effort, all samples were rarefied to the same sequencing depth (corresponding to the sample with the lowest number of sequences).

2.4. Statistical Analysis

Statistical analysis was performed in R [39]. Spearman’s rank correlation coefficients were calculated to show significant relationships between alpha diversity indices and environmental variables. A non-metric multidimensional scaling (NMDS) plot was implemented based upon Bray–Curtis distance metrics to display the microbial community dissimilarity between sample groups [40]. PERMANOVA (permutational multivariate analysis of variance) was performed to statistically determine the differences between groups based on Bray–Curtis distance metrics using the ‘Adonis’ function within the ‘vegan’ package [41,42]. The similarity–time relationship plot was used to assess the temporal turnover rate of the microbial communities, and Spearman’s correlation coefficient was also calculated to evaluate the significance. A test of significant difference in the topological parameters among network modules was performed by one-way analysis of variance (ANOVA) followed by Tukey’s HSD test for multiple comparisons [42].
RDA (redundancy analysis) was performed to investigate the relationships between microbial communities and environmental factors [43]. Environmental variables with a high variance inflation factor (VIF) > 10 were eliminated to avoid collinearity among factors, and a forward selection was conducted using the ‘ordiR2step’ function in the ‘vegan’ package to select those explanatory variables with significant explaining factors (p < 0.05) for further analyses [41]. The correlations between most abundant genera and water variables were estimated based on Pearson’s correlation using the ‘psych’ package.

2.5. Network Analysis

A co-occurrence network was constructed to investigate how the microbial taxa interacted by exhibiting positive or negative Spearman correlations. A correlation matrix was constructed by calculating all pairwise Spearman’s correlation coefficients (r) among ASVs (relative abundances > 0.05%). The nodes in the reconstructed network represent the ASVs, whereas the edges correspond to strong (|r| > 0.8) and significant (FDR-adjusted p < 0.01) Spearman’s correlations between nodes. All statistical analyses were performed using the ‘psych’ package in R [39]. The co-occurrence network was visualized and the topological properties were generated using the interactive platform Gephi 0.9.2 [44]. Moreover, 1000 Erdös-Réyni random networks, with identical numbers of nodes and edges to the real network, were generated [45]. Topological properties, including modularity (MD), average clustering coefficient (CC), and average shortest path length (APL), were compared between the random and real network to assess the extent of randomness of the real network.
Using a previously reported method [46,47], ASVs with maximum betweenness centrality in a network, notably those with scores > 500 and standing names at the genus level, were considered as keystone taxa in the present study.

3. Results

3.1. Physicochemical Parameters of Seawater Samples

The levels of nutrients required by the seedling varied between 2.92 ± 0.09 and 4.06 ± 0.18 mg/L of NO3–N and between 0.20 ± 0.01 and 0.47 ± 0.03 mg/L of PO43−–P (Figure S1), which were generally consistent with the seedling production regulations (Table S1). Other conditions included seawater temperature varying between 11.07 ± 0.22 and 7.08 ± 0.28 °C and light intensity varying between 1000 and 7500 lux, which were also consistent with the regulations. Such consistency indicated that highly strict management has been carried out. Additionally, pH (7.57 ± 0.36) and salinity (32.36 ± 0.70) monotonically remained at relatively stable levels (Figure S1), and DO content slowly increased (8.94 ± 0.05 to 12.75 ± 0.11 mg/L). Other nutrients, NH₄⁺–N and NO2–N, remained at very low levels (<0.20 mg/L) (Figure S1).

3.2. Microbial Alpha and Beta Diversities

In total, 456,006 high-quality sequences were obtained after denoising. After the removal of chloroplasts, mitochondria, and unassigned sequences, 442,904 sequences ranging from 10,236 to 18,504 (14,763 ± 1849 each sample) were classified as bacteria or archaea, with 10,236 corresponding to the sample with the lowest number of sequences. These sequences were binned into 1375 ASVs, which were assigned to a total of 25 phyla.
The observed bacterial/archaeal species showed a slow increase (from 191 ± 17 to 235 ± 41) with a slight decrease observed after T4 (Figure 1a). This pattern was significantly correlated with most of the detected environmental variables except pH and salinity (p > 0.05) (Table S2). The pattern of Pielou’s evenness varied within a narrow range (approximately 0.6 to 0.8) (Figure 1b), indicating a relatively stable evenness pattern though significantly correlated with salinity (rho = 0.650), pH (rho = 0.528), and DO (rho = 0.454) (Table S2).
A major differentiation was found based on sampling time for the microbial communities (Figure 2a), which is consistent with Bray–Curtis distance-based pairwise PERMANOVA (Table S3). Bray–Curtis community dissimilarity and time point intervals showed significantly positive Spearman’s correlation (rho = 0.838, p < 0.001) (Figure 2b). Moreover, dissimilarities of the microbial community composition also increased with time intervals (turnover rate 0.127) (Figure 2b).

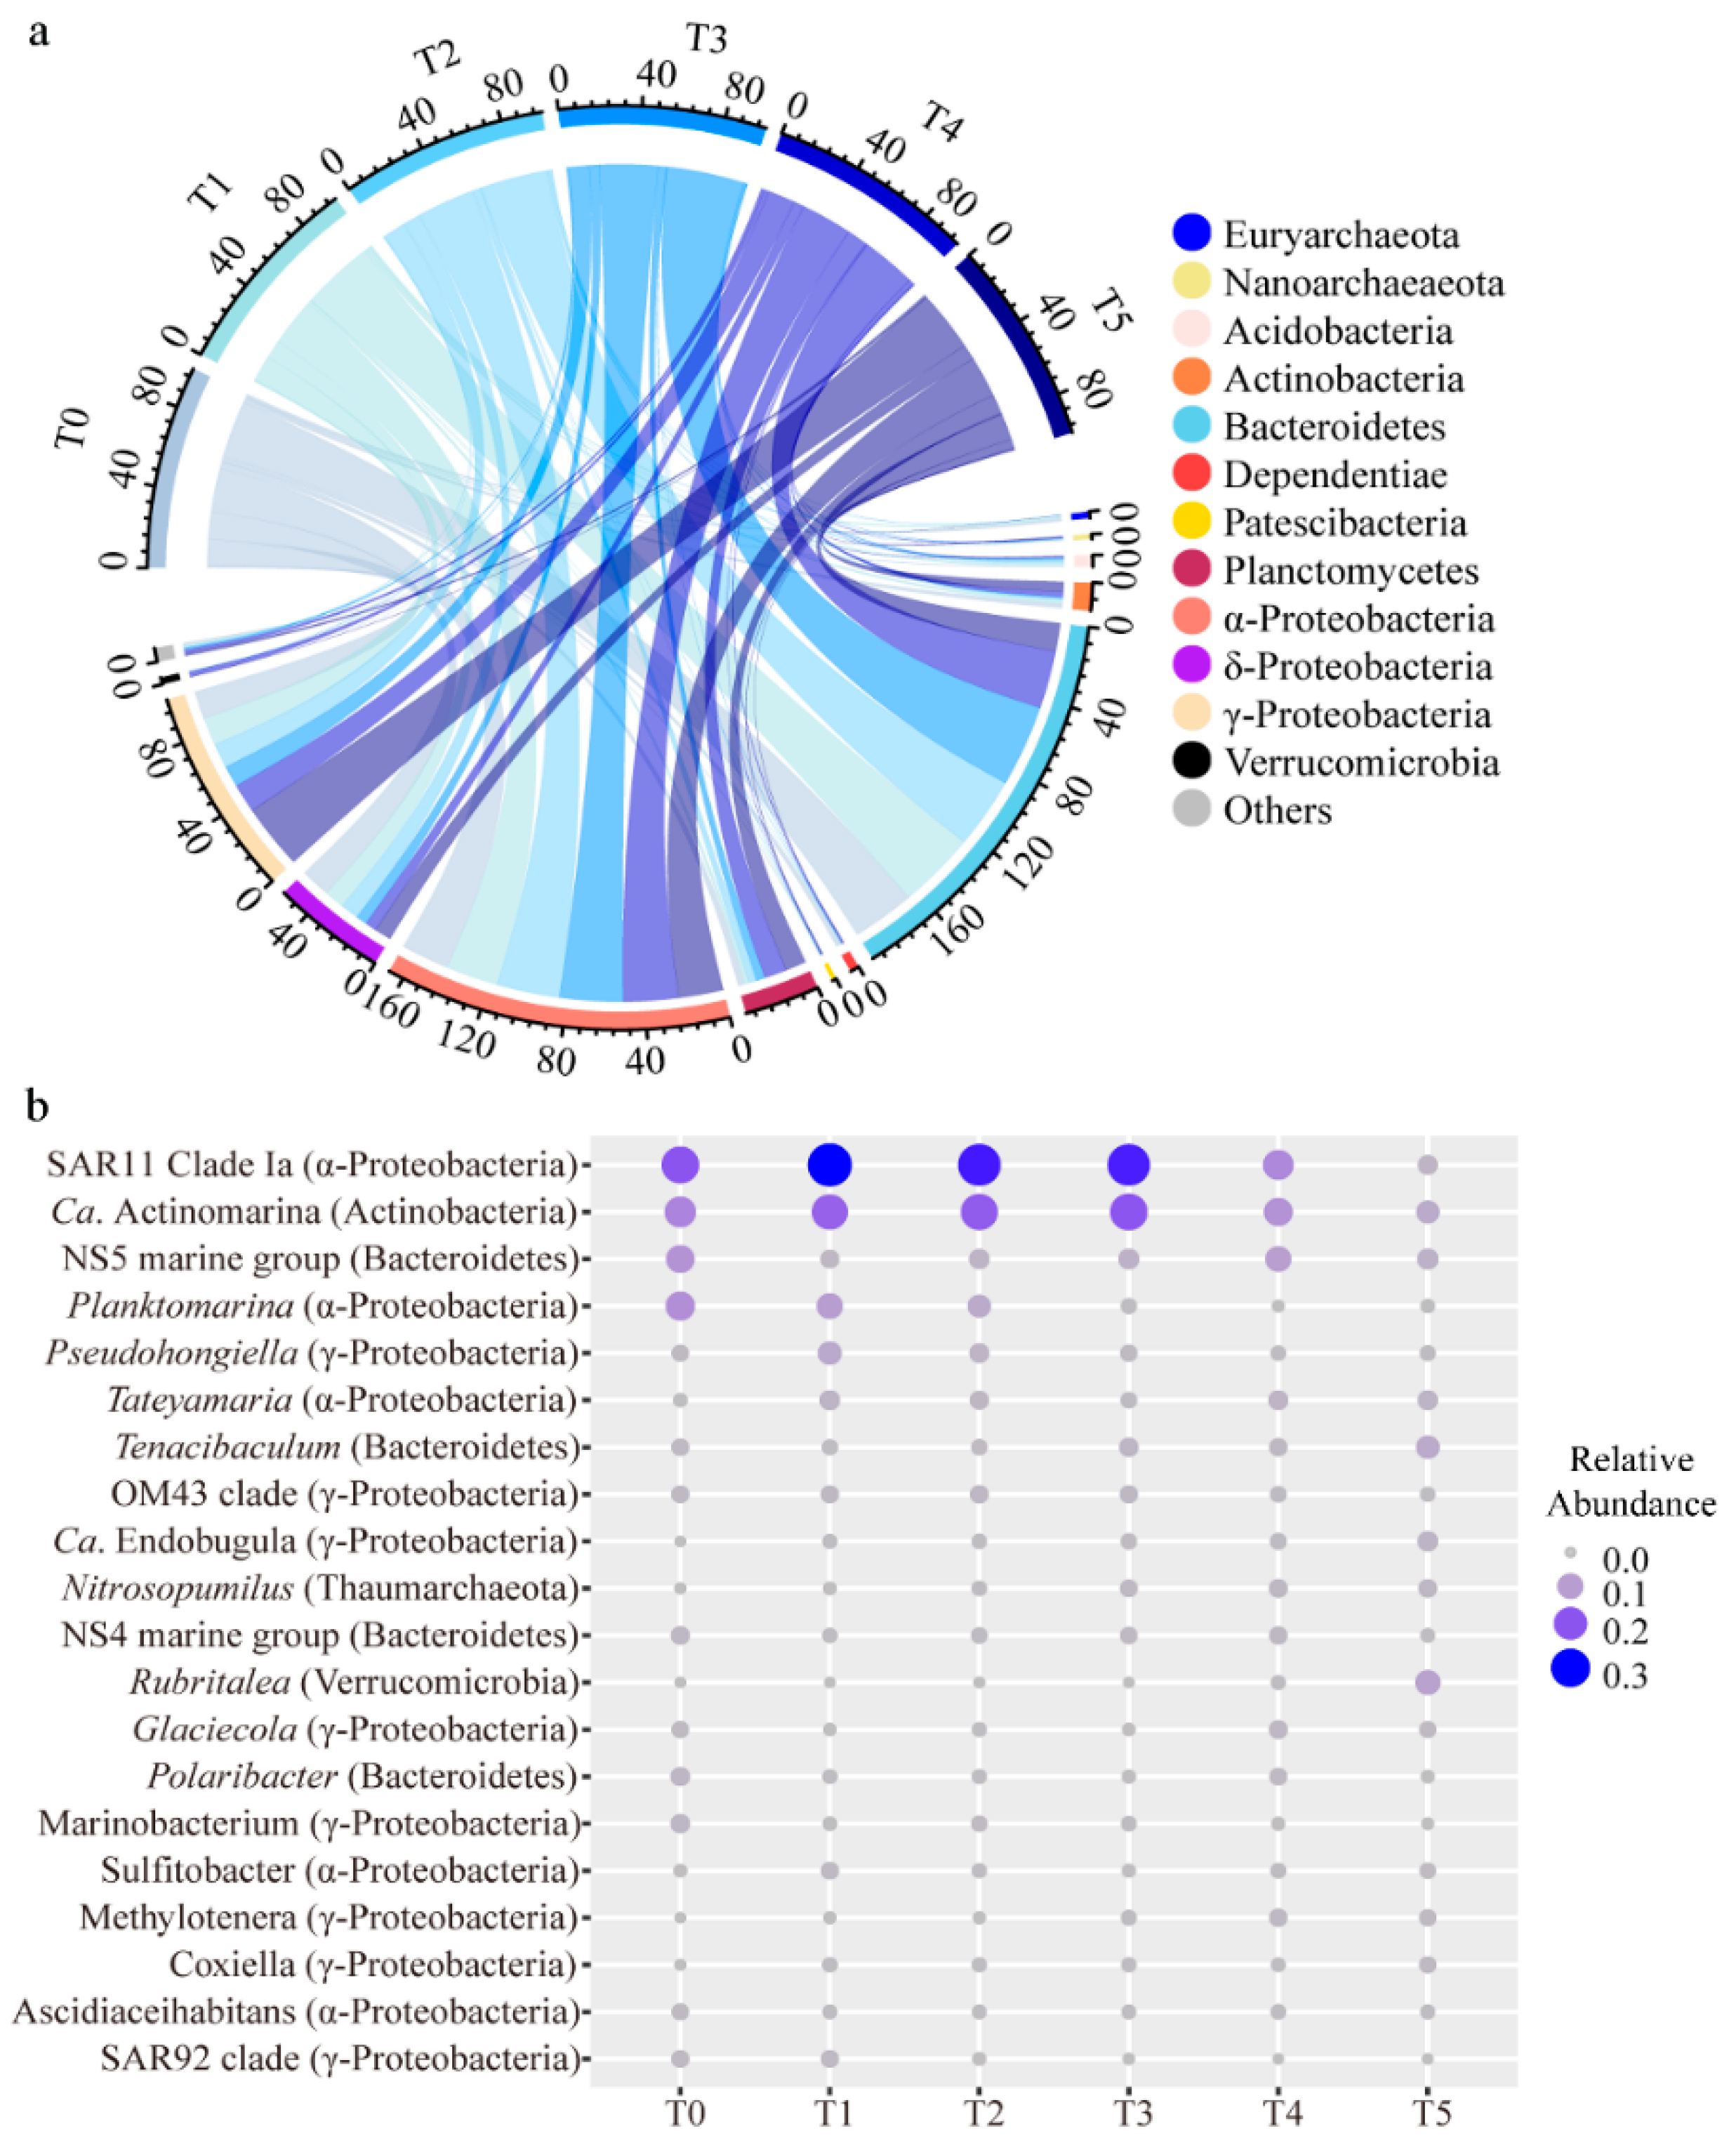
3.3. Distribution of Microbial Taxa

The microbial community was dominated by Bacteroidetes (T0 through T5; 32.5%, 40.0%, 37.1%, 42.8%, 30.3%, and 14.7%), α-Proteobacteria (24.7%, 26.8%, 32.3%, 32.3%, 28.3%, and 23.0%), and γ-Proteobacteria (14.8%, 14.4%, 12.8%, 11.2%, 15.1%, and 34.0%) (Figure 3a). Although cumulatively accounting for nearly 75% of the sequences in all samples, these taxa varied in their relative abundance over the production stage. The relative abundance of the phylum Bacteroidetes and the class α-Proteobacteria generally increased slowly from T0 to T3 and decreased after T3 (Figure 3a), whereas the relative abundance of γ-Proteobacteria decreased after nutrient addition (T0) and elevated to a higher relative abundance at the end of the seedling production (Figure 3a).
Similar trends were not always observed at the genus level (Figure 3b). For example, Planktomarina displayed a consistent decreasing trend across the whole process, although the prevalent SAR11 clade Ia showed similar patterns to the α-Proteobacteria. The dominant Candidatus Actinomarina displayed an opposite trend to the phylum Actinobacteria, to which it belongs. Such differentiated profiles were also observed for the prevalent genera within Bacteroidetes (e.g., NS5 marine group and Tenacibaculum) and γ-Proteobacteria (e.g., Pseudohongiella and OM43 clade). Additionally, a prevalent archaeal genus, Nitrosopumilus, within Thaumarchaeota, was also detected and consistently increased during the seedling production, indicating a potential ammonium oxidation activity by this group [48].

3.4. Environmental Variables and Microbial Communities

RDA revealed that environmental variables, such as illumination, DO, pH, and NO3−N contents, coincided with significant differentiation in the assemblage of microbial communities across the sampling time points (Figure 4a). All these variables also have significant relationships with most of the abundant genera (Figure 4b). For factors that are more correlated with the growth of seedlings, e.g., light and NO3−N, they displayed closely related patterns with the prevalent genera since they were clustered together in the Pearson’s correlation heatmap. Specifically, all these factors were significantly and negatively correlated with NS5 and NS4 marine groups, Planktomarina, Polaribacter, Marinobacterium, Ascidiaceihabitans, and SAR92clade but positively correlated with Tateyamaria, Tenacibaculum, Ca. Endobugula, Nitrosopumilus, Rubritalea, Methylotenera, and Coxiella. No significant correlations were discovered between these factors and Ca. Actinomarina, Pseudohongiella, Glaciecola, and Sulfitobacter.

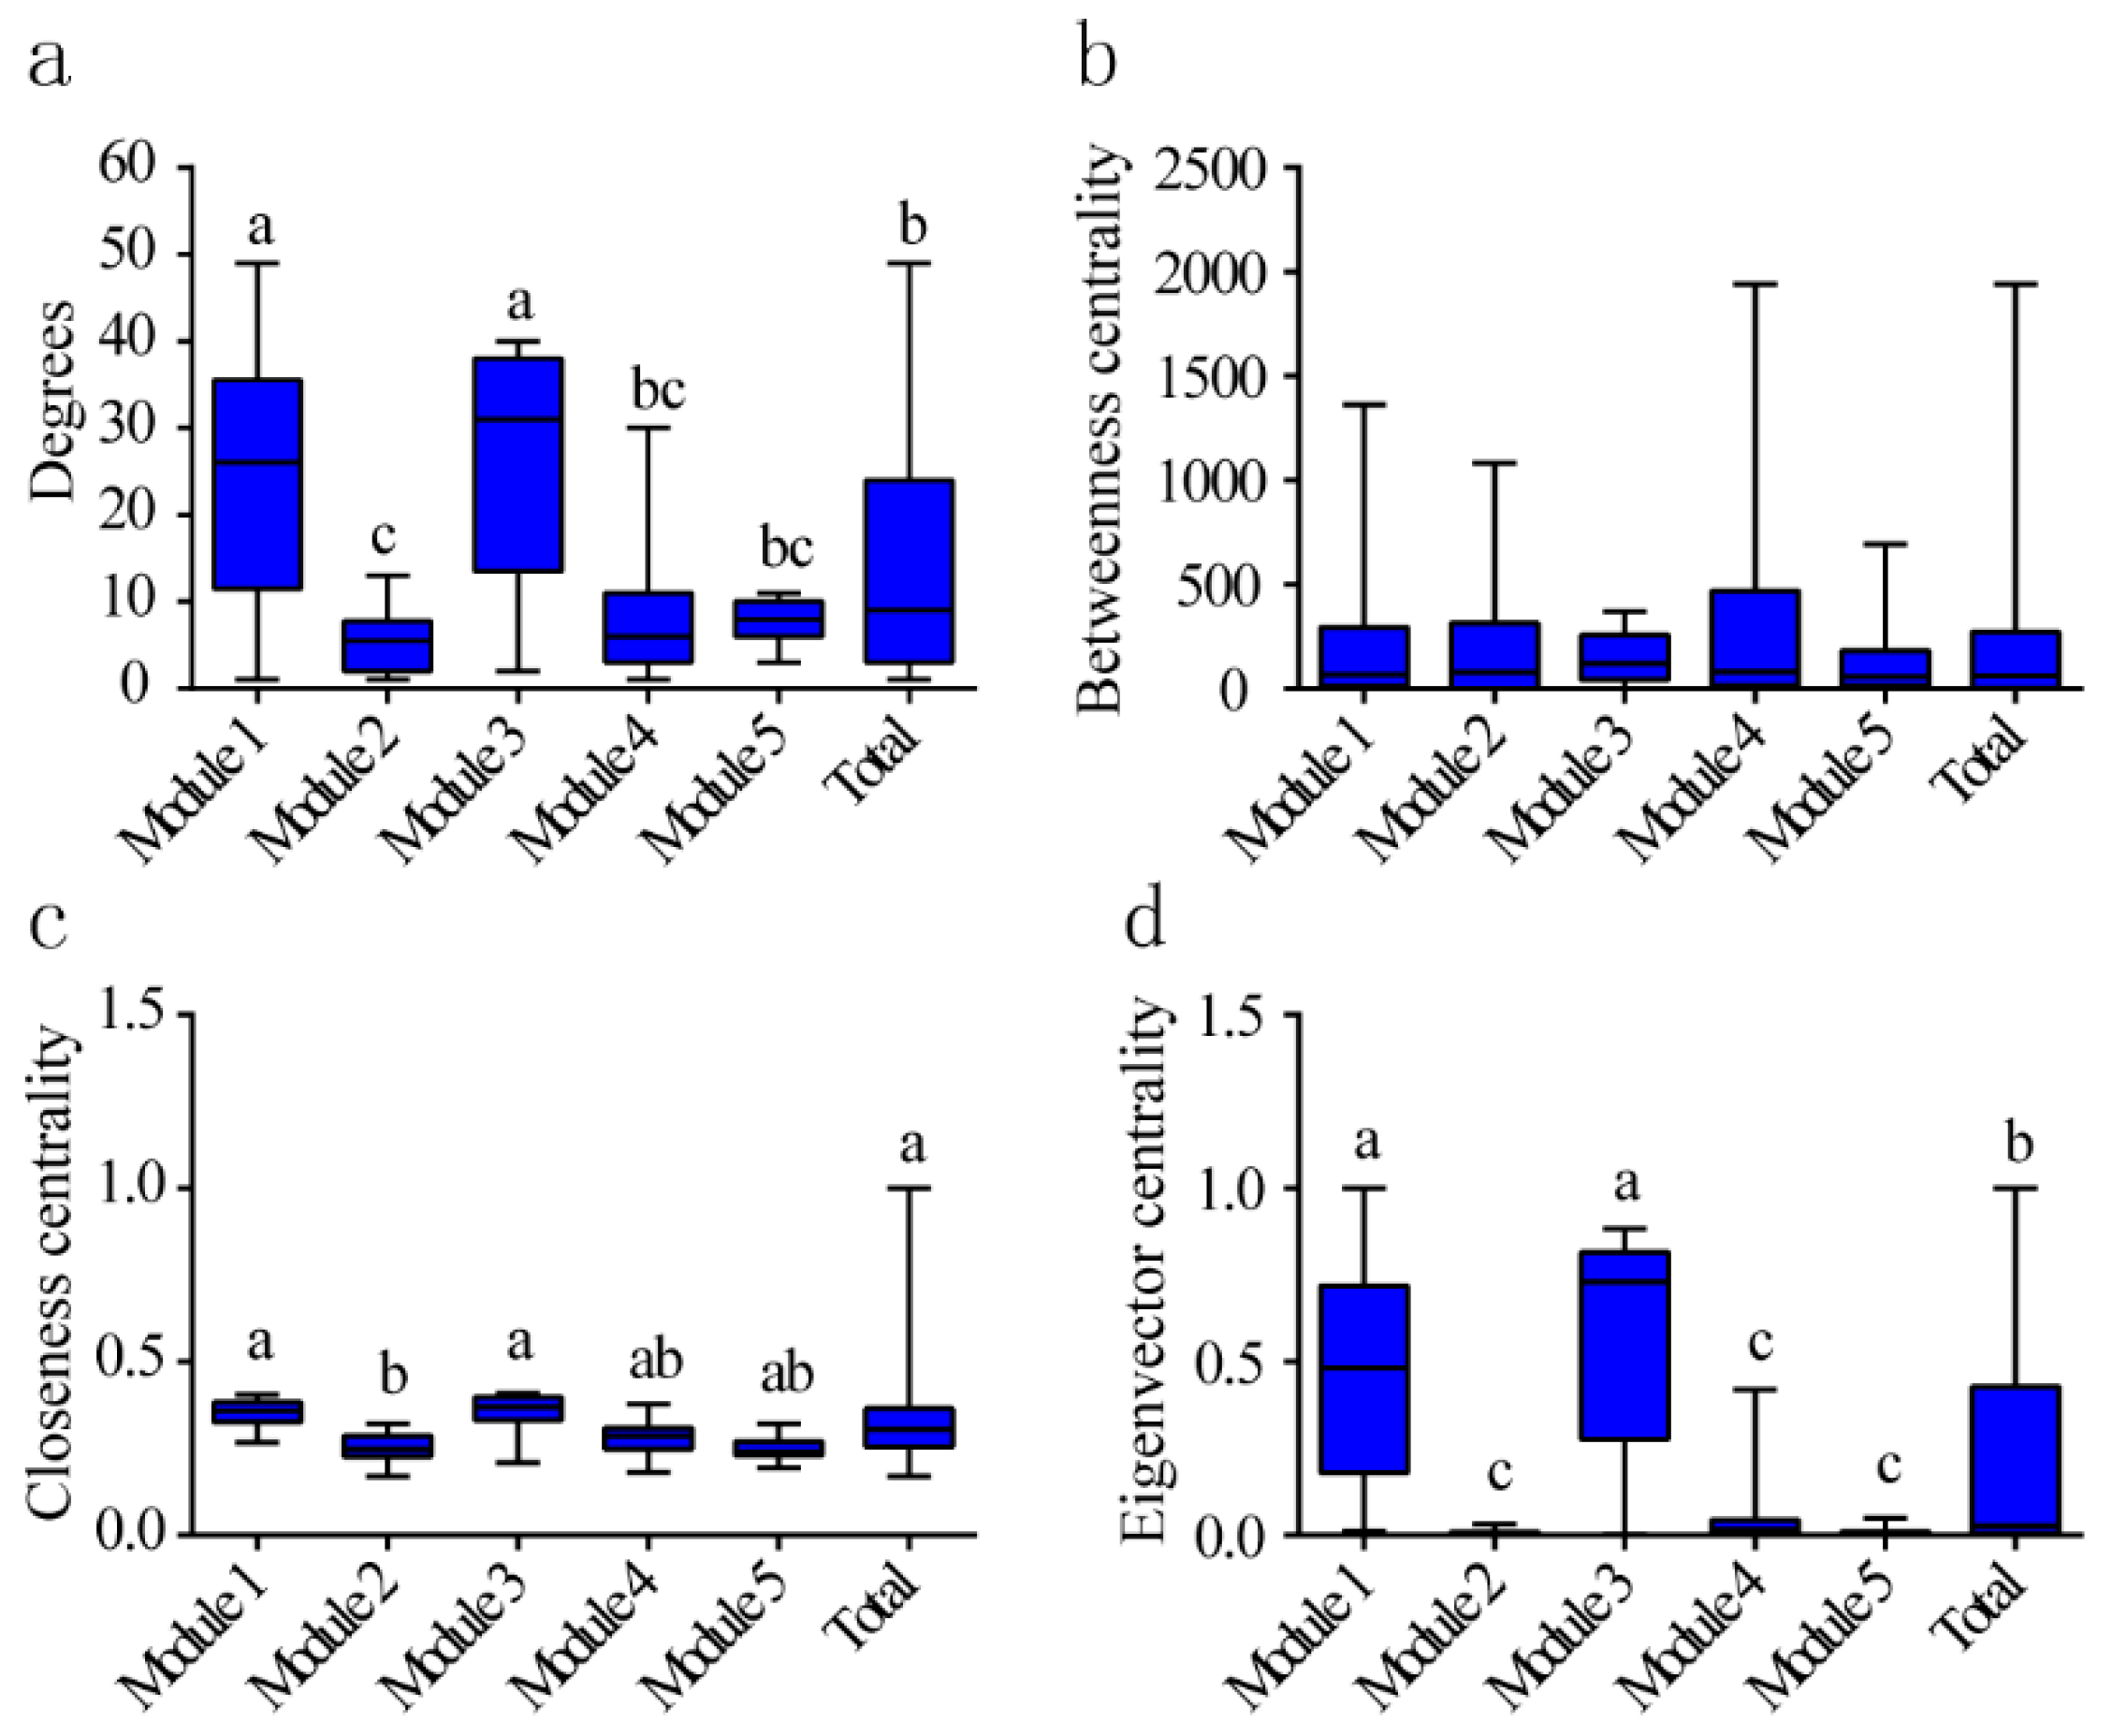
3.5. Microbial Community Co-Occurrence Network

The correlation-based network consisted of 174 nodes and 1217 edges (Table S4), with nodes dominated by the major taxa, such as α-Proteobacteria, γ-Proteobacteria, and Bacteroidia (Bacteroidetes) (Figure 5a,b). The topological properties of APL, MD, and CC were all significantly higher than those of the random network (Table S4), indicating that the real network was non-random and had modular structures. Consequently, the network consisted of 10 modules, of which modules 1 to 5 accounted for 21.3%, 20.7%, 19.0%, 17.8%, and 8.6% of the whole network, respectively (Figure 5b). Significantly higher degrees, closeness centrality, and eigenvector centrality were detected for the modules (module 1 and module 3) at the core of the network (p < 0.05, ANOVA, Tukey’s HSD test) (Figure 6).
Based on betweenness centrality scores, the top five keystone taxa within the network were identified as Amylibacter (α-Proteobacteria), Litoricola (γ-Proteobacteria), Nisaea (α-Proteobacteria), SAR11 Clade Ia (α-Proteobacteria), and Persicirhabdus (Verrucomicrobia) at the genus level (Table S5).

4. Discussion

4.1. Microbial Diversities during the Seedling Production Stage

In the present study, microbial communities were determined, which dramatically changed over time with a notable separation between sampling time points and a dissimilarity turnover rate > 0, indicating that planktonic microbial community changed during the course of kelp seedling production.
The dynamic was also determined for alpha diversity. It is shown that microbial richness (observed bacterial/archaeal species) negatively correlated with the slowly decreased temperature, contrasting with previous reported positive correlations, notably below 20 °C [49,50,51]. The only driving force could be attributed to the growth of the kelp seedlings because cultivated macroalgae are proven to cause large microbial shifts in the adjacent seawater by changing its communities and diversities [22,25,26]. Another piece of evidence derived from the observation that microbial richness was also positively correlated with light, NO3−N, and PO43−−P supplied in accordance with the seedling growth. Therefore, the present data showed that kelp seedlings tend to recruit more taxonomic microbial groups during their growing stage without significantly altering the community evenness.

4.2. The Dominant Microbial Groups and Keystone Taxa

The α-Proteobacteria, Bacteroidetes, and γ-Proteobacteria were the dominant bacterial groups in the present kelp seedling production stage. Their dominance has been extensively detected in coastal ecosystems [52,53], and even in various aquaculture systems [22,28,54,55]. This highlights their importance in biogeochemical cycles included in the current seedling production system. For example, Bacteroidetes and α-Proteobacteria can sequentially utilize polymers and monomers existing in the seawater, thus playing significant roles in C cycles [56]. When bacterial genera were considered, their succession was speculated to be substrate-dependent according to reported data: oligotrophic Planktomarina, SAR11 Clade Ia, Pseudohongiella, and OM43 clade [57,58,59] could thrive on limited nutrients (e.g., C1 carbon) as the seedling process commenced (T0 to T1). This may also be the case with Ca. Actinomarina, a C2 carbon utilizer in seawater [60]. In contrast, members within Bacteroidetes (e.g., Tenacibaculum) are degraders of polymeric organic matters [56], and their growth can be stimulated by algae-derived resources at the late stages (T4 to T5) compared with at the beginning (T0 to T1). Therefore, its distribution pattern is positively correlated with the seedling growth-related environmental factors such as light, which also force the aforementioned oligotrophic microbes to decrease in their relative abundance at the late stage and thus negatively correlated with these seedling growth-related environmental factors. As for the NS5 marine group, despite a polymeric organic degrader, other environmental factors (e.g., temperature) might have more influence on its distribution since it has been reported to be more prevalent in summer in coastal water [61]. This may well explain why its relative abundance decreased accordingly with the temperature decrease across the seedling production stage.
In the field of microbial ecology, keystone taxa have been frequently accepted and identified as ‘ecosystem engineers’ due to their essential roles in driving community structure and function, irrespective of relative abundances, and can play more important roles in microbial communities [31,46,47,61]. Most of the present determined keystone taxa did not belong to the prevalent taxa (Table S6) but were mainly involved in the C cycles, such as the C1 carbon utilizers of SAR11 Clade Ia [62] as well as polymeric carbon resource degraders of Amylibacter [63], Litoricola [64]. This suggests that the prevalent ecological functions in the tanks, at least C cycles, might be sustained and driven by these taxa in parallel with the community compositional changes.

4.3. Co-Occurrence Patterns of Microbial Communities

Interactions among species can be vital in maintaining ecosystem stability and function [29,65]. In the present study, the network encompassed a modularity index that is greater than 0.4, a threshold determining if a network harbors a modularized structure [66]. Co-occurring nodes categorized into modules are usually relevant with functional significance and may represent different functions [46,66]. This observation suggests that prevalent members of α- and γ-Proteobacteria, Bacteroidetes within the major modules participate or mediate in different ecological cycles in the culturing tanks. Higher closeness centrality values in the network also suggest that microbes have stronger interactions, particularly in the central location. It is reported that the strong links between the bacterial phylotypes possibly enable them to be critical drivers or indicators of key ecological processes [67]. In the present study, such a consequence is possibly attributed to the enrichment of organic compounds due to the kelp seedling production, which can, in turn, shape microbial assemblages, thus enhancing their taxon-to-taxon interactions to adapt their lifestyles [21]. Similar cases have also been reported, revealing that bacterioplankton enhances their interactions in response to mariculture processes or nutrient enrichment [68,69].

5. Conclusions

Planktonic microbial communities change over time within tanks during kelp seedling production, which is firstly demonstrated by richness positively correlated with the increased supplement of light illumination, NO3–N, and PO43−–P. Significant dissimilarity-time relationship and temporal separation for planktonic communities also proved such alterations. The α-Proteobacteria, Bacteroidetes, γ-Proteobacteria, and their prevalent genera dominated the planktonic microbial community, with light, DO, pH, and NO3−N significantly correlated with the temporal separation. Compared with the prevalent profile, a different profile of keystone taxa was determined. Intensified species-to-species interactions, particularly at the core of the co-occurrence network, rather than on the periphery, were determined to adapt to seedling production. This study provides insights into the dynamics, environmental correlations, and co-occurrence pattern of planktonic microbial community during the kelp seedling production. Additional biological replicates (e.g., an increased number of hatcheries and sampling time points) are required in future studies to characterize microbial densities, assemblages, and interactions, notably for disease events. It is also noted that particle-associated (PA) and free-living (FL) bacteria are both significant fractions in the microbial ecology of aquatic ecosystems, which may differ in taxonomic compositions, correlations with environments, and assembly processes even in oligotrophic environments. This also suggests their differential responses to macroalgal cultivation, and an in-depth analysis is required to determine the interactions between the cultured kelp and PA and FL bacteria in our future studies.

Supplementary Materials

The following supporting information can be downloaded at https://0-www-mdpi-com.brum.beds.ac.uk/article/10.3390/jmse10060726/s1, Figure S1: Dynamics of water variables across sampling time points. Data are shown as mean ± standard deviation (n = 5); Table S1: Culturing conditions of kelp seedlings in standard methods; Table S2: Spearman’s rank correlations between alpha diversity indices and environmental variables. Bold values indicate significant correlations (p < 0.05); Table S3: Group pair difference determined using PERMANOVA based on Bray–Curtis distance; Table S4: Topological parameters of the co-occurrence network of seedling culturing tanks; Table S5: Distributions of microbial taxa within the network based on descending order of betweenness centrality scores. Bold ASVs were perceived as keystone taxa in the present study; Table S6: Distributions of major microbial taxa within the prevalent network modules.

Author Contributions

Conceptualization, Z.M., T.L., Y.Y. and S.W.; methodology, S.W. and Y.Y.; investigation, S.W., Y.Y., H.Q. and J.L.; resources, Z.M. and T.L.; data curation, Y.Y. and J.L.; writing—original draft preparation, S.W., Y.Y., H.Q. and J.L.; writing—review and editing, Z.M. and T.L.; visualization, S.W., Y.Y. and H.Q.; project administration, J.L., Z.M. and T.L.; funding acquisition, Z.M. and S.W. All authors have read and agreed to the published version of the manuscript.

Funding

This research was funded by Agriculture Research System (CARS-50), Shandong Provincial Natural Science Foundation, China (ZR2019BD060), and the Fundamental Research Funds for the Central Universities (202064006).

Institutional Review Board Statement

Not applicable.

Informed Consent Statement

Not applicable.

Data Availability Statement

All raw sequence data have been submitted to GenBank SRA under BioProject PRJNA667823.

Conflicts of Interest

The authors declare no conflict of interest.

References

  1. Tseng, C.K. Algal biotechnology industries and research activities in China. J. Appl. Phycol. 2001, 13, 375–380. [Google Scholar] [CrossRef]
  2. Bocanegra, A.; Bastida, S.; Benedí, J.; Ródenas, S.; Sánchez-Muniz, F.J. Characteristics and nutritional and cardiovascular-health properties of seaweeds. J. Med. Food 2009, 12, 236–258. [Google Scholar] [CrossRef] [PubMed]
  3. Kim, E.; Kim, D.; Kim, Y.; Hwang, H.; Nam, T.; Kong, I. An improved method of protein isolation and proteome analysis with Saccharina japonica (Laminariales) incubated under different pH conditions. J. Appl. Phycol. 2011, 23, 123–130. [Google Scholar] [CrossRef]
  4. Zhang, J.; Fang, J.; Wang, W.; Du, M.; Gao, Y.; Zhang, M. Growth and loss of mariculture kelp Saccharina japonica in Sungo Bay, China. J. Appl. Phycol. 2012, 24, 1209–1216. [Google Scholar] [CrossRef]
  5. Ye, N.; Zhang, X.; Miao, M.; Fan, X.; Zheng, Y.; Xu, D.; Wang, J.; Zhou, L.; Wang, D.; Gao, Y.; et al. Saccharina genomes provide novel insight into kelp biology. Nat. Commun. 2015, 6, 6986. [Google Scholar] [CrossRef] [PubMed] [Green Version]
  6. Yabu, H. Alternation of chromosomes in the life history of Laminaria japonica Aresch. Bull. Fac. Fish. Hokkaido Univ. 1973, 23, 171–176. [Google Scholar]
  7. Wang, G.; Lu, B.; Shuai, L.; Li, D.; Zhang, R. Microbial diseases of nursery and field-cultivated Saccharina japonica (Phaeophyta) in China. Algol. Stud. 2014, 145, 39–51. [Google Scholar] [CrossRef]
  8. Peng, Y.; Li, W. A bacterial pathogen infecting gametophytes of Saccharina japonica (Laminariales, Phaeophyceae). Chin. J. Oceanol. Limn. 2013, 31, 366–373. [Google Scholar] [CrossRef]
  9. Gai, C.; Xu, L.; Diao, J.; Yang, X.; Liu, W.; Ye, H. Establishment and utilization of quick retrieval table of kelp common disease. Chin. Fish. Qual. Stand. 2017, 7, 51–57. [Google Scholar]
  10. Li, J.; Pang, S.; Shan, T.; Su, L. Changes of microbial community structures associated with seedlings of Saccharina japonica at early stage of outbreak of green rotten disease. J. Appl. Phycol. 2020, 62, 191. [Google Scholar] [CrossRef]
  11. Zhang, R.; Chang, L.; Xiao, L.; Zhang, X.; Han, Q.; Li, N.; Egan, S.; Wang, G. Diversity of the epiphytic bacterial communities associated with commercially cultivated healthy and diseased Saccharina japonica during the harvest season. J. Appl. Phycol. 2020, 32, 2071–2080. [Google Scholar] [CrossRef]
  12. Han, Q.; Zhang, X.; Chang, L.; Xiao, L.; Ahmad, R.; Saha, M.; Wu, H.; Wang, G. Dynamic shift of the epibacterial communities on commercially cultivated Saccharina japonica from mature sporophytes to sporelings and juvenile sporophytes. J. Appl. Phycol. 2021, 33, 1171–1179. [Google Scholar] [CrossRef]
  13. Burke, C.; Thomas, T.; Lewis, M.; Steinberg, P.; Kjelleberg, S. Composition, uniqueness and variability of the epiphytic bacterial community of the green alga Ulva australis. ISME J. 2011, 5, 590–600. [Google Scholar] [CrossRef] [Green Version]
  14. Lachnit, T.; Meske, D.; Wahl, M.; Harder, T.; Schmitz, R. Epibacterial community patterns on marine macroalgae are host-specific but temporally variable. Environ. Microbiol. 2011, 13, 655–665. [Google Scholar] [CrossRef] [PubMed]
  15. Goecke, F.; Labes, A.; Wiese, J.; Imhoff, J.F. Chemical interactions between marine macroalgae and bacteria. Mar. Ecol. Prog. Ser. 2010, 409, 267–299. [Google Scholar] [CrossRef]
  16. Egan, S.; Harder, T.; Burke, C.; Steinberg, P.; Kjelleberg, S.; Thomas, T. The seaweed holobiont: Understanding seaweed-bacteria interactions. FEMS Microbiol. Rev. 2013, 37, 462–476. [Google Scholar] [CrossRef] [PubMed] [Green Version]
  17. Singh, R.P.; Reddy, C.R.K. Seaweed-microbial interactions: Key functions of seaweed-associated bacteria. FEMS Microbiol. Ecol. 2014, 88, 213–230. [Google Scholar] [CrossRef]
  18. Mesquita, M.M.F.; Crapez, M.A.C.; Teixeira, V.L.; Cavalcanti, D.N. Potential interactions bacteria-brown algae. J. Appl. Phycol. 2019, 31, 867–883. [Google Scholar] [CrossRef]
  19. Egan, S.; Fernandes, N.D.; Kumar, V.; Gardiner, M.; Thomas, T. Bacterial pathogens, virulence mechanism and host defence in marine macroalgae. Environ. Microbiol. 2014, 16, 925–938. [Google Scholar] [CrossRef] [Green Version]
  20. Egan, S.; Gardiner, M. Microbial dysbiosis: Rethinking disease in marine ecosystems. Front. Microbiol. 2016, 7, 991. [Google Scholar] [CrossRef]
  21. Clasen, J.L.; Shurin, J.B. Kelp forest size alters microbial community structure and function on Vancouver Island, Canada. Ecology 2015, 96, 862–872. [Google Scholar] [CrossRef] [PubMed] [Green Version]
  22. Xie, X.; He, Z.; Hu, X.; Yin, H.; Liu, X.; Yang, Y. Large-scale seaweed cultivation diverges water and sediment microbial communities in the coast of Nan’ao Island, South China Sea. Sci. Total Environ. 2017, 598, 97–108. [Google Scholar] [CrossRef] [PubMed]
  23. Dahms, H.U.; Dobretsov, S. Antifouling compounds from marine macroalgae. Mar. Drugs 2017, 15, 265. [Google Scholar] [CrossRef]
  24. Steinberg, P.D.; Rice, S.A.; Campbell, A.H.; Mcdougald, D.; Harder, T. Interfaces between bacterial and eukaryotic “neuroecology”. Integr. Comp. Biol. 2011, 51, 794–806. [Google Scholar] [CrossRef] [PubMed] [Green Version]
  25. Chen, M.Y.; Parfrey, L.W. Incubation with macroalgae induces large shifts in water column microbiota, but minor changes to the epibiota of co-occurring macroalgae. Mol. Ecol. 2018, 27, 1966–1979. [Google Scholar] [CrossRef] [PubMed]
  26. Wang, W.; Wu, L.; Xu, K.; Xu, Y.; Ji, D.; Chen, C.; Xie, C. The cultivation of Pyropia haitanensis has important impacts on the seawater microbial community. J. Appl. Phycol. 2020, 461, 37. [Google Scholar] [CrossRef] [Green Version]
  27. Guan, X.; Zhou, W.; Hu, C.; Zhu, M.; Ding, Y.; Gai, S.; Zheng, X.; Zhu, J.; Lu, Q. Bacterial community temporal dynamics and disease-related variations in the seawater of Pyropia (laver) seedling pools. J. Appl. Phycol. 2018, 30, 1217–1224. [Google Scholar] [CrossRef]
  28. Yan, Y.; Yang, H.; Tang, L.; Li, J.; Mao, Y.; Mo, Z. Compositional shifts of bacterial communities associated with Pyropia yezoensis and surrounding seawater co-occurring with red rot disease. Front. Microbiol. 2019, 10, 1666. [Google Scholar] [CrossRef] [Green Version]
  29. Fuhrman, J.A.; Steele, J.A. Community structure of marine bacterioplankton: Patterns, networks, and relationships to function. Aquat. Microb. Ecol. 2008, 53, 69–81. [Google Scholar] [CrossRef] [Green Version]
  30. Berry, D.; Widder, S. Deciphering microbial interactions and detecting keystone species with co-occurrence networks. Front. Microbiol. 2014, 5, 219. [Google Scholar] [CrossRef] [Green Version]
  31. Banerjee, S.; Schlaeppi, K.; van der Heijden, M.G.A. Keystone taxa as drivers of microbiome structure and functioning. Nat. Rev. Microbiol. 2018, 16, 567–576. [Google Scholar] [CrossRef] [PubMed]
  32. Jiao, S.; Xu, Y.; Zhang, J.; Hao, X.; Lu, Y. Core microbiota in agricultural soils and their potential associations with nutrient cycling. mSystems 2019, 4, e00313-18. [Google Scholar] [CrossRef] [PubMed] [Green Version]
  33. Martín González, A.M.; Dalsgaard, B.; Olesen, J.M. Centrality measures and the importance of generalist species in pollination networks. Ecol. Complex. 2010, 7, 36–43. [Google Scholar] [CrossRef]
  34. Eaton, A.D.; Clesceri, L.S.; Rice, E.W.; Greenberg, A.F. Standard Methods for the Examination of Water and Wastewater; American Water Works Association: Washington, DC, USA, 2005. [Google Scholar]
  35. Walters, W.; Hyde, E.R.; Berg-Lyons, D.; Ackermann, G.; Humphrey, G.; Parada, A.; Gilbert, J.A.; Jansson, J.K.; Caporaso, J.G.; Fuhrman, J.A.; et al. Improved bacterial 16S rRNA gene (V4 and V4-5) and fungal internal transcribed spacer marker gene primers for microbial community surveys. mSystems 2016, 1, e00009-15. [Google Scholar] [CrossRef] [PubMed] [Green Version]
  36. Bolyen, E.; Rideout, J.R.; Dillon, M.R.; Bokulich, N.A.; Abnet, C.C.; Al-Ghalith, G.A.; Alexander, H.; Alm, E.J.; Arumugam, M.; Asnicar, F.; et al. Reproducible, interactive, scalable and extensible microbiome data science using QIIME 2. Nat. Biotechnol. 2019, 37, 852–857. [Google Scholar] [CrossRef]
  37. Callahan, B.J.; Mcmurdie, P.J.; Rosen, M.J.; Han, A.W.; Johnson, A.J.A.; Holmes, S.P. DADA2: High-resolution sample inference from Illumina amplicon data. Nat. Methods 2016, 13, 581–583. [Google Scholar] [CrossRef] [Green Version]
  38. Pedregosa, F.; Varoquaux, G.E.L.; Gramfort, A.; Michel, V.; Thirion, B.; Grisel, O.; Blondel, M.; Prettenhofer, P.; Weiss, R.; Dubourg, V.; et al. Scikit-learn: Machine learning in python. J. Mach. Learn. Res. 2011, 12, 2825–2830. [Google Scholar]
  39. R Core Team. R: A language and environment for statistical computing. R Foundation for Statistical Computing, Vienna, Austria. Computing 2010, 14, 12–21. [Google Scholar]
  40. Faith, D.P.; Minchin, P.R.; Belbin, L. Compositional dissimilarity as a robust measure of ecological distance. Vegetatio 1987, 69, 57–68. [Google Scholar] [CrossRef]
  41. Oksanen, J.; Blanchet, F.G.; Friendly, M.; Kindt, R.; Legendre, P.; Mcglinn, D.; Minchin, P.R.; O’Hara, R.B.; Simpson, G.L.; Solymos, P.; et al. Ordination Methods, Diversity Analysis and Other Functions for Community and Vegetation Ecologists. 2019. Available online: https://CRAN.R-project.org/package=vegan (accessed on 1 January 2012).
  42. Chambers, J.M.; Freeny, A.; Heiberger, R.M. Analysis of variance: Designed experiments. In Statistical Models; Chambers, J.M., Hastie, T.J., Eds.; Wadsworth & Brooks/Cole: Pacific Grove, CA, USA, 1992; Chapter 5. [Google Scholar]
  43. Legendre, P.; Legendre, L. Numerical Ecology, 3rd ed.; Elsevier Science BV: Amsterdam, The Netherlands, 2012; pp. 174–175. [Google Scholar]
  44. Bastian, M.; Heymann, S.; Jacomy, M. Gephi: An open source software for exploring and manipulating networks. In Proceedings of the 3rd International Conference on Weblogs and Social Media, San Jose, CA, USA, 17–20 May 2009. [Google Scholar] [CrossRef]
  45. Erdős, P.; Rényi, A. On the evolution of random graphs. Magyar Tud. Akad. Mat. Kutató Int. Közl. 1960, 5, 17–60. [Google Scholar]
  46. Vick-Majors, T.J.; Priscu, J.C.; Amaral-Zettler, L.A. Modular community structure suggests metabolic plasticity during the transition to polar night in ice-covered Antarctic lakes. ISME J. 2014, 8, 778–789. [Google Scholar] [CrossRef] [PubMed] [Green Version]
  47. Banerjee, S.; Baah-Acheamfour, M.; Carlyle, C.N.; Bissett, A.; Richardson, A.E.; Siddique, T.; Bork, E.W.; Chang, S.X. Determinants of bacterial communities in Canadian agroforestry systems. Environ. Microbiol. 2016, 18, 1805–1816. [Google Scholar] [CrossRef] [PubMed]
  48. Qin, W.; Heal, K.R.; Ramdasi, R.; Kobelt, J.N.; Martens-Habbena, W.; Bertagnolli, A.D.; Amin, S.A.; Walker, C.B.; Urakawa, H.; Könneke, M.; et al. Nitrosopumilus maritimus gen. nov., sp. nov., Nitrosopumilus cobalaminigenes sp. nov., Nitrosopumilus oxyclinae sp. nov., and Nitrosopumilus ureiphilus sp. nov., four marine ammonia-oxidizing archaea of the phylum Thaumarchaeota. Int. J. Syst. Evol. Microbiol. 2017, 67, 5067–5079. [Google Scholar] [CrossRef] [PubMed]
  49. Sharp, C.E.; Brady, A.L.; Sharp, G.H.; Grasby, S.E.; Stott, M.B.; Dunfield, P.F. Humboldt’s spa: Microbial diversity is controlled by temperature in geothermal environments. ISME J. 2014, 8, 1166–1174. [Google Scholar] [CrossRef] [Green Version]
  50. Milici, M.; Tomasch, J.; Wos-Oxley, M.L.; Wang, H.; Jáuregui, R.; Camarinha-Silva, A.; Deng, Z.; Plumeier, I.; Giebel, H.; Wurst, M.; et al. Low diversity of planktonic bacteria in the tropical ocean. Sci. Rep. 2016, 6, 19054. [Google Scholar] [CrossRef]
  51. Yan, Q.; Stegen, J.C.; Yu, Y.; Deng, Y.; Li, X.; Wu, S.; Dai, L.; Zhang, X.; Li, J.; Wang, C.; et al. Nearly a decade-long repeatable seasonal diversity patterns of bacterioplankton communities in the eutrophic Lake Donghu (Wuhan, China). Mol. Ecol. 2017, 26, 3839–3850. [Google Scholar] [CrossRef]
  52. Mou, X.; Hodson, R.E.; Moran, M.A. Bacterioplankton assemblages transforming dissolved organic compounds in coastal seawater. Environ. Microbiol. 2007, 9, 2025–2037. [Google Scholar] [CrossRef]
  53. Mo, Y.; Zhang, W.; Yang, J.; Lin, Y.; Yu, Z.; Lin, S. Biogeographic patterns of abundant and rare bacterioplankton in three subtropical bays resulting from selective and neutral processes. ISME J. 2018, 12, 2198–2210. [Google Scholar] [CrossRef] [Green Version]
  54. Rud, I.; Kolarevic, J.; Holan, A.B.; Berget, I.; Calabrese, S.; Terjesen, B.F. Deep-sequencing of the bacterial microbiota in commercial-scale recirculating and semi-closed aquaculture systems for Atlantic salmon post-smolt production. Aquacult. Eng. 2017, 78, 50–62. [Google Scholar] [CrossRef]
  55. Huang, X.; Du, S.; Zhang, H.; Chen, C.; Xiao, G.; Huang, L.; Zhang, D. Temporal patterns of bacterial communities in shrimp (Litopenaeus vannamei) culture systems loaded with oyster shells. Aquaculture 2020, 526, 735424. [Google Scholar] [CrossRef]
  56. Fernández-Gómez, B.; Richter, M.; Schüler, M.; Pinhassi, J.; Acinas, S.G.; González, J.M.; Pedrós-Alió, C. Ecology of marine Bacteroidetes: A comparative genomics approach. ISME J. 2013, 7, 1026–1037. [Google Scholar] [CrossRef] [PubMed] [Green Version]
  57. Sowell, S.M.; Abraham, P.E.; Shah, M.; Verberkmoes, N.C.; Smith, D.P.; Barofsky, D.F.; Giovannoni, S.J. Environmental proteomics of microbial plankton in a highly productive coastal upwelling system. ISME J. 2011, 5, 856–865. [Google Scholar] [CrossRef] [PubMed]
  58. Voget, S.; Wemheuer, B.; Brinkhoff, T.; Vollmers, J.; Dietrich, S.; Giebel, H.; Beardsley, C.; Sardemann, C.; Bakenhus, I.; Billerbeck, S.; et al. Adaptation of an abundant Roseobacter RCA organism to pelagic systems revealed by genomic and transcriptomic analyses. ISME J. 2015, 9, 371–384. [Google Scholar] [CrossRef] [PubMed] [Green Version]
  59. Xu, L.; Zhou, P.; Wu, Y.; Xu, J.; Wu, Y.; Xu, X. Insight into adaptation mechanisms of marine bacterioplankton from comparative genomic analysis of the genus Pseudohongiella. Deep Sea Res. Part II 2019, 167, 62–69. [Google Scholar] [CrossRef]
  60. Ghai, R.; Mizuno, C.M.; Picazo, A.; Camacho, A.; Rodriguez-Valera, F. Metagenomics uncovers a new group of low GC and ultra-small marine Actinobacteria. Sci. Rep. 2013, 3, 2471. [Google Scholar] [CrossRef] [Green Version]
  61. Signori, C.N.; Pellizari, V.H.; Enrich-Prast, A.; Sievert, S.M. Spatiotemporal dynamics of marine bacterial and archaeal communities in surface waters off the northern Antarctic Peninsula. Deep Sea Res. Part II 2018, 149, 150–160. [Google Scholar] [CrossRef]
  62. Halsey, K.H.; Carter, A.E.; Giovannoni, S.J. Synergistic metabolism of a broad range of C1 compounds in the marine methylotrophic bacterium HTCC2181. Environ. Microbiol. 2012, 14, 630–640. [Google Scholar] [CrossRef]
  63. Wong, S.; Yoshizawa, S.; Nakajima, Y.; Cuadra, M.J.; Nogi, Y.; Nakamura, K.; Takami, H.; Ogura, Y.; Hayashi, T.; Chiura, H.X.; et al. Amylibacter kogurei sp. nov., a novel marine alphaproteobacterium isolated from the coastal sea surface microlayer of a marine inlet. Int. J. Syst. Evol. Micr. 2018, 68, 2872–2877. [Google Scholar] [CrossRef]
  64. Choi, A.; Lee, K.; Oh, H.; Feng, J.; Cho, J. Litoricola marina sp. nov. Int. J. Syst. Evol. Micr. 2010, 60, 1303–1306. [Google Scholar] [CrossRef]
  65. Coyte, K.Z.; Schluter, J.; Foster, K.R. The ecology of the microbiome: Networks, competition, and stability. Science 2015, 350, 663–666. [Google Scholar] [CrossRef]
  66. Newman, M.E.J. Modularity and community structure in networks. Proc. Natl. Acad. Sci. USA 2006, 103, 8577. [Google Scholar] [CrossRef] [PubMed] [Green Version]
  67. Delgado-Baquerizo, M.; Oliverio, A.M.; Brewer, T.E.; Benavent-González, A.; Eldridge, D.J.; Bardgett, R.D.; Maestre, F.T.; Singh, B.K.; Fierer, N. A global atlas of the dominant bacteria found in soil. Science 2018, 359, 320–325. [Google Scholar] [CrossRef] [PubMed] [Green Version]
  68. Xiong, J.; Chen, H.; Hu, C.; Ye, X.; Kong, D.; Zhang, D. Evidence of bacterioplankton community adaptation in response to long-term mariculture disturbance. Sci. Rep. 2015, 5, 15274. [Google Scholar] [CrossRef] [PubMed] [Green Version]
  69. Yang, W.; Zheng, C.; Zheng, Z.; Wei, Y.; Lu, K.; Zhu, J. Nutrient enrichment during shrimp cultivation alters bacterioplankton assemblies and destroys community stability. Ecotox. Environ. Safe. 2018, 156, 366–374. [Google Scholar] [CrossRef]
Figure 1. Dynamics of alpha diversity indices during seedling production. (a) Observed bacterial/archaeal species. (b) Pielou’s evenness.
Jmse 10 00726 g001
Figure 2. Non-metric multidimensional scaling (NMDS) plot (a) and the relationship between dissimilarity and time point intervals (b) based on Bray–Curtis distance. The regression slope indicates the turnover rate. The rho indicates Spearman’s rank correlation.
Jmse 10 00726 g002
Figure 3. Temporal changes in the relative abundance of the prevalent microbial taxa. (a) Microbial compositions displayed at the phylum or Proteobacterial class level. (b) The most abundant taxa at the genus level.
Jmse 10 00726 g003
Figure 4. Influences of environmental factors on microbial community variations. (a) Biplots of redundancy analysis for microbial communities and environmental parameters. (b) Pearson correlation between the most abundant genera and water variables. ** p < 0.01; * p < 0.05.
Jmse 10 00726 g004
Figure 5. Co-occurrence network with ASVs colored by taxonomy (a) and modularity (b), respectively. The size of each node is proportional to the number of connections. Each connection has a Spearman’s correlation coefficient > |0.8| and a p-value < 0.01. A grey edge in (a) indicates positive interaction, while a red edge indicates negative interaction.
Jmse 10 00726 g005
Figure 6. Comparisons of topological parameters among the prevalent modules within the network. (a) Degrees; (b) Betweenness centrality; (c) Closeness centrality; (d) Eigenvector centrality. The letters above the boxes represent significant differences among modules determined by ANOVA with a Tukey’s HSD test.
Jmse 10 00726 g006
Table 1. Seawater sampling and associating information.
SampleCollecting DateSeedling Production Stage
T013 AugustHours after zoospore inoculated on collectors and transferal to culturing tanks; nutrients supplied 2 days after T0
T14 SeptemberZygote formation
T210 September4–8 rows of cells
T320 September16–32 rows of cells
T45 October3–5 mm seedlings
T515 October1–2 cm seedlings
Publisher’s Note: MDPI stays neutral with regard to jurisdictional claims in published maps and institutional affiliations.

