Article

Comparison of the Economic Performances of Three Sulphur Oxides Emissions Abatement Solutions for a Very Large Crude Carrier (VLCC)

1
Australian Maritime College (AMC), University of Tasmania, Launceston, TAS 7248, Australia
2
Wuhan Rules and Research Institute, China Classification Society, Wuhan 430022, China
3
C-LNG Solutions Pte. Ltd., Singapore 608526, Singapore
*
Author to whom correspondence should be addressed.
J. Mar. Sci. Eng. 2021, 9(2), 221; https://0-doi-org.brum.beds.ac.uk/10.3390/jmse9020221
Submission received: 25 January 2021 / Revised: 13 February 2021 / Accepted: 14 February 2021 / Published: 19 February 2021
(This article belongs to the Special Issue Marine Alternative Fuels and Environmental Protection)

Abstract

:
Ship-source air pollutants, especially sulphur oxides (SOx), have a major impact on human health, the marine environment and the natural resources. Therefore, control of SOx emissions has become a main concern in the maritime industry. The International Maritime Organization (IMO) has set a global limit on sulphur content of 0.50% m/m (mass by mass) in marine fuels which has entered into effect on 1 January 2020.To comply with the sulphur limits, ship owners are facing the need to select suitable abatement solutions. The choice of a suitable solution is a compromise among many issues, but the economic performance offers the basis for which ones are attractive to ship owners. Currently, there are three technologically feasible SOx abatement solutions that could be used by ships, namely, liquified natural gas (LNG) as a fuel (Solution A), scrubbers (Solution B) and low-sulphur fuel oil (LSFO) (Solution C). To compare the economic performances of the mentioned three solutions for a newbuilding very large crude carrier (VLCC), this paper proposes a voyage expenses-based method (VEM). It was found that, within the initial target payback period of 6 years, Solution A and C are more expensive than Solution B, while Solution C is more competitive than Solution A. Five scenarios of target payback years were assumed to compare the trends of the three proposed solutions. The results show that Solution B maintains its comparative advantage. As the assumed target payback years becomes longer, the economy of Solution A gradually improves and the economics of Solution B and C gradually decline. A comparison between Solution A and C shows 6.5 years is a turning point. The advantage of Solution A is prominent after this payback period. In addition, the performance of a certain solution in terms of adaptability to the IMO greenhouse gas (GHG) emissions regulations is also a factor that ship owner need to consider when making decisions. In conclusion, when the IMO air pollutant regulations and GHG regulations are considered simultaneously, the advantages of using LNG are obvious.

1. Introduction

Air pollution caused by the exhaust emissions of ships, such as sulphur oxides (SOx), nitrogen oxides (NOx) and particulate matters (PM), has a detrimental effect upon the human health, the marine environment and the natural resources [1,2,3,4]. Since maritime industry has been moving towards a sustainable future, air pollutants control has become a main concern [5]. The International Maritime Organization (IMO) estimated the total average annual SOx emissions for the period of 2007–2012 to be 11.3 million tons from shipping, representing about 13% of global SOx emissions [6]. In port cities, ship’s SOx emissions are often a dominant source of urban pollution [7,8,9,10,11,12,13]. Furthermore, SOx emissions from ships are spread in atmosphere over several hundreds of kilometers and thus contribute to air quality degradation on land even if emitted at sea [14]. In order to deal with SOx emissions from ships, the IMO sets regulations and introduced the so-called Emission Control Areas (ECAs) [15,16].
Among various ship types, bulk carriers, container ships, cruises and oil tankers are greater contributors to the SOx emissions [9,11]. Therefore, to be in compliance, it is imperative for ship owners to choose among a technologically feasible and cost-effective SOx abatement solutions. This paper focuses on the economic performance of three SOx emissions abatement solutions for a newbuilding very large crude carrier (VLCC) (the very large crude carrier (VLCC) is an oil tanker with a size ranging between 180,000 to 320,000 deadweight tonnage (DWT); as of December 2020, there has been a total of 810 VLCCs in the market and 58 ships are on order).
The following subsections introduce the international regulatory framework and technologically feasible solutions, review the literature and propose the research questions (RQs).

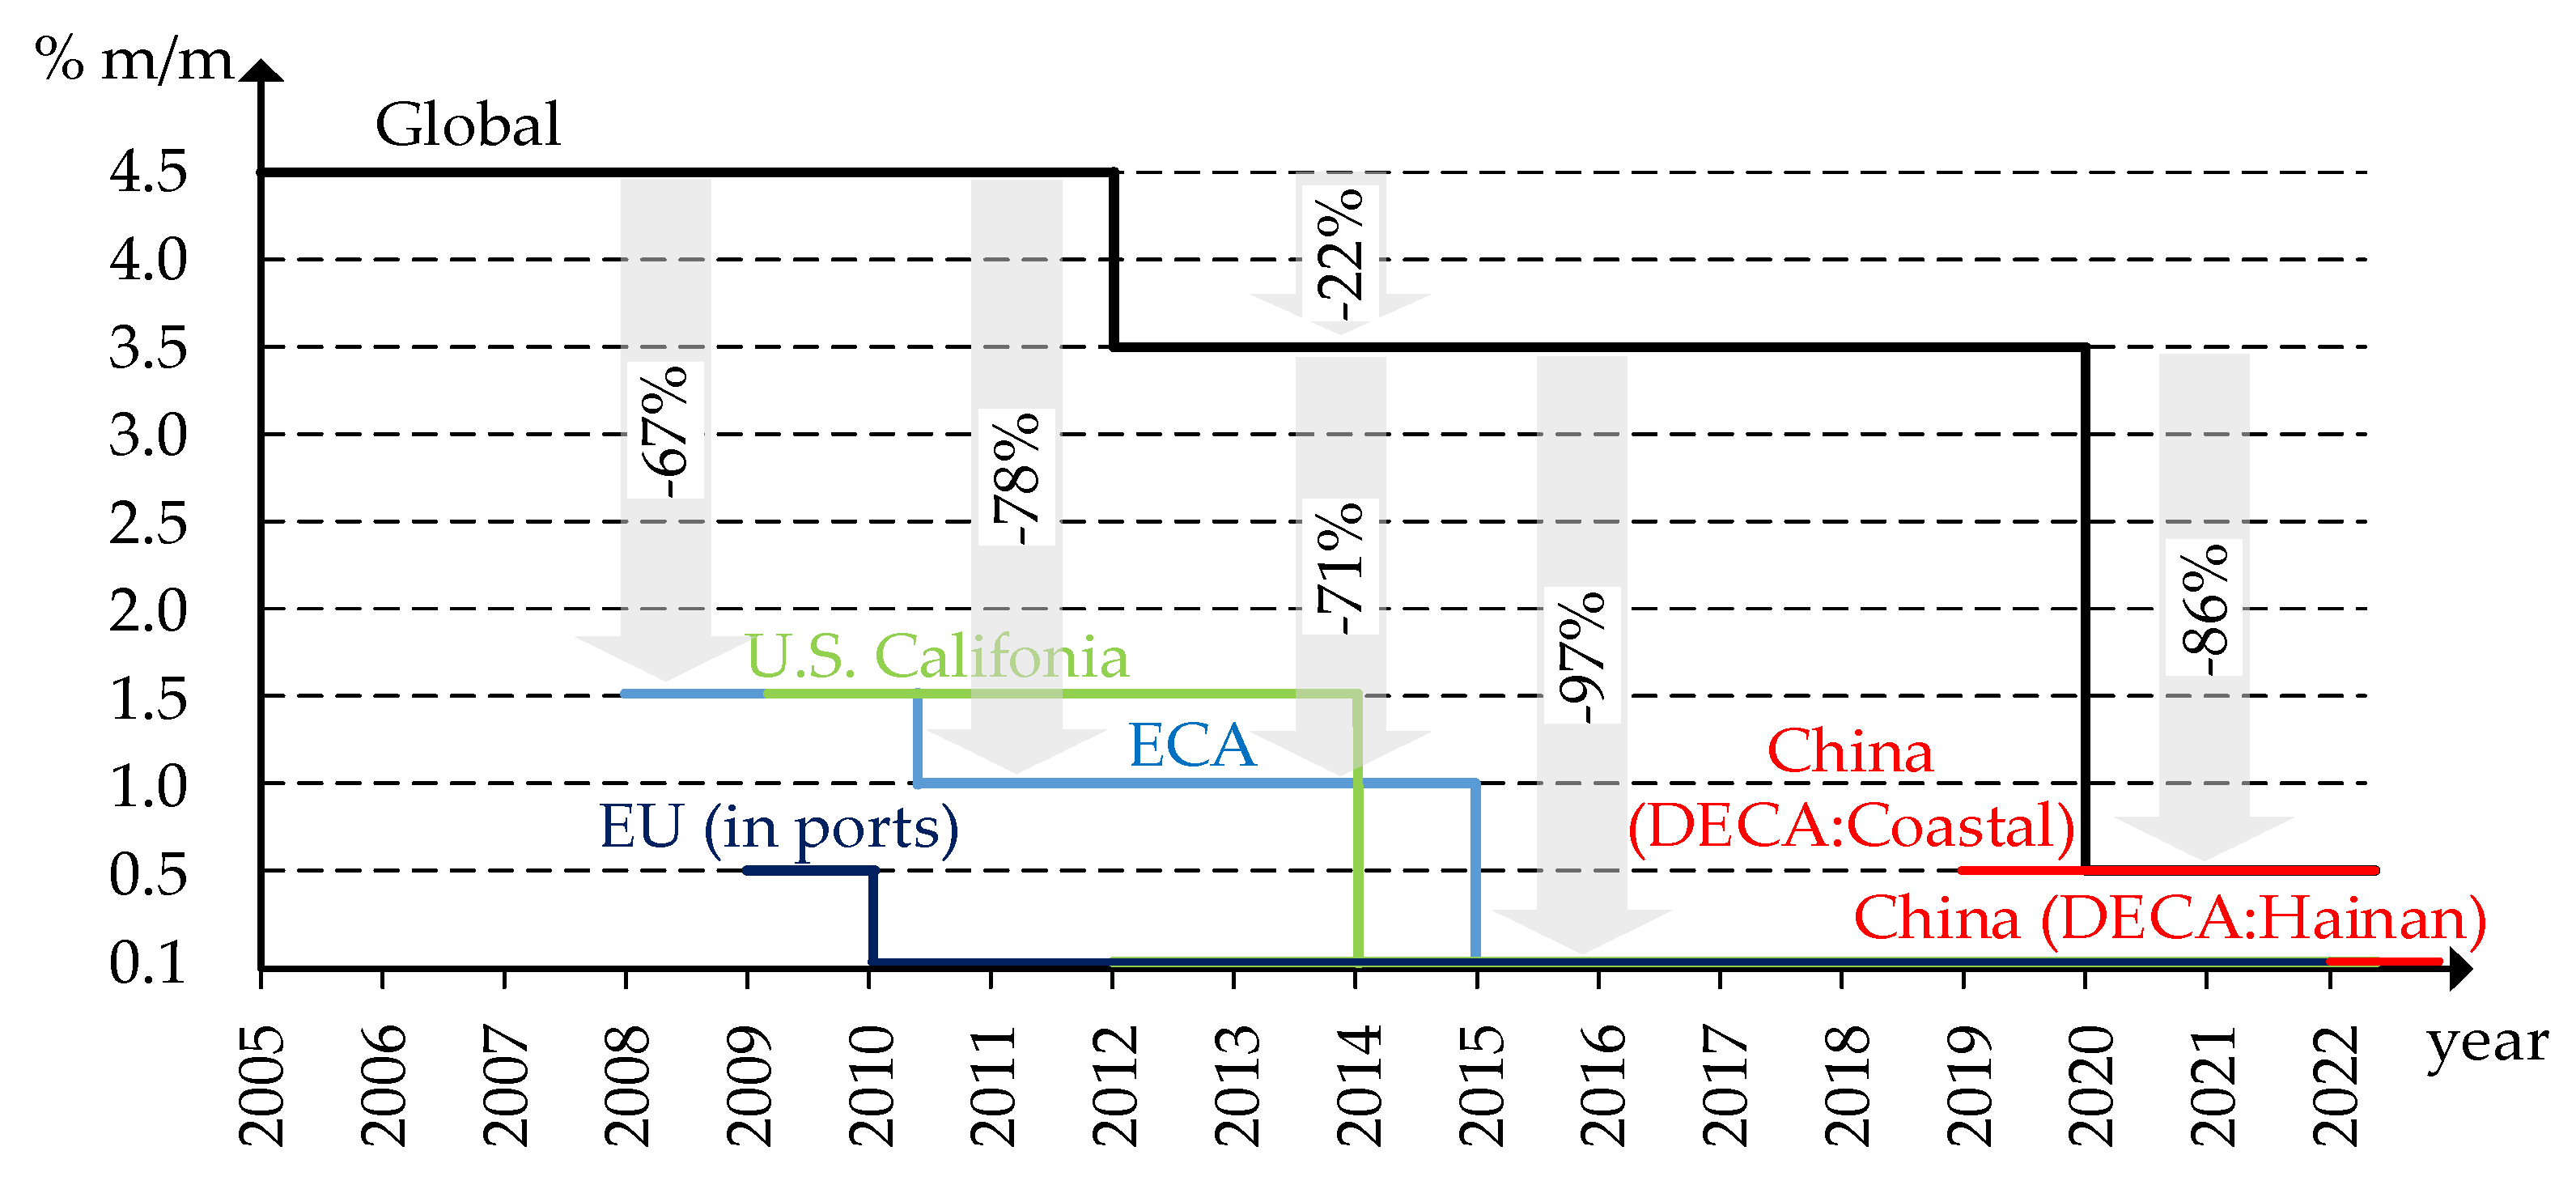
1.1. International Regulatory Framework and Technologically Feasible Solutions

SOx emissions are a function of the sulphur content of fuel [17]. Accordingly, reduction of the sulphur content of marine fuels could be an effective way to control the SOx emissions.
The IMO regulations on the sulphur content of marine fuels first came into force in 2005, under the Annex VI of the International Convention for the Prevention of Pollution from Ships (the MARPOL Convention) [15]. Since then, the limits on sulphur content in fuels have been progressively tightened. From 1 January 2020, the sulphur content limit in fuels used on board ships operating outside designated sulphur emission control areas (SECAs) is reduced to 0.50% m/m (mass by mass) from the formerly permissible 3.5% m/m. This requirement is in addition to the 0.1% m/m sulphur limit in SECAs including the North American, US Caribbean, North Sea and Baltic seas. Figure 1 shows the sulphur content limits and implementation dates worldwide.
In addition to the IMO’s regulations, some regional regulations were initiated to be implemented. The European Union Sulphur Directive (Directive 2005/33/EC) stipulates a maximum of 0.10% m/m sulphur content of any fuel for ships in EU ports since 1 January 2010 [18]. California’s Air Resources Board (CARB) has enforced a 0.10% m/m sulphur limit within 24 nautical miles of the California coast since 1 January 2014 [19]. Some of these implementations have been developed over many years by adding and modifying the regional requirements. For example, in 2016, China started imposing domestic emission control areas (DECAs) in the Pearl and Yangtze deltas and the Bohai Sea rim, with a staged reduction of sulphur content to 0.5% m/m. In 2018, China announced an upgraded DECA consists of coastal control areas covering 12 nautical miles outside its territorial baseline along the entire coast and Hainan island, and inland river control areas including the shipping routes on the Yangtze and Xi rivers. From 1 January 2019, it stipulates that the maximum sulphur content of any fuel for sea-going ships in the DECA should not exceed 0.5% m/m; from 1 January 2022, the sulphur content of any fuel used on board sea-going ships should not exceed 0.1% m/m when operating in the coastal emission control area in Hainan waters [20].
To comply with the sulphur limit, ship owners need to select suitable abatement methods. Currently, there are three technologically and economically viable solutions to reduce SOx emission suitable for ships, i.e., (1) compliant marine fuel oil with a maximum sulphur content of 0.50% or 0.10% m/m; (2) alternative fuels such as liquefied natural gas (LNG); (3) an alternative equivalent measure to reduce SOx emissions approved by the ship’s flag state administration in accordance with the IMO requirements [21]. An exhaust gas cleaning system (EGCS) or so-called “scrubber” is the only alternative measure currently approved for ships [22]. With EGCS ships continue to use and carry heavy fuel oil (HFO) with a sulphur content of up to 3.50% m/m.
Regardless of these solutions being selected, each requires additional costs consist of capital expenditures (CAPEX) and operating expense (OPEX). Therefore, it is particularly important for ship operators to conduct cost-effective analysis for choosing emission abatement solutions for their ships. Figure 2 presents the records of SOx abatement solutions application on contracted numbers of newbuilding ships (see Table 1) worldwide in recent three years (2018–2020) [23]. It shows that the number of ships using low-sulphur fuel oil (LSFO) accounts for the majority, the number of ships with “scrubber” has been gradually decreasing and the number of ships using LNG as a fuel tends to increase. The main reasons for the changes in detected trend deserve further studies. In general, it is financially sensible for ship owners to use scrubbers in the first few years starting 2020. Although there is still high uncertainty regarding the premium of compliant fuels over HFO, the expected tight supply of the compliant fuels suggests that the premium will be strong enough to lead ship owners in using scrubbers. However, as the price margin narrows down significantly upon sufficient supply of compliant fuels, the business for retrofitting scrubbers will eventually disappear.
The choice of technologies to be used is a compromise among many other issues but it appears that the CAPEX and OPEX analysis provides a basis for attractiveness to ship owners. In this paper, a comparison of the economic performances of the following three SOx emissions abatement solutions for a newbuilding VLCC that operates outside ECAs is carried out:
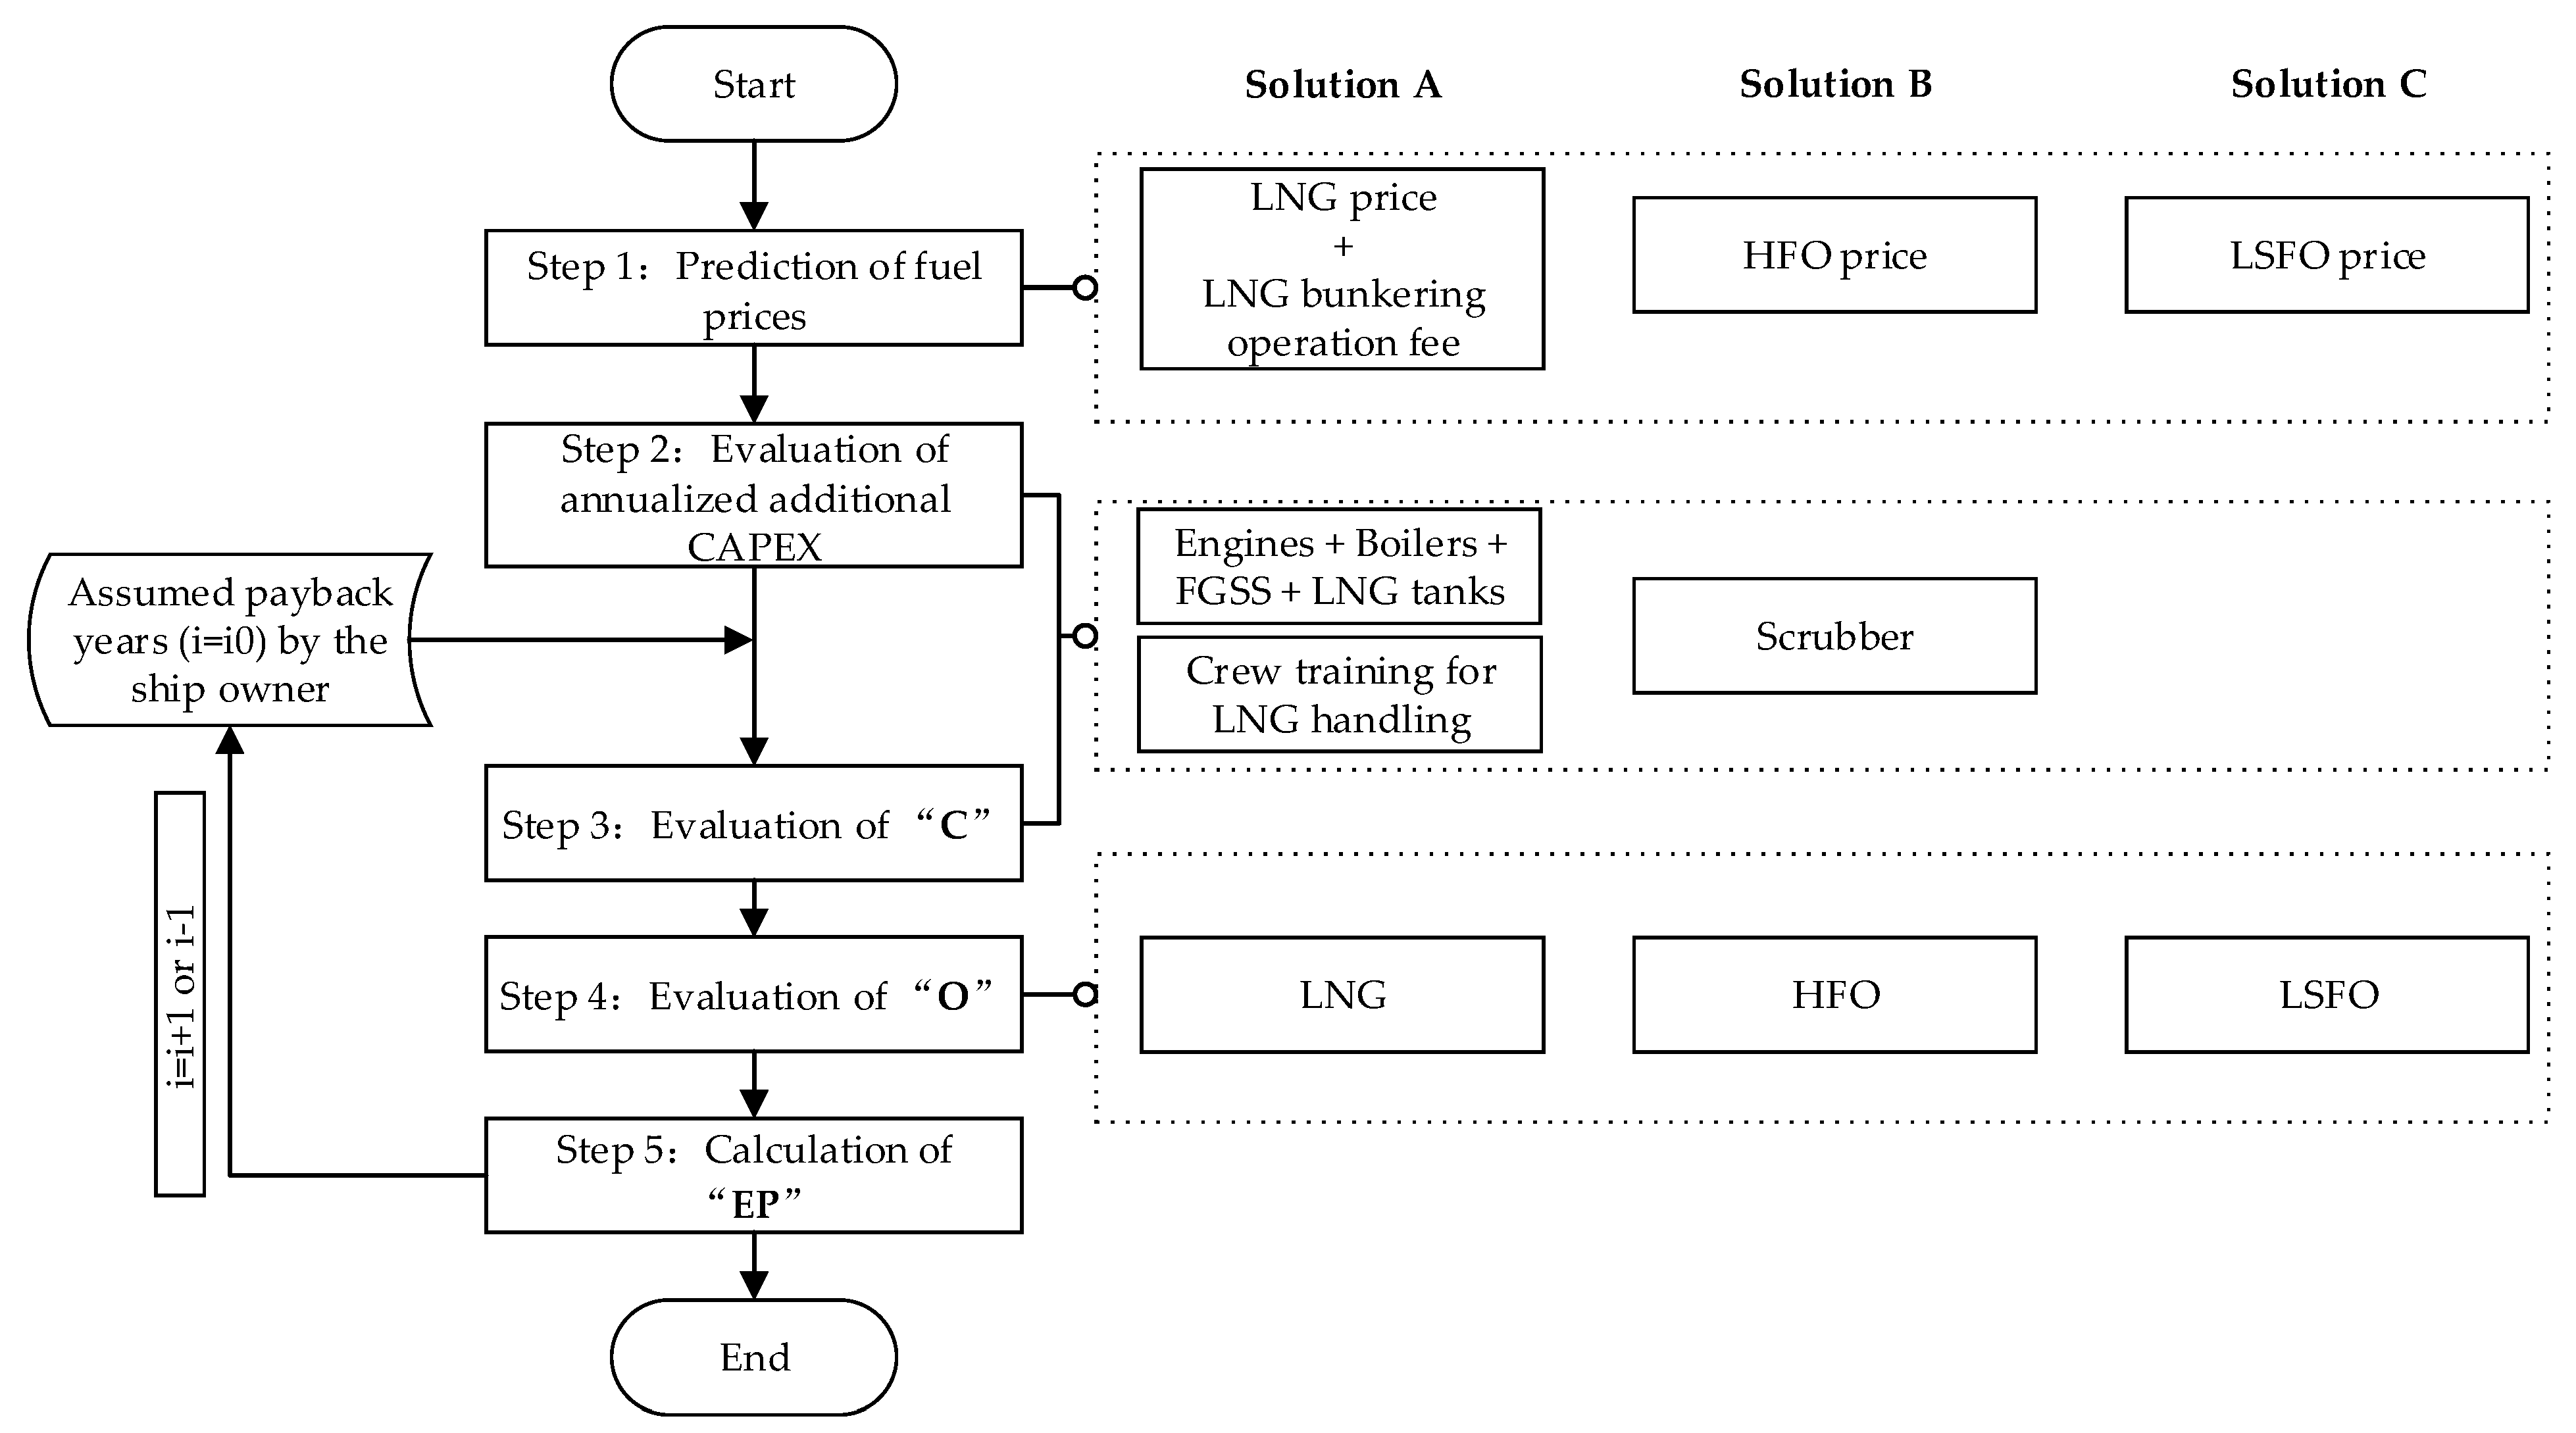
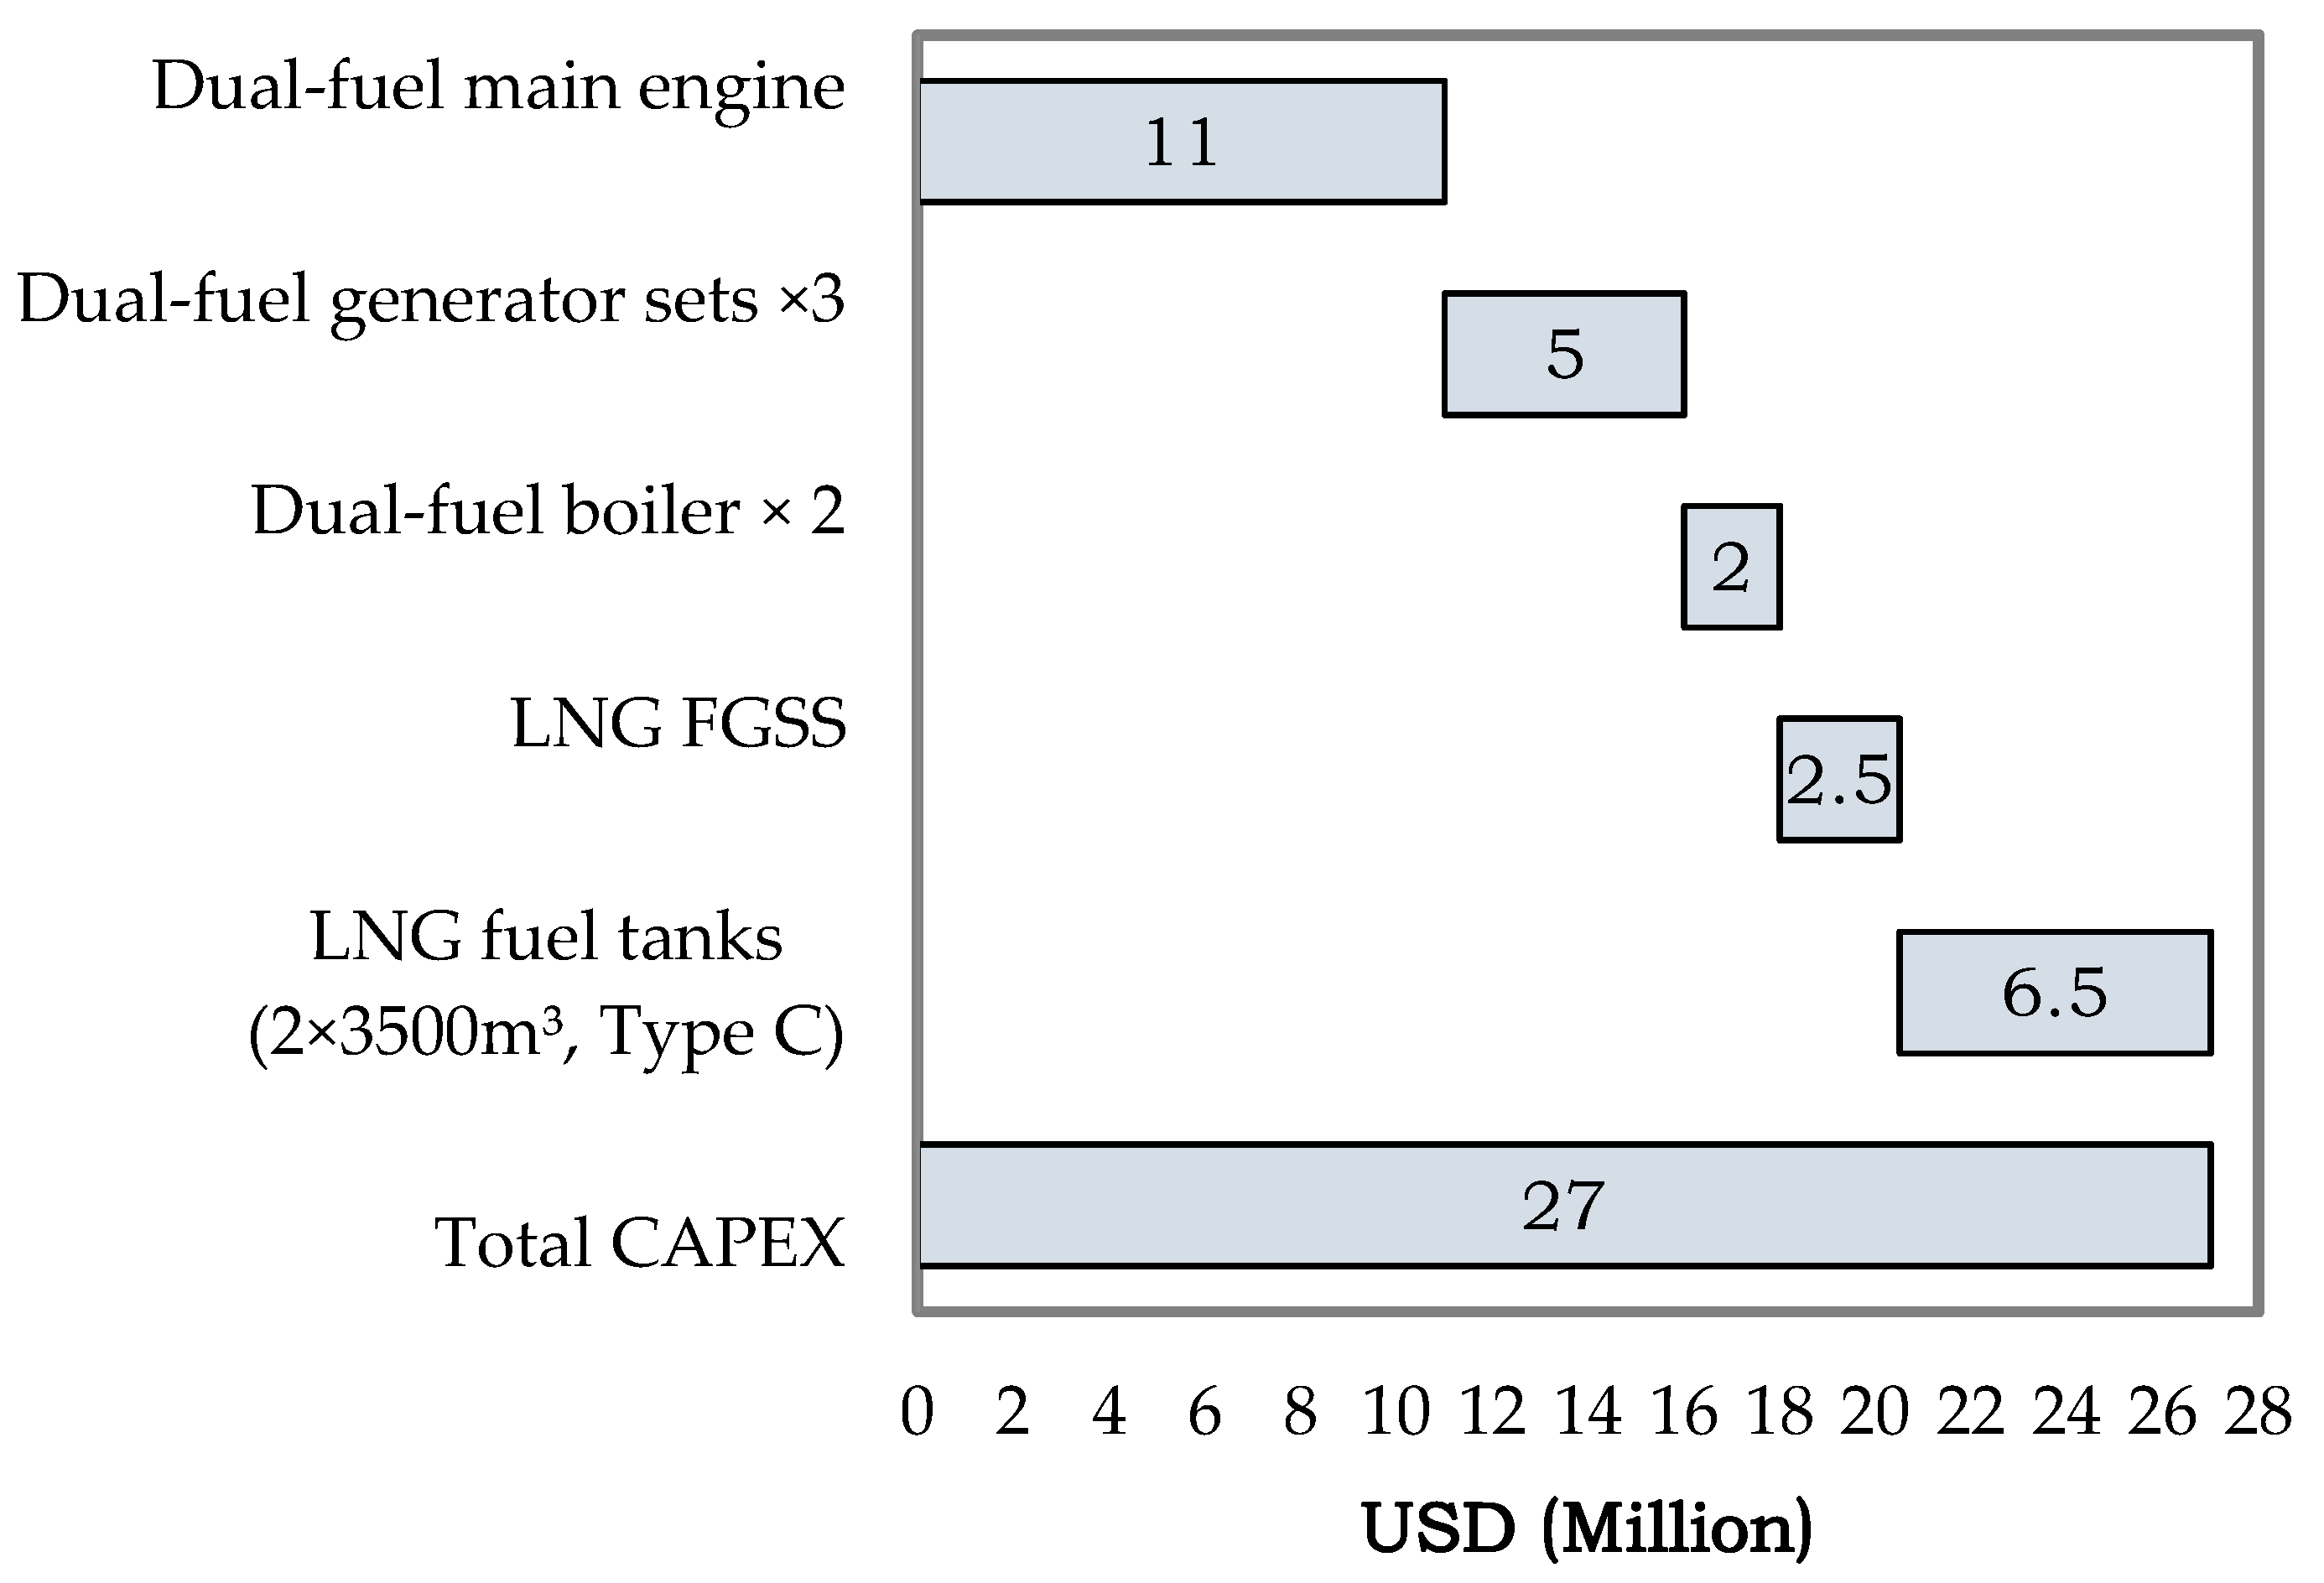
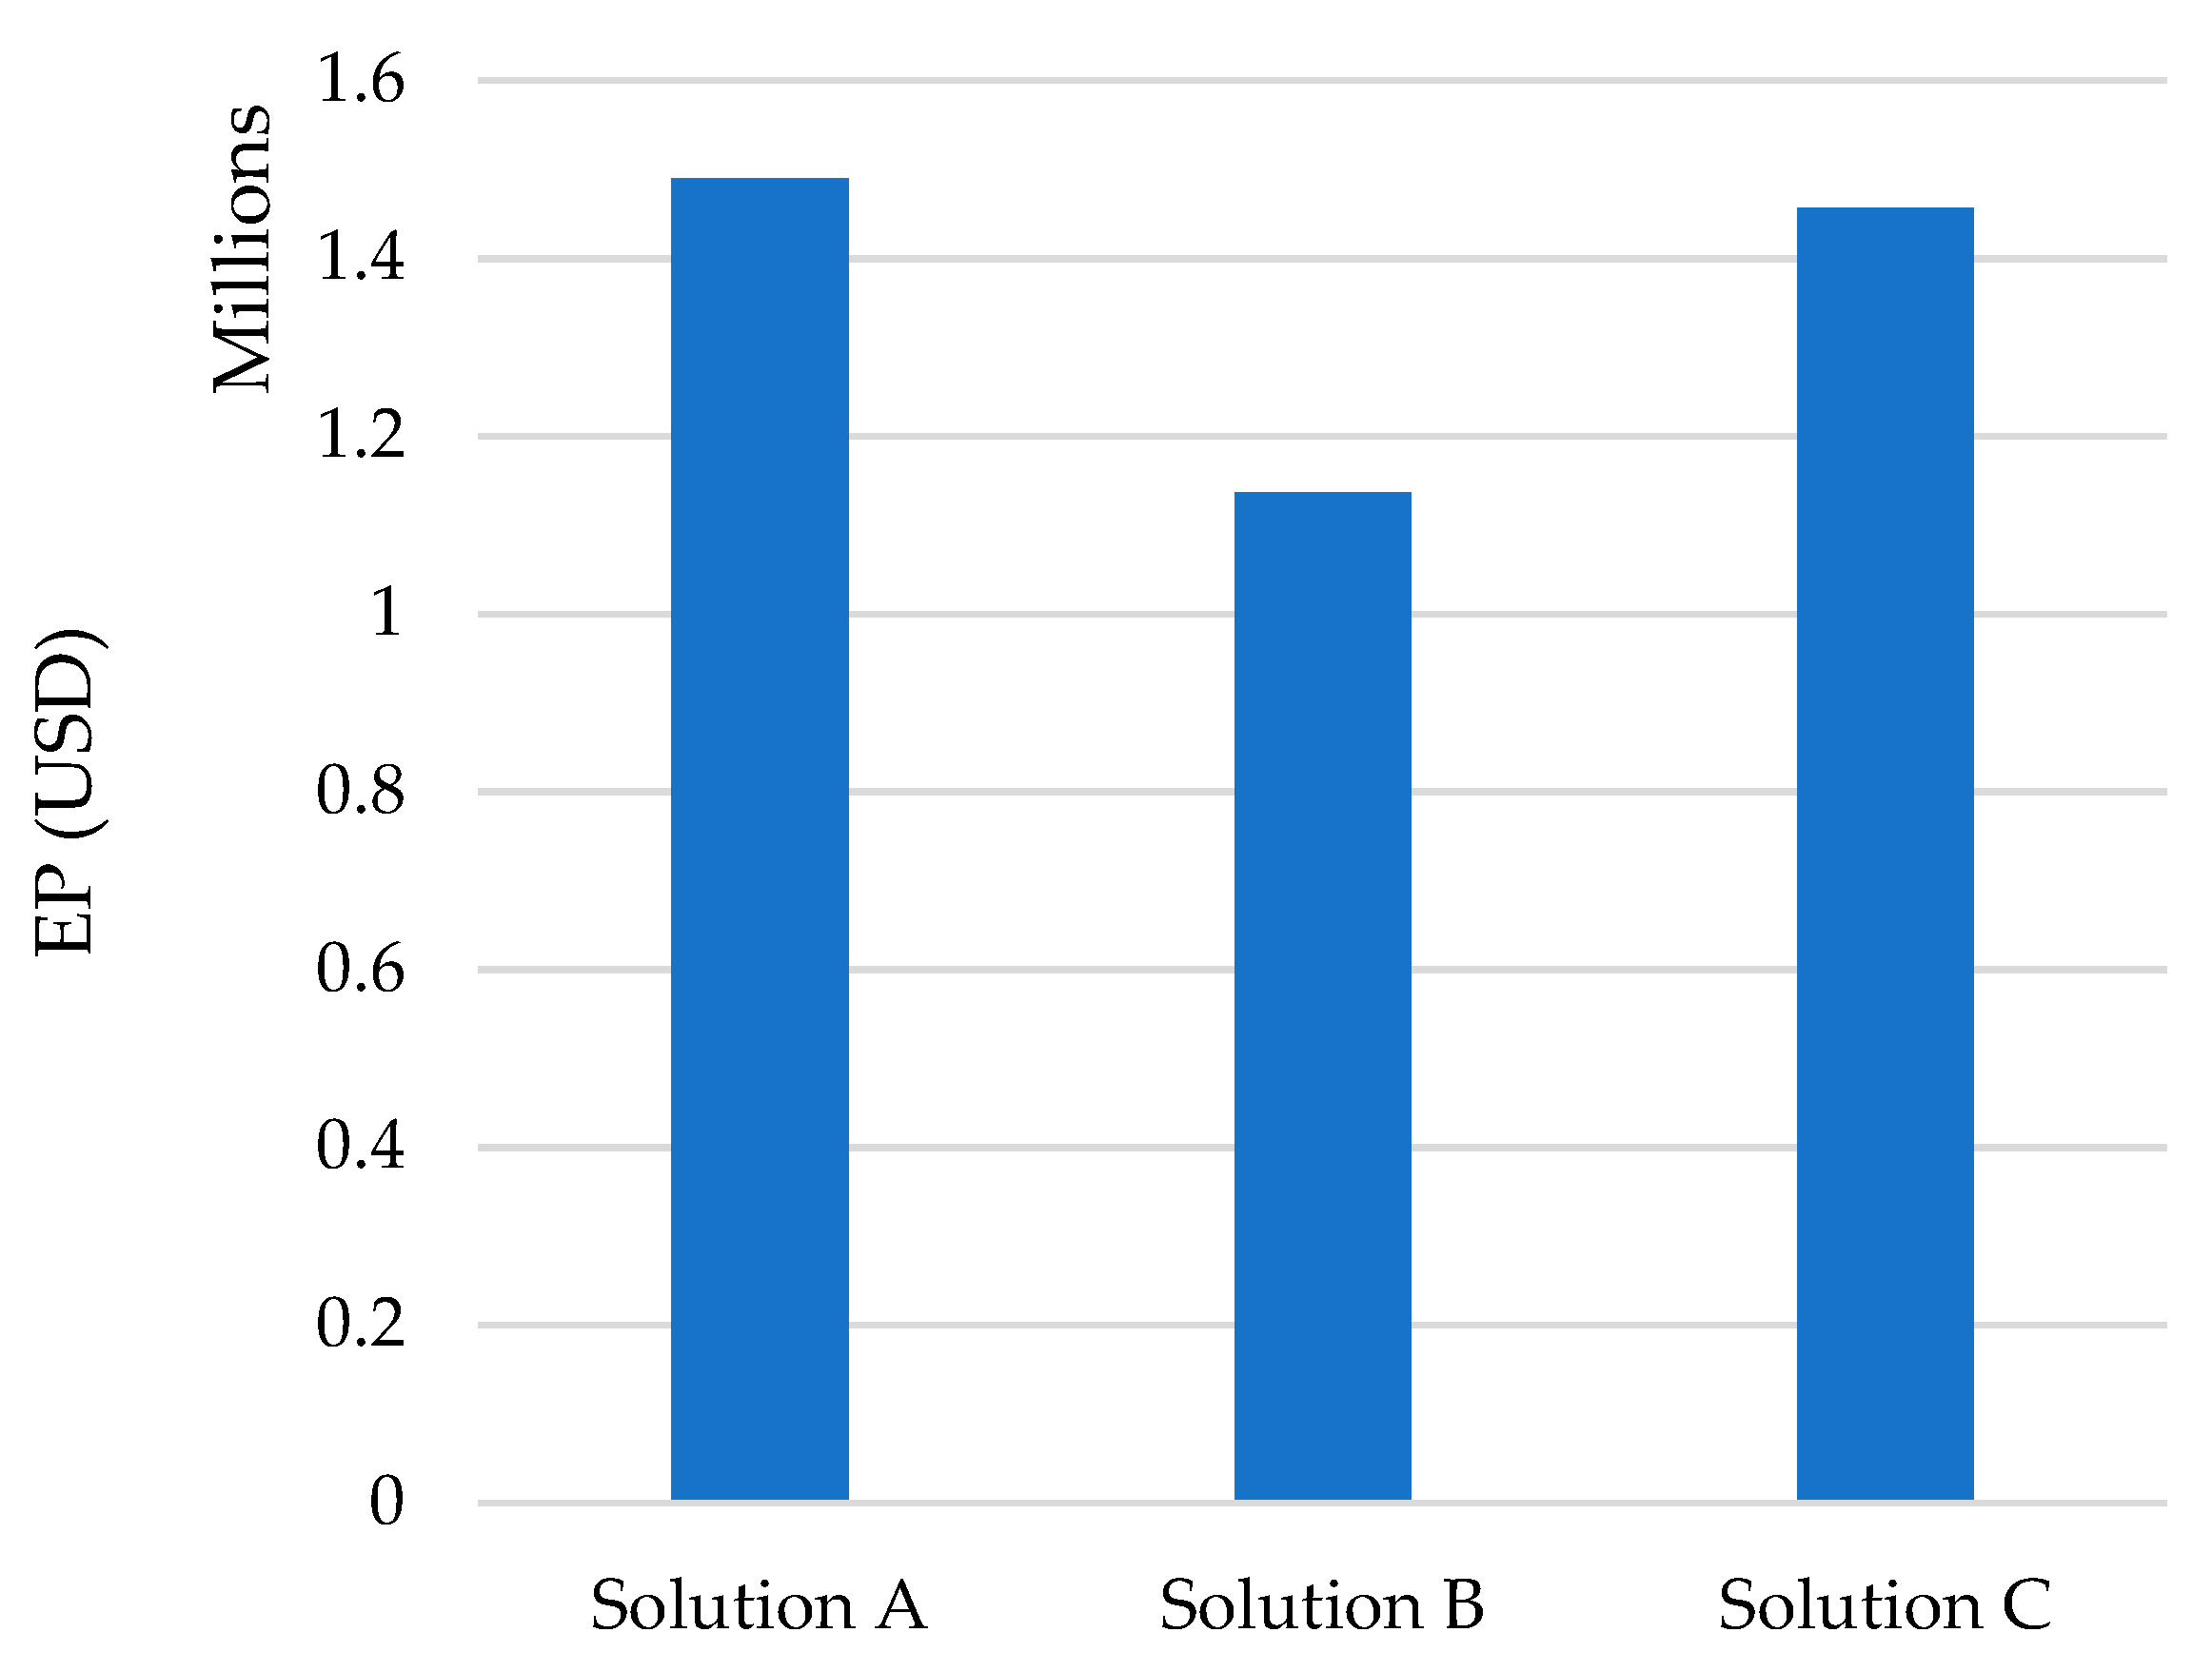
  • A: Using LNG as a marine fuel with dual-fuel engines.
  • B: Installing scrubber with using HFO.
  • C: Using LSFO.
It is noteworthy that the use of LNG as a bunker fuel is a well-proven technology. The safety associated with the operation of LNG-fuelled vessels has been well demonstrated over 20 years of safe operations after the world’s first LNG-fuelled vessel becomes operational in 2000, other than the LNG carriers. Furthermore, the adoption of the International Code of Safety for Ships using Gases or other Low-flashpoint Fuels (IMO IGF Code) addresses the risk issues and guarantees that LNG as a fuel on board has the same safety level as conventional ships using traditional bunkers on board.

1.2. Literature Review

Several previous studies have provided some insights into the comparison of economic performance of on-board emissions abatement approaches. For example, Jiang, L. et al. conducted an economic comparison between installing scrubbers and using marine gas oil (MGO) based on the Net Present Values (NPV) method. The results showed that the price spread between MGO and HFO is a determining factor in making choice [24]. Panasiuk, I. et al. carried out the evaluation of the investments efficiency by comparing installing scrubbers and using LSFO, where the NPV method was used [25]. Kim, A.R. et al. performed an empirical analysis focusing on three SOx reduction alternatives (using LSFO, installing scrubbers and using LNG as a fuel) considered by Korean shipping companies. The results of surveys and interviews indicated that, among the nine sub-criteria regarding responses to SOx regulation, investment costs are the most significant contributing factor [21]. Adachi, M. et al. also used the NPV method to carry out an economic comparison analysis considering three options for compliance with the IMO Tier III NOx emission reduction for a 9300 Twenty-foot Equivalent Unit (TEU) container ship (the IMO NOx emission standards are referred to as Tier I, II, III standards (a three-tier structure): the Tier I standards were defined in the 1997 version of Annex VI of the MARPOL Convention, while the Tier II/III standards were introduced by Annex VI amendments adopted in 2008; NOx emission limits are set for diesel engines depending on the rated engine speed; Tier I and Tier II limits are global effected in 2000 and 2011, respectively, while the Tier III standards apply only in NOx Emission Control Areas (ECAs) since 2016). Those options are oil-fuelled ship with selective catalytic reduction (SCR), LNG-fuelled ship with low-speed diesel engine directly coupled to the propulsion system and LNG-fuelled ship with medium speed diesel electrical propulsion system. The parameters for the economic analysis study were evaluated by the market research and the general information including initial shipbuilding cost, freight revenue, operation expenditure and fuel cost [26]. Georgios, A.L. et al. studied the techno-economical sustainability of four main alternative propulsion plants of a ferry ship, i.e., an LNG engine propulsion plant is compared with a conventional oil engine plant with and without waste heat recovery system. The Energy Efficiency Design Index (EEDI) and the life cycle cost were calculated for each alternative propulsion plant [27]. Tzannatos, E. et al. conducted a techno-economic comparison analysis of oil-fuelled and LNG-fuelled ferries and concluded that LNG as a marine fuel offers not only a favourable alternative in terms of private costs (technical and fuel costs), but also the external (damage) costs due to ship exhaust pollution [28]. Based on NPV method, Ge, J. et al. analysed the cost-efficiency of three alternatives complying with SOx and NOx emission regulations, i.e., HFO + Scrubber + SCR, Diesel + SCR and LNG-diesel dual fuel and concluded that LNG-diesel dual fuel power technology performs best among three alternatives. [29], Zhao, Y. et al. used a NPV model to select the optimal technology choice that meets both the IMO sulphur limits and Tier III NOx limits and applied it to three feeder services [30], Schinas, O. et al. studied the feasibility and commercial considerations of LNG-fuelled ships. An equation was proposed to give the accepted costing structure for commercial ships which can be used to assess or estimate the incentives required to promote LNG as a marine fuel [31]. Lee, H.J. et al. analysed the public’s willingness to pay for products imported by LNG-fuelled ships using the contingent valuation method [32]. Jin, L. studied the technical feasibility and the economic advantages of a newbuilding LNG-fuelled VLCC. He concluded that with an estimated 20% investment premium based on the original price for a conventional VLCC, the payback time for investors was expected to be within ten years under most circumstances. The higher the oil price, the more cost-competitive it is to replace the conventional marine fuel with LNG [33]. Wu, Y.H. et al. analysed the economic feasibility of retrofitting existing vessels to run on LNG based on NPV method [34]. In another approach, Peksen, D.Y. et al. analysed external costs of ship emissions onto national economy and investment costs for ship owners for new LNG-fuelled ships or retrofitting of existing ships by using Payback Period and NPV methods [35].
These works have offered NPV-based methods on the comparison of economic performances of ship’s emissions reduction technologies. The NPV-based limitations remain if the methods are applied to the comparison of economic performances for the solutions A, B and C in this study. The ship owner is always keen to evaluate the economic performance of various solutions for every voyage, as this evaluation is demanding for the business of voyage charter (a voyage charter refers to the hiring of a vessel and crew for a voyage between a load port and a discharge port).
In addition, the Internal Rate of Return (IRR) method is also commonly used in the process of the shipbuilding investment decision-making [36,37]. However, it is difficult to apply the IRR in this study since the ship owner had yet to decide the details of the financing strategy of the shipbuilding.
In view of this background, this research was motivated to propose a voyage expenses-based method (VEM) for comparing the economic performances of the solutions A, B and C, which can guide ship owners and/or potential charterers to obtain general insight to economic performance of different solutions. Therefore, the general results can be directly utilized for decision-making on selecting an optimal SOx emissions abatement solution for the ship operation.

1.3. Reseach Questions

Given the limited number of studies comparing the economic performances of on-board SOx emissions abatement solutions and lack of a VEM, this study aims to propose a VEM to conduct the analysis of the economic performances of three SOx emissions abatement solutions to provide a reference for decision making.
Of particular interest is the following questions to be addressed in this paper:
How to set an indicator for economic comparison, while considering the prices of marine fuels (LNG, HFO and LSFO)?
How to consider the CAPEX and OPEX of each solution, by considering the fuel consumption?
Which is the most optimal SOx abatement solution for the target VLCC?
In this paper, Section 2 outlines the parameters of the VLCC and the proposed methodology. Section 3 presents the results of the comparison of economic performance of the three solutions. Section 4 discusses the results. Finally, Section 5 presents the conclusions.

2. Materials and Methods

This section presents the parameters of the target ship and the proposed methodology.

2.1. Parameters of The VLCC

The shipping route of the planned newbuilding VLCC will be from the Middle East to East Asia, as shown in Figure 3, where the round trip is about 11,400 nautical miles [38]. The design speed of the ship is 15.5 knots, but the economical speed of 12.5 knots (the main engine can run at the economical speed where consumption of fuel is minimum) was used in this study to calculate the sailing days of each voyage. A voyage would take 43 days with 38 days of sailing and 5 days of port stay and as a result, eight voyages per year was considered.
In term of LNG bunkering availability, both departure and arrival ports and the intermediate port of call, Singapore, will be able to provide LNG bunkering services by the time the VLCC is launched. China’s first LNG bunkering vessel with 8500 cubic meters will be put into operation in 2021 in Ningbo port, while Singapore’s first LNG bunkering vessel with 7500 cubic meters has been delivered in January of 2021.
Table 2 presents the parameters of the VLCC. In terms of the additional equipment on board the VLCC, Solution A consists of dual-fuel main engine, dual-fuel generator sets, dual-fuel boilers, fuel gas supply system (FGSS) and LNG fuel tanks. Figure 4 shows two single-walled IMO type C tanks (IMO Type C tanks are normally cylindrical or bi-lobe (or multi-lobe) pressure vessels) designed to be located on the open deck for Solution A. The capacity of each tank is 3500 cubic meters. For Solution B, there is only one addition of a scrubber to machinery that runs on HFO. There is no additional equipment for Solution C.

2.2. Methodology

A voyage expenses-based method (VEM) was proposed in this paper to analyse the three different solutions as discussed above. Ship’s voyage expenses refer to the costs associated with the ship’s employment, including costs of bunker fuel, the salaries of the crew, canal dues, port charges (including pilotage, towage, berth hiring, agency fees, linesmen’s charges, etc.), passenger-handling costs and cargo-handling costs, etc. [39]. A ship’s voyage expense is an important indicator for the ship operators and the potential charterers to understand the economy of the ship, especially in the business of voyage charter [40].
To answer the first question, this study developed a comparison indicator “EP” which allows the ship operator to compare the economic performances of the three solutions. “EP” is expressed as the sum of “C” and “O” given in Equations (1) and (2). “C” represents the additional CAPEX per voyage within the targeted payback years, which refers to the increased investment compared to the conventional fuel oil powered system. The payback years in this paper refers to the amount of years it takes to recover the cost of the additional capital investment in LNG propulsion system of Solution A, or addition of scrubber system to Solution B for the ship. “O” represents the OPEX per voyage including the fuel costs consumed in the three proposed solutions and the operating cost for the scrubber in Solution B. The comparable parameters “C” and “O” can reflect on the characteristics of the three solutions. Other voyage expenses items, such as salaries of the crew, port charges and cargo-handling costs, are not significantly different in the three solutions and therefore, they were not considered in the analysis of economic performances.
E P = C + O
where
C = A n n u a l i z e d   a d d i t i o n a l   C A P E X   V o y a g e s   p e r   y e a r
The proposed VEM structure shown in Figure 5 can be implemented to a selected target ship in five steps:

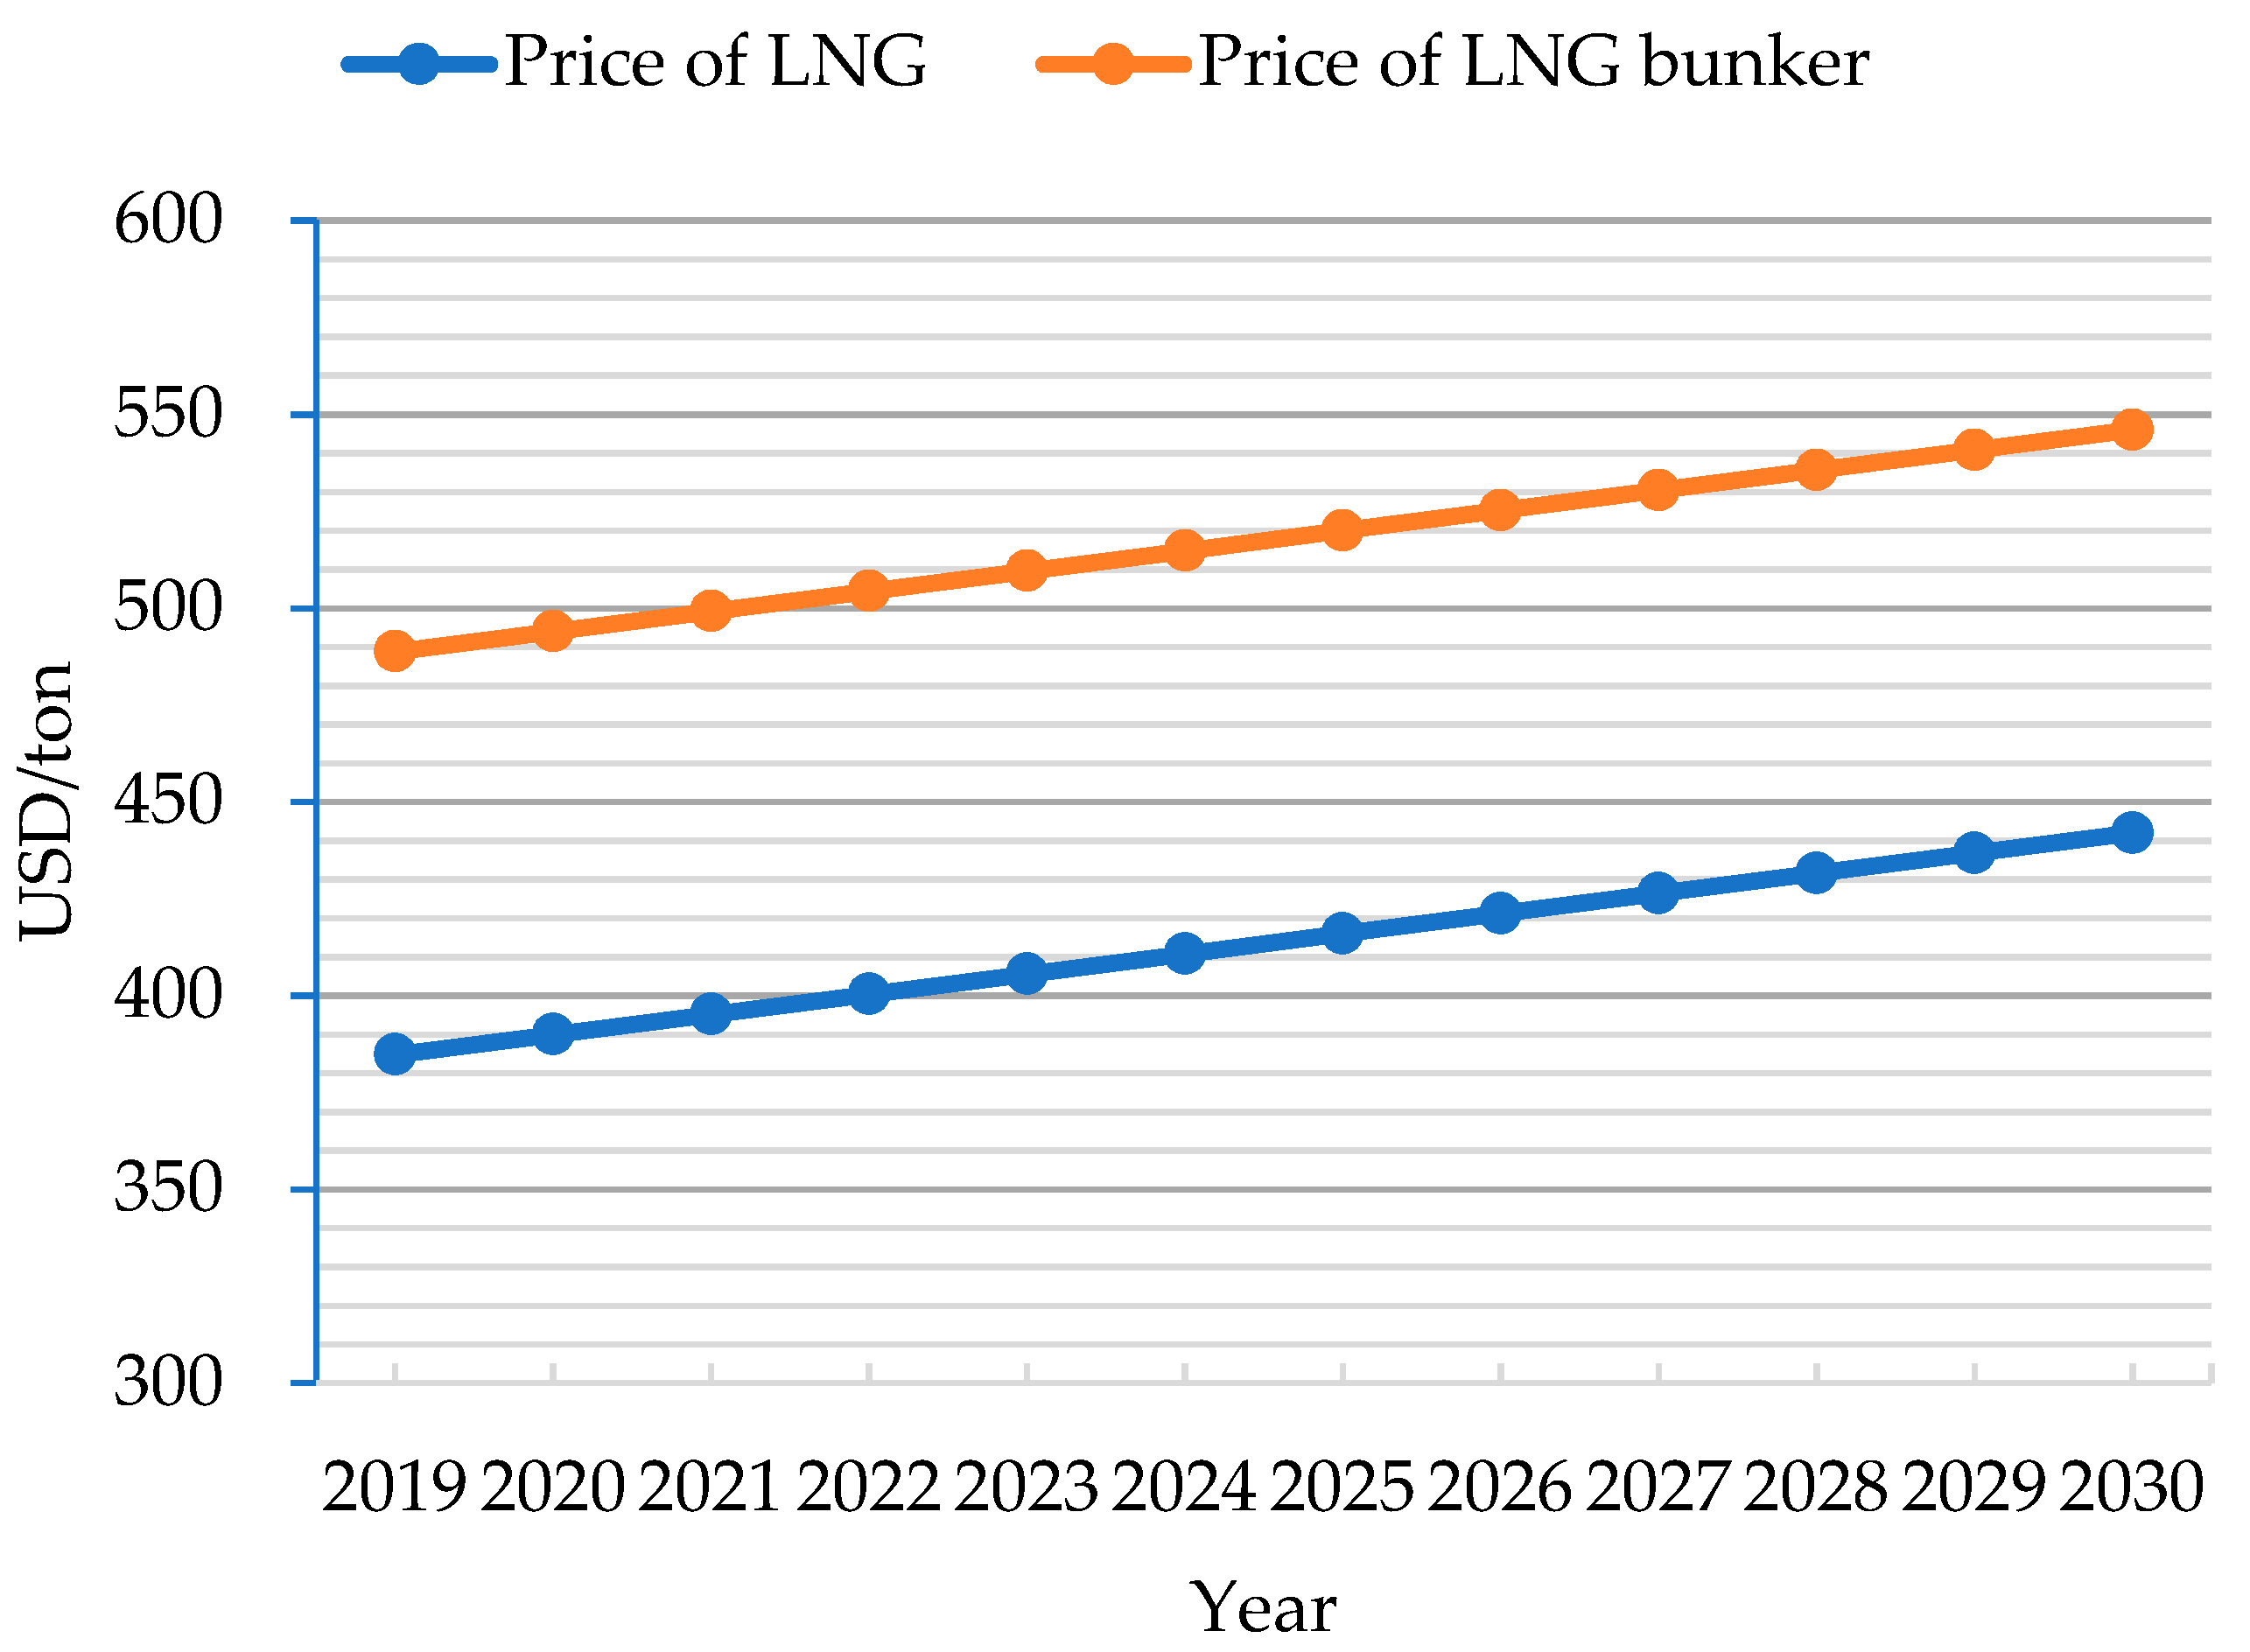
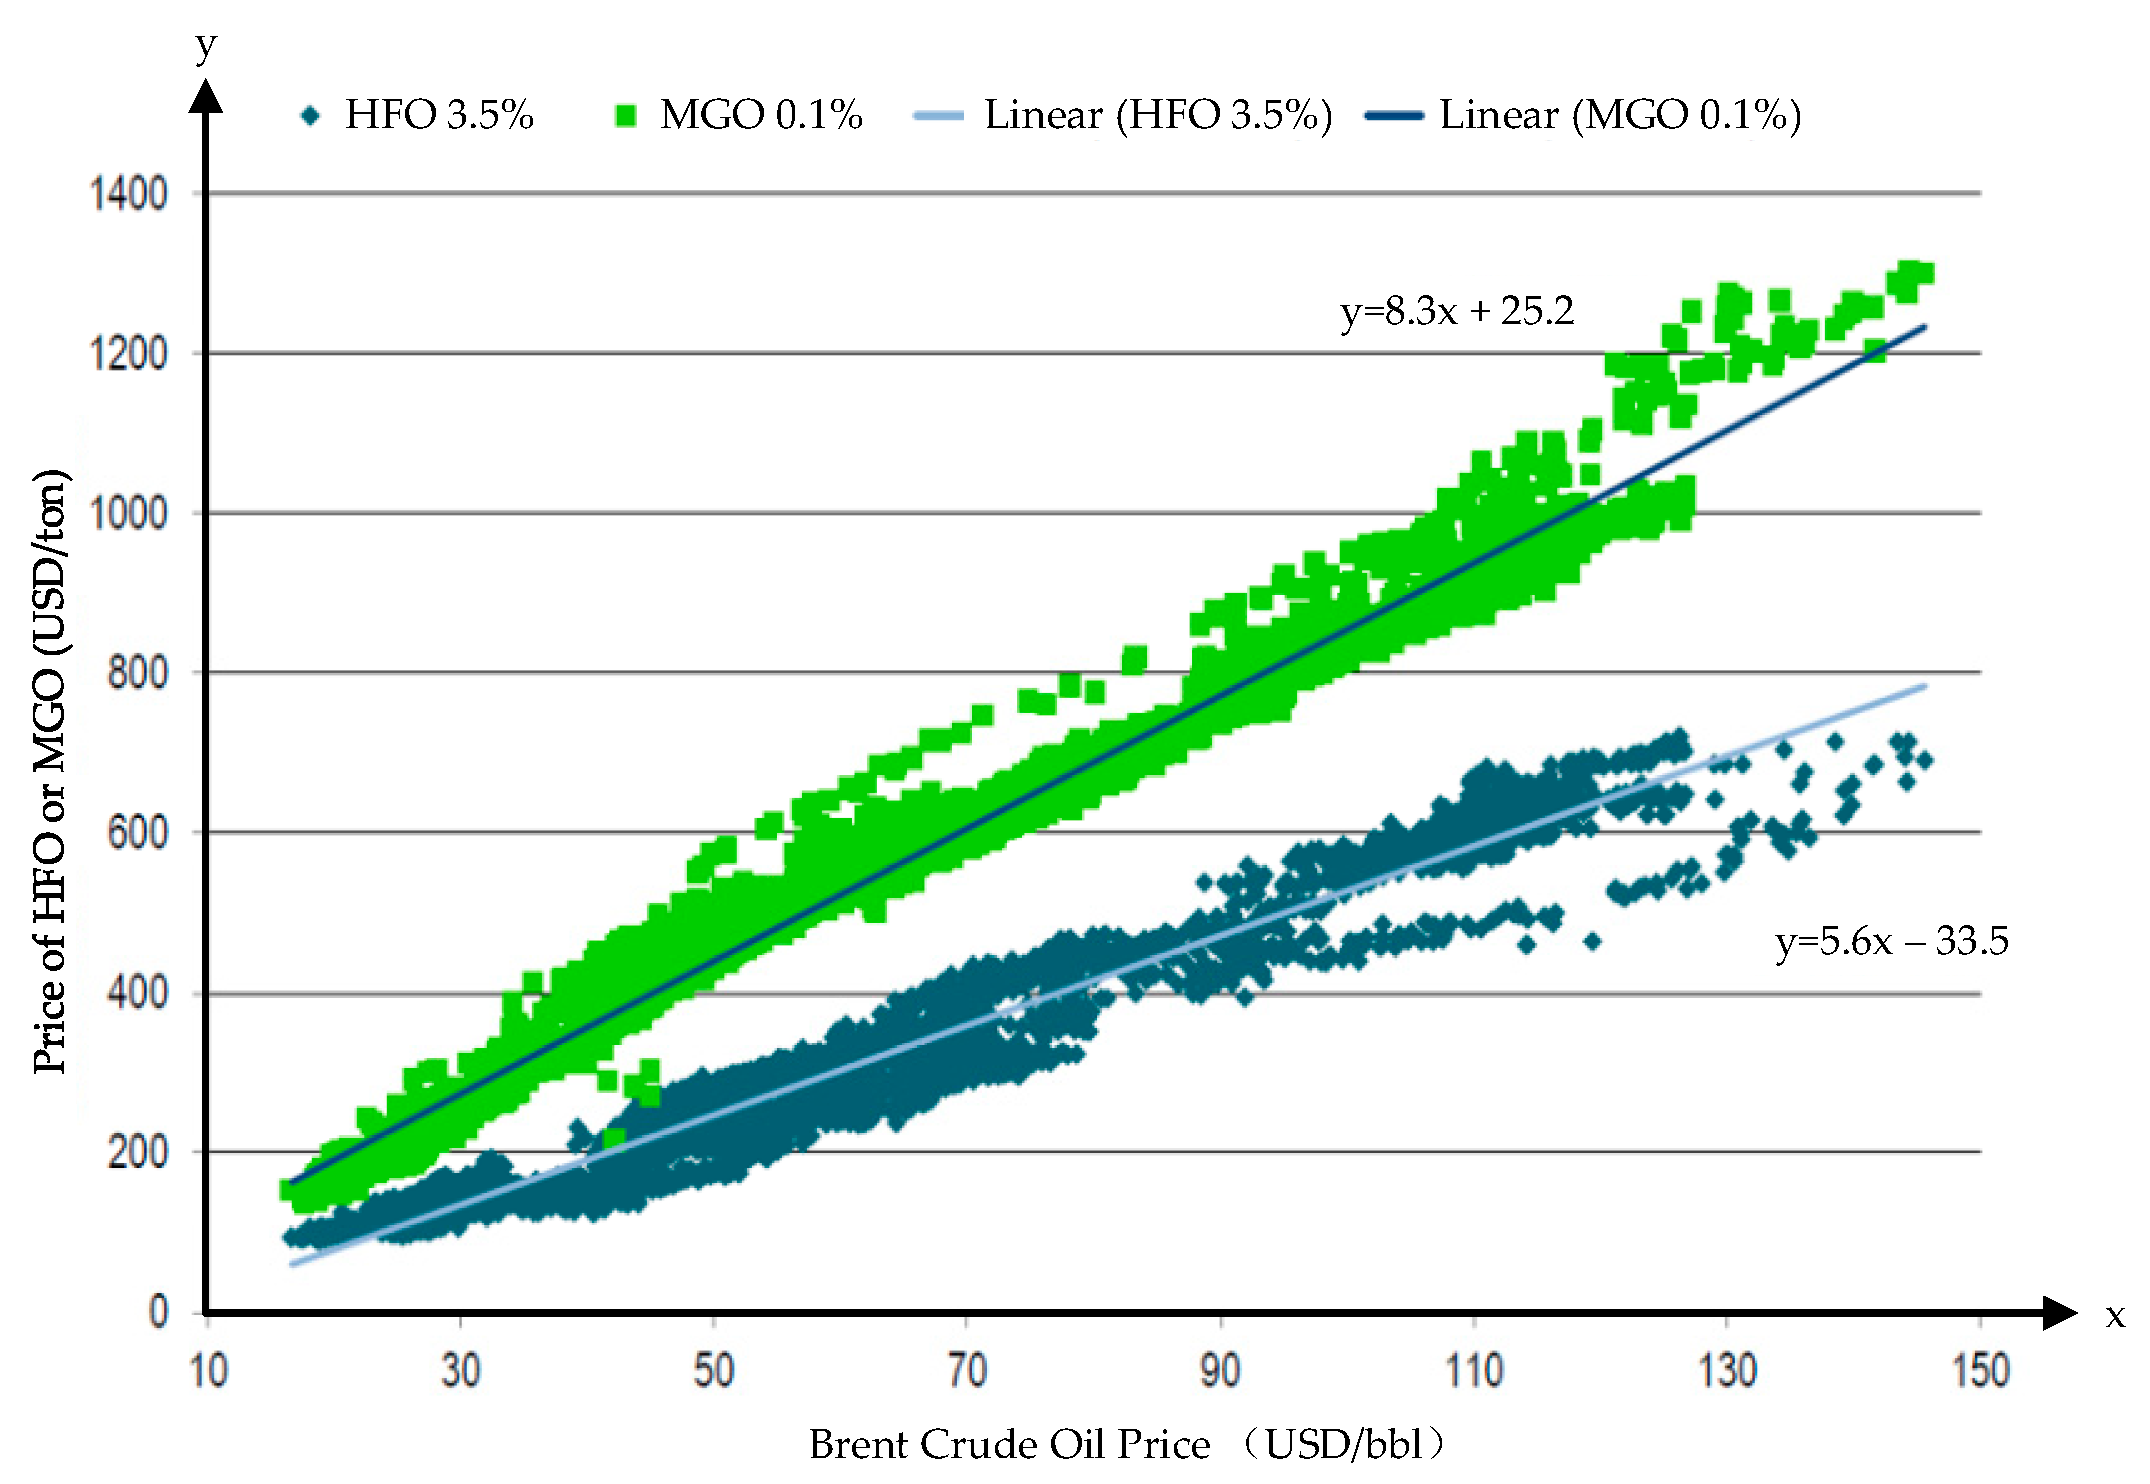
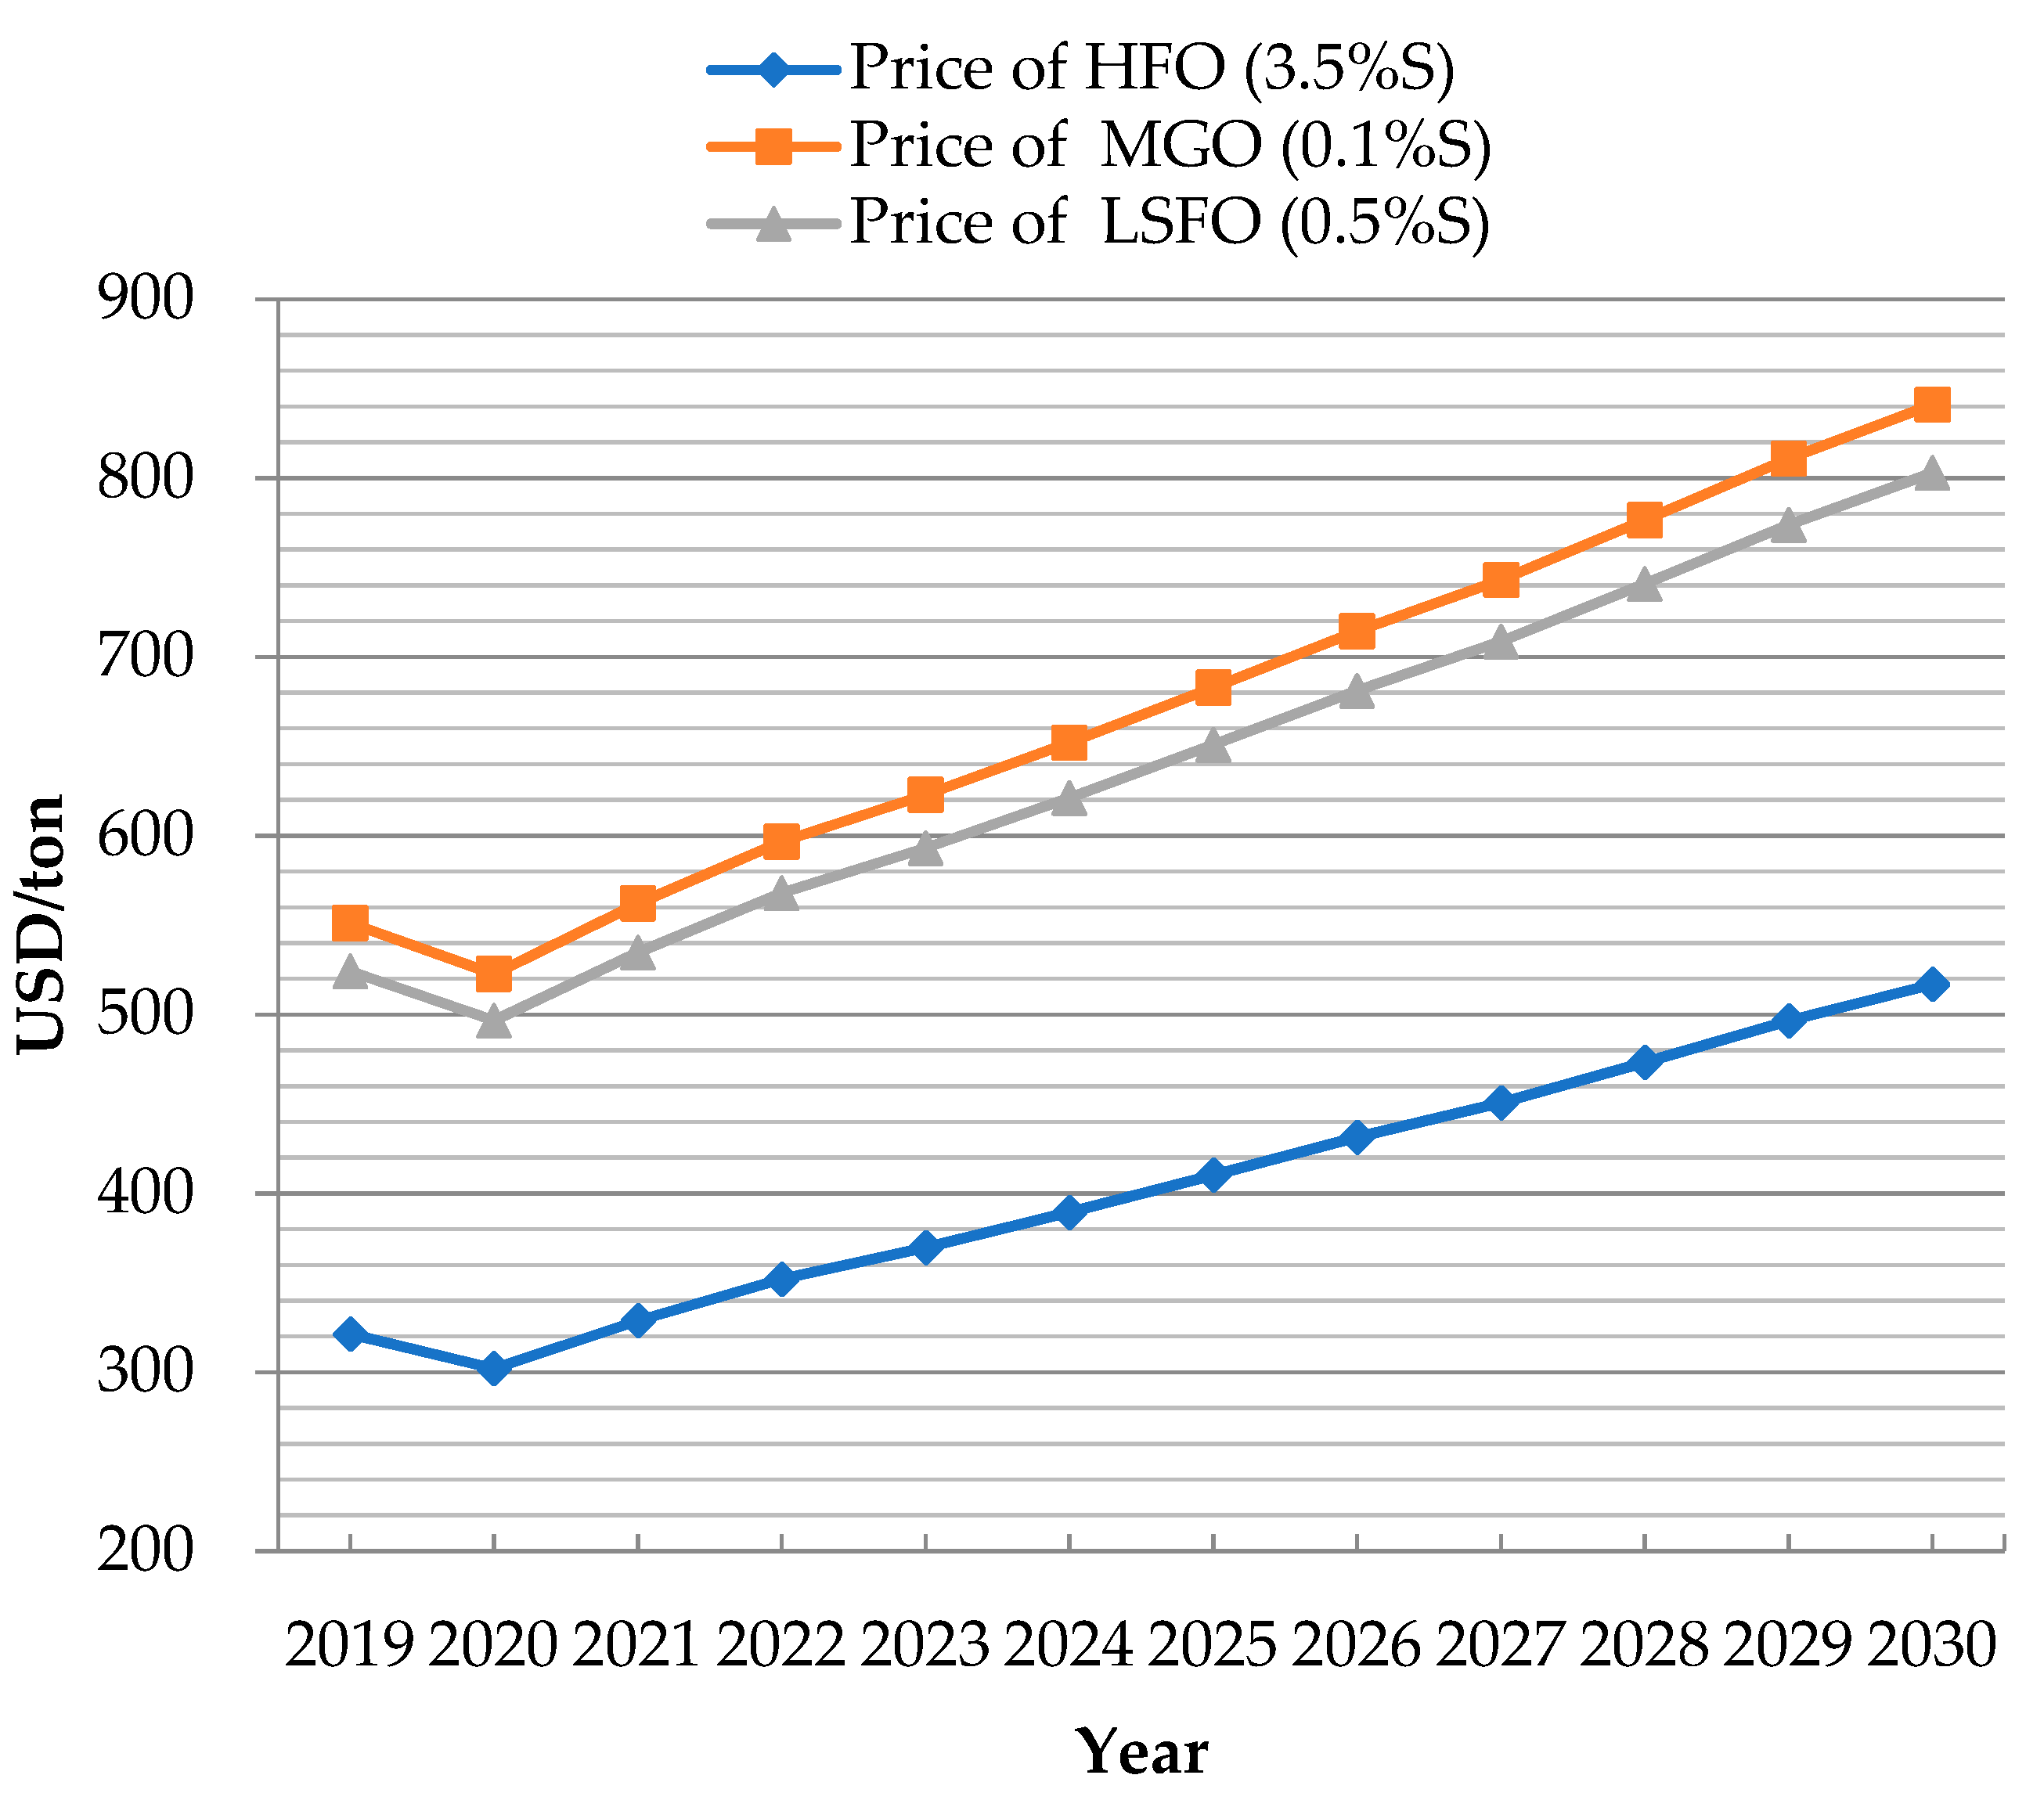
2.2.1. Step 1: Prediction of Fuel Prices (LNG, HFO and LSFO)

To analyse the impact of fuel cost on the OPEX, this study used the marine fuels data published by the authoritative institutions.
Solution A: LNG Price + LNG bunkering operation fee.
The LNG price is much dependent on the location of LNG bunkering [41]. Since bunkering of newbuilding VLCC is expected to be in East Asia, the long-term East Asian LNG Price projection data published by the World Bank Commodities Price Forecast based on the market expectation in 2019 given in Figure 6 was used in this paper [42]. In analysis, an additional LNG bunkering operation fee was added to the price. The LNG bunkering operation fee is affected by many factors, such as the building cost of the bunkering ship, annual bunkering volume and the bunkering volume for each operation. In this study, The LNG bunkering operation fee was set to 2 USD/MMBtu (MMBtu is equal to 1 million BTU (British Thermal Unit); natural gas is measured in MMBtu’s. 1 tonne of LNG is equal to 52 MMBtu) which is provided by a potential LNG bunkering contractor of the VLCC. Figure 6 presents the prediction of both LNG price and LNG bunker price in East Asia until 2030.
Solution B and C: HFO and LSFO Price.
The prices of HFO, MGO and LSFO are closely related to the Brent Crude Oil Price (Brent Crude Oil Price is used for major trading and serves as a benchmark for purchases on global financial markets). The long-term Brent Crude Oil Price projection data from the U.S. Energy Information Administration was used in this paper [43]. The prices of HFO, MGO and LSFO include the bunkering operation fee.
Figure 7 shows linear regression relationships between the price of HFO and Brent Crude Oil Price, as well as the price of MGO and Brent Crude Oil Price [44,45]. In terms of the LSFO, one of the commonly used production methods is blending of two readily available fuels [46]. Typically, LSFO with a sulphur content of 0.5% m/m can be produced by blending 88.24% of MGO with a sulphur content of 0.1% m/m and 11.76% of HFO with a sulphur content of 3.5% m/m. Based on this blending ratio, the estimation of the price for LSFO (PLSFO) can be obtained from the price of HFO (PHFO) and MGO (PMGO). The PLSFO formula is expressed by Equation (3) [47].
P L S F O = 88.24 % × P M G O + 11.76 % × P H F O
Figure 8 shows the prediction data of PLSFO, which is based on the market expectation in 2020. It is seen that the oil price dropped in 2020 due to the COVID-19 pandemic outbreak [48].

2.2.2. Step 2: Evaluation of the Annualized Additional CAPEX

Evaluation of the annualized additional CAPEX for Solution A includes dual fuel engines, dual fuel boilers, FGSS, LNG tanks and crew training for LNG handling. With regard to Solution B, the installation of scrubber is mainly considered. There is no additional CAPEX for equipment in Solution C.
The annualized CAPEX is expressed by Equation (4).
A n n u a l i z e d   C A P E X = I I × R × ( 1 + R ) n ( 1 + R ) n 1
where, I I is the initial investment, R the discount rate and n is the targeted payback years. According to the ship owner’s opinion, R is taken as 6% in this study.
Solution A: Dual fuel engines + Dual fuel boilers + FGSS + LNG tanks + Crew training.
Currently, there are two types of dual fuel engines for large ships, namely, the high-pressure engines operating on the Diesel cycle and the low-pressure engines operating on the lean-burn Otto cycle. The low-pressure engines allow the gas to be injected at low pressure, ranging from 5 to 16 bar [49,50]. This results in low levels of NOx emissions and can meet the IMO Tier III requirements. Moreover, the low-pressure concept offers the possibility of applying a simple FGSS. Thus, in this study, the total CAPEX was estimated based on the low-pressure engine that the ship owner preferred to choose.
According to supplier’s quotation provided by the ship owner, the total initial investment of equipment was estimated to be 27 million USD as shown in Figure 9. That is 17 million USD in excess of the conventional fuel oil-based power system, which is about 10 million USD.
In addition to the initial investment on equipment, the cost of crew training for LNG handling is considered. The estimate by the ship owner is 800 USD on average for each crew member which, would be 18,400 USD in total considering 23 crew members for a VLCC.
Solution B: Adding scrubber.
Madsen, S. and T.C. Olsson recommended a regression model to estimate the initial investment of the scrubbers [51]. The regression model is expressed as Equations (5) and (6). In this model, both the cost of equipment, the cost of installation and commissioning can be expressed as a linear function based on the engine power.
C S c r u b b e r   u n i t = 750 + 35 × P M E  
C S c r u b b e r   i n s t a l l a t i o n = 75 + 30 × P M E
where C S c r u b b e r   u n i t is the cost of scrubber equipment (unit: 1000 EUR); C S c r u b b e r   i n s t a l l a t i o n is the cost of installation and commissioning (unit: 1000 EUR); P M E is the power of main engine (kW).
For the target vessel engine power of 25,360 kW, the total CAPEX of the scrubber is estimated to be approximately 2.8 million USD. However, taking into account the latest changes in prices, the scrubber supplier’s quotation was 4 million USD, given by the ship owner. Therefore, 4 million USD was taken as the additional initial investment for Solution B.

2.2.3. Step 3: Evaluation of Parameter C

After the ship owner initially determined the target payback period, the number of voyages within the payback period and the CAPEX of each voyage within payback period can be obtained.

2.2.4. Step 4: Evaluation of Parameter O

Solution A, B and C: fuel costs.
This step evaluates the fuel cost for each voyage based on the prediction of fuel prices and fuel consumption.
Solution B: OPEX of scrubber.
There are three main types of scrubbers: the open loop which uses only sea water; the close loop which uses fresh water mixed with caustic soda; the hybrid which has both benefits of open and closed loop. Most ships could benefit from hybrid scrubber which operate as a closed loop system when in coastal waters and ports and operates as an open loop system when in open waters. In this project, the ship owner intents to select a hybrid scrubber for Solution B. Hybrid scrubbers are estimated to have an average annual operating cost closer to that of an open loop scrubber with the assumption that the ship will operate in open waters more often. The operating cost of the scrubber was estimated to be 6 USD per MW/hour, including the cost of additional energy required for sea water/freshwater pumping, sludge disposal and caustic soda consumption [52].
Step 3 and 4 answer the second question.

2.2.5. Step 5: Calculation of EP

By combining steps 3 and 4, the EP can be obtained.
Upon completing all five steps, the results of comparable economic performance for solution A, B and C can be obtained.

3. Results

This section presents the results.

3.1. Calculation of Fuel Comsumptions for Three Solutions

The HFO consumption is obtained from the actual voyage data from a sister ship having the same design data as the target ship. The consumption of LSFO and LNG were calculated using the HFO consumption based on the principle of equal output energy. The calculation method is according to the following steps:
Step 1: The daily HFO consumption of the main engine and auxiliary engines at ship’s economical speed was obtained.
Step 2: The number of sailing days for each voyage was calculated considering the mileage and speed of each voyage. Subsequently, the total HFO consumption per voyage was calculated based on the daily HFO consumption of the main engine and auxiliary engines.
Step 3: Considering differences in the fuel’s calorific value (LNG: 50 MJ/kg [53], HFO: 40.2 MJ/kg [54], MGO: 42.7 MJ/kg [53], the value of LSFO can be calculated using the mixing ratio and the calorific value of HFO and MGO) and taking into consideration the difference in engine efficiency (low pressure two-stroke dual-fuel engine in gas mode: 47% [55], two-stroke diesel engine: 50% [56]), the HFO consumption for each voyage was converted to LNG and LSFO consumptions. The consumptions of LNG and LSFO can be expressed by Equations (7) and (8).
L N G c o n s u m p t i o n = H F O c o n s u m p t i o n × 40.2   50 ÷ 47 % 50 %
L S F O c o n s u m p t i o n = H F O c o n s u m p t i o n × 40.2   40.2 × 88.24 % + 42.7 × 11.76 %
Table 3 presents the daily HFO (bunker grade: IFO 380 [57]) consumption of the main engine and auxiliary engines at various speeds from the referenced VLCC. Using these data and Equations (7) and (8), the consumptions of LNG and LSFO are obtained.

3.2. Results Based on Initial Target Payback Period

The ship owner initially determined the target payback period of 6 years Therefore, the additional CAPEX for each solution was allocated to each voyage accordingly, that is 48 voyages in 6 years. It was estimated that the ship will be delivered for operation at the start of 2022 and therefore, the average fuel prices were based on the prices from 2022 to 2027.
Table 4 shows calculation of the economic performances of three proposed solutions. Figure 10 presents the EP values of these three solutions. It is seen from the Figure 10 that within the target payback period of 6 years, using LNG (Solution A) and using LSFO (Solution C) options are more expensive than installing scrubber (Solution B). Therefore, installing scrubbers is a potential way to save cost, which is as a consequence of LNG and LSFO price. A comparison between Solution A and C shows that Solution C is more competitive than Solution A.
At a speed of 12.5 knots, the power of the main engine is about 50% of the rated power. For a voyage of 38 days, the operating cost of the hybrid scrubber is 25.36 × 50% × 24 × 38 × 6 = 69,385 (USD).

3.3. Results Based on Variuos Target Payback Periods

Further to VEM application, it is apparent that the difference in target payback years is significant to the results of EP value. In this section, five senarios of target payback years (5, 6, 7, 8 and 9 years) were assumed to compare the EP trends for the three proposed solutions, where the trends are summarised in Figure 11. It is seen that in these five scenarios, Solution B maintains its comparative advantage. As the target payback years becomes longer, the EP value for Solution A gradually decreases, while that of Solution B and C gradually increase. The reasons are discussed below:
For Solution A, the CAPEX has a maximum impact on the results. Furthermore, the longer the target payback period, the less the CAPEX that would be equally divided each year, which leads to gradual decreases of the EP values.
For Solution B and C, the main reasons for the values of EP that gradually increase is due to the increase in fuel prices in the future.
A comparison between Solution A and C shows the target payback of 6.5 years is a turning point. When the target payback period is greater than 6.5 years, the advantage of the Solution A is prominent.

4. Discussion

The choice of the SOX emissions abatement technologies is a compromise among many issues. In addition to the economy, the performance of a certain technology in terms of compliance with the greenhouse gas (GHG) emissions regulations is also a factor that shipowners need to consider when making decisions.
According to the Fourth IMO GHG Study [58], contribution of shipping GHG emissions in global anthropogenic emissions had increased from 2.76% in 2012 to 2.89% in 2018. Three ship types remain the dominant source of international shipping’s GHG emissions: container ships, bulk carriers and oil tankers.
In terms of GHG emission mitigation, the IMO has set the target to reduce carbon intensity by 40% by 2030 and 70% by 2050, while lowering total greenhouse gas emissions by 50% by 2050 (compared to 2008 levels) [59]. Short-term, mid-term and long-term measures are introduced to achieve the goal.
There are measures in place for energy efficiency standards for ship design. The EEDI was made mandatory for new ships by IMO in 2011 [60]. The EEDI provides a specific figure for an individual ship design, expressed in grams of CO2 per ship’s capacity-mile (the smaller the EEDI, the more energy efficient ship design) and is calculated by a formula based on the technical design parameters for a given ship [61]. The conceptual expression of EEDI can be expressed by Equation (9); however, the detailed expression can be found in reference [54].
E E D I P × C F × S F C   C a p a c i t y   × S p e e d
where P is 75% of the maximum continuous rating (MCR) for each main engine;   C F is the conversion factor between fuel consumption and CO2 emission ( C F of LNG is 2.750 [54]; C F of HFO is 3.114 [54]; C F of MGO is 3.206 [54]; C F of LSFO can be calculated by using the C F of HFO and MGO based on the blending ratio); S F C is the specific fuel consumption; C a p a c i t y is the deadweight of ship; S p e e d is the ship speed.
The IMO regulations use the reduction factor in the calculation of the required EEDI in different phases, see Table 5 [60]. Reduction rates have been established until the period 2025 and onwards when a 30% reduction is mandated for applicable ship types calculated from a reference line representing the average efficiency for ships built between 2000 and 2010. The amendments to strengthen the EEDI “Phase 3” requirements was adopted at IMO MEPC 74 in 2019 [62], brought forward the entry into effect date of phase 3 to 2022 from 2025 for several ship types, including gas carriers, general cargo ships and LNG carriers. This means that the implementation date of EEDI “Phase 3” requirements remains unchanged for VLCCs.
Table 6 presents the potential EEDI reductions for three proposed solutions according to Equation (9). Taking the traditional fuel-based Solution B as the benchmark, Solution A can reduce the EEDI value by 19.6%; however, Solution C has no contribution to reducing EEDI. In view of this, Solution B and C reduce SOx emissions but have no contribution to reducing CO2 emissions which makes them naive to the future IMO GHG regulations.
Although the use of LNG as a fuel cannot directly meet the requirements of EEDI phase 3, it is easier to add other technical measures (such as hull design optimization and power and propulsion system optimization [5]) to Solution A to cover the remaining gap compared to Solution B and C.
In addition, according to References [63,64,65,66,67,68], using LNG as a marine fuel can provide a significant reduction in NOx and particulate matters (PM). Therefore, using LNG as a marine fuel is an effective harmonized strategy for reducing air pollutants and CO2 emissions simultaneously.
Section 3 and Section 4 answer the third question.

5. Conclusions

To achieve the IMO’s sulphur limits, it is imperative for shipping to remain in compliance by choosing suitable solutions. One of the controversial debates in controlling the ship’s pollution has always been measuring of SOx emission. Proposing and using a voyage expenses-based method (VEM), this paper offered a comparison of the economic performances of three proposed SOx abatement solutions for a VLCC. The paper was structured to answer three main research questions concerning:
  • the indicator for the economic comparison;
  • the CAPEX and OPEX of each solution;
  • the most optimal SOx abatement solution for the target VLCC.
A comparison indicator “EP” was developed, which allows the ship owner to compare the economic performances of the three solutions from a voyage expenses-based perspective. “EP” is expressed as the sum of the additional CAPEX per voyage within the target payback years and the OPEX per voyage includes the fuel costs of three solutions and the operating cost of the scrubber.
To determine EP, the CAPEX of the additional equipment and crew training to traditional design of the VLCC was considered in each solution taken. Moreover, the operating cost of the scrubber as an OPEX was also considered.
The HFO consumption was obtained from the actual operating data of an original referenced VLCC, while the consumptions of LSFO and LNG were calculated using the HFO consumption based on the principle of equal output energy.
In terms of the economy, installing a scrubber is the best choice among the three alternatives discussed. A comparison between using LNG and LSFO shows that the target payback of 6.5 years is a turning point. It is apparent that the advantage of using LNG is prominent after the turning point. While the IMO air pollutant regulations and GHG regulations are considered simultaneously, the advantages of using LNG are obvious.
However, the generalizability of these results is subject to certain limitations. For in-stance, variations in fuel price or initial cost of equipment may change the results of this study. Further research could be undertaken by VEM methodology to explore the eco-nomic impact of using alternative fuel in shipping.

Author Contributions

Conceptualization, H.F.; methodology, H.F. and H.T.; validation, H.E., X.X. and Y.W.; formal analysis, H.F. and H.T.; resources, X.X. and Y.W.; data curation, H.F. and H.T.; writing—original draft preparation, H.F.; writing—review and editing, H.T., H.E., X.X. and Y.W.; supervision, H.E.; project administration, H.F. All authors have read and agreed to the published version of the manuscript.

Funding

This research received no external funding.

Institutional Review Board Statement

Not applicable.

Informed Consent Statement

Not applicable.

Conflicts of Interest

The authors declare no conflict of interest.

Abbreviations

BTUBritish Thermal Unit
CAPEXCapital expenditures
CARBCalifornia’s air resources board
CO2Carbon dioxide
DECAsDomestic emission control areas
DWTDeadweight tonnage
ECEuropean Commission
ECAsEmission control areas
EEDIEnergy efficiency design index
EGCSExhaust gas cleaning system
EPEconomic performance
EUEuropean Union
EUREuro (European monetary unit)
FGSSFuel gas supply system
GHGGreenhouse gas
HFOHeavy fuel oil
IFOIntermediate fuel oil
IMOThe International Maritime Organization
IMO IGF CodeThe International Code of Safety for Ships using Gases or other Low-flashpoint Fuels
IRRInternal rate of return
LNGLiquified natural gas
LSFOLow-sulphur fuel oil
MARPOLThe International Convention for the Prevention of Pollution from Ships
MCRMaximum continuous rating
MEPCMarine environment protection committee
MGO Marine gas oil
NOxNitrogen oxide
NPVNet present value
OPEXOperating expense
PMParticulate matter
RQResearch question
SCRSelective catalytic reduction
SECAsSulphur emission control areas
SOxSulphur oxides
TEUTwenty-foot equivalent unit
USUnited States
USDUnited States dollar
VEMVoyage expenses-based method
VLCCVery large crude carrier
Symbols
C Additional capital expenditures (CAPEX) per voyage within the target payback years
C F Conversion factor between fuel consumption and CO2 emission
C S c r u b b e r   i n s t a l l a t i o n Cost of installation and commissioning of scrubber
C S c r u b b e r   u n i t Cost of scrubber
E P Indicator of the economic performance
H F O c o n s u m p t i o n Consumption of HFO
I I Initial investment
L N G c o n s u m p t i o n Consumption of LNG
L S F O c o n s u m p t i o n Consumption of LSFO
n Targeted payback years
O Operating expense (OPEX)
P 75% of rated installed power (MCR) for each main engine
P M G O Price of MGO
P H F O Price of HGO
P L S F O Price of LSFO
R Discount rate
S F C Specific fuel consumption

References

  1. Dore, A.J.; Vieno, M.; Tang, Y.S.; Dragosits, U.; Dosio, A.; Weston, K.J.; Sutton, M.A. Modelling the atmospheric transport and deposition of sulphur and nitrogen over the United Kingdom and assessment of the influence of SO2 emissions from international shipping. Atmos. Environ. 2007, 41, 2355–2367. [Google Scholar] [CrossRef] [Green Version]
  2. Smith, S.J.; Van Aardenne, J.; Klimont, Z.; Andres, R.J.; Volke, A.; Arias, S.D. Anthropogenic sulfur dioxide emissions: 1850–2005. Atmos. Chem. Phys. Discuss. 2011, 11, 1101–1116. [Google Scholar] [CrossRef] [Green Version]
  3. Eyring, V.; Köhler, H.W.; Van Aardenne, J.; Lauer, A. Emissions from international shipping: 1. The last 50 years. J. Geophys. Res. Space Phys. 2005, 110, 171–182. [Google Scholar] [CrossRef]
  4. Endresen, Ø.; Sørgård, E.; Sundet, J.K.; Dalsøren, S.B.; Isaksen, I.S.A.; Berglen, T.F.; Gravir, G. Emission from international sea transportation and environmental impact. J. Geophys. Res. Space Phys. 2003, 108. [Google Scholar] [CrossRef]
  5. Bouman, E.A.; Lindstad, E.; Rialland, A.I.; Strømman, A.H. State-of-the-art technologies, measures, and potential for reducing GHG emissions from shipping—A review. Transp. Res. Part D Transp. Environ. 2017, 52, 408–421. [Google Scholar] [CrossRef]
  6. IMO. Reduction of GHG Emissions from Ships—Third IMO GHG Study 2014—Final Report; International Maritime Organization: London, UK, 2015. [Google Scholar]
  7. Chen, D.; Zhao, Y.; Nelson, P.; Li, Y.; Wang, X.; Zhou, Y.; Lang, J.; Guo, X. Estimating ship emissions based on AIS data for port of Tianjin, China. Atmos. Environ. 2016, 145, 10–18. [Google Scholar] [CrossRef]
  8. Li, C.; Yuan, Z.; Ou, J.; Fan, X.; Ye, S.; Xiao, T.; Shi, Y.; Huang, Z.; Ng, S.K.; Zhong, Z.; et al. An AIS-based high-resolution ship emission inventory and its uncertainty in Pearl River Delta region, China. Sci. Total Environ. 2016, 573, 1–10. [Google Scholar] [CrossRef] [PubMed]
  9. Liu, T.K.; Chen, Y.S.; Chen, Y.T. Utilization of vessel automatic identification system (AIS) to estimate the emission of air pollutant from merchant vessels in the port of Kaohsiung. Aerosol Air Qual. Res. 2019, 19, 2341–2351. [Google Scholar] [CrossRef]
  10. Ekmekçioğlu, A.; Kuzu, S.L.; Ünlügençoğlu, K.; Çelebi, U.B. Assessment of shipping emission factors through monitoring and modelling studies. Sci. Total Environ. 2020, 743, 140742. [Google Scholar] [CrossRef] [PubMed]
  11. Zhang, Y.; Yang, X.; Brown, R.; Yang, L.; Morawska, L.; Ristovski, Z.; Fu, Q.; Huang, C. Shipping emissions and their impacts on air quality in China. Sci. Total Environ. 2017, 581-582, 186–198. [Google Scholar] [CrossRef] [PubMed]
  12. Mao, J.; Zhang, Y.; Yu, F.; Chen, J.; Sun, J.; Wang, S.; Zou, Z.; Zhou, J.; Yu, Q.; Ma, W.; et al. Simulating the impacts of ship emissions on coastal air quality: Importance of a high-resolution emission inventory relative to cruise- and land-based observations. Sci. Total Environ. 2020, 728, 138454. [Google Scholar] [CrossRef] [PubMed]
  13. Russo, M.; Leitão, J.; Gama, C.; Ferreira, J.; Monteiro, A. Shipping emissions over Europe: A state-of-the-art and comparative analysis. Atmos. Environ. 2018, 177, 187–194. [Google Scholar] [CrossRef]
  14. Miola, A.; Ciuffo, B.; Giovine, E.; Marra, M. Regulating Air Emissions from Ships: The State of the Art on Methodologies, Technologies and Policy Options; JRC: Luxembourg, 2010. [Google Scholar]
  15. IMO. Annex VI Prevention of Air Pollution from Ships of International Convention for the Prevention of Pollution from Ships (MARPOL); International Maritime Organization: London, UK, 2005. [Google Scholar]
  16. Lindstad, H.E.; Rehn, C.F.; Eskeland, G.S. Sulphur abatement globally in maritime shipping. Transp. Res. Part D Transp. Environ. 2017, 57, 303–313. [Google Scholar] [CrossRef] [Green Version]
  17. Jang, H.; Jeong, B.; Zhou, P.; Ha, S.; Nam, D.; Kim, J.; Lee, J.-U. Development of Parametric Trend Life Cycle Assessment for marine SOx reduction scrubber systems. J. Clean. Prod. 2020, 272, 122821. [Google Scholar] [CrossRef]
  18. European Union. Directive 2005/33/EC of the European parliament and of the council. Off. J. Eur. Union 2005, 191, 60–65. [Google Scholar]
  19. CARB. Marine Notice 2013-1 Advisory to Owners or Operators of Ocean-Going Vessels Visiting California Ports; California Air Resources Board: Sacramento, CA, USA, 2013. [Google Scholar]
  20. Ministry of Transport of the People’s Republic of China. Implementation Scheme of the Domestic Emission Control Areas for Atmospheric Pollution from Vessels; Ministry of Transport of the People’s Republic of China: Beijing, China, 2018.
  21. Kim, A.-R.; Seo, Y.-J. The reduction of SOx emissions in the shipping industry: The case of Korean companies. Mar. Policy 2019, 100, 98–106. [Google Scholar] [CrossRef]
  22. DNVGL. Global Sulphur Cap 2020: Get Insights on Compliance Options and Implications for Shipping. 2019. Available online: https://www.dnvgl.com/publications/global-sulphur-cap-2020-updated-in-2019--84567 (accessed on 1 December 2020).
  23. Clarksons. World Fleet Register; Clarksons Research: London, UK, 2020. [Google Scholar]
  24. Jiang, L.; Kronbak, J.; Christensen, L.P. The costs and benefits of sulphur reduction measures: Sulphur scrubbers versus marine gas oil. Transp. Res. Part D Transp. Environ. 2014, 28, 19–27. [Google Scholar] [CrossRef]
  25. Panasiuk, I.; Turkina, L. The evaluation of investments efficiency of SOx scrubber installation. Transp. Res. Part D Transp. Environ. 2015, 40, 87–96. [Google Scholar] [CrossRef]
  26. Adachi, M.; Kosaka, H.; Fukuda, T.; Ohashi, S.; Harumi, K. Economic analysis of trans-ocean LNG-fueled container ship. J. Mar. Sci. Technol. 2014, 19, 470–478. [Google Scholar] [CrossRef]
  27. Livanos, G.; Theotokatos, G.; Dimitrios‑Nikolaos, P. Techno-economical investigation of alternative propulsion concepts of ferries operating in mediterranean sea—Introduction of LNG as alternative fuel. In Proceedings of the 3rd International Conference on Contemporary Problems of Thermal Engineering, Gliwice, Poland, 18–20 February 2013. [Google Scholar]
  28. Tzannatos, E.; Papadimitriou, S.; Koliousis, I. A Techno-Economic Analysis of Oil vs. Natural Gas Operation for Greek Island Ferries. Int. J. Sustain. Transp. 2014, 9, 272–281. [Google Scholar] [CrossRef]
  29. Ge, J.; Wang, X. Techno-economic study of LNG diesel power (dual fuel) ship. WMU J. Marit. Aff. 2017, 16, 233–245. [Google Scholar] [CrossRef]
  30. Zhao, Y.; Fan, Y.; Fagerholt, K.; Zhou, J. Reducing sulfur and nitrogen emissions in shipping economically. Transp. Res. Part D Transp. Environ. 2021, 90, 102641. [Google Scholar] [CrossRef]
  31. Schinas, O.; Butler, M. Feasibility and commercial considerations of LNG-fueled ships. Ocean Eng. 2016, 122, 84–96. [Google Scholar] [CrossRef]
  32. Lee, H.-J.; Yoo, S.-H.; Huh, S.-Y. Economic benefits of introducing LNG-fuelled ships for imported flour in South Korea. Transp. Res. Part D Transp. Environ. 2020, 78, 102220. [Google Scholar] [CrossRef]
  33. Jin, L. A Case Study: Technical Feasibility and Economic Potentials of Using LNG as Alternative Marine Fuel. Master’s Thesis, School of Engineering and Mathematical Science, City University of London, London, UK, 2012. [Google Scholar]
  34. Wu, Y.-H.; Hua, J.; Chen, H.-L. Economic Feasibility of an Alternative Fuel for Sustainable Short Sea Shipping: Case of Cross-Taiwan Strait Transport. In Proceedings of the 4th World Congress on New Technologies, Madrid, Spain, 19–21 August 2018. [Google Scholar]
  35. Peksen, D.; Alkan, G.; Bayar, S.; Yildiz, M.; Elmas, G. LNG as ship fuel for SOX emission reduction target in the Sea of marmara. Fresenius Environ. Bull. 2016, 25, 1406–1419. [Google Scholar]
  36. Dimitrakiev, D.; Gunes, E. An empirical assessment of the chemical tanker investments. Int. J. Sci. Technol. Res. 2020, 9, 6025–6031. [Google Scholar]
  37. Meana-Fernández, A.; Peris-Pérez, B.; Gutiérrez-Trashorras, A.J.; Rodríguez-Artime, S.; Ríos-Fernández, J.C.; González-Caballín, J.M. Optimization of the propulsion plant of a Liquefied Natural Gas transport ship. Energy Convers. Manag. 2020, 224, 113398. [Google Scholar] [CrossRef]
  38. Searoutes. Distance Calculator, Weather Routing & Voyage Planning. 2020. Available online: https://classic.searoutes.com (accessed on 1 December 2020).
  39. Rusu, L.I. Economic Efficiency of Sea Transport. Case Study: Constanţa—Galaţi. Procedia Econ. Financ. 2015, 32, 1598–1607. [Google Scholar] [CrossRef] [Green Version]
  40. Jia, P.; Sun, X.; Yang, Z. Optimization Research of Refueled Scheme Based on Fuel Price Prediction of the Voyage Charter. J. Transp. Syst. Eng. Inf. Technol. 2012, 12, 110–116. [Google Scholar] [CrossRef]
  41. SHELL. Shell LNG Outlook 2020. 2020. Available online: https://www.shell.com/energy-and-innovation/natural-gas/liquefied-natural-gas-lng/lng-outlook-2020.html (accessed on 1 December 2020).
  42. World Bank. World Bank Commodities Price Forecast. 2019. Available online: http://pubdocs.worldbank.org/en/598821555973008624/CMO-April-2019-Forecasts.pdf (accessed on 1 December 2020).
  43. EIA. Long-Term Brent Crude Oil Price Projection. 2020. Available online: https://knoema.com/infographics/yxptpab/crude-oil-price-forecast-2020-2021-and-long-term-to-2030 (accessed on 1 December 2020).
  44. Schieldrop, B. IMO 2020 Report. 2018, Macro & FICC Research; Skandinaviska Enskilda Banken AB Publication: Stockholm, Sweden, 2018. [Google Scholar]
  45. Aabo, K.; Røjgaard, C. Fuel 2020. CIMAC. 2018. Available online: https://www.cimac.com/cms/upload/events/circles/circle_2018_SMM/CIMAC_Circle_SMM_2018.pdf (accessed on 3 November 2020).
  46. BP. Technical Guide for 0.50% Sulphur Marine Fuel. 2018. Available online: https://www.bp.com/content/dam/bp/business-sites/en/global/bp-global-energy-trading/documents/what-we-do/marine/marpol-technical-guide-oct-2018.pdf (accessed on 3 November 2020).
  47. Hatzigrigoris, S.; Liadis, P. Scrubber Technologies-Will an Investment in Scrubbers Pay Back? 2017. Available online: http://conference12.diorama.gr/images/presentations/Stavros-Hatzigrigoris---Maran-Tankers.pdf (accessed on 3 November 2020).
  48. Prabheesh, K.; Padhan, R.; Garg, B. COVID-19 and the Oil Price—Stock Market Nexus: Evidence from Net Oil-Importing Countries. Energy Res. Lett. 2020, 1, 13745. [Google Scholar] [CrossRef]
  49. Huan, T.; Hongjun, F.; Wei, L.; Guoqiang, Z.; Tu, H. Options and Evaluations on Propulsion Systems of LNG Carriers. In Propulsion Systems; IntechOpen: London, UK, 2019. [Google Scholar]
  50. Ott, M. WinGD X-DF: The Leading Solution for LNG Propulsion; Winterthur Gas & Diesel (Shanghai) Co. Ltd.: Wuxi, China, 2019. [Google Scholar]
  51. Madsen, S.; Olsson, T.C. Cost-Efficient Emission Control Area Compliancy; Department of Marine Technology, Norwegian University of Science and Technology: Trondheim, Norway, 2012. [Google Scholar]
  52. Van Rynbach, E.A.; Briers, K.E.; DelGatto, N. Analysis of Fuel Alternatives for Commercial Ships in the ECA Era. Herbert Engineering Corp. 2015. Available online: https://www.semanticscholar.org/paper/Analysis-of-Fuel-Alternatives-for-Commercial-Ships-Rynbach-Briers/03ca549244677e1a0351651c479a137e6070c532 (accessed on 3 November 2020).
  53. WINGD. Low-Speed Engines 2021. 2021. Available online: https://www.wingd.com/en/documents/general/brochures/wingd-low-speed-engines-booklet-2021/ (accessed on 3 January 2021).
  54. IMO. Guidelines on the Method of Calculation of the Attained Energy Efficiency Design Index (EEDI) for New Ships; International Maritime Organization: London, UK, 2018. [Google Scholar]
  55. Yiping, M.; Xiangming, Z.; Haijun, W.; Rui, Z.; Zhongcheng, W.; Leping, X. Current Development Situation of Marine LNG Fueled Engines Both at Home and Abroad. Navig. China 2016, 39, 20–25. [Google Scholar]
  56. Attah, E.E.; Bucknall, R.W.G. An analysis of the energy efficiency of LNG ships powering options using the EEDI. Ocean Eng. 2015, 110, 62–74. [Google Scholar] [CrossRef]
  57. ISO. ISO 8217:2017 Petroleum Products—Fuels (Class F)—Specifications of Marine Fuels; International Organization for Standardization: Geneva, Switzerland, 2017. [Google Scholar]
  58. IMO. Reduction of GHG Emissions from Ships—Fourth IMO GHG Study 2020—Final Report; International Maritime Organization: London, UK, 2020. [Google Scholar]
  59. IMO. Initial IMO Strategy on Reduction of GHG Emissions from Ships; MEPC: London, UK, 2018. [Google Scholar]
  60. IMO. Amendments to the Annex of the Protocol of 1997 to Amend the International Convention for the Prevention of Pollution from Ships, 1973, as Modified by the Protocol of 1978 Relating Thereto; MEPC: London, UK, 2011. [Google Scholar]
  61. Ren, H.; Ding, Y.; Sui, C. Influence of EEDI (Energy Efficiency Design Index) on Ship–Engine–Propeller Matching. J. Mar. Sci. Eng. 2019, 7, 425. [Google Scholar] [CrossRef] [Green Version]
  62. IMO. Draft Report of the Marine Environment Protection Committee on its Seventy-Fifth Session; International Maritime Organization: London, UK, 2020. [Google Scholar]
  63. Li, J.; Han, Y.; Mao, G.; Wang, P. Optimization of exhaust emissions from marine engine fueled with LNG/diesel using response surface methodology. Energy Sources Part A Recover. Util. Environ. Eff. 2019, 42, 1436–1448. [Google Scholar] [CrossRef]
  64. Jafarzadeh, S.; Paltrinieri, N.; Utne, I.B.; Ellingsen, H. LNG-fuelled fishing vessels: A systems engineering approach. Transp. Res. Part D Transp. Environ. 2017, 50, 202–222. [Google Scholar] [CrossRef]
  65. Kumar, S.; Kwon, H.-T.; Choi, K.-H.; Lim, W.; Cho, J.H.; Tak, K.; Moon, I. LNG: An eco-friendly cryogenic fuel for sustainable development. Appl. Energy 2011, 88, 4264–4273. [Google Scholar] [CrossRef]
  66. OECD. Fuelling Maritime Shipping with Liquefied Natural Gas: The Case of Japon; Organisation for Economic Co-Operation and Development: Paris, France, 2018. [Google Scholar]
  67. IMO. Studies on the Feasibility and Use of LNG as a Fuel for Shipping. In Air Pollution and Energy Efficiency Study; Series 3; International Maritime Organization: London, UK, 2016. [Google Scholar]
  68. Arefin, M.A.; Nabi, M.N.; Akram, M.W.; Islam, M.T.; Chowdhury, M.W. A Review on Liquefied Natural Gas as Fuels for Dual Fuel Engines: Opportunities, Challenges and Responses. Energies 2020, 13, 6127. [Google Scholar] [CrossRef]
Figure 1. Sulphur content limits and implementation dates.
Jmse 09 00221 g001
Figure 2. SOx abatement solutions application on contracted numbers of ships worldwide (2018–2020).
Jmse 09 00221 g002
Figure 3. Shipping route of the VLCC.
Jmse 09 00221 g003
Figure 4. Arrangement of LNG fuel tanks on the VLCC.
Jmse 09 00221 g004
Figure 5. Structure of the proposed VEM.
Jmse 09 00221 g005
Figure 6. Prediction of price of LNG bunkering in East Asia.
Jmse 09 00221 g006
Figure 7. Regression for the price of HFO and MGO based on Brent Crude Oil Price.
Jmse 09 00221 g007
Figure 8. Prediction of LSFO price.
Jmse 09 00221 g008
Figure 9. Total initial investment on equipment for solution A.
Jmse 09 00221 g009
Figure 10. Values of EP for three proposed solutions.
Jmse 09 00221 g010
Figure 11. Trends of EP for five scenarios.
Jmse 09 00221 g011
Table 1. Contracted numbers of newbuilding ships worldwide (2018–2020).
YearNumbers of Ships
20181965
20191539
2020704
Table 2. Parameters of the VLCC.
ParameterValueUnit
Basic dataMaximum deadweight (DWT)318,000tons
Length between perpendiculars319.00m
Breath mid.58.00m
Depth30.00m
Design draught19.83m
Design speed15.50knots
Economical speed12.5knots
Round trip voyage 43days
Solution ARated power of dual fuel main engine 25,000 kW
Rated power of dual fuel generator sets3 × 1400kW
Fuel consumption of dual fuel boilers140ton/voyage
Supply pressure of the FGSS5~16bar
Capacity of LNG tanks2 × 3500m3
Solution B and CMain engine rated power25,360 kW
Table 3. Fuel consumption data of the referenced design VLCC.
Laden, Tons/DayBallast, Tons/Day
Speed (knots)Main Engine 1Auxiliary EnginesMain Engine 1Auxiliary Engines
10.0345.8285.8
10.5385.8315.8
11.0415.8375.8
11.5465.8425.8
12.0504.5444.5
12.5574.5504.5
13.0604.5534.5
13.5654.5584.5
14.0714.5624.5
14.5784.5664.5
15.0834.5754.5
15.5884.5814.5
1 Engine type: MAN B&W 7S80ME-C9.2, the main engine rated power is 25,360 kW.
Table 4. Economic performance of three solutions based on target payback period of 6 years.
ParameterValue
Solution ASolution BSolution C
Economical speed (knots)12.512.512.5
Fuel consumption per day, main engine (Laden, tons)48.857.054.0
Fuel consumption per day, main engine (Ballast, tons)42.850.047.4
Fuel consumption per day, auxiliary engine (tons)4.55.65.3
Fuel consumption per voyage, boilers (tons)132.7165.0156.4
Sailing per voyage (days)38.038.038.0
In ports per voyage (days)5.05.05.0
Voyages per year8.08.08.0
Fuel consumption per voyage (tons)2042.92410.82285.4
Average fuel price for 2022–2027 (USD)517.4400.6637.1
Fuel cost per voyage (USD)1,056,985.8965,766.51,456,020.6
Operating cost per voyage for the scrubber (USD)0.0 69,385.0 10.0
Additional initial investment on equipment (USD)17,000,000.04,000,000.00.0
Additional cost of crew training (USD)18,4000.00.0
Total additional initial investment (USD)17,018,400.04,000,000.00.0
Annualized additional CAPEX (USD)3,460,906.6813,450.50.0
C (USD)432,613.3101,681.30.0
O (USD)1,056,985.81,035,151.41,456,020.6
EP (USD)1,489,599.11,136,832.81,456,020.6
1 The rated power of the main engine is 25,360 kW.
Table 5. Reduction factors of required EEDI for tankers.
PhasePeriodReduction Factor
01 Jan. 2013–31 Dec. 20140%
11 Jan. 2015–31 Dec. 201910%
21 Jan. 2020–31 Dec. 202420%
31 Jan. 2025 and onwards30%
Table 6. Potential EEDI reductions for three solutions.
SolutionFuel Type C F S F C   ( g / kWh )   1 C F × S F C RelativeReduction
ALNG2.750152.077418.21180.4%19.6%
BHFO3.114167.000 2520.038100%/
CLSFO3.195 3167.046533.712102.6%−2.6%
1 The SFCs of LSFO and LNG are calculated based on the Equations (7) and (8).; 2 This value is quoted from the engine manual.; 3 This value is calculated by using the C F of HFO and MGO based on the blending ratio.
Publisher’s Note: MDPI stays neutral with regard to jurisdictional claims in published maps and institutional affiliations.

