
Physical Modelling of the Effect on the Wave Field of the WaveCat Wave Energy Converter


1
COAST Engineering Research Group, University of Plymouth, Plymouth PL4 8AA, UK
2
MaREI, Environmental Research Institute, School of Engineering, University College Cork, T12 K8AF Cork, Ireland
*
Author to whom correspondence should be addressed.
J. Mar. Sci. Eng. 2021, 9(3), 309; https://0-doi-org.brum.beds.ac.uk/10.3390/jmse9030309
Submission received: 31 January 2021
/
Revised: 8 March 2021
/
Accepted: 9 March 2021
/
Published: 11 March 2021
(This article belongs to the Special Issue Selected Papers from the 7th PRIMaRE Conference 2020)
Abstract
:The WaveCat is a moored Wave Energy Converter design which uses wave overtopping discharge into a variable v-shaped hull, to generate electricity through low head turbines. Physical model tests of WaveCat WEC were carried out to determine the device reflection, transmission, absorption and capture coefficients based on selected wave conditions. The model scale was 1:30, with hulls of 3 m in length, 0.4 m in height and a freeboard of 0.2 m. Wave gauges monitored the surface elevation at discrete points around the experimental area, and level sensors and flowmeters recorded the amount of water captured and released by the model. Random waves of significant wave height between 0.03 m and 0.12 m and peak wave periods of 0.91 s to 2.37 s at model scale were tested. The wedge angle of the device was set to 60°. A reflection analysis was carried out using a revised three probe method and spectral analysis of the surface elevation to determine the incident, reflected and transmitted energy. The results show that the reflection coefficient is highest (0.79) at low significant wave height and low peak wave period, the transmission coefficient is highest (0.98) at low significant wave height and high peak wave period, and absorption coefficient is highest (0.78) when significant wave height is high and peak wave period is low. The model also shows the highest Capture Width Ratio (0.015) at wavelengths on the order of model length. The results have particular implications for wave energy conversion prediction potential using this design of device.
1. Introduction
In order to reduce the impact of fossil fuels on our environment, alternative means of energy generation must be considered. Originally the European Union (EU) set out energy generation targets in which member countries were to achieve a percentage of their energy generation from renewable sources by 2020 [1], however since then a new agreement has come into force revising the date to 2030 [2]. After the United Kingdom (UK) left the EU the UK government introduced the Environment Bill [3] outlining targets towards cutting fossil fuel emissions, which is currently before Parliament [4]. One such source of renewable energy is marine renewable energy.
Marine renewable energy is a relatively underutilised area of energy extraction, with potential avenues in offshore wind, tidal stream, tidal range and wave energy available. The estimated worldwide wave energy potential is 17 TWh/year [5] with large concentrations at mid-latitudes, 30° to 60°, which the UK and EU are in prime position to exploit.
Research efforts into wave energy have thus been examining locations which have potential for energy extraction from the wave climate. The energy resource at the site is examined as it can exhibit significant spatial and temporal variation over the local area [6,7,8,9,10,11,12]. The sites economic viability must also be considered [13,14,15] along with the accessibility of the installation for operations and maintenance routines during the installation life-cycle [16,17]. A wave energy converter (WEC) must be suitable for the local conditions both to minimise negative impacts and to efficiently capture energy in a commercially viable manner. Finally, the device must be able to survive at the location it is deployed as the local wave climate will impart wave loading forces to the device, which it must resist [18,19].
WECs are devices that convert the energy contained within ocean waves to a usable form of energy, typically electricity. One such method is that of an overtopping wave energy converter (OWEC), where water is guided into reservoirs in the device and held above still water level. The collected water is released through turbines using the head from the height difference of the bodies of water to generate electricity. Two such devices are the Wave Dragon floating OWEC [20,21,22,23,24,25] and the Sea Slot-cone Generator (SSG) [26,27,28,29]. The Wave Dragon uses wave reflector arms to guide waves into a central reservoir. The Sea Slot-Cone Generator (SSG) is mounted on a breakwater with varying levels of reservoirs into which waves runup and water collected.
When a WEC extracts and converts energy from the wave climate, the wave climate is altered. The effect of a WEC installation on the wave field can be modelled numerically using a wave propagation model [30], or approximated with superpositions of the analytical solutions for monochromatic unidirectional waves [31]. WEC characteristics, in the form of reflection () and transmission () coefficients, can be applied to a wave propagation model to determine the effect of a single or group of devices on the nearshore [32,33,34].
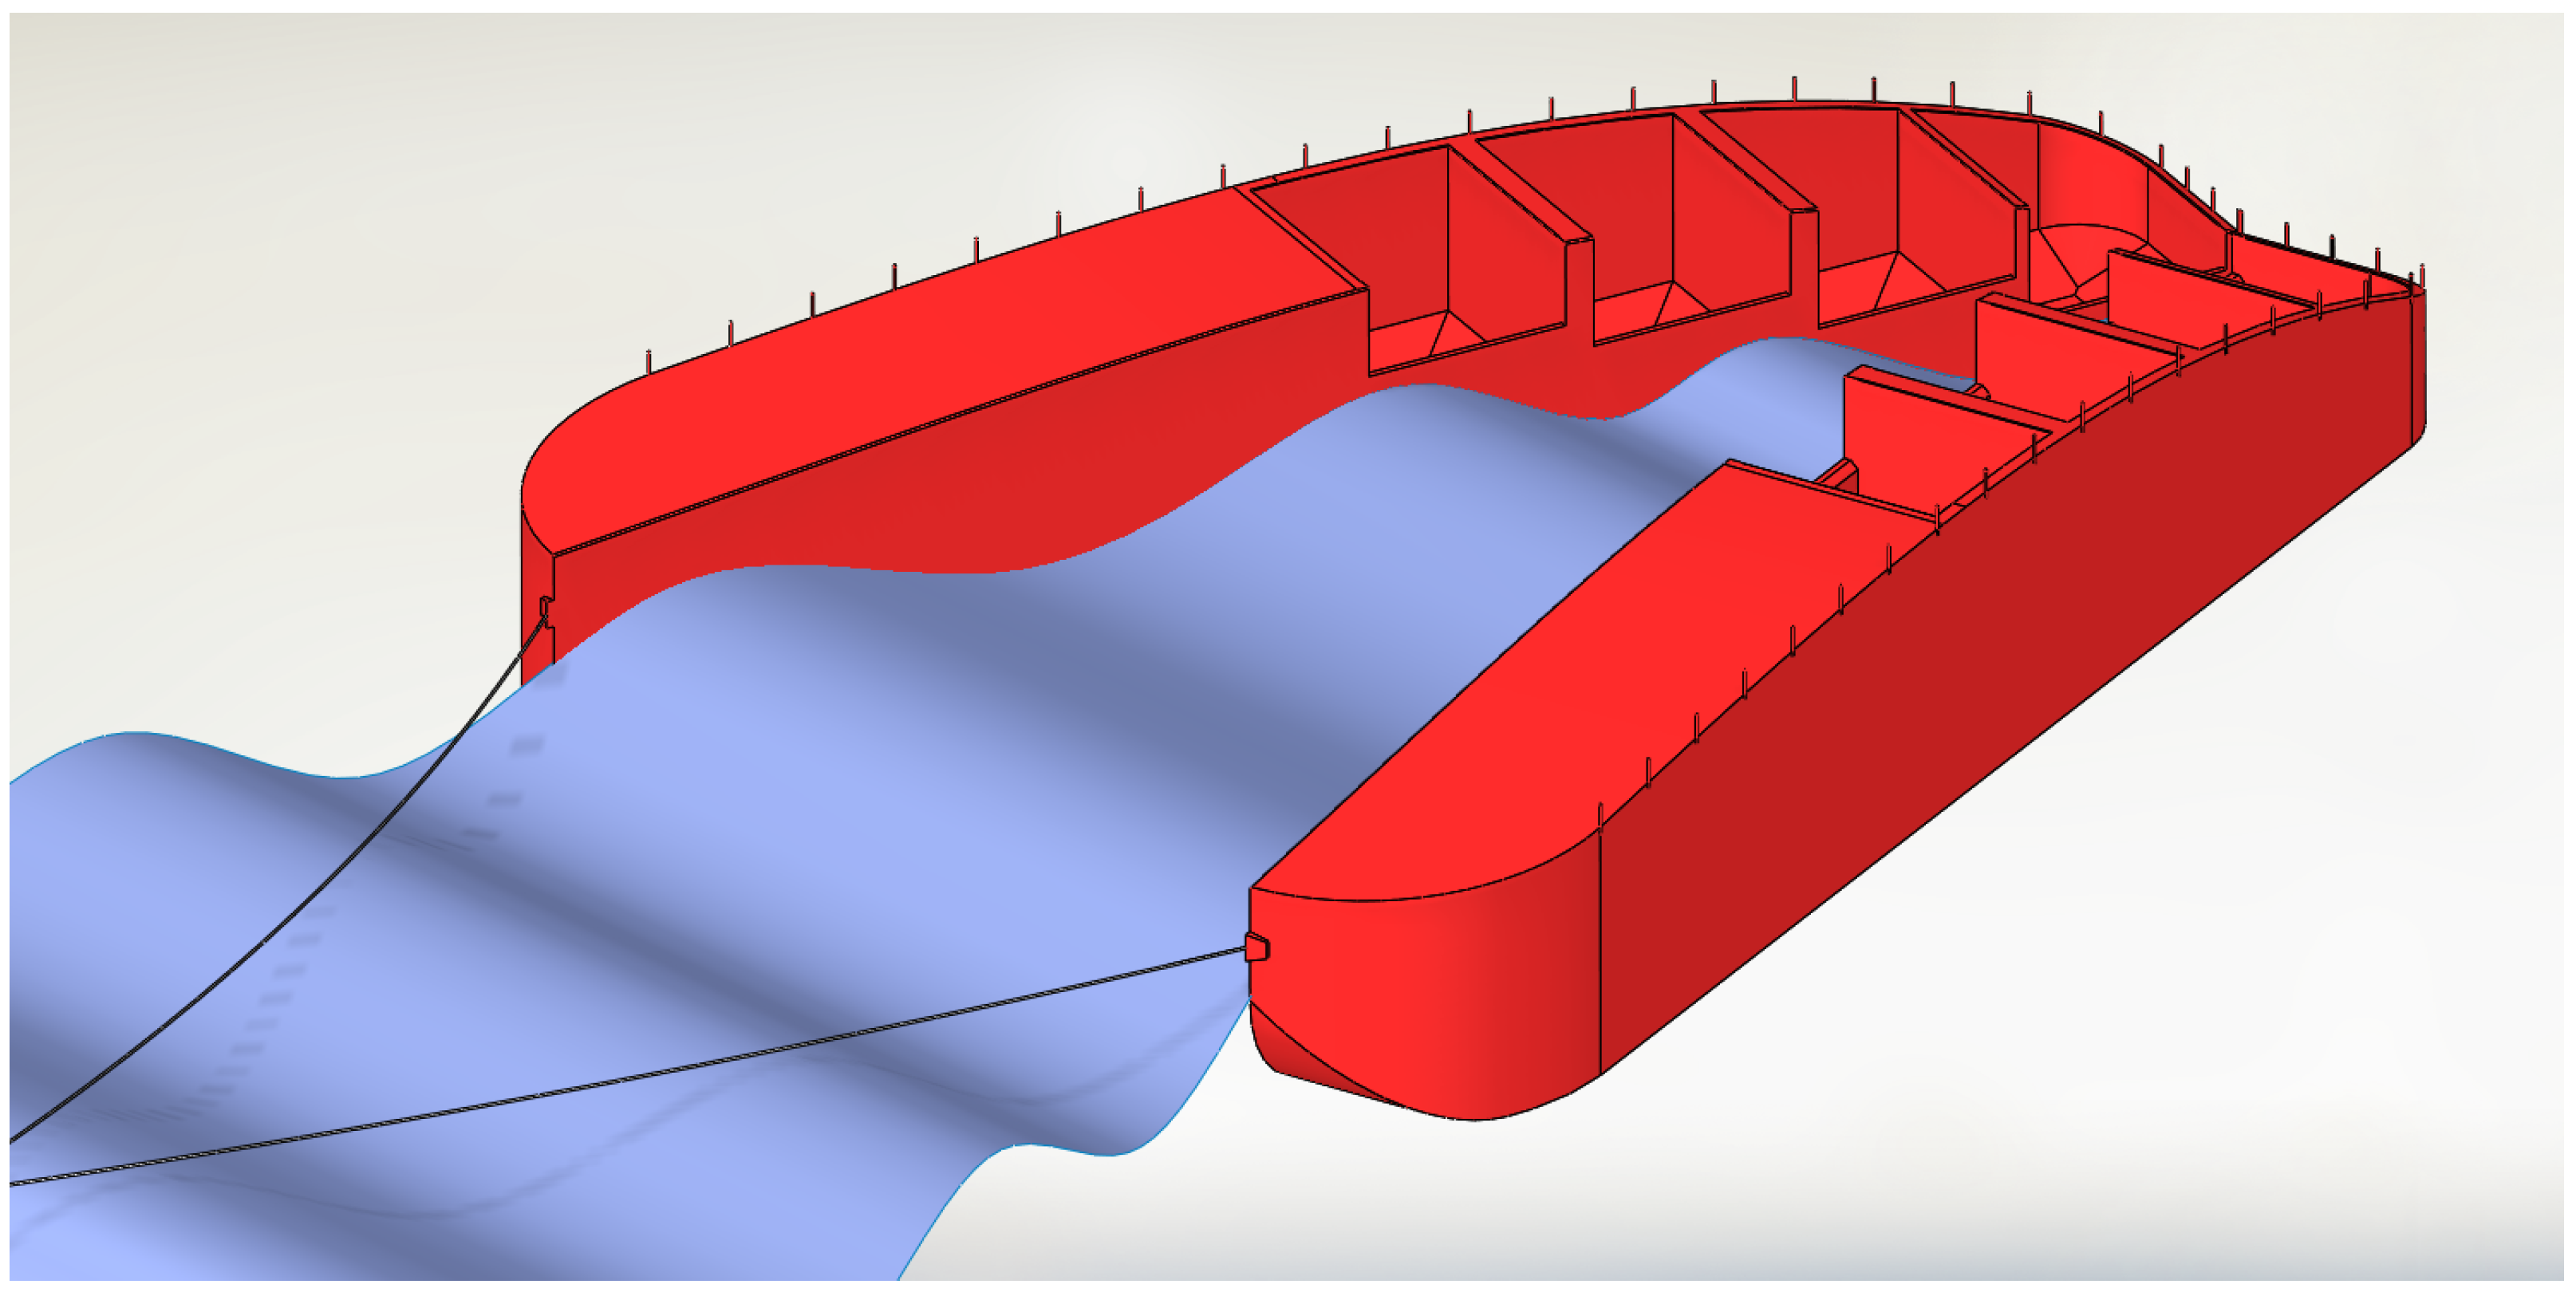
The focus of this article the WaveCat, with the concept drawing shown in Figure 1, is an offshore, floating WEC operating on the principle of oblique overtopping to collect water [35,36]. Waves impinge at an angle along its inner hull before cascading into reservoirs. Two symmetrical hulls are connected via a hinge at the stern of the device, allowing the relative angle between the two hulls to be varied during operation. The draft and trim of the device can be varied through the use of ballast tanks, allowing the device to adapt to seas states and tune the freeboard to spread overtopping volumes across the device collection tanks. The collected water is exhausted through low-head turbines in the base of the tanks to generate electricity. The overall length of the planned prototype is 90 m and it is intended to operate in water depths of 50 m to 100 m. The distance of the device offshore, coupled with the devices low profile will limit visual impact compared to offshore wind farm. The device is intended to be moored via a single point to the seabed, using a Catenary Anchor Leg Mooring (CALM). This allows the device to orient itself along the direction of wave propagation passively, reducing the need for complex systems devoted to maintaining device direction. The survivability of the device is closely linked to the wedge angle (). By reducing the angle to 0°, effectively closing the wedge, the device acts as a single hull body.
This article investigates the reflection and transmission coefficients of the WaveCat WEC across a range of wave conditions, determined through scale physical model experimentation.
2. Materials and Methods
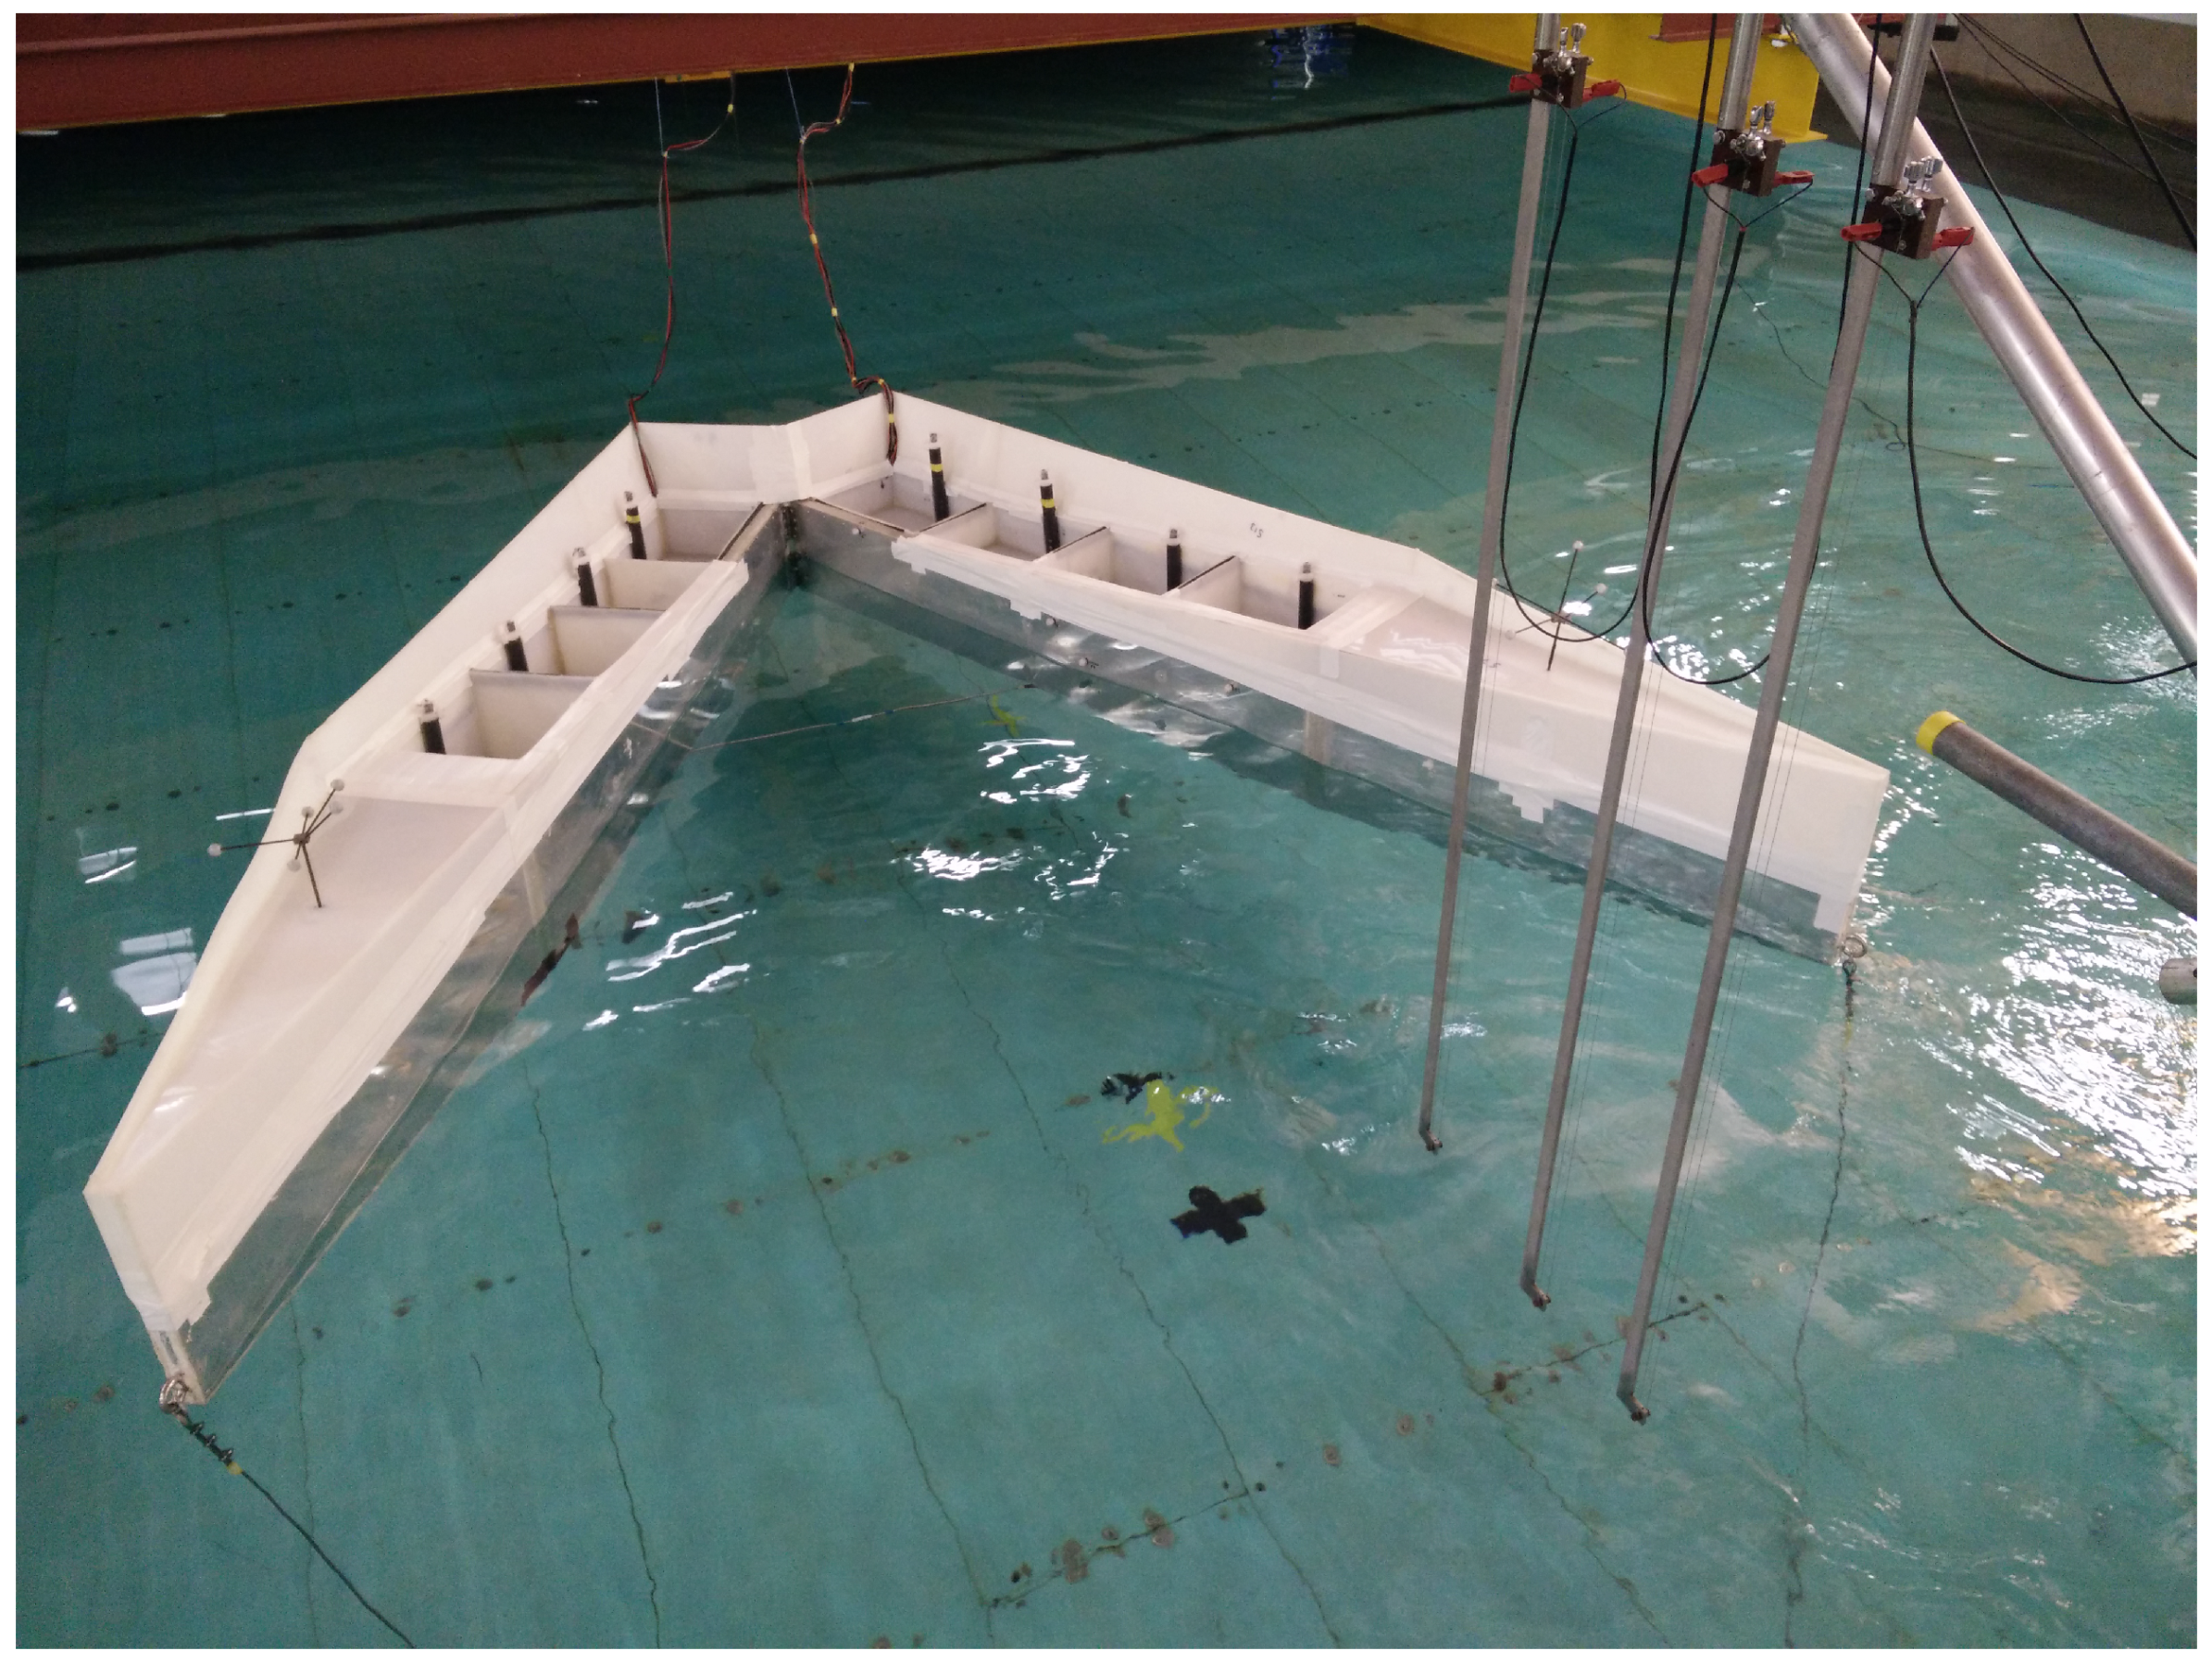
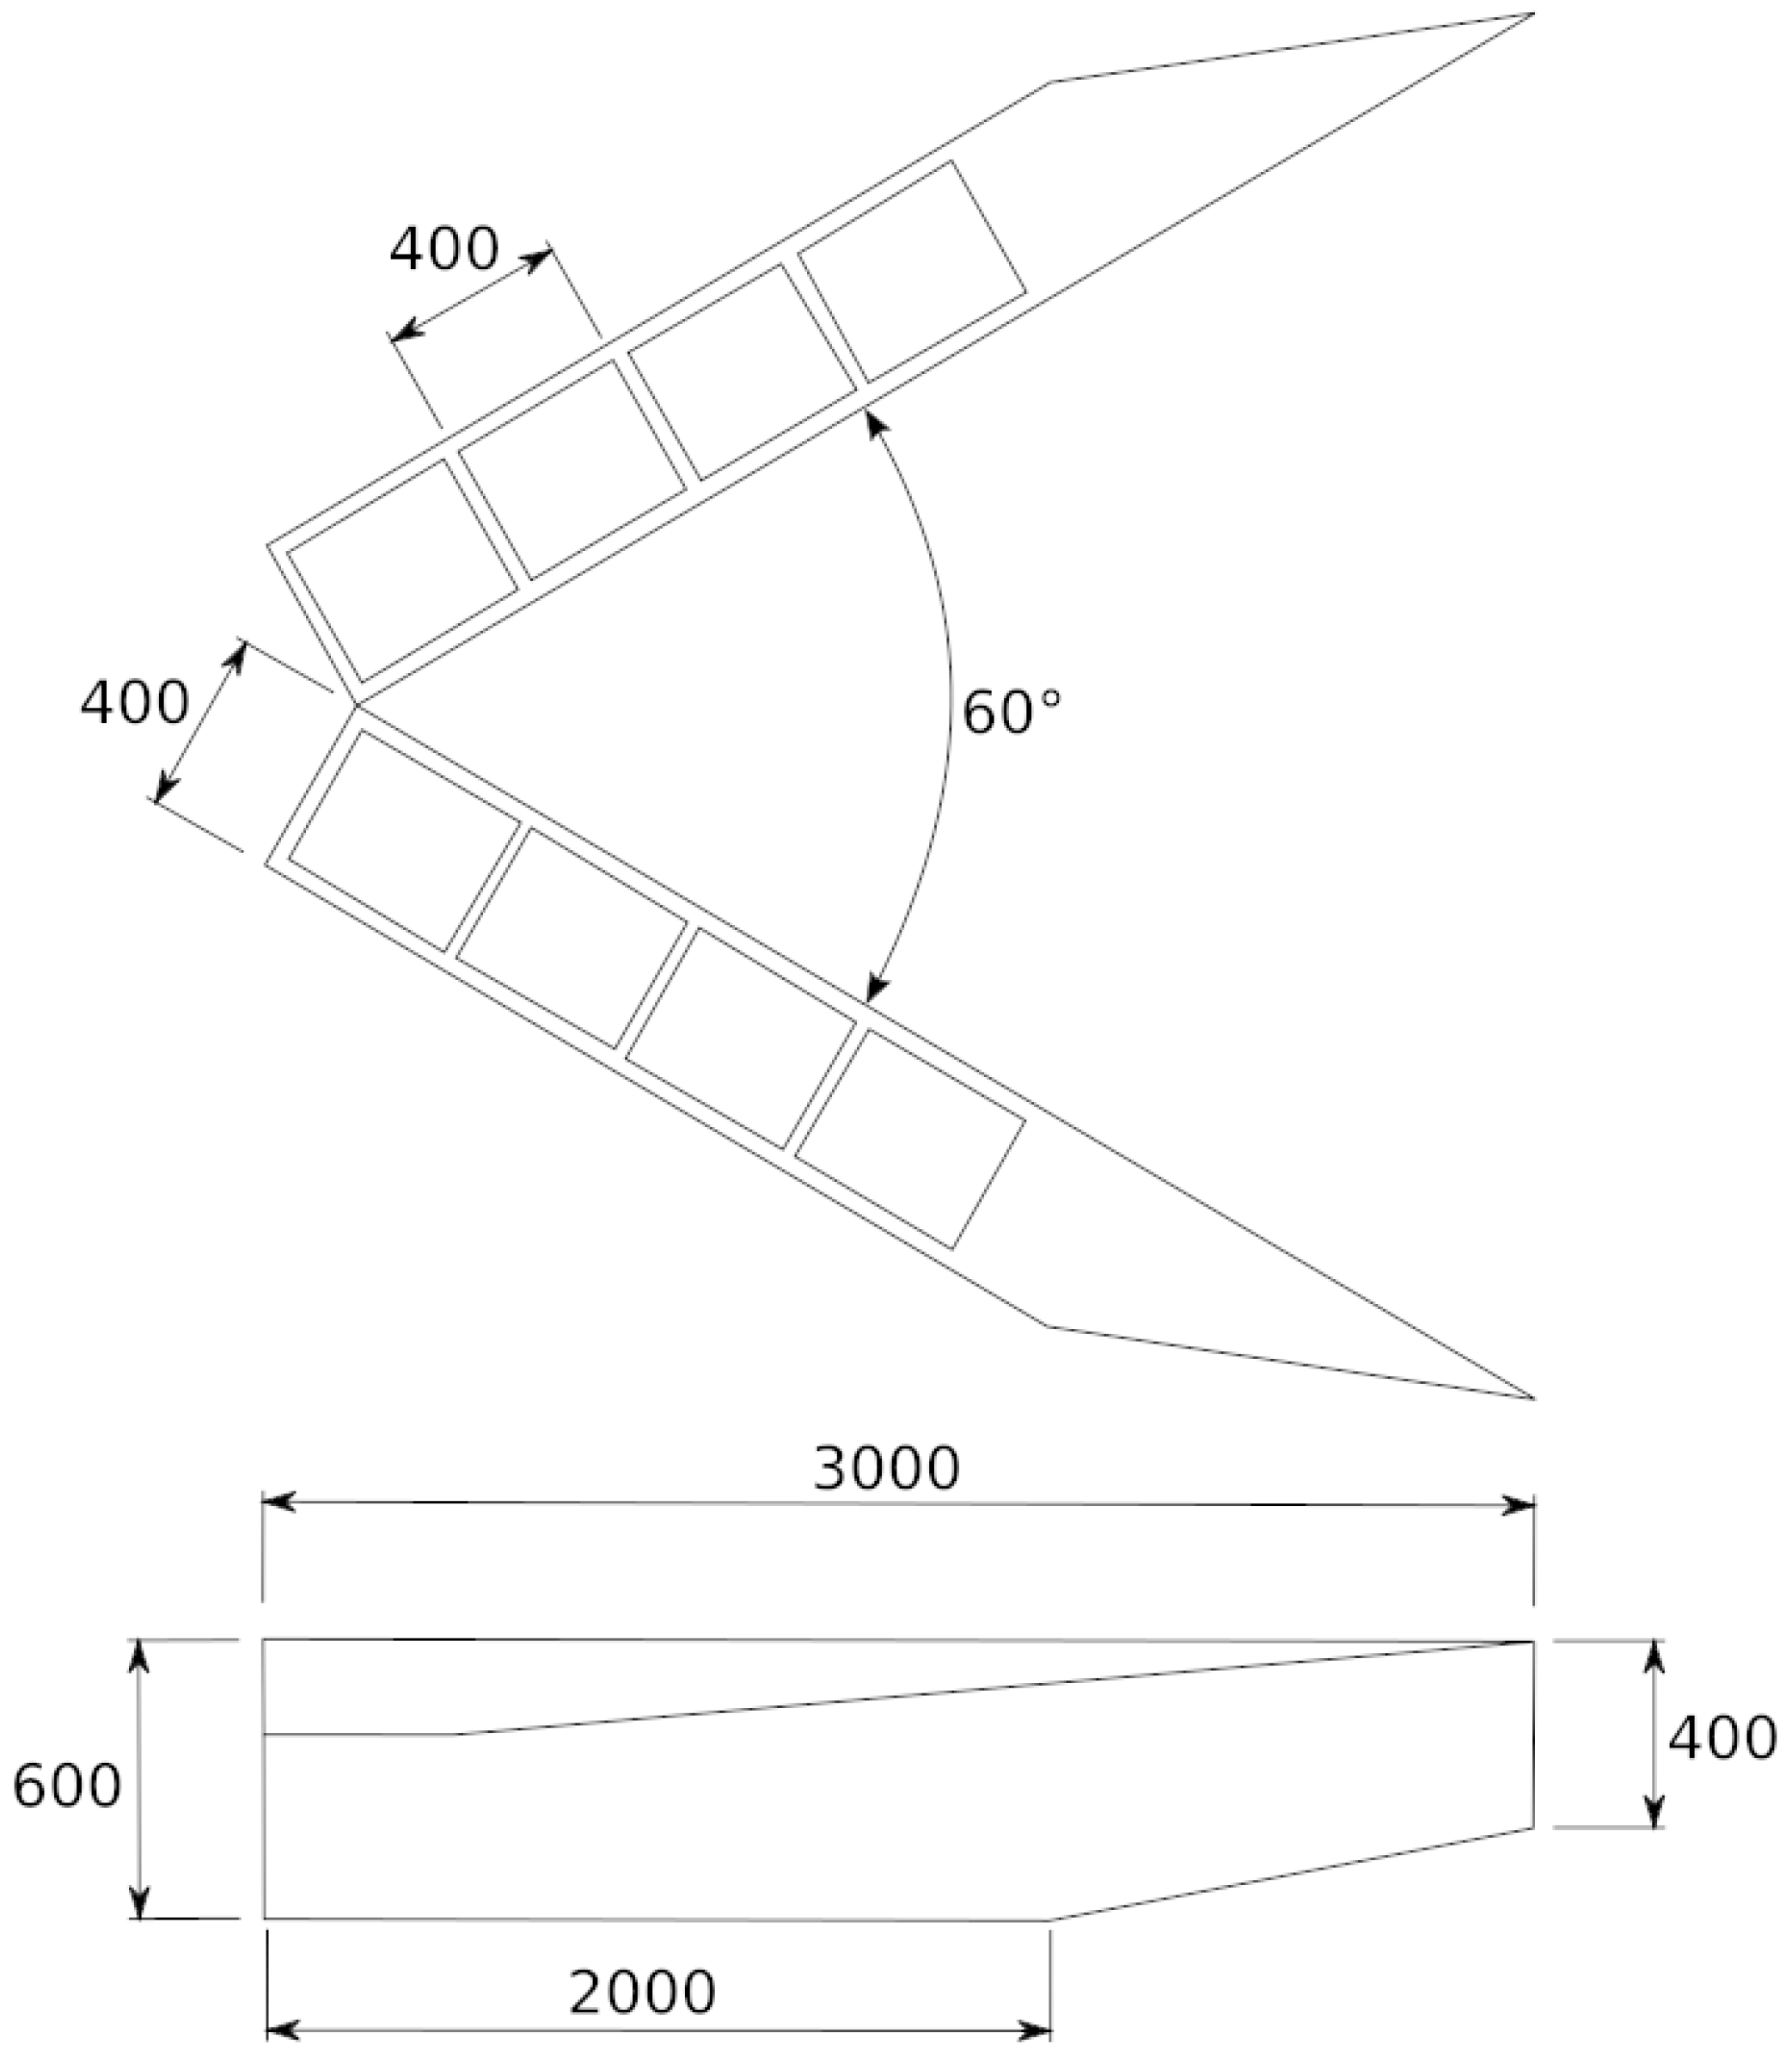
Following initial concept tests of a 1:30 scale model [37] an updated version of the WaveCat model was constructed at the University of Plymouth (UK), at 1:30 scale. See [38] for further details and initial tests on the new model, shown in Figure 2. The model dimensions are shown in Figure 3. The model was given extra ballast, approximately 200 kg, compared to the original model tests in [38]. The trim of the device was also adjusted to sit the nose lower, therefore ensuring a constant freeboard along the inner edge of the device.
Within each overtopping tank a resistance level sensor was mounted in a pipe to control surface oscillations. The pipe was open at the base, equalising the level with the tank whilst blocking surface ripples from overtopping water and limiting sloshing due to device movements. A valve controlled the release of water from each tank to a communal exhaust pipe for each hull, in which a flowmeter was placed to measure the flow simultaneously with the level of each tank. The valve was programmed to release when water reached a certain level in the tank and close when a minimum level was reached. A microcontroller (Arduino Leonardo revision 3) was used to control the valves and allowed modifications when considering which valves to open and close, as well as manual control for a safeguard. The addition of a microcontroller gave a further level of flexibility to the design as it was able to be configured to specific test conditions.
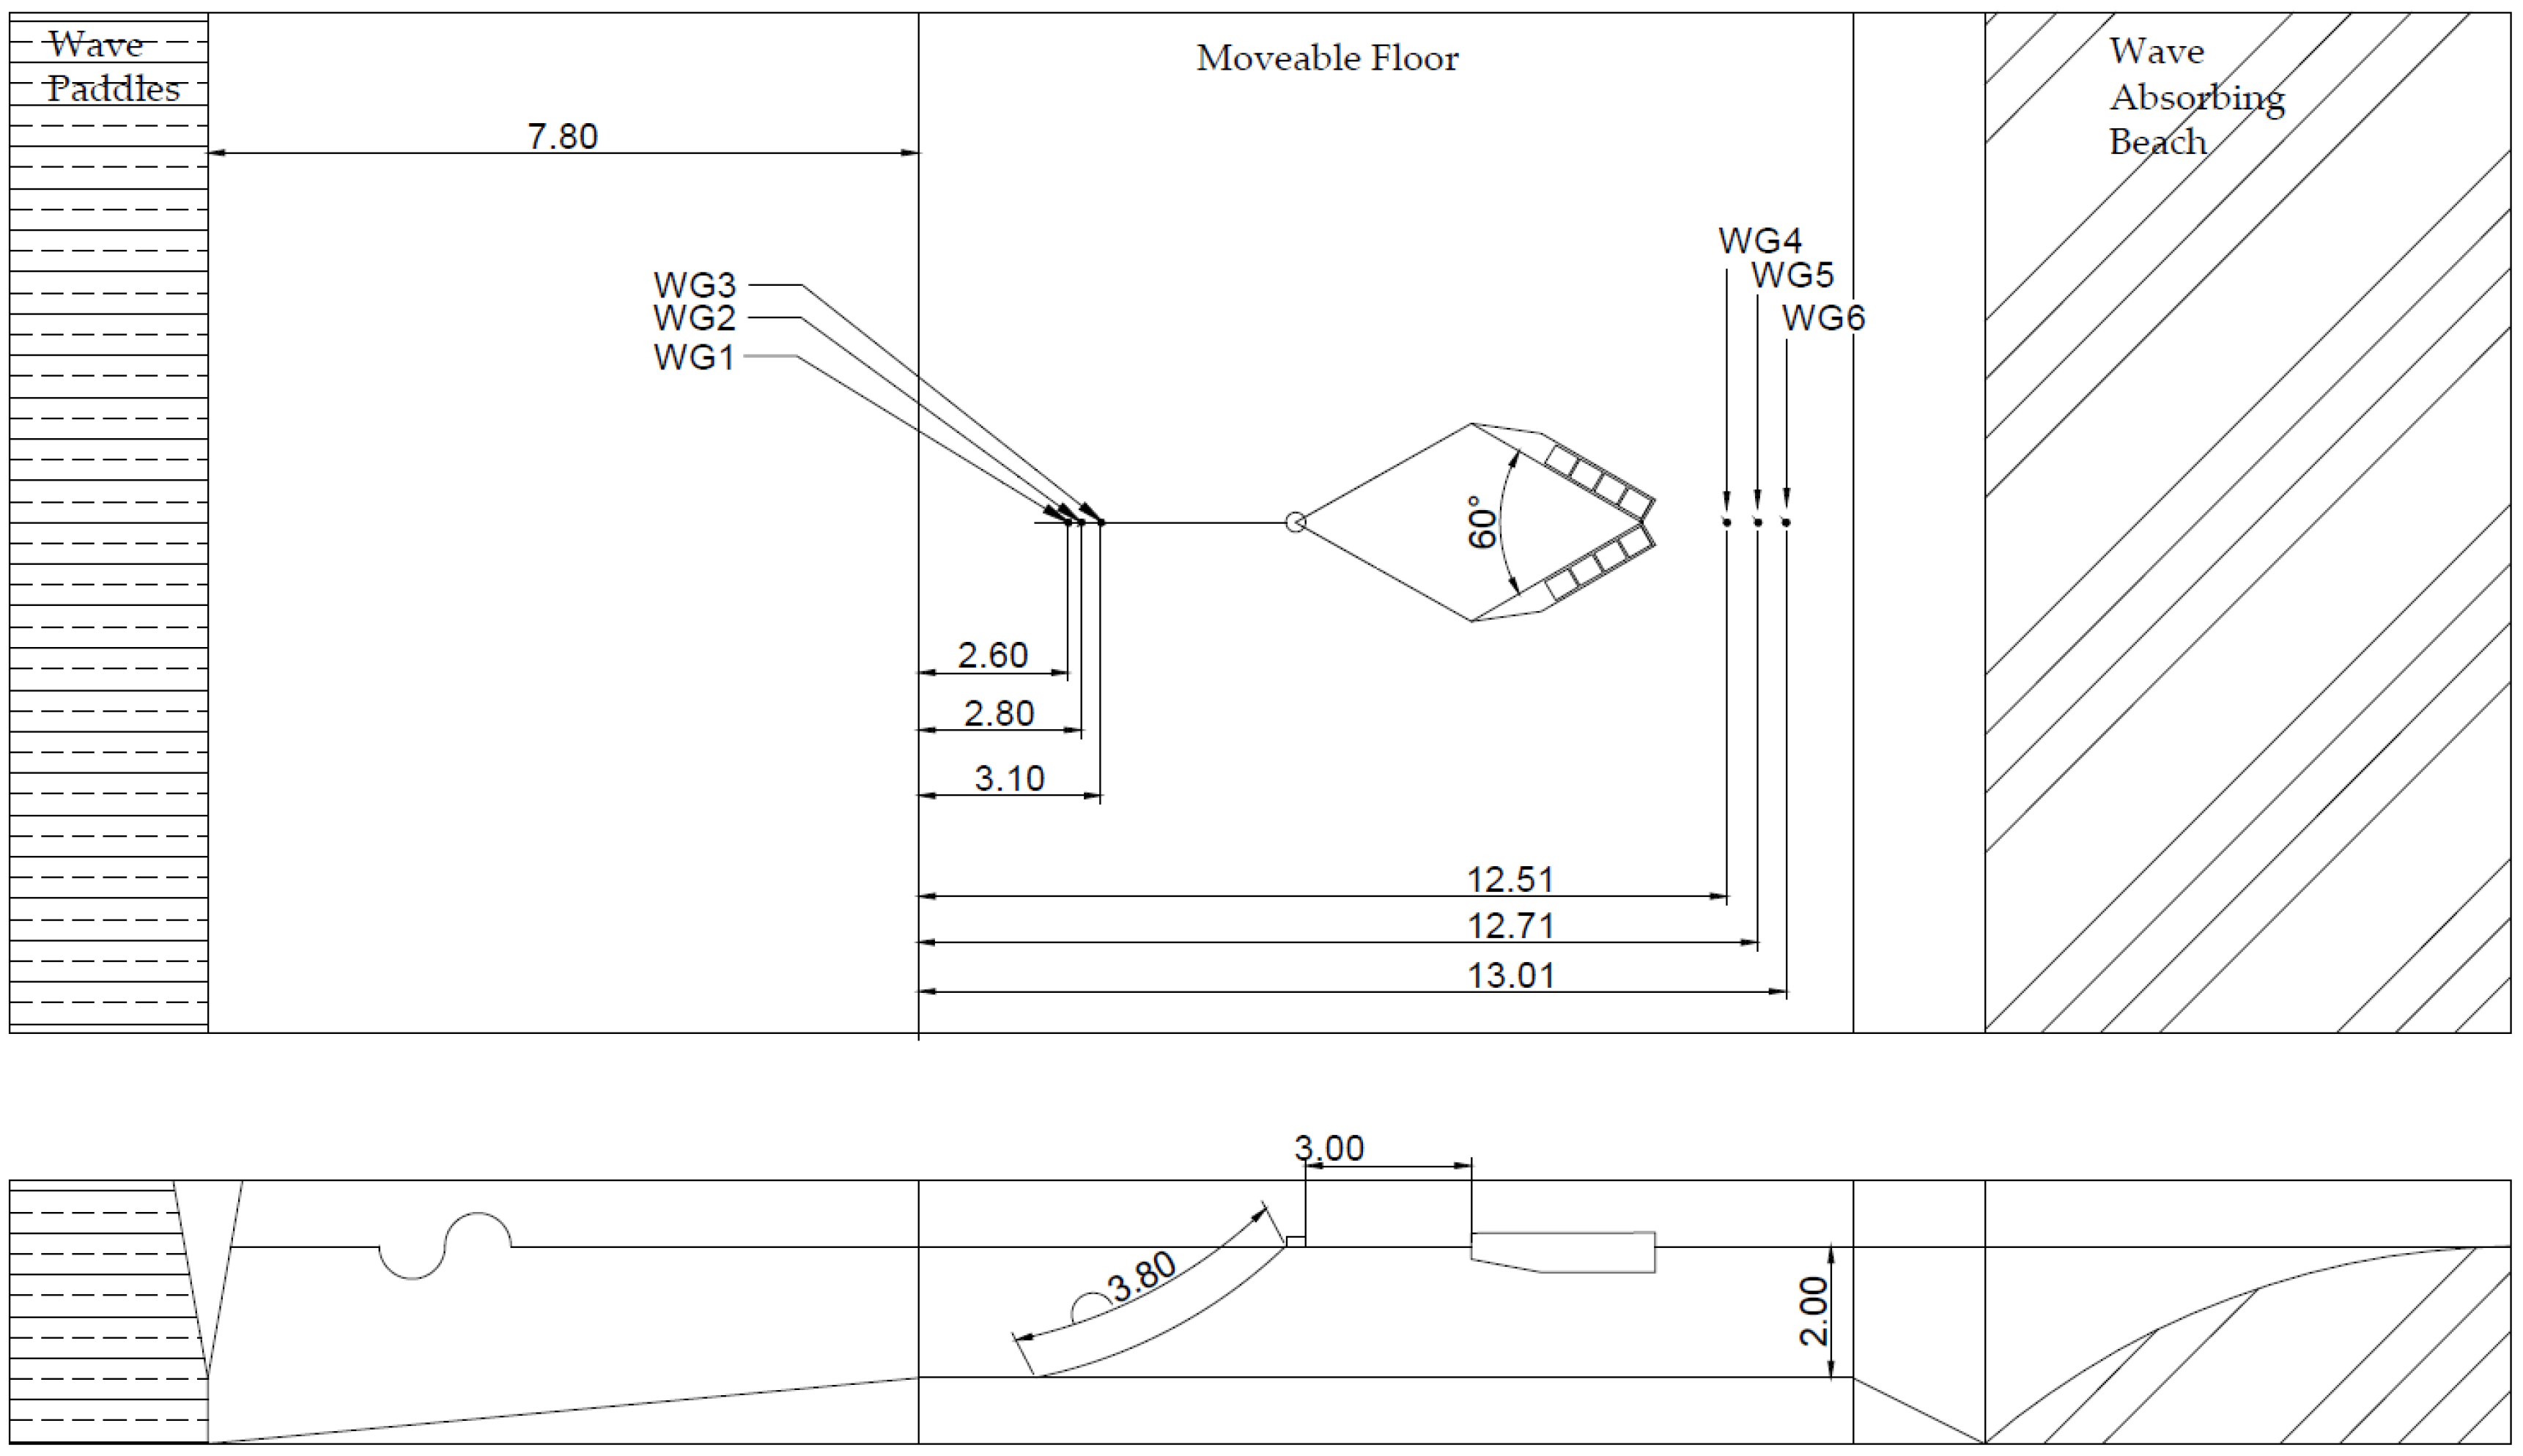
The experimental phase was performed in the COAST Laboratory Ocean Basin in the University of Plymouth. The Ocean Basin is a 35 m long, 15.5 m wide basin equipped with 24 individually controlled paddle wavemakers and an adjustable floor of up to 3 m depth [39]. The paddles are equipped with active wave absorption, which, along with a convex beach at the opposite end of the basin, minimises reflections back into the experimental area.
The mooring system used in the lab was a CALM system representative of the final intended prototype. A single point fixed to the Ocean Basin movable floor was moored to each bow of the WaveCat hulls via a float point. The wedge angle of the hulls was set to 60° for this test campaign.
Figure 4 shows the plan view of the moorings and wave gauges, above, and the lateral view of the moorings, below. The line from floor to float is 3.8 m long and allowed to rest at equilibrium. The two lines from float to model are 3 m long each. Three wave gauges are placed between the model and wavemakers and three further wave gauges behind the model to capture transmitted waves. Wave gauges 1, 2 and 3 are located between the model and wavemakers and wave gauges 4, 5 and 6 are located between the model and beach. All wave gauges are positioned along the centerline of the model.
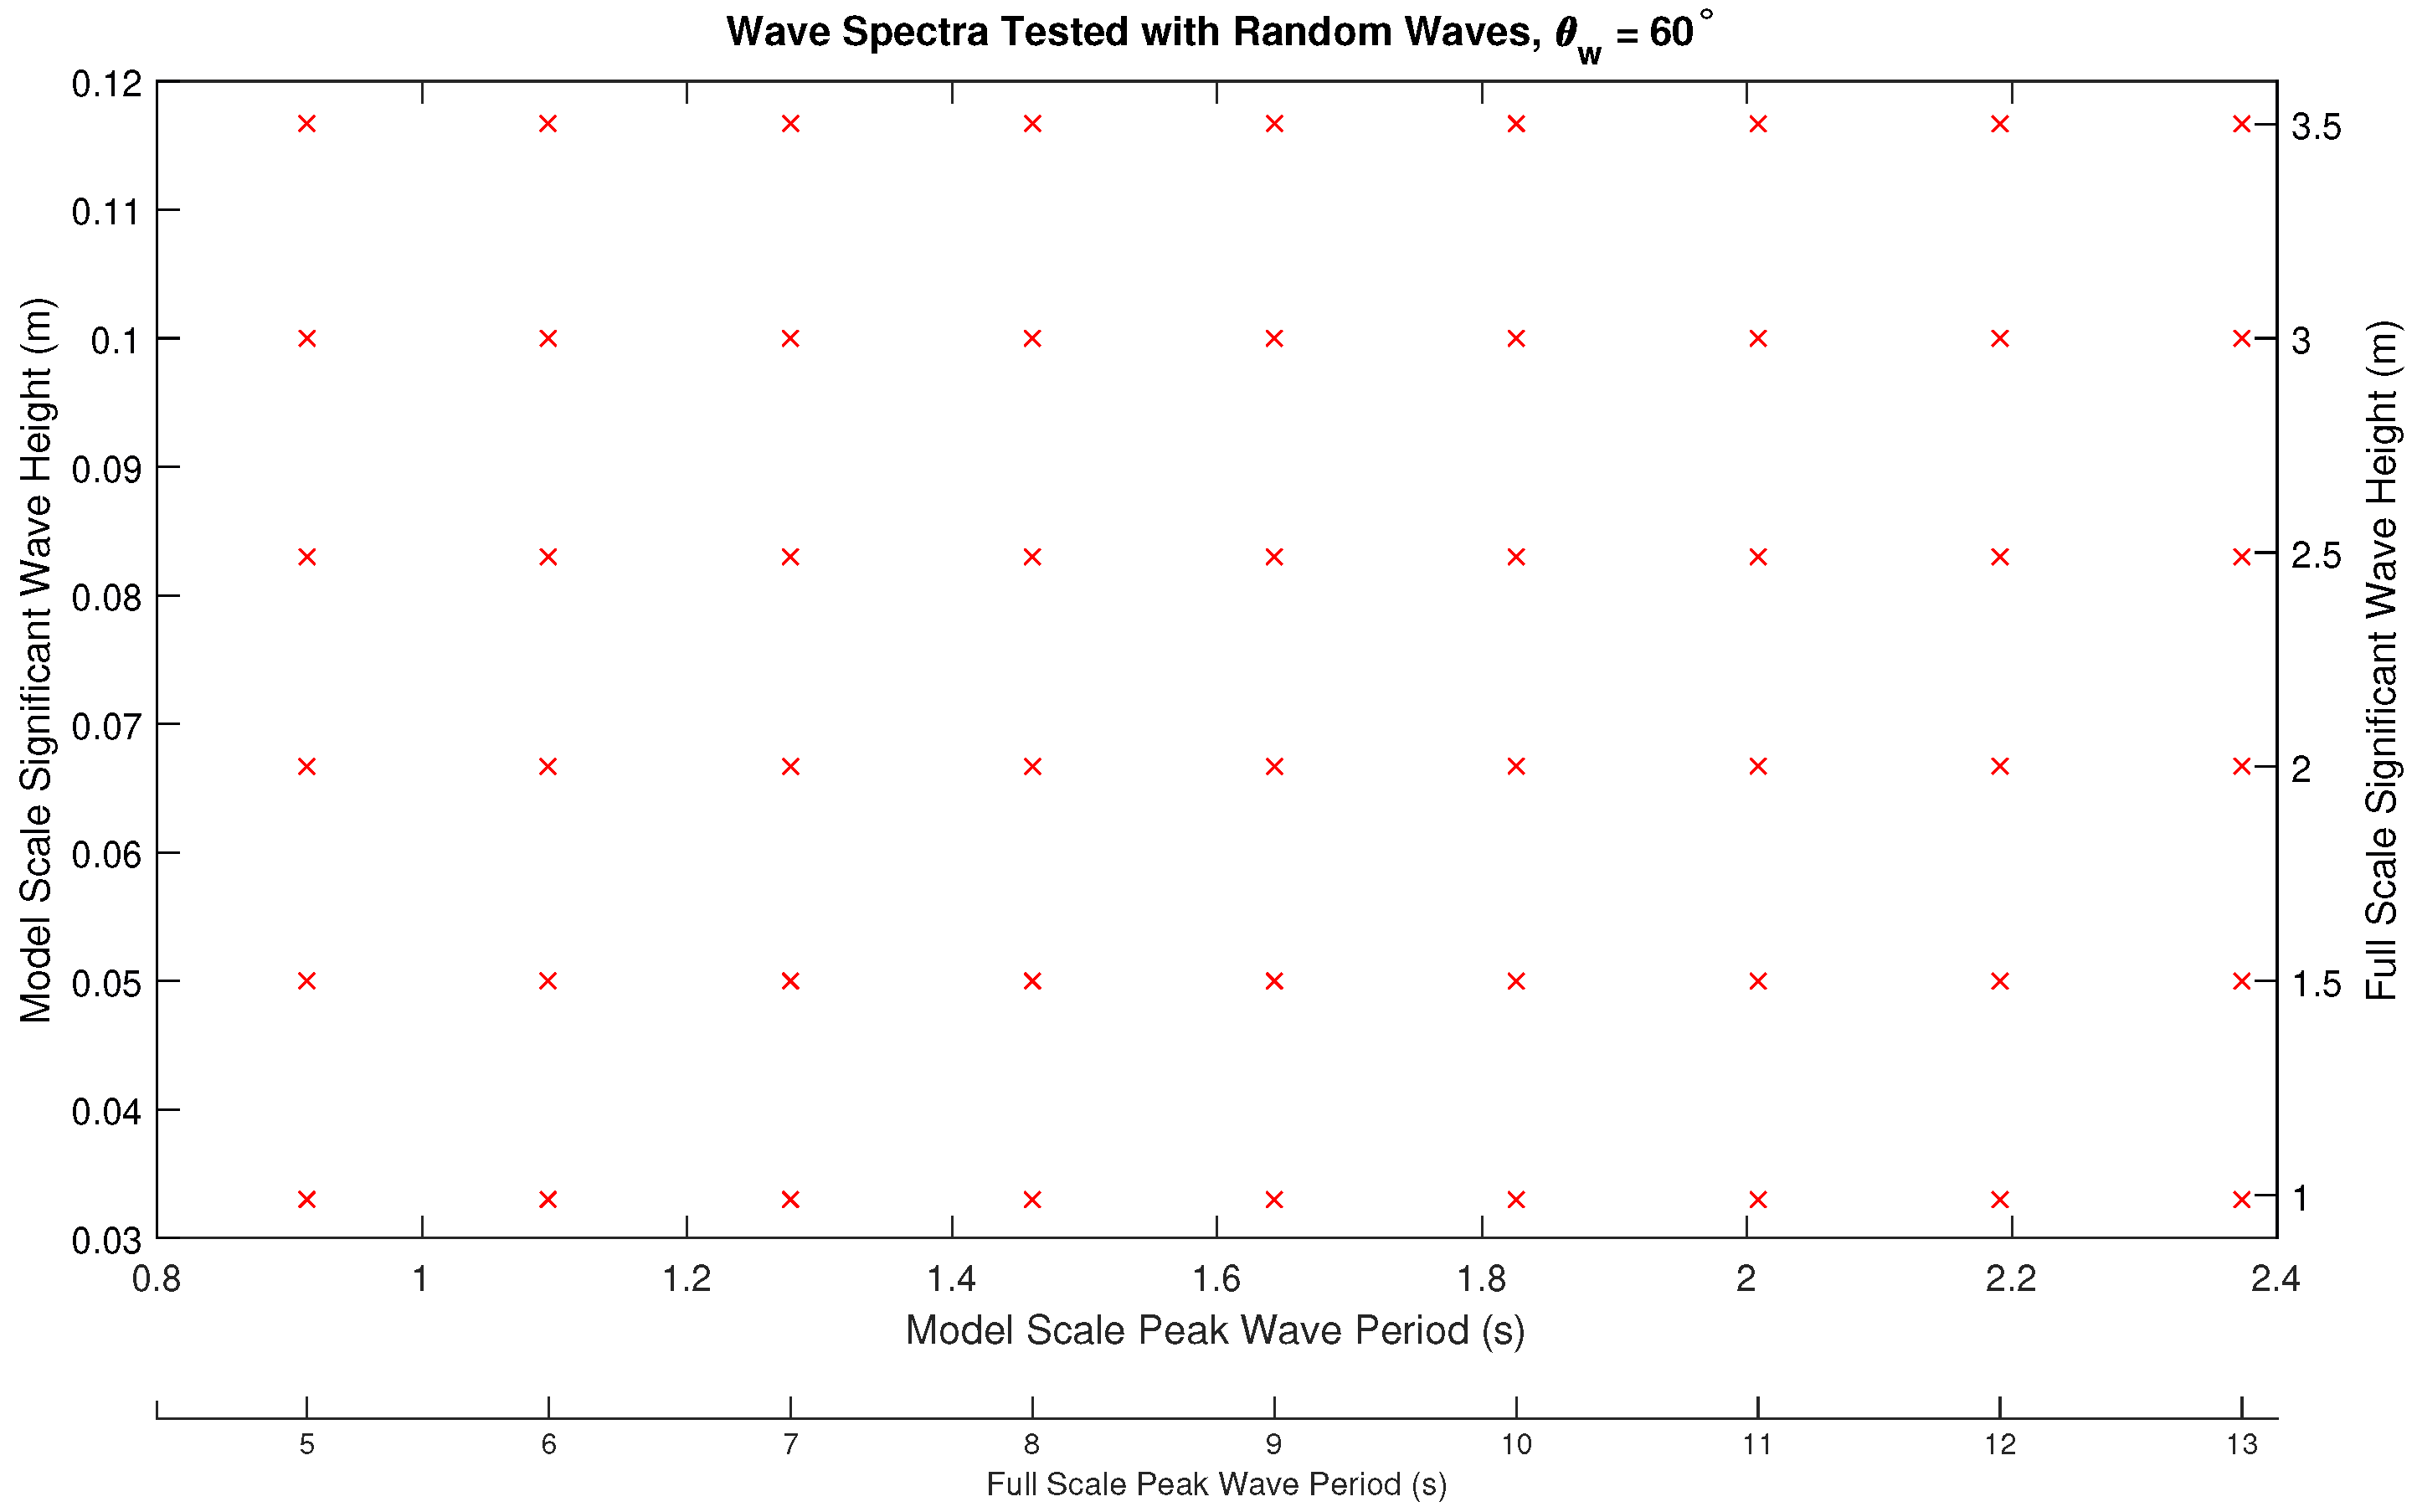
Random waves were generated using a Bretschneider spectral shape, to represent a fully developed sea [40], with parameters shown in Figure 5. A total of 54 tests were performed. Tests were performed for significant wave heights () of approximately 0.03 m to 0.12 m in 0.02 m increments and peak wave period of 0.91 s to 2.37 s in increments of 0.18 s. This corresponds to full scale tests of of 1 m to 3.5 m in steps of 0.5 m and peak wave periods () of 5 s to 13 s in steps in 1 s. The full scale parameters were scaled to 1:30 using Froude scaling. The tests were configured to encompass 30 min of waves at full scale in accordance with recommended guidelines [41], equivalent to 328 s at model scale.
To estimate the captured power of the device the overtopping flow was measured using flowmeters in the model along with the model position data measured through the Qualisys system. Each hull contained a flowmeter through which the collected water would pass and record a pulse representing a fixed volume of water. The gravitational potential energy of the system can be estimated using the volume of water collected and the head through [42]:
where is the gravitational energy, is the number of pulses recorded by the flowmeter, is the density of fresh water medium in the Ocean Basin, g is the acceleration due to gravity, h is the head in the tank and K is a calibration factor of the flowmeter to obtain litres [43].
The potential energy within the captured water was then compared to the energy contained in the incident waves to obtain a ratio of energy captured to incident energy. The concept of a capture width (CW) [44] allows power captured by a device to be compared to the wave power available.
where P is the power absorbed by the device and J is the wave resource given by
where is the significant wave height and is the wave energy period. The CW, therefore, is a length in metres representing the width of wave crest absorbed by the device.
Capture Width Ratio (CWR) is obtained by dividing the CW by a characteristic length scale of the device, and is an indication of device efficiency [45].
The characteristic dimension, B, is selected based on the method of operation of the device. For example, a point absorber would use the width of the buoy as the characteristic dimension. The characteristic dimension of the WaveCat is the width of the wedge opening, which is variable depending on wedge angle, and follows the equation
where is the length of the inner edge of the WaveCat hull and is the wedge angle. For this model at the characteristic dimension is 3 m. The CWR allows devices of different sizes and power rating to be compared to each other, using a compiled database [45].
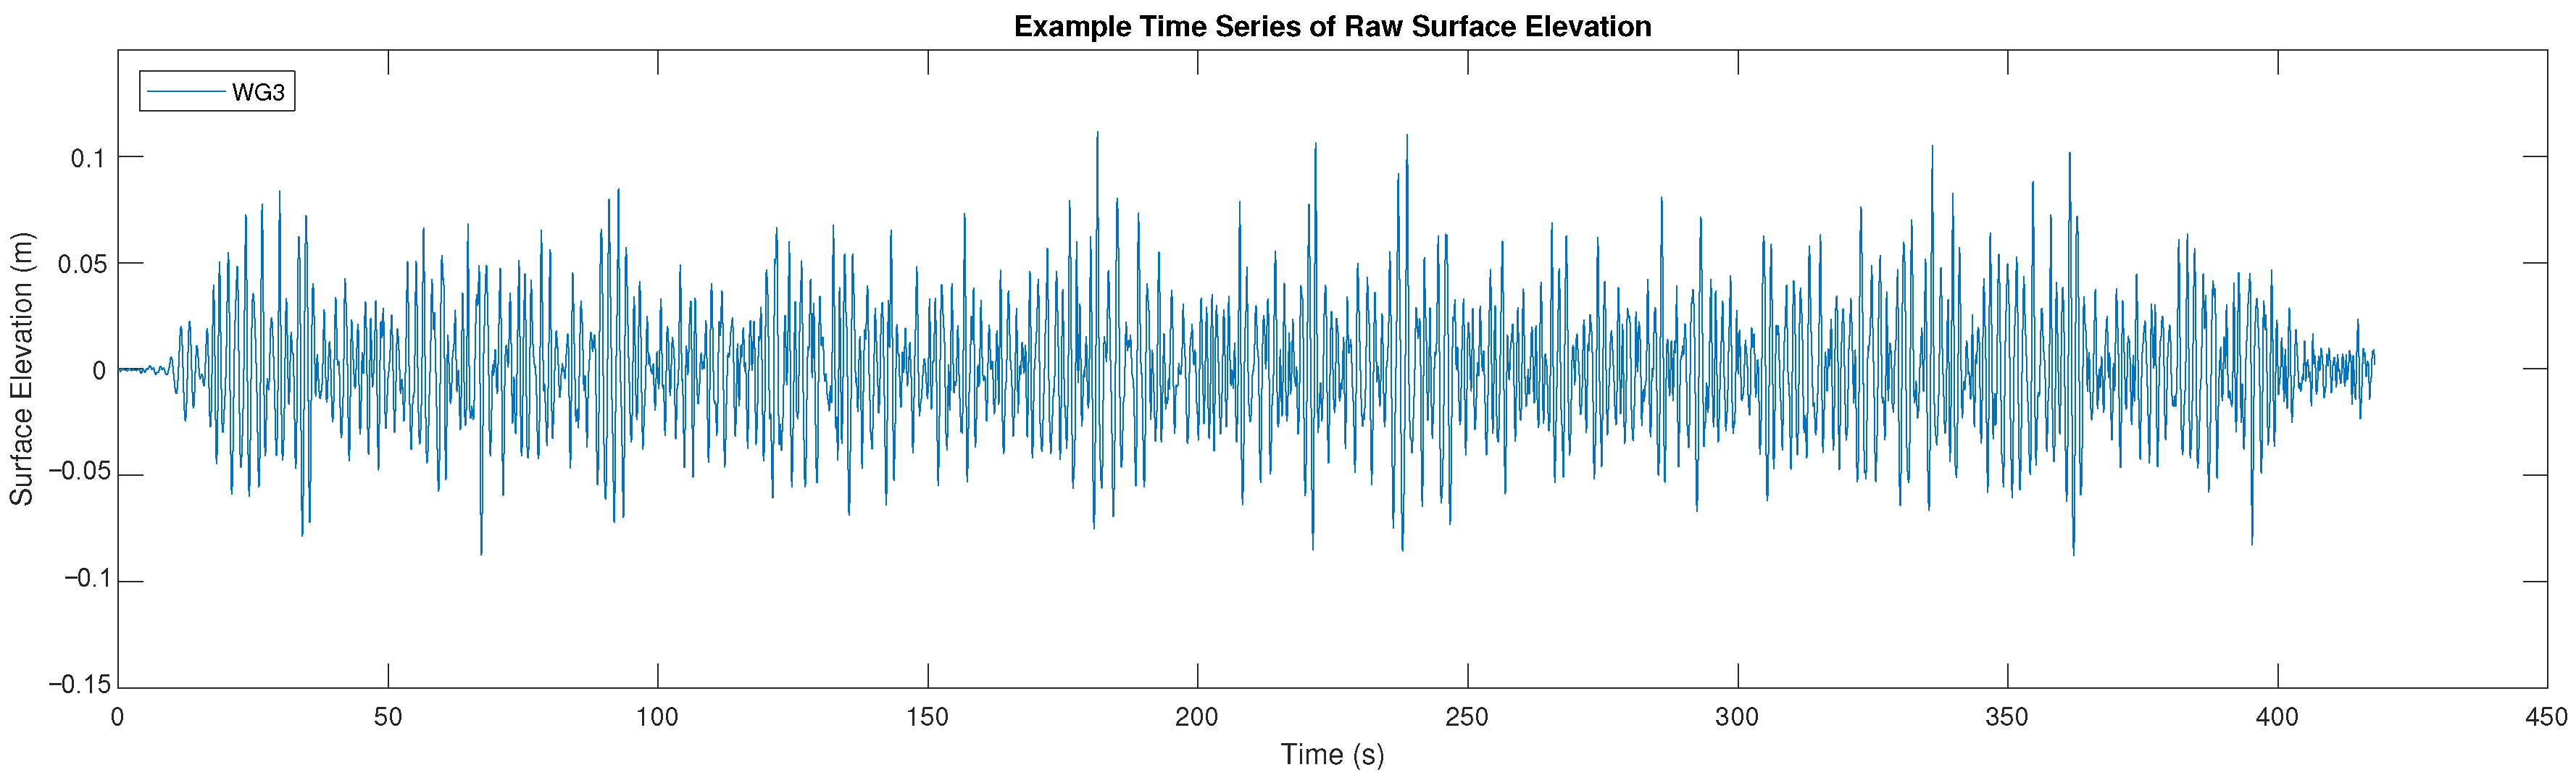
Waves within the Ocean Basin were subject to reflections caused by the presence of a model in the area, as well as reflections caused by imperfect absorption of the tank beach and reflections from the solid wall at the sides of the basin. Figure 6 shows an example time series of the surface elevation for the three wave gauges located between the model and wavemakers.
The 3 point least-squares method [46], based on Mansard and Funke [47], was initially used to remove the reflections from the absorbing beach from the transmitted wave field in the lee of the model. The method was then used to split the combined incident wave field in the test into the incident, reflected and transmitted wave fields.
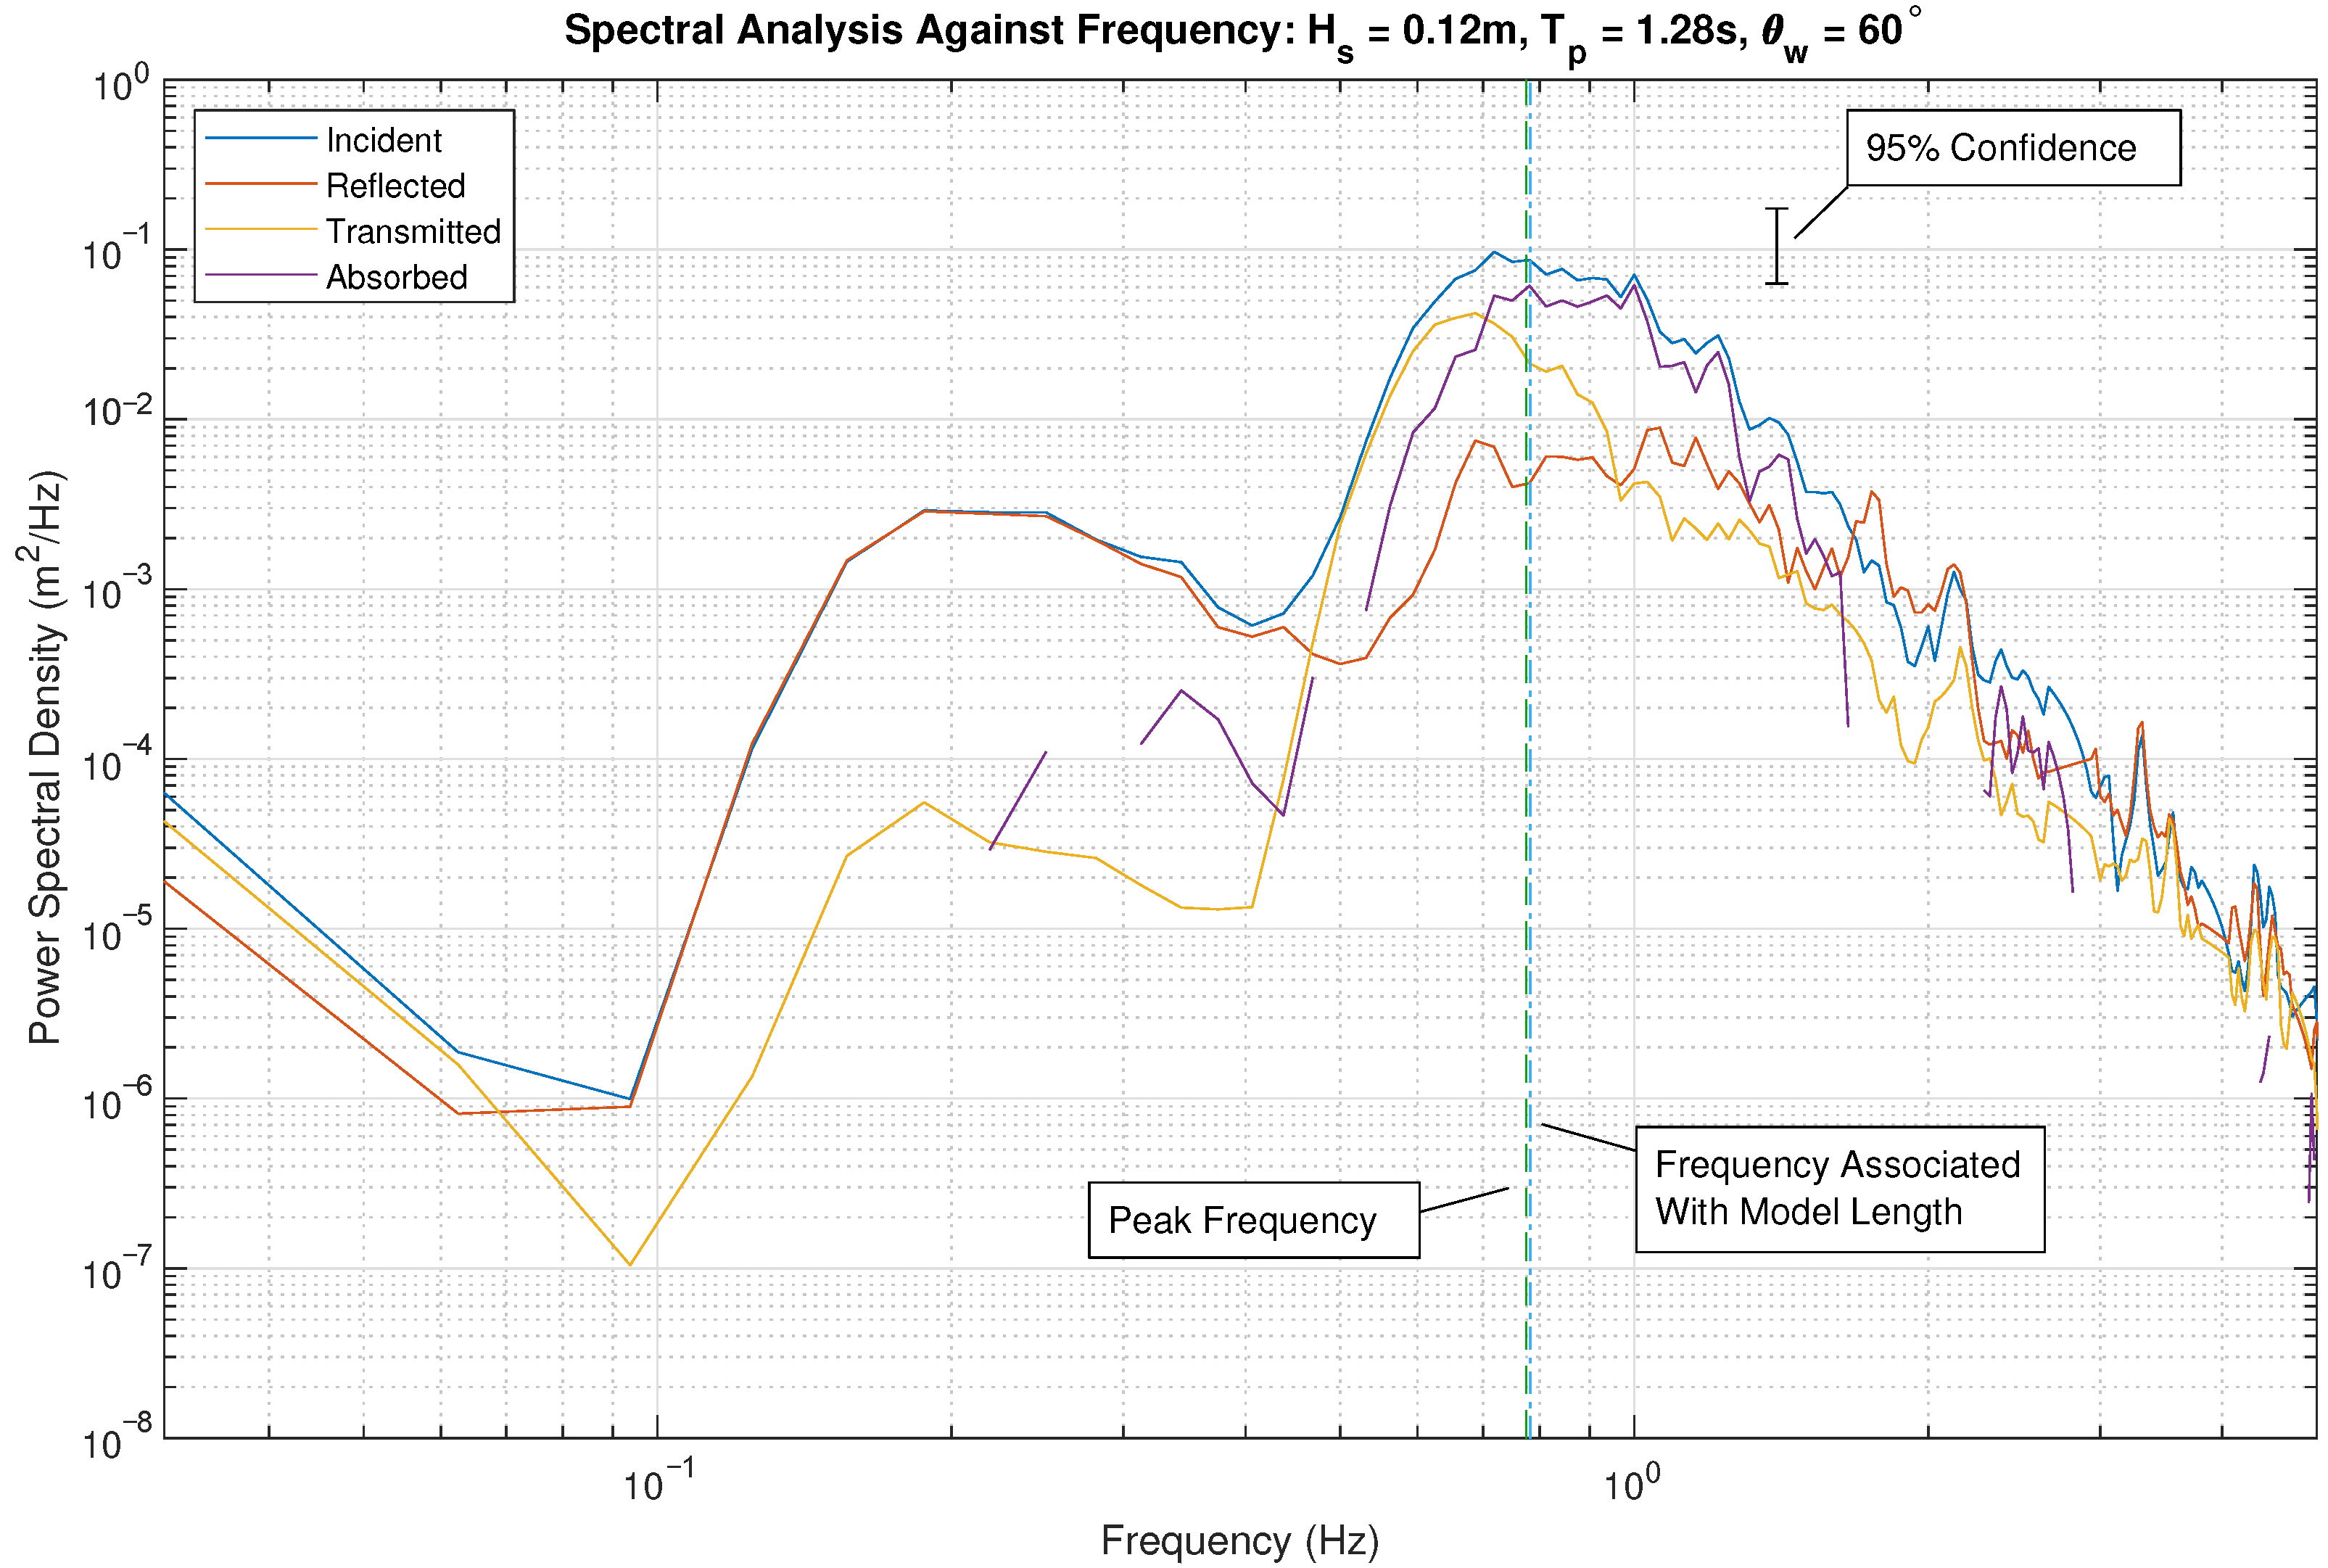
Spectral analysis was then applied to the time series of the surface elevation in order to examine the frequency response of the incident, reflected and transmitted surface elevations. Spectral analysis was applied to the 45,056-point time series using eleven overlapping sections of 4096-points each, with ten overlapping sections of 50% overlap. This gave a frequency resolution of 0.03125 Hz and 38.78 degrees of freedom (following Nuttall [48]). Upper and lower bounds of the 95% confidence intervals on spectral peaks are therefore 1.8 and 0.65, respectively, following Jenkins and Watts [49].
The incident energy contained in a wave is transformed as it influenced the model, a proportion was reflected, a proportion transmitted and a proportion absorbed by the model through movement and overtopping. The proportions were defined as coefficients of reflection, transmission and absorption and are the ratio of relevant significant wave height to the incident significant wave height thus:
where and are the reflection and transmission coefficients, respectively. , and are the significant wave heights of the incident waves, reflected waves and transmitted waves, respectively.
The absorption coefficient, , can be calculated from the other coefficients [50]:
represents the proportion of incident wave height that is absorbed by the device. In this application refers to all energy that is not reflected or transmitted, as it is traditionally used in reference to breakwaters. In the area of wave energy conversion this term therefore encompasses energy that is lost in the system through friction, radiation and influencing the motion of the device.
The effective model length, , is the length of the inner opening in the direction of wave propagation. It is calculated from and as:
The frequency which corresponds to waves of wavelength is given by:
where is the wave frequency that corresponds to a wavelength of length and d is the water depth. For a water depth of 2 m, model length of 3 m and of 60° the frequency associated with model length is 0.775 Hz.
3. Results
As an example, Figure 7 shows the spectral analysis of a test with characteristics = 0.12 m, = 1.28 s and = 60°. The peak wave period parameter of this test represents a frequency of 0.781 Hz, close to that of the model frequency, calculated from Equation (10), of 0.775 Hz, both shown by the vertical dashed lines. As expected, the peak in incident energy is around the characteristic frequency of the test. At lower frequencies than that of the peak frequency, and therefore longer period waves, the majority of energy is transmitted rather than reflected, leaving little energy available for the device to absorb. As the frequency approaches the peak frequency of the test, the amount of energy transmitted drops but the amount of reflected energy remains constant, allowing a greater portion of energy to be absorbed. As the wave frequency increases, and therefore the wave period becomes shorter, the transmitted energy drops. The reflected power also drops but is less affected resulting in more energy in reflected waves than transmitted. The absorbed energy curve is not continuous due to the reflection and transmission equalling the incident energy, thus no energy was absorbed at those frequencies.
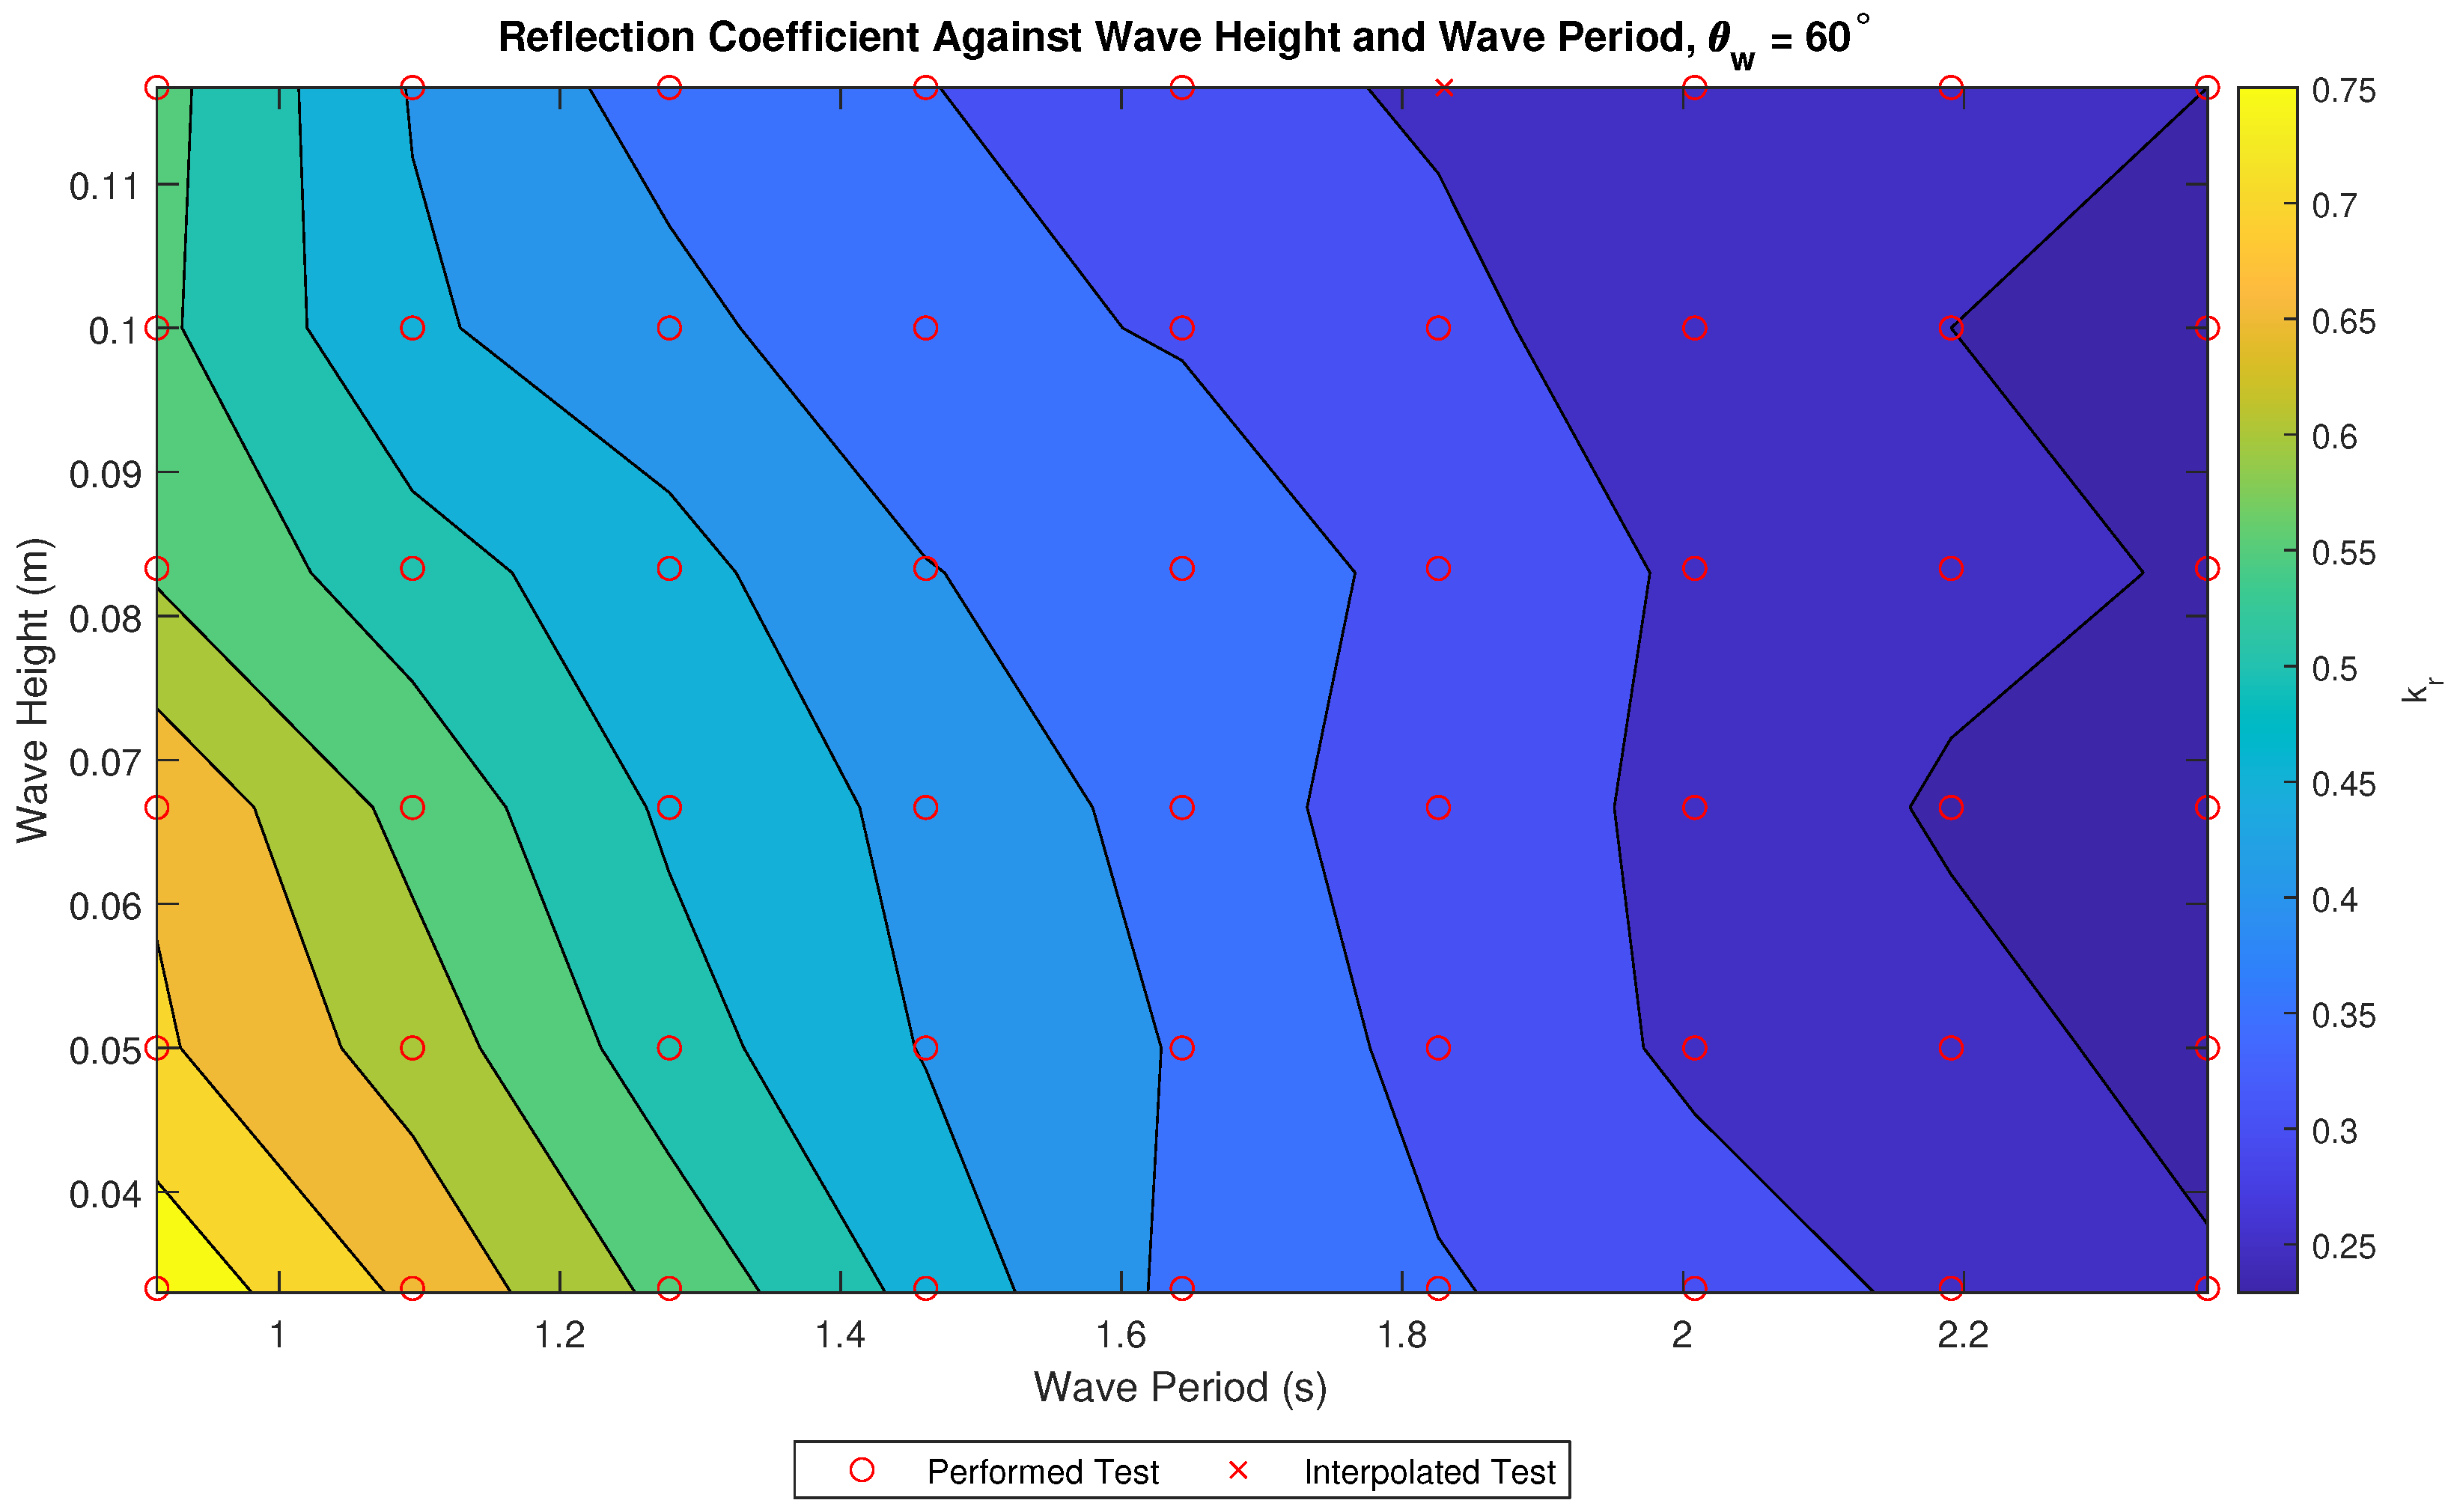
Using the spectral data from each test, the significant wave heights of incident, reflected and transmitted waves were calculated over the course of a complete test and converted to a coefficient using the method detailed above. Note that for test conditions of = 0.12 m and = 1.83 s it was discovered that file corruption caused data loss for the surface elevation data. When plotting the tests by period it was observed that the tests of other wave heights were of a linear relationship around a wave period of 1.83 s, therefore the data point was linearly interpolated using the tests of the periods either side of the missing result at the same wave height. The interpolated result has been highlighted on all following results.
Figure 8 shows with respect to and with yellow representing high coefficient and blue low coefficient. The highest , 0.79, occurs when is low and is also low. Increasing lowers to a minimum of 0.25 and during tests with high values of the becomes less dependent on the of the test, showing similar values across the range of wave heights tested.
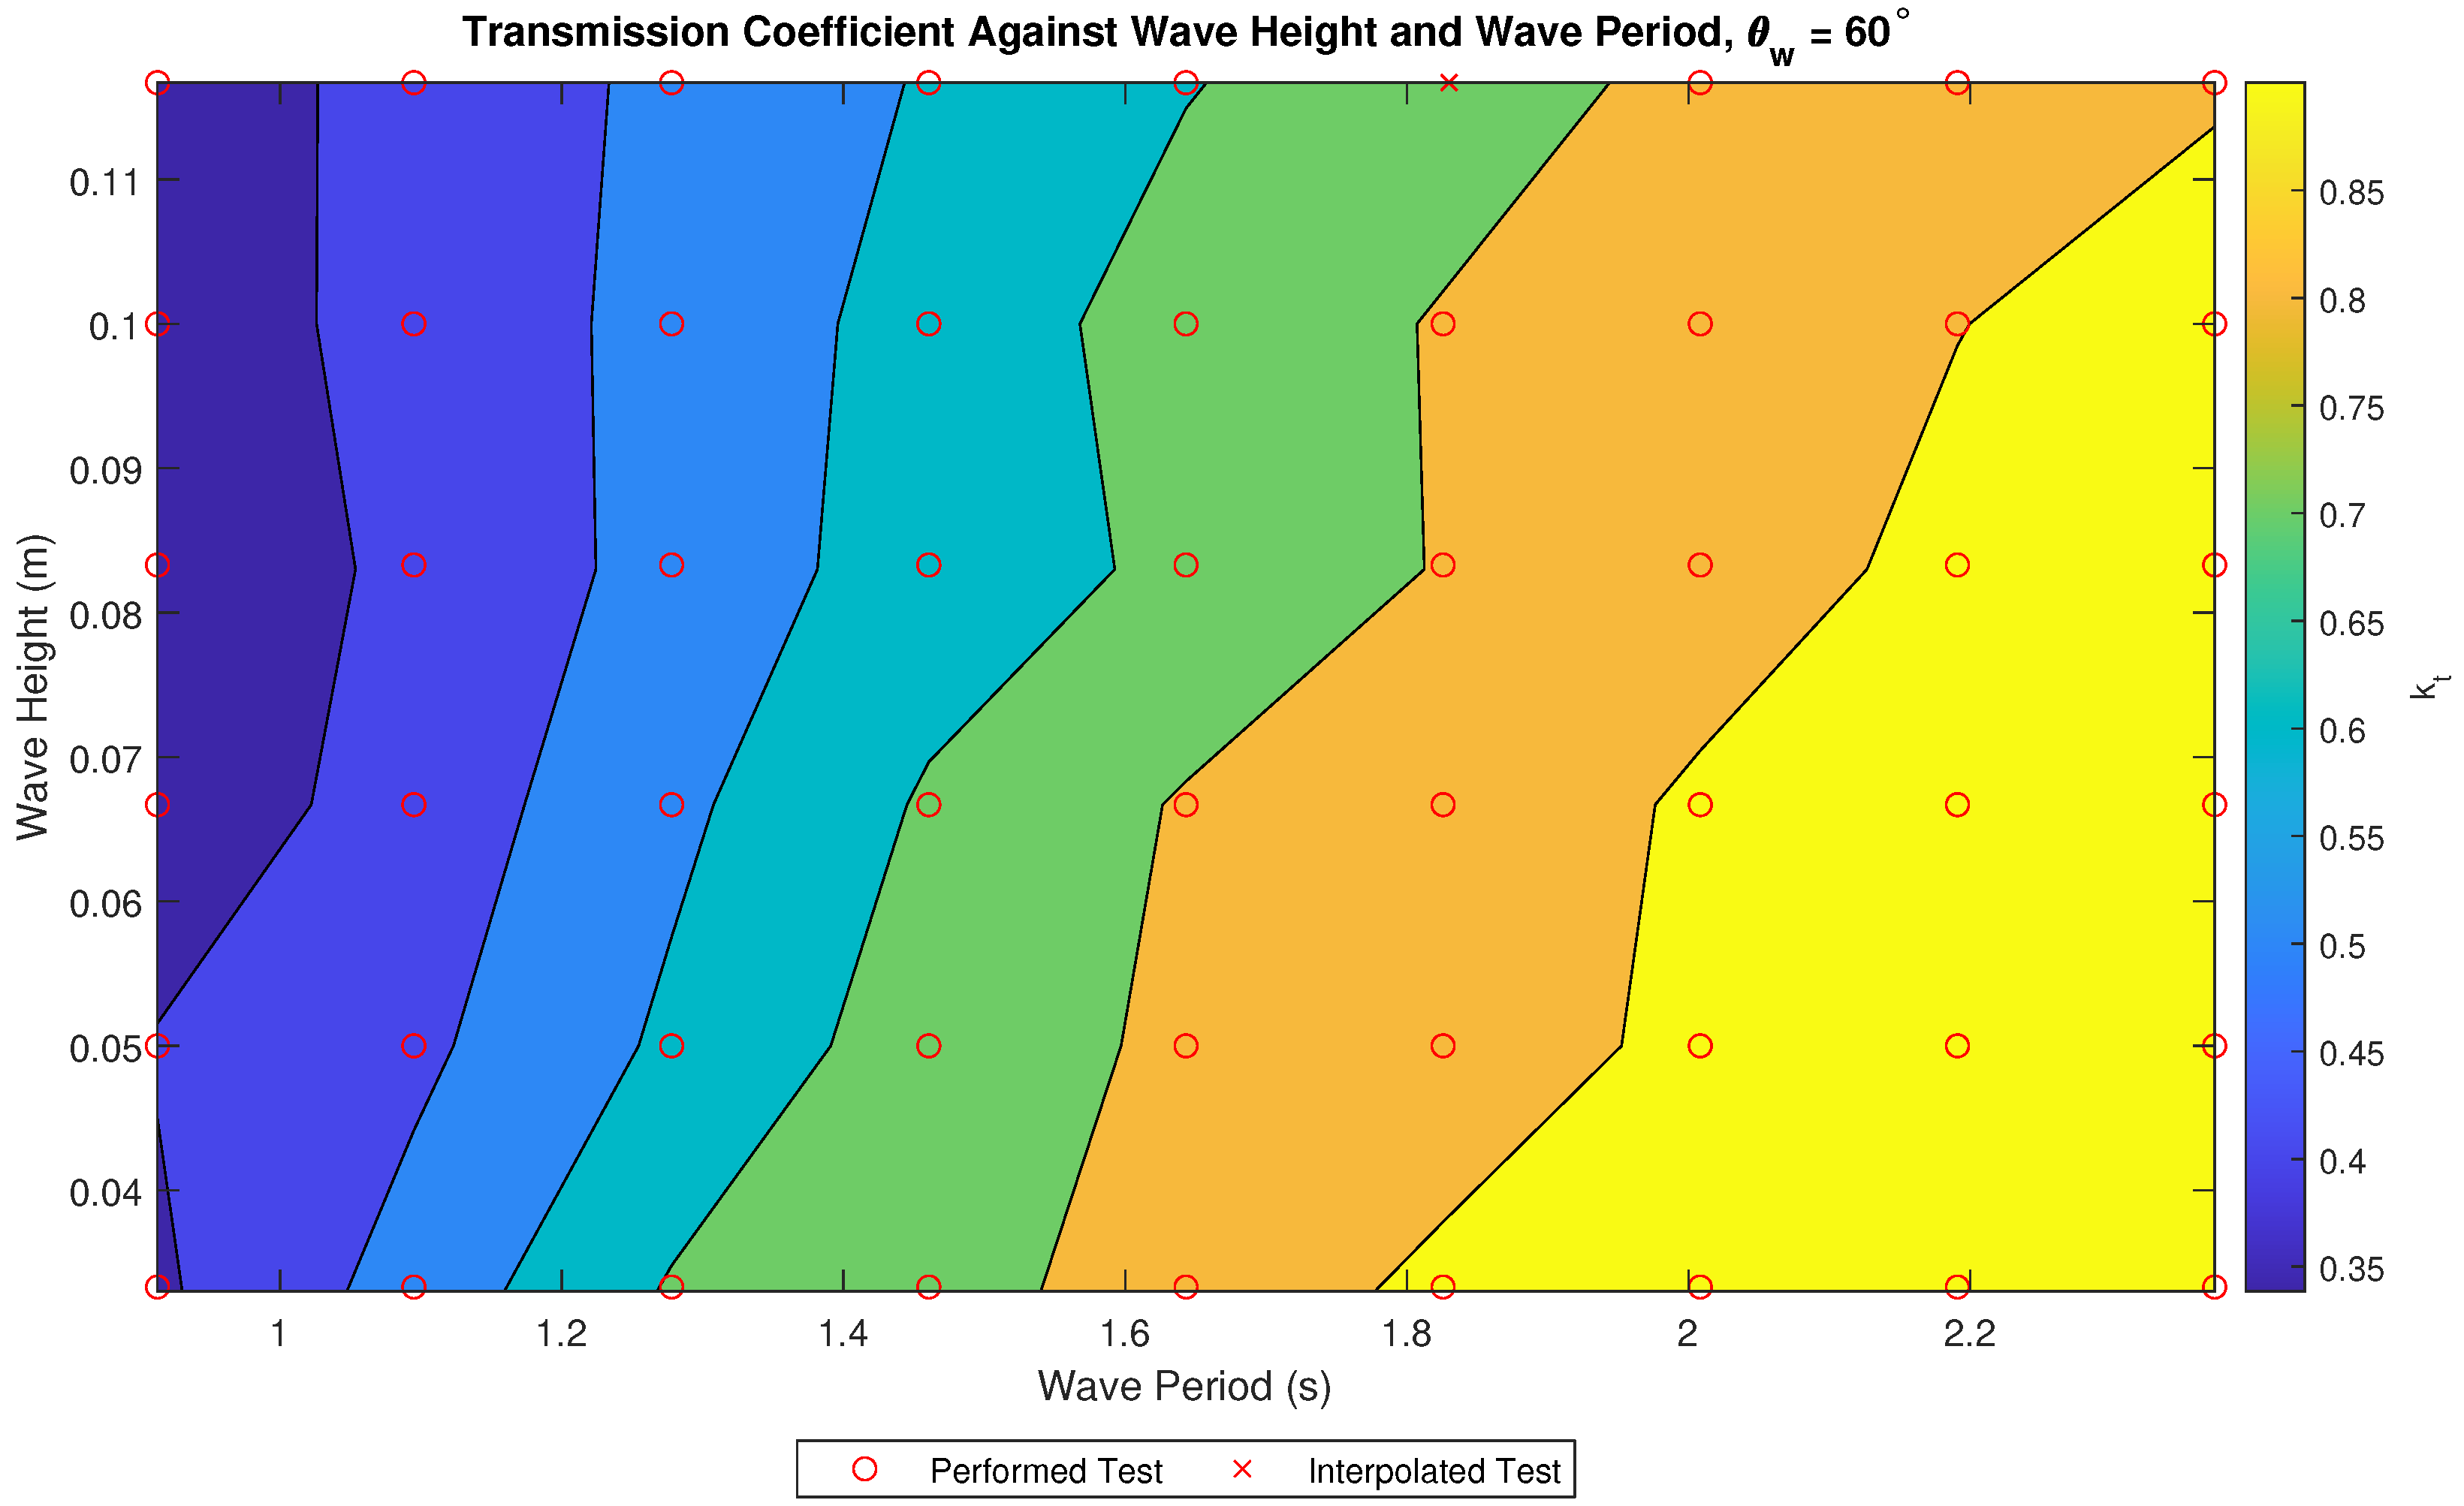
Figure 9 shows with respect to and with yellow representing high coefficient and blue low coefficient. The highest , 0.98, occurs when is low and is high. Reducing lowers to a minimum of 0.35 and reduces the dependency of on wave period, as the transmission becomes more constant over the range of wave heights tested. Compared to the reflection coefficient, Figure 8, the model has a larger range of conditions in which remains high.
Figure 10 shows with respect to and , with yellow representing high coefficient and blue low coefficient. The highest , 0.78, occurs when is high and is low, with low absorption at high and low tests. The area with the highest absorption is where the highest power output for the device is expected. When wave steepness is large is also large, as shown by the regions of high absorption where is high and is low.
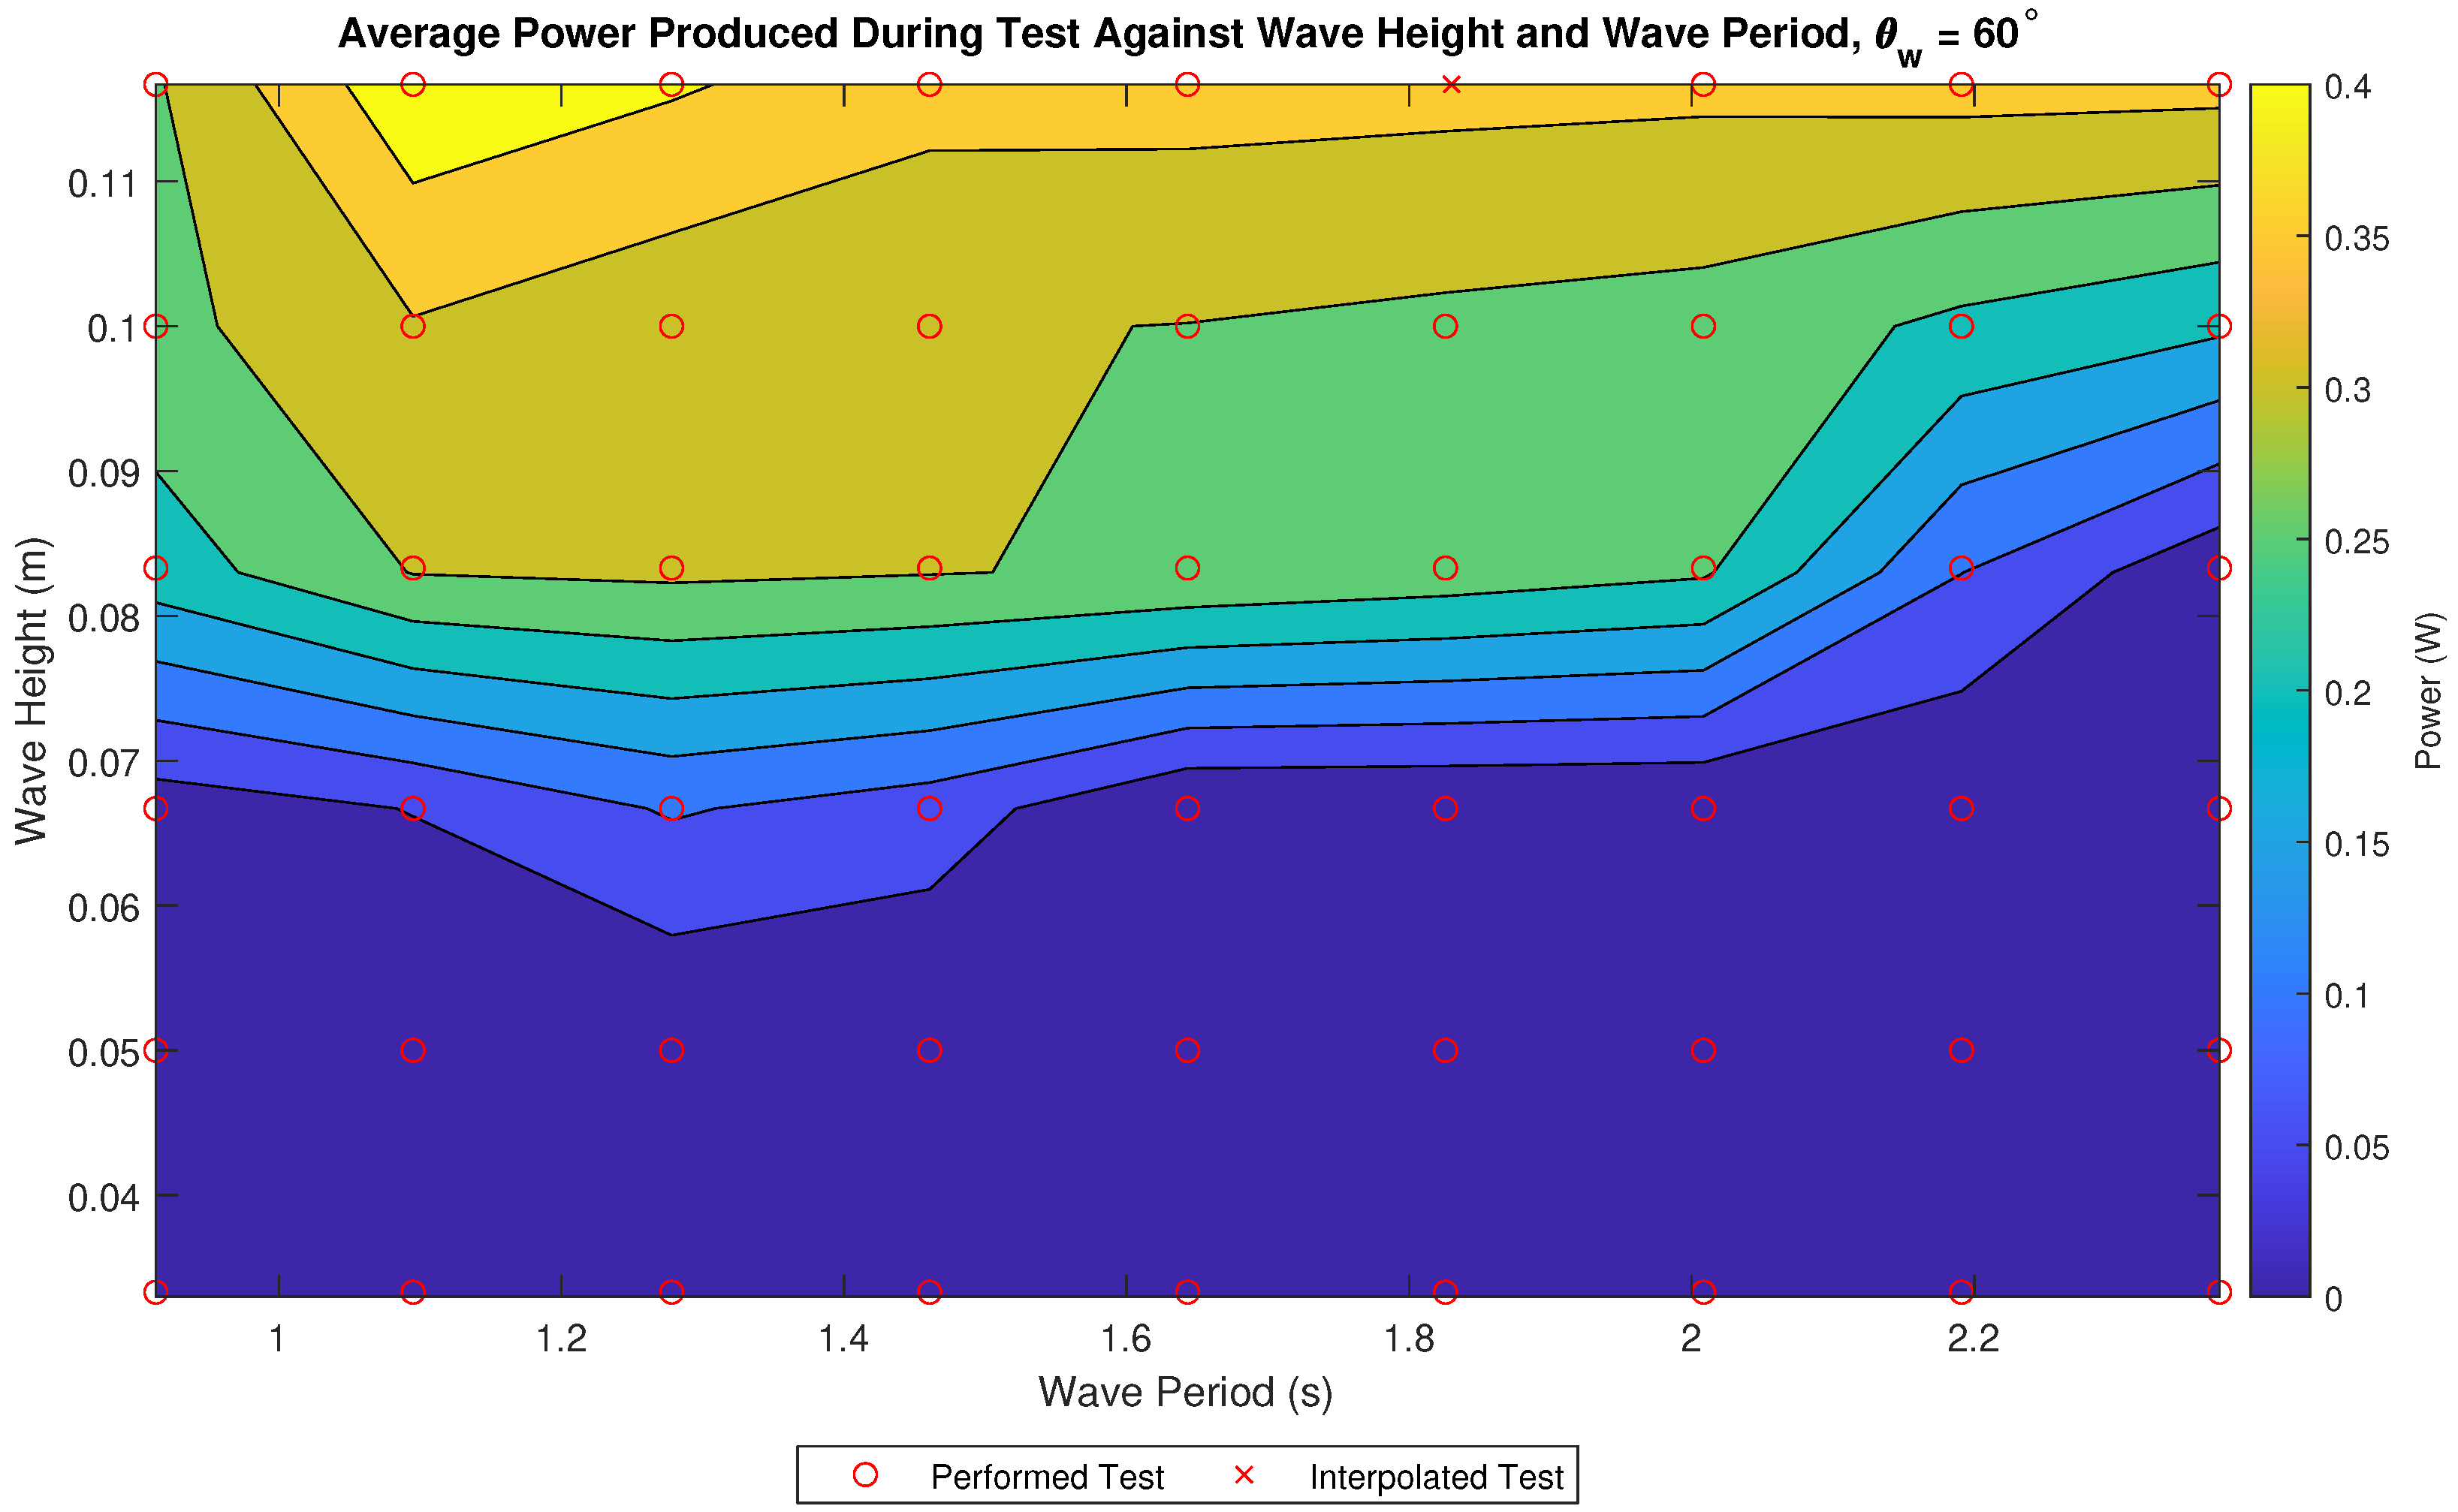
Figure 11 shows the power estimation of the WaveCat during tests, with yellow representing high power and blue low power. The average power during a test was calculated from the total collected energy during a complete test, Equation (1), and averaged by the length of the test. This was then scaled up to full scale. The highest power is generated during tests of high and = 1.09 s. This test represents a with peak wavelengths close to that of the model length. During tests of a below 0.05 m there was no overtopping and thus no power generated. When is kept constant the general trend shows lower produced more power.
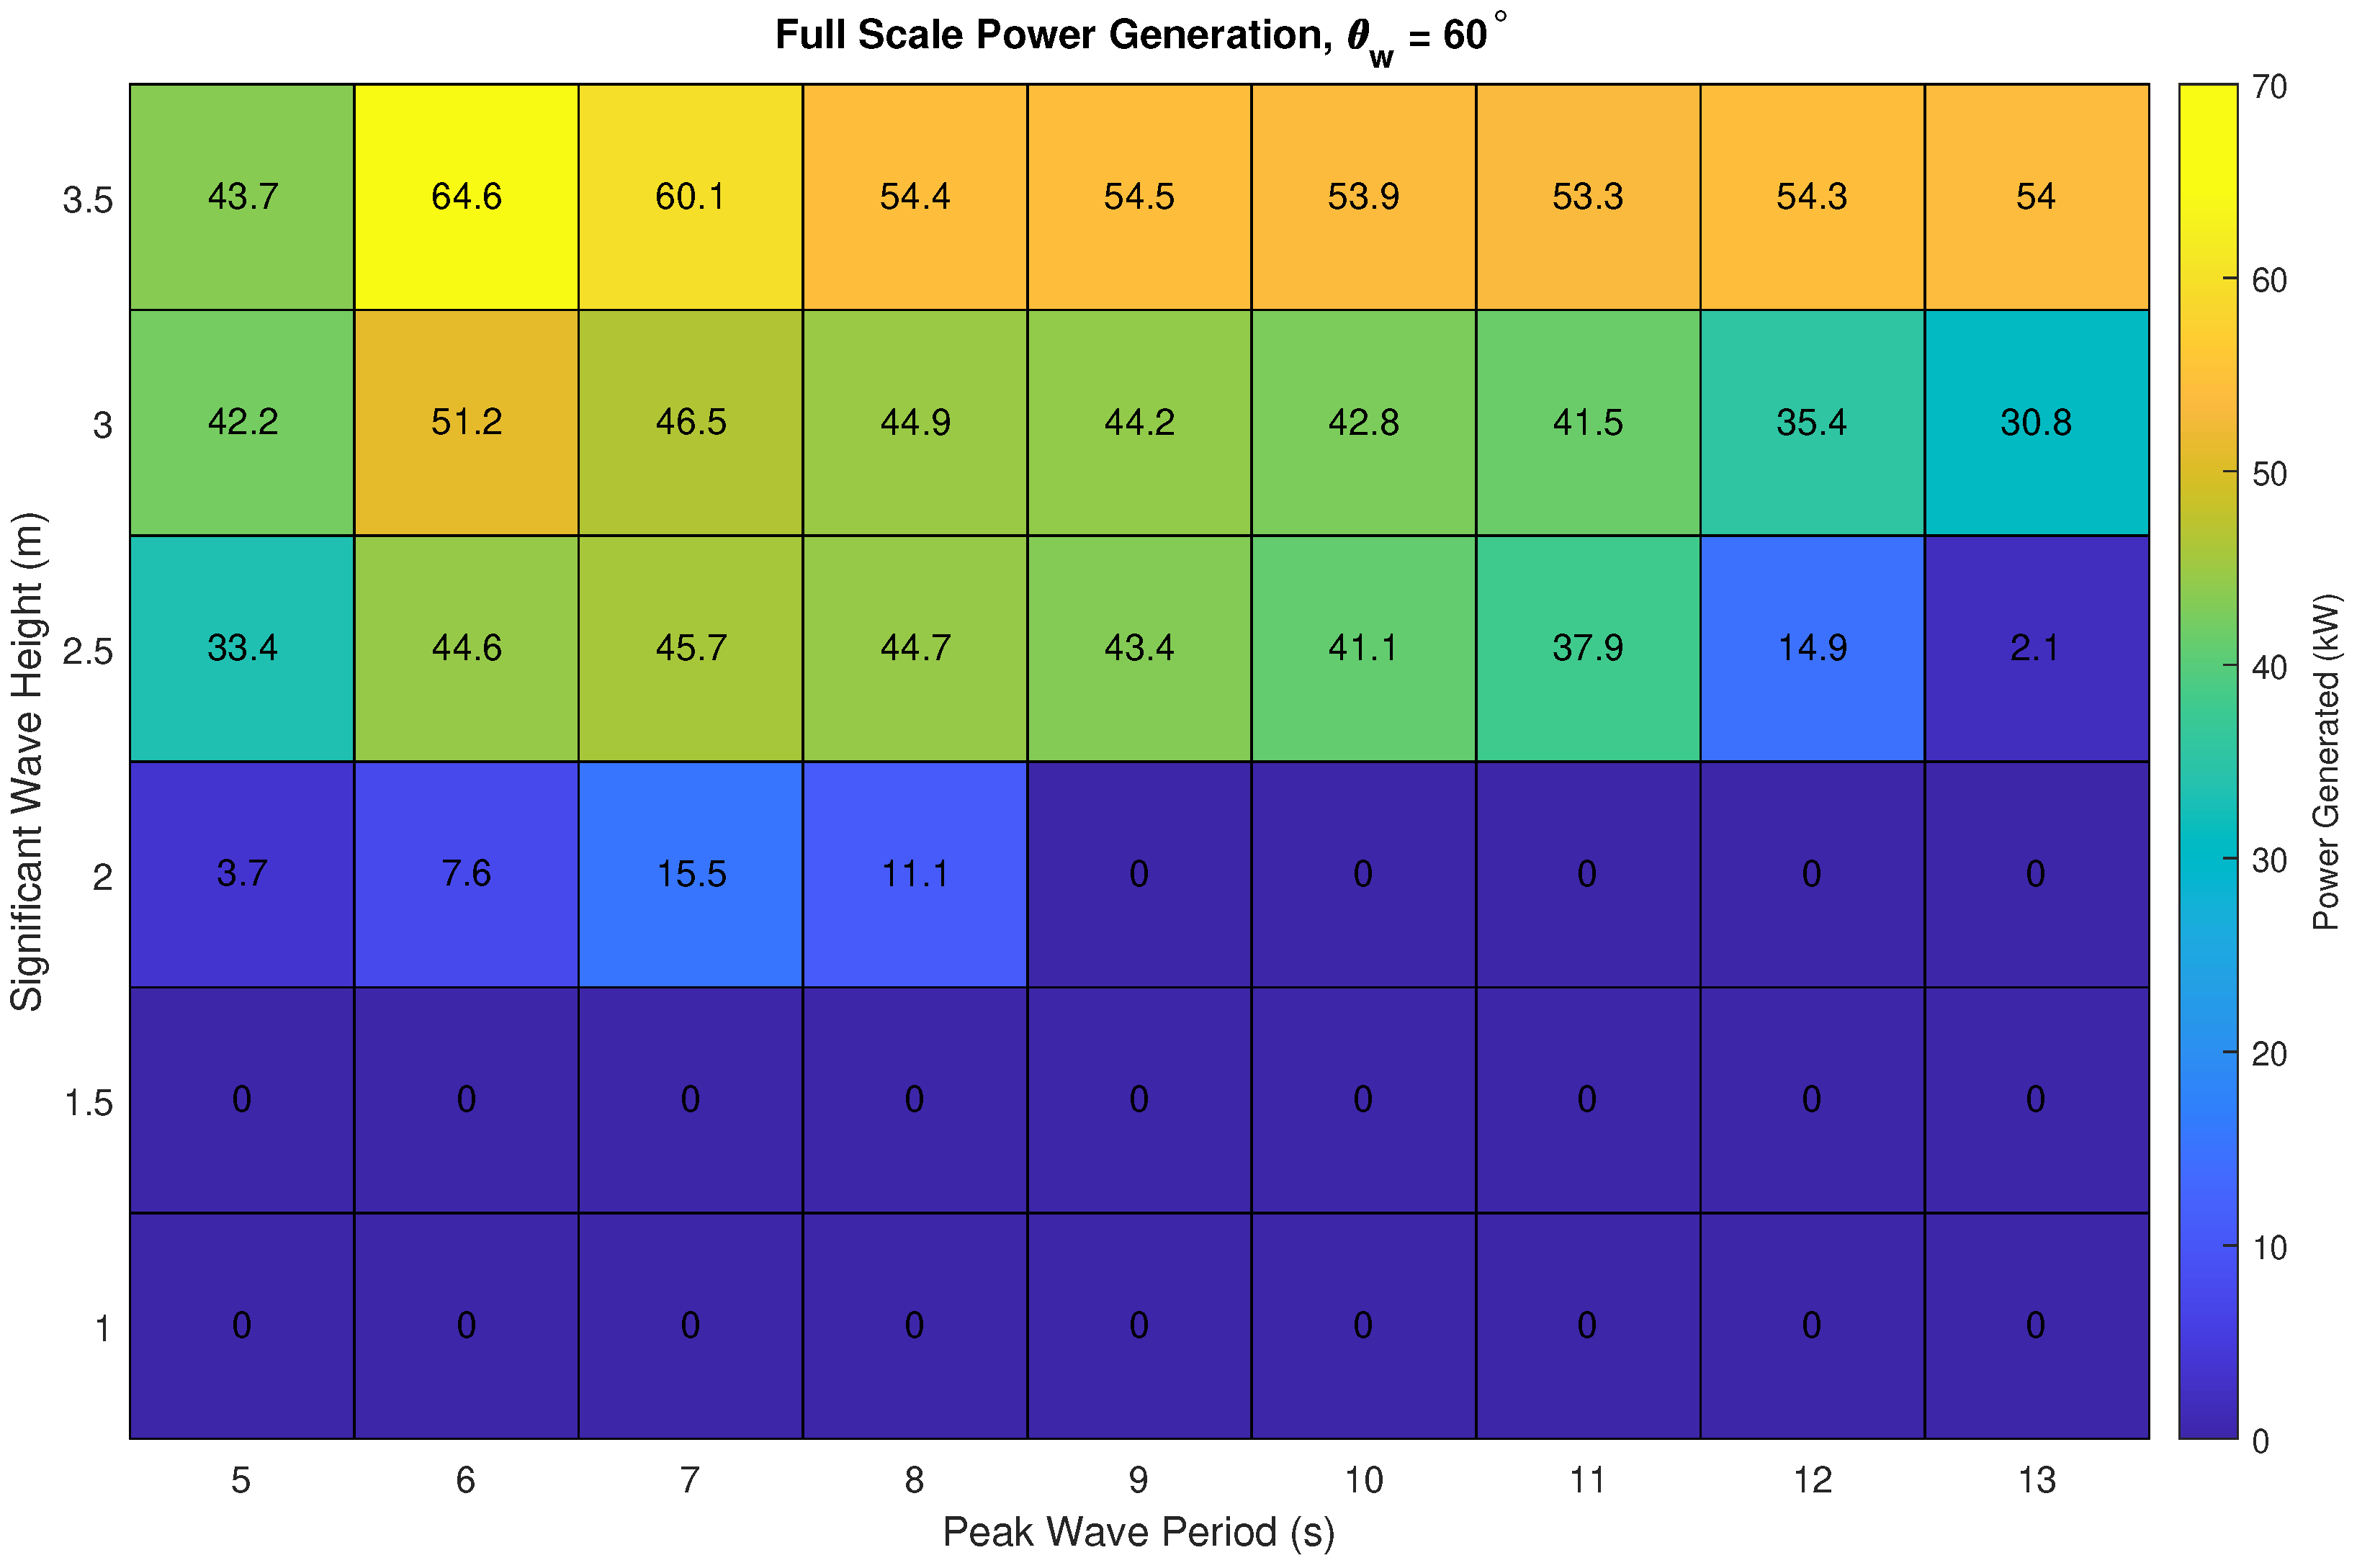
Figure 12 shows the power matrix when the results from Figure 11 are scaled from model scale to full scale. Peak power is approximately 64.6 kW during the test of = 3.5 m and = 6 s. As is increased, such that wavelength is longer than the model length, the power generation is lower than that of the peak test but remain constant.
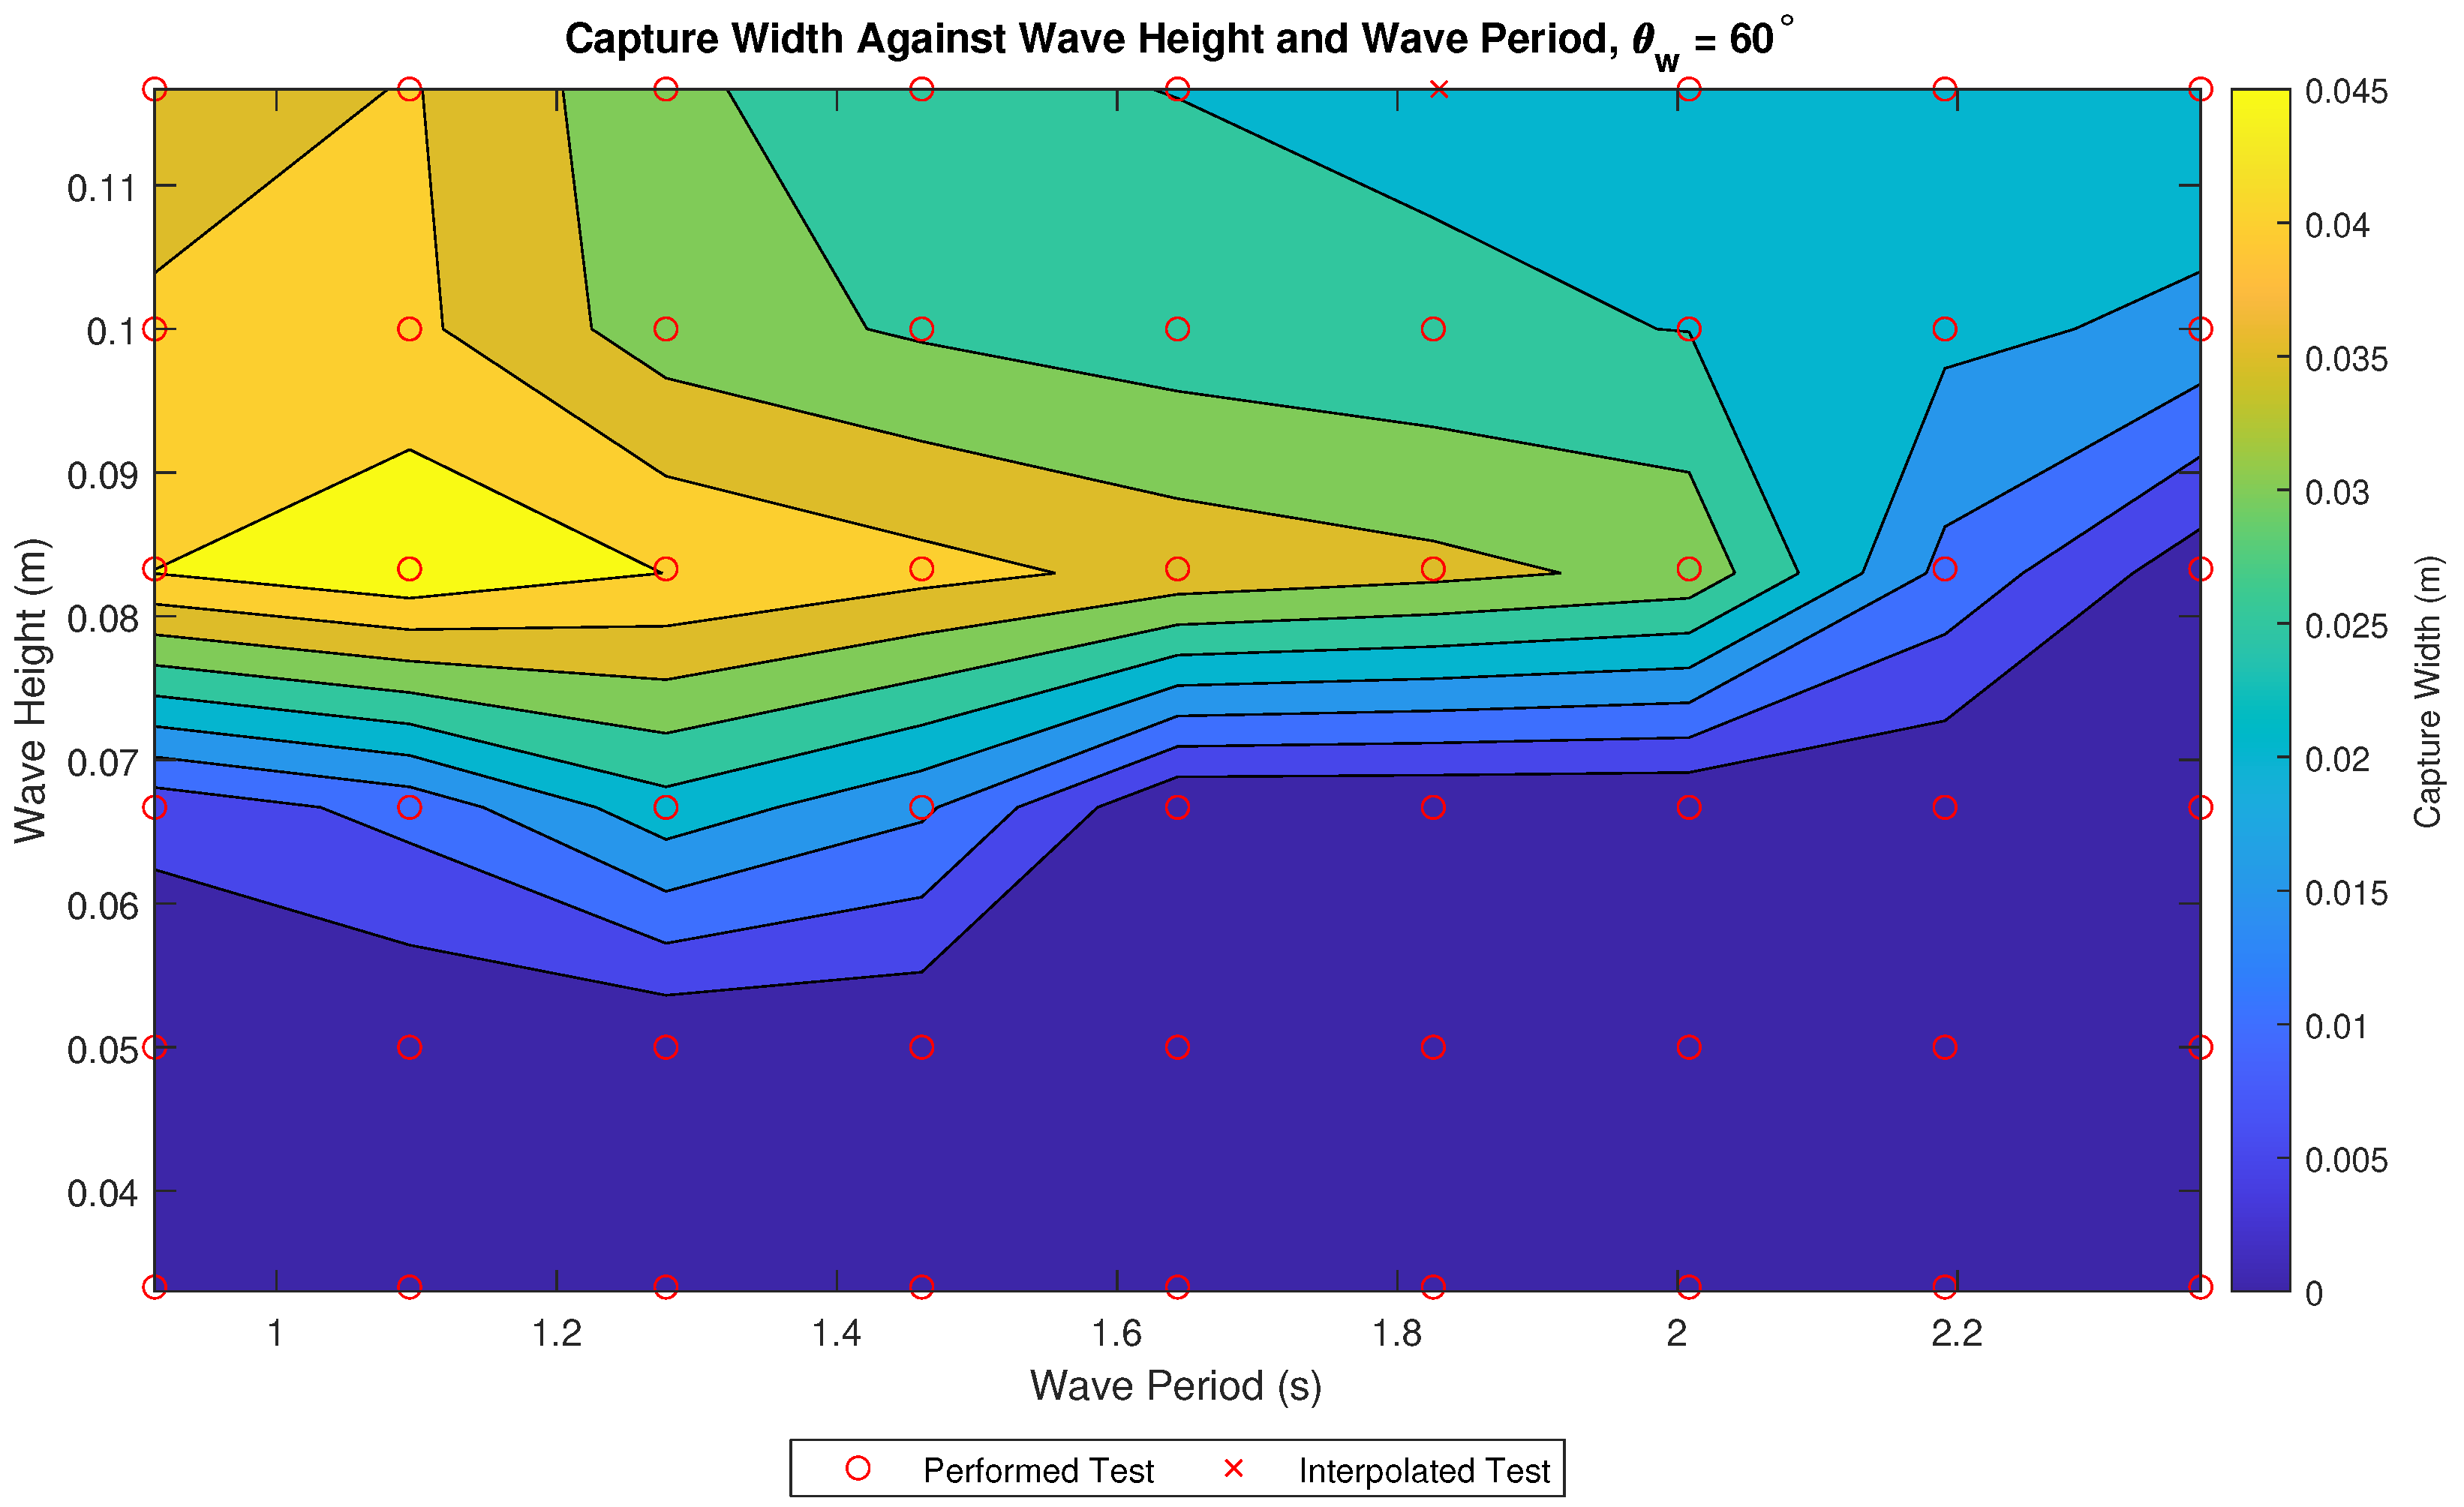
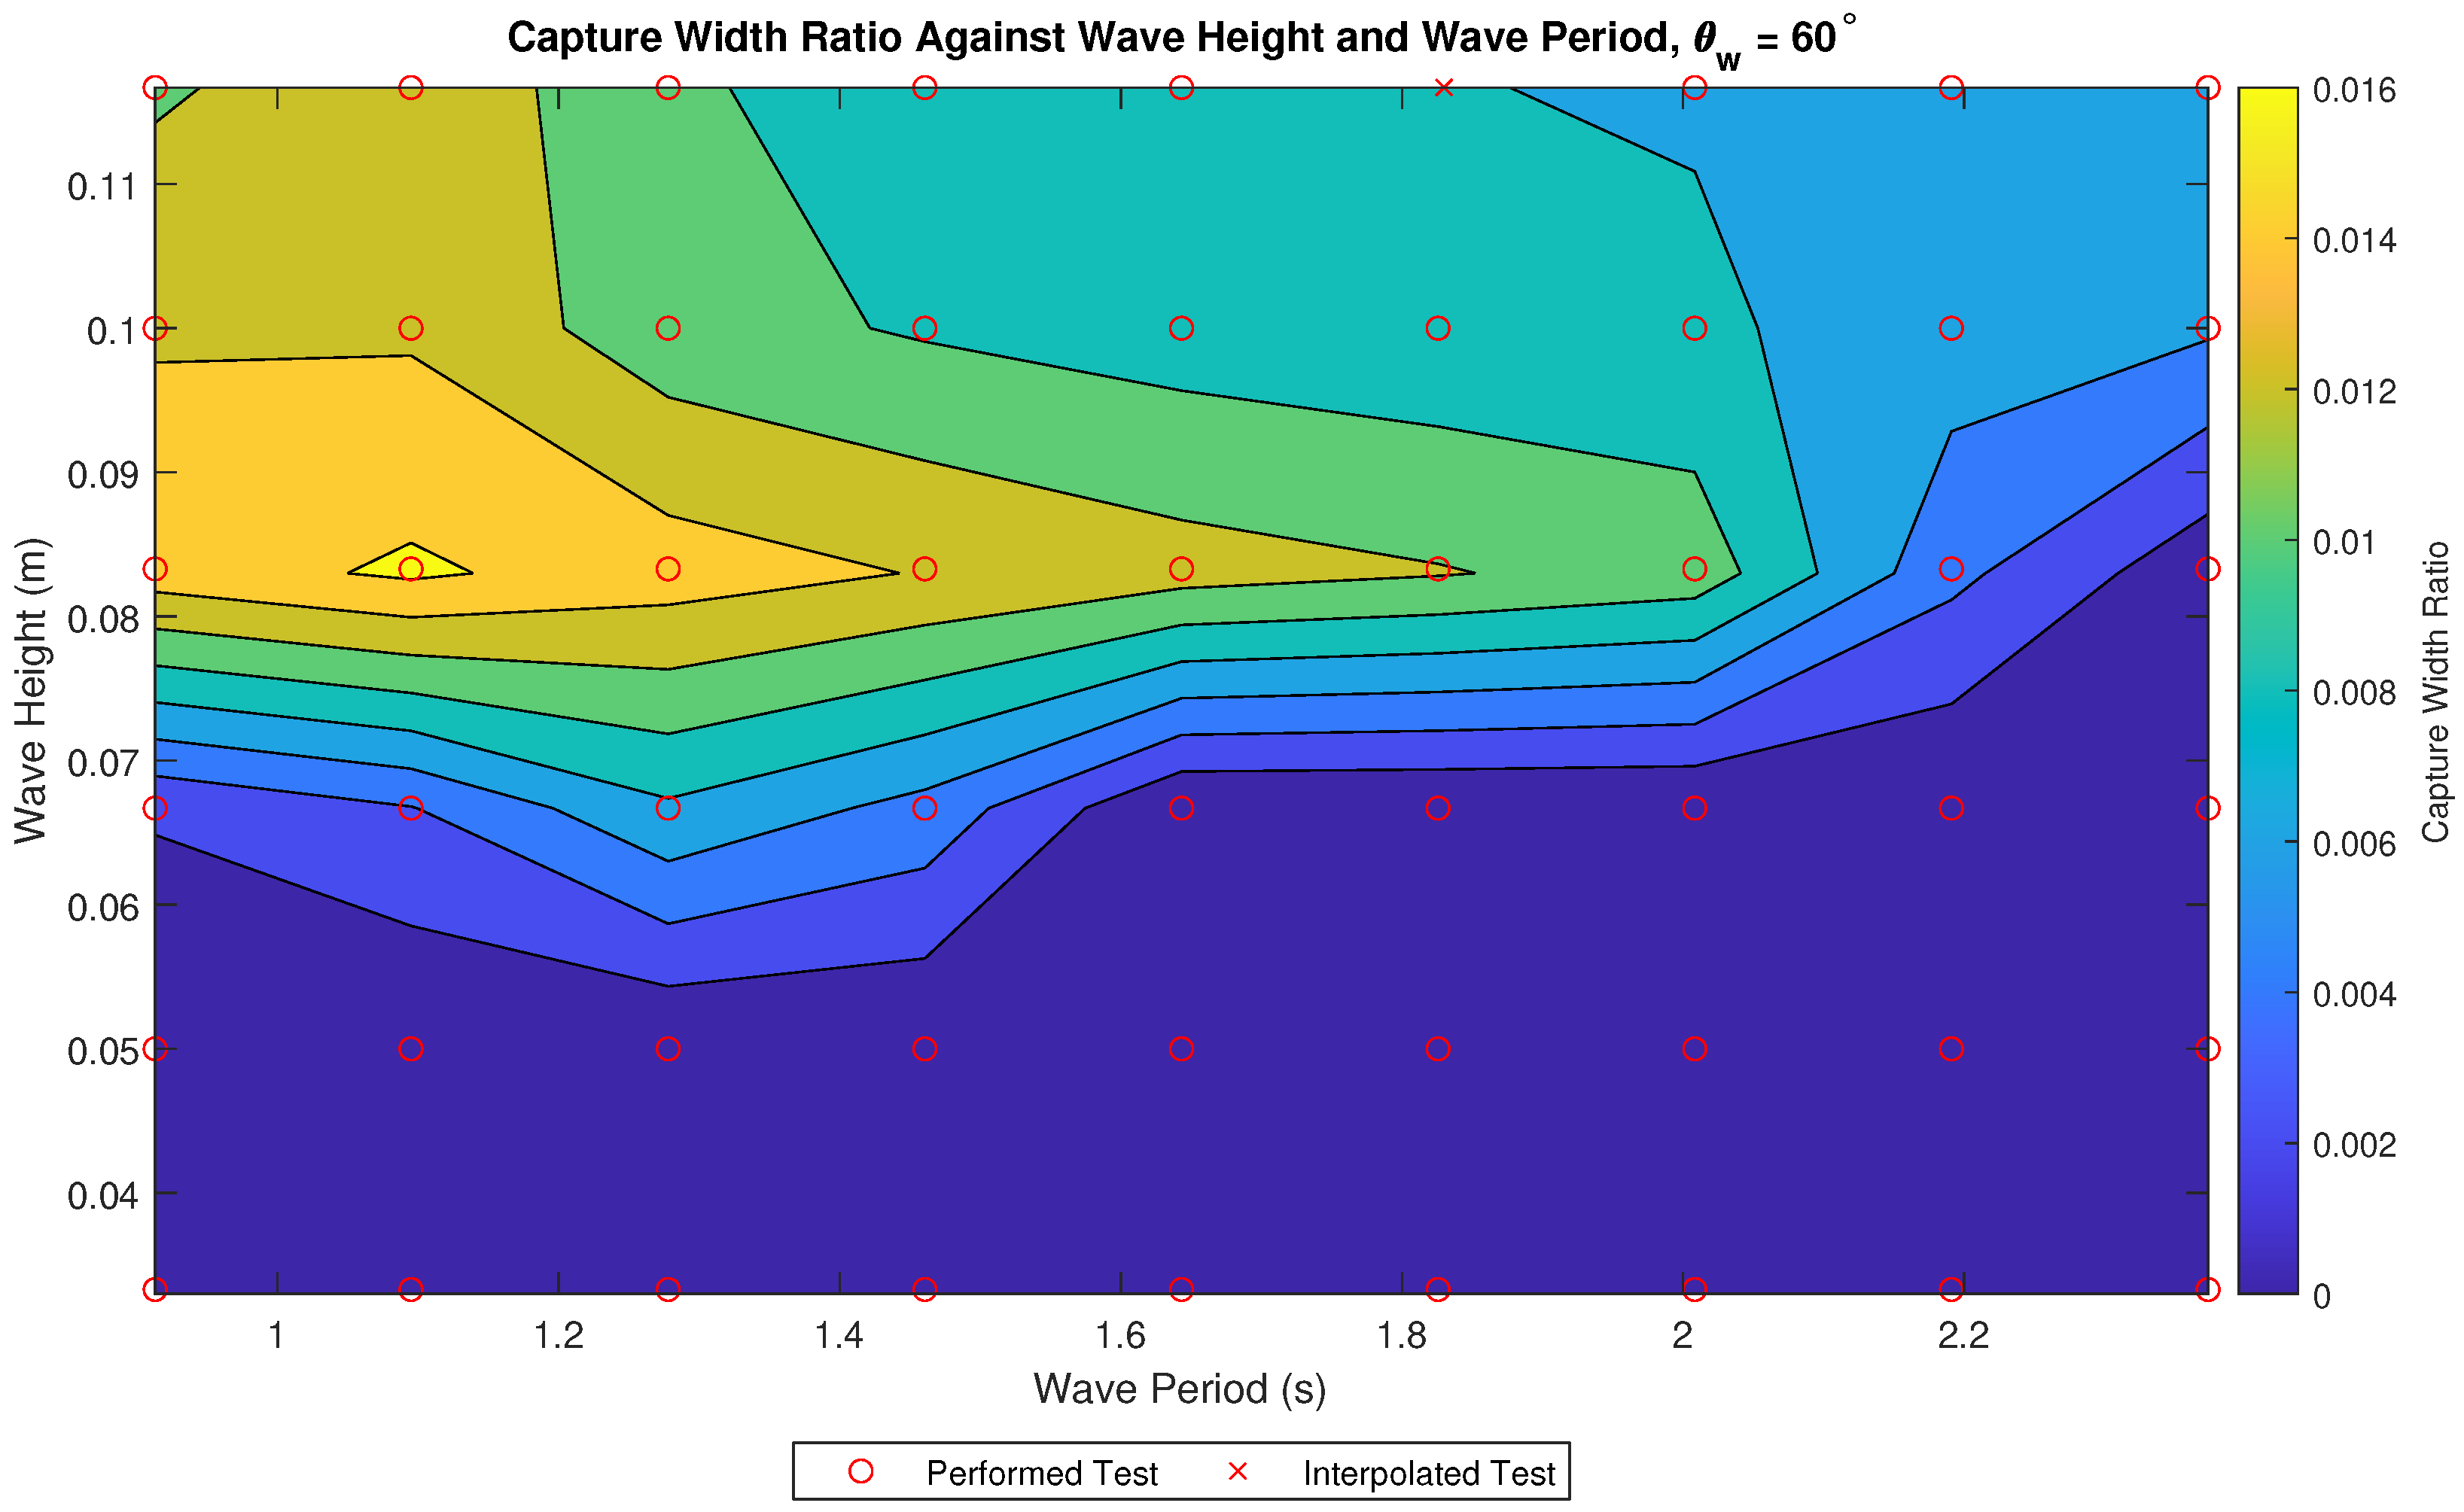
Figure 13 and Figure 14 show the CW and CWR, respectively. The highest CWR occurs at = 0.08 m and = 1.09 s. While this is not the most energetic test, nor the test with the highest overall power captured, it is the test that has the greatest efficiency in capturing power. This suggests that the device is capturing more than the power generation system can accommodate during tests with higher power produced.
4. Discussion
The WaveCat shows promise as a WEC based on the results of physical model testing. It can be compared to the wider community of WECs to observe how it compares to previous versions of the device and other devices.
A study prior to this paper at 1:30 scale [37], with , measured reflection and transmission coefficients. Two wave cases were shown to experience significant overtopping; Case (1) = 2.50 m and = 11 s, and Case (2) = 3.00 m and = 12 s. At model scale Case 1 represents = 0.08 m and = 1.83 s and Case 2 = 0.1 m and = 2.01 s. While the test conditions were similar, the tests presented in this study used Bretschneider spectra and the concept tests used JONSWAP spectra. The concept also used significantly lower freeboard, 0.04 m compared to 0.2 m in the presented study. The scaling factor was the same between studies.
For the two comparable tests in which the concept experienced significant overtopping, the was of 0.421 and 0.431 for cases (1) and (2), respectively. For the model presented in this study the was 0.291 and 0.250, respectively, shown in Figure 8, lower than that of the initial model tests. The transmission coefficient was also calculated for the same tests with the initial concept model having of 0.507 and 0.760 for the respective cases. The model presented in this study had of 0.869 and 0.898 for the equivalent tests.
In the two comparable wave conditions the new model configuration reflects less of the incident wave energy compared to the initial concept model and the transmission of the new model is higher. By applying Equation (8) to the and values given by the concept study [37], the resultant values are 0.752 for the test of = 2.50 m and = 11 s and 0.486 for the test of = 3.00 m and = 12 s. The values presented in this study, in Figure 10, for the equivalent tests are 0.341 and 0.302, respectively.
The coefficients show that for the two test cases the new model transmits a large proportion of the wave field, however it has been observed from the presented data that the new model is better adapted to short period waves, typically those that produce wavelengths of approximate model length. The change in model behaviour is likely to be the results of the motion and responses of the device changing to wavelengths shorter than that of model length and further study into the devices responses is required. This is the region where the greatest opportunity for the WaveCat to generate power is found, based on the estimated overtopping rates shown in Figure 11.
The power generation capability of the concept WaveCat was also estimated if scaled up to full scale, for Case 1 the concept generated 11.74 kW and for Case 2 43.08 kW. For the presented model the full scale power generation was estimated at 37.90 kW for Case 1 and 35.39 kW for Case 2. The updated WaveCat model shows better power generation at the lower test, however lower power at the higher test. It is worth noting, however, that the new model has a much wider range of conditions for which overtopping occurs and power is generated. When under conditions of the equivalent but with lower the power is higher than that of the higher tests.
The main cause of the differences in the two models is that the concept model used a much lower freeboard compared to the model presented in this study. The new model, however, represents an improvement over the concept as significant overtopping occurred for tests at a of 2.00 m at full scale, whereas the initial concept model only reported significant overtopping at of 2.50 m and higher. In addition, while the presented model produced power of a similar magnitude as that of the initial concept model, it did so during tests with lower values, showing a higher efficiency in the system.
In conditions of = 3.50 m and = 6 s, representing the case where the WaveCat performs best generating 64.6 kW, the Wave Dragon prototype generates 1450 kW [51]. The SSG, for the same conditions, generates 5348 kW [51]. In these conditions both devices are operating away from conditions that generate their rated power, suggesting they are better suited to different conditions to the WaveCat.
CWR is used to compare devices of differing dimensions by comparing the amount of power the device captures from the amount of wave front that is acting on the device. At this stage of development the WaveCat has a CWR of approximately 1.5% in the most efficient tests, compared to the Wave Dragon, which achieved CWRs between 21% and 27% depending on the device dimensions and resource [24,25]. Other OWECs, such as SSG, show a CWR of 23% [26], the Power Pyramid 12% [25] and the Sucking Sea Shaft 3% [25]. Individual devices within the OWEC category show large variations however, evidenced by large variations in the CWR [45]. The WaveCat is towards the lower end of the OWEC category, although it is early in development and requires significant further optimisation. Thus, far the device has been tested at a fixed of 60° identified in the previous study as performing well [37]. The present results show the updated model performs better in wave conditions that have shorter wave periods and thus a study of the effect of at these identified conditions should be carried out.
Optimisation is necessary for a device to progress towards commercialisation and the device thus far shows great versatility in its design. Particular attention should be paid to the devices hydrodynamic behaviour under wave action, as controlling motions relative to the incident wave field can enhance power output. The device has been shown to have greater values when the wavelength of the waves are close to or less than the model length, therefore extending the length of the proposed design could widen the parameter conditions that allow the device to achieve significant overtopping and power generation. The relationship between , freeboard and power production should also be investigated, as described above. The efficiency of the power conversion mechanism should also be explored, as well the structural elements of the WaveCat that are involved in the overtopping process.
5. Conclusions
In conclusion an updated version of the WaveCat WEC was designed and tested at 1:30 scale in the University of Plymouth Ocean Basin with the objective of quantifying reflection, transmission and absorption coefficients of the new WaveCat model. 54 tests were performed using random waves after which reflection and spectral analysis was applied to surface elevation measurements to obtain the coefficients. The amount of water that overtopped the device was recorded and an estimation of power generation made. Results showed that the device had the highest CWR, 0.015, during wave conditions of high and that produced wave of wavelength close to that of the model length. This corresponded to regions where the model had low and . The highest reflections, = 0.79, occurred at low and low regions. The highest transmission, = 0.98, occurred at regions of low and high . The highest absorption, = 0.78, occurred at regions of high and low . Further device optimisation is suggested to take advantage of the regions of high absorption and to tune the device to expand the conditions in which the device has high absorption.
Author Contributions
J.A. designed and performed the experiments, performed the analysis and wrote the manuscript. G.I. designed the WaveCat concept, contributed to experimental method and revised the manuscript. D.G. contributed to review of experimental and analysis method. J.M. assisted with the analysis method, revised the manuscript, and approved the final version. All authors have read and agreed to the published version of the manuscript.
Funding
The research was funded through funding received by Gregorio Iglesias through a Marie Curie fellowship (WAVEIMPACT, PCIG13-GA-2013-618556). James Allen received a Santander Seed-corn Scholarship for the experimental phase. The contribution of Jon Miles was supported by Intelligent Community Energy-533 (ICE), INTERREG V FCE, European Commission (Contract No. 5025).
Institutional Review Board Statement
Not applicable.
Informed Consent Statement
Not applicable.
Data Availability Statement
The data presented in this study are available on request from the corresponding author.
Acknowledgments
The authors would like to acknowledge the COAST Laboratory staff at the University of Plymouth for their expert assistance during the model build and testing phases.
Conflicts of Interest
The authors declare no conflict of interest.
Abbreviations
The following abbreviations are used in this manuscript:
| CALM | Catenary Anchor Leg Mooring |
| CW | Capture Width |
| CWR | Capture Width Ratio |
| EU | European Union |
| OWEC | Overtopping Wave Energy Converter |
| SSG | Sea Slot-Cone Generator |
| UK | United Kingdom |
| WEC | Wave Energy Converter |
References
- European Parliament and Council. Directive 2009/28/EC on the promotion of the use of energy from renewable sources. Off. J. Eur. Union 2009, 140, 16–62. [Google Scholar] [CrossRef]
- European Parliament and Council. Directive (EU) 2018/2001 of the European Parliament and of the Council of 11 December 2018 on the promotion of the use of energy from renewable sources. Off. J. Eur. Union 2018, 328, 82–209. [Google Scholar]
- Great Britain Parliament. Environment Bill; House of Commons Papers, Session 2019/21; HCB 9; UK Parliament Bill: London, UK, 2020. [Google Scholar]
- UK Parliament. Environment Bill 2019-21-UK Parliament. Available online: https://services.parliament.uk/Bills/2019-21/environment.html (accessed on 12 January 2021).
- Lund, H. Renewable energy strategies for sustainable development. Energy 2007, 32, 912–919. [Google Scholar] [CrossRef] [Green Version]
- Iglesias, G.; Carballo, R. Wave energy potential along the Death Coast (Spain). Energy 2009, 34, 1963–1975. [Google Scholar] [CrossRef]
- Iglesias, G.; Carballo, R. Offshore and inshore wave energy assessment: Asturias (N Spain). Energy 2010, 35, 1964–1972. [Google Scholar] [CrossRef]
- Iglesias, G.; Carballo, R. Wave energy resource in the Estaca de Bares area (Spain). Renew. Energy 2010, 35, 1574–1584. [Google Scholar] [CrossRef]
- Iglesias, G.; Carballo, R. Wave resource in El Hierro—An island towards energy self-sufficiency. Renew. Energy 2011, 36, 689–698. [Google Scholar] [CrossRef]
- Iglesias, G.; Carballo, R. Wave energy and nearshore hot spots: The case of the SE Bay of Biscay. Renew. Energy 2010, 35, 2490–2500. [Google Scholar] [CrossRef]
- Vicinanza, D.; Contestabile, P.; Ferrante, V. Wave energy potential in the north-west of Sardinia (Italy). Renew. Energy 2013, 50, 506–521. [Google Scholar] [CrossRef]
- López, M.; Veigas, M.; Iglesias, G. On the wave energy resource of Peru. Energy Convers. Manag. 2015, 90, 34–40. [Google Scholar] [CrossRef]
- Frost, C.; Findlay, D.; Macpherson, E.; Sayer, P.; Johanning, L. A model to map levelised cost of energy for wave energy projects. Ocean. Eng. 2018, 149, 438–451. [Google Scholar] [CrossRef]
- Astariz, S.; Vazquez, A.; Iglesias, G. Evaluation and comparison of the levelized cost of tidal, wave, and offshore wind energy. J. Renew. Sustain. Energy 2015, 7, 53112. [Google Scholar] [CrossRef]
- Astariz, S.; Iglesias, G. The economics of wave energy: A review. Renew. Sustain. Energy Rev. 2015, 45, 397–408. [Google Scholar] [CrossRef]
- Lopez-Ruiz, A.; Bergillos, R.J.; Ortega-Sanchez, M. The importance of wave climate forecasting on the decision-making process for nearshore wave energy exploitation. Appl. Energy 2016, 182, 191–203. [Google Scholar] [CrossRef]
- Guanche, R.; de Andres, A.; Losada, I.J.; Vidal, C. A global analysis of the operation and maintenance role on the placing of wave energy farms. Energy Convers. Manag. 2015, 106, 440–456. [Google Scholar] [CrossRef]
- Buccino, M.; Banfi, D.; Vicinanza, D.; Calabrese, M.; Del Giudice, G.; Carravetta, A. Non Breaking Wave Forces at the Front Face of Seawave Slotcone Generators. Energies 2012, 5, 4779–4803. [Google Scholar] [CrossRef]
- Buccino, M.; Vicinanza, D.; Salerno, D.; Banfi, D.; Calabrese, M. Nature and magnitude of wave loadings at Seawave Slot-cone Generators. Ocean. Eng. 2015, 95, 34–58. [Google Scholar] [CrossRef]
- Kofoed, J.P.; Frigaard, P.; Sorensen, H.C.; Friis-Madsen, E. Development of the Wave Energy Converter-Wave Dragon. In Proceedings of the International Offshore and Polar Engineering Conference, Seattle, WA, USA, 28 May–2 June 2000. [Google Scholar]
- Frigaard, P.; Kofoed, J.P.; Knapp, W. Wave Dragon. Wave Power Plant using Low-head Turbines. In Proceedings of the Hidroenergia 04: International Conference and Exhibition on Small Hydropower, Fakenberg, Sweden, 17–19 June 2004. [Google Scholar]
- Kofoed, J.P.; Frigaard, P.; Friis-Madsen, E.; Sorensen, H.C. Prototype testing of the wave energy converter wave dragon. Renew. Energy 2006, 31, 181–189. [Google Scholar] [CrossRef] [Green Version]
- Tedd, J.; Kofoed, J.P. Measurements of overtopping flow time series on the Wave Dragon, wave energy converter. Renew. Energy 2009, 34, 711–717. [Google Scholar] [CrossRef]
- Parmeggiani, S.; Chozas, J.F.; Pecher, A.; Friis-Madsen, E.; Sørensen, H.C.; Kofoed, J.P. Performance Assessment of the Wave Dragon Wave Energy Converter Based on the EquiMar Methodology. In Proceedings of the 9th European Wave and Tidal Energy Conference (EWTEC), Southampton, UK, 5–9 September 2011. [Google Scholar]
- Previsic, M.; Bedard, R.; Hagerman, G. E2I EPRI Assessment Offshore Wave Energy Conversion Devices; Electric Innovation Institute: Washington, DC, USA, 2004. [Google Scholar]
- Margheritini, L.; Vicinanza, D.; Frigaard, R. SSG wave energy converter: Design, reliability and hydraulic performance of an innovative overtopping device. Renew. Energy 2009, 34, 1371–1380. [Google Scholar] [CrossRef]
- Vicinanza, D.; Margheritini, L.; Kofoed, J.P.; Buccino, M. The SSG wave energy converter: Performance, status and recent developments. Energies 2012, 5, 193–226. [Google Scholar] [CrossRef] [Green Version]
- Buccino, M.; Salerno, D.; Banfi, D.; Vicinanza, D.; Kofoed, J.P.; Calabrese, M. Breaker types and loading characteristics at SSG. In Proceedings of the 10th European Wave and Tidal Energy Conference (EWTEC), Aalborg, Denmark, 2–5 September 2013. [Google Scholar]
- Buccino, M.; Stagonas, D.; Vicinanza, D. Development of a composite sea wall wave energy converter system. Renew. Energy 2015, 81, 509–522. [Google Scholar] [CrossRef] [Green Version]
- Holthuijsen, L.H.; Booij, N.; Ris, R.C. A spectral wave model for the coastal zone. In Proceedings of the 2nd International Symposium on Ocean Wave Measurement and Analysis, New Orleans, LA, USA, 25–28 July 1993; pp. 630–641. [Google Scholar]
- Monk, K.; Zou, Q.P.; Conley, D. An approximate solution for the wave energy shadow in the lee of an array of overtopping type wave energy converters. Coast. Eng. 2013, 73, 115–132. [Google Scholar] [CrossRef]
- Rodriguez-Delgado, C.; Bergillos, R.J.; Iglesias, G. Dual wave farms and coastline dynamics: The role of inter-device spacing. Sci. Total Environ. 2019, 646, 1241–1252. [Google Scholar] [CrossRef]
- Bergillos, R.; Rodriguez-Delgado, C.; Allen, J.; Iglesias, G. Wave energy converter geometry for coastal flooding mitigation. Sci. Total Environ. 2019. [Google Scholar] [CrossRef]
- Bergillos, R.; Rodriguez-Delgado, C.; Allen, J.; Iglesias, G. Wave energy converter configuration in dual wave farms. Ocean. Eng. 2019, 178, 204–214. [Google Scholar] [CrossRef]
- Iglesias, G.; Fernandez, H.; Carballo, R.; Castro, A.; Taveira-Pinto, F. The WaveCat-Development of A New Wave Energy Converter. In Proceedings of the World Renewable Energy Congress, Linköping, Sweden, 8–13 May 2011; Volume 57, pp. 2151–2158. [Google Scholar] [CrossRef] [Green Version]
- Fernández, H.; Iglesias, G.; Carballo, R.; Castro, A.; Sánchez, M.; Taveira-Pinto, F. Optimization of the wavecat wave energy converter. Coast. Eng. Proc. 2012. [Google Scholar] [CrossRef] [Green Version]
- Fernández, H.; Iglesias, G.; Carballo, R.; Castro, A.; Fraguela, J.A.; Taveira-Pinto, F.; Sanchez, M. The new wave energy converter WaveCat: Concept and laboratory tests. Mar. Struct. 2012, 29, 58–70. [Google Scholar] [CrossRef]
- Allen, J.; Sampanis, K.; Wan, J.; Greaves, D.; Miles, J.; Iglesias, G. Laboratory tests in the development of WaveCat. Sustainability 2016, 8, 1339. [Google Scholar] [CrossRef] [Green Version]
- COAST Laboratory. Available online: https://www.plymouth.ac.uk/research/institutes/marine-institute/coast-laboratory (accessed on 9 July 2020).
- Tucker, M.J. Waves in Ocean Engineering: Measurement, Analysis, Interpretation; Ellis Horwood Series in Applied Science and Industrial; Techn, E., Ed.; Horwood: Hemel Hemstead, UK, 1991. [Google Scholar]
- ITTC. ITTC—Recommended Procedures and Guidelines-Seakeeping Experiments. In 27th ITTC Seakeeping Committee; (7.5-02 07-02.1); 2014; pp. 1–22. Available online: https://www.ittc.info/media/8101/75-02-07-021.pdf (accessed on 12 January 2021).
- Feynman, R.P.; Leighton, R.B.; Sands, M. The Feynman Lectures on Physics, Vol. I: The New Millennium Edition: Mainly Mechanics, Radiation, and Heat; The Feynman Lectures on Physics; Basic Books: New York, NY, USA, 2011. [Google Scholar]
- OMEGA Engineering. All Plastic Flow Sensors. Available online: https://www.omega.co.uk/pptst/FTB600.html (accessed on 24 April 2018).
- Budar, K.; Falnes, J. A resonant point absorber of ocean-wave power. Nature 1975, 256, 478–479. [Google Scholar] [CrossRef]
- Babarit, A. A database of capture width ratio of wave energy converters. Renew. Energy 2015, 80, 610–628. [Google Scholar] [CrossRef] [Green Version]
- Baquerizo, A. Wave Reflection at Beaches. Prediction and Evaluation Methods. Ph.D. Thesis, University of Cantabria, Santander, Spain, 1995. [Google Scholar]
- Mansard, E.; Funke, E. The measurement of incident and reflected spectra using a least squares method. Coast. Eng. 1980. [Google Scholar] [CrossRef] [Green Version]
- Nuttall, A.H. Spectral Estimation by Means of Overlapped Fast Fourier Transform Processing of Windowed Data; Naval Underwater Systems Center Report No. 4169; 1971; Available online: https://apps.dtic.mil/dtic/tr/fulltext/u2/739315.pdf (accessed on 12 January 2021).
- Jenkins, G.M.; Watts, D.G. Spectral Analysis and Its Application; Holden-Day: San Francisco, CA, USA, 1968. [Google Scholar]
- Thornton, E.B.; Calhoun, R.J. Spectral Resolution of Breakwater Reflected Waves. ASCE J. Waterw. Harbors Coast. Eng. Div. 1972, 98, 443–460. [Google Scholar] [CrossRef]
- Silva, D.; Rusu, E.; Soares, C.G. Evaluation of various technologies for wave energy conversion in the Portuguese nearshore. Energies 2013, 6, 1344–1364. [Google Scholar] [CrossRef]
Figure 1.
The WaveCat concept showing twin hulls containing on-board tanks converging at the rear of the device.
Figure 1.
The WaveCat concept showing twin hulls containing on-board tanks converging at the rear of the device.

Figure 2.
The 1:30 scale model constructed at the University of Plymouth in situ during experimentation.
Figure 2.
The 1:30 scale model constructed at the University of Plymouth in situ during experimentation.

Figure 3.
Plan view, above, and lateral view, below, of the model with dimensions shown in mm, at model scale. The wedge angle can be varied between 0°, closed, and 170°.
Figure 3.
Plan view, above, and lateral view, below, of the model with dimensions shown in mm, at model scale. The wedge angle can be varied between 0°, closed, and 170°.

Figure 4.
The experimental setup showing wave gauges, model and floor position in plan view, above, and section view, below. Dimensions in m.
Figure 4.
The experimental setup showing wave gauges, model and floor position in plan view, above, and section view, below. Dimensions in m.

Figure 5.
Random wave cases tested showing model scale values and full scale values.

Figure 6.
Example time series of surface elevation for the wave gauge located between the model and wavemakers, closest to the model.
Figure 6.
Example time series of surface elevation for the wave gauge located between the model and wavemakers, closest to the model.

Figure 7.
Spectral analysis of = 0.12 m, = 1.28 s, = 60°. Incident, reflected, transmitted and absorbed spectra are shown in blue, orange, yellow and purple, respectively.
Figure 7.
Spectral analysis of = 0.12 m, = 1.28 s, = 60°. Incident, reflected, transmitted and absorbed spectra are shown in blue, orange, yellow and purple, respectively.

Figure 8.
against significant wave height and peak wave period.

Figure 9.
against significant wave height and peak wave period.

Figure 10.
against significant wave height and peak wave period.

Figure 11.
Collected power as measured through flowmeter readings over the course of a test.

Figure 12.
Power scaled to full scale based on experimental results.

Figure 13.
The CW of the WaveCat model.

Figure 14.
The CWR of the WaveCat model.

Publisher’s Note: MDPI stays neutral with regard to jurisdictional claims in published maps and institutional affiliations. |
© 2021 by the authors. Licensee MDPI, Basel, Switzerland. This article is an open access article distributed under the terms and conditions of the Creative Commons Attribution (CC BY) license (http://creativecommons.org/licenses/by/4.0/).
Share and Cite
MDPI and ACS Style
Allen, J.; Iglesias, G.; Greaves, D.; Miles, J. Physical Modelling of the Effect on the Wave Field of the WaveCat Wave Energy Converter. J. Mar. Sci. Eng. 2021, 9, 309. https://0-doi-org.brum.beds.ac.uk/10.3390/jmse9030309
AMA Style
Allen J, Iglesias G, Greaves D, Miles J. Physical Modelling of the Effect on the Wave Field of the WaveCat Wave Energy Converter. Journal of Marine Science and Engineering. 2021; 9(3):309. https://0-doi-org.brum.beds.ac.uk/10.3390/jmse9030309
Chicago/Turabian StyleAllen, James, Gregorio Iglesias, Deborah Greaves, and Jon Miles. 2021. "Physical Modelling of the Effect on the Wave Field of the WaveCat Wave Energy Converter" Journal of Marine Science and Engineering 9, no. 3: 309. https://0-doi-org.brum.beds.ac.uk/10.3390/jmse9030309
Note that from the first issue of 2016, this journal uses article numbers instead of page numbers. See further details here.