Article

Wave Dissipation and Sediment Transport Patterns during Shoreface Nourishment towards Equilibrium

1
State Key Laboratory of Hydrology-Water Resources and Hydraulic Engineering, Hohai University, Nanjing 210024, China
2
College of Harbour, Coastal and Offshore Engineering, Hohai University, Nanjing 210024, China
3
Tianjin Research Institute of Water Transport Engineering, Tianjin 300456, China
4
Third Institute of Oceanography, Ministry of Natural Resources, Xiamen 361005, China
*
Authors to whom correspondence should be addressed.
J. Mar. Sci. Eng. 2021, 9(5), 535; https://0-doi-org.brum.beds.ac.uk/10.3390/jmse9050535
Submission received: 21 April 2021 / Revised: 11 May 2021 / Accepted: 13 May 2021 / Published: 17 May 2021
(This article belongs to the Section Coastal Engineering)

Abstract

:
Implementing shoreface nourishment is an effective method to protect sandy beaches. A better understanding of the equilibrium mechanism of shoreface nourishments is necessary for coastal engineering designs and constructions. Two experiments on the beach profile equilibrium of the shoreface nourishment are carried out under mild wave conditions on the reflective and intermediate beach. It is observed that the shoreface nourishment increases local wave height and strengthens wave nonlinearity by its shallow water depth. The most intense wave breaking dissipation has been found on the crest of the shoreface nourishment, and the distribution of wave energy dissipation rate is more uniform on the quasi-equilibrium profile than that on the initial profile. A process-based numerical model is used to reproduce bed profile evolution successfully. On that basis, it is found that onshore bedload transport is the primary cause for the onshore migration of the shoreface nourishment. The magnitude of bedload transport decreases during the evolution of the shoreface nourishment towards equilibrium. The most intense sediment transport rate occurs over the shoreface nourishment or in front of the shoreline, depending on the ’lee effect’ of the nourishment. Furthermore, the effects of incident wave height, wave period, and sea-level rise on the equilibrium profile of the shoreface nourishment under mild wave conditions are analyzed.

1. Introduction

Coastal areas functioning as habitats for amphibians are densely populated and economically developed. Nowadays, coastal communities are currently threatened by climatic change and anthropogenic activities [1,2]. Climate change, such as sea-level rise and global warming could result in growing risks of barrier island breaching and coastal flooding [3,4,5,6]. For instance, based on contemporary monitoring of storm activities, Tao and Li [4] found the risk of coastal flooding caused by storm surges becomes a serious problem worldwide. Anthropogenic activities are also inducements to the degradation of coastal environment. Traditional ‘hard structures’ such as, seawalls and submerged dikes, are constructed mostly focusing on the protections of lives and assets, without taking the environmental health into account [7]. Although these ‘hard structures’ can provide protective services within a certain period, they will cause negative impacts on landscapes, ecosystems, biodiversity, and biological interactions in the long run [2,8,9]. At present, several maritime policies aim to protect coastal habitats and natural resources using environmental-friendly strategies [2,6]. Shoreface nourishment is a kind of ‘soft engineering’ to save our beaches from marine disasters, and it will not impose a burden on the environment.
Shoreface nourishment is one of the most widely used nourishment strategies due to the intensification of storm frequency [10]. It has been implemented extensively worldwide from 1990s [11,12,13,14,15,16]. The effect of the shoreface nourishment is multi-functional, the most representative two functions are so-called the ‘lee effect’ and ‘feeder effect’. The ‘lee effect’ indicates destructive waves could be triggered to break in advance by the shoreface nourishment to protect the littoral areas. Meanwhile, the ‘feeder effect’ represents the shoreface nourishment acts as a ‘sediment reservoir’ to supply extra sediments to beach-dune systems taking advantage of natural wave forces. Compared with the ‘lee effect’, the ‘feeder’ effect usually functions under mild wave conditions to nourish the beach in a slow, cumulative way. Both the ‘lee effect’ and ‘feeder effect’ have been proved in the laboratory and in real-world beaches [17,18]. Shoreface nourishments are typically in motion due to the mismatch between beach states and incident wave conditions, and it will tend to be equilibrium (quasi-equilibrium) under a given wave condition for sufficiently long time. A better understanding of wave dissipation and sediment transport patterns during the evolution of the shoreface nourishment towards equilibrium under mild wave conditions is beneficial to take full advantage of the ‘feeder effect’ and to reduce constructional cost.
Previous equilibrium models were mostly based on two concepts. The first concept is that the bulk net sediment transport at equilibrium is related to the ‘discrepancy’ between the instantaneous beach state and the equilibrium state. The beach state is usually reflected by the dimensionless settling velocity [19,20,21,22]. Recently, Birren and Baldock [23] coupled this kind of equilibrium model with a parametric wave dissipation model to show the morphological feedbacks to hydrodynamics. The other concept is the assumption that the volumetric wave energy dissipation rate is uniform on the equilibrium beach, firstly proposed by Dean [24]. This assumption has been proved on beach profiles without shoreface nourishments in the large-scale wave flume [25]. However, these models have neither been tested on artificial beaches with shoreface nourishments, nor revealed whether the wave dissipation rate will be more uniform on quasi-equilibrium beach profile with shoreface nourishments.
The shoreface nourishment can be regarded as a local perturbation that involves complicated feedbacks between the evolving morphology and driving forces. Both wave nonlinearity and setup will evolve differently on beaches without shoreface nourishments [26,27,28]. So far, the studies regarding detailed sediment transport of shoreface nourishment are scarce, to the best of the authors’ knowledge. Recent studies have paid much attention to the morphological evolution of the shoreface nourishment and its impact on the littoral areas. Atkinson and Baldock [29] found the shoreface nourishment is capable of reducing shoreline recession under sea-level rise. Grasso et al. [17] found the performance of the shoreface nourishment differs in various filling positions. The development of new equipment favors the measurements of near-bed hydrodynamics and sediment transport rate. Hurther et al. [30] used a multi-frequency Acoustic Concentration and Velocity Profiler (ACVP) for boundary layer measurements. van der Zanden et al. [31] measured flow velocity and sediment concentration around the breaker bar using Acoustic Doppler velocimeters (ADVs) and Transverse Suction System (TSS). van der Zanden et al. [32] measured sediment concentration in the sheet flow layer using two Conductivity-based Concentration Measurement (CCM+) tanks. However, detailed measurement of sediment transport rate is still difficult due to the small water depth over the shoreface nourishments. Therefore, process-based beach evolution models which couple the complex wave–current–sediment processes can provide a useful tool.
The objective of this study is to investigate the wave dissipation and sediment transport patterns during the evolution of shoreface nourishment towards equilibrium under mild wave conditions. Three main research questions need to be answered: (1) on the artificial beach with shoreface nourishments, will the wave energy dissipation rate be more uniform on the quasi-equilibrium state than on the initial state (i.e., just after the implementation of the shoreface nourishment)? (2) Which type of sediment transport dominates the onshore migration of the shoreface nourishment, and how does it evolve during the evolution of shoreface nourishment towards equilibrium? (3) How can wave height, period, and sea-level rise influence the equilibrium profile of the shoreface nourishment? To this end, both laboratory experiments and numerical modelings are carried out. This paper has been organized as follows. Section 2 provides brief descriptions of the experimental setup and the numerical model. The experimental results and model calibration are provided in Section 3. Discussion and conclusions are listed in Section 4 and Section 5, respectively.

2. Methods

2.1. Experimental Observations

Two experiments with shoreface nourishments were carried out on the reflective and intermediate beach. Wave-making procedure was terminated when the beach profile tended to be equilibrium. The general descriptions of these two experiments are provided below.

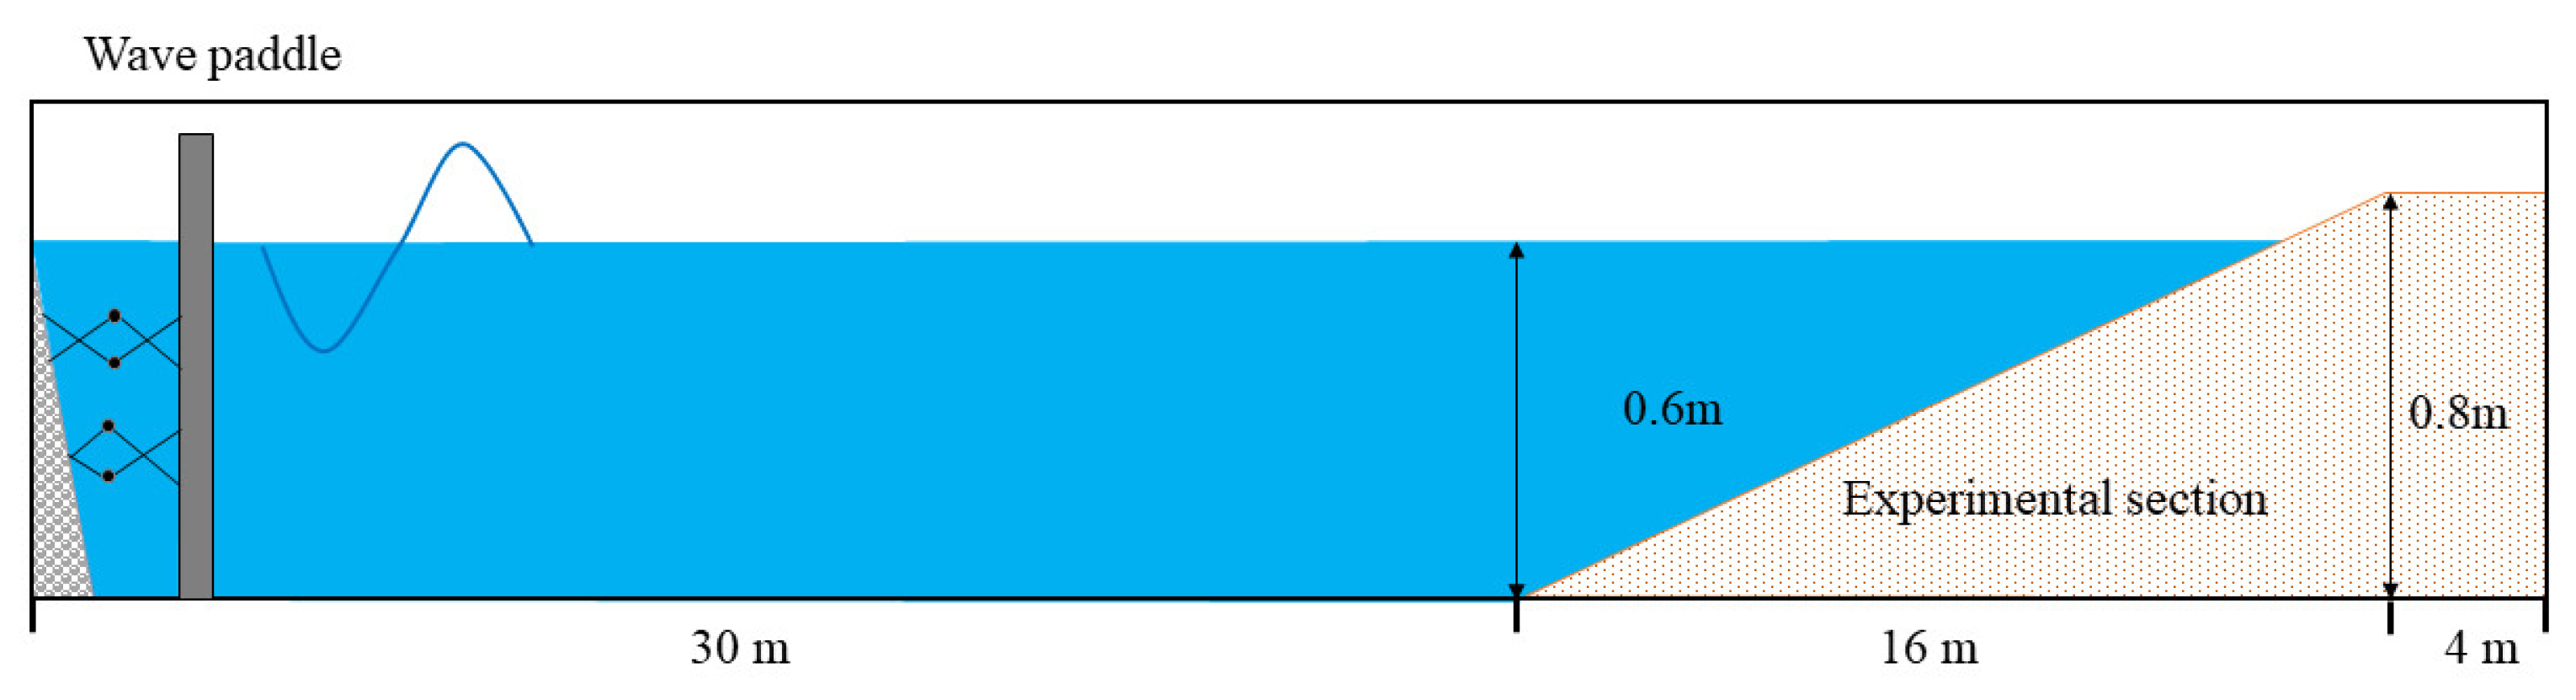
2.1.1. Experimental Setup

Experiments were conducted in a wave flume of 50 m length, 0.5 m width, and 1 m height. The wave flume belongs to Tianjin Research Institute of Water Transport Engineering, Tianjin, China. The working still water depth was 0.6 m. A paddle wave-maker was equipped at one end of the flume, and a porous media plate was installed to reduce secondary wave reflection. In the experiment, irregular waves were generated according to JONSWAP spectrum with the peak enhancement factor of 3.3. As can be seen in Figure 1, the experimental section was located from 30 m away from the wave paddle. The shape of the experimental section was generally a slope of 1/20, behind which, a 4 m long horizontal sand platform was used to support the experiment section. The 4 m horizontal part was located shoreward of the shoreward swash limit that did not show any beach evolution during the experiment. The experimental section consisted of natural well-sorted sands of median grain size d50 of 0.23 mm and sorting coefficient of 1.45. Sediment settling velocity was measured in cylinder filled with clean water, and its value was 0.03 m/s.
Before the implementation of the shoreface nourishment, two types of background profiles were generated from the initial sloping profile. According to the dimensionless sediment settling velocity parameter ( Ω = H s 0 / ω s T p , Hs0 is incident significant wave height, ws is sediment settling velocity and Tp is incident peak wave period, two sets of incident wave parameters were chosen to form a reflective and intermediate beach. The reflective beach was formed using irregular waves with Hs0 = 0.05 m, Tp = 2 s, Ω = 0.83. The intermediate beach was double-barred and was generated with Hs0 = 0.16 m, Tp = 1.6 s, Ω = 3.3. Wave durations for the reflective and intermediate beach were 14 h and 11 h, respectively. Wave generation was terminated when the whole profile tended to be equilibrium.
After the formations of background profiles, the shoreface nourishment was implemented. As provided in Figure 2, the shape of the shoreface nourishment in each case was triangle since a nourishment with a more concentrated geometry shape provides a higher protecting efficiency [33]. Triangular nourishments can be found in the nourishment project of Qinhuangdao Coast, China [16]. The volume of the shoreface nourishment was designed to equal to the volume of the outer sandbar on the intermediate beach. The design methodology can be validated by a real-world nourishment project at the Egmond beach [13], the shoreface nourishment volume is designed to be almost equal to the outer sandbar in this project. The ratio of both sides slope of the shoreface nourishment was same as that of the outer bar with respect local profile slope, since the ratio of both slopes can be recognized as an indicator of migration directions according to the 4-year field observations in [34]. On the reflective beach, the seaward slope toe of the shoreface nourishment was located at the position of the closure depth. In real-world beach nourishment projects, most of the shoreface nourishments are implemented within 8 m water depth [12,13,14,15,16]. On the intermediate beach, the shoreface nourishment was implemented on the trough of the outer sandbar. Similar nourishment implementation strategies can also be found on real-world beaches. For instance, a total of 2 Mm3 sediments were supplied to the trough of the outer bar on the Terschelling beach in 1993 [15]. As provided in Table 1, the incident wave conditions for these two cases are characterized by their Hs0, Tp and the corresponding Ω. A small value of Ω (generally less than 2) indicates the reflective beach state, and thus represents the mild wave condition in most cases [20]. As a preliminary test before the experiments, it was observed that the bottom profile was rarely changed when Hs0 < 0.05 m. Each experiment was terminated when the beach profile tended to be equilibrium. Case E1_1 took more time to be equilibrium than A1_2, thus the duration for E1_1 was larger than A1_2. It is noted that the same wave condition for the background reflective profile was used for A1_2. However, the wave condition for E1_1 was with a much smaller wave height and a larger wave period than those of the background intermediate profile to promote the shoreface nourishment to migrate onshore.

2.1.2. Data Treatment

In this experiment, beach bottom elevation was measured by the Trimble scan X configuration scanner with measuring error less than 1 mm. Wave gauges were used to record water surface elevation with measuring error less than 0.12% [35]. The sampling frequency was set as 50 Hz. Before and after each wave duration, wave gauges were calibrated in a tube with slightly changed water levels. During the experiment, the wave making process was temporarily interrupted to the moment when the surface of the water regained its calm, and then waves were made again. A band-pass filtering method was used to separated high-frequency motions (short wave component) and low-frequency motions (long wave component) and to remove high-frequency tails. The upper and low cut-off frequencies were 4 and 0.5 times of the peak frequency, respectively. Analysis on wave height and wave dissipation in this study are based on short wave components. The wave height is calculated by spectrum analysis rather than wave zero-crossing. Furthermore, wave skewness and asymmetry are defined as,
S k = ( η η ¯ ) 3 ( η η ¯ ) 2 3 / 2
A s = H ( η η ¯ ) 3 ( η η ¯ ) 2 3 / 2
in which, η is water surface elevation, H is the Hilbert transformation, < > and overbar denotes period-averaging.

2.1.3. Scale Relationships

The present study does not model the shoreface nourishment evolution on a real-world beach, but try to achieve similitudes in terms of the morphological evolution [21]. The scale relationships are designed according to Henriquez et al. [36], a brief description is provided here. Since the present experiment is conducted for the onshore migration of the shoreface nourishment under mild wave conditions, the similarity for bedload transport should be firstly fulfilled, i.e., the scale ratios of grain size Reynolds number and Shields number should equal to 1. The grain size Reynolds number (Re) and Shields number ( θ ) are defined as,
Re = u * d ν
θ = ρ u * 2 γ s d
in which, u* is shear velocity, d is representative grain diameter, ν is water kinematic viscosity. γ s is specific gravity defined as γ s = ( ρ s ρ )   g , where g is gravity acceleration, and ρ s and ρ are sediment density and water density, respectively. Furthermore, suspended sediment transport plays a crucial role in the surf zone, and the suspended sediment transport rate is strongly linked to the relative sediment settling velocity V defined as [37],
V = ω s u *
To fulfill the requirements for the scale ratios, the below three equations should be considered:
n R e = n u * n d n ν 1 = 1
n θ = n u * 2 n γ s 1 n d 1 = 1
n V = n γ s 0.7 n d 1.1 n u * 1 = 1
in which, n is scale factor for each quantity. Following conditions are applied to simplify Equations (6)–(8). They are the usage of natural water, fulfill the Froude law, and substitution of wave shear velocity [36]. Thus, Equations (6)–(8) can be written as,
n R e = n h 0.7 n d 2.3 = 1
n θ = n h 0.7 n γ s 1 n d 0.7 = 1
n V = n h 0.7 n γ s 1.4 n d 1.9 = 1
in which, h is water depth. According to Henriquez et al. [36], Equations (9)–(11) can be fulfilled when n d = n h 0 . 3 and n γ s = n d 3 . By using the relation scales above, the following processes can be properly reproduced. They are the turbulent regime in wave bottom boundary layer, sediment initial motion by wave friction and settling of suspended sediment. However, using the scale relationships above cannot maintain the Sleath number [38], and the scaled mobility of sediment is larger than that on prototype beaches. Thus, the modeled onshore migration rate of the shoreface nourishment could be faster than that on real-world beaches.

2.2. Numerical Model

A process-based numerical model CROSPE [39] is used to reproduce the shoreface nourishment evolution. The model has been successfully applied to model sandbar offshore/onshore migration [39] and barred beach profile equilibrium [40]. We provide a brief description here.
The time-averaged wave and roller energy conservation equations are used to model wave transformation and roller evolution, respectively.
( E w c g ) x = D w D f
( 2 E r c p ) x = D w D r
D r = 2 g E r sin β c p
In Equation (12), Ew is wave energy density, cg is group velocity, and they are both calculated by linear wave theory. Dw is wave breaking energy dissipation estimated by the method of [41], and Df is energy dissipation due to bottom friction. In Equation (13), Er is roller energy, cp is phase velocity, and Dr is roller dissipation. In Equation (14), β is roller slope. Cartesian coordinate system is used with x representing cross-shore distance (with its origin at the toe of experimental section and positive shoreward) and z representing vertical distance (with its origin at the still water level and positive upward). Depth-integrated and period-averaged momentum equation is used to calculated mean wave setup η ¯ .
S x x x + ( 2 E r ) x + ρ g ( h + η ¯ ) η ¯ x = 0
in which, Sxx is wave radiation stress.
The instantaneous flow velocity is modeled using the wave–current momentum equation [42].
u t i = u t i + z [ ( ν t + ν ) u z ] 1 ρ p ¯ x 1 ρ τ b l s ¯ z
in which, ti is the time within a wave period, u is the instantaneous intra-wave flow velocity at a given level, vt is turbulent eddy viscosities. p ¯ is mean pressure, τ bls ¯ is additional mean shear stress induced by bottom boundary layer streaming. u is the wave-induced instantaneous near-bed free stream velocity which is calculated by an empirical parameterization proposed by Ruessink et al. [43]. The turbulent eddy viscosity vt in Equation (16) is calculated with the method proposed in Zheng et al. [39].
ν t = f v H r m s ( D r ρ ) 1 3 z h t | u e 3 | ¯ + | u e 3 | | u e 3 | ¯
u e = cos φ u + sin φ 1 ω d u d t
in which, fv is turbulence factor, ht is water depth below the wave trough level, φ is a phase-shift angle, and ω is the angle frequency. ue is effective velocity used to control intra-wave variation of eddy viscosity [44].
The last term in right hand in Equation (16) represents the mean–shear–stress gradient induced by bottom boundary layer streaming, defined as [45],
1 ρ τ b l s ¯ z = { D f ρ c p δ ( z δ ) 0 ( z > δ )
where δ is boundary-layer thickness. Detail expressions for both δ and Df can be found in Reniers et al. [45]. Meanwhile, the mean–horizontal–pressure gradient (−ρ p ¯ /∂x) in Equation (16) is solved using an iterative method using the mass conservation equation,
1 T 0 T 0 h t u d z d t + Q w + Q r = 0
Q w = 1 12 g c p H r m s 2
Q r = 2 E r ρ c p
in which, T is a representative wave period, t is model time, Qw and Qr are net mass fluxes induced by waves and rollers, respectively. The boundary conditions for Equation (16) are,
u = 0 ( z = z 0 = k s 30 )
τ = D r c p ( z = h t )
where τ mean shear stress at the wave trough level, ks = 2.5 d50 is bed roughness. z0 is theoretical bed level.
Wave-averaged total sediment transport rate is calculated by the sum of suspended sediment transport rate and bedload transport rate.
q ¯ t = q ¯ s + q ¯ b
in which, qt, qb, and qs are instantaneous total, bedload and suspended sediment transport rates, respectively. The estimation of bedload sediment transport rate is complicated due to the complexity of sediment pick-up and sheet flow processes [46,47]. Therefore, qb is calculated with the Meyer–Peter–Mueller type formula [48] for convenience in this model.
q b = 11 β s θ | θ | ( | θ | θ c r ) 1.65 ( s 1 ) g d 50 3
θ = τ b ρ ( s 1 ) g d 50
where τb is instantaneous bed shear stress, s is density ratio of sand to water with a default value of 2.65, θ is Shields parameter, θcr is slope-corrected critical Shields parameter and βs is bed-slope correction factor, which include the effect of bed repose angle. See Zheng et al. [39] for detailed formulations of βs and θcr.
The instantaneous suspended sediment, transport rate is calculated by integrating the product of sediment concentration c and flow velocity u.
q s = z a h t u c d z
The spatiotemporal variations of sediment concentration are solved with the advection–diffusion equation.
c t i = ω s c z + z ( ε s c z )
where εs represents sediment diffusivity. Sediment settling velocity in Equation (29) is calculated according to van Rijn [37] by considering the hindered settling effect [49].
ω s = ω s 0 ( 1 c 0.6 ) 5
where ws0 is setting velocity in clear water. Sediment diffusivity is related to the turbulent eddy viscosity by Prandtl/Schmidt number σ p and the turbulence damping effects [37]:
ε s = ν t ¯ σ p [ 1 + ( c 0.6 ) 0.8 2 ( c 0.6 ) 0.4 ]
Prandtl/Schmidt number σ p is set as 1 for the equivalent contributions for advection and diffusion. Two boundary conditions are employed to solve Equation (29). At the upper boundary, sediment concentration is zero. At the bottom boundary, a reference sediment concentration according to the formula of Zyserman and Fredsøe [50] is used at za near the bed.
It should be noted that the present model cannot resolve sediment transport in swash zone properly. At the surf zone boundary, the most landward grid for hydrodynamic and sediment transport computation is set at the downwash point xd. In the area between the downwash point (xd) and the uprush point (xu), the empirical function of Larson and Kraus [51] is used to calculate sediment transport rate.
q t ¯ ( x ) = q t ¯ ( x d ) [ 1 ( x x d ) ( x u x d ) ] 5 for x d < x < x u
The downwash point is set as the location where T p g / h exceeds 40 for the first time [52]. The uprush point xd is set as the location where the bed elevation is 0 . 8 tan a H 0   L 0 higher than the shoreline. H0 and L0 represent wave height and wave length in deep water, and tan a is bed slope. The definition for the uprush point was firstly proposed by Hunt [53]. It represents the point of maximum uprush within a certain period.
Bed elevation change is given by the Exner equation.
z b t = 1 1 p v q t ¯ x
where zb is bed elevation and pv represents bed porosity taken as 0.4.

3. Results

3.1. Experimental Results

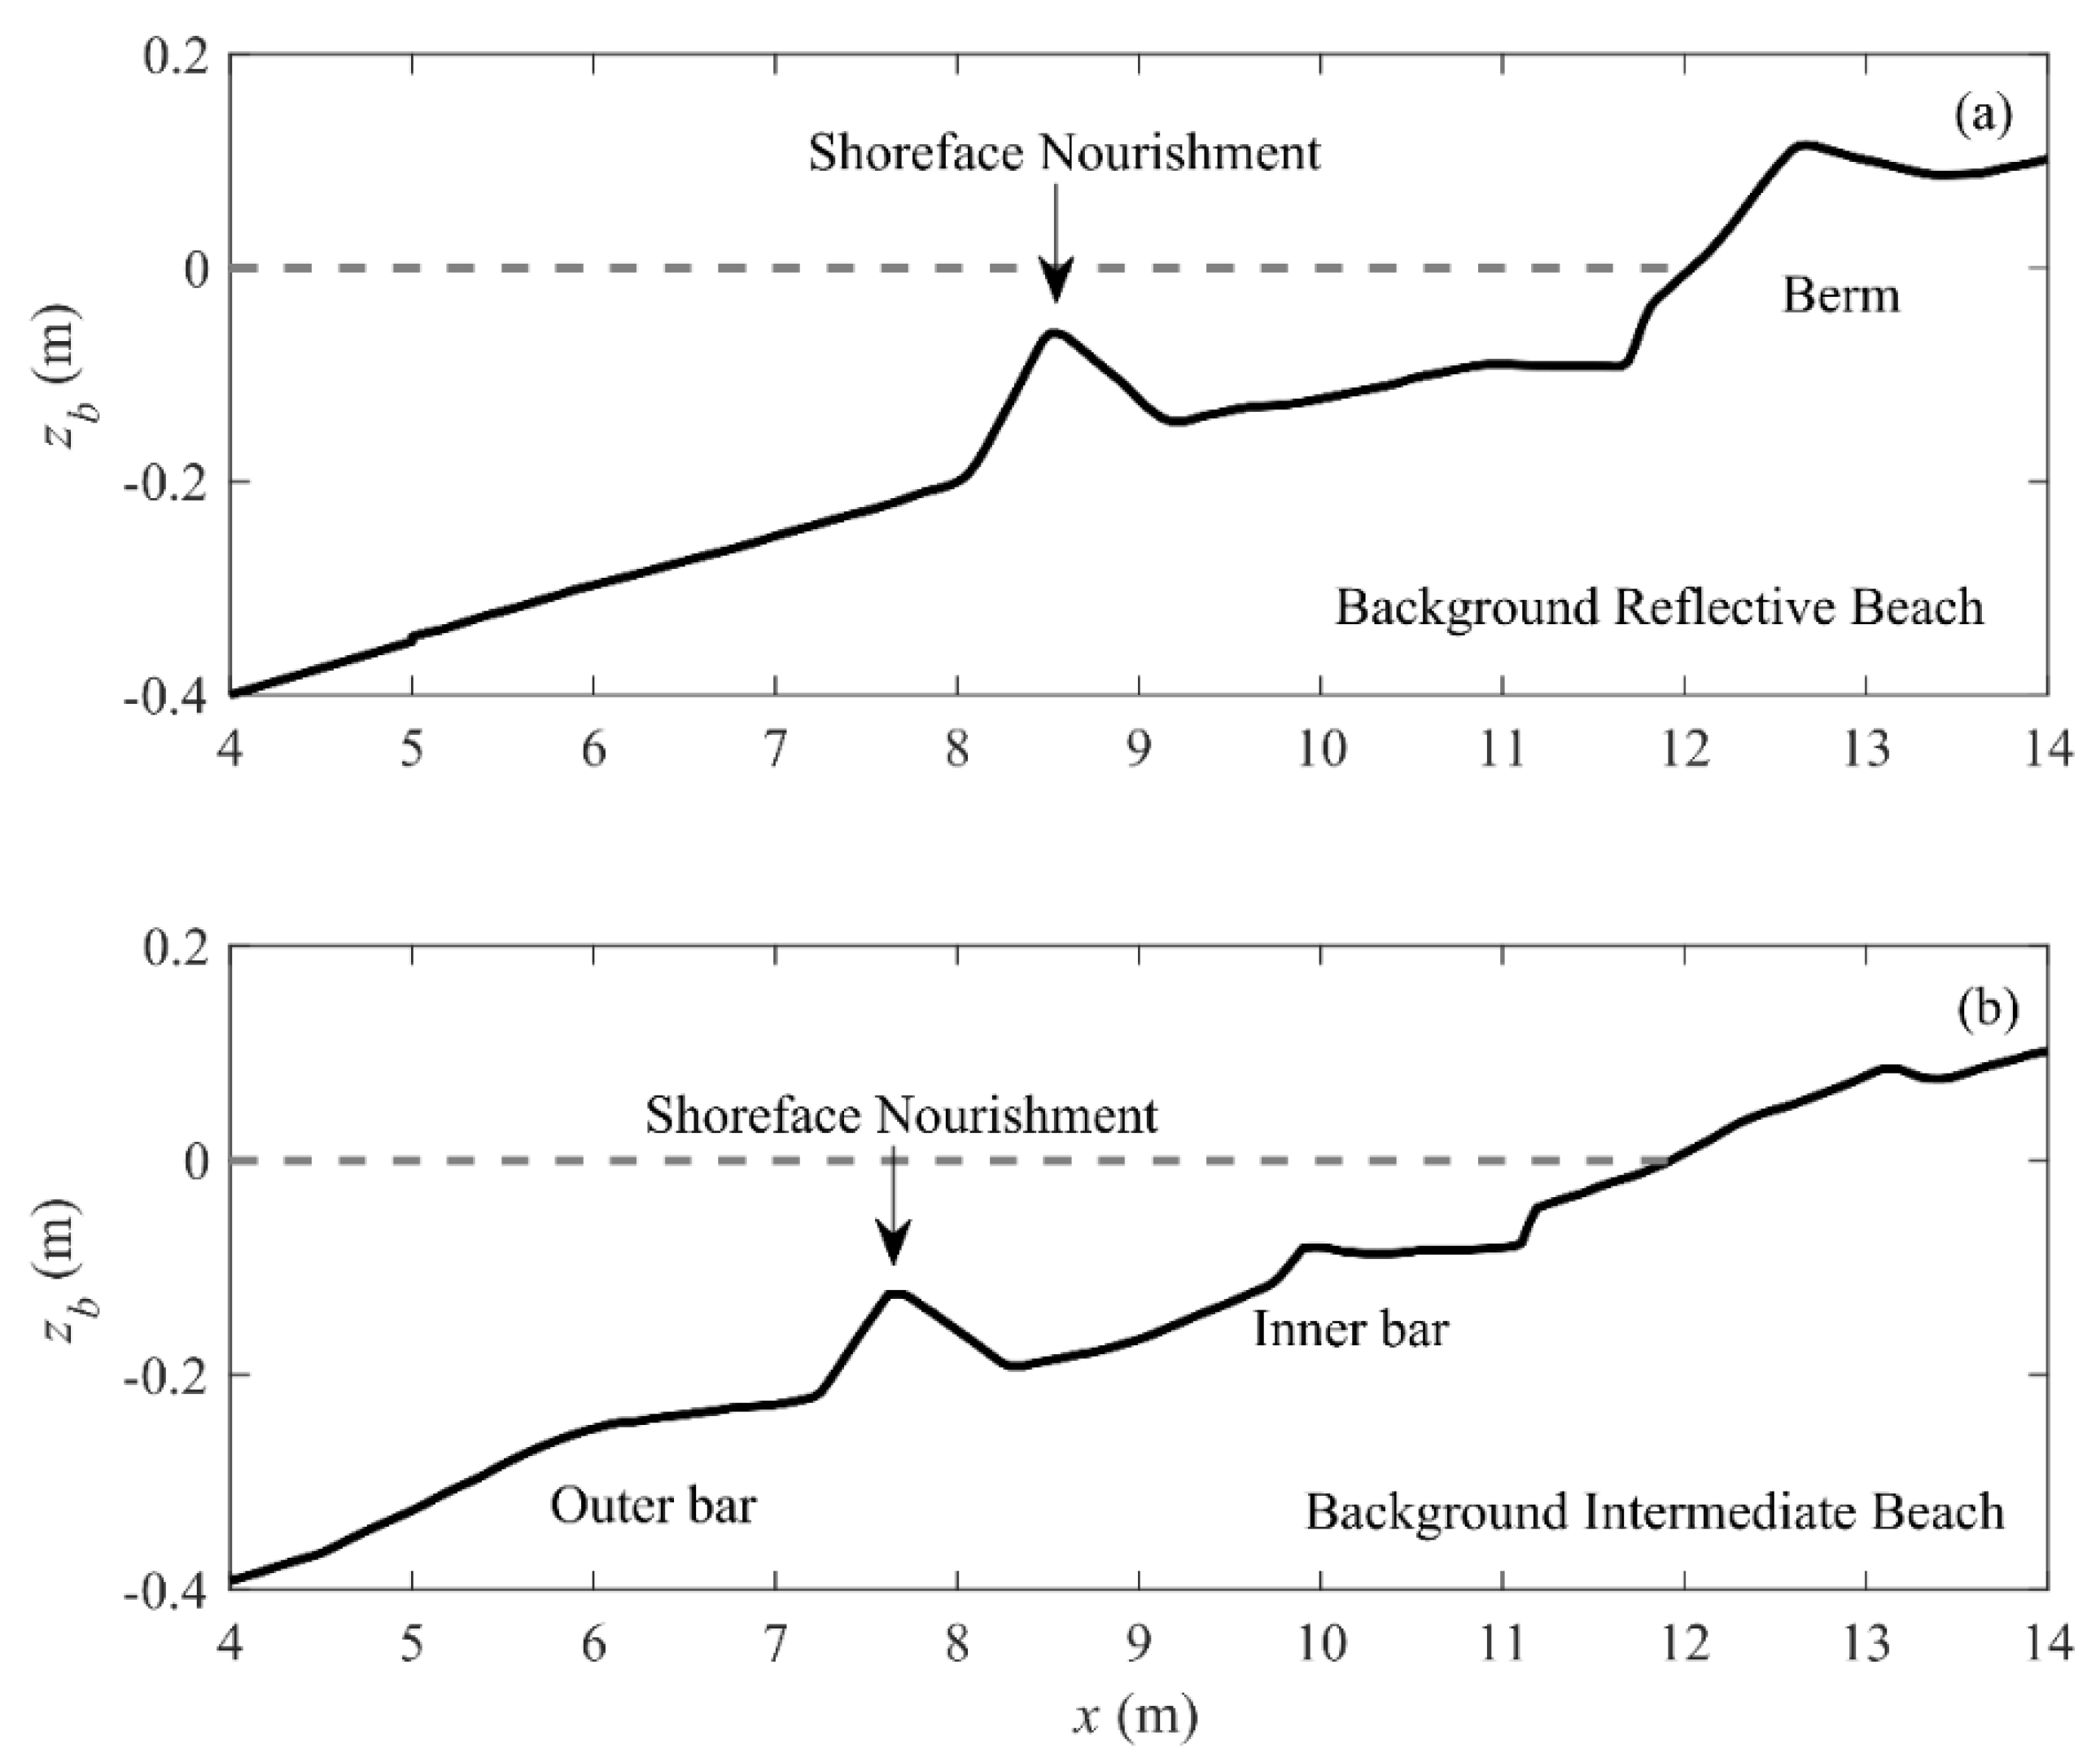
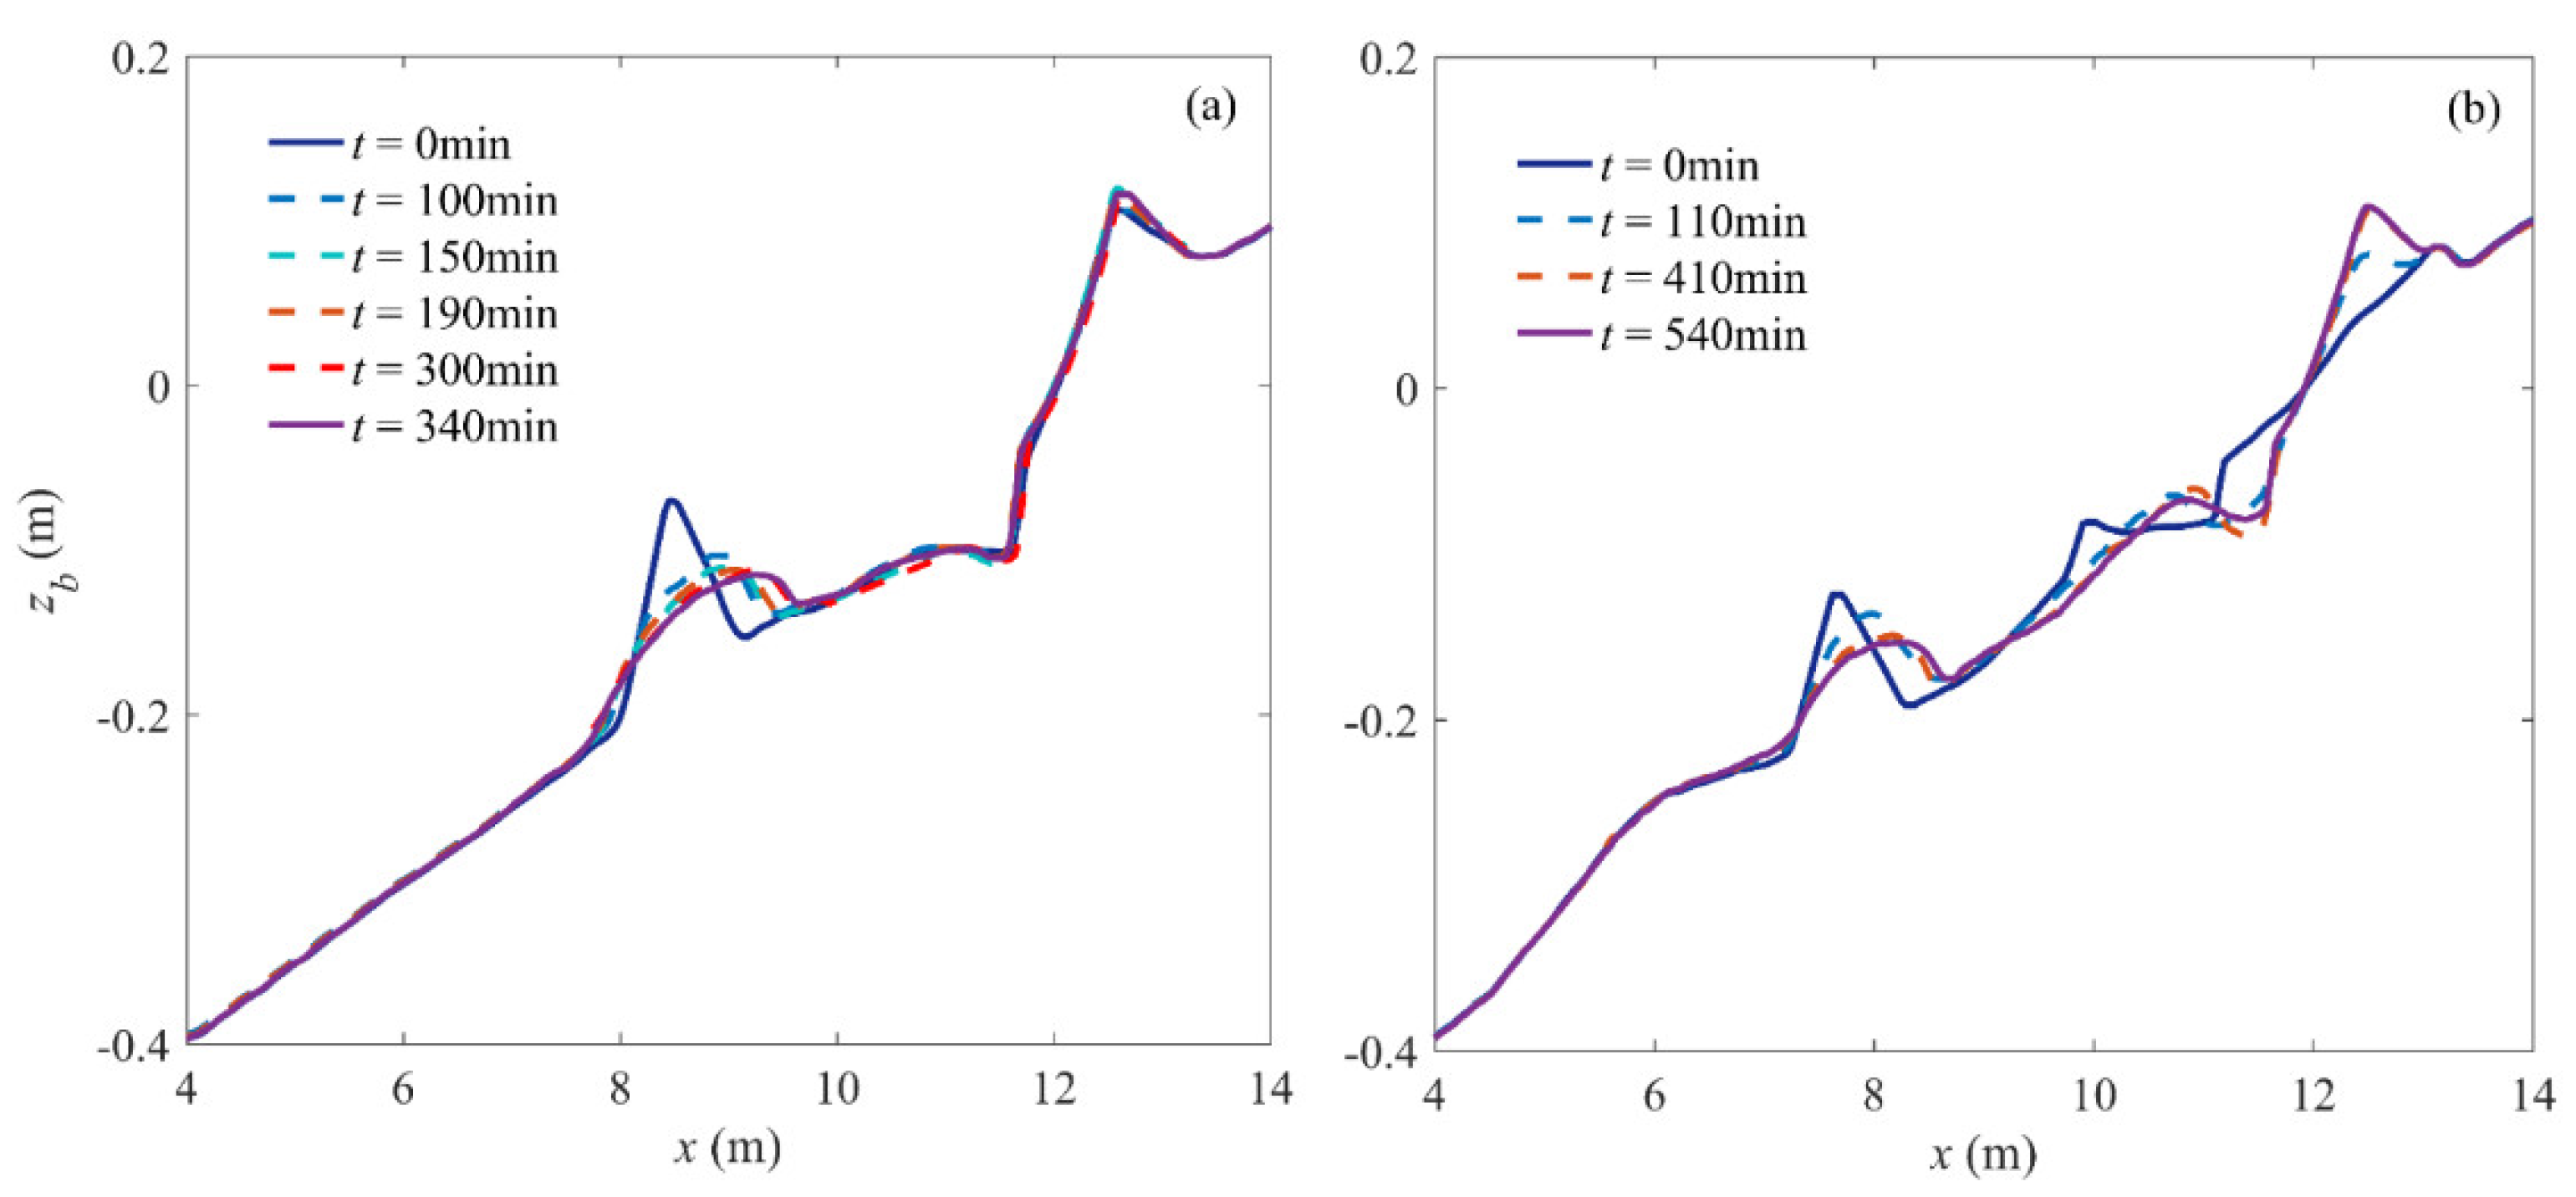
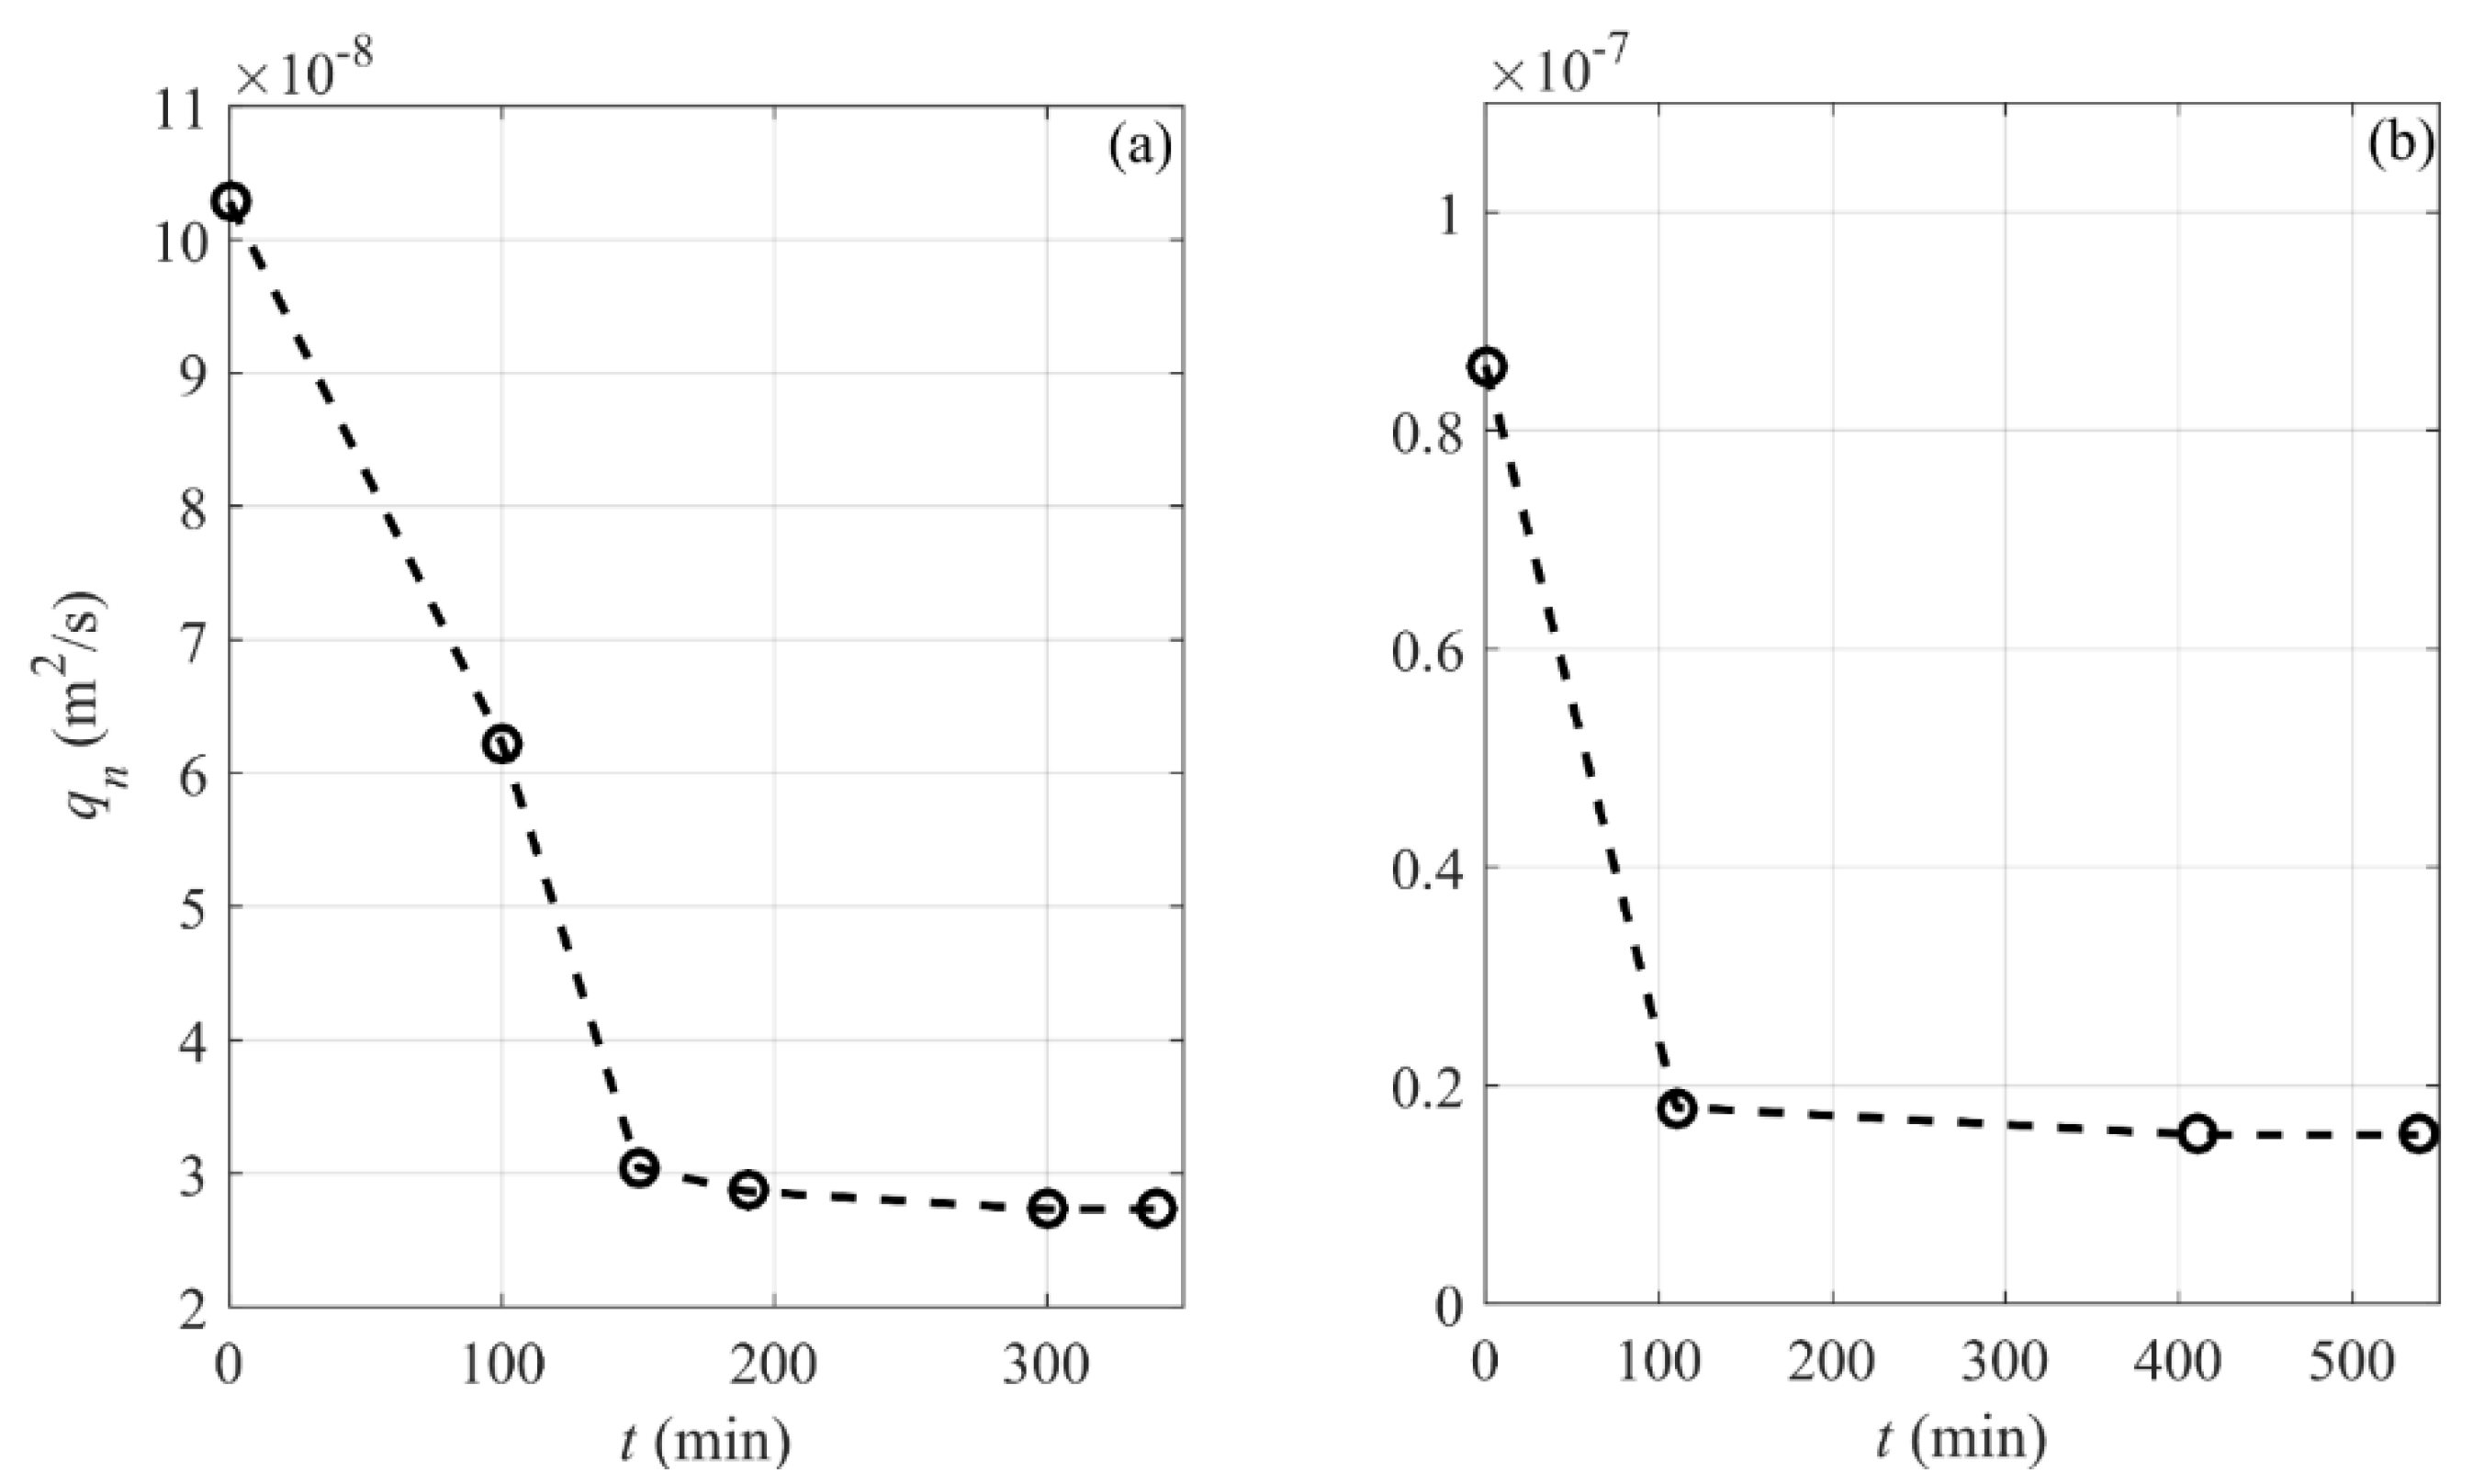
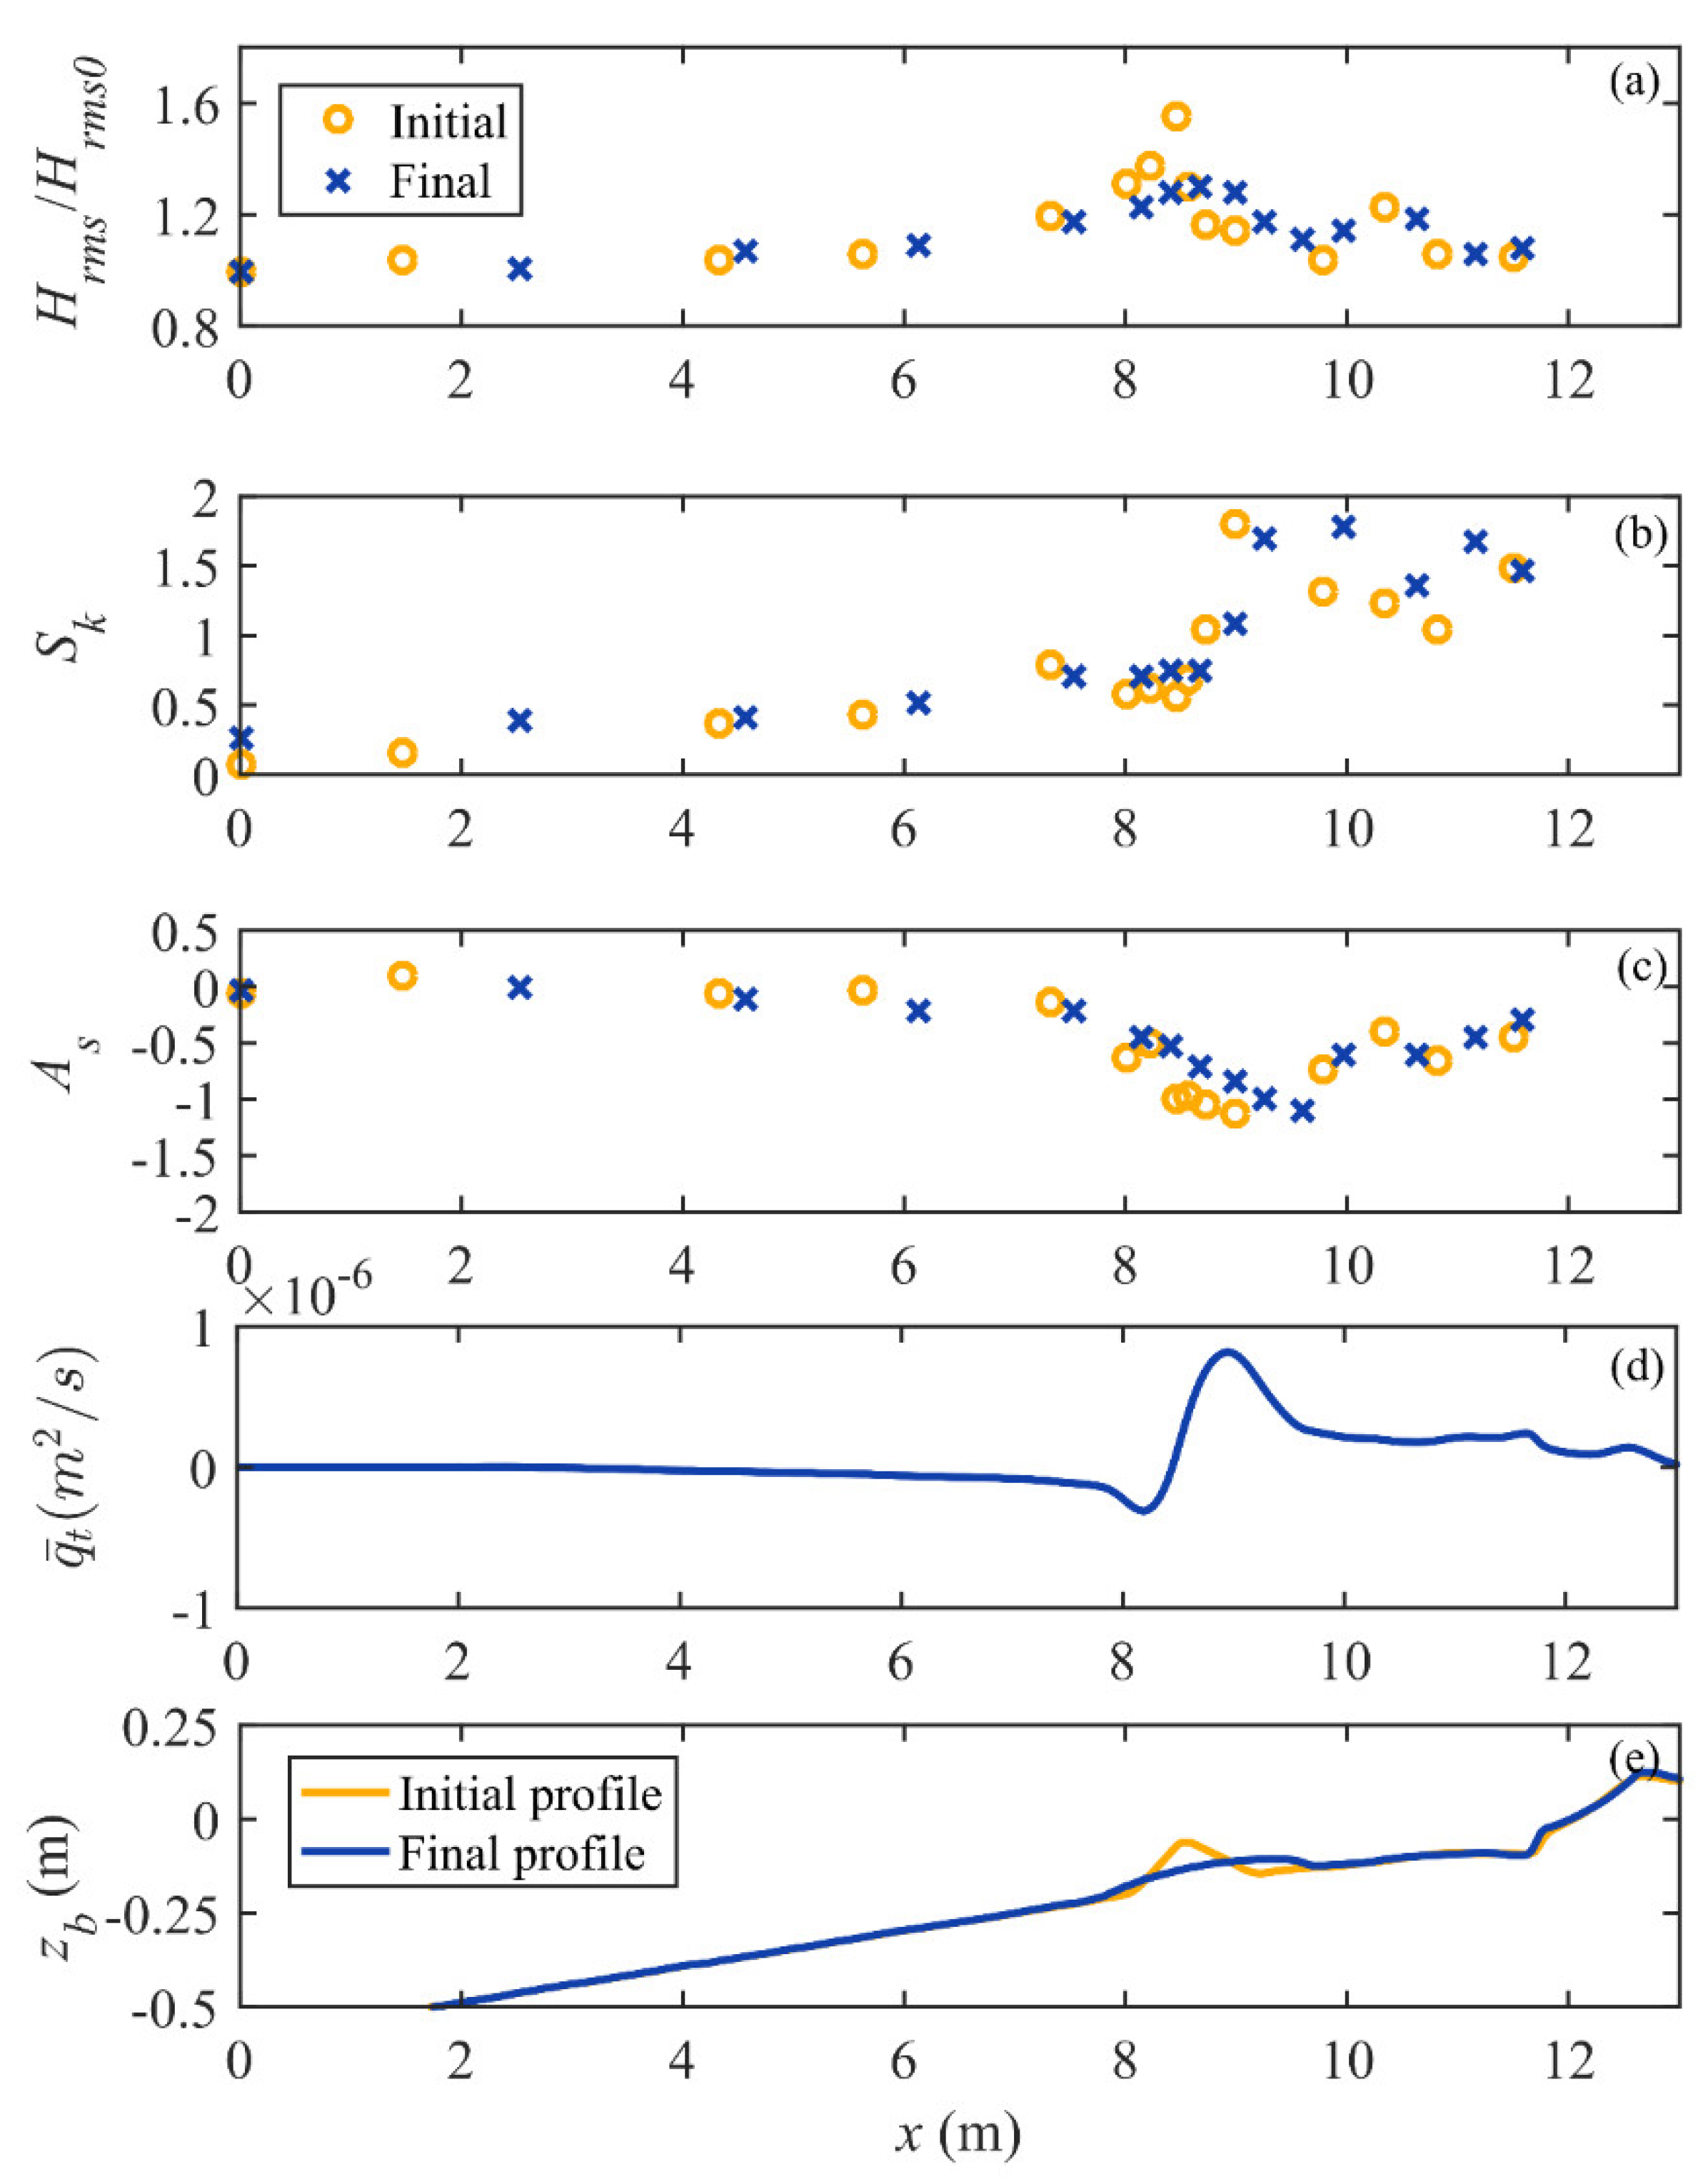
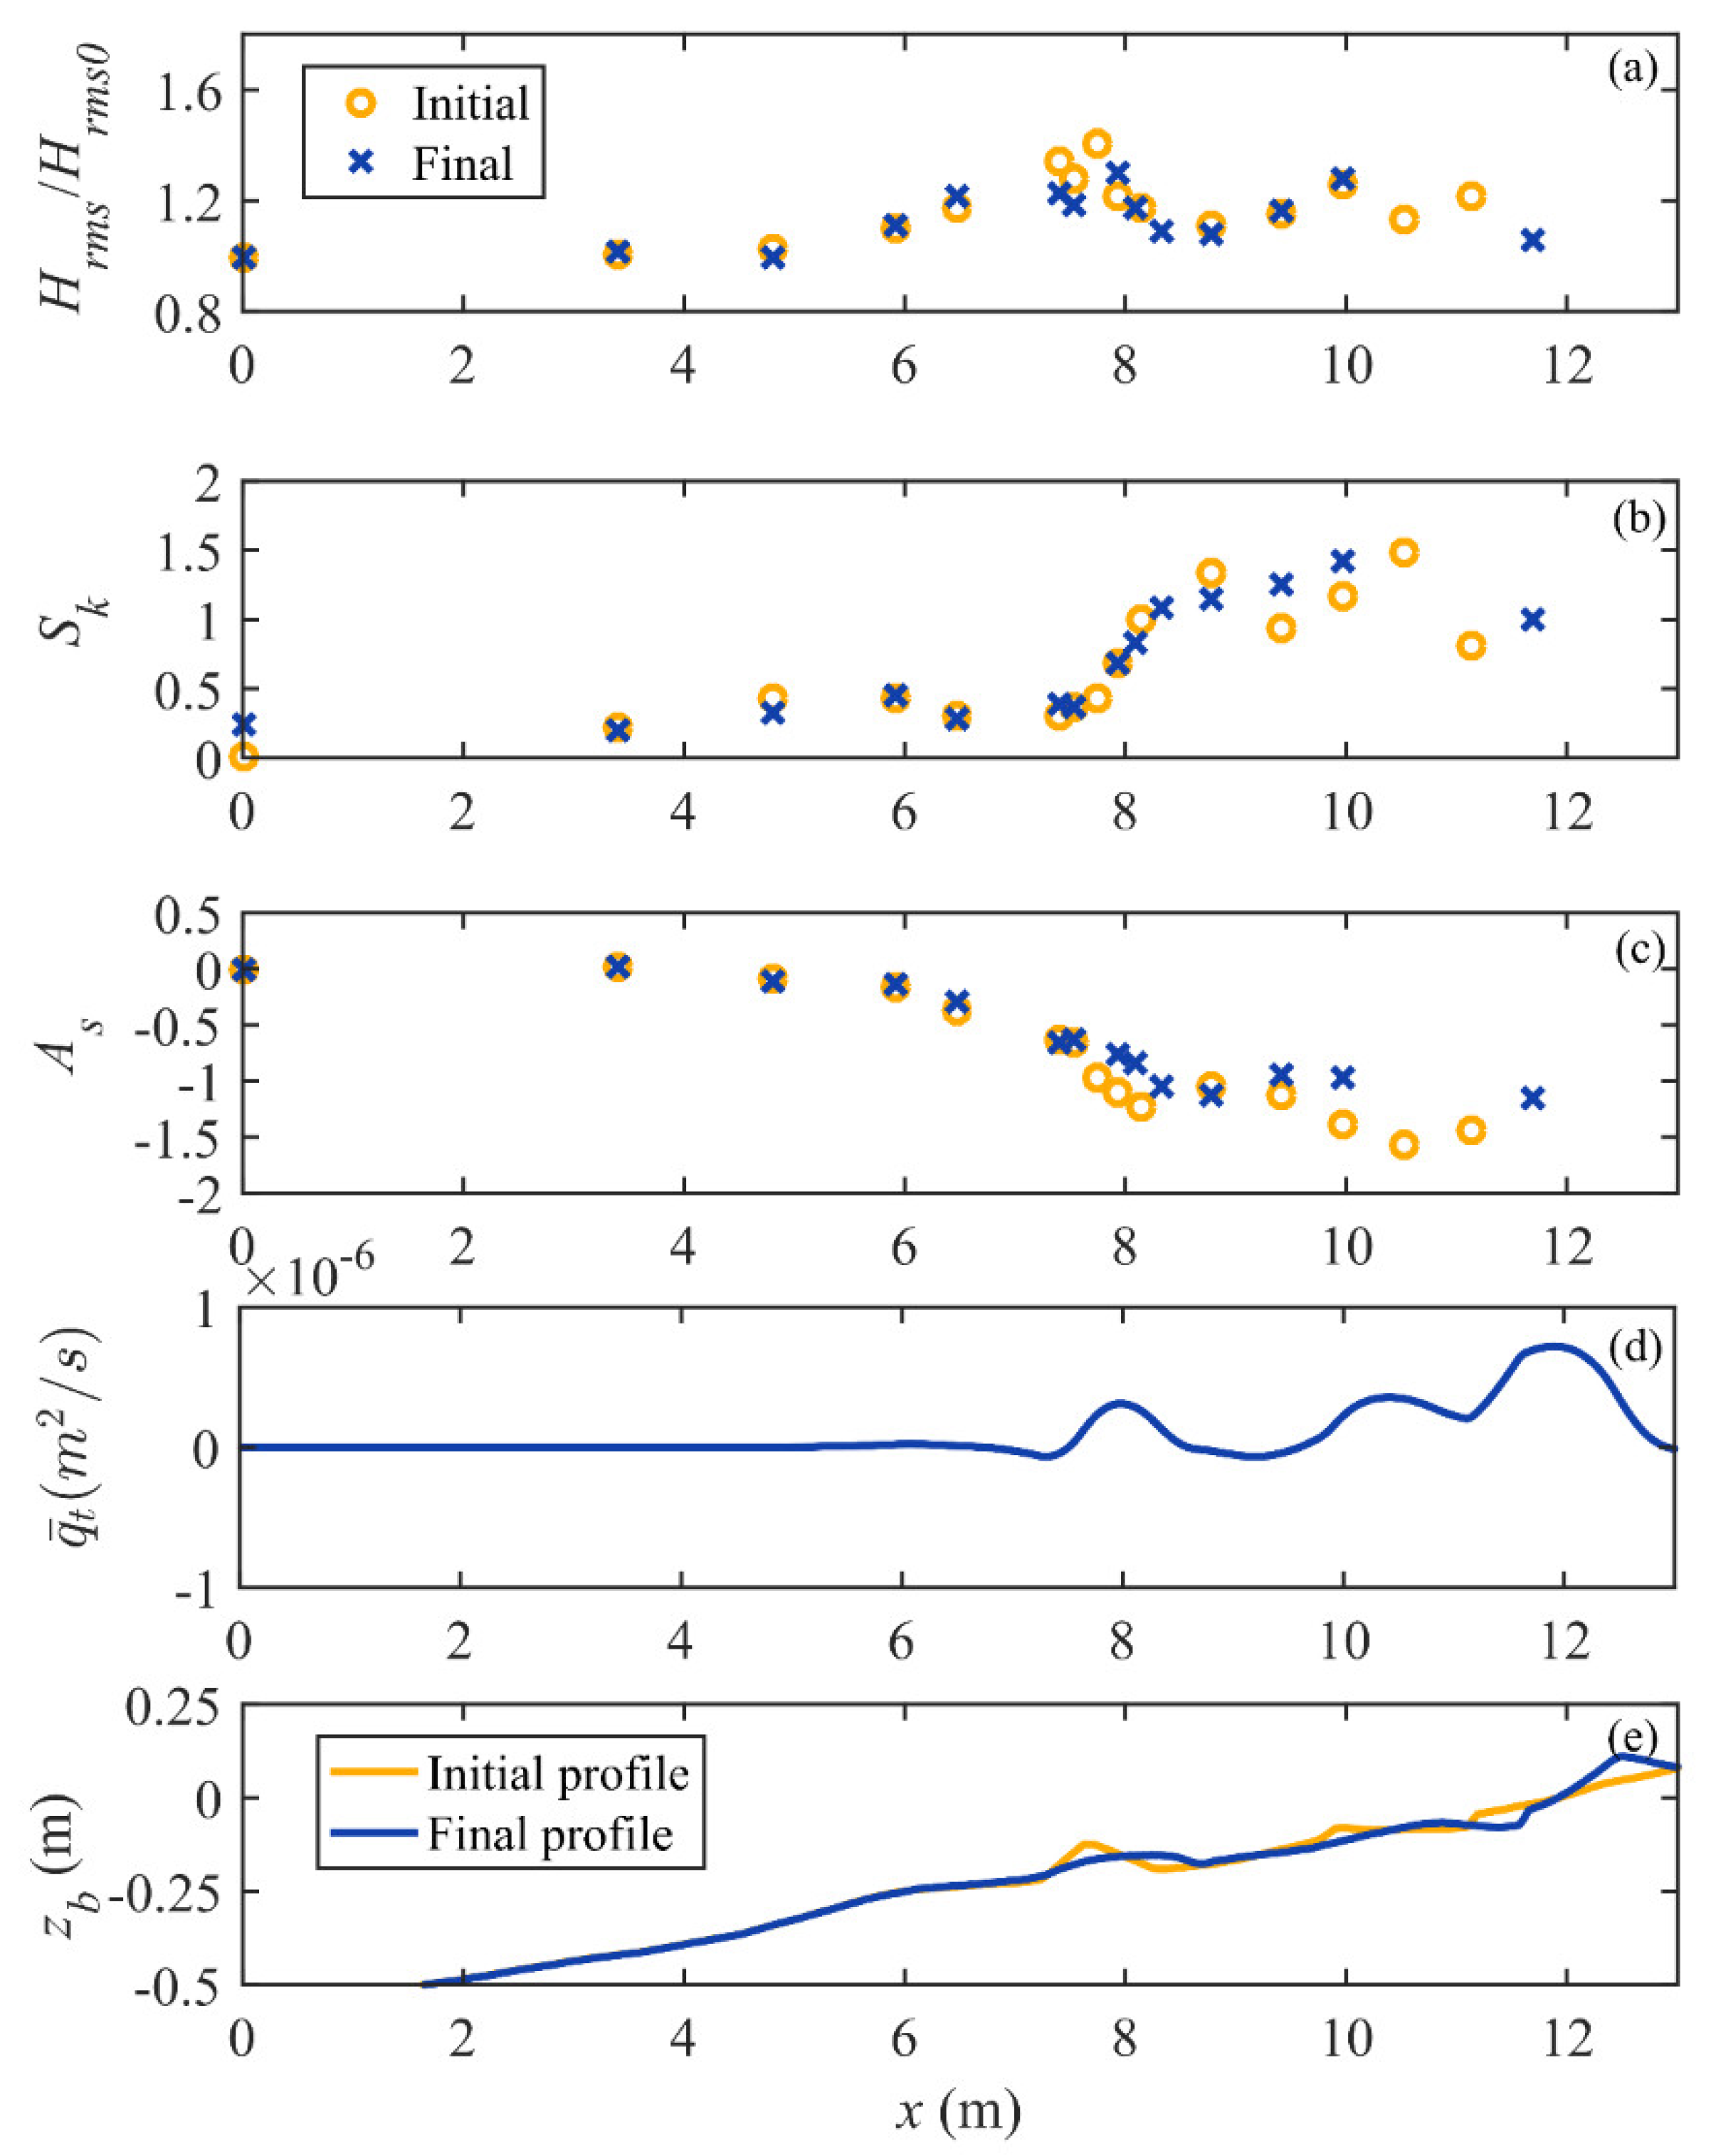
3.1.1. Beach Profile Evolution

As can be seen in Figure 3a, the shoreface nourishment migrates onshore in A1_2, with the nourishment crest elevation decreased. Its seaward slope becomes milder and shoreward slope keeps stable. The elevation of berm crest has been raised slightly while other berm geometry parameters, such as, berm foreshore slope and berm step, are almost unchanged. As shown in Figure 3b, the shoreface nourishment shows a similar evolution pattern to that in A1_2, it migrates onshore and gradually fills on the trough of outer sandbar. The outer bar keeps almost unchanged and the inner bar migrates onshore. The berm has been formed with the berm height increased and foreshore slope steepened.
It can be noted that both the shoreface nourishments in these two cases tend to be equilibrium. The equilibrium trends of the shoreface nourishment are described by the integration of the magnitudes of bed elevation changing rates (i.e., cross-shore cumulative sediment transport gradient) in the active zones. The active zones for cases A1_2 and E1_1 are from x = 8 m to x = 10 m and x = 7 m to x = 9 m, respectively.
q n = | z b t | d x
in which, qn is the integration representing the shoreface nourishment changing rate. For each qn, the time interval is calculated as the difference to the previous time step. As shown in Figure 4a, qn at the initial moment is 1.03 × 10⁻⁷ m2/s, and it decreases as time goes on. Besides, the decreasing rate is more rapid in the first 150 min, and turns slower after t = 150 min. At t = 300 min, qn = 2.73 × 10⁻⁸ m2/s, and is only 1/4 of that at t = 0 min. qn in case E1_1 shows a similar pattern, as is provided in Figure 4b. Therefore, it is fair to consider that the shoreface nourishments in both cases turn to be equilibrium after the implementation.

3.1.2. Hydrodynamics

Wave height transformations over the initial and quasi-equilibrium profile in case A1_2 are presented in Figure 5a. The maximum wave height occurs on the crest of the shoreface nourishment, and the wave transformation pattern on the shoreface nourishment is similar to that on the submerged breakwater [54]. Comparing root–mean–square wave height on the initial and quasi-equilibrium profile, it can be found that the breaker point moves onshore due to the feedback of the onshore migration of the shoreface nourishment. Wave height on the crest of the nourishment is larger on the initial profile than on the quasi-equilibrium profile. This is because the small water depth over the crest of nourishment on the initial profile tends to trigger more wave breaking dissipation than the large water depth [55,56,57]. Similar observations were also made by [17,58] on beaches with or without nourishments. Wave skewness and asymmetry play crucial roles on sediment transport in the shoaling zone and surf zone [59,60]. As shown in Figure 5b, the magnitude of Sk firstly increases over the shoreface nourishment and then decreases shoreward. As shown in Figure 5c, the magnitude of As keeps stable when the water depth is large, then it begins to increase after x = 7.5 m, and decreases shoreward of the crest of the nourishment. This is because the steep seaward slope and small water depth of the nourishment affect triad interactions among wave components [61,62,63]. Compared with the initial profile, both the positions of maximum Sk and As move shoreward.
Measured time-averaged sediment transport rate is calculated by the Exner equation (i.e., Equation (33)) with time interval of the experiment duration. Time-averaged sediment transport rate is calculated from x = 0 m to over-wash limits (x = 13 m). At the shoreward or seaward boundary, closure errors could occur due to profile alongshore variance or sediment compaction. A correction method is introduced to ensure zero sediment transport across the boundary, which distributes the sediment volumetric error uniformly across the active profile, following Baldock et al. [64]. As shown in Figure 5d, a positive peak of sediment transport rate occurs shoreward of the shoreface nourishment in the beginning, indicating onshore migration of the shoreface nourishment in A1_2.
As can be seen in Figure 6a, the root–mean–square wave height distribution across the profile in case E1_1 shows a similar pattern that wave height increases on the nourishment and decreases shoreward. On the initial profile in Figure 6b,c, the trends of magnitudes of Sk and As are similar to those in case A1_2. As the shoreface nourishment moves onshore, the positions of maximum Sk and As move shoreward. For case E1_1, three positive peaks occur on the profile, representing the onshore migration of the shoreface nourishment and the inner bar, and the formation of the berm.

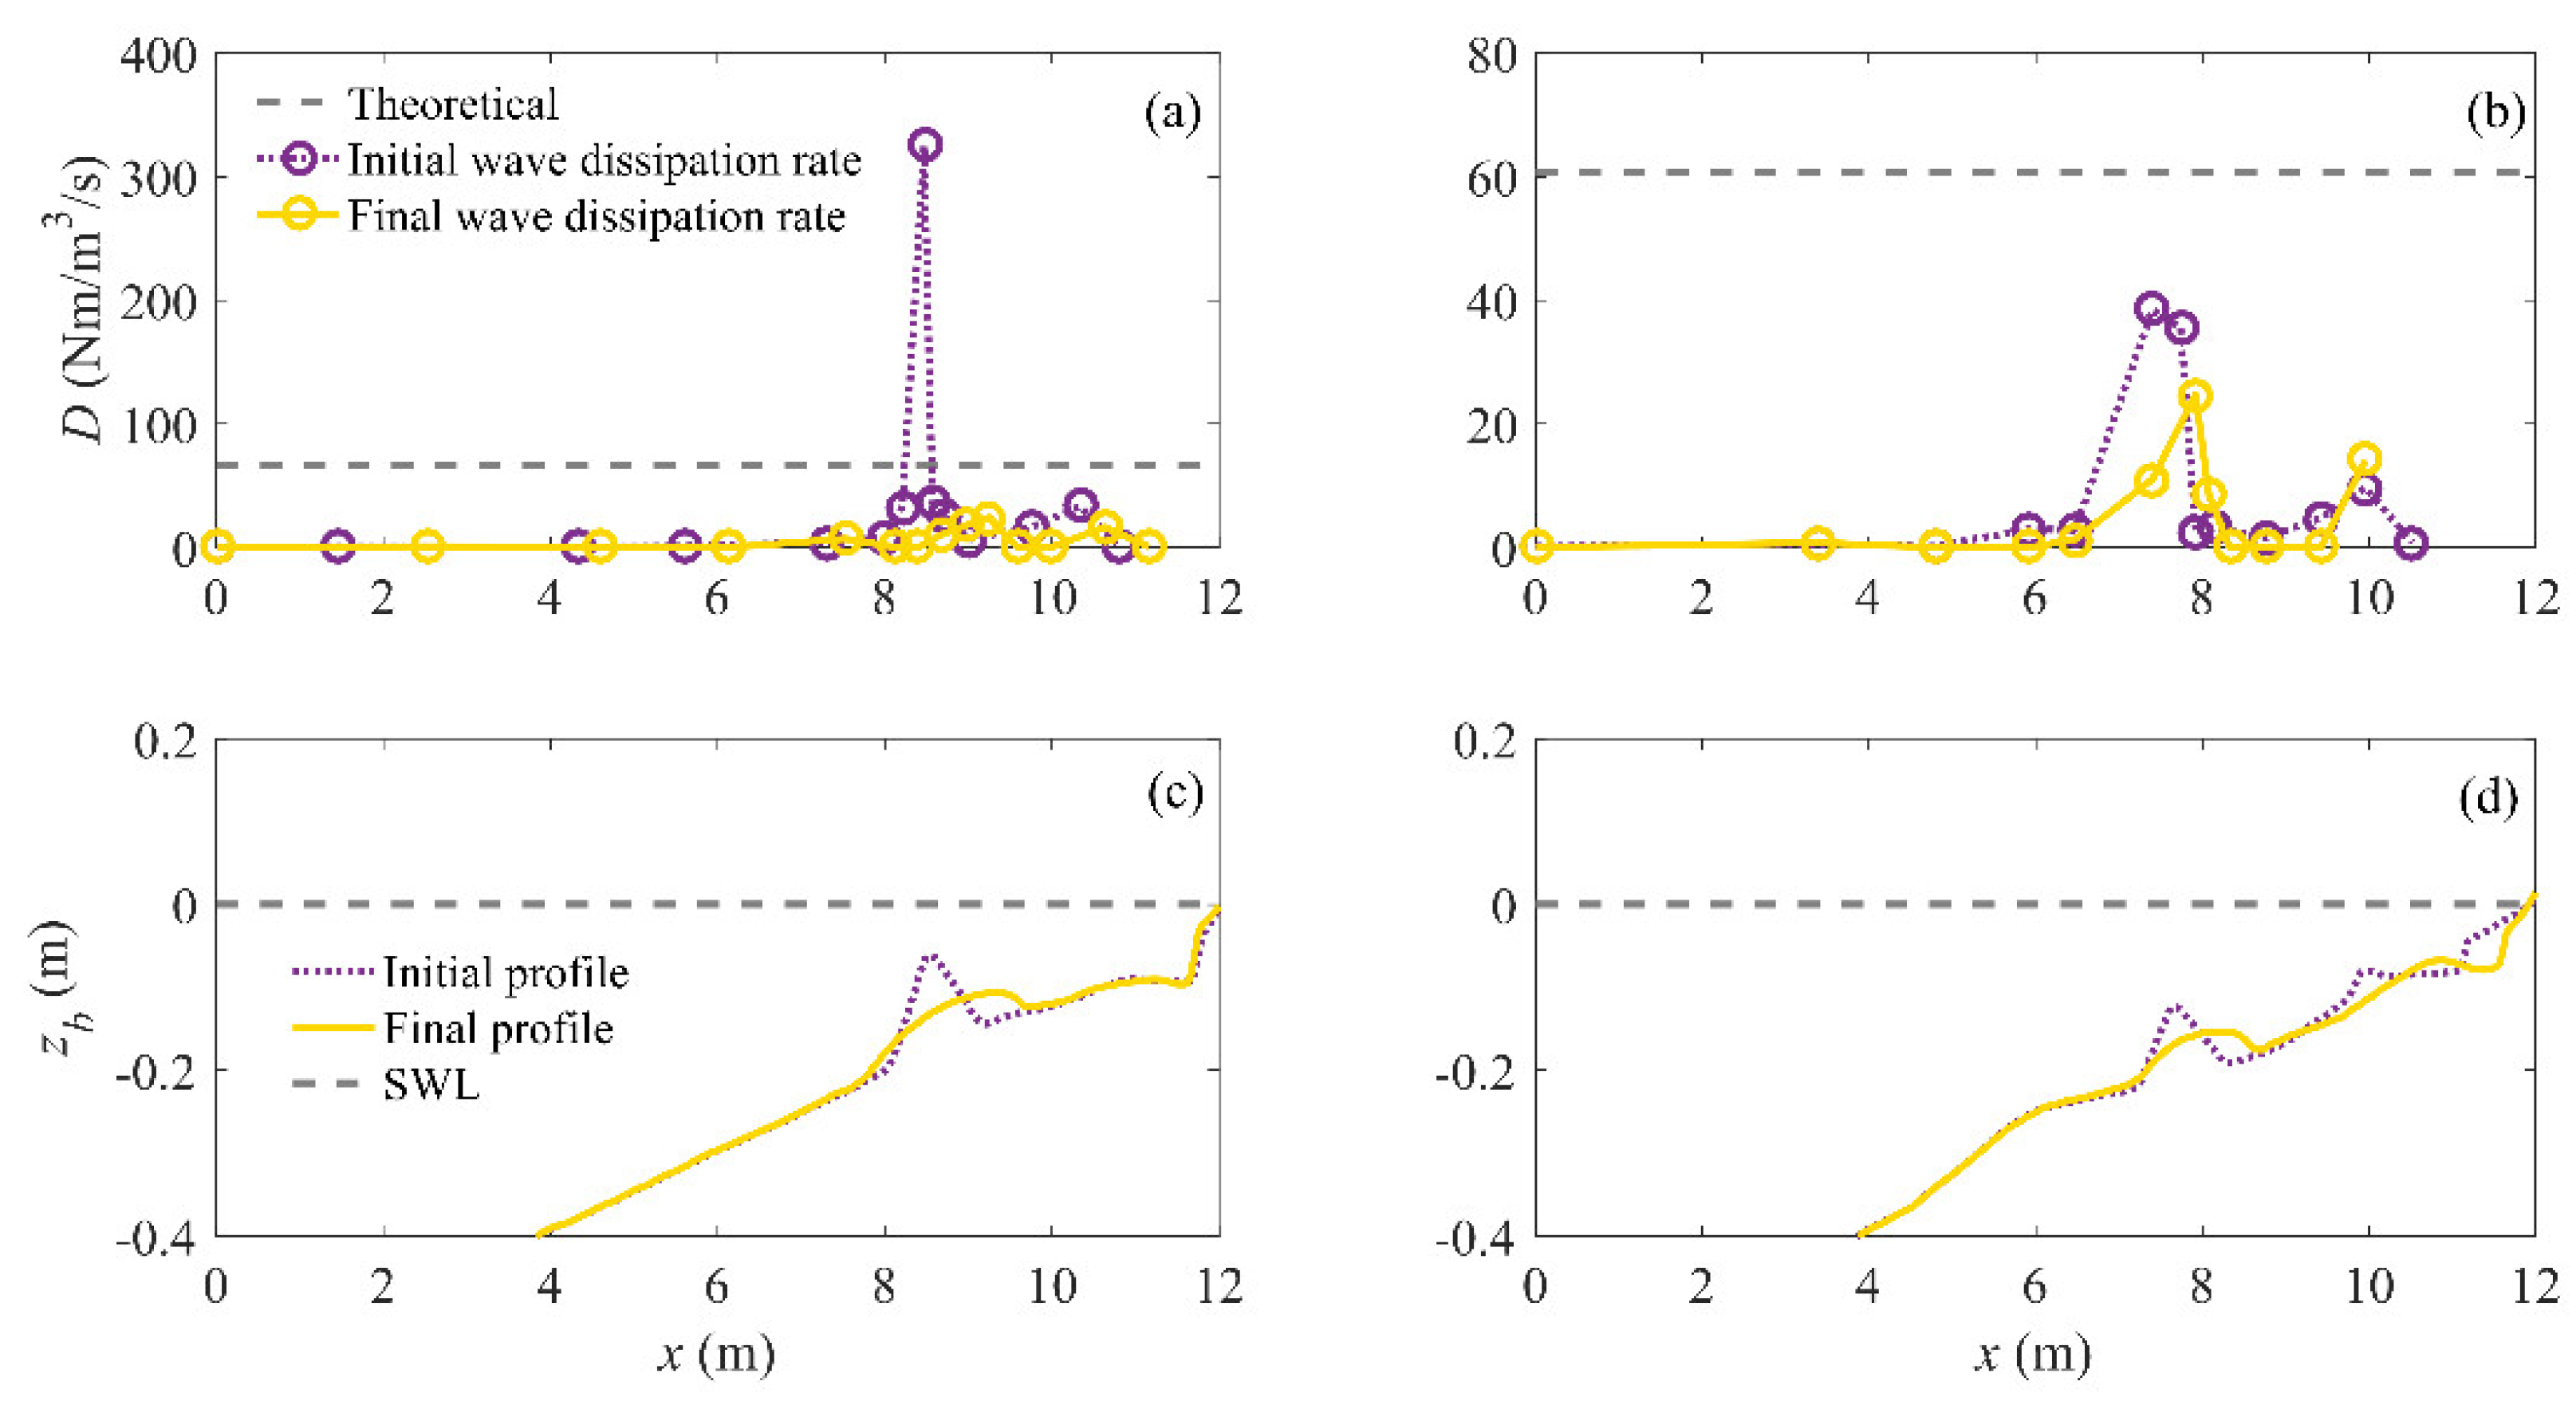
3.1.3. Wave Energy Dissipation

Dean [24] assumed that the wave energy dissipation rate on the equilibrium beach profile is uniform, and proposed the equilibrium wave energy dissipation rate ( D * ) as,
D * = 5 24 γ 2 ρ g 3 / 2 A 3 / 2
in which, γ is breaker index for depth-limited breaking waves, defined as the ratio of wave breaker height to local water depth. A is scale parameter for the traditional power function. The volumetric wave energy dissipation rate is defined as [25],
D ( x ) = 1 8 ρ g 3 / 2 h m i d Δ ( H r m s 2 h 1 / 2 ) Δ x
in which, hmid is water depth at mid-point between the wave gauges. Following Wang and Kraus [25], we also propose two questions. They are (1) whether the energy dissipation rate will be uniform on the equilibrium profile with shoreface nourishment under mild wave conditions? (2) To what extent can Equation (36) predict energy dissipation rate on the artificial beach? According to Wang and Kraus [25], Moore [65], and Dean [66], A is a function of grain size, and A = 0.1 m1/3 corresponds to the used grain size of 0.23 mm in this study. For depth-limited breakings, γ is related to deep-water wave steepness [67], and equals to 0.57 and 0.55 for A1_2 and E1_1, respectively.
As can be seen in Figure 7, maximum D occurs on the crest of the nourishment both on the initial and quasi-equilibrium profiles for each case under mild wave conditions. In Figure 7a, on the reflective beach, the wave energy dissipation rate on the initial nourishment crest can be larger than 300 (Nm/m3/s) due to its small water depth, while it decreases to 50 (Nm/m3/s) on the crest of the nourishment on the quasi-equilibrium profile. Comparing these two curves of the wave energy dissipation rate, it is fair to say that the distribution of wave dissipation rate in the quasi-equilibrium state is more uniform than that in the initial state under mild wave conditions. In Figure 7b, on the intermediate beach, D increases on the seaward slope of the nourishment and decreases shoreward of it. When waves propagate onto the inner bar, D increases and then decreases again. Both two curves of the wave dissipation rates show a similar trend that wave dissipation rate in the equilibrium state holds a more uniform distribution.
It can be found that the theoretical wave dissipation rate is larger than the measured in most positions on the profile. This is potentially because the γ used in Equation (35) is independent of water depth, indicating that the surf zone is depth-limited. However, the surf zone under mild wave conditions is always unsaturated [68,69], such that γ is related to local water depth. Detailed discussion on this issue can be found in Wang and Kraus [25].

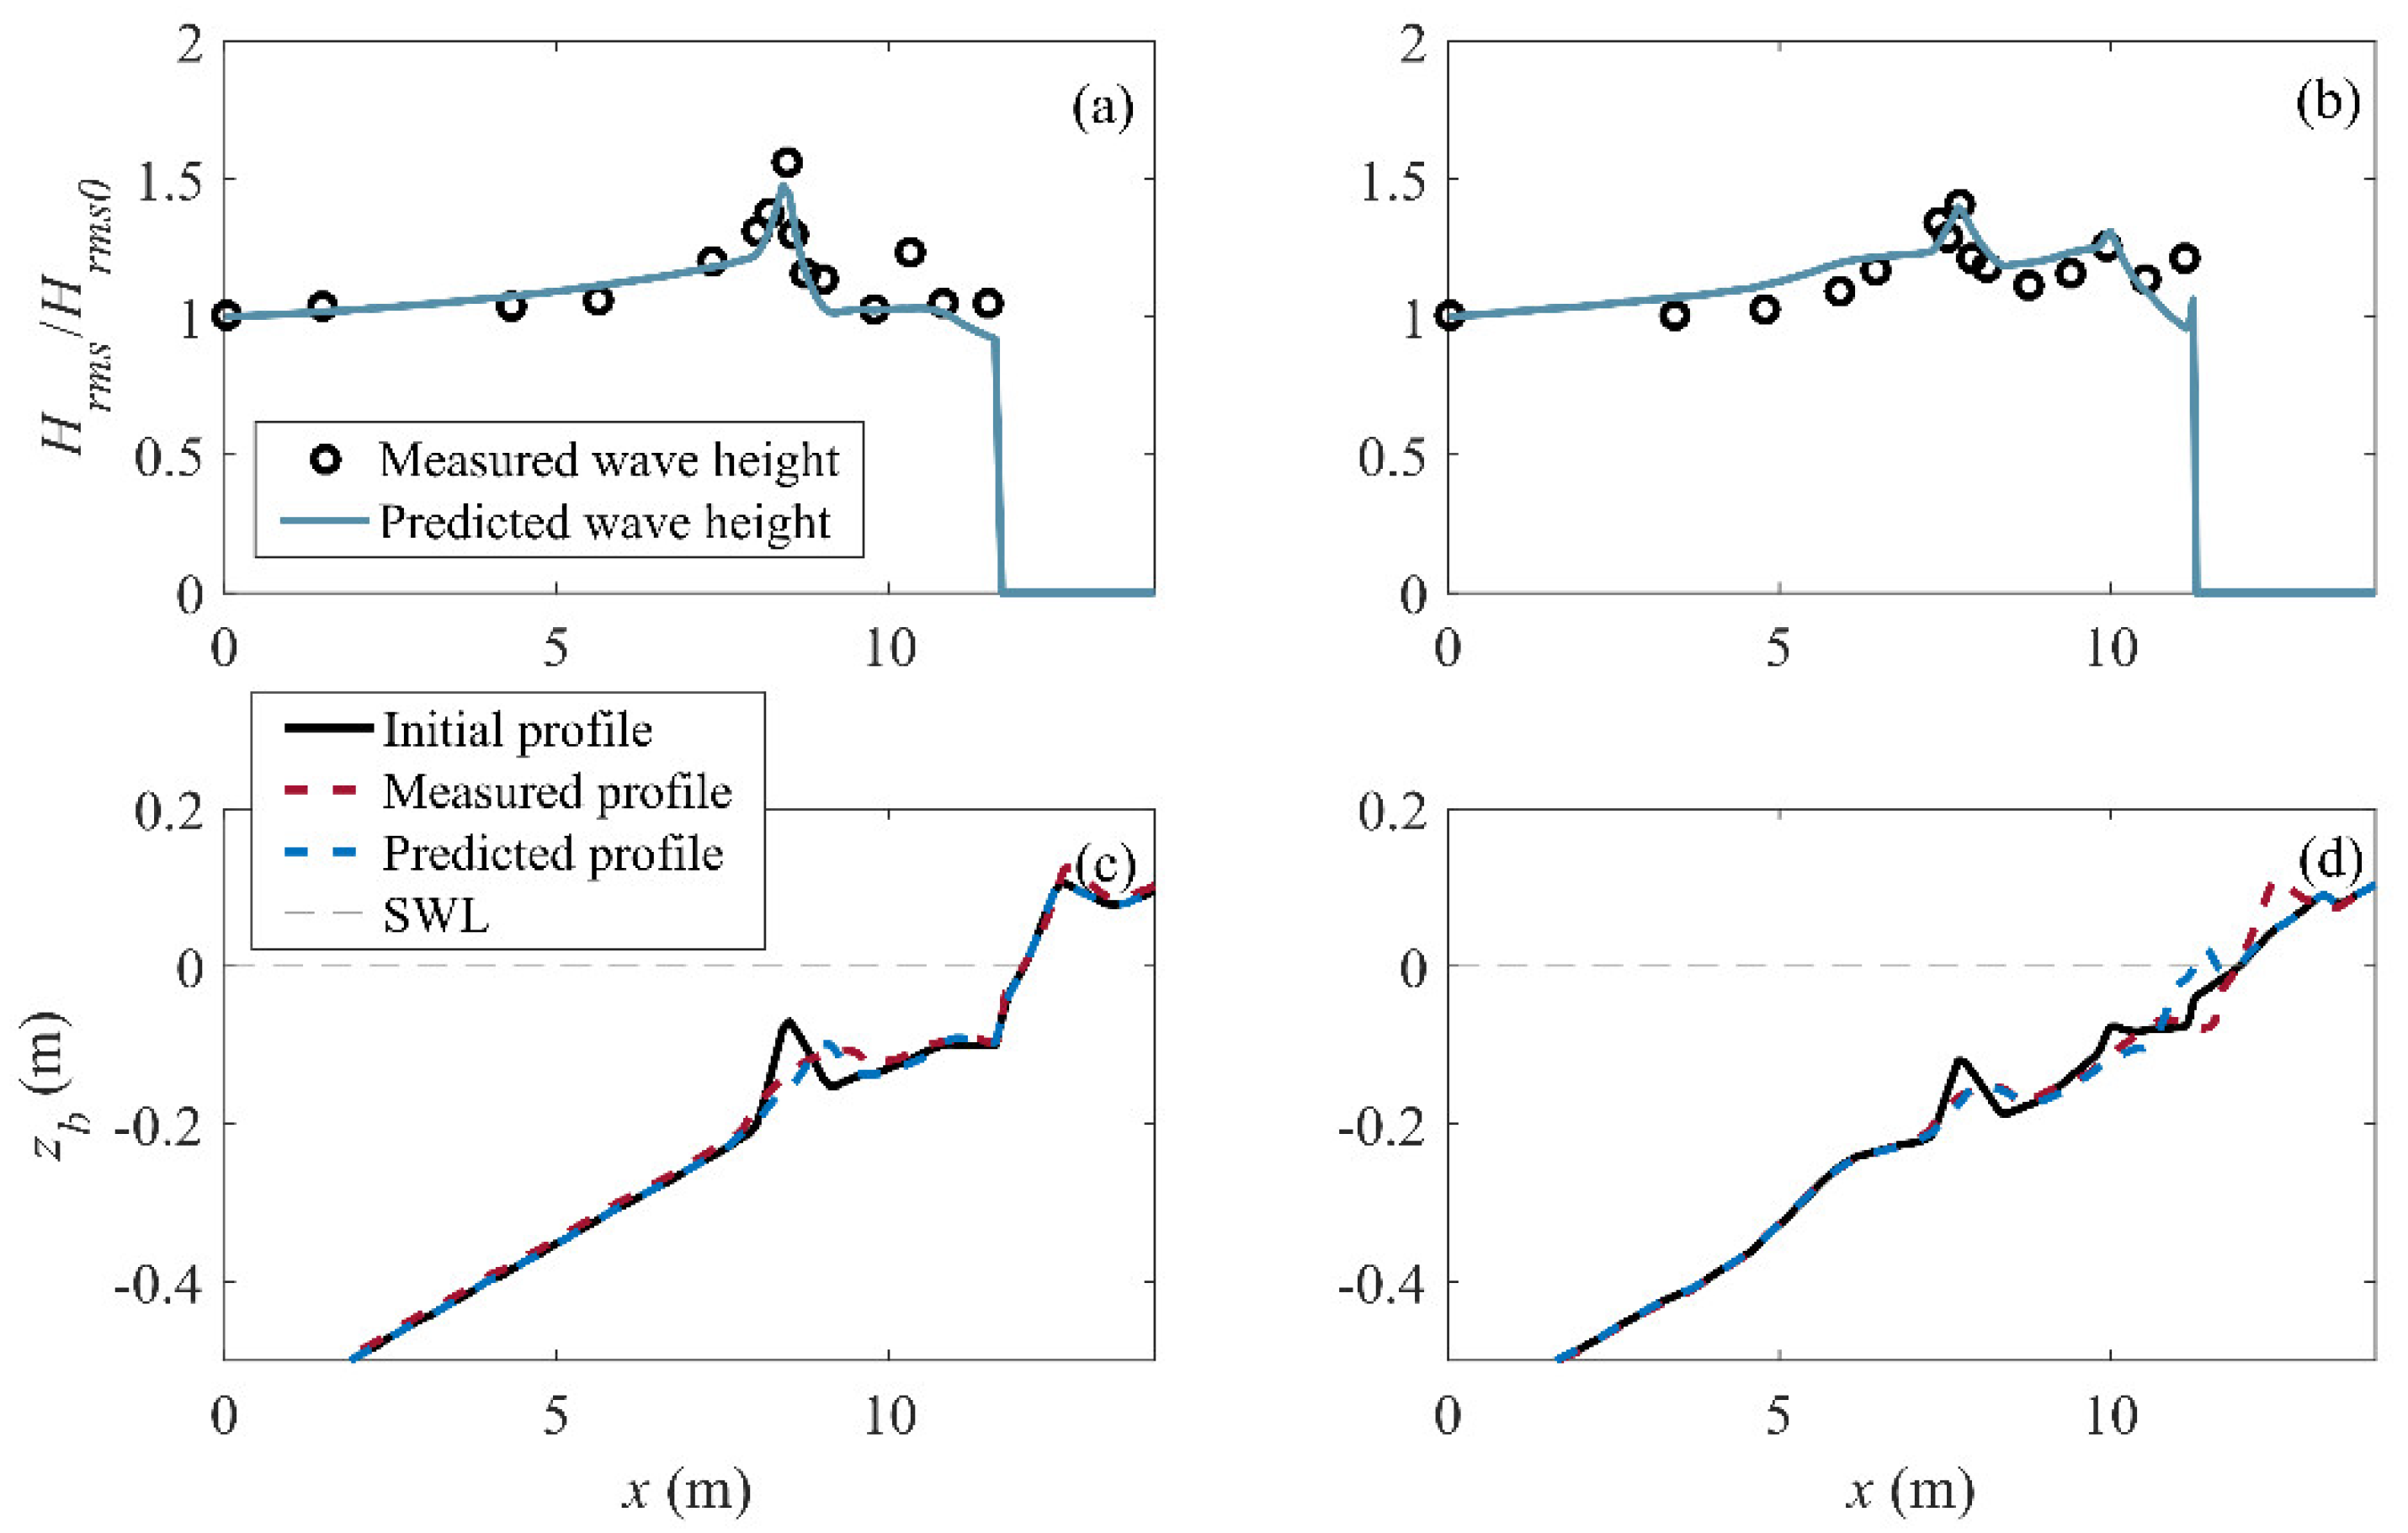
3.2. Numerical Model Validation

In the numerical model, a uniform mesh is used in the cross-shore direction with a grid spacing of 0.1 m. In the vertical direction, 100 grid cells are set to increases from bed to wave trough level logarithmically so that the vertical resolution near the bed is high [39,40]. Calibrated parameters in this model include: roller slope β, turbulent factor fv and phase shift angle φ. The calibrated values are provided in Table 2.
As can be seen in Figure 8a,b, the initial wave height in both cases are reproduced well by the model, especially on the nourishment. The predicted incipient breaking height is found on the crest of the nourishment, and the model underestimates the wave height at this position in A1_2 (Figure 8a). For comparisons of bed profile evolution, the model shows a good performance in representing the evolution of the shoreface nourishment. However, the model fails to reproduce berm formation in both cases. This is because the model uses the interpolation functions to calculate sediment transport rate at the surf zone shoreward boundary, and cannot represent swash zone processes. Although swash zone can affect surf zone hydrodynamics, for instance, by swash-based wave reflection [70], this process has not been involved in the present model and is beyond the scope of this study. For the present study, we focus on shoreface nourishment evolution and equilibrium which are well reproduced by the model.
Based on model results, the overall beach profile evolution, as well as the crest and seaward/shoreward boundary of the shoreface nourishment are analyzed. As shown in Figure 9a, the crest of the nourishment migrates onshore from x = 8.5 m to x = 9 m with its elevation decreasing from z = −0.07 m to z = −0.1 m. The seaward boundary keeps almost unchanged during the onshore migration of the nourishment. It can be seen from Figure 8c that the model underestimates the offshore migration of seaward boundary of the nourishment. This is because the present model cannot represent the sediment transport driven by gravity diffusion [71,72]. The shoreward boundary moves onshore. These three curves turn to be stable after t = 225 min. Similarly, the crest of the nourishment in Figure 9b migrates onshore from x = 7.75 m to x = 7.95 m in case E1_1. Both seaward and shoreward boundaries are almost unchanged during shoreface nourishment onshore migration. The cross-shore span of the shoreface nourishment in E1_1 is smaller than that in A1_2. This is because the trough of the outer bar limits the range of migration of the shoreface nourishment for E1_1.

4. Discussion

4.1. Sediment Transport Patterns

Beach profile evolution is a consequence of sediment transport, so that it is necessary to analyze sediment transport patterns during the evolution of the nourishment towards equilibrium. Based on the model outputs, period-averaged total sediment transport rate q t ¯ is provided in Figure 10. As shown in Figure 10a, the most intensive sediment transport across the profile occurs over the nourishment. q t ¯ is positive and becomes smaller during shoreface nourishment equilibrium. This pattern has also been reported on sandbar under mild wave condition [34,73]. For case E1_1 shown in Figure 10b, the most intense sediment transport occurs in front of the shoreline (about x = 12 m), but the sediment transport rate over the nourishment is smaller than that in A1_2. This is because A1_2 has a smaller water depth over the shoreface nourishment, which will cause stronger dissipation over the nourishment and a better ‘lee effect’ for the littoral area. Similar observations were also made by Eichentopf et al. [58] that an offshore sandbar triggered wave energy dissipation leading to limited beach erosion near the shoreline. Hence, the sediment transport capacity will be enhanced over the shoreface nourishment and suppressed near the shoreline.
Period-averaged bedload and suspended sediment transport rate in both cases are provided. As can be seen from Figure 11, q b ¯ is positive (i.e., onshore directed) on the nourishment. Compared with q b ¯ , the magnitude of q s ¯ is negligible on the shoreface nourishment. The magnitude of q b ¯ is about 10 times larger than q s ¯ on the nourishment; thus, it is fair to state that the onshore migration of the shoreface nourishment is induced by onshore bedload transport under mild wave conditions, which is different from the sediment transport pattern under stormy wave conditions [74,75]. Comparing Figure 11a,b it is found that the largest q b ¯ occurs on the crest of the shoreface nourishment in A1_2, while the largest q b ¯ occurs in front of the shoreline and q b ¯ on the crest of the shoreface nourishment is weak in E1_1. The differences of q b ¯ in these two cases are similar to q t ¯ shown in Figure 10. Besides the difference of the ‘lee effect’ of the nourishment with difference water depth over the crest, the water depth over the shoreface nourishment also plays a crucial role on wave nonlinearity evolution, and thus the bedload transport. To be specific, Sk and As always increase with Ursell number (Ur = HL2/h3) [61,62]; thus, wave nonlinearity is increased and bedload transport rate is enhanced on a small water depth. As shown in Figure 11b,d q b ¯ reduces as q s ¯ gradually becomes relevant after t = 300 min. The reduction of q b ¯ can be explained by the decrease of wave nonlinearity, which is caused by the decrease of the seaward slope of the shoreface nourishment. Increase of q s ¯ is due to the increase of breaking turbulence near the shoreline. Specifically, the ‘lee effect’ is weakened due to the increase of water depth over the shoreface nourishment, then more wave energy can propagate to littoral areas and trigger more intensive wave breaking near the shoreline.

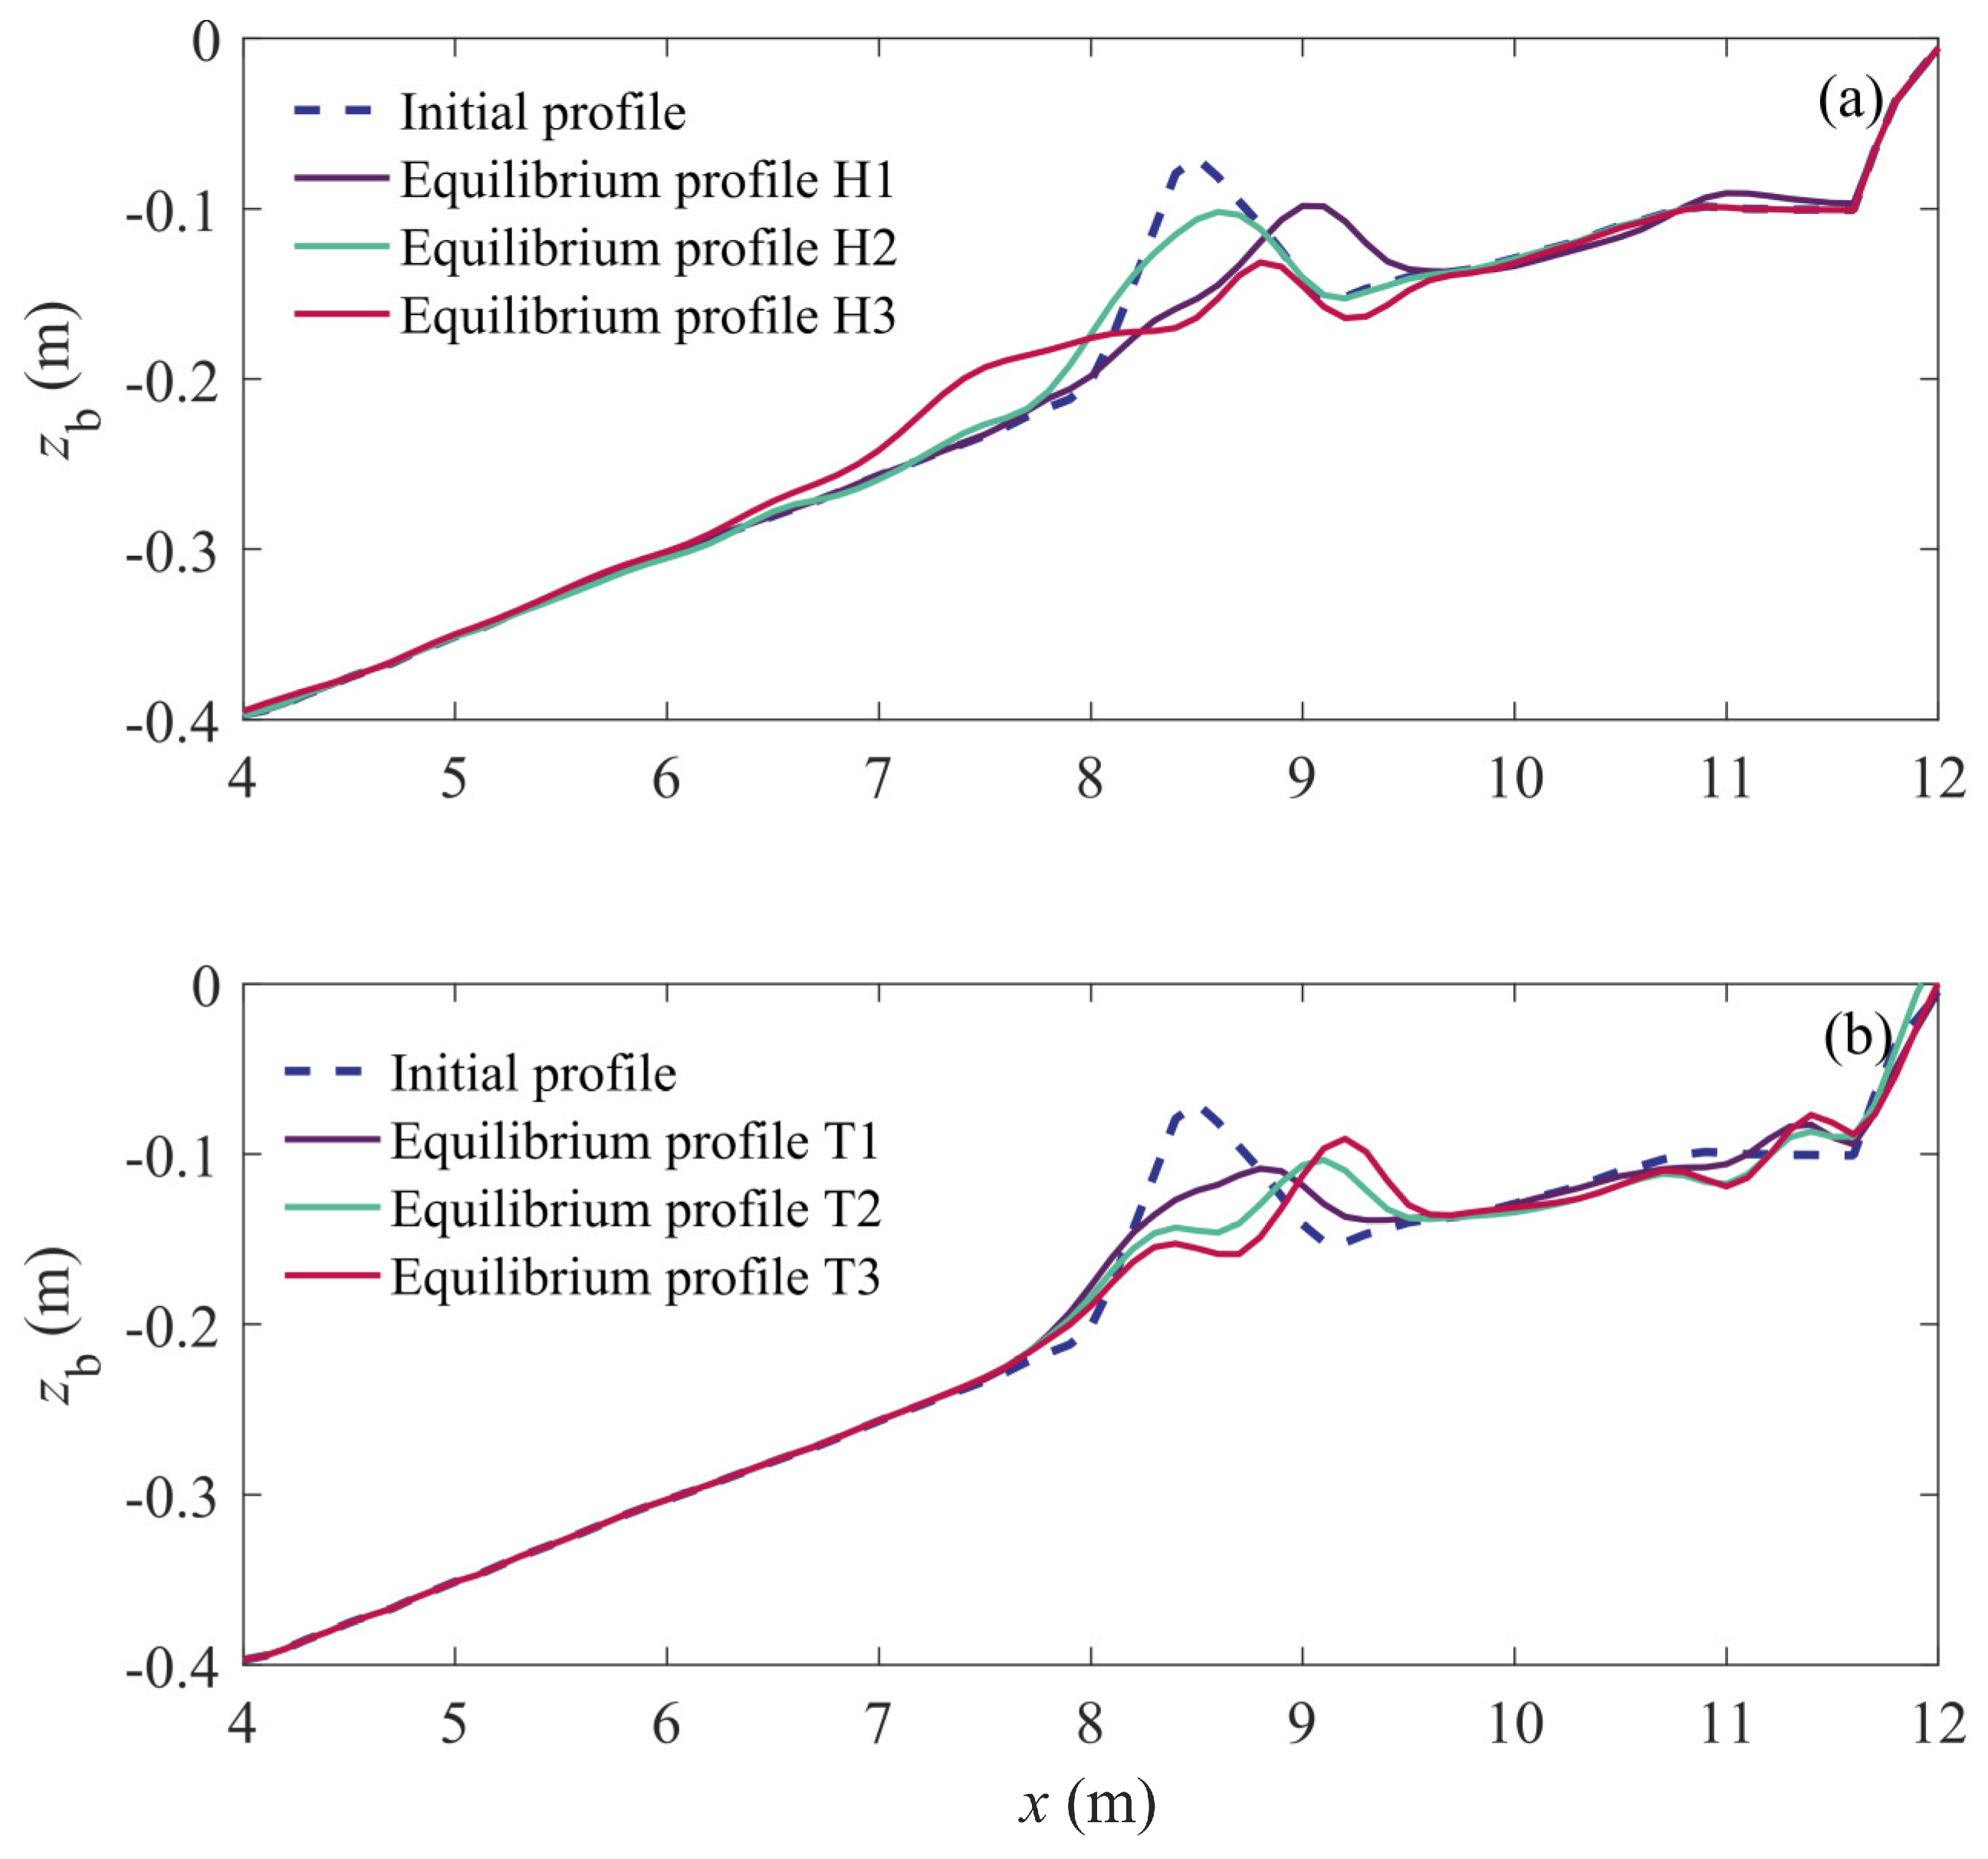
4.2. Effect of Incident Wave Conditions

In this section, the effects of incident wave condition on equilibrium profile of the shoreface nourishment implemented on the background reflective beach are analyzed. The incident wave height and wave period have been changed in the boundary condition of the numerical model. Model calibration parameters are equal to those in Table 2 for case A1_2. Detailed information on the idealized tests are shown in Table 3. For cases H1–H3, Hs0 ranges from 0.05 to 0.15 m with Tp fixed as 2.5 s. Meanwhile, for cases T1–T3, Tp changes from 1 to 1.5 s with Hs0 fixed as 0.05 m. All cases in Table 3 are conducted without sea-level rise, i.e., SWL is fixed as 0 m. The Ω ranges from 0.67 to 2, which is corresponding to the range of reflective beach according to Wright et al. [20]. The wave duration for each case is the same as for A1_2, i.e., 340 min. As is provided in Figure 12 for an instance, the cross-shore cumulative sediment transport gradient qn defined in Equation (34) decreases in case H1 as time goes on, indicating that the shoreface nourishment tends to be equilibrium. All cases in Table 3 exhibit equilibrium trends, and reach the quasi-equilibrium state at the end of wave duration.
As can be seen in Figure 13a, equilibrium profiles of the shoreface nourishment in case H1, H2, and H3 are provided. For H1 with relatively small wave height, the shoreface nourishment migrates onshore and tends to be equilibrium shoreward of the initial implementation. For H2, the equilibrium shoreface nourishment does not exhibit an obvious cross-shore migration trend. For H3 with relatively large wave height, the shoreface nourishment is eroded and smoothed with sediment accumulating offshore of it, but its crest position keeps stable at x = 8.8 m. Hence, it is noted that large wave height tends to smooth and diffuse the shoreface nourishment to the sea. The effect of wave period on equilibrium profile of the shoreface nourishment is provided in Figure 13b. For T1 with relatively small wave period, the shoreface nourishment is stable and becomes equilibrium without obvious cross-shore migration. As the wave period increases, the shoreface nourishment tends to migrate shoreward.

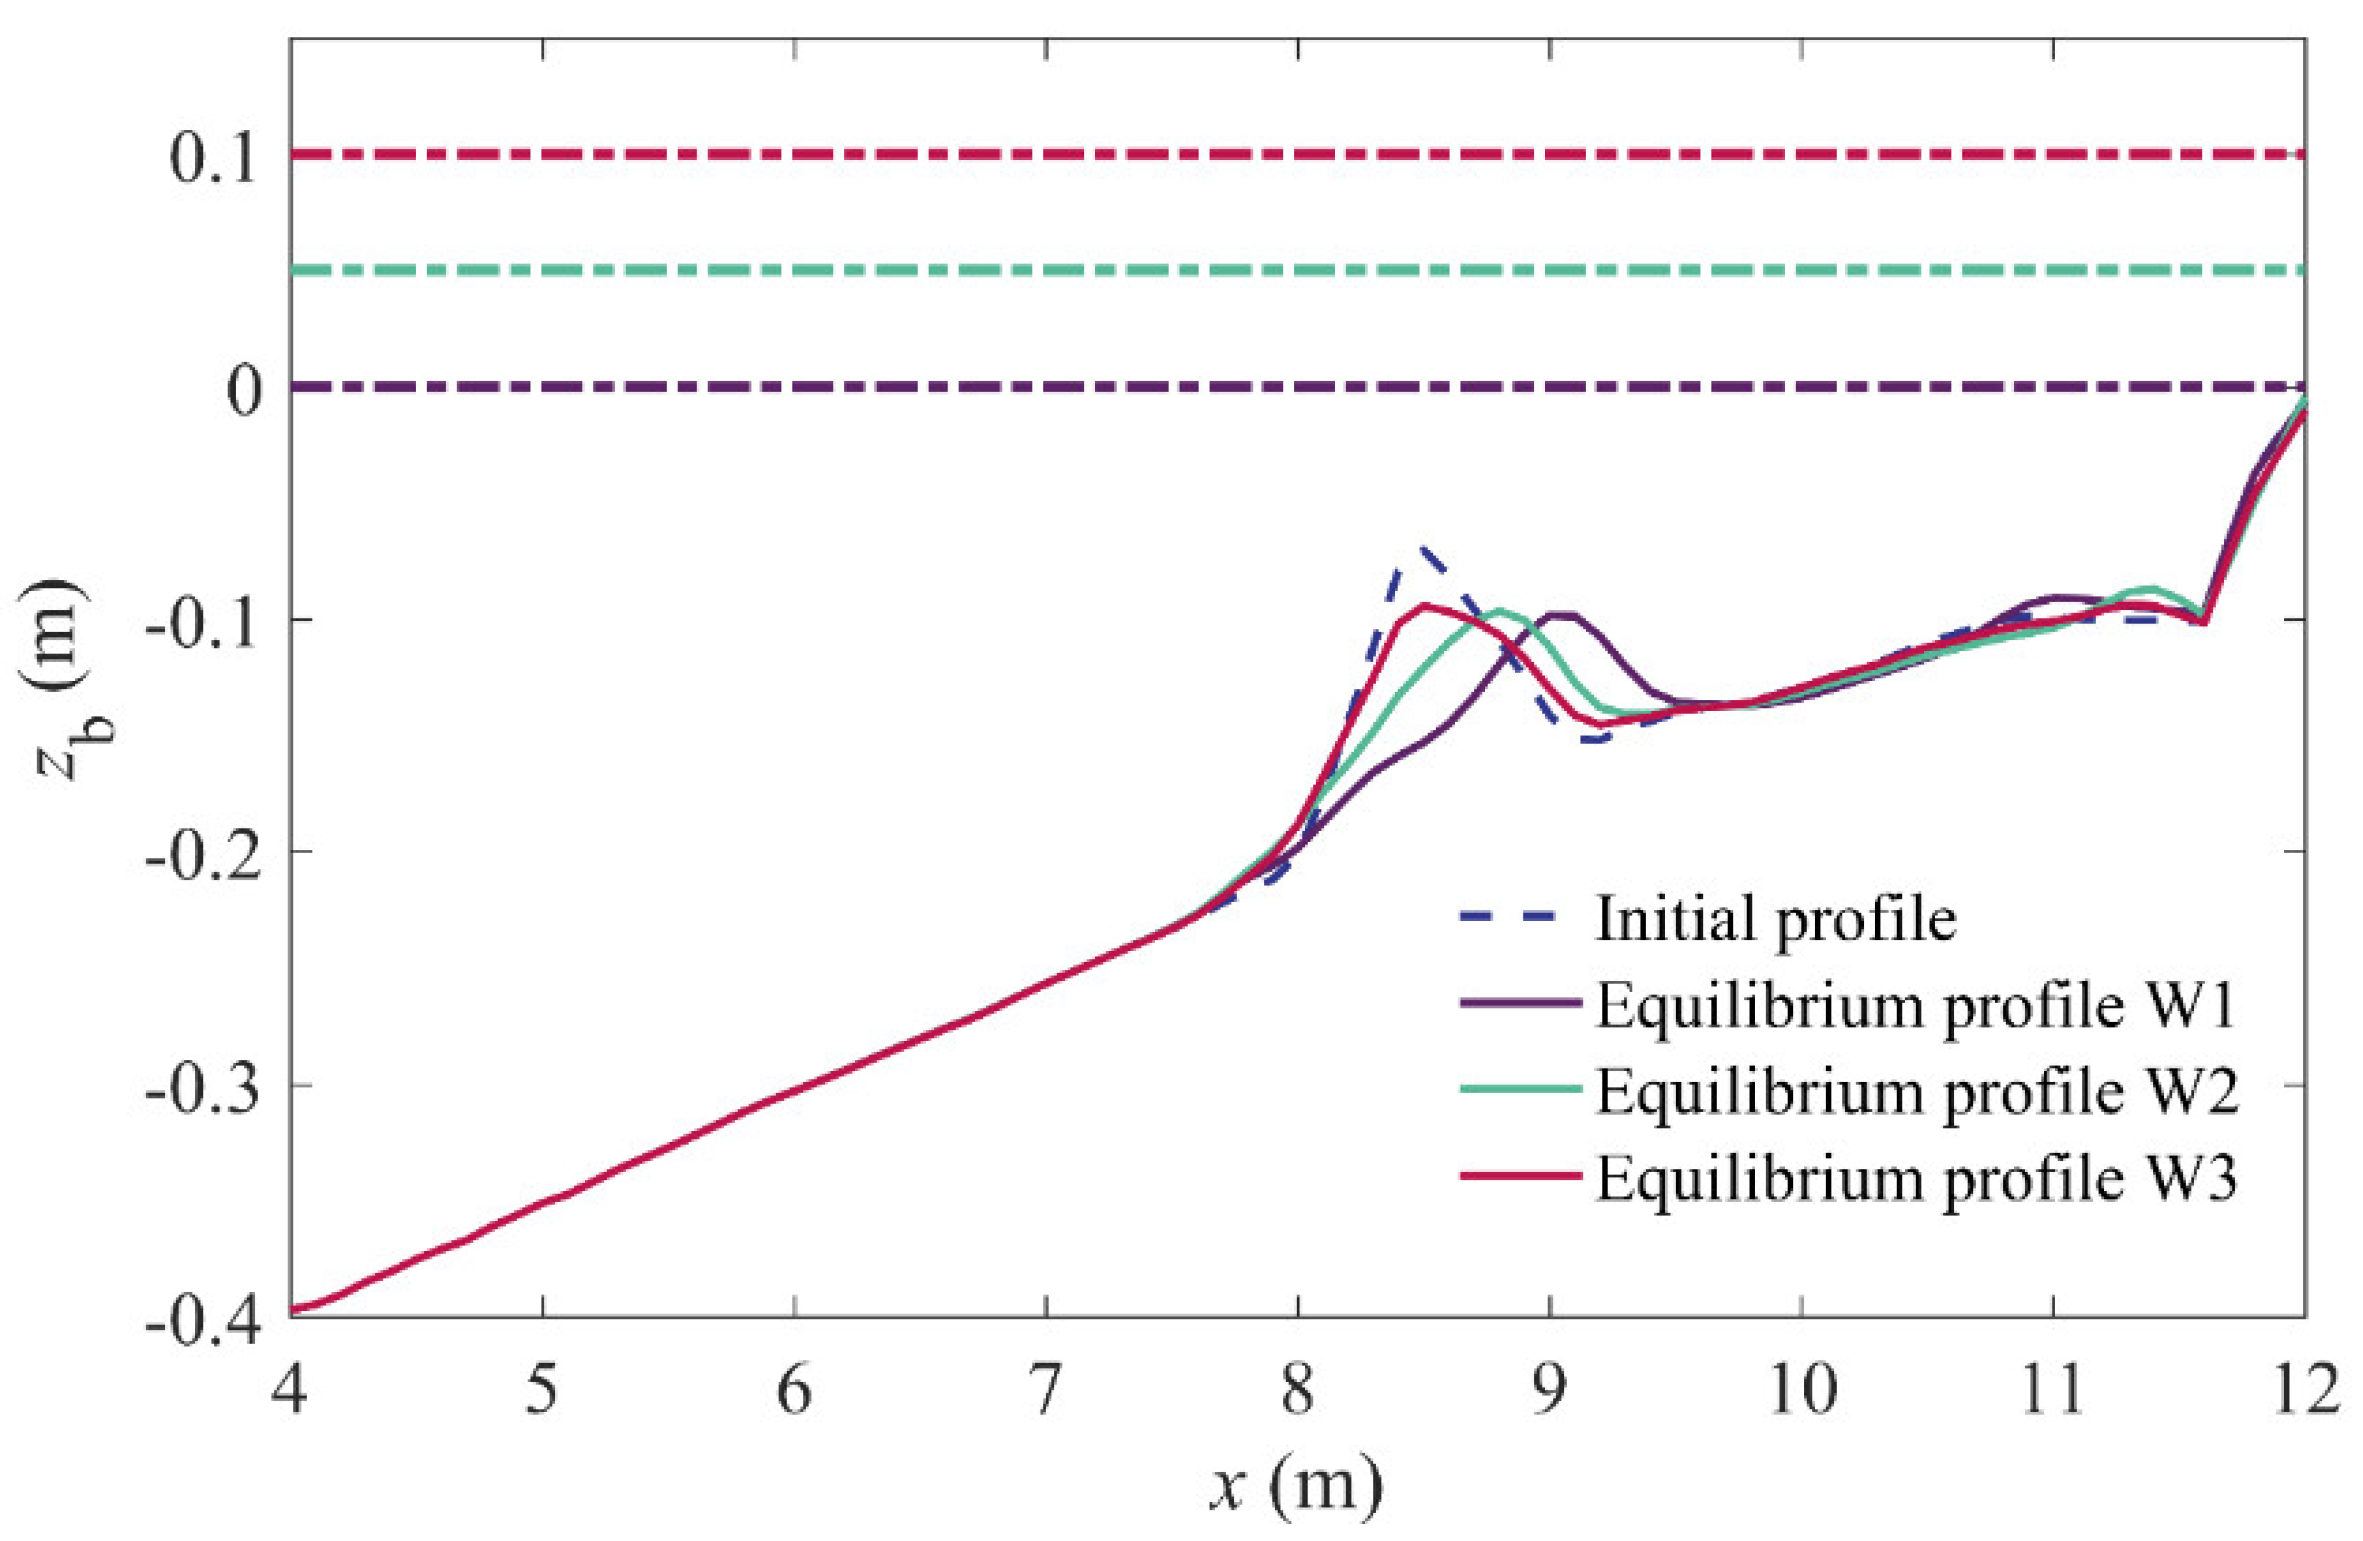
4.3. Effect of Sea-Level Rise

In this section, the effects of sea-level rise on the equilibrium profile of the shoreface nourishment on the reflective beach under mild wave conditions are investigated. Similarly, detailed information on the relevant idealized tests are provided in Table 3 (W1, W2, and W3). The sea-level increases from 0 to 0.1 m with the wave height and wave period fixed as 0.05 m and 2 s, respectively. Model calibration parameters are also same to those in Table 2 for case A1_2. As can be seen in Figure 14, the shoreface nourishment migrates onshore and tends to be equilibrium shoreward of the initial implementation. As the still water level increases to 0.05 m, the onshore migration trend is weak. Furthermore, the onshore migration trend of the shoreface nourishment is not obvious when the still water level increases to 0.1 m. Hence, it can be concluded that sea-level rise can limit the shoreface nourishment onshore migration under mild wave conditions. This is partly because sea-level rise increases the water depth over the shoreface nourishment, and thus decreases the wave nonlinearity and sediment transport capacity.

5. Conclusions

In this study, both experimental measurements and numerical modeling are used to investigate the wave dissipation and sediment transport patterns during the evolution of the shoreface nourishment towards equilibrium under mild wave conditions. The shoreface nourishment has been found to be quasi-equilibrium both on intermediate and reflective beaches in the wave flume. The numerical model is in a process-based framework coupling wave and roller transformation, undertow, bottom boundary layer, sediment transport, and bed profile evolution. Furthermore, the effects of incident wave height, wave period and sea-level rise on the equilibrium profile of the shoreface nourishment under mild wave conditions are discussed.
Experimental measurements show that the shoreface nourishment migrates onshore and gradually tend to be quasi-equilibrium. The shoreface nourishment increases local wave height and strengthens wave nonlinearity due to its small water depth. Traditional equilibrium wave dissipation rate formula proposed by Dean [24] overestimates wave energy dissipation rate on the nourished beach in most positions. The distribution of wave energy dissipation rate at quasi-equilibrium state is more uniform than that at the initial state on the shoreface nourishment.
The present numerical model reproduces wave height and profile evolution with satisfactory agreements. In case A1_2 with a small crest depth, the total sediment transport rate is found to be maximum on the nourishment crest. While the crest depth is larger in case E1_1, the most intense sediment transport occurs in front of the shoreline and sediment transport capacity on the nourishment crest is limited. Onshore bedload transport is the primary cause for the onshore migration of the shoreface nourishment. Compared with bedload transport, suspended sediment transport is negligible on the nourishment crest. The magnitude of bedload transport decreases during the evolution of the shoreface nourishment towards equilibrium.
Based on idealized tests, it is found that the shoreface nourishment migrates onshore and tends to be equilibrium shoreward of the initial implementation with small incident wave height. Large wave height tends to smooth and diffuse the shoreface nourishment to the sea. Meanwhile, the equilibrium profile of the shoreface nourishment can be formed more shoreward with a larger wave period. Under mild wave conditions, the shoreface nourishment becomes more stable as the sea-level rise.
In terms of the ‘lee effect’ of the shoreface nourishment, a smaller water depth over the shoreface nourishment is expected to provide a better protection near the shoreline. However, the shoreface nourishment is more active under the circumstances, and its ‘life time’ might be shorter. From another perspective, the water depth over the shoreface nourishment should be enlarged to achieve a better stability, especially with the increasing wave height. The design of shoreface nourishment should take the sea-level rise into account, which can weaken the ‘lee effect’ of the shoreface nourishment on one hand, and enhance the stability of the shoreface nourishment on the other hand.

Author Contributions

Conceptualization, Y.L. and C.Z.; methodology, Y.L. and C.Z.; software, C.Z. and Y.L.; validation, Y.C., M.X. and Y.L.; formal analysis, Y.L.; investigation, Y.L.; resources, C.Z.; data curation, Y.C. and H.Q.; writing—original draft preparation, Y.L.; writing—review and editing, C.Z. and H.Q.; visualization, Y.L.; supervision, C.Z., M.X. and Y.W.; project administration, C.Z.; funding acquisition, C.Z. and M.X. All authors have read and agreed to the published version of the manuscript.

Funding

This research was funded by the National Natural Science Foundation of China, grant numbers 51879096 and 51779112, the Key Program of National Natural Science Foundation of China, grant number 41930538, the Special Research Funding of State Key Laboratory of Hydrology-Water Resources and Hydraulic Engineering, grant numbers 20195025812 and 20185044512.

Informed Consent Statement

Not applicable.

Data Availability Statement

The data presented in this study are available upon request from the corresponding author.

Acknowledgments

The authors are very much grateful to the three anonymous reviewers for their constructive comments that significantly improved the quality of this paper. Our graduate students Yang Haoye and Chen Yanzhe are acknowledged for their contributions in conducting laboratory experiments.

Conflicts of Interest

The authors declare no conflict of interest. The funders had no role in the design of the study; in the collection, analyses, or interpretation of data; in the writing of the manuscript, or in the decision to publish the results.

References

  1. Luijendijk, A.; Hagenaars, G.; Ranasinghe, R.; Baart, F.; Donchyts, G.; Aarninkhof, S. The State of the World’s Beaches. Sci. Rep. 2018, 8, 6641. [Google Scholar] [CrossRef] [PubMed]
  2. de Schipper, M.A.; Ludka, B.C.; Raubenheimer, B.; Luijendijk, A.; Schlacher, T.A. Beach nourishment has complex implications for the future of sandy shores. Nat. Rev. Earth Environ. 2020, 2, 70–84. [Google Scholar] [CrossRef]
  3. Ranasinghe, R.; Callaghan, D.; Stive, M.J.F. Estimating coastal recession due to sea level rise: Beyond the Bruun rule. Clim. Chang. 2012, 110, 561–574. [Google Scholar] [CrossRef] [Green Version]
  4. Tao, J.; Li, G. Contemporary monitoring of storm surge activity. Prog. Phys. Geog. 2020, 44, 299–314. [Google Scholar]
  5. Arnell, N.W.; Gousling, S.N. The impacts of climate change on river flood risk at the global scale. Clim. Chang. 2016, 134, 387–401. [Google Scholar] [CrossRef] [Green Version]
  6. Sinay, L.; Carter, R.W. Climate Change Adaptation Options for Coastal Communities and Local Governments. Climate 2020, 8, 7. [Google Scholar] [CrossRef] [Green Version]
  7. Maiolo, M.; Mel, R.A.; Sinopoli, S. A Stepwise Approach to Beach Restoration at Calabaia Beach. Water 2020, 12, 2667. [Google Scholar] [CrossRef]
  8. Cooke, B.C.; Jones, A.R.; Goodwin, I.D.; Bishop, M.J. Nourishment practices on Australian sandy beaches: A review. J. Environ. Manag. 2012, 113, 319–327. [Google Scholar] [CrossRef]
  9. Hanson, H.; Brampton, A.; Capobianco, M.; Dette, H.; Hamm, L.; Laustrup, C.; Lechuga, A.; Spanhoff, R. Beach nourishment projects, practices, and objectives—A European overview. Coast. Eng. 2002, 47, 81–111. [Google Scholar] [CrossRef]
  10. Eichentopf, S.; Karunarathna, H.; Alsina, J.M. Morphodynamics of sandy beaches under the influence of storm sequences: Current research status and future needs. Water Sci. Eng. 2019, 3, 221–234. [Google Scholar] [CrossRef]
  11. Elko, N.A.; Wang, P. Immediate profile and planform evolution of a beach nourishment project with hurricane influences. Coast. Eng. 2007, 54, 49–66. [Google Scholar] [CrossRef]
  12. Brutsché, K.E.; Wang, P.; Beck, T.M.; Rosati, J.D.; Legault, K.R. Morphological evolution of a submerged artificial nearshore berm along a low-wave microtidal coast, Fort Myers Beach, west-central Florida, USA. Coast. Eng. 2014, 91, 29–44. [Google Scholar] [CrossRef]
  13. van Duin, M.J.P.; Wiersma, N.R.; Walstra, D.J.R.; Van Rijn, L.C.; Stive, M.J.F. Nourishing the shoreface: Observations and hindcasting of the Egmond case, The Netherlands. Coast. Eng. 2004, 51, 813–837. [Google Scholar] [CrossRef]
  14. Ojeda, E.; Ruessink, B.G.; Guillen, J. Morphodynamic response of a two-barred beach to a shoreface nourishment. Coast. Eng. 2008, 55, 1185–1196. [Google Scholar] [CrossRef]
  15. Grunnet, N.M.; Walstra, D.R.; Ruessink, B.G. Process-based modelling of a shoreface nourishment. Coast. Eng. 2004, 51, 581–607. [Google Scholar] [CrossRef]
  16. Pan, Y.; Kuang, C.; Zhang, J.; Chen, Y.; Mao, X.; Ma, Y.; Zhang, Y.; Yang, Y.; Qiu, R. Postnourishment evolution of beach profiles in a low-energy sandy beach with a submerged berm. J. Waterw. Port Coast. Ocean Eng. 2017, 143, 05017001. [Google Scholar] [CrossRef]
  17. Grasso, F.; Michallet, H.; Barthélemy, E. Experimental simulation of shoreface nourishments under storm events: A morphological, hydrodynamic, and sediment grain size analysis. Coast. Eng. 2011, 58, 184–193. [Google Scholar] [CrossRef]
  18. Kuang, C.; Han, X.; Zhang, J.; Zou, Q.; Dong, B. Morphodynamic Evolution of a Nourished Beach with Artificial Sandbars: Field Observations and Numerical Modeling. J. Mar. Sci. Eng. 2021, 9, 245. [Google Scholar] [CrossRef]
  19. van der Meulen, T.; Gourlay, M.R. Beach and Dune Erosion Tests; American Society of Civil Engineers (ASCE): New York, NY, USA, 1969. [Google Scholar]
  20. Wright, L.; Short, A.; Green, M. Short-term changes in the morphodynamic states of beaches and surf zones: An empirical predictive model. Mar. Geol. 1985, 62, 339–364. [Google Scholar] [CrossRef]
  21. Baldock, T.E.; Birrien, F.; Atkinson, A.; Shimamoto, T.; Wu, S.; Callaghan, D.P.; Nielsen, P. Morphological hysteresis in the evolution of beach profiles under sequences of wave climates-Part 1: Observations. Coast. Eng. 2017, 128, 92–105. [Google Scholar] [CrossRef] [Green Version]
  22. Birrien, F.; Atkinson, A.; Shimamoto, T.; Baldock, T.E. Hysteresis in the evolution of beach profile parameters under sequences of wave climates-Part 2: Modelling. Coast. Eng. 2018, 133, 13–25. [Google Scholar] [CrossRef] [Green Version]
  23. Birrien, F.; Baldock, T.E. A Coupled Hydrodynamic-Equilibrium Type Beach Profile Evolution Model. J. Mar. Sci. Eng. 2021, 9, 353. [Google Scholar] [CrossRef]
  24. Dean, R.G. Equilibrium Beach Profiles: US Atlantic and Gulf Coasts; Department of Civil Engineering and College of Marine Studies, University of Delaware: Newark, DE, USA, 1977. [Google Scholar]
  25. Wang, P.; Kraus, N.C. Beach profile equilibrium and patterns of wave decay and energy dissipation across the surf zone elucidated in a large-scale laboratory experiment. J. Coast. Res. 2005, 21, 522–534. [Google Scholar] [CrossRef]
  26. Zhang, C.; Zhang, Q.; Zheng, J.; Demirbilek, Z. Parameterization of nearshore wave front slope. Coast. Eng. 2017, 127, 80–87. [Google Scholar] [CrossRef]
  27. Zheng, J.; Yao, Y.; Chen, S.; Chen, S.; Zhang, Q. Laboratory study on wave-induced setup and wave-driven current in a 2DH reef-lagoon-channel system. Coast. Eng. 2020, 162, 103772. [Google Scholar] [CrossRef]
  28. Fan, J.; Zheng, J.; Tao, A.; Liu, Y. Upstream-propagating waves induced by steady current over a rippled bottom: Theory and experimental observation. J. Fluid Mech. 2021, 910, A49. [Google Scholar] [CrossRef]
  29. Atkinson, A.L.; Baldock, T.E. Laboratory investigation of nourishment options to mitigate sea level rise induced erosion. Coast. Eng. 2020, 161, 103769. [Google Scholar] [CrossRef]
  30. Hurther, D.; Thorne, P.D.; Bricault, M.; Lemmin, U.; Barnoud, J.M. A multi-frequency Acoustic Concentration and Velocity Profile (ACVP) for boundary layer measurements of fine-scale flow and sediment transport processes. Coast. Eng. 2011, 58, 594–605. [Google Scholar] [CrossRef]
  31. van der Zanden, J.; van der A, D.A.; Hurther, D.; Cáceres, I.; O’Donoghue, T.; Ribberink, J.S. Suspended sediment transport around a large-scale laboratory breaker bar. Coast. Eng. 2017, 125, 51–69. [Google Scholar] [CrossRef]
  32. van der Zanden, J.; van der A, D.A.; Hurther, D.; Cáceres, I.; O’Donoghue, T.; Hulscher, S.J.M.H.; Ribberink, J.S. Bedload and suspended load contributions to breaker bar morphodynamics. Coast. Eng. 2017, 129, 74–92. [Google Scholar] [CrossRef]
  33. Jacobsen, N.G.; Fredsøe, J. Cross-shore Redistribution of Nourished Sand near a Breaker Bar. J. Waterw. Port Coast. Ocean Eng. 2014, 140, 125–134. [Google Scholar] [CrossRef]
  34. Cheng, J.; Wang, P. Dynamic equilibrium of sandbar position and height along a low wave energy micro-tidal coast. Cont. Shelf Res. 2018, 165, 120–136. [Google Scholar] [CrossRef]
  35. Xue, M.; Zheng, J.; Lin, P.; Yuan, X. Experimental study on vertical baffles of different configurations in suppressing sloshing pressure. Ocean Eng. 2017, 136, 178–189. [Google Scholar] [CrossRef]
  36. Henriquez, M.; Reniers, A.J.H.M.; Ruessink, B.G.; Stive, M.J.F.; Stanton, T.P.; Foster, D.L. On the scaling of sediment transport in the nearshore. In Proceedings of the Second International Conference on the Application of Physical Modelling to Port and Coastal Protection, Bari, Italy, 2–5 July 2008; International Association for Hydro-Environmental Engineering and Research: Bari, Italy, 2008; pp. 193–204. [Google Scholar]
  37. van Rijn, L.C. Principles of Sediment Transport in Rivers, Estuaries, and Coastal Seas; Aqua: Blokzijl, The Netherlands, 1993. [Google Scholar]
  38. Nielsen, P. Coastal Bottom Boundary Layers and Sediment Transport. In Advanced Series on Ocean Engineering; World Scientific: Singapore, 1992; Volume 4. [Google Scholar]
  39. Zheng, J.; Zhang, C.; Demirbilek, Z.; Lin, L. Numerical Study of Sandbar Migration under Wave-Undertow Interaction. J. Waterw. Port Coast. Ocean Eng. 2014, 140, 146–159. [Google Scholar] [CrossRef] [Green Version]
  40. Li, Y.; Zhang, C.; Chen, D.; Zheng, J.; Sun, J.; Wang, P. Barred beach profile equilibrium investigated with a process-based numerical model. Cont. Shelf Res. 2021, 222, 104432. [Google Scholar] [CrossRef]
  41. Janssen, T.T.; Battjes, J.A. A note on wave energy dissipation over steep beaches. Coast. Eng. 2007, 54, 711–716. [Google Scholar] [CrossRef]
  42. Zhang, C.; Zheng, J.; Wang, Y.; Demirbilek, Z. Modeling wave-current bottom boundary layers beneath shoaling and breaking waves. Geo-Mar. Lett. 2011, 31, 189–201. [Google Scholar] [CrossRef]
  43. Ruessink, B.G.; Ramaekers, G.; van Rijn, L.C. On the parameterization of the free-stream non-linear wave orbital motion in nearshore morphodynamic models. Coast. Eng. 2012, 65, 56–63. [Google Scholar] [CrossRef]
  44. Nielsen, P.; Callaghan, D.P. Shear stress and sediment transport calculations for sheet flow under waves. Coast. Eng. 2003, 47, 347–354. [Google Scholar] [CrossRef]
  45. Reniers, A.J.H.M.; Thornton, E.B.; Stanton, T.P.; Roelvink, J.A. Vertical flow structure during Sandy Duck: Observations and modeling. Coast. Eng. 2004, 51, 237–260. [Google Scholar] [CrossRef]
  46. Chen, D.; Wang, Y.; Melville, B.; Huang, H.; Zhang, W. Unified formula for critical shear stress for erosion of sand, mud, and sand-mud mixtures. J. Hydraul. Eng. 2018, 144, 04018046. [Google Scholar] [CrossRef]
  47. Chen, D.; Melville, B.; Zheng, J.; Wang, Y.; Zhang, C.; Guan, D.; Chen, C. Pick up rate of non-cohesive sediments in low-velocity flows. J. Hydraul. Res. 2021. [Google Scholar] [CrossRef]
  48. Ribberink, J.S. Bed-load transport for steady flows and unsteady oscillatory flows. Coast. Eng. 1998, 34, 59–82. [Google Scholar] [CrossRef]
  49. Richardson, J.F.; Zaki, W.N. Sedimentation and fluidization. I. Trans. ICE. 1954, 32, 35–53. [Google Scholar]
  50. Zyserman, J.A.; Fredsøe, J. Data-analysis of bed concentration of suspended sediment. J. Hydraul. Div. Am. Soc. Civ. Eng. 1994, 9, 1021–1042. [Google Scholar] [CrossRef]
  51. Larson, M.; Kraus, N.C. SBEACH: Numerical Model for Simulating Storm-Induced Beach Change; CERC: Vicksburg, MS, USA, 1989. [Google Scholar]
  52. Ruessink, B.G.; Kuriyama, Y.; Reniers, A.J.H.M.; Roelvink, J.A.; Walstra, D.J.R. Modeling cross-shore sandbar behavior on the timescale of weeks. J. Geophys. Res. 2007, 112. [Google Scholar] [CrossRef] [Green Version]
  53. Hunt, I.A. Design of seawalls and breakwaters. J. Waterw. Harb. Div. 1959, 85, 123–152. [Google Scholar] [CrossRef]
  54. Liu, B.; Cheng, D.; Sun, Z.; Zhao, X.; Chen, Y.; Lin, W. Experimental and numerical study of regular waves past a submerged breakwater. J. Hydrodyn. 2019, 31, 641–653. [Google Scholar] [CrossRef]
  55. Ruessink, B.G.; Walstra, D.J.R.; Southgate, H.N. Calibration and verification of a parametric wave model on barred beaches. Coast. Eng. 2003, 48, 139–149. [Google Scholar] [CrossRef]
  56. van der Westhuysen, A.J. Modeling of depth-induced wave breaking under finite depth wave growth conditions. J. Geophys. Res. Oceans. 2010, 115. [Google Scholar] [CrossRef]
  57. Zhang, C.; Li, Y.; Cai, Y.; Shi, J.; Zheng, J.; Cai, F.; Qi, H. Parameterization of nearshore wave breaker index. Coast. Eng. 2021, 103914. [Google Scholar] [CrossRef]
  58. Eichentopf, S.; van der Zanden, J.; Cáceres, I.; Alsina, J.M. Beach Profile Evolution towards Equilibrium from Varying Initial Morphologies. J. Mar. Sci. Eng. 2019, 7, 406. [Google Scholar] [CrossRef] [Green Version]
  59. Hoefel, F.; Elgar, S. Wave-Induced Sediment Transport and Sandbar Migration. Science 2003, 299, 1885–1887. [Google Scholar] [CrossRef] [Green Version]
  60. Hsu, T.J.; Elgar, S.; Guza, R.T. Wave-induced sediment transport and onshore sandbar migration. Coast. Eng. 2006, 53, 817–824. [Google Scholar] [CrossRef] [Green Version]
  61. Dong, G.; Chen, H.; Ma, Y. Parameterization of nonlinear shallow water waves over sloping bottoms. Coast. Eng. 2014, 94, 23–32. [Google Scholar] [CrossRef]
  62. Peng, Z.; Zou, Q.; Reeve, D.; Wang, B. Parameterisation and transformation of wave asymmetries over a low-crested breakwater. Coast. Eng. 2009, 56, 1123–1132. [Google Scholar] [CrossRef]
  63. Zou, Q.; Peng, Z. Evolution of wave shape over a low-crested structure. Coast. Eng. 2011, 58, 478–488. [Google Scholar] [CrossRef]
  64. Baldock, T.E.; Alsina, J.M.; Cáceres, I.; Vicinanza, D.; Contestabile, P.; Power, H.; Sanchez-Arcilla, A. Large-scale experiments on beach profile evolution and surf and swash zone sediment transport induced by long waves, wave groups and random waves. Coast. Eng. 2011, 58, 214–227. [Google Scholar] [CrossRef]
  65. Moore, B.D. Beach Profile Evolution in Response to Changes in Water Level and Wave Height. Master’s Thesis, Department of Civil Engineering, University of Delaware, Newark, Delaware, 1982. [Google Scholar]
  66. Dean, R.G. Equilibrium beach profiles: Characteristics and applications. J. Coast. Res. 1991, 7, 53–84. [Google Scholar]
  67. Battjes, J.A.; Stive, M.J.F. Calibration and verification of a dissipation model for random breaking waves. J. Geophys. Res. Ocean. 1985, 90, 9159–9167. [Google Scholar] [CrossRef]
  68. Baldock, T.E.; Holmes, P.; Bunker, S.; Van Weert, P. Cross-shore hydrodynamics within an unsaturated surf zone. Coast. Eng. 1998, 34, 173–196. [Google Scholar] [CrossRef]
  69. Power, H.E.; Baldock, T.E.; Callaghan, D.P.; Nielsen, P. Surf Zone States and Energy Dissipation Regimes—A Similarity Model. Coast. Eng. J. 2013, 55, 1350003-1–1350003-18. [Google Scholar] [CrossRef]
  70. Martins, K.; Blenkinsopp, C.E.; Almar, R.; Zang, J. The influence of swash-based reflection on surf zone hydrodynamics: A wave-by-wave approach. Coast. Eng. 2017, 122, 27–43. [Google Scholar] [CrossRef] [Green Version]
  71. Chen, W.L.; Dodd, N. An idealised study for the evolution of a shoreface nourishment. Cont. Shelf Res. 2019, 178, 15–26. [Google Scholar] [CrossRef]
  72. Chen, W.L.; Dodd, N. A nonlinear perturbation study of a shoreface nourishment on a multiply barred beach. Cont. Shelf Res. 2021, 214, 104317. [Google Scholar] [CrossRef]
  73. Dubarbier, B.; Castelle, B.; Marieu, V.; Ruessink, B.G. Process-based modeling of cross-shore sandbar behavior. Coast. Eng. 2015, 95, 35–50. [Google Scholar] [CrossRef]
  74. Xie, M.; Li, S.; Zhang, C.; Yang, Z.; Hou, Z.; Zhang, H. Investigation and discussion on the beach morphodynamic response under storm events based on a three-dimensional numerical model. China Ocean Eng. 2021, 35, 12–25. [Google Scholar] [CrossRef]
  75. Xie, M.; Zhang, C.; Li, J.; Li, S.; Yang, Z.; Zhang, H.; Qu, K. Flow structure and bottom friction of the nonlinear turbulent boundary layer under stormy waves. Coast. Eng. 2021, 164, 103811. [Google Scholar] [CrossRef]
Figure 1. Sketch of experimental setup.
Jmse 09 00535 g001
Figure 2. Initial profile after shoreface nourishment implementation on the reflective beach (a) and the intermediate beach (b).
Jmse 09 00535 g002
Figure 3. Experimental results of beach profile evolution in case A1_2 (a) and E1_1 (b).
Jmse 09 00535 g003
Figure 4. The magnitudes of bed elevation changing rates for case A1_2 (a) and E1_1 (b).
Jmse 09 00535 g004
Figure 5. Measured (a) normalized root-mean-square wave height, (b) wave skewness, (c) wave asymmetry, (d) time-averaged sediment transport rate across the (e) initial and final profiles for case A1_2. Subscript ‘0′ means the quantity at x = 0 m.
Jmse 09 00535 g005
Figure 6. Measured (a) normalized root-mean-square wave height, (b) wave skewness, (c) wave asymmetry, (d) time-averaged sediment transport rate across the (e) initial and final profiles for case E1_1. Subscript ‘0′ means the quantity at x = 0 m.
Jmse 09 00535 g006
Figure 7. Wave energy dissipation rates corresponding to initial and final profile in case A1_2 (a) and (c), in case E1_1 (b) and (d).
Jmse 09 00535 g007
Figure 8. Modeling of wave height and profile evolution of A1_2 (a,c) and E1_1 (b,d).
Jmse 09 00535 g008
Figure 9. Spatiotemporal evolution of bed profile evolution for A1_2 (a) and E1_1 (b). Black dashed line means the crest of the nourishment and two dotted lines indicate two boundaries. Shoreline position is indicted by the grey dashed line.
Jmse 09 00535 g009
Figure 10. Spatiotemporal evolution of period-averaged total sediment transport rate in case A1_2 (a) and E1_1 (b). Black dashed line means the crest of the nourishment and two dotted lines indicate two boundaries. Shoreline position is indicted by the grey dashed line.
Jmse 09 00535 g010
Figure 11. Spatiotemporal evolution of period-averaged bedload transport (a,b), and suspended sediment transport (c,d). Left panel is in case A1_2, and right panel is in case E1_1. Black dashed line means the crest of the nourishment and two dotted lines indicate two boundaries. Shoreline position is indicted by the grey dashed line.
Jmse 09 00535 g011
Figure 12. Temporal evolution of case H1.
Jmse 09 00535 g012
Figure 13. Equilibrium profile of the shoreface nourishment with different wave heights (a) and wave periods (b).
Jmse 09 00535 g013
Figure 14. Equilibrium profile of the shoreface nourishment with different still water levels. Water level for each case is represented by the dash-dotted line in the same color.
Jmse 09 00535 g014
Table 1. Incident wave conditions.
Case IDBackgroundHs0 (m)Tp (s) Ω Duration (min)
A1_2Reflective0.0520.83340
E1_1Intermediate0.052.50.67540
Table 2. Model calibration parameters.
Case IDβfvφ (o)
A1_20.070.01530
E1_10.020.0230
Table 3. Wave conditions for idealized tests.
Case IDHs0 (m)Tp (s) Ω SWL (m)
H10.052.50.670
H20.12.51.330
H30.152.520
T10.0511.670
T20.051.251.330
T30.051.51.110
W10.052.00.830
W20.052.00.830.05
W30.052.00.830.1
Publisher’s Note: MDPI stays neutral with regard to jurisdictional claims in published maps and institutional affiliations.

