Article

Aquaculture Farming Effect on Benthic Respiration and Nutrient Flux in Semi-Enclosed Coastal Waters of Korea

1
Marine Environment Research Center, Korea Institute of Ocean Science and Technology, 385, Haeyang-ro, Yengdo-gu, Busan 49111, Korea
2
Department of Convergence Study on the Ocean Science and Technology, Ocean Science and Technology School, 385, Haeyang-ro, Yengdo-gu, Busan 49111, Korea
3
Research and Development Planning Division, National Institute of Fisheries Science, 216 Gijanghaean-ro, Gijang-eup, Busan 46083, Korea
4
Marine Environmental Research Division, National Institute of Fisheries Science, 216 Gijanghaean-ro, Gijang-eup, Busan 46083, Korea
5
Marine Bio-Resources Research Unit, Korea Institute of Ocean Science and Technology, 385, Haeyang-ro, Yengdo-gu, Busan 49111, Korea
6
Instrumental Development and Management Center, Korea Institute of Ocean Science and Technology, 385, Haeyang-ro, Yengdo-gu, Busan 49111, Korea
7
Department of Environmental Chemistry and Ecology, Geosystem Research Corporation, 172 LS-ro, Gunpo-si 15807, Korea
*
Author to whom correspondence should be addressed.
J. Mar. Sci. Eng. 2021, 9(5), 554; https://0-doi-org.brum.beds.ac.uk/10.3390/jmse9050554
Submission received: 7 April 2021 / Revised: 14 May 2021 / Accepted: 14 May 2021 / Published: 20 May 2021
(This article belongs to the Special Issue Aquaculture Impacts on Marine Ecosystems)

Abstract

:
Sediment oxygen demand (SOD) and benthic nutrient fluxes (BNFs) were measured using an in situ benthic chamber at a fish farm (FF), oyster farm (OF), and controls (FF-C and OF-C) to assess the impact of aquaculture activities on organic carbon (OC) and nutrients cycles in coastal waters of Korea. The SOD at FF and OF ranged from 60 ± 2 to 157 ± 3 mmol m−2 d−1 and from 77 ± 14 to 84 ± 16 mmol m−2 d−1, respectively, more than five times those of the control sites. The SOD at farm sites is highly correlated with fish stock and food input, suggesting that excess feed input is an important control factor for OC remineralization. The combined analysis of sediment trap and SOD indicates that most of the deposited OC oxidized in the sediment and/or was laterally transported by the current before being buried in the sediment. The benthic nutrient fluxes at farms ranged from 5.45 to 8.95 mmol N m−2 d−1 for nitrogen and from 0.51 to 1.67 mmol P m−2 d−1 for phosphate, respectively, accounting for 37–270% and 52–804% of the N and P required for primary production in the water column. These results indicate that aquaculture farming may profoundly impact biogeochemical cycles in coastal waters.

1. Introduction

Over the past three decades, aquaculture has been developed rapidly because of the overharvesting of natural fish stocks and increased demand for ocean-derived food [1,2]. The contribution of aquaculture to overall production in the world has gradually increased from 20.9% in 1995 to 46.0% in 2019 [3]. Among them, finfish and shellfish aquaculture represent major aquaculture industries, accounting for 47.3% and 15.2% of the total production in 2018, respectively [3]. In Korea, aquaculture production increased from 1.0 million tons in 1995 to 2.3 million tons in 2018 and is ranked seventh in global aquaculture production [4,5].
One of the most significant environmental impacts of aquaculture is the enrichment of organic matter (OM) in the sediment layer, which is the major driving force on the hypoxia and eutrophication of coastal waters [6,7,8]. For example, about 20–50% of feed waste from the aquaculture activities is accumulated in the sediments of finfish aquaculture [9]. In contrast to finfish aquaculture, shellfish aquaculture suggests that the feeding activities of shellfish can filter the suspended particulate OM in a water column; thus, it can serve as a biofiltration system. However, the biodeposit released by excretion can be another organic source to the sediment [10,11]. In addition, the aquaculture infrastructure, net cages, and long lines can modify the hydrologic regime and promote the deposition of OM around an aquaculture farm [12,13]. Thus, both finfish and shellfish farming activities can promote OM enrichment in coastal sediment.
The OM settled onto the sediment layer is rapidly remineralized via aerobic and anaerobic respiration pathways using O2, NO3, MnO2, FeOOH, and SO42− [14,15]. Because oxygen is consumed by organic carbon (OC) oxidation in the sediment, the sediment oxygen demand (SOD) can be represented as the rates of total OC oxidation in the sediment [16]. By contrast, the residual fraction from OC oxidation known as refractory OC is buried in the sediment [15,17], and thus, the OC buried in the sediment is an important sink of OC, isolating carbon from the active carbon pools [18]. Sequential processes of OC and sedimentation–remineralization–burial in the sediment can control the carbon cycle; thus, quantification of these processes is necessary [19,20].
In an organic-rich aquaculture system, liberated ammonium and phosphate, byproducts during OM remineralization, are accumulated in the pore water and then released via the sediment–water interface (SWI) by diffusion and advection processes [21,22]. The benthic nitrogen and phosphate fluxes may enhance the eutrophication in the water column, resulting in supplying more than 50% of the nutrient required for phytoplankton production via benthic–pelagic coupling [23,24,25,26]. Unexpected high nutrient release from sediment occasionally leads to the occurrence of red tide in a coastal ecosystem [27,28]. Therefore, benthic nutrient fluxes (BNFs) are a major factor in controlling nutrient cycles and ecosystems in the coastal zone.
The southern part of the Korean Peninsula is a ria occupied with a semi-enclosed bay where aquaculture facilities have often been installed. Finfish and shellfish aquaculture in the southern region of the Korean Peninsula were initiated in the 1970s, and the production of finfish (48,000 t) and shellfish (379,000 t) accounted for 60% and 93% of the total production in 2019 of Korea (http://fips.go.kr, accessed on 20 May 2021). In spite of the long-term and large-scale operations of aquaculture farms, no comprehensive process studies on carbon and nutrient cycles in the sediment have been conducted. The main objectives of this study are to investigate the spatial and temporal variation of SOD and consequential carbon cycle associated with the farming operation and to elucidate the potential contribution of BNF to primary production in the water column at finfish and shellfish aquaculture.

2. Materials and Methods

2.1. Study Area

The study sites are located in the inner part of Geoje–Tongyeong coastal waters, and the control sites are ~1 km away from finfish and shellfish farms (Figure 1). The finfish farm (FF) site in Tongyeong is the largest extent of net cages (0.015 km2, 40 net cages) and cultures Japanese amberjack (Seriola quinqueradiata) and Korean rockfish (Sebastes schlegelii). The stock density at FF was 31.9–42.8 kg m−2, and the amount of feed varied depending on the stock density of fish (Table 1). The harvest of fish and the input of juvenile fish for culture vary depending on the fish species and market price in South Korea [29]. The growing season in this study area is from April to November, and harvesting was implemented before the December 2018 survey (Table 1).
The oyster farm (OF) has been operating for more than 40 years, and the stock density of oyster (Grassostrea gigas) is 8.7–21.1 kg m−2 in an area of 0.091 km2 (Table 1). Cultivated seeds in the nursery are attached on a long line in May and grow out before harvesting. Harvesting oysters from the long line begins in September and continues until the following April [30,31]. In the study area, oyster harvesting occurred in January 2019 (Table 1). The control sites of FF (FF-C) and OF (OF-C) are selected about 1 km from each farm site to minimize the impact of farm [13]. The geochemical properties and SOD were measured at four sites at FF, OF, and control sites (FF-C and OF-C) in October 2017, May 2018, and December 2018, and the carbon cycle by mass balance and BNFs were measured in May and December 2018.

2.2. Sampling and Handling

Water temperature was measured using a CTD (19 plus, Sea-Bird Scientific, Bellevue, WA, USA). Two sediment samples were conducted by acrylic cores (8 cm i.d.). Two sediment samples for measuring total organic carbon (TOC) and total nitrogen (TN) contents were sectioned at a 0–2-cm interval of sediment and kept at a deep freezer (−20 °C) until the laboratory process.

2.3. In Situ Measurement

We deployed an in situ benthic chamber (BelcII) to estimate the SOD and BNFs using a small winch [13,23,24,32]. The BelcII has an opaque PVC benthic chamber (surface area: 841 cm2, total volume: 19.8 L) and can collect incubated water in a chamber by an autonomous water sampler. The autonomous sampler consisted of 11 disposable syringes (50-mL) that can program the sampling interval time. On the chamber lid, an oxygen sensor (4330F, Aanderaa Data Instruments, Bergen, Norway) was attached to measure the concentration of dissolved oxygen by time in the overlying water of the benthic chamber. As the chamber lid was opened, it was gently installed on the sediment using a whip crane. Two hours later, the chamber lid closed automatically when the sediment resuspension by the chamber deployment was expected to be stabilized. After the chamber lid was closed, the oxygen concentration in the chamber was measured at 10-s intervals, and the data were stored in the controller. Water samples for measuring the BNF were sampled at 1-h intervals during the incubation. After retrieving the benthic chamber on the deck, the water samples for measuring nutrients were filtered immediately using a syringe filter (25CS045AS, ADVENTEC, Tokyo, Japan) and then stored in the freezer −20 °C until further processing in the laboratory.

2.4. Sediment Trap

Two sediment traps consisting of an acrylic cylinder with a diameter of 7 cm, length of 60 cm, and aspect ratio of 8.6 were deployed for more than 24 h at each site. The sediment trap was carefully placed on the upper frame of the benthic chamber by a scuba dive after the benthic chamber was installed onto the sediment [24]. After approximately 2 h, the trap bottles were inserted into the bottom of the sediment trap. The trap bottles were filled with a salt-water solution (more than 50) to preserve the particulate materials and prevent sample wash-out. The sediment traps were collected by a scuba diver before the benthic chamber was retrieved. The overlying saltwater solution was cautiously siphoned off within 3 h, and samples were stored in a refrigerator until processing in the laboratory.

2.5. Laboratory Analysis

The nutrients derived from benthic incubation samples were determined using a nutrient auto-analyzer (QuAAtro 39, SEAL Analytical, Wrexham, UK) [33]. To analyze the contents of TOC and TN (0–2 cm sediment depth), the sediment samples were freeze-dried and milled into a fine powder using an agate pestle and mortar. The ground samples were acidified to remove CaCO3. TOC and TN contents were measured using a CHN analyzer (Flash EA 1112 Thermo Scientific, Waltham, MA, USA). To estimate the vertical carbon flux, two aliquots of samples in the sediment trap were filtered through precombusted GF/F glass microfiber filters (6827-1315, Whatman, Maidstone, UK). The filtered sample was acidified, and its OC content was analyzed according to the same processes for the sediment sample.

2.6. Flux Calculation

The SOD and BNFs at the SWI were calculated as
F = (dc/dt) × (V/A),
where F is the rates of SOD and BNF (mmol m−2 d−1), (dc/dt) is the slope of the best-fitting regression line between concentration (c) and time (t) (mmol L−1 d−1), V is the benthic chamber volume (m3), and A is the benthic chamber area (m2).

2.7. Organic Carbon Budget Calculation

Assuming steady state, the mass balance of OC in sediment is represented as shown in the following equation [34],
OCin = OCox + OCburial,
where OCin is the vertical flux of OC collected by sediment trap, OCox is the total oxidation rate that is calculated using SOD applying to Redfield’s ratio (106/138), and OCburial is the burial flux of OC below the mixed layer (mmol C m−2 d−1), which is estimated by the following equation [35].
OCburial = ωρ (1 − φ) OC,
where ω is the sedimentation rate estimated from excess 210Pb (0.35 ± 0.05–1.01 ± 0.14 cm y−1; [13]), ρ is the sediment density (2.45 g cm−3), φ is the porosity (0.7), and OC is the mean OC content below the mixed layer (>15 cm) and ranged from 8.0 to 12.3 mmol g−1 [13].

3. Results

3.1. Water Column and Sediment Parameters

The physicochemical properties of the bottom water and surface sediment are presented in Table 2. The water depth ranged from 10 m to 19 m. The bottom water temperature varied from 15.0 °C to 19.1 °C and was the highest in October 2017 (18.5–19.1 °C), followed by May 2018 (15.8–16.1 °C) and December 2018 (15.0–15.9 °C). The TOC and TN contents in sediment surface (<2 cm depth) at the FF site were 1.78 ± 0.20–2.11 ± 0.12% and 0.31 ± 0.03–0.40 ± 0.02%, respectively, and were significantly higher than measured at the OF (1.45 ± 0.04–1.99 ± 0.13% for TOC and 0.23 ± 0.02–0.29 ± 0.03% for TN) and each control site (1.01 ± 0.05–1.13 ± 0.08% for TOC and 0.14 ± 0.01–0.15 ± 0.01% for TN) (p < 0.05 one-way ANOVA, IBM SPSS Statistics). Those were higher in October 2017 (2.11 ± 0.12% TOC and 0.40 ± 0.02% TN) during the period for intensive fish culturing than those of May 2018 (1.91 ± 0.10% TOC and 0.35 ± 0.03% TN) and December 2018 (1.78 ± 0.20% TOC and 0.31 ± 0.03% TN) at the FF site (p < 0.05 one-way ANOVA, IBM SPSS Statistics, Table 1 and Table 2). Similar to the FF site, the contents of TOC and TN at the OF site were the highest for the intensive shellfish culturing period just before the harvest in December 2018 (1.99 ± 0.13% TOC and 0.29 ± 0.03% TN), followed by October 2017 (1.46 ± 0.11% TOC and 0.24 ± 0.01% TN) and May 2018 (1.45 ± 0.04% TOC and 0.23 ± 0.02% TN) (p < 0.05 one-way ANOVA, IBM SPSS Statistics, Table 1 and Table 2). The C/N molar ratios varied from 6.2 to 9.4 and had the highest range at each control site (8.4–9.4) followed by the OF site (7.2–8.0) and the FF site (6.2–6.7).

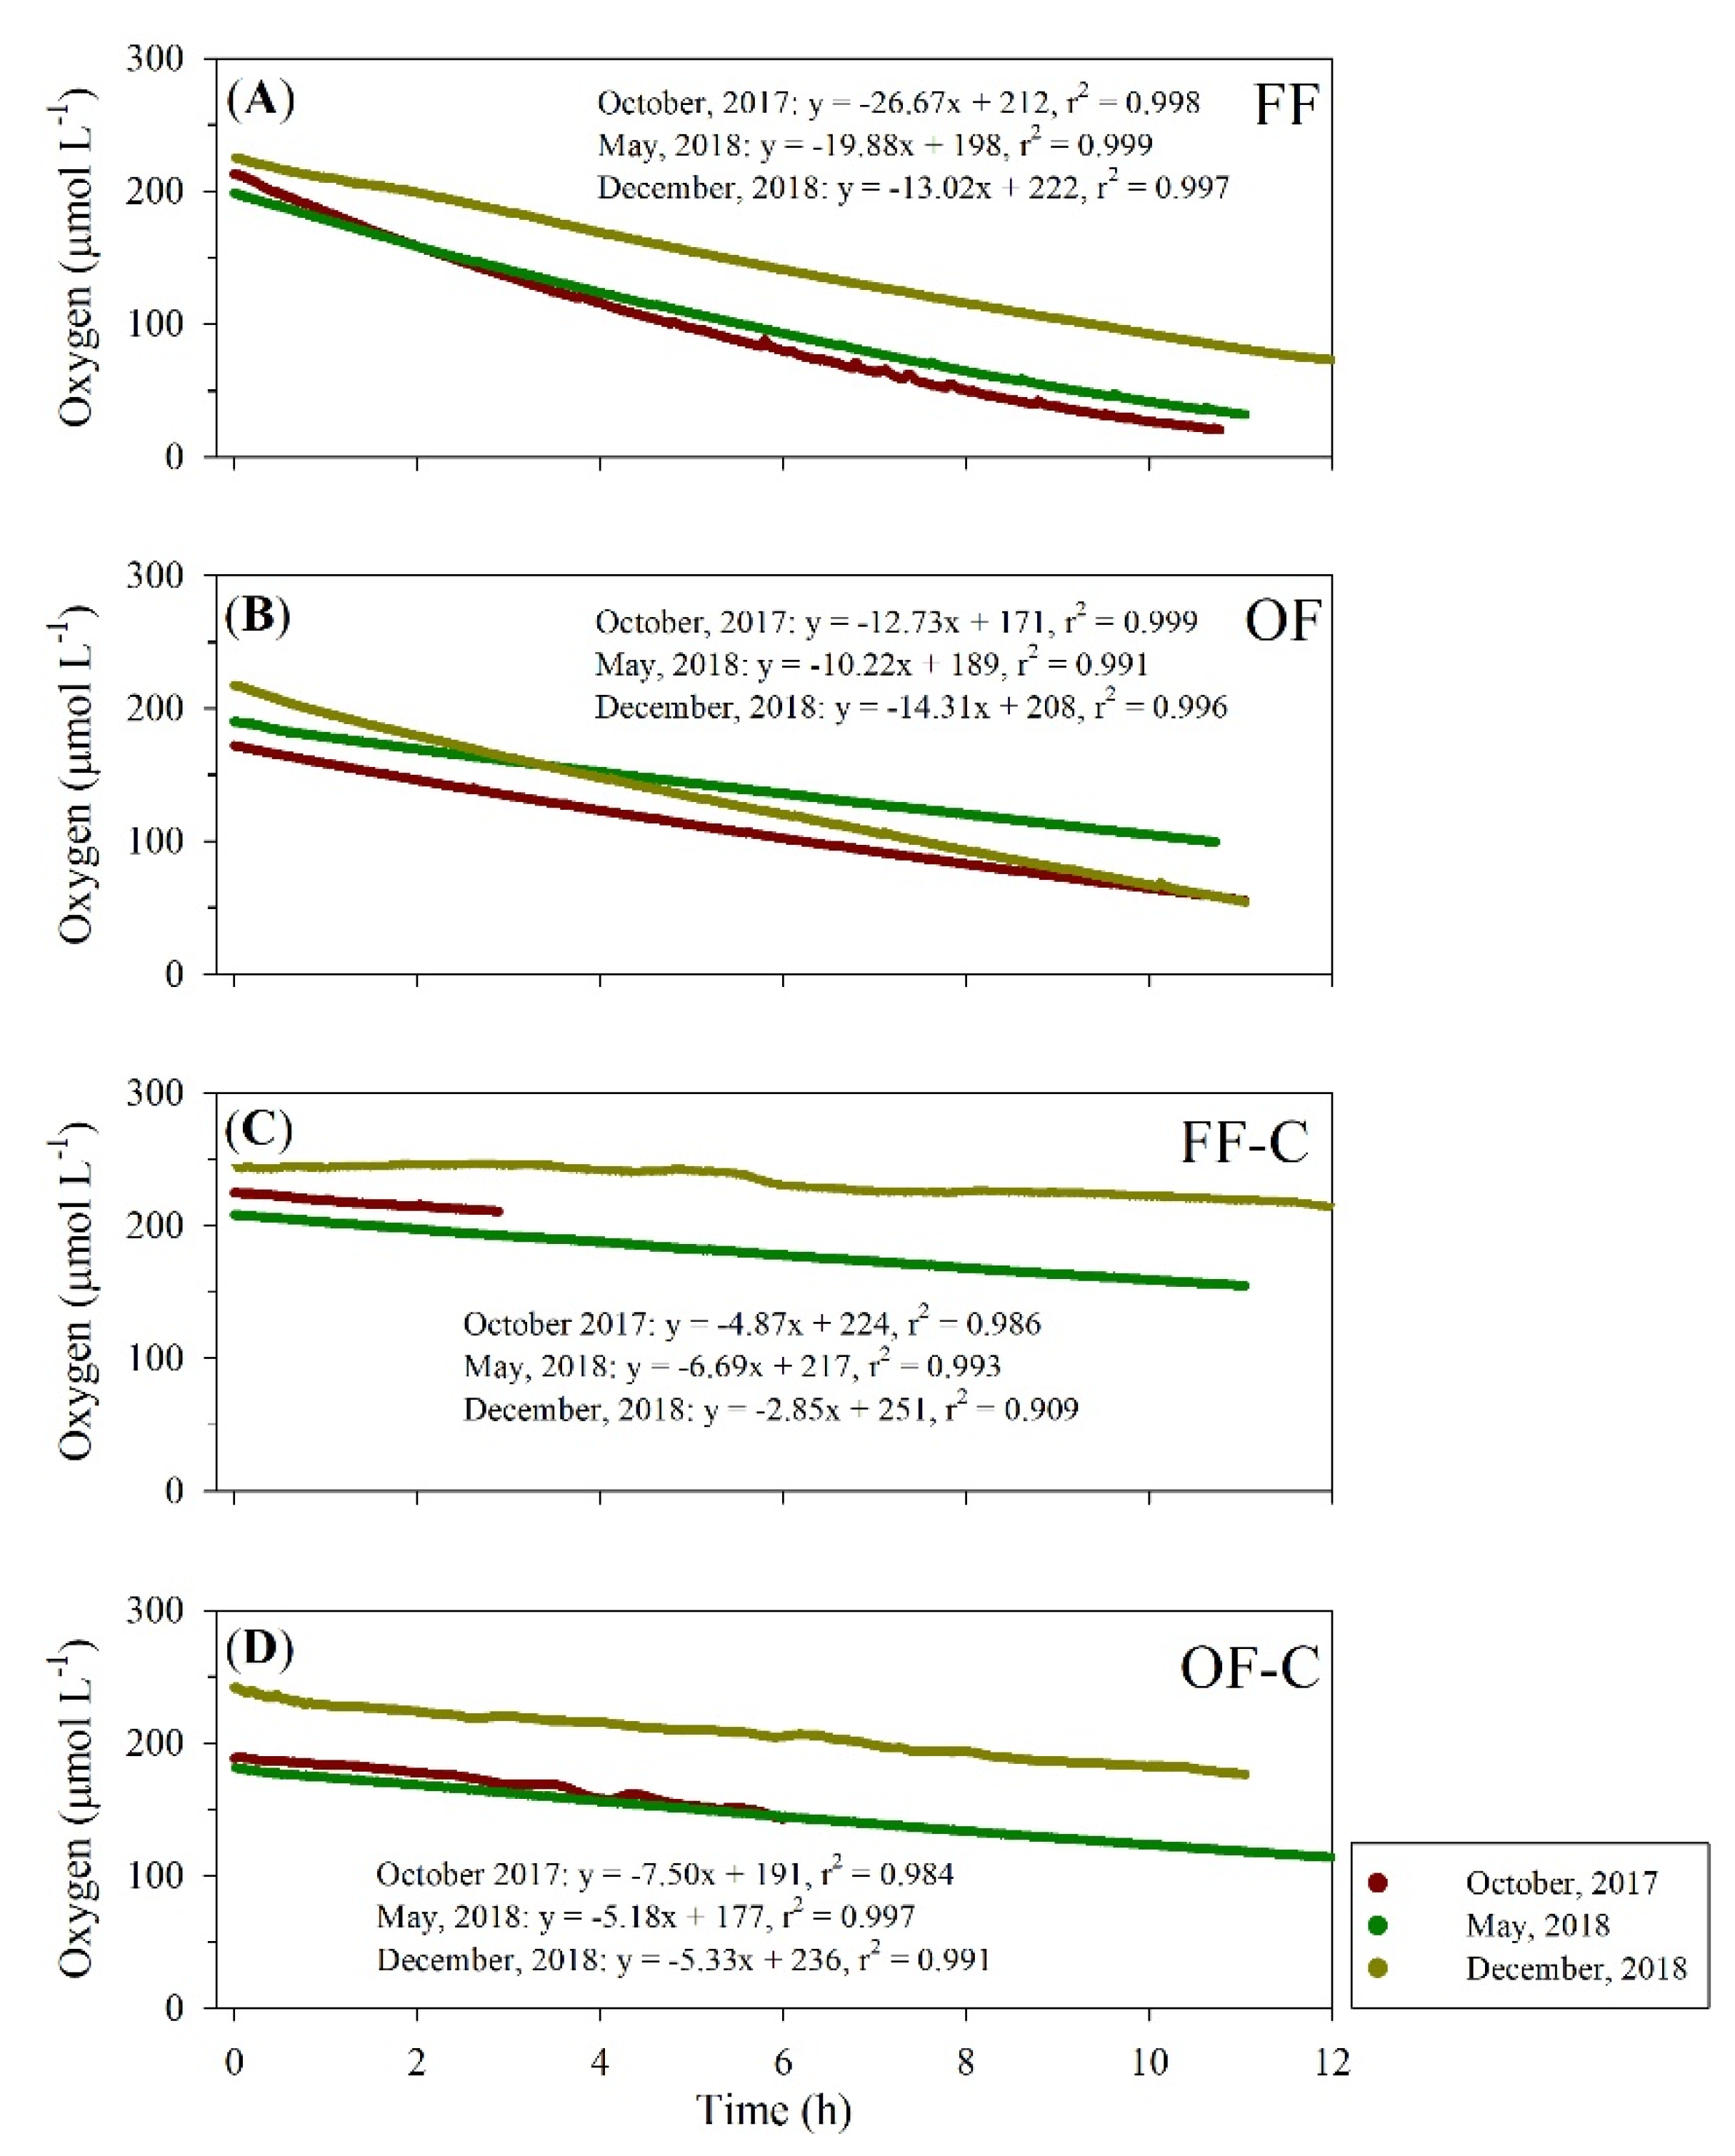
3.2. Sediment Oxygen Demand

The oxygen concentrations in the chamber rapidly decreased over time at all sites, and the slope was significantly steeper at the farm sites (FF and OF) than the control sites (FF-C and OF-C) (p < 0.01, t test, IBM SPSS Statistics, Figure 2). The averaged SOD was significantly higher at the FF site (117 ± 40 mmol m−2 d−1) than at the FF-C site (28 ± 11 mmol m−2 d−1), but it was not statistically different from the OF site (73 ± 12 mmol m−2 d−1) (one-way ANOVA, IBM SPSS Statistics, Figure 3A). The temporal variations of SOD are shown in Figure 3B. The SOD at the FF site was the highest in October 2017 (157 ± 3 mmol m−2 d−1) and decreased by May 2018 (117 ± 2 mmol m−2 d−1) and December 2018 (77 ± 14 mmol m−2 d−1). At the OF site, SOD decreased from 75 ± 5 mmol m−2 d−1 in October 2017 to 60 ± 2 mmol m−2 d−1 in May 2018 and then increased in December 2018 (84 ± 16 mmol m−2 d−1) with the highest value. The SOD at FF-C and OF-C was the highest in May 2018 (39 ± 10 mmol m−2 d−1) and October 2017 (44 ± 4 mmol m−2 d−1), respectively.

3.3. Benthic Nutrient Flux

The concentration of nutrients during the incubation increased over time, except for the concentration of nitrate in October 2018 (Figure 4). The benthic flux of ammonium (NH4+) at the farm site ranged from 5.43 to 9.94 mmol m−2 d−1 and showed its highest value at the OF site in October 2018. At the control site, the ammonium flux was slightly less than 1.98 mmol m−2 d−1. The nitrate (NOx, sum of nitrate and nitrite) flux at the farm and control sites ranged from −0.99 to 1.10 mmol m−2 d−1 and from −0.90 to 0.67 mmol m−2 d−1, respectively. The slope of the nitrate concentration changed with time based on the net denitrification (nitrification-denitrification), and the negative slope may indicate that denitrification and/or anammox are higher than nitrification. The benthic phosphate (PO43−) flux at the FF and OF sites ranged from 0.51 to 1.67 mmol m−2 d−1, more than twice those of the control sites. The silicate (Si(OH)4) flux was by far the highest at the OF site (20.19–24.63 mmol m−2 d−1), followed by the FF (4.76–15.95 mmol m−2 d−1), FF-C (7.32–14.82 mmol m−2 d−1), and OF-C sites (4.75–7.32 mmol m−2 d−1).

4. Discussion

4.1. Sediment Oxygen Demand

The most unfavorable impact of aquaculture is the OM enrichment by excess feed and/or biodeposition, which can enhance benthic respiration [36,37,38,39]. Overall, our results well match the aquaculture effects, which may serve as important control keys for the coastal environment of Korea [12,13,23,25]. Indeed, the TOC contents at the FF and OF sites are similar to the values obtained at other fish and shellfish farms [40,41]. Furthermore, the SODs are comparable to those reported from eutrophic farms [42,43], and those are one order higher than the coastal sediment of the South Sea of Korea [44].
The strong relationship between TOC and SOD represents the OM enrichment on the aquaculture farm sediment and indicates the benthic respiration enhancement by aquaculture activities (Figure 5A). The control sites, oyster farm, and fish farm were grouped with each other with respect to OM loading, which showed significantly different (p < 0.05, ANCOVA, IBM SPSS Statistics). Given that the feed waste (e.g., uneaten feed) at the FF may be an additional OM source to sediment [45,46,47] and the degraded feed waste may contain highly degradable carbohydrates and protein [48,49,50], the deposition of excess OM at the FF sediment can be promoted to SOD and BNFs. Consequently, the high protein proportion in feed can intensify to a low C/N ratio in sediment (Table 2). The raw-fish-based moist pellets are widely used as more than 80% of the total feed for fish because of their low cost ([51]; http://www.nifs.go.kr/fishfeed/, Accessed on 20 May 2021). The pellets can well disperse with high settling velocity, and thus the excess OM has been accumulated within the closed zone with minimal degradation in the water column ([52]; http://www.nifs.go.kr/fishfeed/, Accessed on 20 May 2021). The enhancement of benthic respiration by aquaculture also showed the strong relationships between SOD and food input at FF (Figure 5B).
In contrast to fish, the oyster culture does not need to supply highly nutritious artificial food because the oyster is a filter feeder. Most of the excess OM in the oyster farm would have originated from biodepositions (fecal pellet and bio-debris), which have less protein than raw-fish feed pellets [53,54]. As a result, the C/N ratio (~7) at OF is slightly higher than at FF (~6) but lower than at control sites (>8) (Table 2), and thus the slope of the linear relationship between sediment oxygen demand and stock density is three times lower than that of FF (Figure 5C).

4.2. OC Budget

According to the culture species, the partitioned OC fluxes (OCin, OCox, and OClat) in the farms were temporally varied, i.e., those were highest in May at FF when the stock density and food supply were maximum; whereas those at OF were the highest in December just before harvesting as intensive culturing (Table 1 and Table 3). This result suggests that the aquaculture activities can determine not only the benthic respiration but also the biogeochemical OC cycles in coastal waters (Figure 6).
The strong positive linear relationship between OCin and OCox implies that a significant fraction of deposited OC at the coastal sediment (~50%) is oxidized in the upper sedimentary layer (Figure 7A). The oxidation efficiencies (OCOE = OCox/OCin × 100) at FF and OF were 7–21% lower than control sites, implying that the higher OC supply in the sediment of farms can lead to an anaerobic condition in the sediment and thus OC remineralization proceeds to relatively slow anaerobic decomposition pathways of OC rather than aerobic respiration [15] (Figure 7) (Table 3).
The OCburial at farms (7.3 ± 0.5–9.1 ± 1.3 mmol m−2 d−1) were higher than that at control sites (2.1 ± 0.4–3.7 ± 0.4 mmol m−2 d−1), which account for less than ~ 10% of the OCin into the surface sediment. The burial efficiency of OC, which means the percentage of deposited OC preserved in the sediment, was estimated to range from 5% to 12% with no difference between farms and control sites (Table 3). These results suggest that most of the deposited OC were oxidized in the sediment surface layer and/or lateral transported by resuspension before being buried in the sediment.
The fact that the OCin was higher than the sum of OCox and OCburial implies that the vertical OC flux could be an overestimation or that the lateral transported OC might have been captured into the sediment trap. The sampling artifact of sediment trap in shallow water is well known, but its quantification is not valid in this study [55,56]. Otherwise, the lateral transported OC also can contribute to the vertical flux [57]. For example, OM released from the farm site can be spread out tens or hundreds of meters via the process of deposition and transport. The current speed plays an important role in this process [58,59]. The “sediment resuspension-lateral transport” process can initiate at the bottom current speeds of 20–40 cm s−1 in natural coastal sediment [60]. The current speeds of 10 cm s−1 are high enough to initiate the resuspension of fine texture sediments such as farm sediment, and current speeds greater than 5 cm s−1 are strong enough to keep the suspension of particles in the fish farm sediments [61]. Considering the average current speed is 13.8 cm s−1 in the Tongyeong system [13], the net between OCin and the sum of OCox and OCburial can be simplified as contributions by lateral transports. The fractions of lateral flux to total vertical carbon flux were estimated to range from 27% to 44%, which may be maximum values.

4.3. Benthic Nutrient Fluxes and Benthic–Pelagic Coupling in Aquaculture Sediment

The BNFs at farms were significantly greater than those at control sites and generally represent influx of nutrients to the coastal water (Figure 4). The dissolved inorganic nitrogen (DIN, NH4+ + NOx) and dissolved inorganic phosphate (DIP, PO43−) fluxes (5.45–8.95 mmol DIN m−2 d−1 and 0.51–1.67 mmol DIP m−2 d−1) measured at FF and OF were comparable to or higher than those measured at the shellfish farm, such as at the mussel farm (1.1–8.2 mmol DIN m−2 d−1 and 0.36–1.20 mmol DIP m−2 d−1, [62]) and sea squirt farm (9.0 mmol DIN m−2 d−1 and 0.52 mmol DIP m−2 d−1, [23]). However, the values were lower than those reported from finfish farm sediment that received a large amount of OM, specifically, from the rainbow trout farm (2.7–28.7 mmol DIN m−2 d−1 and 0.16–5.10 mmol DIP m−2 d−1, [36,37]) and the salmon farm (96.8 mmol DIN m−2 d−1, 14.5 mmol DIP m−2 d−1, [63]). The benthic silicate fluxes at OF (20.19–24.63 mmol m−2 d−1) were significantly higher than at other sites. A higher biogenic silicate of sediment and silicate concentration in porewater in the sea squirt farms, and thus the silicate benthic flux was about two times higher than the eutrophic coastal bay [23]. The biogenic silicate in fecal pellets of sea squirt may accumulate into the sediment [64], implying that the feeding activity of filter feeder species may not only redistribute the silicate in coastal water of Korea but also control the phytoplankton community temporally.
The BNFs can potentially trigger stimulating phytoplankton bloom via benthic–pelagic coupling [12,25]. Based on Redfield C:N:P ratio (106:16:1), the DIN and DIP demanded primary production in May and October were 17.5 mmol DIN m−2 d−1 and 1.09 mmol DIP m−2 d−1 and 3.32 mmol DIN m−2 d−1 and 0.21 mmol DIP m−2 d−1, respectively ([12], Table 4). The benthic release of DIN and DIP in May accounted for 37–46% and 52–60% of that demanded primary production, respectively, at FF and OF (Table 4). By contrast, the BNF contributed to more than 150% for both the N and P required for primary production with tight benthic–pelagic coupling in December (Table 4).

5. Conclusions

A combined analysis of in situ SOD and BNFs, sedimentation rate, the sediment trap, and OC contents of sediment in aquaculture farms (fish and oyster) and control sites show the following highlights. The SOD and BNFs at the fish farm were significantly higher than at other sites and may be affected by artificial feed for fish growing. The strong correlation between SOD and stock densities suggests that the excess OM loading around farms may enhance the benthic respiration in coastal. Furthermore, the feeding types (artificial or natural) of cultured species may be important keys to controlling the bio-limiting elements, especially nitrogen in coastal waters over the long term [65]. In addition, most of the OM deposited into sediment was recycled in the upper sediment layer, and the aquaculture of which may intensify the red tide and deoxygenation in the semi-enclosed coastal waters of Korea.

Author Contributions

S.-H.K.: conceptualization, investigation, formal analysis, writing—original draft, writing—review and editing. J.-S.L.: conceptualization, writing—original draft, writing—review and editing supervision. K.-T.K.: formal analysis, writing—review and editing. H.-C.K. and W.-C.L.: resources, funding acquisition. D.C. and S.-H.C.: methodology, funding acquisition. J.-H.C., H.-J.L., and J.-H.S.: Data curation. All authors have read and agreed to the published version of the manuscript.

Funding

This research was funded by the Korea Institute of Ocean Science and Technology (KIOST; PE99912) and was supported by the National Institute of Fisheries Science (NIFS; R2021055).

Institutional Review Board Statement

Not applicable.

Informed Consent Statement

Not applicable.

Data Availability Statement

The data used to support the findings of this study are available from the corresponding author upon request.

Acknowledgments

The authors gratefully acknowledge the financial support from the Korea Institute of Ocean Science and Technology and National Institute of Fisheries Science.

Conflicts of Interest

The authors declare no conflict of interest.

References

  1. FAO. Fishery and Aquaculture Statistics. Global Aquaculture and Capture Production: 1950–2017 (FishstatJ); FAO Fisheries and Aquaculture Department: Rome, Italy, 2019. [Google Scholar]
  2. Costello, C.; Cao, L.; Gelcish, S.; Cisneros-Mata, M.Á.; Free, C.M.; Froehlich, H.E.; Golden, C.D.; Ishimura, G.; Maier, J.; Macadam-Domer, I.; et al. The future of food from the sea. Nature 2020, 588, 95–100. [Google Scholar] [CrossRef]
  3. FAO. The State of World Fisheries and Aquaculture; Food and Agriculture Organization of the United Nations: Rome, Italy, 2020. [Google Scholar]
  4. FAO. The State of World Fisheries and Aquaculture; Food and Agriculture Organization of the United Nations: Rome, Italy, 2016. [Google Scholar]
  5. KOSIS. Korean Statistical Information Service. 2019. Available online: http://kosis.kr/eng/ (accessed on 20 May 2021).
  6. Islam, M.S. Nitrogen and phosphorus budget in coastal and marine cage aquaculture and impacts of effluent loading on ecosystem: Review and analysis towards model development. Mar. Pollut. Bull. 2005, 50, 48–61. [Google Scholar] [CrossRef] [PubMed]
  7. Sarà, G.; Martire, M.L.; Sanfilippo, M.; Pulicanò, G.; Cortese, G.; Mazzola, A.; Pusceddu, A. Impacts of marine aquaculture at large spatial scales: Evidences from N and P catchment loading and phytoplankton biomass. Mar. Environ. Res. 2011, 71, 317–324. [Google Scholar] [CrossRef] [PubMed] [Green Version]
  8. Lee, Y.G.; Jeong, D.U.; Lee, J.S.; Choi, Y.H.; Lee, M.O. Effects of hypoxia caused by mussel farming on benthic foraminifera in semi-closed Gamak Bay, South Korea. Mar. Pollut. Bull. 2016, 109, 566–581. [Google Scholar] [CrossRef]
  9. Wu, R.S.S. The environmental impacts of marine fish culture: Towards a sustainable future. Mar. Pollut. Bull. 1995, 31, 159–166. [Google Scholar] [CrossRef]
  10. Zúñiga, D.; Castro, C.G.; Aguiar, E.; Labarta, U.; Figueiras, F.G.; Fernández-Reiriz, M.J. Biodeposit contribution to natural sedimentation in a suspended Mytilus galloprovincialis Lmk mussel farm in a Galician Ría (NW Iberian Peninsula). Aquaculture 2014, 432, 311–320. [Google Scholar] [CrossRef] [Green Version]
  11. Liao, Y.; Shou, L.; Jiang, Z.; Tang, Y.; Du, P.; Zeng, J.; Chen, Q.; Yan, X.; Chen, J. Effects of fish cage culture and suspended oyster culture on microbenthic communities in Xiangshan Bay, A semi-enclosed subtropical bay in eastern China. Mar. Pollut. Bull. 2019, 142, 475–483. [Google Scholar] [CrossRef] [PubMed]
  12. Lee, J.S.; Kim, Y.-T.; Shin, K.-H.; Hyun, J.-H.; Kim, S.-Y. Benthic nutrient fluxes at longline sea squirt and oyster aquaculture farms and their role in coastal systems. Aquacult. Int. 2011, 19, 931–944. [Google Scholar] [CrossRef]
  13. Kim, S.-H.; Kim, H.C.; Choi, S.-H.; Lee, W.-C.; Jung, R.-H.; Hyun, J.-H.; Kim, S.H.; Lee, J.S. Benthic respiration and nutrient release associated with net cage fish and longline oyster aquaculture in the Geoje-Tongyeong coastal waters in Korea. Estuar. Coasts 2020, 43, 589–601. [Google Scholar] [CrossRef]
  14. Canfield, D.E.; Kristensen, E.; Thamdrup, B. Aquatic geomicrobiology. In Advances in Marine Biology; Southward, A.J., Tyler, P.A., Young, C.M., Fuiman, L.A., Eds.; Elsevier: Amsterdam, The Netherlands, 2005; Volume 48, pp. 65–166. [Google Scholar]
  15. Canfield, D.E.; Thamdrup, B.; Hansen, J.W. The anaerobic degradation of organic matter in Danish coastal sediments: Iron reduction, manganese reduction, and sulfate reduction. Geochim. Cosmochim. Acta 1993, 57, 3867–3883. [Google Scholar] [CrossRef]
  16. Glud, R.N. Oxygen dynamics of marine sediments. Mar. Biol. Res. 2008, 4, 243–289. [Google Scholar] [CrossRef]
  17. Berner, R.A. Early Diagenesis: A Theoretical Approach; Princeton University Press: Princeton, NY, USA, 1980. [Google Scholar]
  18. Leithold, E.L.; Blair, N.E.; Wegmann, K.W. Source-to-sink sedimentary systems and global carbon burial: A river runs through it. Earth-Sci. Rev. 2016, 153, 30–42. [Google Scholar] [CrossRef]
  19. Hedges, J.I.; Keil, R.G.; Benner, R. What happens to terrestrial organic matter in the ocean? Org. Geochem. 1997, 27, 195–212. [Google Scholar] [CrossRef]
  20. Burdige, D.J. Preservation of organic matter in marine sediments: Controls, mechanisms, and an imbalance in sediment organic carbon budgets? Chem. Rev. 2007, 107, 467–485. [Google Scholar] [CrossRef] [PubMed]
  21. Lacoste, E.; Gaertner-Mazouni, N. Nutrient regeneration in the water column and at the sediment-water interface in pearl oyster culture (Pinctada margaritifera) in a deep atoll lagoon (Ahe, French Polynesia). Estuar. Coast. Shelf Sci. 2016, 182, 304–309. [Google Scholar] [CrossRef]
  22. Kim, S.-H.; Lee, J.S.; Hyun, J.-H. Extremely high sulfate reduction, sediment oxygen demand and benthic nutrient flux associated with a large-scale artificial dyke and its implication to benthic-pelagic coupling in the Yeongsan River estuary, Yellow Sea. Mar. Pollut. Bull. 2017, 120, 126–135. [Google Scholar] [CrossRef]
  23. Lee, J.S.; Kim, S.-H.; Kim, Y.-T.; Hong, S.J.; Han, J.H.; Hyun, J.-H.; Shin, K.-H. Influence of sea squirt (Halocynthia roretzi) aquaculture on benthic-pelagic coupling in coastal waters: A study of the South Sea in Korea. Estuar. Coast. Shelf Sci. 2012, 99, 10–20. [Google Scholar] [CrossRef]
  24. Lee, J.S.; Kim, K.H.; Shim, J.; Han, J.H.; Choi, Y.H.; Khang, B.-J. Massive sedimentation of fine sediment with organic matter and enhanced benthic-pelagic coupling by an artificial dyke in semi-enclosed Chonsu Bay, Korea. Mar. Pollut. Bull. 2012, 64, 153–163. [Google Scholar] [CrossRef]
  25. Hyun, J.-H.; Kim, S.-H.; Mok, J.-S.; Lee, J.S.; An, S.-U.; Lee, W.-C. Impacts of long-line aquaculture of Pacific oyster (Crassostea gigas) on sulfate reduction and diffusive nutrient flux in the coastal sediments of Jinhae-Tongyeong, Korea. Mar. Pollut. Bull. 2013, 74, 187–198. [Google Scholar] [CrossRef]
  26. Choi, A.; Kim, B.; Mok, J.-S.; Yoo, J.; Kim, J.B.; Lee, W.-C.; Hyun, S.-H. Impact of finfish aquaculture on biogeochemical processes in coastal ecosystems and elemental sulfur as a relevant proxy for assessing farming condition. Mar. Pollut. Bull. 2020, 150, 110635. [Google Scholar] [CrossRef]
  27. Chauvaud, L.; Jean, F.; Ragueneau, O.; Thouzeau, G. Long-term variation of the bay of Brest ecosystem: Benthic-pelagic coupling revisited. Mar. Ecol. Prog. Ser. 2000, 200, 35–48. [Google Scholar] [CrossRef]
  28. Vahtera, E.; Conley, D.J.; Gustafsson, B.G.; Kuosa, H.; Pitkänen, H.; Savchuk, O.P.; Tamminen, T.; Viitasalo, M.; Voss, M.; Wasmund, N.; et al. Internal ecosystem feedbacks enhance nitrogen-fixing cyanobacteria blooms and complicate management in the Baltic Sea. Ambio 2007, 36, 186–194. [Google Scholar] [CrossRef]
  29. Hwang, J.-W.; Kim, D.-H. An economic feasibility comparison of the extruded pellets and moist pellet on the Oliver flounder culture farm. J. Fish. Bus. Adm. 2009, 40, 189–205. [Google Scholar]
  30. Kang, C.-K.; Park, M.S.; Lee, P.-Y.; Choi, W.-J.; Lee, W.-C. Seasonal variations in condition, reproductive activity, and biochemical composition of the pacific oyster, Grassostrea gigas (Thunberg), in suspended culture in two coastal bays of Korea. J. Shellfish Res. 2000, 19, 771–778. [Google Scholar]
  31. Choi, K.S. Oyster Capture-Based Aquaculture in the Republic of Korea; In Capture-Based Aquaculture. Global Overview; Lovatelli, A., Holthus, P.F., Eds.; FAO Fisheries Technical Paper. No. 508; FAO: Rome, Italy, 2008; pp. 271–286. [Google Scholar]
  32. Kim, S.-H.; Lee, J.S.; Kim, K.T.; Kim, S.-L.; Yu, O.W.; Lim, D.; Kim, S.H. Low benthic mineralization and nutrient fluxes in the continental shelf sediment of the northern East China Sea. J. Sea Res. 2020, 164, 101934. [Google Scholar] [CrossRef]
  33. Hansen, H.P.; Koroleff, F. Methods of Seawater Analysis; Grasshoff, K., Kremling, K., Ehrhardt, M., Eds.; Wiley-VCH: Weinhein, Germany, 1999; pp. 159–228. [Google Scholar]
  34. Martens, C.S.; Klump, J.V. Biogeochemical cycling in an organic-rich coastal margin basin 4. An organic carbon budget for sediments dominated by sulfate reduction and methanogenesis. Geochim. Cosmochim. Acta 1984, 48, 1987–2004. [Google Scholar] [CrossRef]
  35. Hedge, J.I.; Keil, R.G. Sedimentary organic matter preservation: An assessment and speculative synthesis. Mar. Chem. 1995, 49, 81–115. [Google Scholar] [CrossRef]
  36. Holby, O.; Hall, P.O.J. Chemical fluxes and mass balances in a marine fish cage farm. II. Phosphorus. Mar. Ecol. Prog. Ser. 1991, 70, 263–272. [Google Scholar] [CrossRef]
  37. Hall, P.O.J.; Holby, O.; Kollberg, S.; Samuelsson, M.-O. Chemical fluxes and mass balance in a marine fish farm cage farm. IV. Nitrogen. Mar. Ecol. Prog. Ser. 1992, 89, 81–91. [Google Scholar] [CrossRef]
  38. Holmer, M.; Kristensen, E. Impact of marine fish cage farming on metabolism and sulfate reduction of underlying sediments. Mar. Ecol. Prog. Ser. 1992, 80, 191–201. [Google Scholar] [CrossRef]
  39. Wu, R.S.S.; Lam, K.S.; Mackay, D.W.; Lau, T.C.; Yam, V. Impacts of marine fish farming on water quality and bottom sediment: A case study in the subtropical environment. Mar. Environ. Res. 1994, 38, 115–145. [Google Scholar] [CrossRef]
  40. Holmer, M.; Duarte, C.M.; Heliskov, A.; Olesen, B.; Terrados, J. Biogeochemical conditions in sediments enriched by organic matter from net-pen fish farms in the Bolinao area, Philippines. Mar. Pollut. Bull. 2003, 46, 1470–1479. [Google Scholar] [CrossRef]
  41. Carlsson, M.S.; Enhström, P.; Lindahl, O.; Ljungqvist, L.; Petersen, J.K.; Svanberg, L.; Holmer, M. Effects of mussel farms on the benthic nitrogen cycle on the Swedish west coast. Aquac. Environ. Interact. 2012, 2, 177–191. [Google Scholar] [CrossRef] [Green Version]
  42. Holmer, M.; Marbá, N.; Terrados, J.; Duarte, C.M.; Fortes, M.D. Impacts of milkfish (Chanos chanos) aquaculture on carbon and nutrient fluxes in the Bolinao area, Philippines. Mar. Pollut. Bull. 2002, 44, 685–696. [Google Scholar] [CrossRef] [Green Version]
  43. Sweetman, A.K.; Norling, K.; Gunderstad, C.; Haugland, B.T.; Dale, T. Benthic ecosystem functioning beneath fish farms in different hydrodynamic environments. Limnol. Oceanogr. 2014, 59, 1139–1151. [Google Scholar] [CrossRef]
  44. Lee, J.S.; Kim, S.; Kim, S.-S.; An, S.; Kim, Y.-T.; Choi, O.-I. Sediment Oxygen Consumption in Semi-Closed Korean Coastal Bays during Summer. Ocean Sci. J. 2009, 44, 161–171. [Google Scholar] [CrossRef]
  45. Hargrave, B.T.; Duplisea, D.E.; Pfeiffer, E.; Wildish, D.J. Seasonal changes in benthic fluxes of dissolved oxygen and ammonium associated with marine cultured Atlantic salmon. Mar. Ecol. Prog. Ser. 1993, 96, 249–257. [Google Scholar] [CrossRef]
  46. Holmer, M.; Marba, N.; Diaz-Almela, E.; Duarte, C.M.; Tsapakis, M.; Danovaro, R. Sedimentation of organic matter from fish farms in oligotrophic Mediterranean assessed through bulk and stable isotope (13C and 15N) analyses. Aquaculture 2007, 262, 268–280. [Google Scholar] [CrossRef] [Green Version]
  47. Papageorgiou, N.; Kalantzi, I.; Karakassis, I. Effects of fish farming on the biological and geochemical properties of muddy and sandy sediments in the Mediterranean Sea. Mar. Environ. Res. 2010, 69, 326–336. [Google Scholar] [CrossRef]
  48. Azim, M.E.; Little, D.C.; Bron, J.E. Microbial protein production in activated suspension tanks manipulating C:N ratio in feed and the implications for fish culture. Bioresour. Technol. 2008, 99, 3590–3599. [Google Scholar] [CrossRef]
  49. Lefebvre, S.; Barillé, L.; Clerc, M. Pacific oyster (Crassostrea gigas) feeding responses to a fish-farm effluent. Aquaculture 2000, 187, 185–198. [Google Scholar] [CrossRef]
  50. Lee, S.-M.; Kim, K.-D. Effects of dietary carbohydrate to lipid ratios on growth and body composition of juvenile and grower rockfish, Sebastes schlegeli. Aquacult. Res. 2009, 40, 1830–1837. [Google Scholar] [CrossRef]
  51. Cho, S.H.; Lee, S.-M.; Lee, J.H. Effects of the extruded pellets and raw fish-based moist pellet on growth and body composition of flounder, Paralichthys olivaceus L. for 10 months. J. Aquacult. 2005, 18, 60–65. [Google Scholar]
  52. Kwon, J.N.; Jung, R.H.; Kang, Y.S.; An, K.H.; Lee, W.C. Environmental management of marine cage fish farms using numerical modelling. Sea 2005, 4, 181–195. [Google Scholar]
  53. Jaramillo, E.; Bertrán, C.; Bravo, A. Mussel biodeposition in an estuary in southern Chile. Mar. Ecol. Prog. Ser. 1992, 82, 85–94. [Google Scholar] [CrossRef]
  54. Wang, X.; Andersen, K.; Handå, A.; Jensen, B.; Reitan, K.I.; Olsen, Y. Chemical composition and release rate of waste discharge from an Atlantic salmon farm with an evaluation of IMTA feasibility. Aquacult. Environ. Interact. 2013, 4, 147–162. [Google Scholar] [CrossRef] [Green Version]
  55. Bale, A.J. Sediment trap performance in tidal waters: Comparison of cylindrical and conical collectors. Cont. Shelf Res. 1998, 18, 1401–1418. [Google Scholar] [CrossRef]
  56. Wang, A.-J.; Liu, J.T.; Ye, X.; Zheng, B.-X.; Li, Y.-H.; Chen, J. Settling fluxes of cohesive sediments measured by sediment traps in a semi-enclosed embayment with strong dial environment. Cont. Shelf Res. 2015, 106, 17–26. [Google Scholar] [CrossRef]
  57. Hatcher, A.; Grant, J.; Schofield, B. Effects of suspended mussel culture (Mytilus spp.) on sedimentation, benthic respiration and sediment nutrient dynamics in a coastal bay. Mar. Ecol. Prog. Ser. 1994, 115, 219–235. [Google Scholar] [CrossRef]
  58. Kutti, T.; Ervik, A.; Hansen, P.K. Effects of organic effluents from a salmon farm on a fjord system. I. Vertical export and disposal processes. Aquaculture 2007, 262, 367–381. [Google Scholar] [CrossRef]
  59. Sarà, G.; Scilipoti, D.; Mazzola, A.; Modica, A. Effects of fish farming waste to sedimentary and particulate organic matter in a southern Mediterranean area (Gulf of Castellammare, Sicily): A multiple stable isotope study (δ13C and δ15N). Aquaculture 2004, 234, 199–213. [Google Scholar] [CrossRef]
  60. Tengberg, A.; Almroth, E.; Hall, P. Resuspension and its effects on organic carbon recycling and nutrient exchange in coastal sediments: In situ measurements using new experimental technology. J. Exp. Mar. Biol. Ecol. 2003, 285–286, 119–142. [Google Scholar] [CrossRef]
  61. Cromey, C.J.; Nickell, T.D.; Black, K.D.; Provost, P.G.; Griffiths, C.R. Validation of a fish farm waste resuspension model by use of a particulate tracer discharged from a point source in a coastal environment. Estuaries 2002, 25, 916–929. [Google Scholar] [CrossRef]
  62. Richard, M.; Archambault, P.; Thouzeau, G.; Mckindsey, C.W.; Desrosiers, G. 2007. Influence of suspended scallop cages and mussel lines on pelagic and benthic biogeochemical fluxes in Havre-aux Maisons Lagoon, ÎIes-de-la-Madeleine (Quebec, Canada). Can J. Fish. Aquat. Sci. 2007, 63, 1198–1213. [Google Scholar] [CrossRef]
  63. Nickell, L.A.; Black, K.D.; Hughes, D.J.; Overnell, J.; Brand, T.; Nickell, T.D.; Breuer, E.; Harvey, S.M. Bioturbation sediment fluxes and benthic community structure around a salmon cage farm in Loch Creran, Scotland. J. Exp. Mar. Biol. Ecol. 2003, 285–286, 221–233. [Google Scholar] [CrossRef]
  64. Ragueneau, O.; Chauvaud, L.; Moriceau, B.; Leynaert, A.; Thouzeau, G.; Dinval, A.; Le Loc’h, F.; Jean, F. Biodeposition by an invasive suspension feeder impacts the biogeochemical cycle of Si in a coastal ecosystem (Bay of Brest, France). Biogeochemistry 2005, 75, 19–41. [Google Scholar] [CrossRef]
  65. Howarth, R.W.; Roxanne, M. Nitrogen as the limiting nutrient for eutrophication in coastal marine ecosystems: Evolving views over three decades. Limnol. Oceanogr. 2006, 51, 364–376. [Google Scholar] [CrossRef] [Green Version]
Figure 1. Sampling sites in the Geoje–Tongyeong system in the South Sea of Korea. Boxes show arrangements of net cage fish and long line oyster farm.
Jmse 09 00554 g001
Figure 2. Evolution of oxygen concentrations with time in the benthic chamber at (A) the fish farm (FF), (B) oyster farm (OF), and (C,D) control sites (FF-C, OF-C).
Jmse 09 00554 g002
Figure 3. Averaged sediment oxygen demand (SOD) (A), and temporal variations of sediment oxygen demand (B) at fish farm (FF), oyster farm (OF), and control sites (FF-C, OF-C). Vertical bars indicate standard errors.
Jmse 09 00554 g003
Figure 4. Evolution of nutrients concentrations with time in the benthic chamber at fish farm (FF), oyster farm (OF), and control sites (FF-C, OF-C).
Jmse 09 00554 g004
Figure 5. Linear relationships of (A) total organic carbon (TOC) contents, (B) food input, and (C) stock density with sediment oxygen demand (SOD). The dash and solid lines represent the regression lines of individual farms and total farms, respectively.
Jmse 09 00554 g005
Figure 6. Simple mass budgets of (A,B) organic carbon at fish farm (FF), (C,D) oyster farm (OF) and (E,F) control sites (FF-C, OF-C).
Jmse 09 00554 g006
Figure 7. The positive linear relationship between vertical flux of organic carbon (OCin) and carbon oxidation (OCox) implies that about 50% of total supple organic carbon is oxidized in the upper sedimentary layer (A). The negative linear relationships between vertical flux of organic carbon (OCin) and oxidation efficiencies (OCOE) suggests that higher loading of organic carbon may intensify the anoxic condition in sediment and organic carbon oxidation processes may follow the slow anoxic degradation pathways (B).
Jmse 09 00554 g007
Table 1. Description of study sites, the density of culturing fish and oyster, and supply of fish feed in fish farm.
SitesProduction CycleDateOperating Period
(Years)
Area
(km2)
Stock Density 1
(kg m−2)
Fish Feed Supply 1
(kg m−2 d−1)
FFIntensive fish culturingOctober 2017>300.01542.81.3
Intensive fish culturingMay 2018 40.71.1
After harvesting and stockingDecember 2018 31.90.8
OFIntensive shellfish culturingOctober 2017>400.09116.5n/a
Stocking and shellfish culturingMay 2018 8.7n/a
Intensive shellfish culturing before harvestingDecember 2018 21.1n/a
1 Data from http://kostat.go.kr/portal/eng/index.action. Accessed on 20 May 2021. n/a = not applicable.
Table 2. Depth, bottom water temperature, and the contents of total organic carbon (TOC) and total nitrogen (TN), and molar ratio of carbon to nitrogen (C/N) in the surficial sediment (0–2 cm).
SeasonSitesWater ColumnSediment
DepthTemp.TOCTNC/N
(m)(°C)(%, dry wt)(mol/mol)
October 2017FF1919.12.11 ± 0.120.40 ± 0.026.2
OF1118.81.46 ± 0.110.24 ± 0.017.2
FF-C1618.71.01 ± 0.050.14 ± 0.018.4
OF-C1018.51.13 ± 0.080.15 ± 0.018.9
May 2018FF1916.11.91 ± 0.100.35 ± 0.036.4
OF1115.81.45 ± 0.040.23 ± 0.027.5
FF-C1615.91.12 ± 0.020.14 ± 0.029.1
OF-C1015.81.02 ± 0.120.14 ± 0.018.5
December 2018FF1915.91.78 ± 0.200.31 ± 0.036.7
OF1115.31.99 ± 0.130.29 ± 0.038.0
FF-C1615.81.11 ± 0.080.14 ± 0.029.3
OF-C1015.01.13 ± 0.070.14 ± 0.019.4
Values represent average ± 1 SD (n = 2).
Table 3. Results of partitioned organic carbon (OC) fluxes at fish farm (FF), oyster farm (OF), and control sites (FF-C, OF-C).
SeasonSitesVertical OC Flux 1
(OCin)
OC Oxidation Rate 2 (OCox)Lateral Flux 3
(OClat)
Burial Flux 4
(OCburial)
Oxidation Efficiency 5Burial Efficiency 6
(mmol C m−2 d−1)(%)
May 2018FF154 ± 2490 ± 155 ± 249.1 ± 1.3586
OF73 ± 646 ± 120 ± 67.3 ± 0.56310
FF-C39 ± 530 ± 87 ± 92.1 ± 0.4775
OF-C33 ± 223 ± 36 ± 43.7 ± 0.47011
December 2018FF112 ± 1359 ± 1144 ± 20-538
OF129 ± 565 ± 1257 ± 13-506
FF-C18 ± 213 ± 33 ± 4-7212
OF-C34 ± 424 ± 56 ± 6-7111
1 OCin estimated using sediment trap data. 2 Redfield ratio was used to convert carbon: C:O2 = 106:138. 3 OClat = OCin − OCox − OCburial. 4 OCburial = wρ(1 − φ)Corg. 5 Oxidation efficiency (OCOE) = OCox/OCin  × 100%. 6 Burial efficiency (OCBE) = OCburial/OCin × 100%. Values represent average ±1 SD (n = 2).
Table 4. Nutrient demand for primary production (PP) in the water column, benthic nutrient fluxes, and contribution of benthic nutrient fluxes to primary production at FF, OF, FF-C, and OF-C in May and December 2018.
SeasonSitesNutrient Demand for PP 1Benthic Nutrient FluxContribution of BNFs to PP
(mmol m−2 d−1)(mmol m−2 d−1)(%)
DIN 2DIPDIN 2DIPDIN 2DIP
MayFF17.51.098.070.654660
OF 6.530.573752
FF-C 2.640.361533
OF-C n.d.n.d.n.d.n.d.
DecemberFF3.320.215.451.67164804
OF 8.950.51270243
FF-C −0.750.08n.d.40
OF-C 0.78n.d.23n.d.
1 Calculated from the PP data using Redfield’s ratio of C:N:P = 106:16:1. 2 DIN is sum of benthic ammonium flux and benthic nitrate flux. n.d. = not detected.
Publisher’s Note: MDPI stays neutral with regard to jurisdictional claims in published maps and institutional affiliations.

