2. Research Methods
Let us consider an approach to studying the spectra of elevations and slopes of the sea surface.
Rough sea surface is a random field of elevations (wave applicates):
where
is the rectangular Cartesian coordinate system, in which the plane
coincides with the level of a calm (no waves) water surface, and
is the time.
Fixing (1) at
, we obtain a two-dimensional random function:
when studying surface waves using optical images, two-dimensional fields of signal are recorded corresponding to a fixed moment in time. Therefore, in this work, we will consider the representation of waves in the form (2).
Optical images of the sea surface are formed as a result of reflection and refraction of light according to the laws of geometric optics, as will be discussed below. Therefore, when analyzing the structure of the sea surface, along with the field of elevations
, it is convenient to characterize the fields of slopes (or gradients) along the axes [
9]:
The field of slopes (gradients) of the sea surface in an arbitrary direction
, taking into account (3), can be expressed by the following equation:
Taking into account the properties of the Fourier transform, it is possible to relate the power spectrum
of the slope field (4) with the elevation field spectrum
This relationship (5) can be used to retrieve the elevation spectrum
if the slope spectrum is measured experimentally, for example, from data extracted from an aerospace image:
However, Equation (6) restores the spectrum of elevations not for all values
, since for:
the denominator goes to zero. Therefore, in the vicinity of the line (7) in the spectrum of slopes, there is a lack of information on the spectrum of elevations of the sea surface. For complete retrieval of two-dimensional wave spectra
from optical images, a multi-position method is used [
13,
14].
The method is based on the use of M (M ≥ 2) fragments separated within a large image, or using several images that differ in shooting conditions. From M fragments, slope spectra corresponding to different directions of the gradient can be retrieved.
With the spatial stationarity (ergodicity) of waves, the selected fragments correspond to the same spectrum of sea surface elevations
, which makes it possible to create a system of M equations:
From this system, one can determine the desired two-dimensional wave spectrum [
13,
14]:
Thus, to retrieve a two-dimensional spectrum of sea surface elevations, it is necessary to have slope spectra for two or more directions.
The required set of slope spectra can be obtained in various ways:
Stereo imaging, when images from two (or more) cameras with different viewing directions of the surface are simultaneously recorded;
Processing of several fragments of images obtained during aerial photography with a wide shooting angle, on the assumption of spatial stationarity (some kind of ergodicity) of waves within the surface area captured by the camera’s field of view;
Processing of multi-temporal surveys of the same area of the surface from different angles using the assumption of the stationarity of waves.
When processing a one-shot satellite image, none of the listed sets of conditions are realized. Therefore, the retrieval of the two-dimensional spectrum of sea surface elevations is possible only outside the angular zone in the vicinity of the straight line defined by the condition (7).
In order to obtain the spectra of the slopes of the sea surface, retrieving operators
should be used, which make it possible to switch from the spectrum
of a fragment of the optical image to the spectrum of slopes
:
In the early works devoted to this problem, a simple representation of the retrieving operator was based on the concept of a linear relationship between the surface slopes and the brightness recorded in the pixels of the images [
15,
16,
17]. The concept of linear modulation of the brightness field by the slopes of the sea surface makes it possible to obtain a retrieving operator that does not depend on the wave vector:
.
In reality, the modulation of brightness by slopes can be significantly nonlinear, especially in the presence of sun glare.
From a physical point of view, the most important point is the distortion of the power exponent (slope) of the spectrum. Numerical estimates of such distortions were obtained in [
14,
18]. The adequacy of the proposed method for retrieving wave spectra from the spectra of optical images, which takes into account the nonlinear modulation of the recorded brightness field by the slopes of the rough sea surface [
13,
14], was first experimentally confirmed by experiments on an oceanographic platform near the village of Katsiveli (Black Sea) [
19] and confirmed in subsequent works as applied to satellite images of high spatial resolution [
9,
10,
11]. The adaptation of the method to the conditions of analysis of vast ocean areas from space images was carried out using the results of sea truth buoy measurements [
20].
When constructing operators that retrieve the spectra of the sea surface slopes, it is necessary to take into account all the known physical mechanisms of non-linear distortions of the sea surface slope spectra [
13,
18,
21,
22,
23,
24]. Since it is difficult to use the relation between slope fields, sea surface brightness fields and their spectra for analytic solution of the problem, it is reasonable to conduct direct numerical modeling of the sea surface images and the calculation of the resulting distortions of the wave spectra.
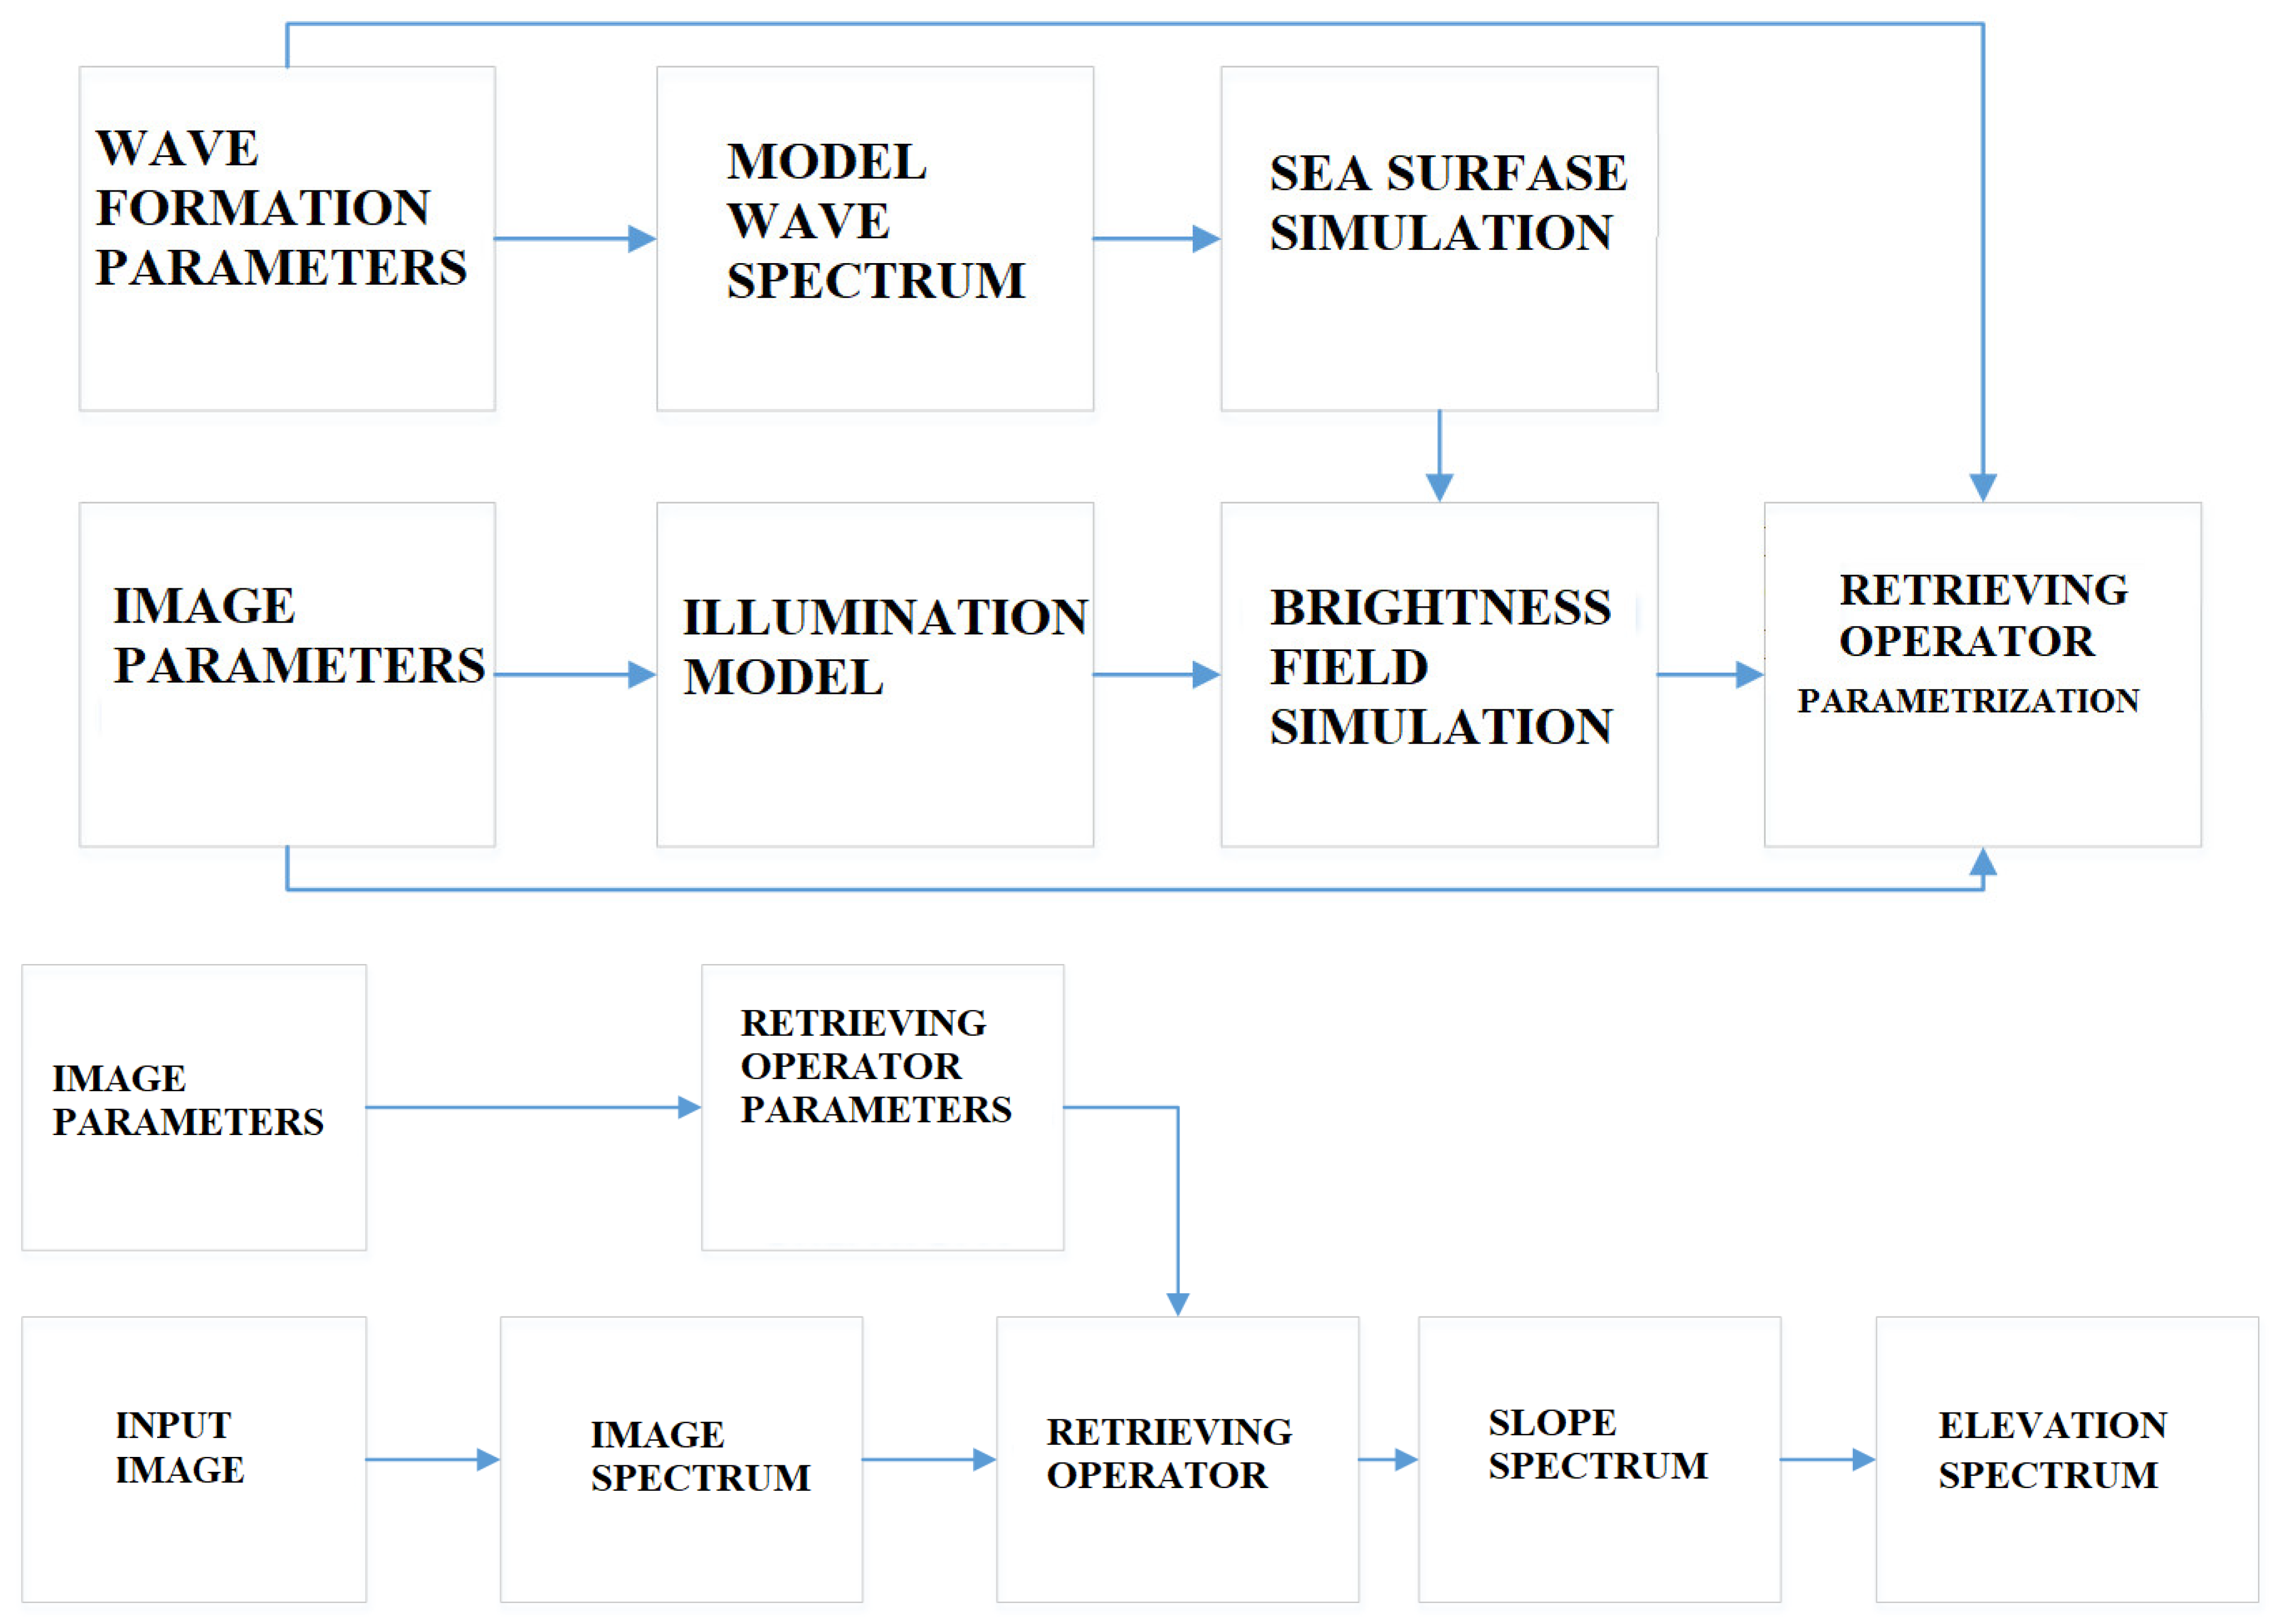
A diagram illustrating the interaction of various algorithms for numerical modeling and image processing is shown in
Figure 1.
To obtain the retrieving operators by the numerical method, the following sequence of operations is performed.
Two-dimensional random fields of sea surface slopes
are synthesized for a given spatial spectrum of elevations
and a phase spectrum given by a random function with a uniform distribution of phases [
9,
13,
14].
For the given illumination and viewing conditions, the brightness field,
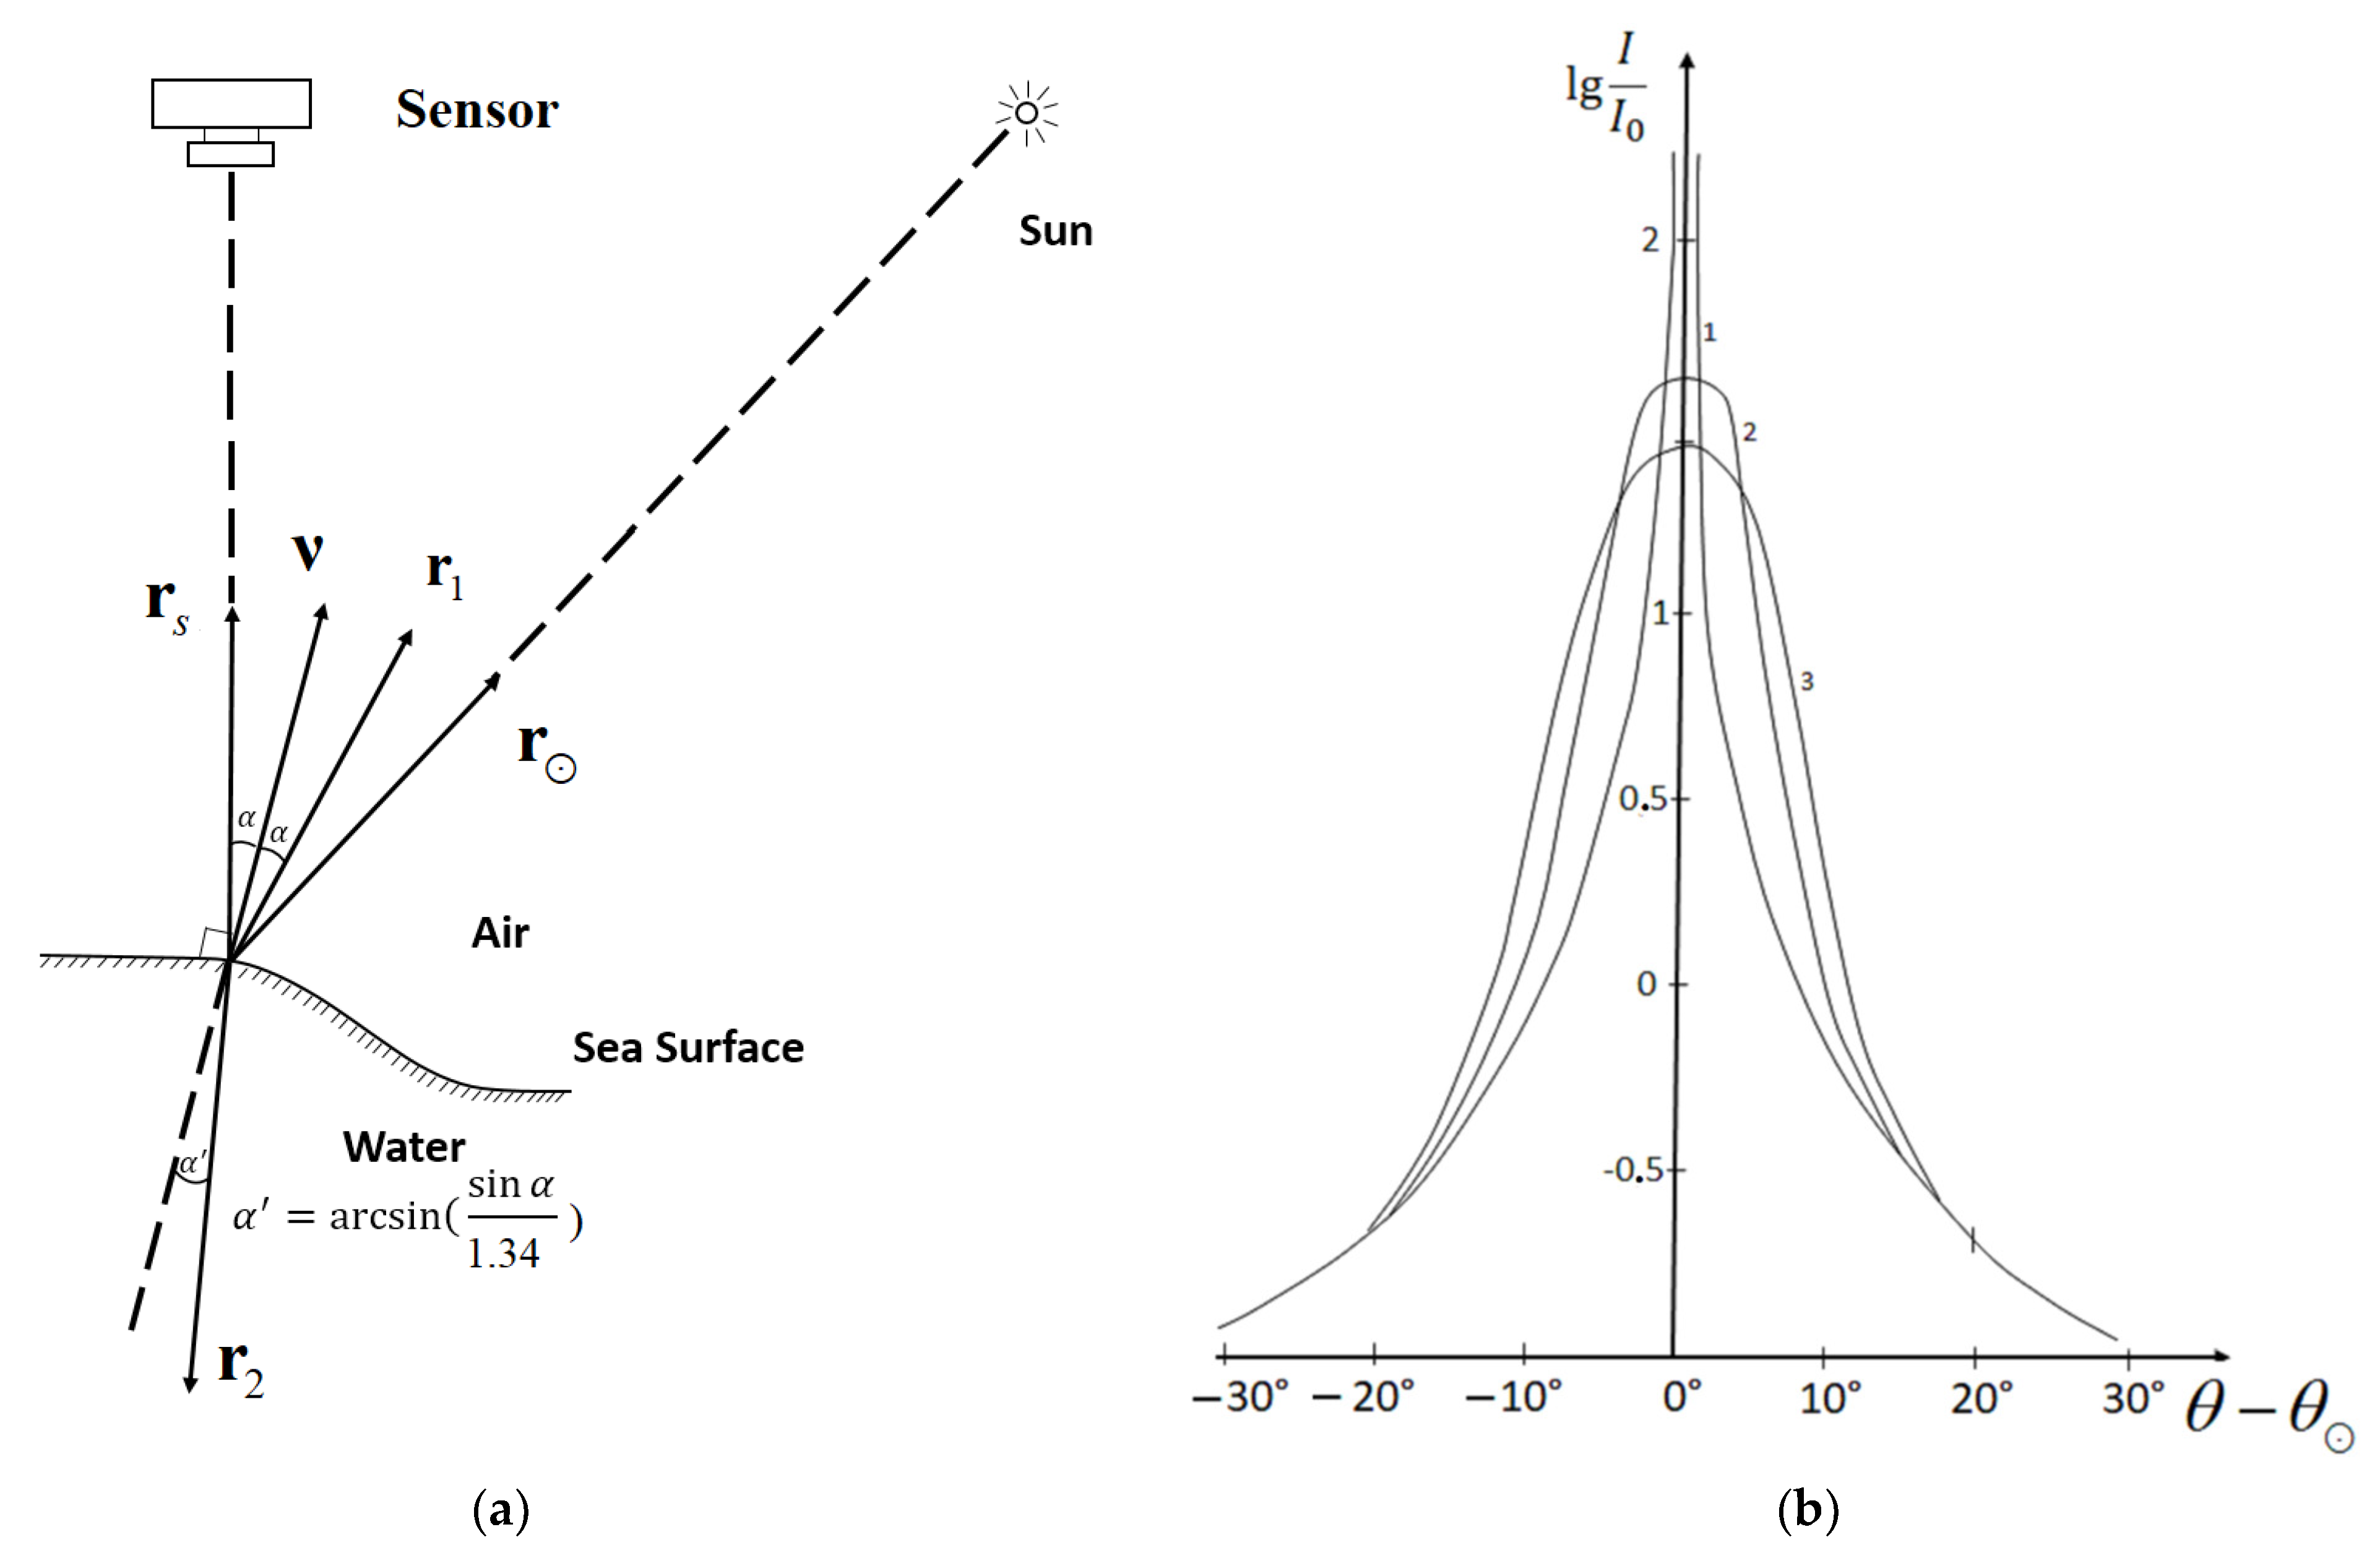
is calculated using the synthesized slope field and taking into account various physical processes involved in its formation. When modeling optical images, a model is used that describes the reflection and refraction of light on the water surface according to the laws of geometric optics, as shown in
Figure 2a.
Figure 2a shows vectors of unit length that determine the reflection and refraction of light on an element of the sea surface according to the laws of geometric optics:
the vector defines the normal to the sea surface element and depends on the gradient of the elevation field;
vectors and , indicate the directions in the upper and lower hemispheres, whence comes the light that enters the receiver after reflection and refraction, respectively;
the vector determines the direction to the Sun;
vector defines the direction to the sensor.
To take into account the nonlinearity of the modulation of the brightness field by the surface slopes due to the presence of sun glare, light scattering by small-scale surface roughness within the area, the size of which is determined by the spatial resolution of the sensor registering the image, is of significant importance. The higher the spatial resolution a satellite image has, the smaller the site size is. Accordingly, the dispersion of roughness is less and the effect of sun glare is greater.
Figure 2b shows examples of the angular dependence of the effective light intensity in the plane of the solar vertical, corresponding to different image pixel sizes
and rms roughness
: 1—
,
; 2—
,
; 3—
,
[
18]. Light intensity is normalized using a multiplier used to approximate the sky light intensity distribution on a cloudless day [
18,
25].
The brightness field, is converted into a model image signal, , taking into account the specified characteristics of the recording equipment.
The retrieving operator R is defined by comparing the spectrum of the model optical image,
to the spectrum of slopes
corresponding to the direction
determined by the specified illumination and viewing conditions. In particular, the retrieving operator can be represented in the form of a spatial-frequency filter [
9,
13,
14].
With this definition of the retrieving operator, the retrieval of the sea surface slope spectrum is reduced to multiplying the spectrum of the image fragment, by the spatial frequency filter, according to Equation (10).
When numerically simulating images of the sea surface, parameters must be set that determine the conditions for the formation of these images, and therefore, to one degree or another, affect the type of the retrieving operator . When processing real images of the sea surface, these parameters are taken directly from the conditions for obtaining an optical image.
When analyzing large amounts of information to determine the retrieving operator, , it is advisable to perform preliminary numerical modeling of sea surface images for various combinations of parameters. For each specific combinations of parameters retrieving operator is approximated by an analytical formula associated with a certain set of parameters .
To parameterize the retrieving operator constructed by the numerical simulation, the power function of the wave number with parameters depending on the wave azimuth can be used as follows [
11]:
where the parameters
a1 a2 a3 characterize the region of high spatial frequencies, where a power-law decay of the spatial wave spectrum is observed. For typical conditions of high-resolution satellite imagery at different positions of the Sun, the values of these parameters were obtained by numerical simulation of physical processes of formation of optical images of waves [
9,
18];
is the retrieving operator in the low-frequency region, the construction technique of which is described in [
11]. In the same work [
11], the results were obtained on preliminary parameterization of
.
Thus, the practical use of the retrieving operator is as follows. From the conditions for obtaining images, a multi-dimensional vector of conditions is constructed, the components of which serve to determine the set of parameters a from the results of numerical simulation carried out in advance. The spatial-frequency filter constructed from the set of parameters a is then applied to the spatial spectra of the selected image fragments to calculate the corresponding spectra of the sea surface slopes. The obtained slope spectra are used to retrieve the elevation spectra:
by Equation (9) in the presence of several spectra of slopes corresponding to different directions;
or by Equation (6), taking into account the restrictions imposed by Equation (7), if there is no possibility of obtaining slope spectra for several different directions.
3. Results
To validate the developed method, an experimental check of the adequacy of its work should be carried out. The main focus of attention should be the validation of the method with the variability of waves associated with the presence of natural and anthropogenic anomalies.
To validate the retrieving operators constructed by the method of numerical simulation, we will use an approach based on the comparison of satellite and in situ measurements obtained in complex experiments [
10]. Complex experiments are carried out under controlled conditions and include a space survey of test areas of the sea surface and synchronous sea truth measurements using wave recorders, as well as stereophotogrammetric survey of the sea surface at low altitude. Spatial spectra of sea surface elevations, retrieved from satellite images under fixed conditions, are compared with the spectra of elevations obtained from in situ measurements with string wave recorders using a special technique that takes into account the different nature of remote and in situ measurements [
10].
To solve the set tasks, the results of complex experiments were used, which were carried out near the stationary oceanographic platform of the Black Sea hydrophysical sea truth test site (Katsiveli village, Crimea), installed at a distance of about 600 m from the coast.
Complex experiments of two types were carried out:
The main complex experiment (experiment #1) consisted of a space survey and synchronous in situ measurements of wave spectra from the oceanographic platform.
An additional complex experiment (experiment #2) consisted of conducting the research in the short-wave region of wave spectra (Λ = 0.04–1.0 m) using string wave recorders and stereo imaging from the deck of an oceanographic platform under wave formation conditions close to those observed in the main complex experiments.
To measure the spatio-temporal wave spectra, we used in situ data obtained using a wave measuring complex based on an array of string wave recorders, which are a set of six resistive wave recorders measuring sea surface elevations at points located in the center and vertices of a pentagon. The distance from the central string to each of the outer strings is 25 cm. The main technical characteristics of this complex: the maximum height of the measured waves—up to 4 m; resolution—not worse than 3 mm; number of measuring channels—6; and channel sampling frequency—10, 20, 50, and 100 Hz.
3.1. The Results of Studies of the Variability of Waves in the Complex Experiment #1
The purpose of the main complex experiments is to validate the method of remote measurement of sea wave spectra from satellite images using in situ measurements on a stationary platform.
The image was recorded by high spatial resolution equipment from the GEOEYE satellite on 24 September 2015 at 11:52 local time.
The details of processing the satellite image obtained in the main complex experiment are described in [
10,
11].
Satellite images were processed using the following sequence of computational operations:
calculation of the spatial spectrum of the selected image fragment ;
retrieval of the spectrum of slopes using the retrieving operator , built for a set of conditions determined by the conditions for obtaining a space image;
calculation of the spatial spectrum of elevations χ(k) from the retrieved spectrum of slopes in a given range of wave azimuths (±60 angular degrees relative to the azimuth of the Sun) according to formula (6);
recalculation into the frequency spectrum
taking into account the dispersion ratio of gravitational waves by the formula:
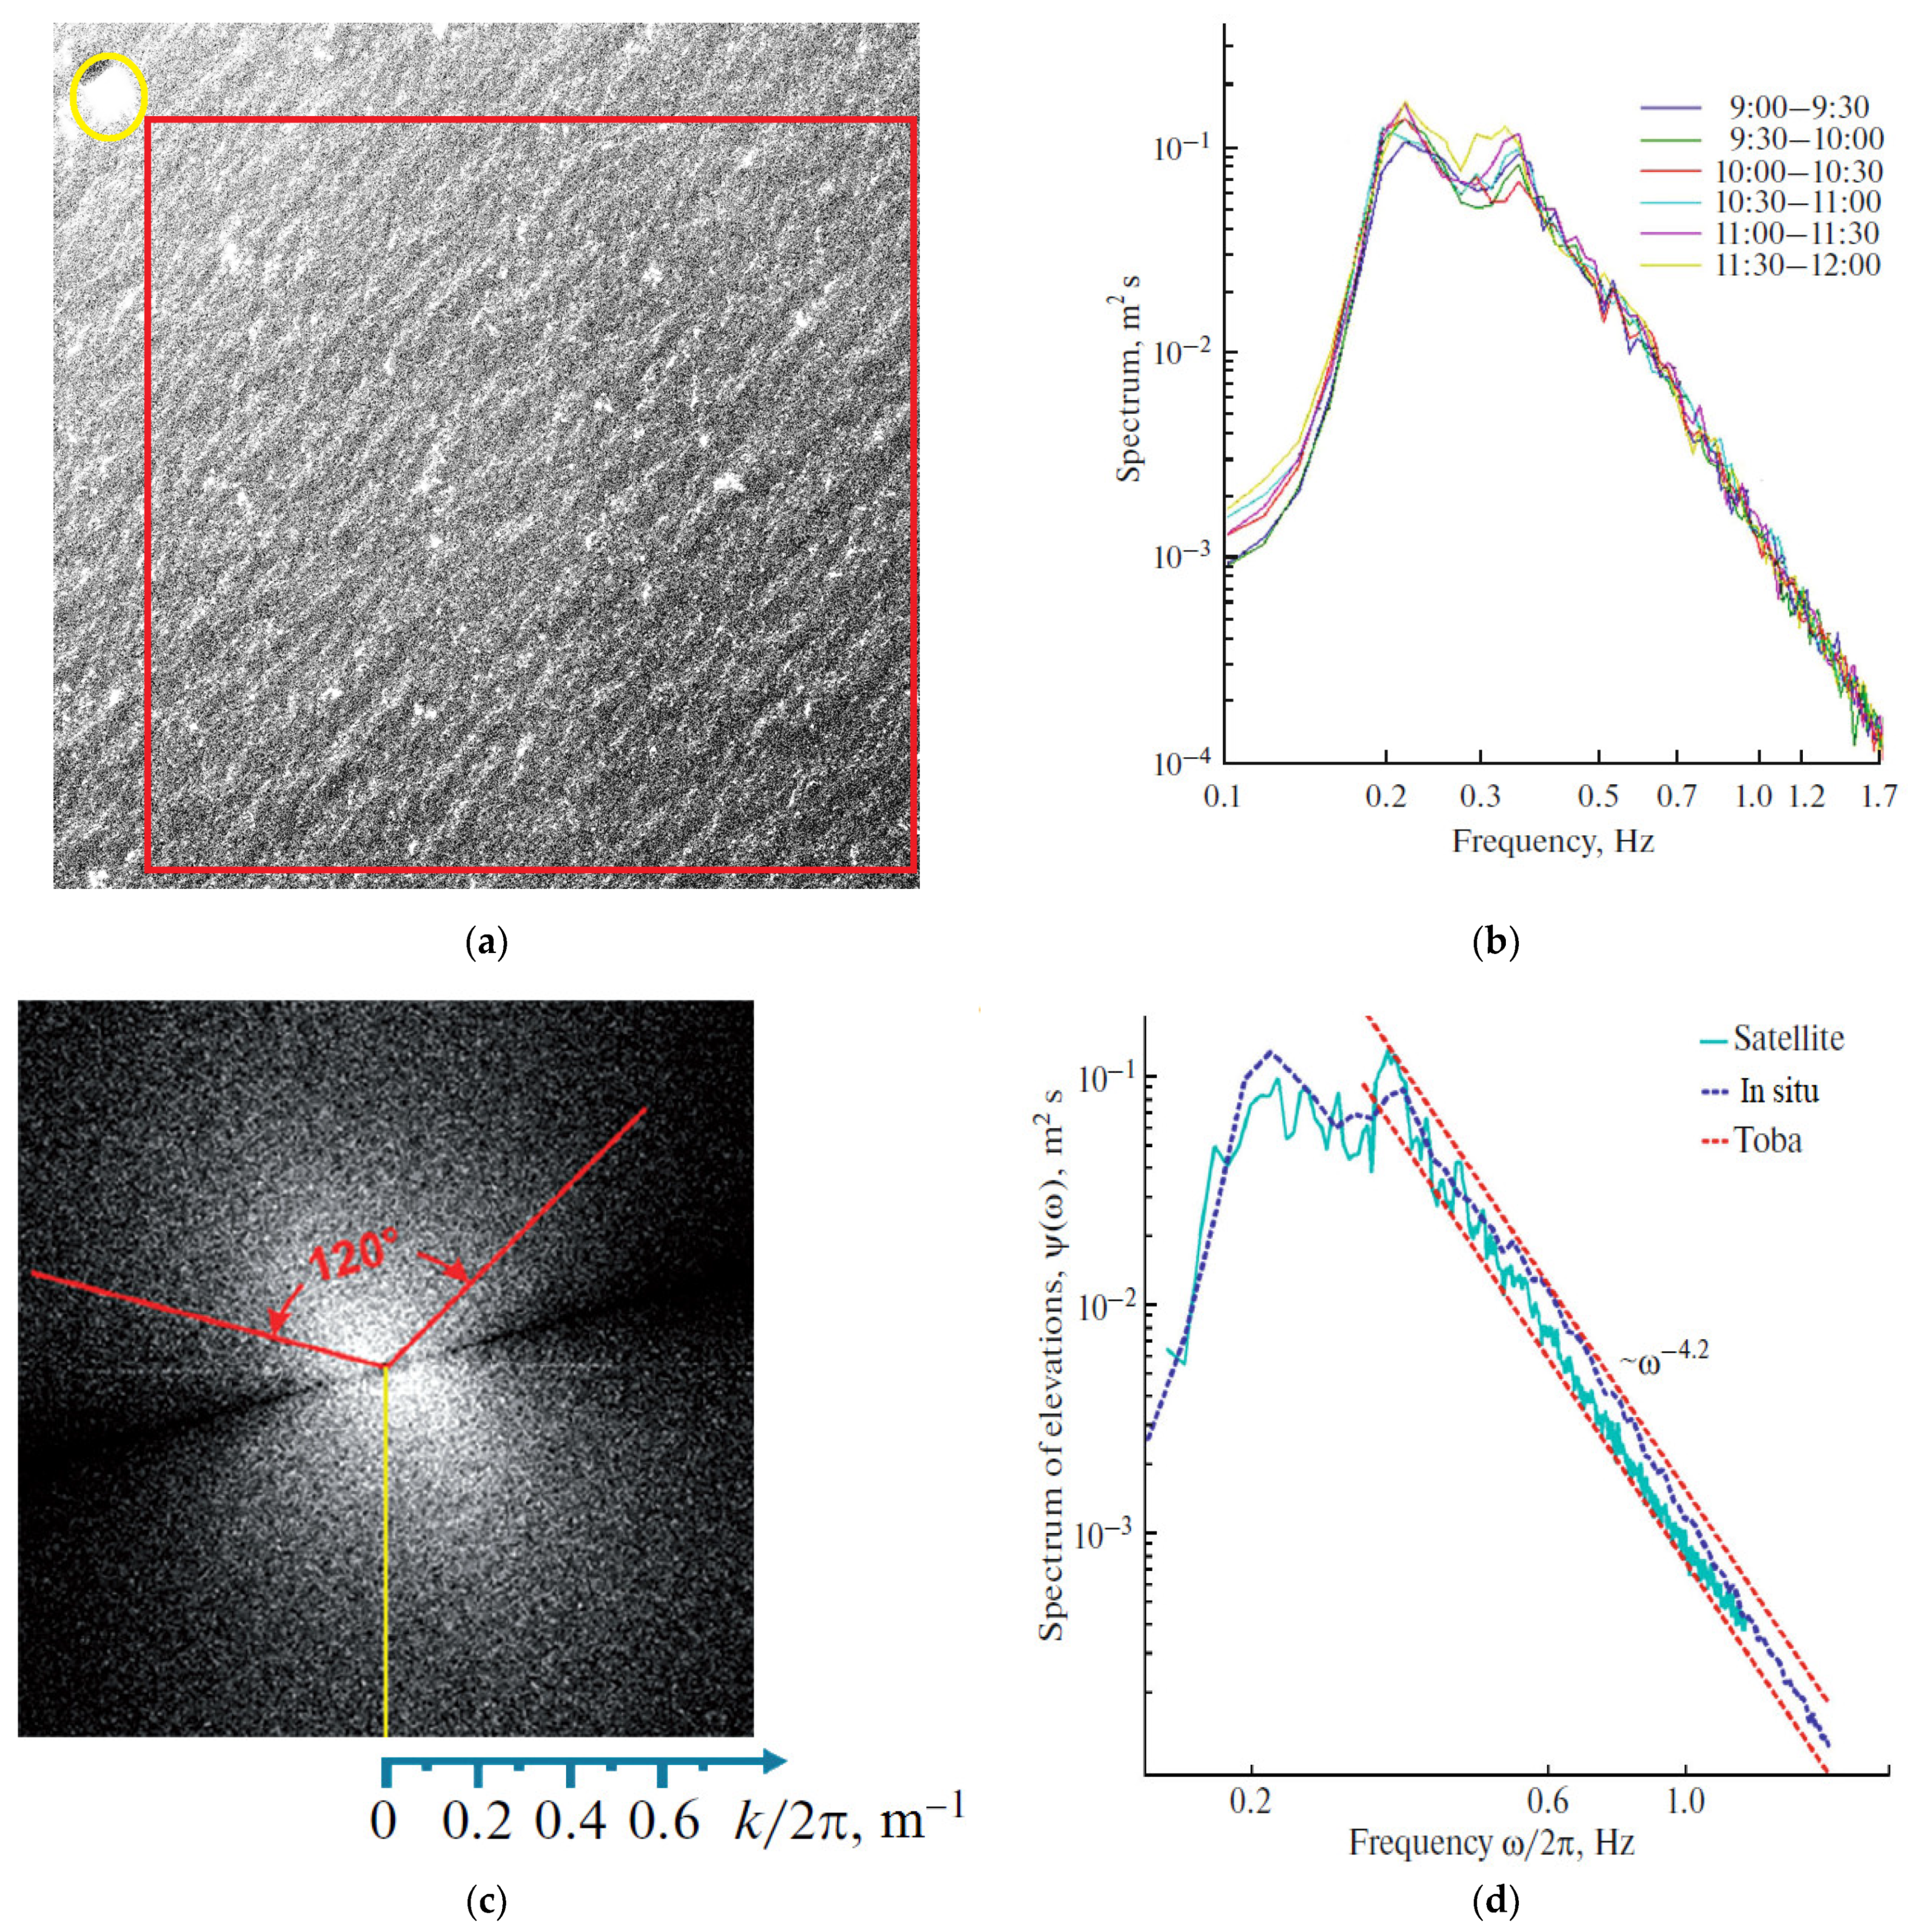
An example of the comparison of spectra is shown in
Figure 3.
Figure 3a shows a fragment of a high-resolution satellite image, registered from the GEOEYE satellite. The oceanographic platform from which in-situ measurements were carried out is marked with the yellow circle. The red rectangle marks a sea surface area used for the wave spectra retrieval.
Figure 3b shows a sequence of spectra based on the data of a string wave-recorder, which demonstrates the variability of waves in the experimental area for three hours before satellite imagery. Each given spectrum was obtained with a half-hour averaging. The time evolution of the frequency spectra for three hours preceding the satellite’s pass shows the development of wind waves—an increase in their energy and a decrease in the frequency of the spectral peak. At the same time, the system of swell waves remained dominant. Swell waves came from an azimuth of 130°, wind waves propagated along the direction of the east wind.
Figure 3c shows the spectrum of slopes, retrieved by the method described above from high-resolution satellite imagery data, and also shows the angular sector in which the spectrum of sea surface elevations was reconstructed for subsequent comparison with in situ measurements.
Figure 3d combines the frequency spectra of elevations obtained during processing of the satellite image, taking into account the dispersion relation and the calculation by Equation (13), as well as the spectra obtained from the data of the array of string wave recorders. The measure of the discrepancy between the estimates of the spectra was Δ ≈ 0.07 [
10].
The red dashed lines show the limits within which the spectrum of developing wind waves should lie according to the Toba approximation of the wave frequency spectrum [
26]:
where
is the dynamic speed in air, and
is the coefficient for two lines, equal to 0.06 and 0.11, respectively.
Figure 4 shows an example of comparing the frequency spectrum of elevations obtained by a half-hour averaging of the data of the array of string wave recorders with the spectra of elevations reconstructed by processing satellite image fragments of various sizes. The given plots show that when retrieving wave spectra from an image of a sea surface area with a linear size of 0.5 km (
Figure 4a), it is not possible to retrieve the spectrum of elevations in the low-frequency region due to the lack of data.
When the spectrum of elevations is reconstructed from a region of the surface with a linear size of 2 km, the retrieved spectrum turns out to be broader in the low frequency region than the spectrum obtained from the data of the array of string wave recorders. In this case, the processed area of the sea surface covers a zone remote from the coast, where the waves are more developed than in the zone where the string wave recorders are located. The best coincidence of the shape of the spectra is observed at a fragment linear size of 1 km.
3.2. The Results of Studies of the Variability of Waves in Complex Experiment #2
The purpose of the additional complex experiments is to study the applicability of the developed method for remote measurement of the spectra of sea waves in the region of short waves.
In additional experiments, along with in situ measurements carried out by string wave recorders, a stereo survey was carried out on the platform from a low altitude with a high spatial resolution.
Stereophotogrammetric processing of synchronously recorded optical images of the sea surface from two different points of view (stereopairs) makes it possible to directly measure the realizations of two-dimensional fields of sea surface heights, and from them to calculate the spatial spectra of elevations. The stereophotogrammetric method makes it possible to measure the shape of a rough sea surface and represent it as a function of Equation (2).
Stereo photography of the sea surface was carried out from the working platform, which was located at an altitude of 16 m above sea level with a baseline of 10.2 m using stereo cameras with a focal length of 99 mm [
10].
Measurements of coordinates of sea surface elements by stereo-pairs. From the elevation field measurements, the spectra of the sea surface elevations were calculated using the interpolation procedures and the discrete Fourier transform.
Simultaneously with the stereophotography on the platform, measurements of the frequency spectra of the sea surface elevations were carried out with the help of a spectral wave recorder, which provided the registration of the spectrum in the frequency range, and the recording time of one spectrum in this range was about 20 min.
Experimental conditions: the zenith angle of the Sun was 30° (the images were recorded in a cloudless sky), and the wind speed was 5 m/s. During the experiments, the wind was blowing off the coast, so the fetch of the wind waves did not exceed the distance from the platform to the coast, which is ~600 m.
Images of the sea surface obtained during stereo photography were also used to retrieve the spectrum of the sea surface elevation using a developed retrieving operator. At the same time, fragments of two optical images of a stereopair were analyzed, in which the same area of the sea surface is presented, which was processed stereophotogrammetrically. This makes it possible, when comparing the estimates of the spectrum of sea surface elevations obtained by different techniques, to study the accuracy of these techniques.
Synchronous wave-recorder measurements were carried out to analyze the selected stereopairs. All the optical images under study were recorded under a cloudless sky.
Comparison of the estimates of the wave spectra obtained by different techniques was carried out in order to check the adequacy of the detection and measurement of variations in the wave spectra caused by the variability of the waves, associated both with natural processes and with anthropogenic influences.
The correlation between variations in the estimates of wave spectra obtained by different techniques was studied in [
10]. We investigated the correlations of the main characteristics of the wave spectra obtained by three methods in two wavelength intervals: from 0.1 to 1 m and from 0.04 m to 0.4 m.
For the main characteristics to compare the wave spectra obtained by different techniques, we chose the rms elevation and the exponent of the power-law approximation of the wave spectrum in the indicated intervals.
The analysis of the obtained results showed that the correlation of estimates made by different techniques is quite high, and averages 0.8–0.9.
To check the adequacy of the developed techniques when working with the regions of the sea surface, where the wave spectrum is subject to anthropogenic impacts, an artificial anomaly of the spatial wave structure was created during the experiment using vegetable oil spilled onto the water.
The wave spectra obtained by different techniques in the area of the artificial anomaly were compared with similar spectra obtained earlier for the background sea surface.
The study of the background sea surface was carried out for two hours.
After that, an artificial anomaly was created by spilling about a liter of vegetable oil from the oceanographic platform. The creation of artificial films of surfactants has proven itself well as a method for studying anthropogenic pollution of the marine environment [
22,
27,
28,
29].
As a result of spilling the vegetable oil, an artificial slick was formed on the water. The area of this slick exceeded the water area under the platform. Special measurements of the thickness of the oil film on the water were not carried out. According to the estimates based on the volume of spilled vegetable oil and the approximate area of the slick, the film thickness was about ~10−6 m.
The artificial anomaly created with the spilled vegetable oil was investigated for about half an hour using three techniques.
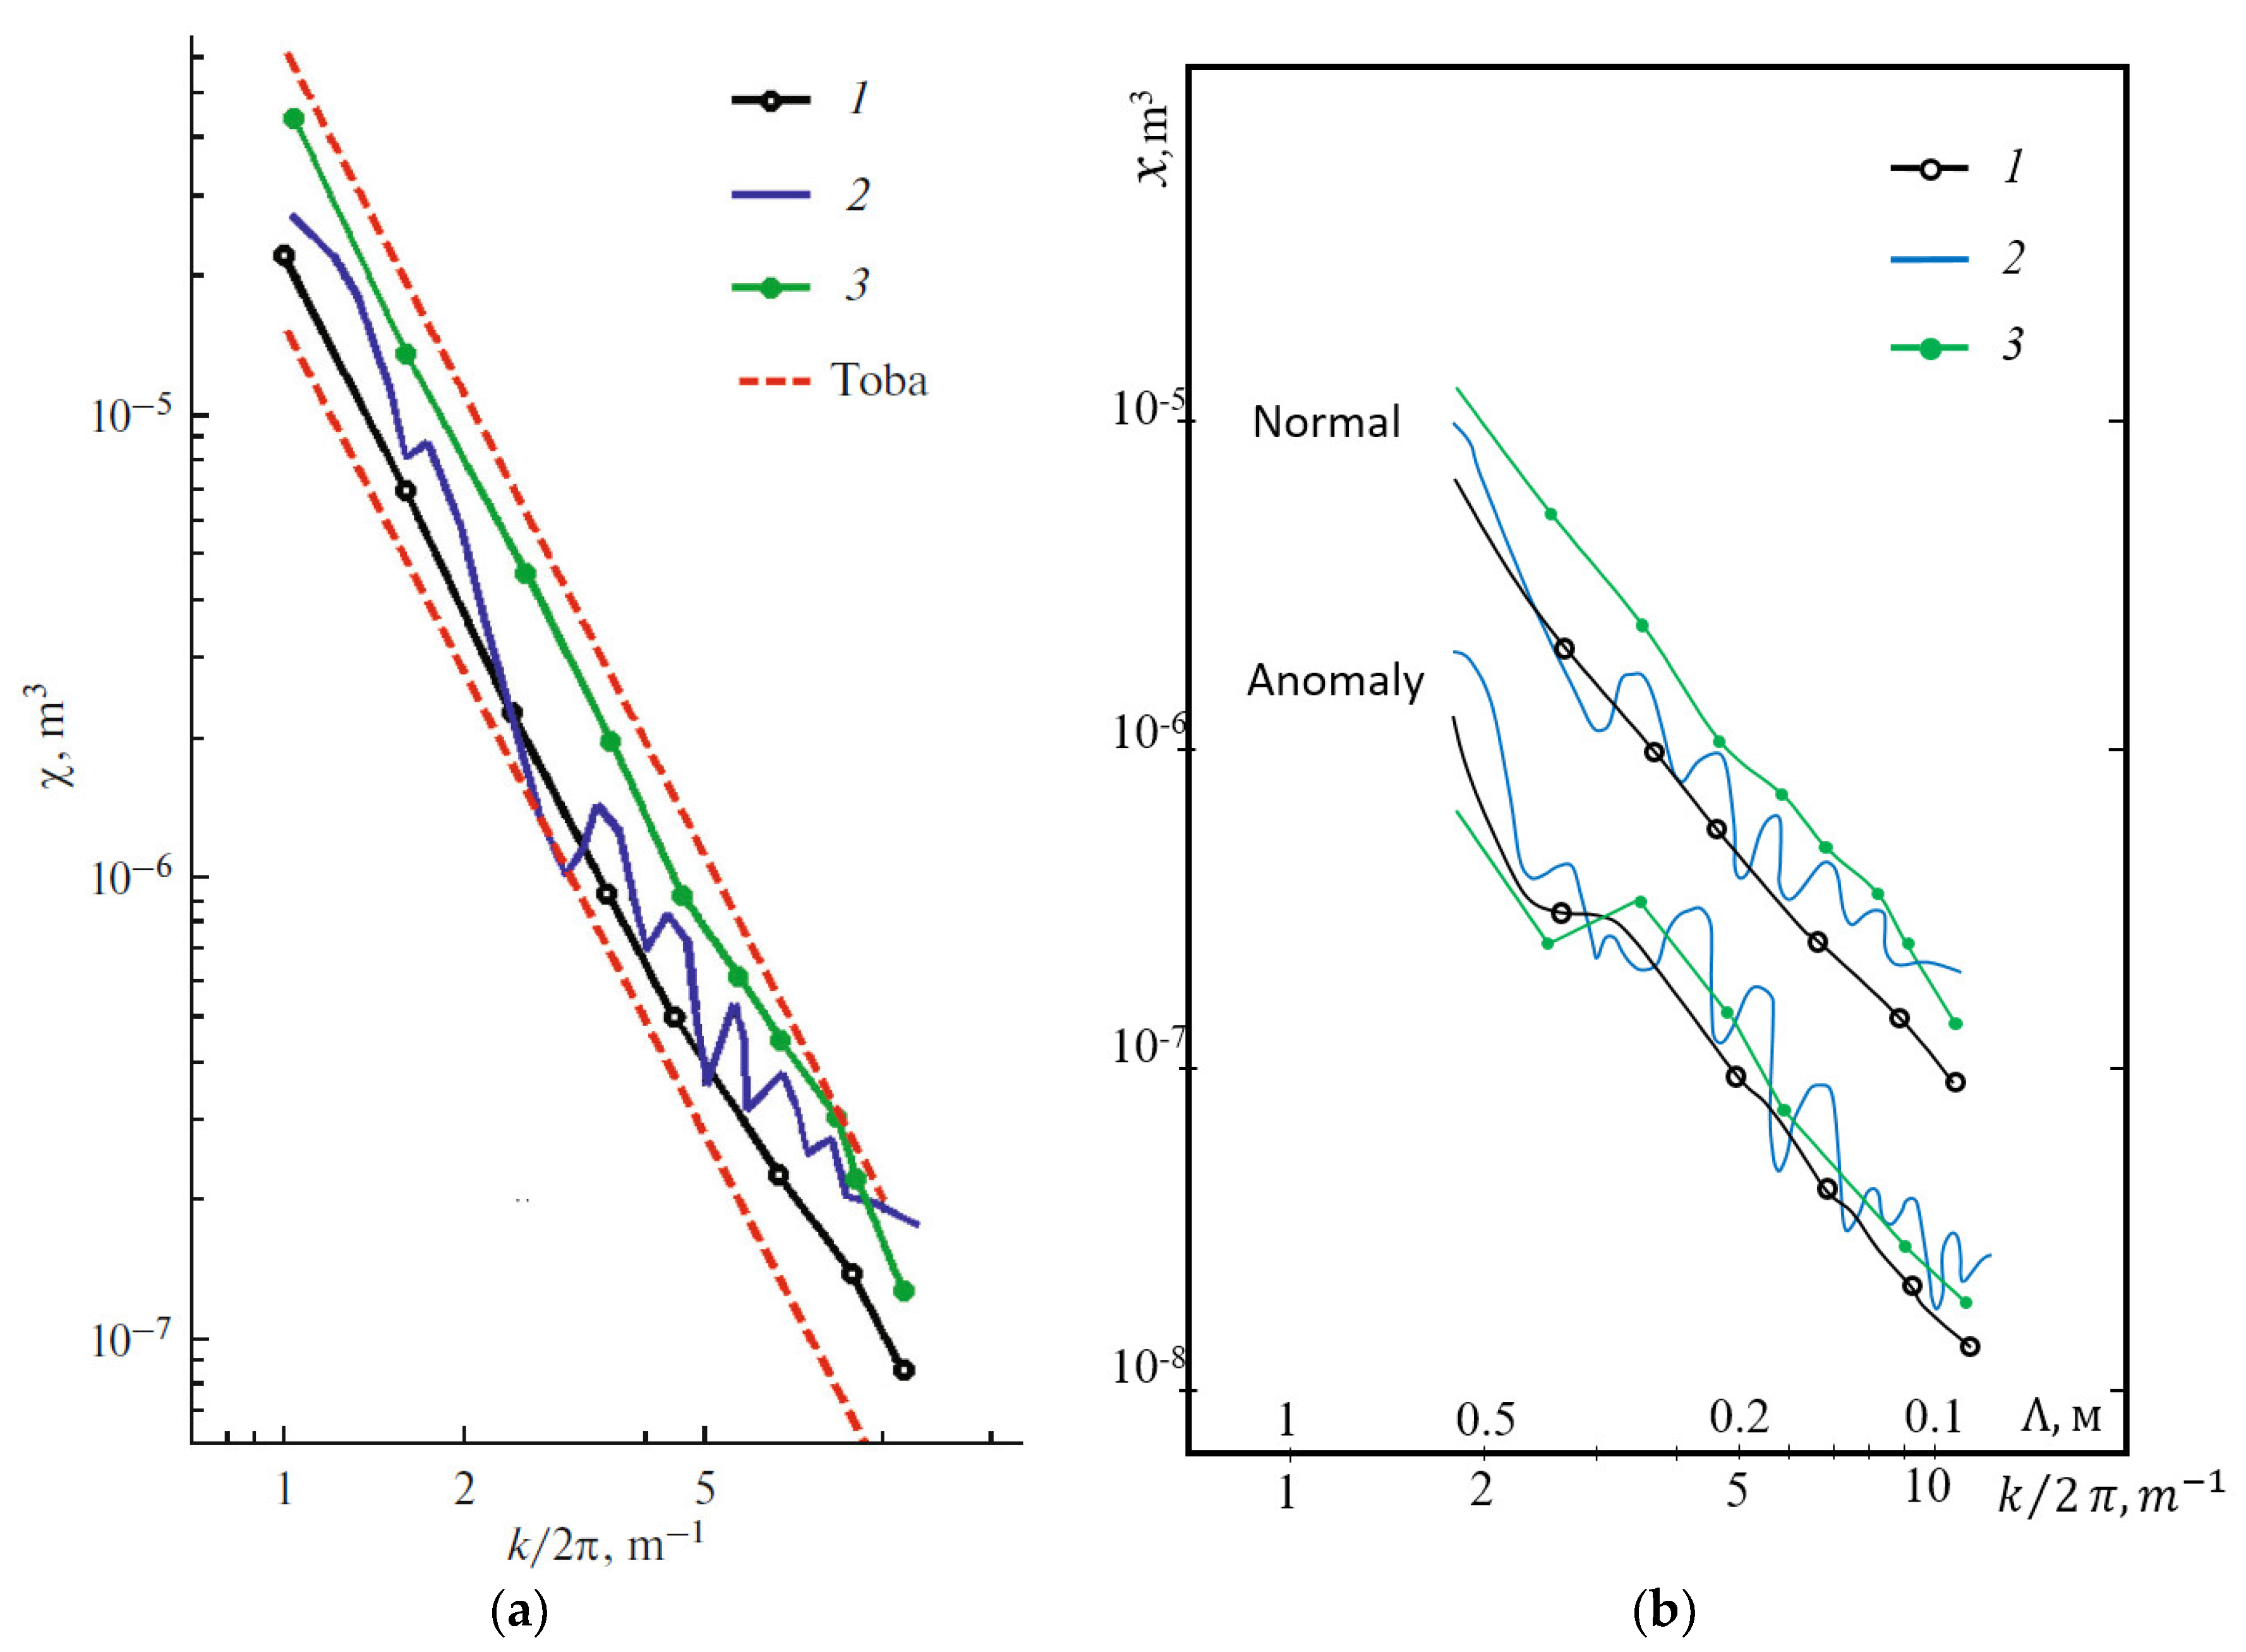
Wave spectra measured by different methods were recalculated into the spectrum of elevations according to Equation (13).
According to our data, there is a noticeable damping of waves with lengths of 0.3–0.6 m, as well as shorter waves. Waves longer than one meter are not considered. The spectra in
Figure 5 have single measurements with wavelengths over 0.5 m, for which the spectral power has decreased by about 2 times.
All the data presented can be divided into two classes—background and anomaly caused by oil on the water. If the background data are averaged over the results of all measurements of the data for all three methods, the rms elevation values given in
Table 1 and
Table 2 will be obtained.
The tables also show the relationship between the background and the anomaly in the magnitude of the spectral power (squares of the root mean square elevation).
Thus, for the wavelength range from 0.1 to 1 m, the rms elevation in the area of the sea surface anomaly associated with the appearance of an oil slick decreases:
1.4-fold, according to the results of the developed technique;
1.91-fold, based on the results of processing stereopairs;
1.59-fold, according to the data of the in situ wave recorder.
Similarly, for the wavelength range from 0.04 m to 0.4 m, the rms elevation in the area of the oil slick decreases:
1.65-fold, according to the results of the developed technique;
2.5-fold, according to the results of processing stereopairs;
1.37-fold, according to the wave recorder data.
The obtained estimates of the spectral anomalies of the sea surface agree with the results of other researchers [
22,
27].
4. Discussion
The developed approach for retrieving the spatial spectra of slopes and elevations of surface waves from aerospace optical images takes into account the nonlinear modulation of the brightness field by the slopes of the sea surface and includes a number of computational operations, including the numerical synthesis of the slope fields of the sea surface with a given spatial spectrum and random phases, as well as modeling the brightness field, taking into account the conditions of illumination, reflection and light scattering.
In this case, parameterization of spatial-frequency filters using a set of parameters depending on the conditions of image registration can be used.
The conducted studies have demonstrated the adequacy of the application of the method for retrieving the spectra of sea wave slopes and elevations from space optical images of high spatial resolution, which takes into account the nonlinear nature of the modulation of the brightness field by slopes of the sea surface.
The possibility of using the developed method for studying the variability of sea waves in the coastal zone under conditions of limited fetch is shown.
According to the results of two different complex experiments, the spatial spectral characteristics of sea waves, estimated from remote sensing data, were compared with the corresponding characteristics measured by in situ means under controlled conditions. The data of the array of string wave recorders installed on the stationary oceanographic platform of the Black Sea hydrophysical sea truth test site, as well as the data of stereo photography from the same platform, were used as sea truth data for comparison. Comparison of the wave spectra and its statistical characteristics demonstrated the correspondence of the results obtained during the processing of satellite images of high spatial resolution and the results of processing data obtained by various ground-based means. The measure of the discrepancy between the background wave spectra obtained from remote and in situ data is about 0.07. At the same time, there is a good qualitative agreement between the spectra obtained by distance and in situ methods in the area of an artificially created anomaly associated with the damping of short waves by an oil film on water.
Thus, the adequacy of remote measurement of both the time-average spectra of the sea surface and the variations of these spectra associated with unsteady waves has been experimentally confirmed. The use of high spatial resolution images and retrieving operators, taking into account the nonlinear nature of the modulation of the optical signal by the surface slopes, makes it possible to remotely determine the characteristics of wave spectra in a wide range of wavelengths and over vast areas.
The developed methods will be used for remote monitoring of the state of sea waves, including for identifying natural and anthropogenic impacts on various water areas.
At the same time, the studies carried out have shown the prospects of further development of the elaborated approach to retrieve wave spectra from optical satellite images using retrieving operators that take into account the nonlinear modulation of the brightness field by surface slopes.
A practically important direction in the development of the approach is its combination with other methods to reconstruct the angular distribution of spectral energy for all directions. In particular, a possible integration of the proposed method with the method for estimating the wave spectrum from the statistical characteristics of solar flares [
23], as well as with developing new methods based on fractal analysis of optical satellite images [
30] looks promising. The development and validation of new approaches will require new complex experiments using synchronous satellite and sea truth measurements.


