Article

Cohesive Zone Model Modification Techniques According to the Mesh Size in Finite Element Models of Stiffened Panels with Debonding

by
Vasileios K. Mantzaroudis
* and
Dimitrios G. Stamatelos
*
Laboratory of Strength of Materials, Department of Aeronautical Sciences, Division of Aeronautics, Applied Mechanics and Infrastructure, Dekelia Air Force Base, 13671 Attica, Greece
*
Authors to whom correspondence should be addressed.
Submission received: 22 November 2021 / Revised: 31 December 2021 / Accepted: 5 January 2022 / Published: 11 January 2022

Abstract

:
When catastrophic failure phenomena in aircraft structures, such as debonding, are numerically analyzed during their design process in the frame of “Damage Tolerance” philosophy, extreme requirements in terms of time and computational resources arise. Here, a decrease in these requirements is achieved by developing a numerical model that efficiently treats the debonding phenomena that occur due to the buckling behavior of composite stiffened panels under compressive loads. The Finite Element (FE) models developed in the ANSYS© software (Canonsburg, PA, USA) are calibrated and validated by using published experimental and numerical results of single-stringer compression specimens (SSCS). Different model features, such as the type of the element used (solid and solid shell) and Cohesive Zone Modeling (CZM) parameters are examined for their impact on the efficiency of the model regarding the accuracy versus computational cost. It is proved that a significant reduction in computational time is achieved, and the accuracy is not compromised when the proposed FE model is adopted. The outcome of the present work leads to guidelines for the development of FE models of stiffened panels, accurately predicting the buckling and post-buckling behavior leading to debonding phenomena, with minimized computational and time cost. The methodology is proved to be a tool for the generation of a universal parametric numerical model for the analysis of debonding phenomena of any stiffened panel configuration by modifying the corresponding geometric, material and damage properties.

1. Introduction

The prediction and understanding of the structural behavior and residual strength of an aircraft component after the occurrence of damage is substantial, considering the need for the design of such structures to perform even under conditions of catastrophic failure initiation (Damage Tolerance design philosophy). Commonly, debonding phenomena arise in the composite materials often employed for modern aircraft structures, essentially affecting not only the response of the loaded structure but also the load level for the catastrophic failure of the composites themselves. An important category of debonding phenomena are the ones that occur as a consequence of buckling behavior due to compressive loads. For a deeper understanding of the buckling and post-buckling phenomena of composite structures, the review of Xu et al. [1] provides a wide range of the published literature on the various analytical, semi-analytical and numerical methods used for their analysis. For more state-of-the-art work on the subject, suggested works include Milazzo et al. [2], Groh et al. [3], Liguori et al. [4]. Specifically for numerical analyses, useful insight is given by studies such as Lanzi [5] for flat, composite-stiffened panels, Bisagni [6] for cylindrical shells and Debski et al. [7] for composite beams. In the process of numerically analyzing debonding phenomena, the need for large computational resources and elongated solution times are typical obstacles. More specifically, when commercial Finite Element Analysis (FEA) software are employed for the analysis of such problems, the typical methods used are the Virtual Crack Closure Technique (VCCT) and CZM; in terms of the integration of these methods in FE models, the VCCT is more complicated due to the increased amount of code development needed, while CZM is easier to define, usually through the determination of certain parameters (for a comprehensive presentation of both methods and their application process, the reader is directed to the ANSYS© software (Canonsburg, PA, USA) Help Manual [8]).
Characteristic studies on the matter where the VCCT is employed include those by Orifici et al. [9] and Bisagni [10], where debonding due to the buckling of I-shaped stiffened panels is analyzed; on similar configurations, Riccio et al. [11] developed and tested a modified, more efficient VCCT. Other panel configurations, such as T-shaped and Hat-shaped configurations, were examined using the VCCT by Zou et al. [12] and Raimondo et al. [13], respectively. On the other hand, for key studies on the application of CZMs on similar debonding phenomena, the reader is encouraged to see Zhao et al. [14] (I-shaped stiffened panels), Bisagni et al. [15], Vescovini et al. [16] and Yetman et al. [17] (Hat-shaped stiffened panels). In these last studies, it is mentioned that the definition of the CZMs relates to the need for the extreme refinement of the meshes incorporated for correct results to be obtained. Published works in the literature deal with the development of techniques for the coarsening of the meshes used in CZMs, with their efficiency mainly having been tested up to now on simple debonding cases, such as the Double Cantilever Beam (DCB), e.g., [18,19,20,21,22]. The applicability of these proposed techniques has not been thoroughly performed in relation to more complicated structures, such as stringer-stiffened panels, where a more complex structural behavior is expected, and the efficiency of these mesh-coarsening methods can be more deeply investigated.

2. Theoretical Background

The work presented here is motivated by the engineering approach already developed by Turon et al. [21]. In this analysis, Turon et al. proposed a technique for the adaptation of a Bilinear CZM incorporated in FEA. This adaptation is based on the modification of certain CZM parameters, depending on the mesh size desired by the engineer. The need for this modification arises from the fact that originally, CZMs require extremely fine meshes, even of the order of a tenth of a millimeter, and this leads to large solution times; this could be a serious consideration, especially when computational resources are limited or when numerous of consecutive calculations has to be performed, for example, in a preliminary design phase. The approach of Turon et al. examines an important characteristic size of structures under debonding, the “cohesive length zone”; this is defined as the length from the crack tip to the first point in the undamaged region of the cohesive material where, under single-mode loading (mode I or modes II–III), the observed normal traction, for mode I, and shear traction, for modes II–III, reach their maximum values. The proposition of Turon et al. suggests an adjustment of this cohesive length zone, to be adapted to the selected mesh size for the FEA. However, it is mentioned that a minimum number of elements is required to span the cohesive length zone, which is based on previous studies, is suggested to be between three and five elements (referred to hereafter as Ne). This adjustment of the cohesive length zone is achieved by modifying the nominal values of the maximum normal and shear traction of CZM; instead, the fracture toughnesses of each mode have to be used with their original values. In this way, the highly refined meshes usually needed for the analysis of debonding by means of CZM are bypassed. The modification of the normal and shear tractions is based on Equation (1).
Modified   Traction   ( Normal   or   Shear ) :   t ¯ 0   =   9 π E 22 G c 32 N e l e
In Equation (1), E22 is the transverse elasticity modulus, Gc is the fracture toughness in for mode I or II, III (depending on the traction to modify), Ne is the selected number of elements on the cohesive zone (according to Turon et al., a number between three and five is proposed, based on the results of previous studies) and le is the desired element length. It is highlighted that Equation (1) in its original form in [21] is employed with an isotropic modulus of elasticity E, but Turon et al. suggest that when orthotropic materials are investigated, as in the present study, the E22 modulus is used.

3. Reference Benchmark Study and Finite Element Modeling

3.1. Benchmark Study

The experimental and numerical results of a single-stringer compression specimen (SSCS) are selected, from the literature, as references to study the effectiveness of the Bilinear CZM implemented in ANSYS© software. The maximum normal and maximum shear traction parameters of the model are modified according to Equation (1) to be adapted to increasingly coarser meshes. More specifically, taking into consideration the buckling phenomena typically arising in SSCS configurations under uniaxial compression, the FE models developed hereafter are assessed in terms of the following aspects: (a) prediction of the load–displacement curve, (b) prediction of the debonded length at the end of the loading, (c) energy absorbed at the end of the loading and (d) total solution duration. It is noted that the authors of the present contribution are not working on developing a new method for modifying CZMs but are instead investigating the applicability of the already proposed modification method of Turon et al. [21] to the undoubtedly more complex problem of an SSCS undergoing debonding due to buckling behavior.
The validation of the present FE model is obtained by comparing its results with the respective numerical results achieved by Riccio et al. [11], who developed a more efficient modified Virtual Crack Closure Technique (VCCT). Apart from the above comparison, the generated results are also compared with the respective results of the standard VCCT, as well as with the experimental results of the same SSCS of [9].
The geometric characteristics and material properties (IM7/8552UD) of the reference SSCS specimen are depicted in Figure 1 and Table 1, respectively.

3.2. Development of Finite Element Model

In the pursuit of accurate results with FE models, 3D quadratic elements are generally preferred. However, this approach is the most computationally expensive. If the computational resources are capable and the run time is not of great importance, then there is no reason to employ shell or solid-shell elements. This is due to the fact that shell and solid-shell elements assume the response of the thin-walled structure, something that it is not required for solid elements. In the current work, where an efficient and time-effective way of solving debonding problems is discussed, solid-shell elements are preferred over shell elements for the benchmark analysis. Even though both type of elements (shell and solid shell) require some preprocessing preparation before the geometry is meshed, solid-shell elements are preferred hereafter, since they have simultaneously the benefits that shell and solid elements individually offer. Solid-shell elements deliver quite accurate results with reduced run time in comparison to shell elements. Furthermore, by assigning a single element through thickness to solid-shell elements, the produced results are as accurate as shell elements. Finally, by employing solid-shell instead of shell elements, convergence issues due to contact elements can be overcome. Consequently, in the current benchmark, solid and solid-shell elements are utilized.
A fully parametric model is developed using the ANSYS Parametric Design Language (APDL) of the ANSYS© software so that the attributes of the numerical model can be easily altered. By modifying the element type for the skin and stringer, the element length and the CZM modification, a parametric study is performed to identify the ideal combination of parameters that provide accurate results with reduced computational cost and time. Table 2 presents all of the combinations of the attributes that are employed to the FE model in detail. Consequently, twelve different FE models are generated per element type. It is worth mentioning at this point that the maximum normal and shear tractions of the CZM model are calculated for every case according to Equation (1).
Regarding the two element types shown in Table 2, SOLID185 and SOLSH190 (eight-node solid and solid shell, correspondingly), that were used to model the specimen skin and stringer, option “enhanced strain formulation” the available in ANSYS© software for the treatment of shear and volumetric locking of this kind of element type is activated. The cohesion conditions between the skin and stringer of the SSCS are modeled with four-node surface-to-surface contact and target elements implemented in ANSYS© software (CONTA173 and TARGE170 elements for each contact pair). The section of the skin–stringer interface that is initially bonded is modeled with a “bonded” contact type, along with the definition of a CZM material, to enable possible further debonding during loading. The initial artificially debonded part of the interface (denoted in Figure 1 as the “debonded region”) is modeled with a “standard” contact type because only the interpenetration of surfaces should be taken into consideration. As for the boundary conditions at the two ends of the specimen, at the clamped end, the corresponding faces are constrained for all of the degrees of freedom (DOFs) applicable (UX = UY = UZ = 0); at the loaded end, the UX DOF is gradually increased in an automatic time-stepping way defined by the ANSYS© software based on the convergence of the problem (until 1.5 mm, as is explained later) to simulate the loading, and the other two DOFs are constrained (UY = UZ = 0). The two “potting regions” designated in Figure 1, used in the experimental fixture to ensure the correct establishment of the specimen, are modeled by only constraining the transverse DOFs involved (UY = UZ = 0). For the initiation of the non-linear buckling behavior of the specimen, it is mentioned that no imperfections of the geometry are needed to operate as perturbations. In contrast to other cases of non-linear buckling problems, where it is common to insert an initial perturbation to the model in order to cause the structure to buckle, in the case examined, the initiation of the non-linear buckling behavior is generated by the laminations of the specimen parts themselves. More specifically, the laminations of the stringer flange and web are such that their coupling matrices [B] are non-zero. It is noted that when a lamination possesses a non-zero coupling matrix [B], there is interconnection between in-plane (tension compression and shear) and out-of-plane (bending and torsion) behavior. For the specimen considered, the in-plane compressive displacement applied leads the stringer to an out-of-plane bending and torsion deflection, which triggers the structure to exhibit non-linear buckling behavior. A typical FE model of the SSCS, along with the aforementioned boundary conditions, is shown in Figure 2.

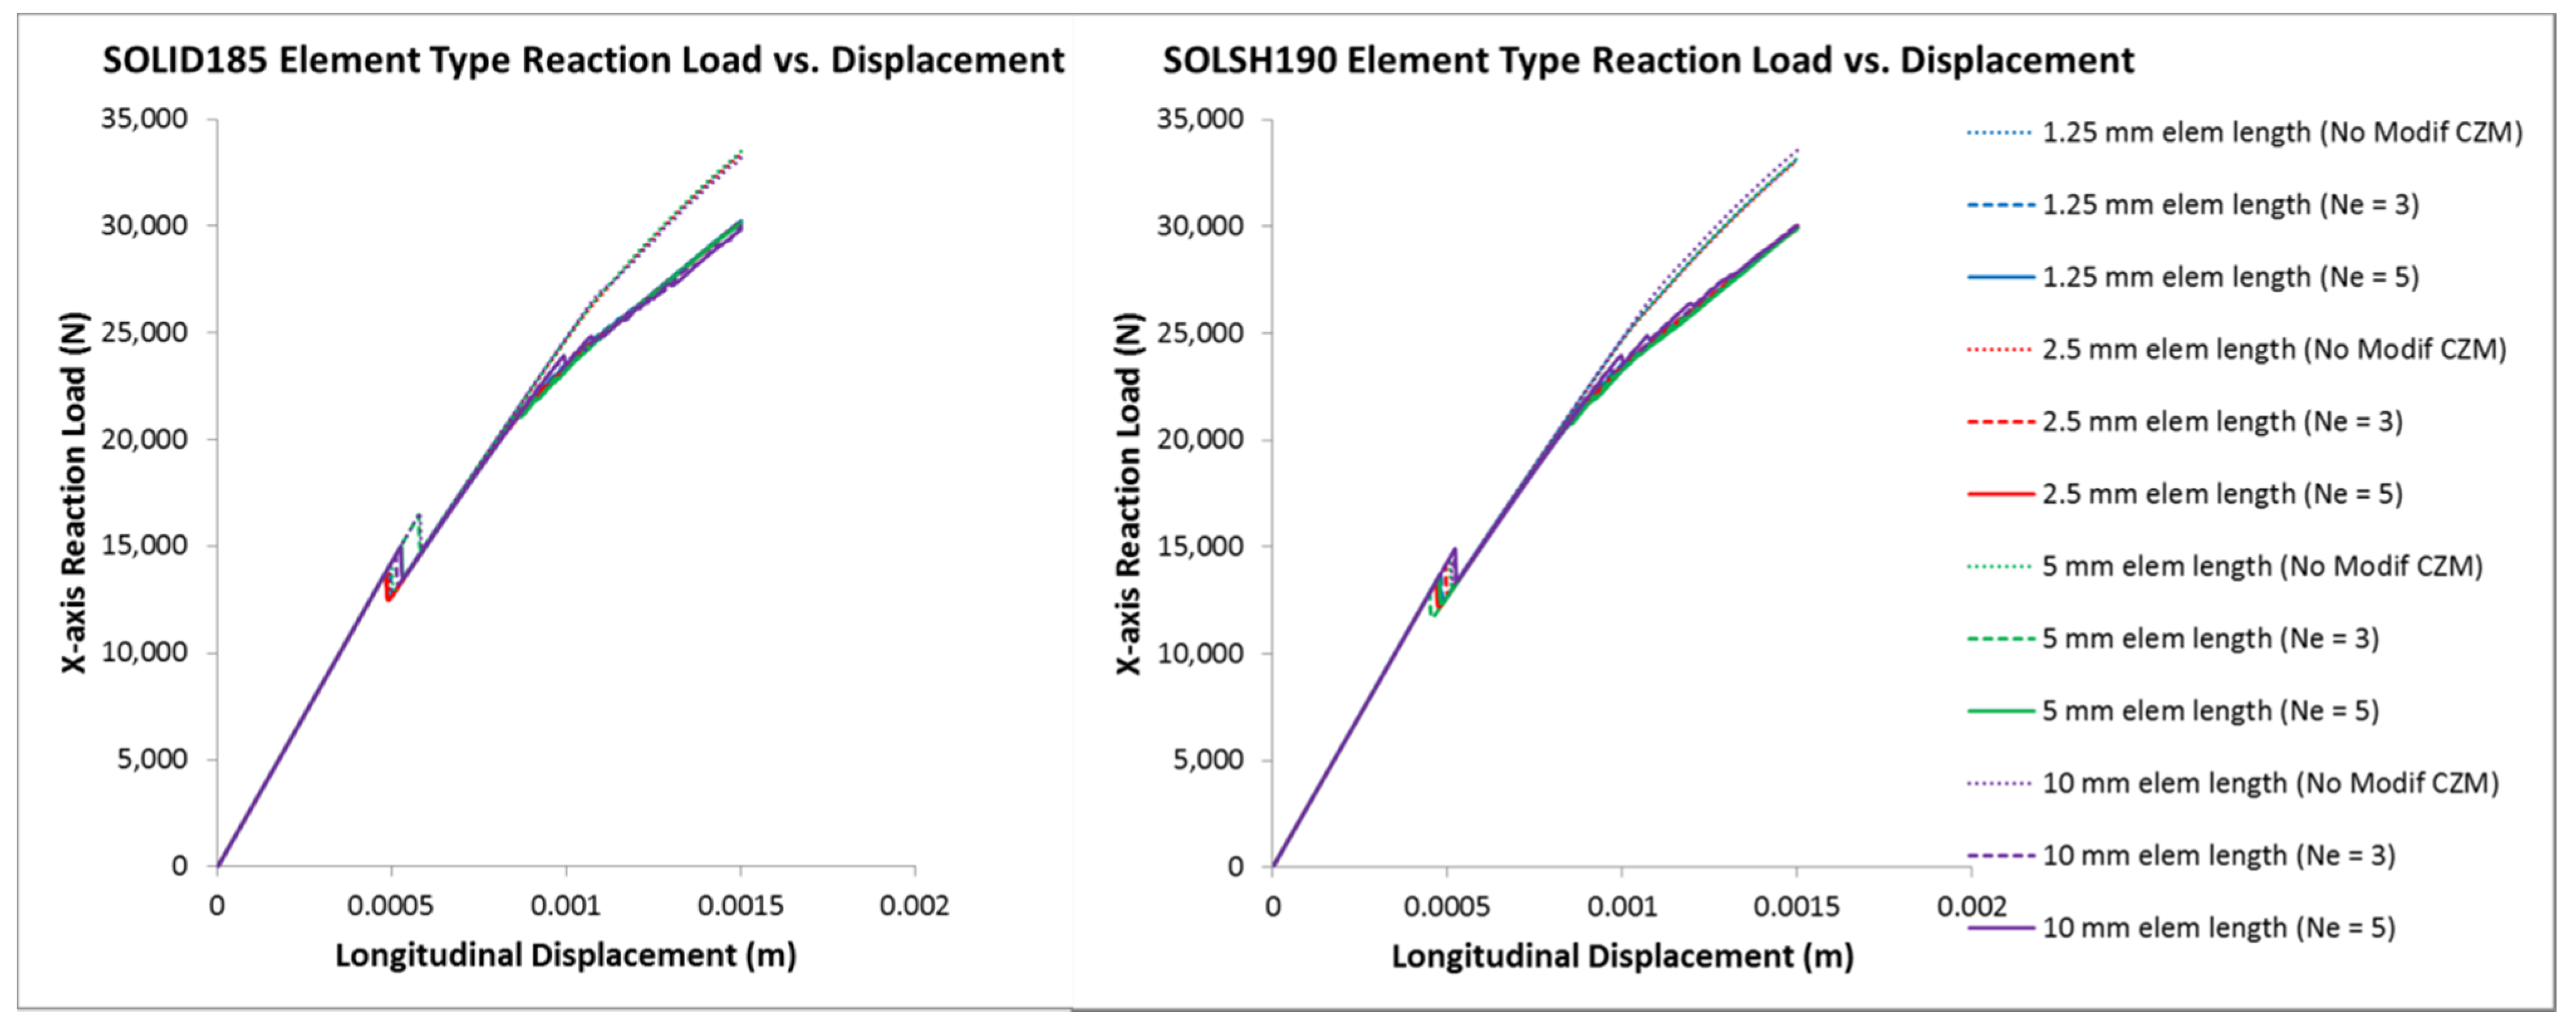
4. FE Model Results and Validation

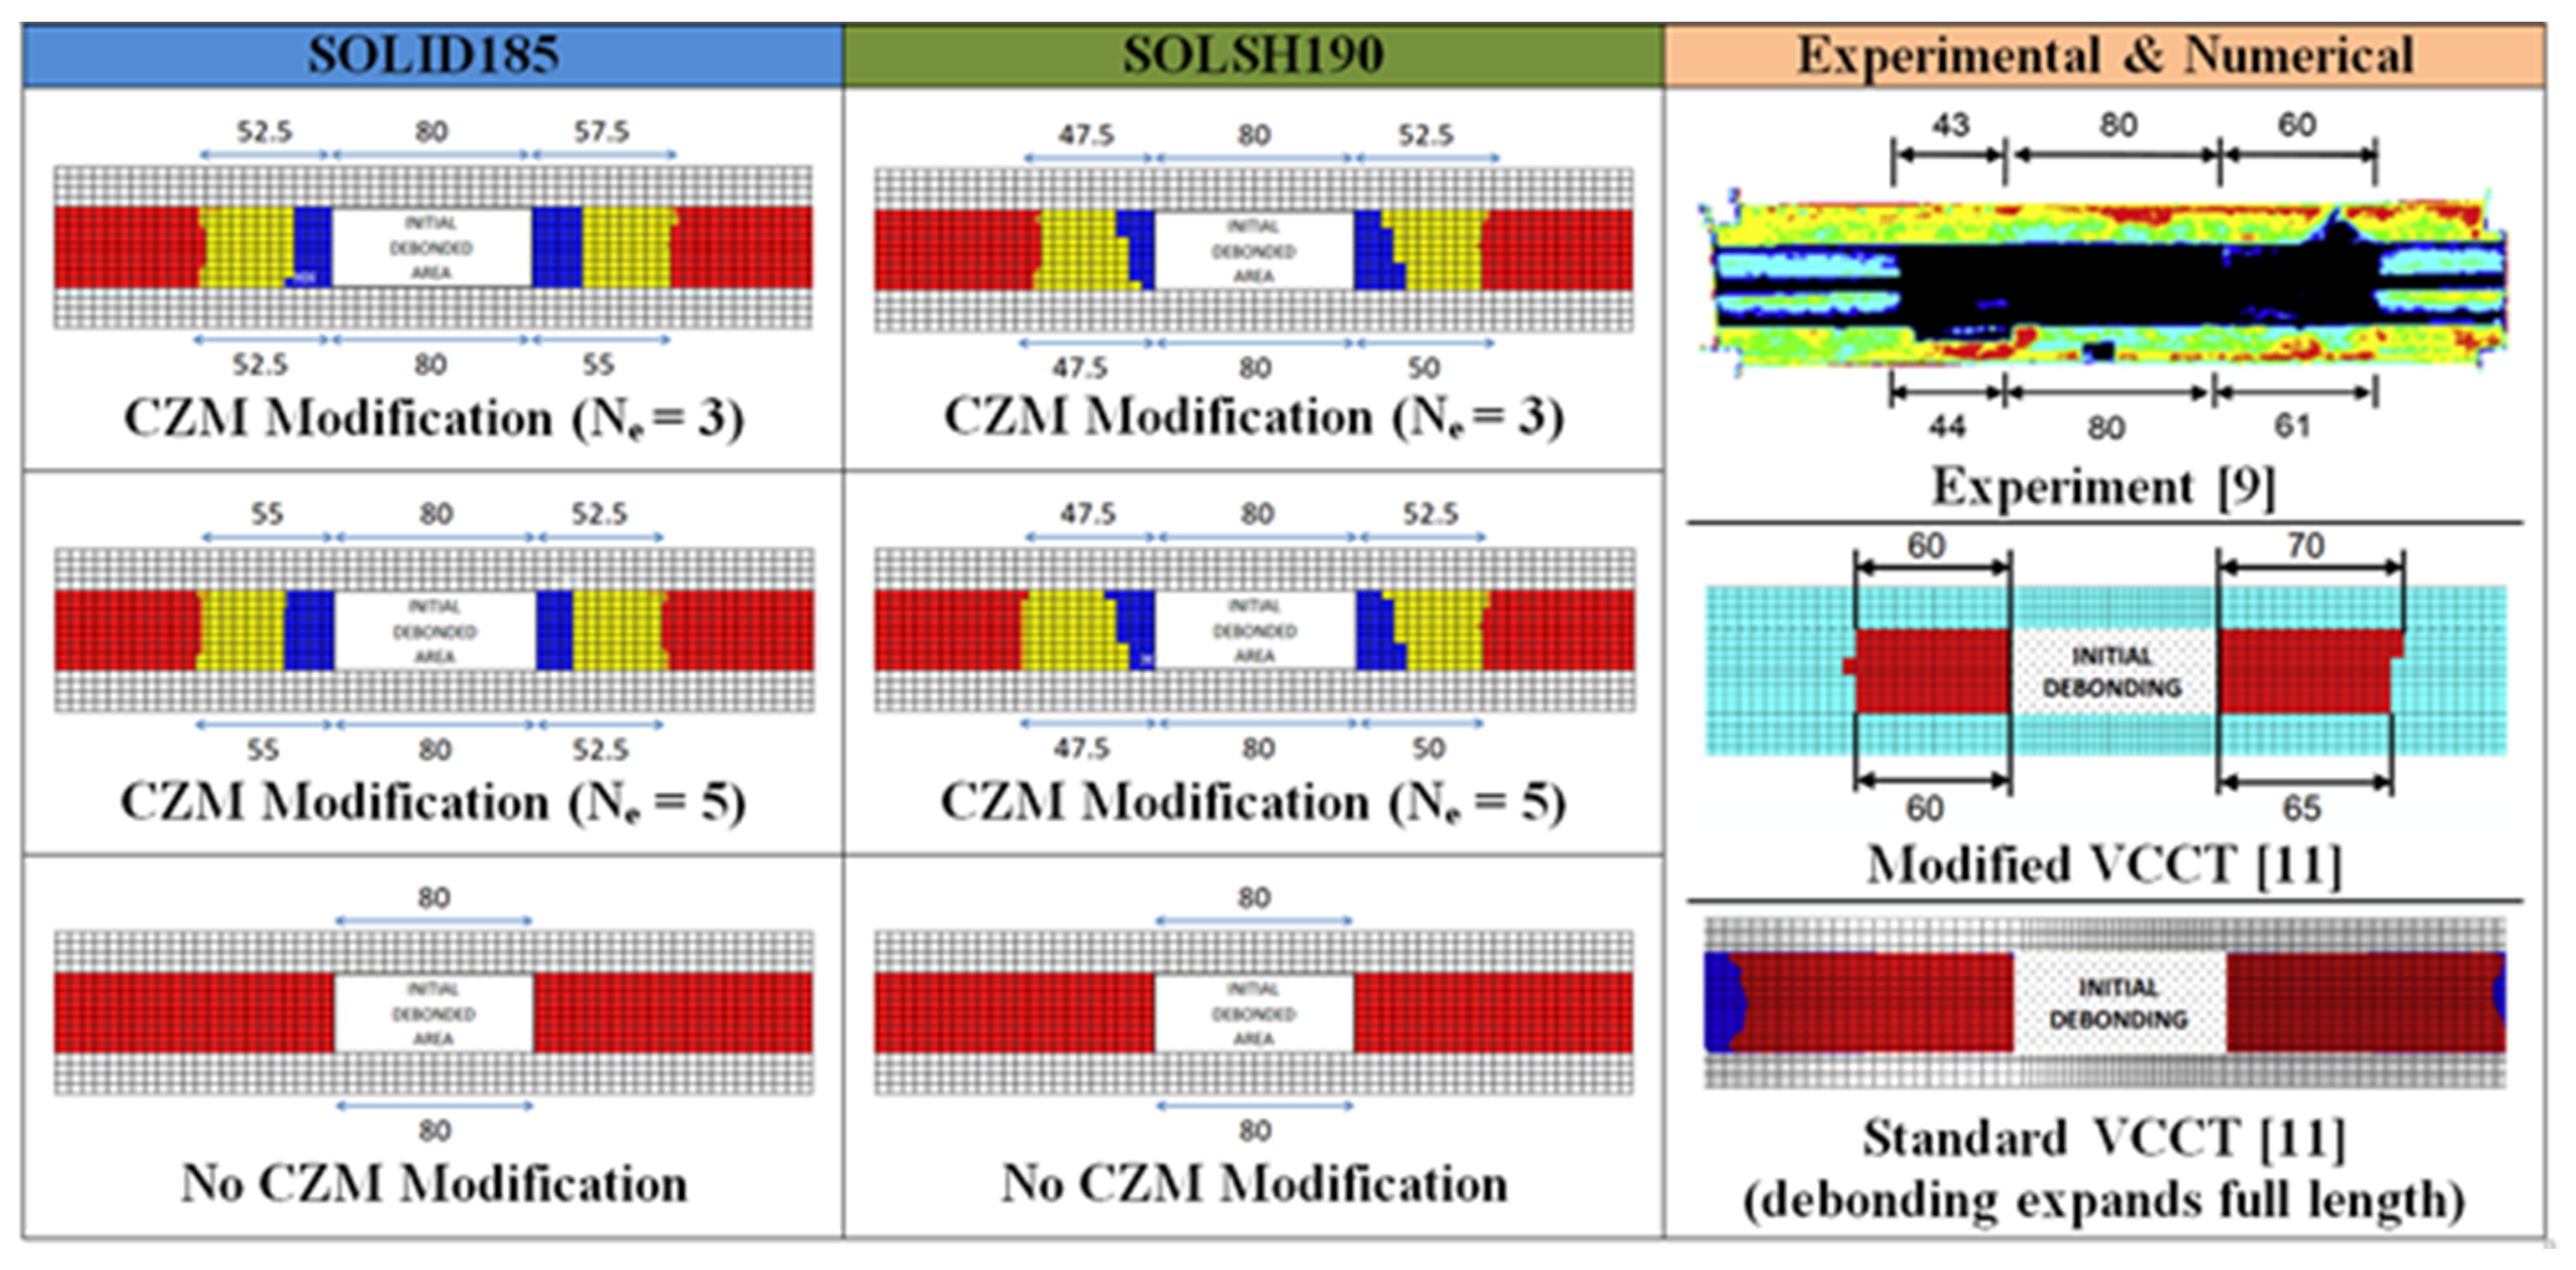
4.1. Validation of the FE model

In this section, the numerical results from the analysis of the FE model are presented along with its validation. In Figure 3a,b, a representative contour plot of the out-of-plane displacement (z-axis) at the end of the loading is shown for one of the investigated specimens under consideration (SOLSH190 and 5 mm element length depicted). In Figure 3a, the case where a modified CZM is applied is presented, whereas in Figure 3b, the case where no modification is considered is shown. In both cases, the buckling of the debonded section of the skin is identified. However, it is obvious that there is a considerable difference in the displacement pattern, since the debonding behavior with and without the modified CZM is quite different. More specifically, when the modified method is used, the initial debonding propagates well beyond its initial length, something that does not happen when no modification is performed.
For the validation, load–displacement curves are produced from the analysis of the FE model, where the SOLSH190 element type is applied, considering 2.5 and 5 mm element length (Figure 4). These curves are compared with the respective numerical [11] and experimental results [9] found in the literature. The comparison between the numerical results of this work and the respective experimental are meaningful up to a longitudinal displacement of 1.5 mm, because beyond this value, the experiments showed that intra-laminar damage (fiber and matrix fracture) and consequently specimen collapse occur. In the present FE models, the intra-laminar damage is not implemented, since the focus is on the debonding behavior predicted by CZM alone. In another study [23], however, the fiber and matrix fracture are considered utilizing the progressive damage modeling (PDM) technique. Despite this, it is clear that an excellent agreement is achieved between the modified CZM used here and the modified VCCT presented by Riccio et al. [11], as well as with the experimental results up to the point of interest (1.5 mm longitudinal displacement, before the specimen experimental collapse).
In Figure 5, the load–displacement curves for both examined element types (SOLID185 and SOLSH190), for all element lengths and values of CZM parameter Ne (number of cohesive zone elements) are presented. In these graphs, it is important to highlight that results where the CZM parameters are not modified are also included. It is observed that when the CZM is not modified, then the loads predicted at the end of the simulation are higher than the ones predicted by the modified CZM by a percentage of 10–12%.
Due to the fact that the assessment of only the load–displacement curves is not adequate to decide the necessity of the CZM modification, another important aspect of the FE model is its ability to predict the total debonded length at the end of the analysis. It is noted that for the aim of the study, the end of the analysis is considered when the longitudinal displacement of the loaded end reaches 1.5 mm in order to comply with the experimental results used as a reference. Figure 6 presents a comparison between the FE results of the final debonded length obtained with the 5 mm element length for the SOLID185 and SOLSH190 element types. These results are compared with the respective experimental results from [9] and with the corresponding numerical ones obtained with a modified VCCT, as well as with a standard VCCT [11]. It is remarkable that, when the modification of the CZM parameters is not applied, the debonding length does not grow/propagate at all; instead it remains the same, in contrast to the reference experimental and numerical results. On the other hand, for the cases with modified CZM, if the average of the final debonded length when measured from the two sides of the skin–stringer interface is taken as a mean of comparison, the correlation shows that: (a) the SOLID185 element type, after modification of the CZM, achieves a final debonded length 2.2% longer than the experimental and 9.4% shorter than the numerical modified VCCT, and (b) the SOLSH190 element type, after modification of CZM, achieves a final debonded length 2.9% shorter than the experimental and 13.9% shorter than the numerical modified VCCT (a quantification of the comparison with the standard VCCT has no meaning, as this VCCT over-predicts the expansion of the debonding at the full length of the specimen, which is not even close to the experimental results).
Consequently, if the load–displacement curves of Figure 4 and Figure 5 and the final debonded lengths of Figure 6 are examined simultaneously, it is concluded that the modification of CZM is necessary for correct predictions, depending on the mesh size selected. If the modification is not incorporated, higher loads than expected shall result (here, a percentage of 10–12% is detected), due to the fact that the evolution of the debonding growth will be wrongly predicted, as it is shown. Both the element types that are examined, SOLID185 and SOLSH190, perform in a similar way.

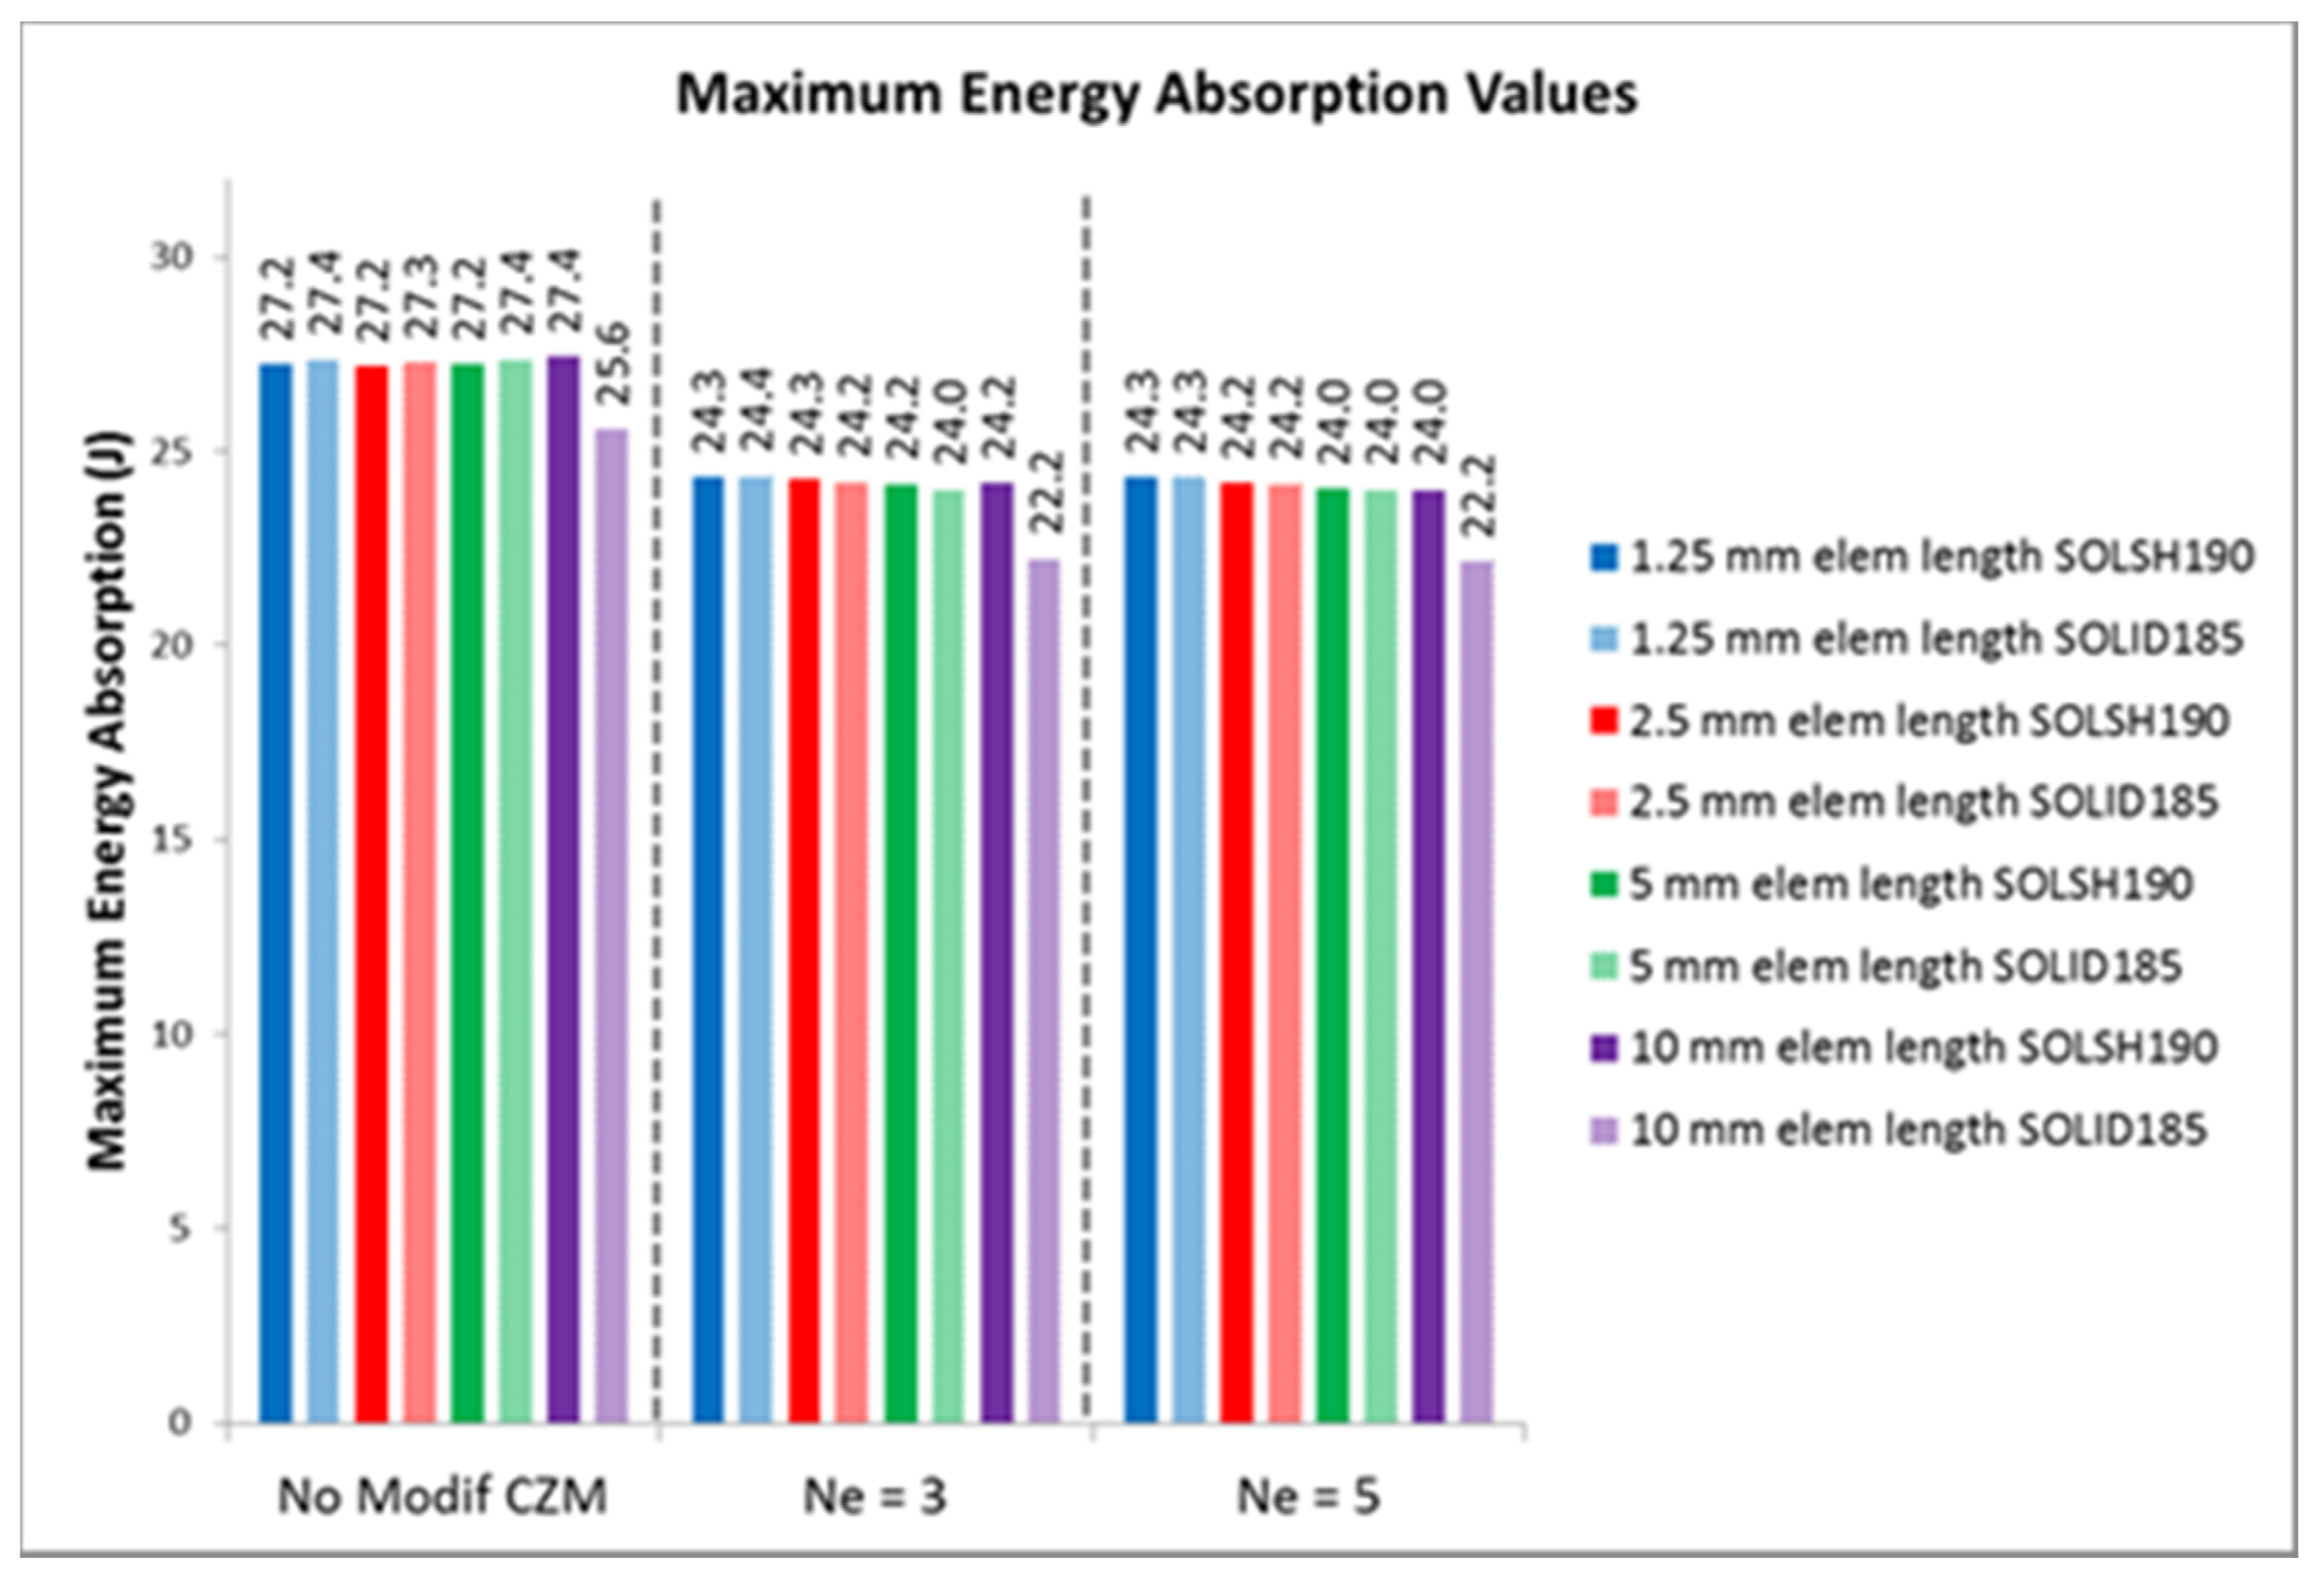
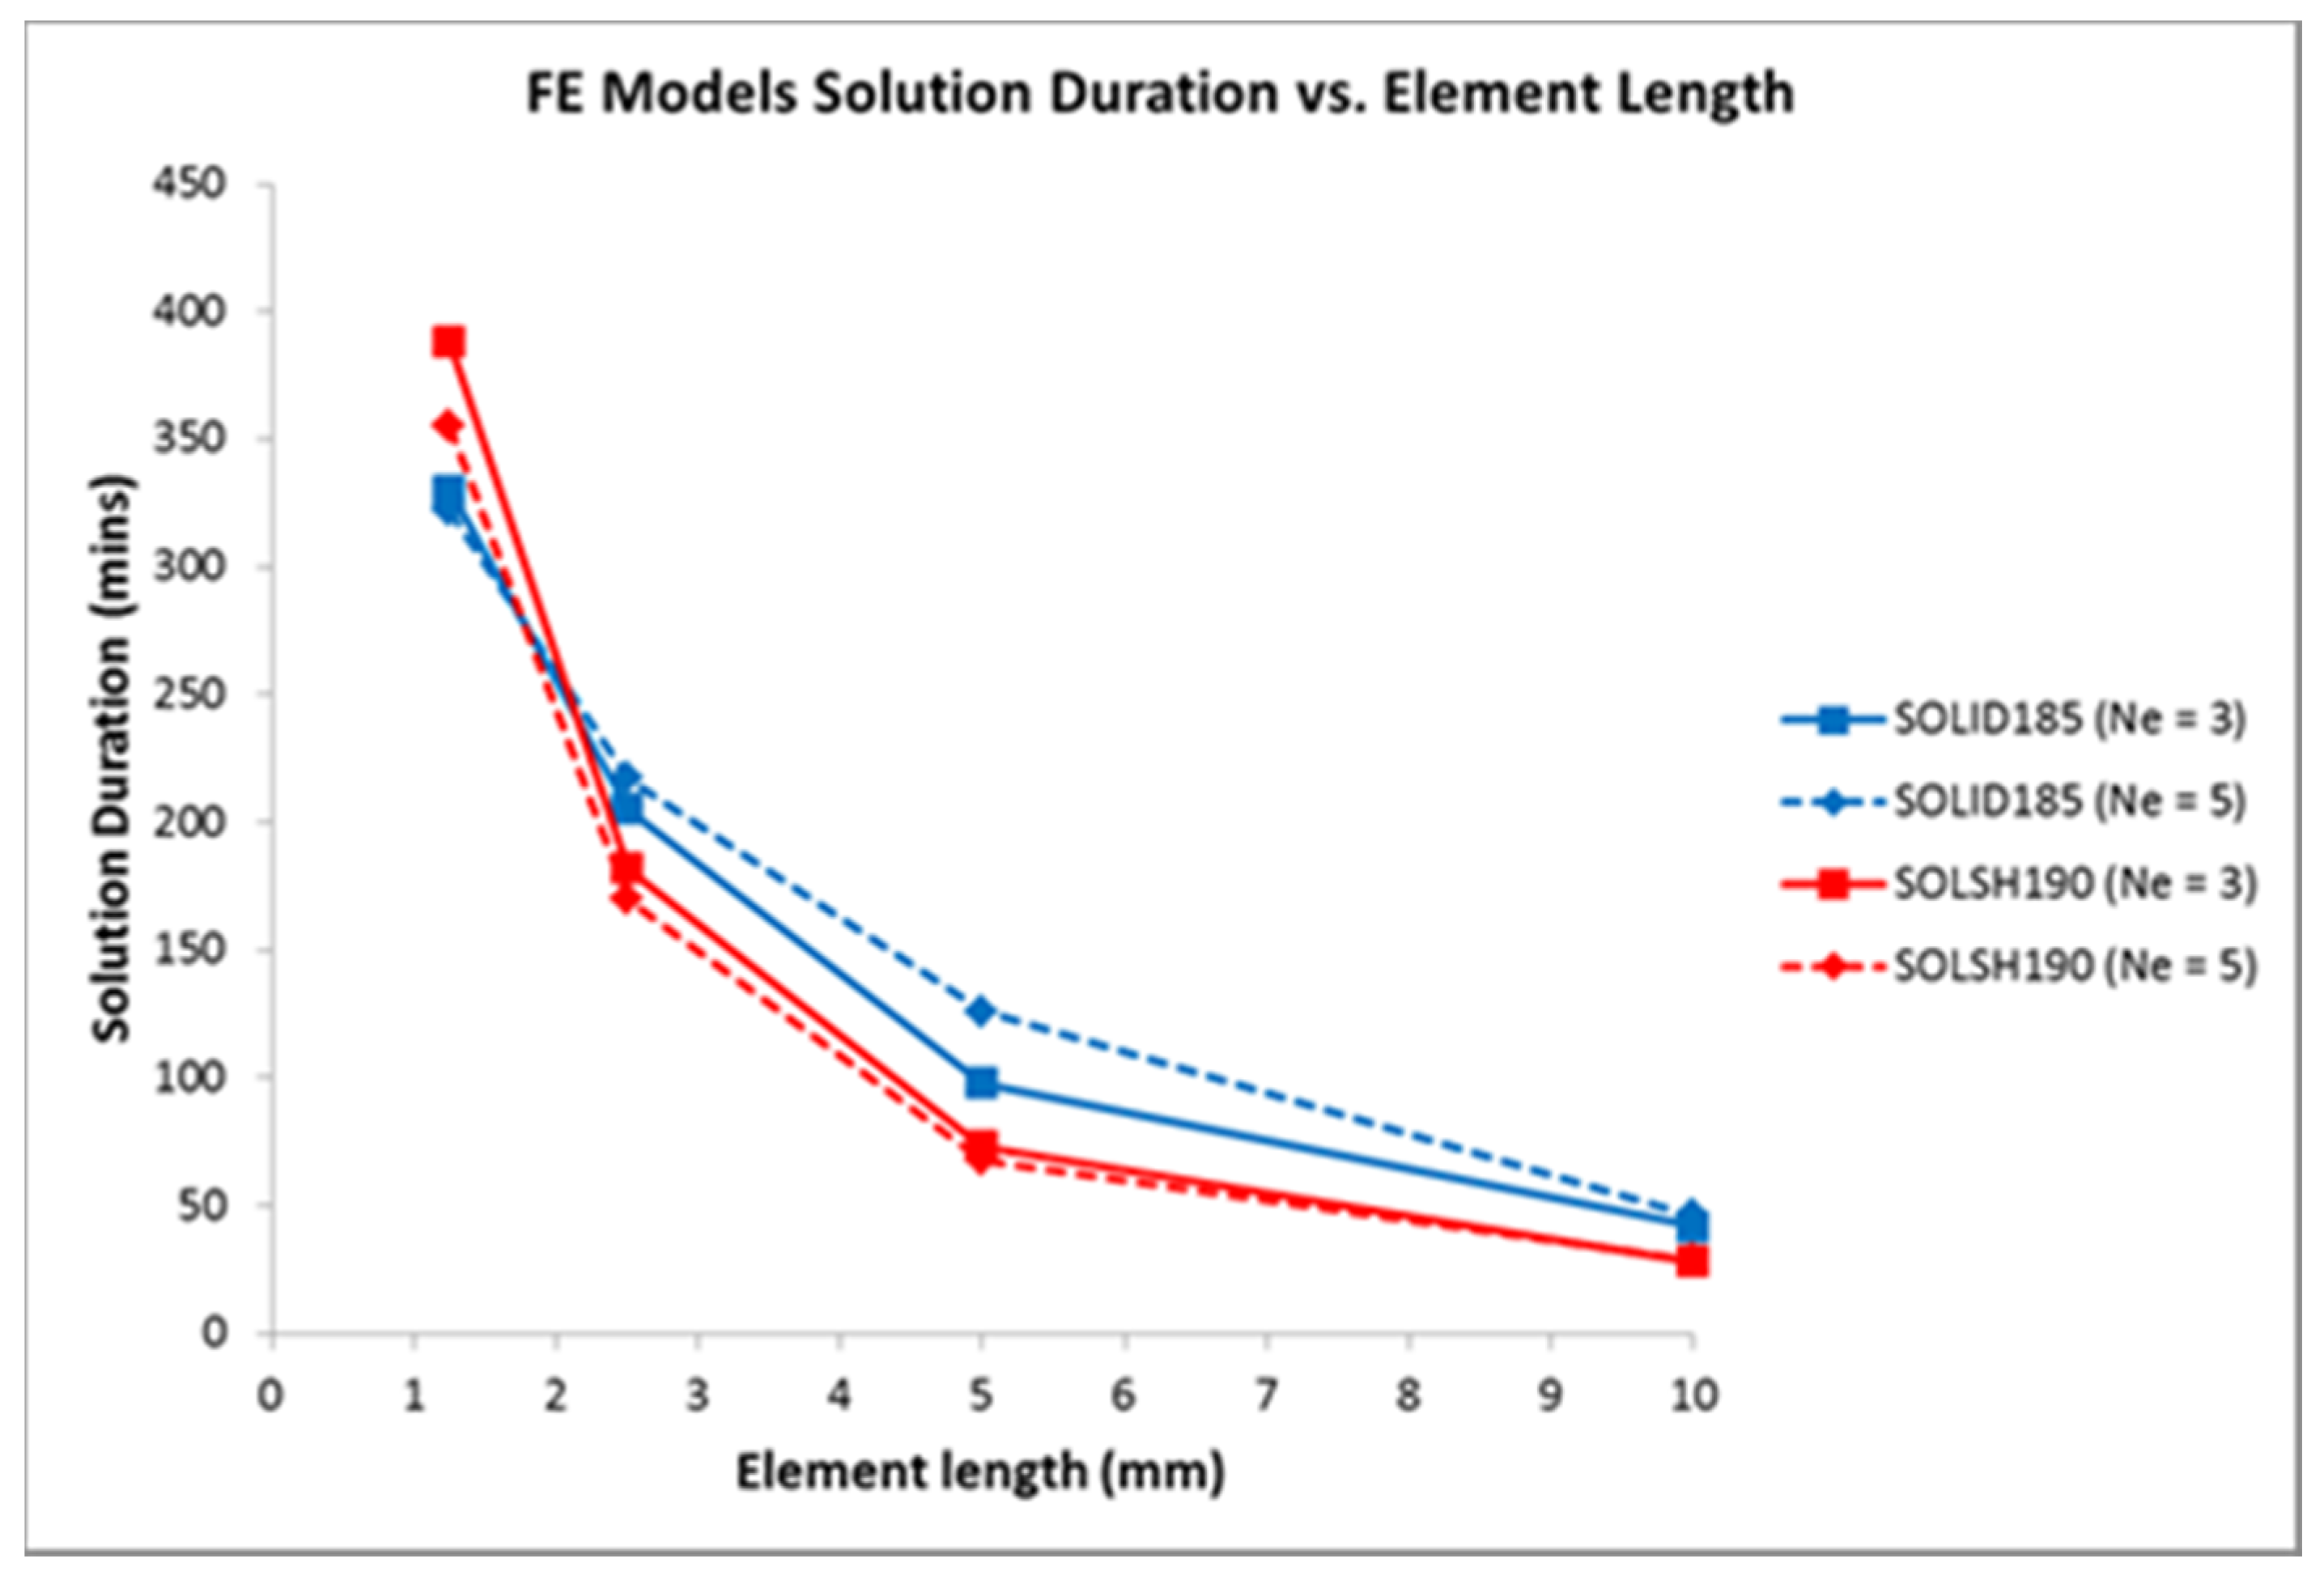
4.2. Additional Numerical Results for the SSCS

Despite the fact that it was not a matter of interest in the reference results used previously, FE results regarding the maximum energy absorbed by the specimen at the 1.5 mm final longitudinal displacement are presented in Figure 7, because energy absorption is an important feature in terms of crashworthy behavior. For both examined element types, the energy absorption predicted follows the same path as the load–displacement curves of Figure 4 and Figure 5, meaning that when the modification of CZM is not used, the resulting maximum value is about 12% higher than when the CZM parameters are modified. Due to the observations previously made during the validation of the FE model, it is safe to conclude that the necessity for CZM modification is also depicted in terms of energy absorption.
A final important feature of the developed FE models, especially when considered in parallel with their ability to predict satisfying results in terms of load–displacement, debonded length and energy absorption even with very coarse meshes, is the total solution duration. This feature is essential, for example, when an engineer wants to obtain useful results when either large workstations are not available or the repetition of multiple cases is needed. Figure 8 presents the evolution of the total computation duration when the modification of CZM is incorporated (both the Ne parameter values are included), in accordance with the mesh coarsening, from 1.25 mm to 10 mm element length. Furthermore, by examining the results from Figure 5, Figure 7 and Figure 8 in parallel, it can be concluded that while accuracy is not compromised (Figure 5 and Figure 7), the solution time is greatly reduced (Figure 8) when the mesh is coarsened and modified CZM is applied. It is impressive that the reduction in solution duration from the finest mesh to the coarsest one is approximately 85–90% (all calculations were performed in a Workstation with a 12-core AMD Ryzen 9 processor, 64 GB of DDR4 RAM and a 500 GB SS Drive).

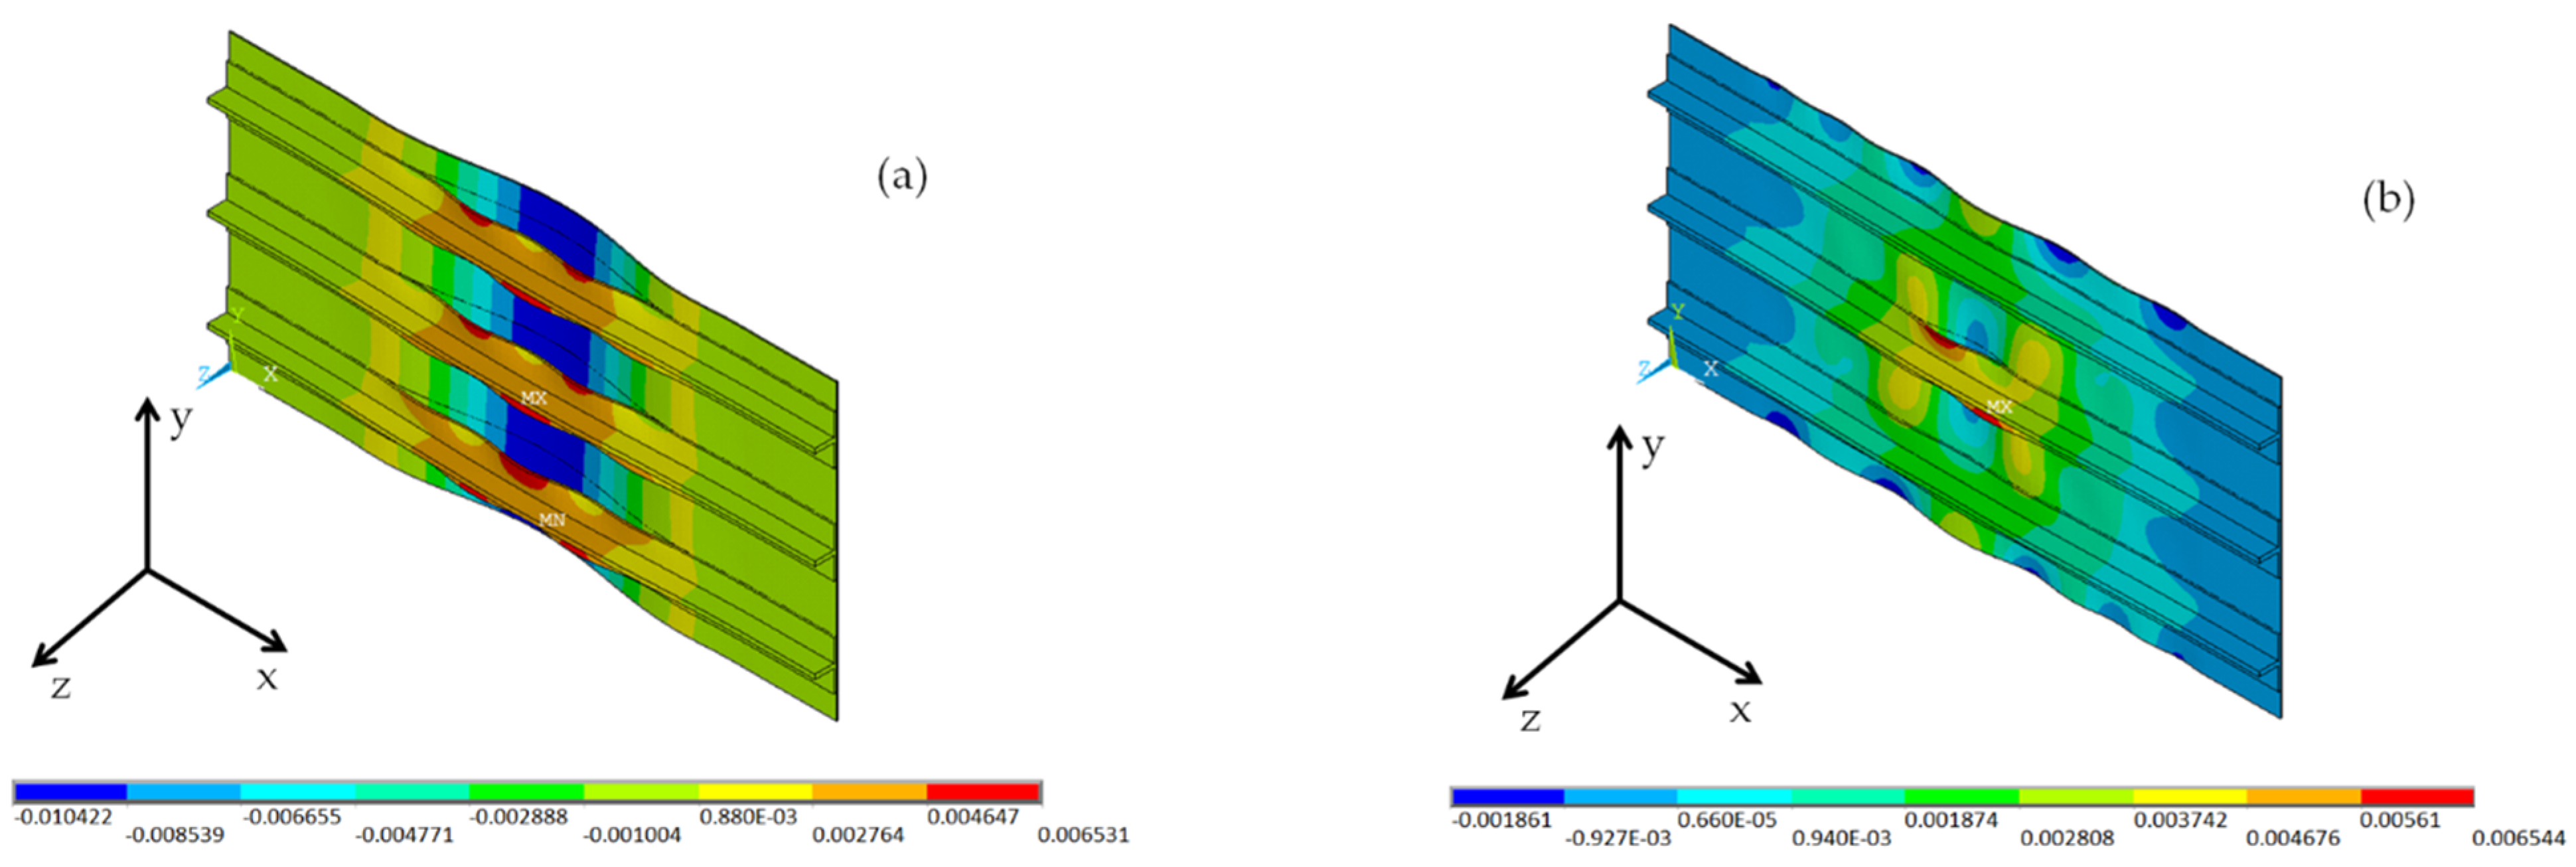
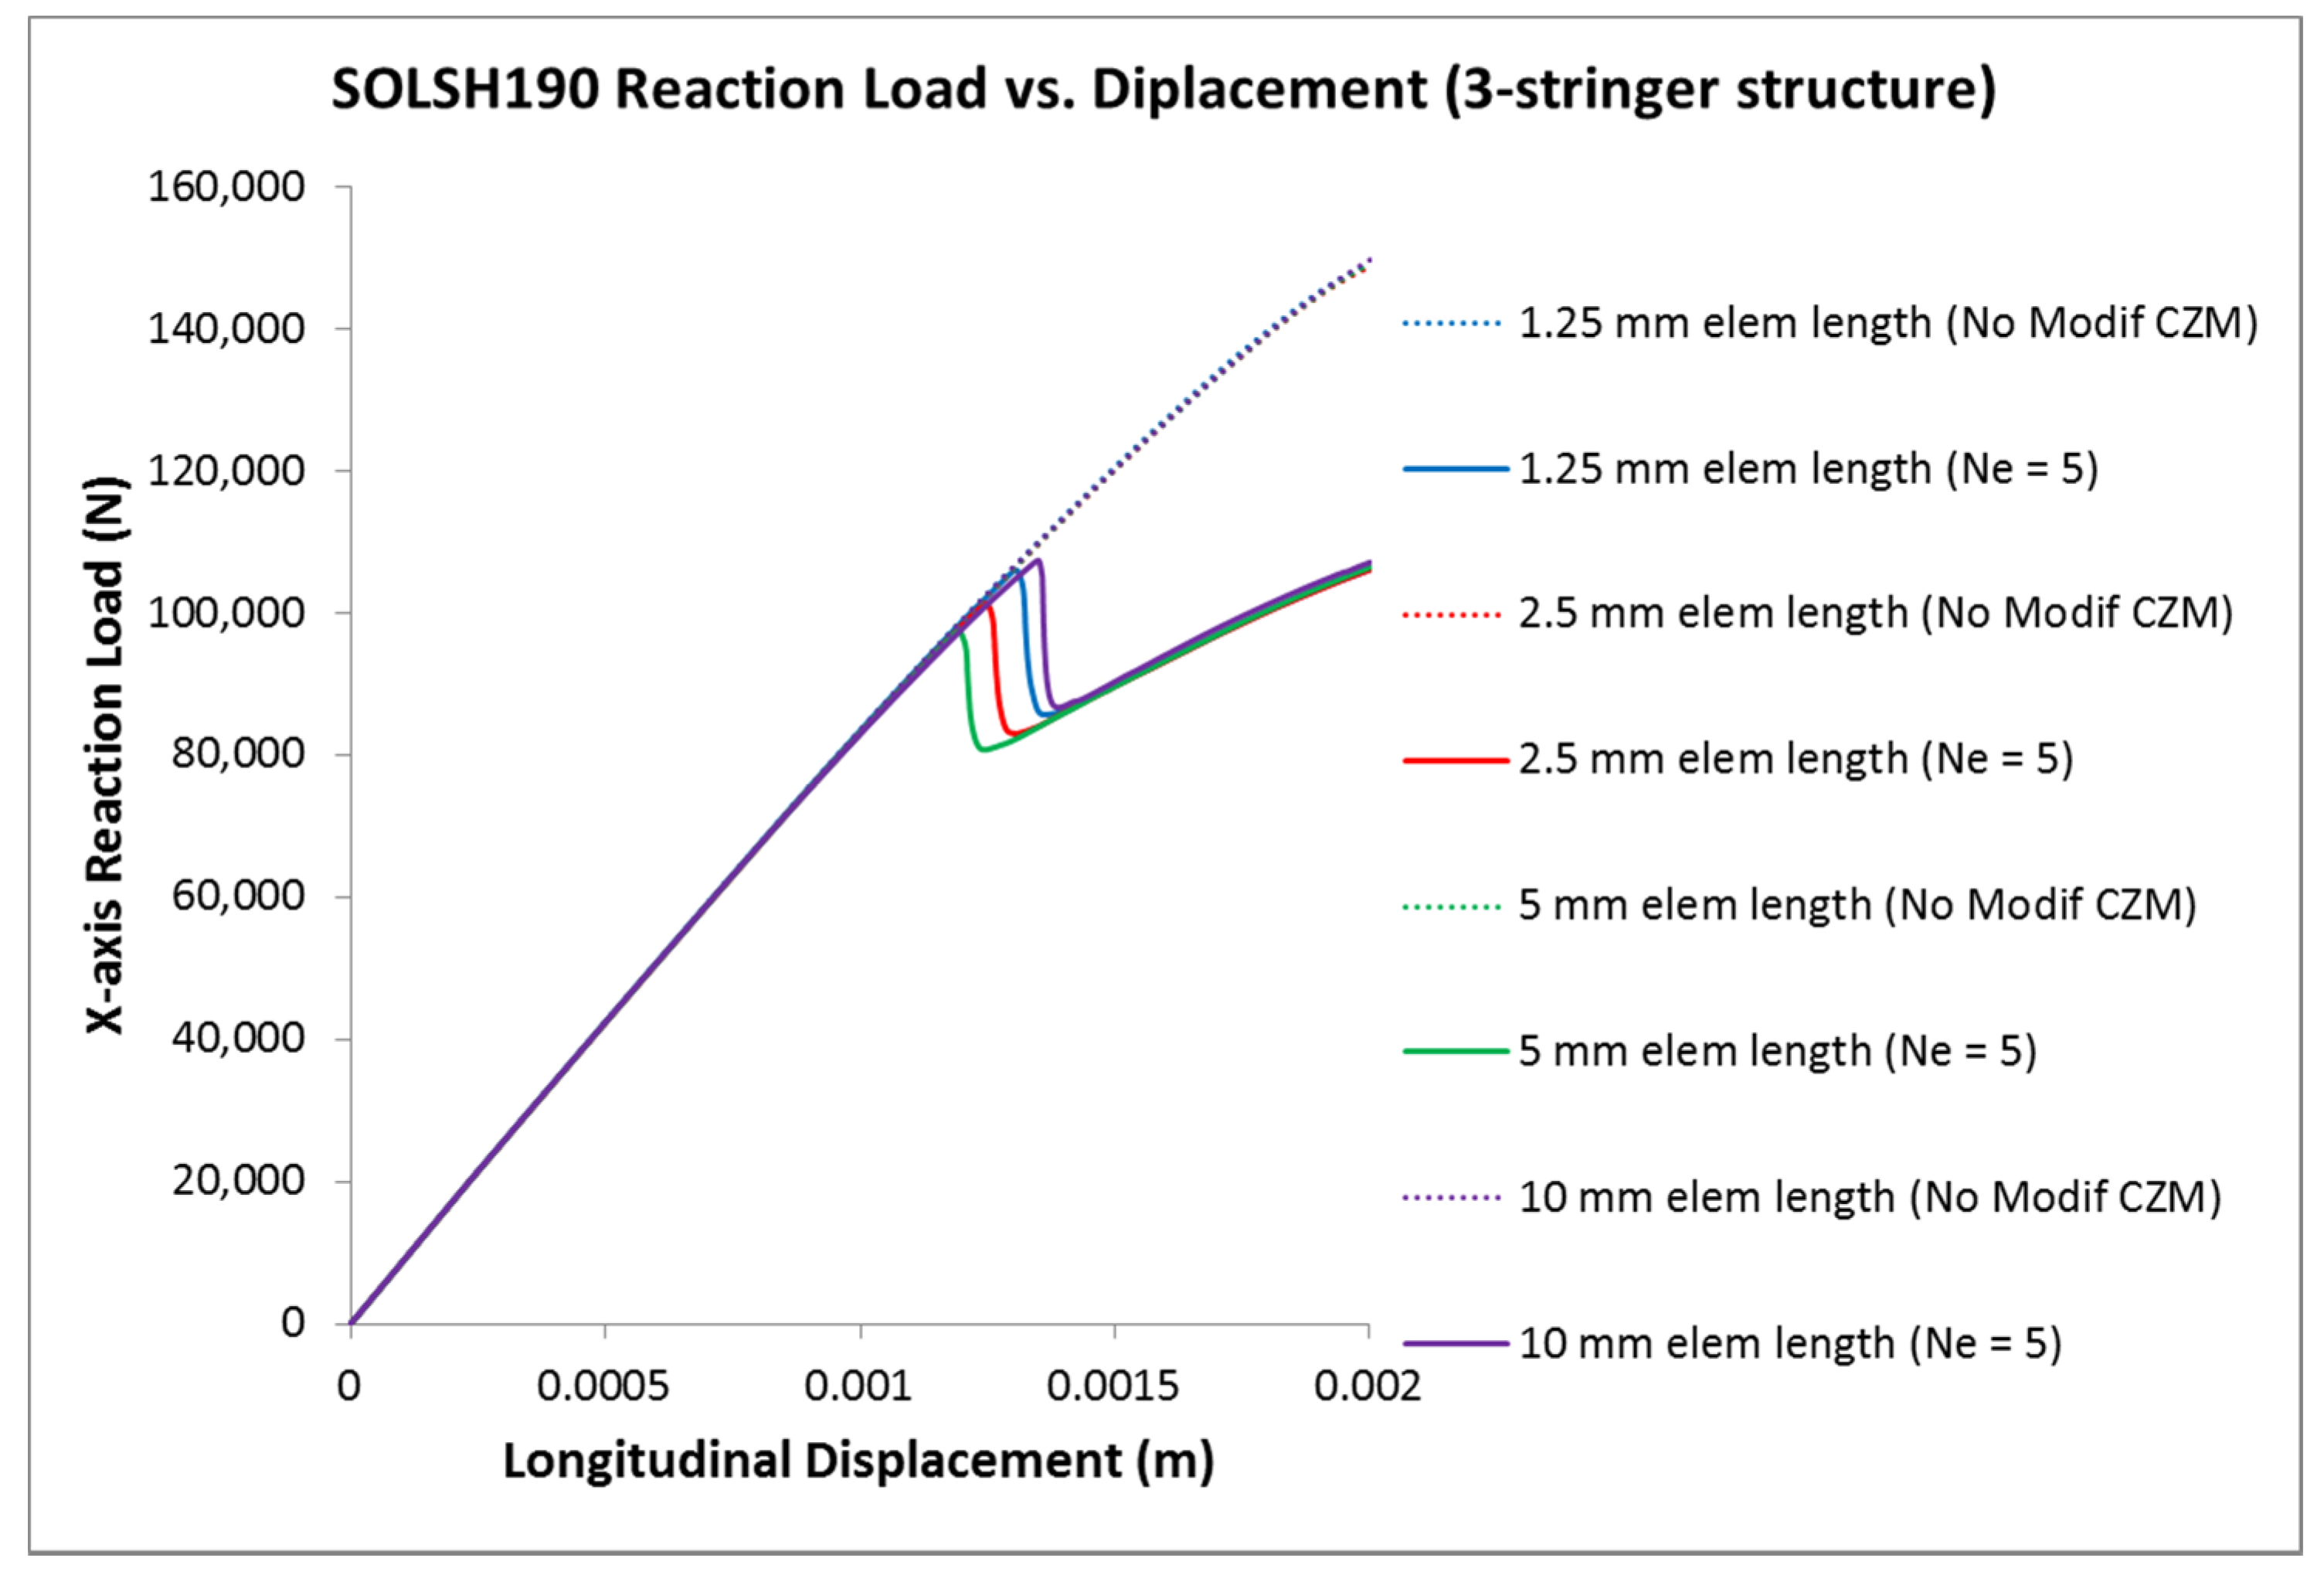
5. Application of Modified CZM to Multi-Stiffened Plate

To explore the applicability and efficiency of the modified CZM method to large-scale structures, a stiffened panel with debonding is examined. This case simply consists of the SSCS specimen multiplied by 3 times, thus building a three-stringer structure. A debonded region equal to the one examined before (80 mm, central), was placed in the central stringer alone, while the other two (stringers) were left fully bonded lengthwise. The boundary conditions at the ends and potting regions of the structure are the same with the SSCS, since the aim is to examine the difference in the results that arise by adding two initially undamaged stringers to the left and right of the initial specimen. In this case, for the skin and stringers, the solid-shell element type SOLSH190 is used, along with unmodified and modified CZM (trial runs showed that similar results are derived for the SOLID185 element as well). The selected parameter is Ne = 5, while all the element lengths of Table 2 are considered. In Figure 9a,b, the contour plots of the out-of-plane displacement for the three-stringer configurations with 5 mm element length are depicted. In Figure 9a, the case where CZM is modified is presented, whereas in Figure 9b, the contour plot of unmodified CZM is shown. It is remarkable that in the model where CZM is modified (Figure 9a), not only has the initially debonded region of the central stiffener buckled and the debonding length has increased, but the same happens for the right and left initially undamaged skin–stringer interfaces. On the contrary, in the case where CZM is not modified and the normal and shear tractions of Bilinear CZM have their nominal values, only the buckling of the initially debonded area is observed (Figure 9b); the debonding length is not increased beyond its initial value and the initially undamaged skin–stiffener interfaces are left intact.
In Figure 10, the load–displacement curves for the three-stringer structure examined are presented, up to an arbitrary longitudinal displacement of 2 mm, only selected for the purpose of the present work. It is easily noticeable that the modified method of CZM operates in the same way as in the SSCS examined before. When CZM is not modified, the load–displacement curves of the different mesh densities of the FE models coincide. On the other hand, when CZM is modified, despite the fact that different maximum normal and shear tractions are assigned to each element length, the results are almost coincident, and the only deviation is at the step that occurs at approximately 1.2–1.3 mm longitudinal displacement, implying sudden debonding in the right and left stringer. Beyond this step, all the curves coincide almost perfectly. The buckling load predicted at the end of the analysis, where no modification of the CZM is applied, compared to the application of the modification is significantly higher (approximately 40%). Even though they are not depicted here, graphs and figures regarding the maximum values of energy absorption, the debonded length at the end of the loading and the total solution duration for this three-stringer structure exhibit behavior and efficiency analogous with the one presented for the SSCS case. More specifically, when CZM modification is not used, the maximum energy absorption value is overestimated by approximately 30%, while the debonded length does not propagate beyond its initial length. Regarding the FE model efficiency in terms of solution duration, when CZM modification is applied, the total solution time is reduced by approximately 200% and 800% for 5 mm and 10 mm element length, respectively, when compared to the finest mesh of 1.25 mm element length.

6. Conclusions

In this work, an engineering approach from the literature, aimed at adapting Bilinear CZMs to the desired mesh size by modifying the parameters of maximum normal and shear tractions, is employed for the investigation of a single-stringer composite specimen under buckling deformation with initial debonding. The results achieved using an FE model are compared to the experimental and numerical results of other debonding analysis methods (VCCT); the necessity of CZM modification according to the mesh size of the model is highlighted in terms of load–displacement, the prediction of debonding propagation beyond the initial length and energy absorption. Moreover, the accuracy achieved even with the coarse meshes examined, in addition to the reduction in the solution time needed, demonstrates the efficiency of the FE model in terms of computational resources. The FEA of an additional multi-stringer, stiffened plate exhibited results with trends analogous to the single-stringer case, thus exhibiting the capability of the FE model proposed to be used in the analysis of larger and more complex structures. Consequently, the present model is proved to be a useful tool during FEAs, especially in the initial stages, where, starting from a coarse mesh, continuous refinement along with convergence monitoring is performed in order to select the most appropriate mesh size for the specific case. To achieve meaningful results for every mesh size examined, a model such as the proposed one is necessary. However, it is remarked that the case of stiffened panels investigated in the present manuscript was selected as a representative case of a lot of aircraft structures with buckling phenomena accompanied by debonding propagation. Continuing work in the direction of studying more correspondingly complex structural problems in the frame of CZM modification techniques is highly beneficial for the establishment of these methods in a wider range of cases.

Author Contributions

Conceptualization, D.G.S.; data curation, V.K.M.; formal analysis, V.K.M.; investigation, V.K.M. and D.G.S.; methodology, V.K.M. and D.G.S.; resources, V.K.M.; supervision, D.G.S.; validation, V.K.M.; visualization, V.K.M.; writing—original draft, V.K.M.; writing—review and editing, V.K.M. and D.G.S. All authors have read and agreed to the published version of the manuscript.

Funding

This research received no external funding.

Institutional Review Board Statement

Not applicable.

Informed Consent Statement

Not applicable.

Data Availability Statement

Not applicable.

Conflicts of Interest

The authors declare no conflict of interest.

References

  1. Xu, J.; Zhao, Q.; Qiao, P. A critical review on buckling and post-buckling analysis of composite structures. Front. Aerosp. Eng. 2013, 2, 157–168. [Google Scholar]
  2. Milazzo, A.; Oliveri, V. Post-buckling analysis of cracked multilayered composite plates by pb-2 Rayleigh–Ritz method. Compos. Struct. 2015, 132, 75–78. [Google Scholar] [CrossRef]
  3. Groh, R.; Avitabile, D.; Pirrera, A. Generalised path-following for well-behaved nonlinear structures. Comput. Methods Appl. Mech. Eng. 2018, 331, 394–426. [Google Scholar] [CrossRef]
  4. Liguori, F.S.; Zucco, G.; Madeo, A.; Garcea, G.; Leonetti, L.; Weaver, P.M. An isogeometric framework for the optimal design of variable stiffness shells undergoing large deformations. Int. J. Solids Struct. 2021, 210–211, 18–34. [Google Scholar] [CrossRef]
  5. Lanzi, L. A numerical and experimental investigation on composite stiffened panels into post-buckling. Thin-Walled Struct. 2004, 42, 1645–1664. [Google Scholar] [CrossRef]
  6. Bisagni, C. Numerical analysis and experimental correlation of composite shell buckling and post-buckling. Compos. Part B Eng. 2000, 31, 655–667. [Google Scholar] [CrossRef]
  7. Dębski, H.; Teter, A.; Kubiak, T.; Samborski, S. Local buckling, post-buckling and collapse of thin-walled channel section composite columns subjected to quasi-static compression. Compos. Struct. 2016, 136, 593–601. [Google Scholar] [CrossRef]
  8. ANSYS© Mechanical APDL. Release 19.2, Help System; Fracture Analysis Guide; ANSYS Inc.: Canonsburg, PA, USA, 2020. [Google Scholar]
  9. Orifici, A.; Alberdi, I.O.D.Z.; Thomson, R.S.; Bayandor, J. Compression and post-buckling damage growth and collapse analysis of flat composite stiffened panels. Compos. Sci. Technol. 2008, 68, 3150–3160. [Google Scholar] [CrossRef] [Green Version]
  10. Bisagni, C. Progressive delamination analysis of stiffened composite panels in post-buckling. In Proceedings of the 47th AIAA/ASME/ASCE/AHS/ASC Structures, Structural Dynamics and Materials Conference, Newport, RI, USA, 1–4 May 2006; American Institute of Aeronautics and Astronautics: Reston, VA, USA, 2006. [Google Scholar] [CrossRef]
  11. Riccio, A.; Raimondo, A.; Scaramuzzino, F. A robust numerical approach for the simulation of skin–stringer debonding growth in stiffened composite panels under compression. Compos. Part B Eng. 2015, 71, 131–142. [Google Scholar] [CrossRef]
  12. Zou, D.; Bisagni, C. Skin-stiffener separation in T-stiffened composite specimens in postbuckling condition. J. Aerosp. Eng. 2018, 31, 04018027. [Google Scholar] [CrossRef] [Green Version]
  13. Raimondo, A.; Doesburg, S.; Bisagni, C. Numerical study of quasi-static and fatigue delamination growth in a post-buckled composite stiffened panel. Compos. Part B Eng. 2020, 182, 107589. [Google Scholar] [CrossRef]
  14. Zhao, L.; Wang, K.; Ding, F.; Qin, T.; Xu, J.; Liu, F.; Zhang, J. A post-buckling compressive failure analysis framework for composite stiffened panels considering intra-, inter-laminar damage and stiffener debonding. Results Phys. 2019, 13, 102205. [Google Scholar] [CrossRef]
  15. Bisagni, C.; Vescovini, R.; Davila, C.G. Single-stringer compression specimen for the assessment of damage tolerance of postbuckled structures. J. Aircr. 2011, 48, 495–502. [Google Scholar] [CrossRef]
  16. Vescovini, R.; Dávila, C.; Bisagni, C. Failure analysis of composite multi-stringer panels using simplified models. Compos. Part B Eng. 2013, 45, 939–951. [Google Scholar] [CrossRef]
  17. Yetman, J.E.; Sobey, A.J.; Blake, J.I.R.; Shenoi, R.A. Investigation into skin stiffener debonding of top-hat stiffened composite structures. Compos. Struct. 2015, 132, 1168–1181. [Google Scholar] [CrossRef] [Green Version]
  18. Álvarez, D.; Blackman, B.; Guild, F.; Kinloch, A. Mode I fracture in adhesively-bonded joints: A mesh-size independent modelling approach using cohesive elements. Eng. Fract. Mech. 2014, 115, 73–95. [Google Scholar] [CrossRef] [Green Version]
  19. Gliszczynski, A.; Samborski, S.; Wiacek, N.; Rzeczkowski, J. Mode I interlaminar fracture of glass/epoxy unidirectional laminates. Part II: Numerical analysis. Materials 2019, 12, 1604. [Google Scholar] [CrossRef] [PubMed] [Green Version]
  20. Harper, P.W.; Hallett, S.R. Cohesive zone length in numerical simulations of composite delamination. Eng. Fract. Mech. 2008, 75, 4774–4792. [Google Scholar] [CrossRef] [Green Version]
  21. Turon, A.; Dávila, C.; Camanho, P.; Costa, J. An engineering solution for mesh size effects in the simulation of delamination using cohesive zone models. Eng. Fract. Mech. 2007, 74, 1665–1682. [Google Scholar] [CrossRef]
  22. Turon, A.; Camanho, P.; Costa, J.; Renart, J. Accurate simulation of delamination growth under mixed-mode loading using cohesive elements: Definition of interlaminar strengths and elastic stiffness. Compos. Struct. 2010, 92, 1857–1864. [Google Scholar] [CrossRef]
  23. Mantzaroudis, V.K.; Stamatelos, D.G. Development of an efficient finite element model for the analysis of buckling, debonding and collapse characteristics of composite stiffened panels under compressive loading. In Proceedings of the International Symposium on Aircraft Technology, MRO & Operations 2021, Budapest, Hungary, 28–30 June 2021; Springer Nature: Cham, Switzerland, 2021. (under publication). [Google Scholar]
Figure 1. Single-stringer compression specimen geometry used as a reference point [9].
Computation 10 00005 g001
Figure 2. Typical FE model of the studied SSCS.
Computation 10 00005 g002
Figure 3. (a,b) FE contour plot of the out-of-plane displacement at the end of the loading when (a) the maximum normal and shear traction parameters are modified and (b) when they are not.
Computation 10 00005 g003
Figure 4. Comparison of the load–displacement curves for SOLSH190 when modified CZM is applied, with experimental and numerical from the literature.
Computation 10 00005 g004
Figure 5. Load–displacement curves for different element types and element sizes.
Computation 10 00005 g005
Figure 6. Comparison of FE results (5 mm element length) regarding the final debonding length with experimental and numerical ones from the literature.
Computation 10 00005 g006
Figure 7. FE results of the maximum energy absorption values of the specimen examined.
Computation 10 00005 g007
Figure 8. Solution duration according to the element length used.
Computation 10 00005 g008
Figure 9. (a,b) FE contour plot of the out-of-plane displacement, when modification of the maximum normal and shear traction parameters of the CZM is used and when is not used, for a 3-stringer structure case.
Computation 10 00005 g009
Figure 10. Load–displacement curves of the 3-stringer structure for element type SOLSH190.
Computation 10 00005 g010
Table 1. Geometric characteristic and material properties of the SSCS examined.
Geometric CharacteristicValueMaterial PropertyValue
Total length, L (mm)400E11 (GPa)147.8
Free length, Lf (mm)300E22 = E33 (GPa)11.8
Width, b (mm)64G12 = G13 (GPa)6
Skin lay-up[90/±45/0]sG23 (GPa)4
Stiffener flange lay-up[06/±453]v12 = v130.3
Stiffener web lay-up[±453/06]sv230.45
Ply thickness, t (mm)0.125Max normal traction (mode I) (MPa)50
Total stiffener height, h (mm)14Max shear traction (mode II) (MPa)100
Stiffener flange width, w (mm)32GIc (J/m2)243
Debonded length (mm)80GIIc = GIIIc (J/m2)514
Table 2. Bilinear CZM parameters.
Element TypeElement LengthCZM ModificationCZM Max Normal Traction (MPa)CZM Max Shear Traction (MPa)
SOLID185
SOLSH190
1.25 mm
(17,280 elements)
No CZM Modification50100
CZM Modification (Ne = 3)2637.8
CZM Modification (Ne = 5)20.129.3
SOLID185
SOLSH190
2.5 mm
(8640 elements)
No CZM Modification50100
CZM Modification (Ne = 3)18.426.7
CZM Modification (Ne = 5)14.220.7
SOLID185
SOLSH190
5 mm
(4320 elements)
No CZM Modification50100
CZM Modification (Ne = 3)1318.9
CZM Modification (Ne = 5)10.114.6
SOLID185
SOLSH190
10 mm
(2160 elements)
No CZM Modification50100
CZM Modification (Ne = 3)9.213.4
CZM Modification (Ne = 5)7.110.4
Publisher’s Note: MDPI stays neutral with regard to jurisdictional claims in published maps and institutional affiliations.

