1. Introduction
Sufficient friction between tires and pavement plays a crucial role on the safety of road users as the ability to accelerate, brake and steer a vehicle is impacted by the friction properties of the pavement’s surface. Safety is dependent on decreases in vehicle braking distance, which is expected to prevent crashes. For instance, it has been found that skidding contributes to up to 35% of wet-weather crashes in the US [
1], where 70% of those crashes could have been prevented by improved pavement friction [
2]. In addition, it has been reported that about 14% of fatal crashes and 25% of all crashes occurred on wet road conditions [
3].
Pavement friction is a function of micro- and macrotexture, having an influential impact on roadway safety [
4]. The microtexture of pavement surfaces refers to the small-scale of pavement aggregate surfaces, which achieve the required adhesion between tires and the pavement’s surface. The macrotexture of the pavement surface represents the large-scale texture due to aggregate particle arrangements.
In dry conditions, adhesion between a tire and the pavement is at a maximum, whereas in wet conditions, adhesion is reduced significantly. Hence, macrotexture properties are important in wet-weather conditions to provide appropriate drainage paths of water beneath the tire; therefore, the adhesive component of friction provided by the microtexture can be re-established. Therefore, skid resistance plays an important role, especially during less-than-optimal weather and roadway conditions.
Most state highway agencies consider a friction metric to quantify skid resistance on pavement surfaces. The friction number (FN), also known as skid resistance number (SN), is considered the most common index, being determined from a locked-wheel friction tester (ASTM E 274). SN or FN is measured at a constant speed of 40 mph and within a predefined length of road, using (R) ribbed or (S) smooth tires. At the early age of pavements, skid resistance exhibits high FN values (greater than 55).
However, pavement friction deteriorates due to age-related factors such as traffic, age and temperature [
5], and consequently, pavement friction is expected to deteriorate, impacting the safety of pavement. For instance, based on the long-term pavement performance (LTPP), it has been shown that pavement friction reduces for both Portland cement concrete (PCC) and asphalt concrete (AC) pavements, with a higher degree for asphalt pavement [
6].
As a result, understanding changes in pavement friction is of critical importance for maintaining the safety of roadways. The friction performance of pavement allows for defining the minimum skid resistance thresholds to promote safety. Two common thresholds have been considered for addressing friction. The first category is the investigatory level, which represents a flagged amount of friction at which an agency should start monitoring skid resistance and related crashes.
The second threshold of pavement friction is the intervention level (i.e., the lowest acceptable level), at which an agency must take immediate action to restore skid resistance. However, the main components of friction over time and under various environmental conditions lose their characteristics as well as the friction needed between a tire and the road, which can be observed from various friction datasets. Ahammed (2009) recommended addressing historical resistance performance and affecting factors to define the effectiveness of friction properties on friction-related crashes and to define appropriate threshold values for managing the road network [
7].
Studies have been conducted to evaluate the impacts of various factors on pavement friction characteristics, a few of which are outlined by the following paragraphs. Pavement friction can vary seasonally on a short term basis based on factors such as temperature, rainfall and surface contamination [
8], or on a long term due to traffic resulting in wear and polishing the surface by traffic or environmental factors [
9]. Grooved and tined surfaces maintained regularly provide higher friction over time, and the quality of aggregates is an important factor for asphalt pavement friction [
9].
Panel data analysis of the surface skid resistance of various pavement maintenance treatments using LTPP was evaluated [
10]. Various treatments including thin overlays, slurry seals, cracked seals and chipped seals were considered. Precipitation, freezing index, humidity, traffic and pavement age were found to be important in predicting pavement friction.
Long-term monitoring friction coefficients for various asphalt pavement surfaces were used [
11]. The factors impacting the coefficients of friction were found to be the age of wearing course, traffic intensity and weather conditions.
In another study, average temperature and the age of installation were some factors impacting skid resistance [
10]. Regression analysis was used in another study to model seasonal variations of pavement skid resistance [
12].
The performance of skid resistance was also addressed from other correlated performance indices [
13]. In that study, the measured average SN was seen to be significantly lower on relatively rougher pavement sections. In another study, friction trends (side force coefficient) with traffic levels (ESAL) and pavement aging for Italian highways were investigated [
14]. The data combined roughness and macrotexture. Prediction models were developed to predict the friction number considering independent variables. Most of the implemented models in the literature are empirical in nature and depend on the surrounding conditions, including texture depths, tire properties and water film thickness [
15].
Finite elements were used to study skid resistance under hot weather conditions [
16]. In that study, a thermo-mechanical tire-pavement interaction model was developed, and consequently, the FE model quantified the effects of factors such as speed, inflation pressure, wheel load and ambient temperature on skid resistance/braking distance.
In another study, a link between ski resistance and macro- and micro-texture was found [
17]. The results highlight that, under the effect of cumulative traffic, macrotexture and skid resistance start presenting an inverse trend.
The parameters influencing the measurement and modeling of the skid resistance of asphalt pavement were evaluated in another study [
18]. The results show that the frictional performance of asphalt pavement is satisfactory when using recycled materials in the surface course instead of conventional ones.
Although studies have been conducted to investigate the impact of various environmental factors, the multiplicative impacts of various factors have been ignored in the literature. Are the impacts of various environmental factors on the friction of pavement stable, or do they vary based on the pavement type? Is the impact of pavement aging constant, or does it vary based on pavement type?
The current study is one of the earliest studies that look at the complex relationship between different factors and pavement friction. The findings might provide policy makers with more reliable ways of addressing the deterioration of pavement friction. Pavement friction is a complex phenomenon, which is expected to be influenced by different factors, including traffic and various environmental factors. However, the relationships between those factors and pavement friction are not necessarily stable, and thus, the current work was conducted to study various design factors including age, precipitation, temperature and pavement types, while considering all pairwise interaction terms.
2. Theoretical Model
The description of this section is heavily based on the work in the literature review [
19]. The process of the generalized linear mixed model (GLMM) can be summarized as defining the objective function and consequently using an optimizer to solve it. During the process, matrices of
Z, or a term-wise matrix of random effects,
, or a term-wise relative covariance factor, are created. For instance, the matrix of
Z is defined as
, where
is Khatri–Rao, which can be written based on Kronecker products
,
J is the random parameter grouping factor indices, and
x is an explanatory variable.
The objective function minimizes the penalized least square, so the parameters are estimated while minimizing the objective function. The objective function can be written as:
where
W is the weight matrix, and in the above,
and thus,
, where
u is the specific value of a random effect, and other parameters are defined before. For the GLMM, the modification can be made to highlight how the univariate and conditional distributions are formed and how
depends on
u.
Now, the penalized least square is used as a probability mass function (PMF) of the Poisson model, which is needed for maximum likelihood estimation.
Here, the penalized least square (PLS) algorithm uses a vector of covariance parameters of , and it returns the profiled deviance in the form of -2likelihood. The process can be summarized as: (A) updating , which is used to update the Cholesky factor of and can also be called a spars double lower-triangular matrix; (B) solving the normal equations for finding the fixed effects coefficients and the conditional mode of . Now that the parameters are estimated, the linear predictors and residuals are updated.
The likelihood in a general term can be written as , where with some algebra, the likelihood is simplified for estimating the parameters, where B (b) is the random effects with a variance covariance matrix of , which is based on and various standard deviations (SD), e.g., intercept. The variance of B is . Moreover, for the GLMM model, , such that .
Laplace approximation is used to approximate the deviance of the model. The sparse Cholesky factor,
L, is used to evaluate the update as
where
is the diagonal Jacobian matrix.
P is the fill-reducing
permutation from
Z.
Now, the negative of twice the log-likelihood corresponds to
where the deviance of
y and
is
. As can be seen from above equation,
depends on
and consequently on
and
. As a result, during the process of minimizing of the above equations, parameters including
are estimated. Moreover, it is clear that, based on various models’ distributions, the formulations of
vary. In summary, the model parameters are estimated by the minimization of the penalized least square (PLS).
At each step, after estimating the parameters,
is estimated as log (
) and consequently as
. Here,
is estimated as
. During the process, the update of one parameter impacts the estimations of the other parameters. In summary, the process is for solving the equation of
where
is the relative covariance factor,
is the term-wise random effect,
is a covariance parameter,
is the cross product of the fixed effects,
is the cross-product of the fixed effect and
L is defined before.
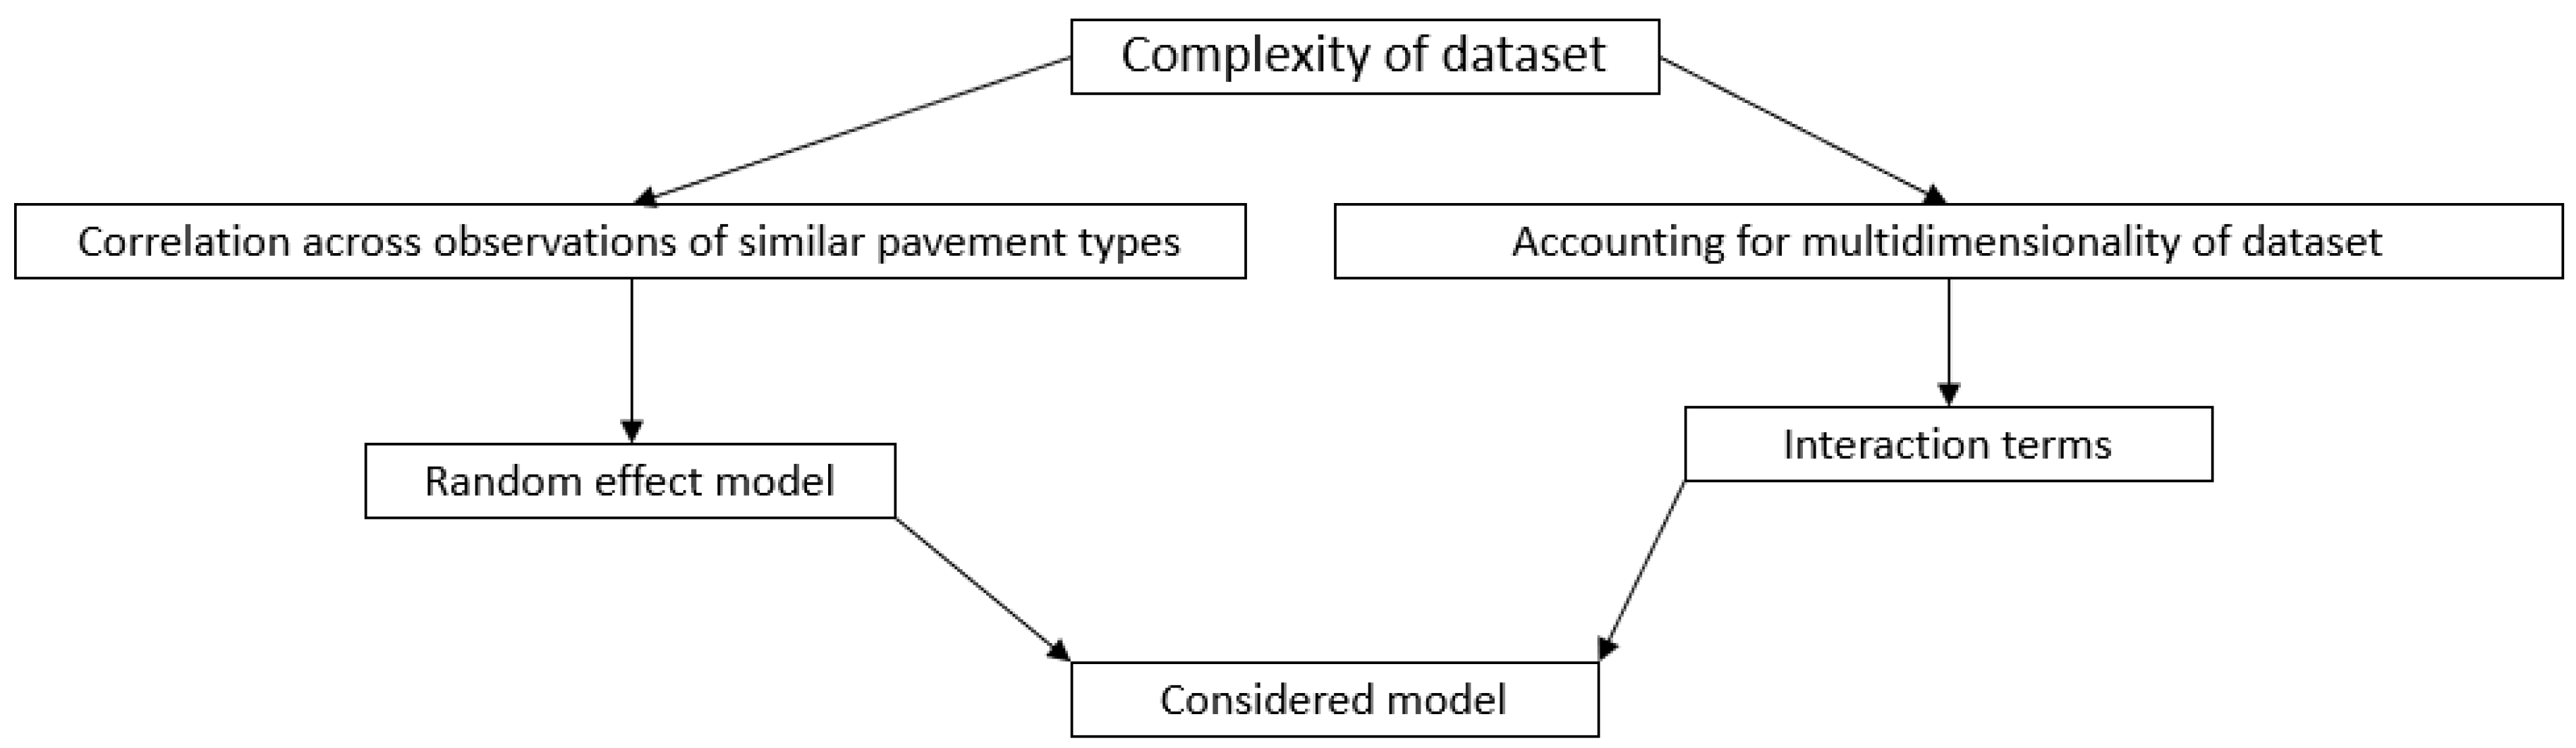
Finally, to highlight the process of the analysis,
Figure 1 is provided to provide better insight regarding accounting for the multidimensionality of the dataset and also for correlations across observations related to similar categories.
3. Data
Friction information was obtained from the national database, containing records of all friction, such as weather, IDs of experiments and whether the roadway experienced any maintenance process during its life span. The LTPP is the major research area of the Strategic Highway Research Program (SHRP) throughout North America. The collected data include information on seven modules: Inventory, Maintenance, Monitoring (Deflection, Distress and Profile), Rehabilitation, Materials Testing, Traffic and Climatic [
17].
The objective of the LTPP study was to extend in-service pavement in the US and Canada under various pavement materials and various environmental conditions, such as temperature, traffic and various maintenance practices. The LTPP study was specially designed to evaluate the effectiveness of various treatments such as thin overlays, slurry crack sealing, and chip sealing.
For LTPP program sites, the friction information is available for 53 sites due to voluntary aspects of the agencies. Here, we considered the control segments, which did not experience any treatment. In other words, to be consistent, all observations that experienced some forms of maintenance, e.g., chip sealing, during their life span were excluded from the dataset. To have a fair comparison, and as the objective of this study was not to evaluate the effects of those treatments on the friction of pavement, all pavements that experienced any type of treatment were excluded from this study. This resulted in 3871 observations across 655 sites, out of 8447 observations included in the dataset.
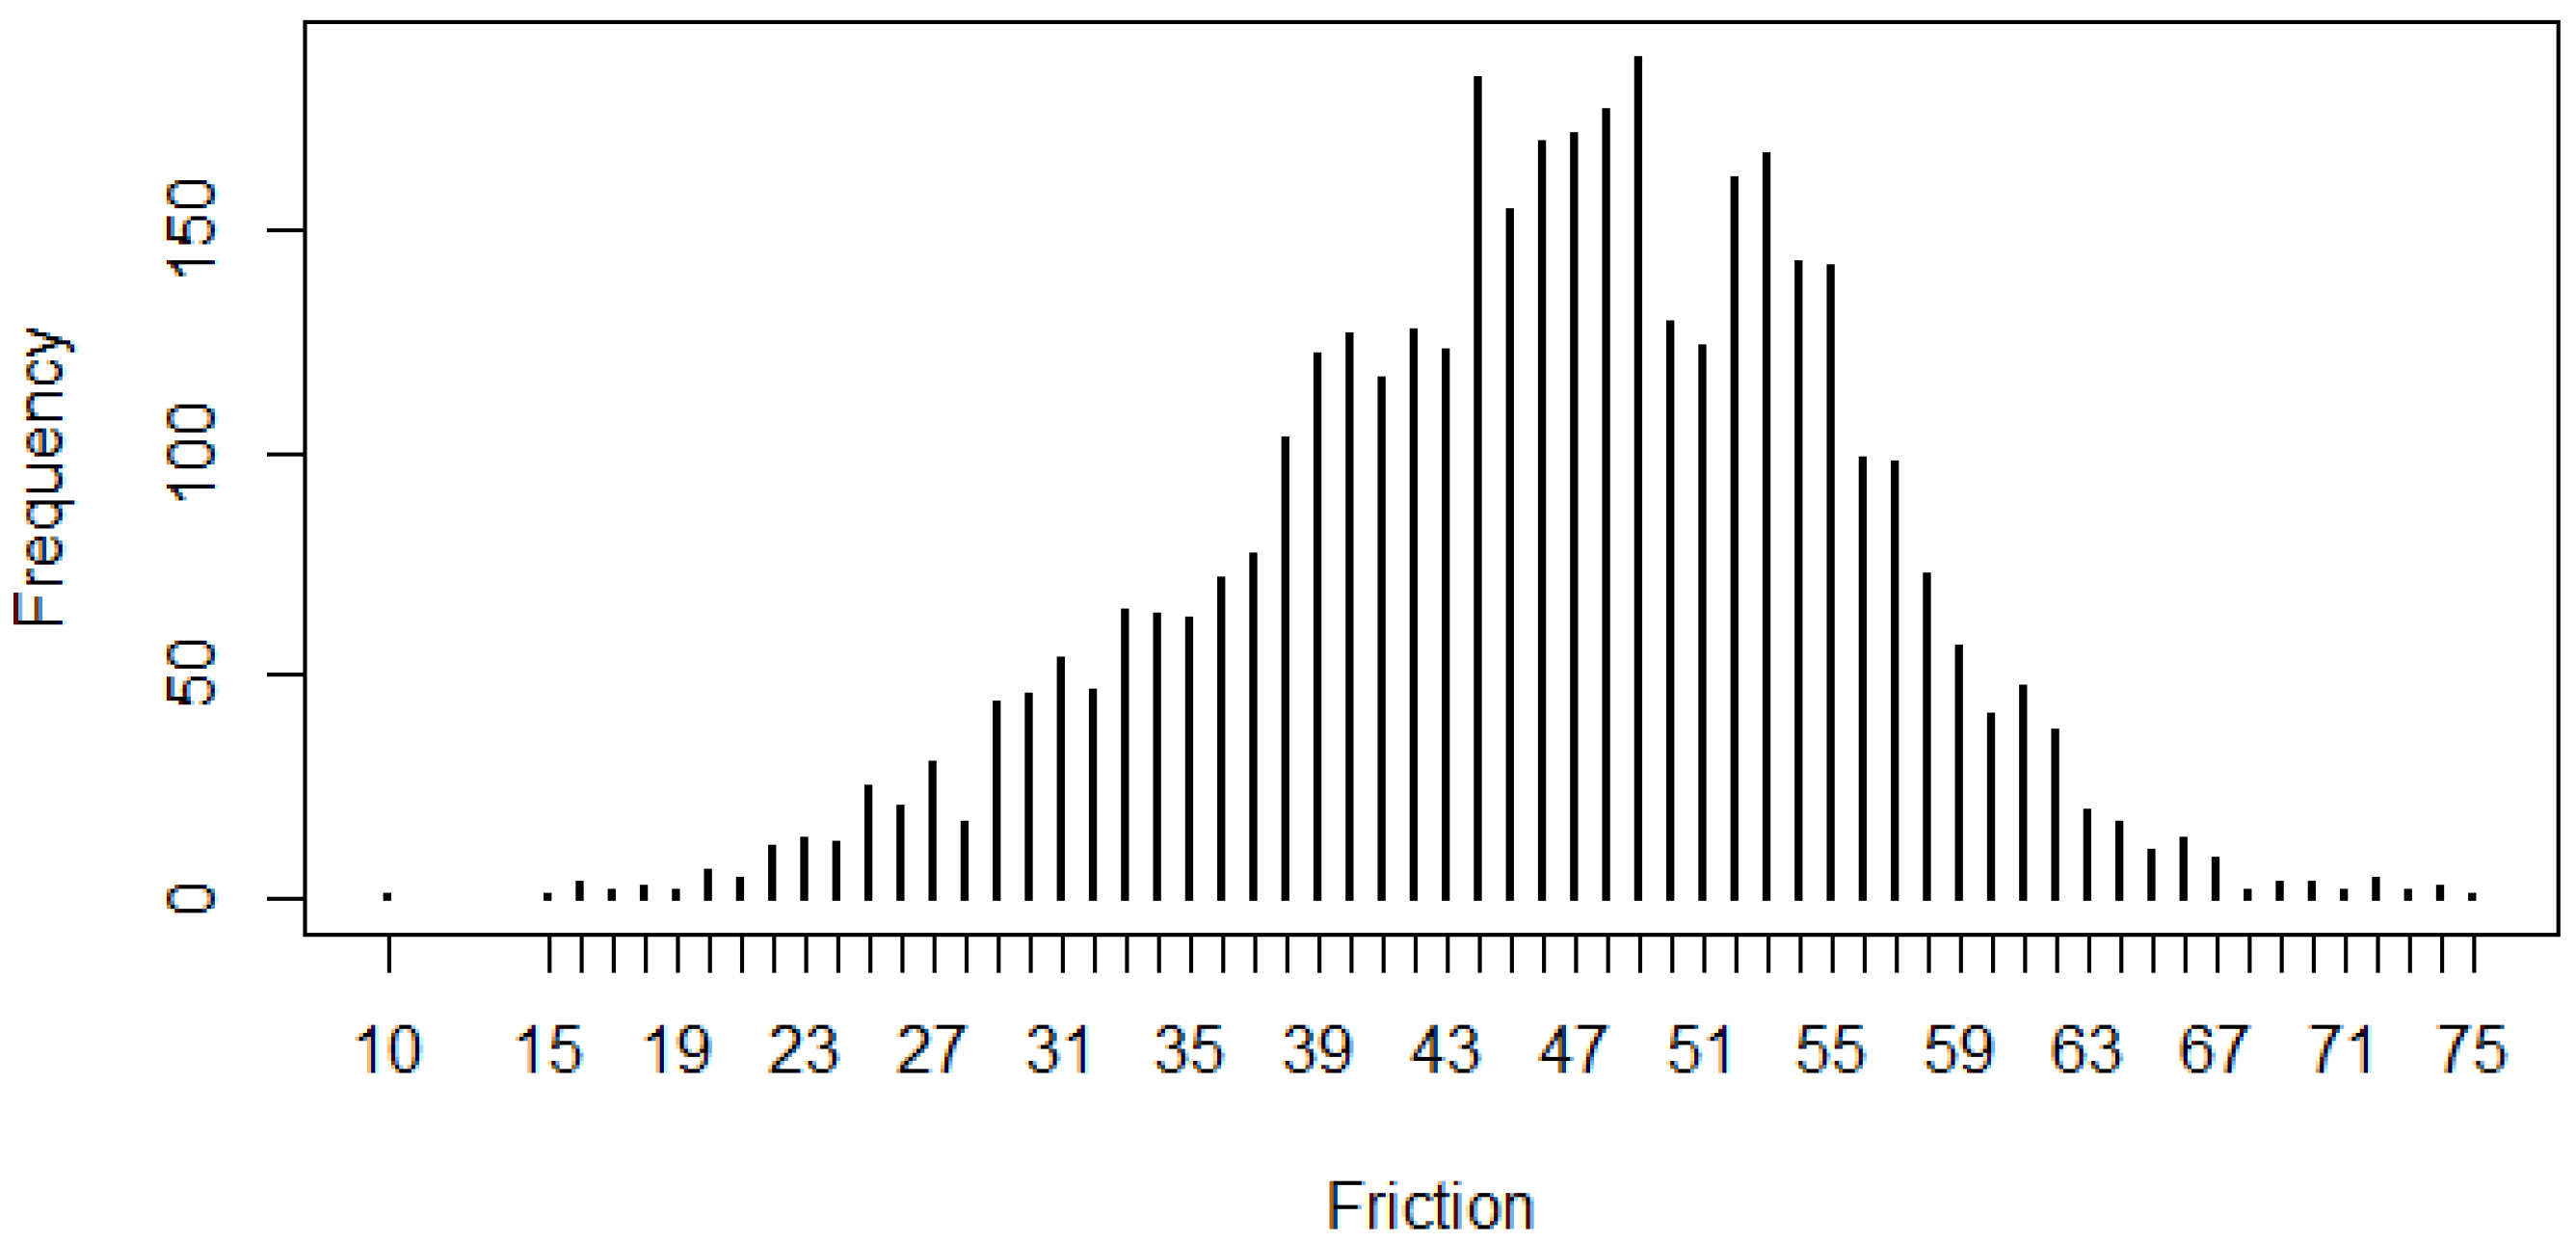
The friction numbers in the dataset were obtained with a locked-wheel pavement friction tester based on ASTM E274 by using ribbed (ASTM E501) and smooth (ASTM E524) tires. The process is produced by a complete slip condition and the measurement of braking and drag forces during slides of the test wheel. The locked wheel provides a friction coefficient, which is reported as friction numbers [
5]. The time period of successive friction measurements ranges from 2 months to 4 years. Friction numbers were used as the response in this study. The frequency of the response of friction is depicted in
Figure 2.
The observations were recorded multiple times during the study period, which cannot be modeled by a traditional technique which does not account for correlations across observations with the same ID. The data obtained from LTPP include variables such as friction (skid) number, age, ESAL, annual average temperature, climatic region and temperature during skid testing. Climatic zone is the only categorical variable with more than binary categories, so the frequency of each category along with the percentages are provided in
Table 1.
Factors such as freezing index were not used in the analysis as the type of climate zone in
Table 1 is correlated with that item. Moreover, the random intercept parameter was assigned to the ID of the observations to account for the repetitive measures of observations. It is intuitive that, as the fixed effect model could not account for correlations across observations from the same sites, it may not provide a reliable method, similar to the random effect model. However, a comparison between the random effect model and the standard models was also made by means of the Akaike Information Criterion (AIC) and the Bayesian Information Criterion (BIC).
4. Results
The results are presented in two subsections; firstly, the model comparison is presented, followed by the model parameter estimates.
4.1. Model Comparison
It should be noted that, initially, various concrete pavement types were considered separately, including Continuously Reinforced Concrete Pavement (CRCP), Jointed Plain Concrete Pavement (JPCP) and Jointed Reinforced Concrete Pavement (JRCP). However, the point estimates of those variables were found to be almost identical in the model. For instance, considering the disaggregated type of model, we had CRCP with , JPCP, with and JRCP with , having AIC = 22, 720, BIC = 22, 867, and log Lik = −11, 336 (df = 24). Due to the better fit of the model, by aggregating various concrete models, that model was considered instead of models with disaggregated concrete pavement.
In addition, considering the models with and without random effects, significant improvements in model fit were observed for the final mixed effect model with AIC (22,715); BIC (22,813); logLik (−11,341, df = 16) compared with the standard generalized linear model (GLM) with AIC (24,160); BIC (24,251); logLik (−12,064, df = 15). As a result, the next subsection considers the mixed effect model while aggregating various types of concrete pavement types.
4.2. Model Parameters
To account for a complex relationship between different variables, the interaction terms across all those predictors were considered. Only the impact of climate zone was found to be additive. As can be seen in
Table 2, the zones with climate conditions of dry-freeze and wet-freeze have lower road friction during the time, compared with the dry area with no freeze.
Moreover, only climate zones of wet and no freeze are associated with lower friction, compared with the no freeze and non-wet areas. However, it should be reiterated that the associations between all other predictors and friction were found to be complex and not additive, which the following paragraphs outline.
The results highlight that the association between pavement surface type and friction varies based on the average temperature. Although concrete pavement has higher friction, compared with asphalt, the higher average temperature resulted in a lower friction.
Also, the association between surface type and friction was found to vary based on the number of lanes. It was found that the associated slope between surface type and friction is less steep for a two-lane highway, compared with a single lane. In other words, friction is reduced more sharply for two-lane highways than for a single lane one. The number of lanes accounts for many confounding factors that may not be recorded at the time of data collection. The association between pavement surface type and road friction varies based on ESAL; a higher ESAL reduces roadway friction with a higher magnitude.
The last interaction term is related to pavement surface type and the age of the pavement. The results highlight that the association between pavement surface type and pavement friction is reduced by a higher age of pavement.
To finalize, the results highlight that the impacts of various environmental characteristics highly depend on the type of pavement. Moreover, the magnitude of the impacts of the type of pavement is so high that it covers the impacts of other predictors. Moreover, as can be seen from
Table 2, ID was set to be random to account for repetitive measures of observations.
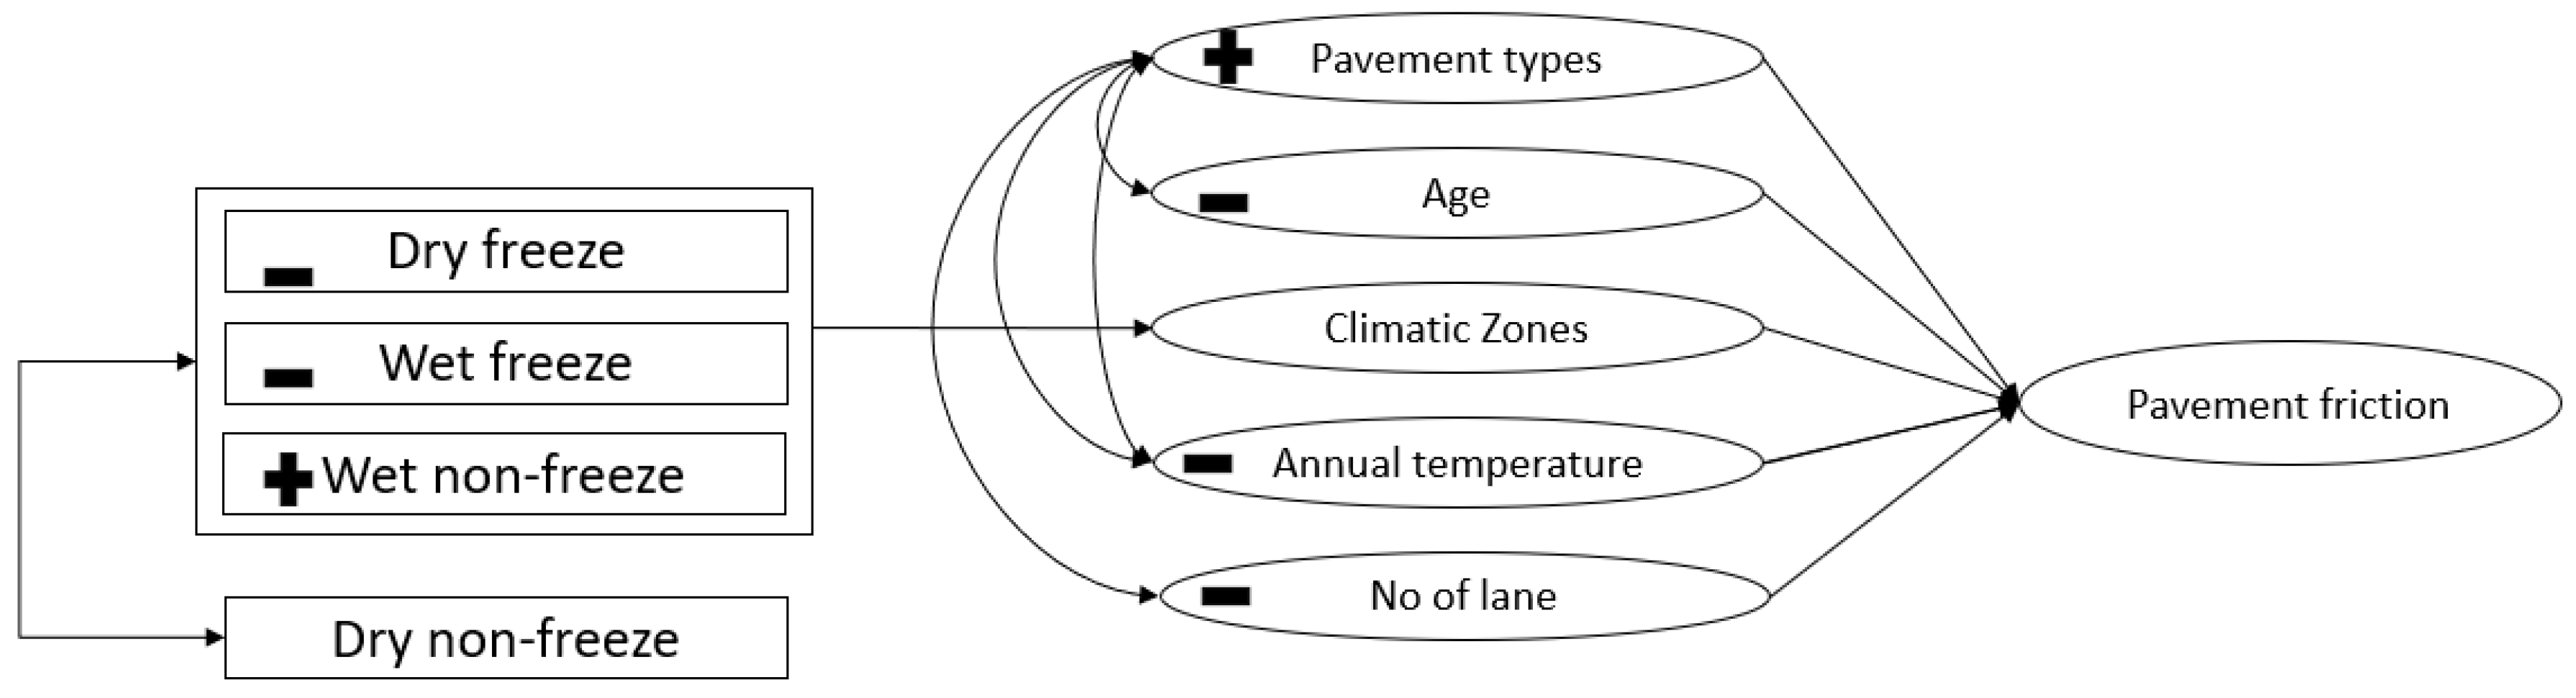
To summarize,
Figure 3 is presented to depict the interrelationships between various variables. Negative and positive signs were also included to highlight the impacts of the predictors. It should be recalled that, although the interaction terms were considered and the interactive relationship for those terms between two variables simultaneously should be considered, based on the magnitude main effects and the interaction terms, those signs are set as in
Figure 3. For instance, considering the interaction between age and pavement type,
is much smaller than
, so an increase in the age of pavement results in a reduction in the friction number.
5. Discussion
Although studies have been conducted to investigate the factors of pavement frictions, to our knowledge, all those studies only considered the additive impacts of various predictors. However, we challenge that assumption and extend the previous studies by considering all pairwise interaction terms. We found that the gap still exists regarding the real impacts of different variables and the friction number.
This study investigated the complex impacts of various environmental, traffic and age effects on road friction. Due to the repetitive nature of observations over time, the mixed effect model was considered to account for correlations across observations with similar ID.
The results of the statistical goodness of fit highlight an improvement in the model’s fit for the model that considers interaction terms versus no interaction terms, and for the random effect model with no random effects. Moreover, after finding the coefficients of various concrete pavement types to be identical, and due to an improvement in the model’s fit after considering those aggregated coefficients, the pavement type was considered with two categories: concrete and asphalt pavement.
Although positive associations were found between pavement types and friction, the impacts of pavement type on friction are not stable but vary based on the number of lanes, average annual temperature, the age of the pavement and annual ESAL. The results highlight that, although concrete pavement increases pavement friction, the slope of the impact is reduced by the number of lanes, annual ESAL and an increase in annual average temperature. However, it should be noted that the impact of pavement type is so high that it covers the impacts of all those factors. Finally, it should be noted that, although asphalt material impacts the friction of pavement, the material used on the surface can impact the provided ski resistance as well.


