1. Introduction
The importance of heterogeneous catalysis for modern chemical production processes is doubtless. Catalytical technologies are used for fuel production (the total number of oil refinery plants exceeds 400 units) [
1], in large-capacity and fine chemicals (the annual output of large-capacity plants alone exceeds
$700 billion in cash equivalent) [
2], to prevent environmental pollution via development of low-waste technologies [
3], to reduce the pollution level of wastewater [
4], industrial emissions [
5], and transport exhaust gases [
6]. Such relevance of catalytic processes leads to the fact that research and development activities aimed at improving efficiency of catalysts, development of new technological processes using catalysts, new equipment designs, etc., are continuously growing. When using solid catalysts, an obvious way to improve their performance is to increase the catalyst’s specific surface area available for contact with reagents. This target can be achieved by application of porous substances.
When using porous materials with a complex disordered structure, an important task is to study the dynamics of the processes occurring both in the internal pore volume (diffusion, adsorption, chemical transformations, heat transfer) and outside the structure (hydrodynamic processes, heat and mass transfer). Due to the complexity and high costs of experimental methods for studying these processes, mathematical and computer modeling are becoming important tools in solving these problems [
7]. It is obvious that the processes inside and outside porous structures, first, influence each other, and, second, they have totally different spatial scales. These facts require the use of a multiscale approach for the models’ development [
8]. Computational Fluid Dynamics (CFD), which has a number of proven advantages [
9], is the most widely used tool to simulate macroscopic processes occurring at the scale of technological equipment. When describing microscopic phenomena in porous materials, one of the most promising approaches is cellular automata (CA), which are especially common in solving diffusion problems [
10].
CA became quite a popular tool for digital material representation [
11]. Among this type of CA, it is worth highlighting aggregation models [
12]. Witten and Sander proposed the first aggregation model—the diffusion-limited aggregation (DLA) model [
13]. An advantage of aggregation models is that they can be easily modified and adapted to specific tasks. Further development of aggregation models led to approaches with the combination of particle clusters. The first cluster–cluster model was reported by Finegold [
14]. Cluster–cluster aggregation models are widely used in modeling porous microstructures such as aerogels [
15].
As it was mentioned, CA are considered a good approach for diffusion modeling. Many CA type have been developed for this purpose. The two most popular ones are lattice-gas automaton [
16] and block CA originally proposed by Margolous [
17]. The latter approach was successfully used for diffusion and convection modeling of flows in porous media [
18], coal combustion modeling [
19], and lignin growth [
20].
For the above reasons, we attempted to create a complex multiscale model of a catalytic reactor with a porous aluminosilicate catalyst. This article presents the first stage of the work and includes application of the CA approach to represent catalyst porous structure and to calculate the effective diffusion coefficient inside a porous body. The CA approach can be considered as an alternative to Molecular Dynamics (MD), which can be also used for material reconstruction and diffusion simulations [
21,
22,
23,
24]. Choice of CA for such simulations is reasonable due to less computational costs, relatively simple transition rules, and more efficient parallelization of computations. CA are an efficient tool to simulate structures and phenomena with much larger scales in comparison to MD.
The results of CA modeling were used to build a hydrodynamic model of a test multicomponent system. The model was implemented in the framework of Computational Fluid Dynamics. The main goal of computational experiments carried out using the implemented model was to verify the applicability of the selected methods for describing diffusion processes in porous aluminosilicate catalysts, taking into account external macroscopic phenomena.
The work was carried out in accordance with the following sequence:
at the first step, using CA, virtual three-dimensional structures of porous aluminosilicate catalysts were generated that have structural characteristics similar to real samples (specific surface area, pore size distribution);
further, using CA with Margolus neighborhood, medium diffusion inside the generated catalyst structure was simulated;
based on the CA simulations, the effective diffusion coefficient taking into account catalyst structure influence on the matter mass transfer was determined;
the obtained effective diffusion coefficient was used in the CFD model to calculate the test process for substance extraction from a porous catalyst.
The model was verified by comparing the calculated and experimental curves for the substance mass change inside the reactor. Experimental studies were conducted in a laboratory scale setup using aniline and methanol.
2. Materials and Methods
There are several different CA-based or CA-like methods for generating structures of porous materials with realistic specific surface area and pore size distribution. The following models were selected and implemented in an own software: DLCA (diffusion-limited cluster aggregation), MultiRLA (reaction-limited aggregation with multiple aggregation centers), OSM (overlapping spheres method), BPCA (ballistic particle–cluster aggregation) and RW (random walker). Catalyst porosity and sizes of globules forming the skeleton of the material were taken as the initial data for structure generation.
General definitions of the selected algorithms are given below, whereas more details can be found in the referenced materials.
The overlapping spheres model [
25] can be described as follows: the volume is filled with slightly overlapping spheres, then the spheres are removed until the desired porosity is obtained and links between all spheres exist. The diffusion limited cluster aggregation model [
26] is a well-known and widely used model. The particles following Brownian motion are aggregated into set of clusters that eventually encounter each other forming resulting clusters. Reaction limited aggregation with multiple centers is a rather new model that is based on reaction limited aggregation [
27] but introduces multiple seeds or aggregation centers. This model provides an opportunity to take into account different processes occurring between particles, but this leads to high computational complexity. Thus, this model is very flexible, meaning that it can be adopted according to the needs. The ballistic particle–cluster aggregation model [
28] operates with particles that follow straight line trajectories between the starting point and the position of the seed. The cluster that is being formed in this model is filled out very evenly, being nearly disk-shaped. Random Walker is a general-purpose algorithm that describes the random movement of single particles. When multiple particles are added to the volume, their paths form a structure full of fiber-like objects. It is also possible to use this model for particle-containing materials.
To simulate diffusion through the pores of the catalyst’s generated structure, a CA model based on a reversible cellular automaton with Margolus neighborhood proposed by Norman Margolus [
29] was used. In detail the CA model is described in [
30]. The model is briefly described below. Program implementation was performed using parallel algorithm utilizing CUDA® (Compute Unified Device Architecture) technology to speed up calculations. The rules of the developed CA are:
alphabet of states: S0 is empty cell, S1 is diffusing substance, S2 is catalyst structure cell; every cell in the lattice is of the same size;
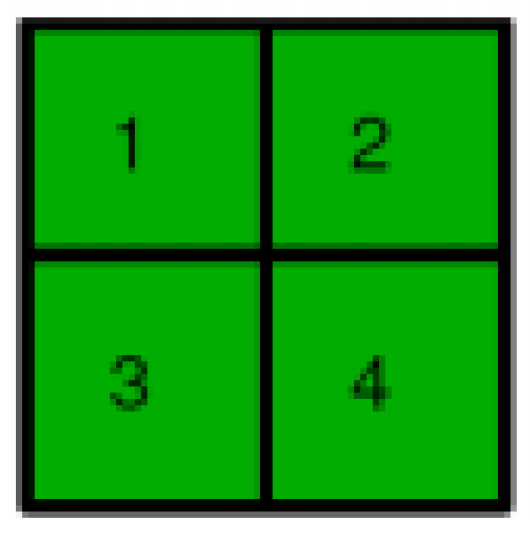
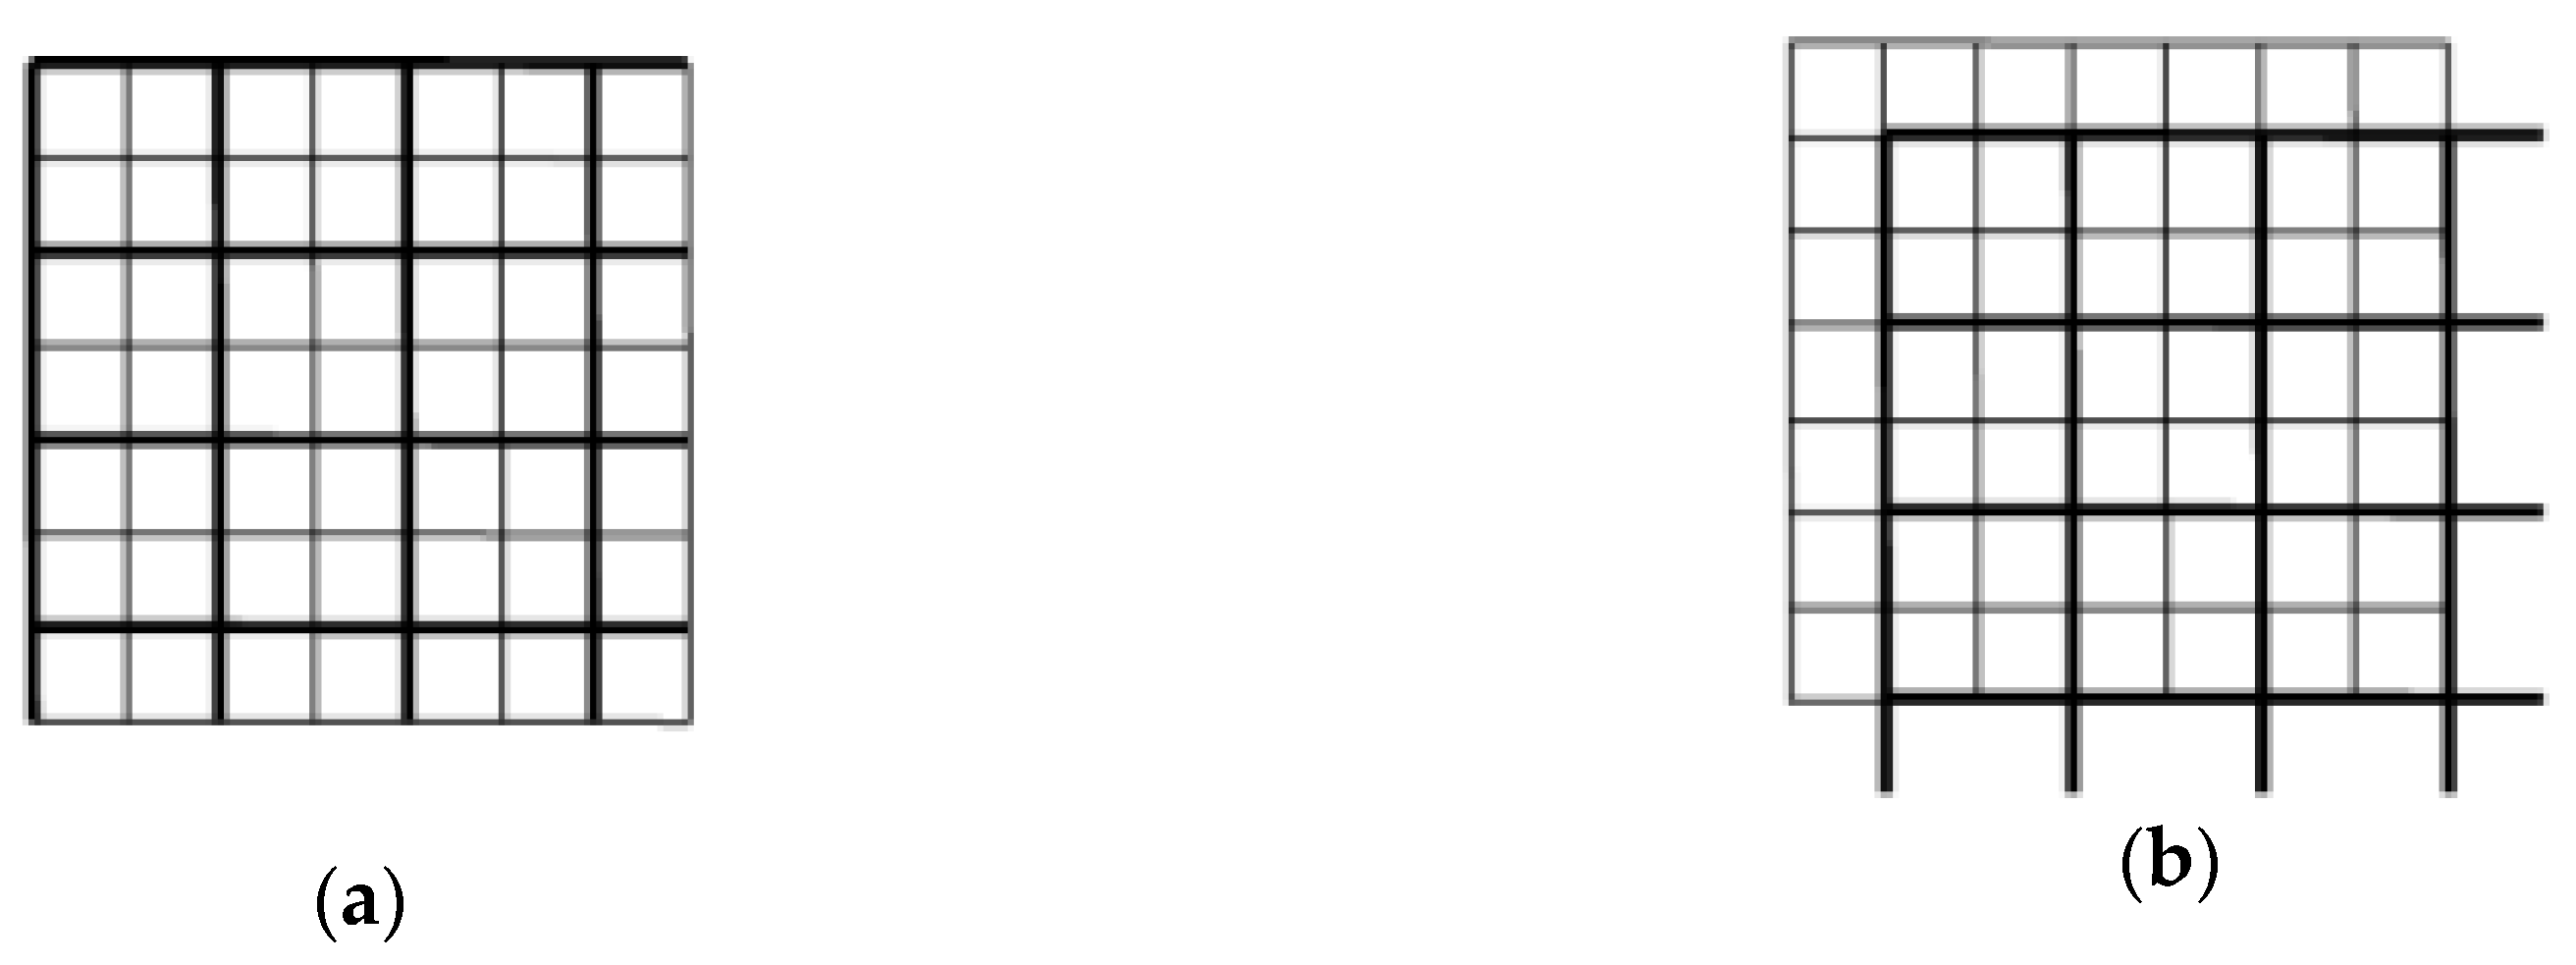
at each iteration the lattice is divided into set of 2 × 2 blocks according to Margolus neighborhood (
Figure 1) that are partitioned (
Figure 2) in two ways (odd and even);
for a pair of two adjacent cells, the interaction energy (which depends on cell types) is calculated;
at each iteration the total energy of the block is calculated;
at each iteration each block can rotate clockwise, counter-clockwise or stay unmoved depending on the energy of the block;
the following assumption has been used: binary diffusion coefficient does not depend on the aniline concentration in alcohol;
the free diffusion coefficient is fixed and when converted to CA units is equal to 1.78 [unit of length]2/iteration.
The energy effect of pair interactions between cells is related to the change of Gibbs energy of the system. In order to take into account entropy (s) and enthalpy (ε) factors, interaction energy has to be calculated. Interaction energy is the sum of enthalpy and entropy factors:
which corresponds to the Gibbs free energy
.
The total energy of the block is the sum of all pair interaction energies within the block
and interaction energies with adjacent cells from other blocks
:
In order to speed up calculations, all pair interaction energies within the block can be neglected.
For example, the probability to stay unmoved for the block is
Values in Equation (3) with “um” index correspond to “unmoved” transition rule, with “cw”—clockwise rotations, and with “ccw”—counter-clockwise rotation.
Similarly, other probabilities (to rotate the block clockwise or counter-clockwise) are calculated.
The described approach can be used to predict penetration and extraction kinetics as temperature functions, and in this case at least two extraction experiments using samples with the same structural properties at different temperatures and the same alcohol density are required in order to determine both enthalpy and entropy factors.
However, when the temperature dependence of the kinetics is not taken into account, only the total interaction energy between the diffusing substance and the catalyst’s structure has to be defined (without the need to determine enthalpy and entropy factors separately).
The effective diffusion coefficient in CA is obviously lower than the free diffusion coefficient and when the number of particles in CA is equal to the number of boundary layer cells or less than that, then it can be considered as a constant. In this case, the diffusion coefficient is determined only by the interaction energy of substances with the catalyst structure and free substance diffusion in pores.
In the following calculations, we assume that the diffusion coefficient in CA depends on concentration as a threshold function:
where
is the concentration that corresponds to the amount of substance in the volume equal to the size of the boundary layer in CA. In order to check the dynamics of such an assumption, Equation (4) is to be solved numerically by using an explicit difference scheme with the following recurrence relation:
In order to determine the effective diffusion coefficient , it is necessary to optimize the value of based on the solution of the diffusion equation for the desired shape of the sample and the corresponding experimental initial and boundary conditions. After this procedure is done and the interaction energy is determined, it can be used in CA simulations for the system described in the experiment.
CA Structure generations were performed using a workstation with Intel Core i5 CPU, 2 GB RAM, and NVidia GeForce GTX 1060 GPU. Each structure generation took approximately 20 minutes of real time. CA diffusion calculations were performed using a workstation assembled for GPU parallelization with Intel Core i7 3.4 GHz CPU, 64 GB RAM, and two NVIDIA GeForce GTX 1080 GPUs supporting CUDA technology, which total performance is 17.746 TFLOPs. Each CA diffusion numerical experiment required approximately 5 hours of real time.
The determined effective diffusion coefficient was used for the CFD model of aniline extraction from a catalyst in a laboratory scale reactor. The modeled system was similar to the experimental set up and incuded the internal volume of the reactor with a block of a catalyst fully filled with aniline and placed in the central area of the reactor.
The following assumptions were made for development of the CFD model:
the system is considered as a two-component homogenous medium (which is a viscous compressible liquid) “methanol–aniline”;
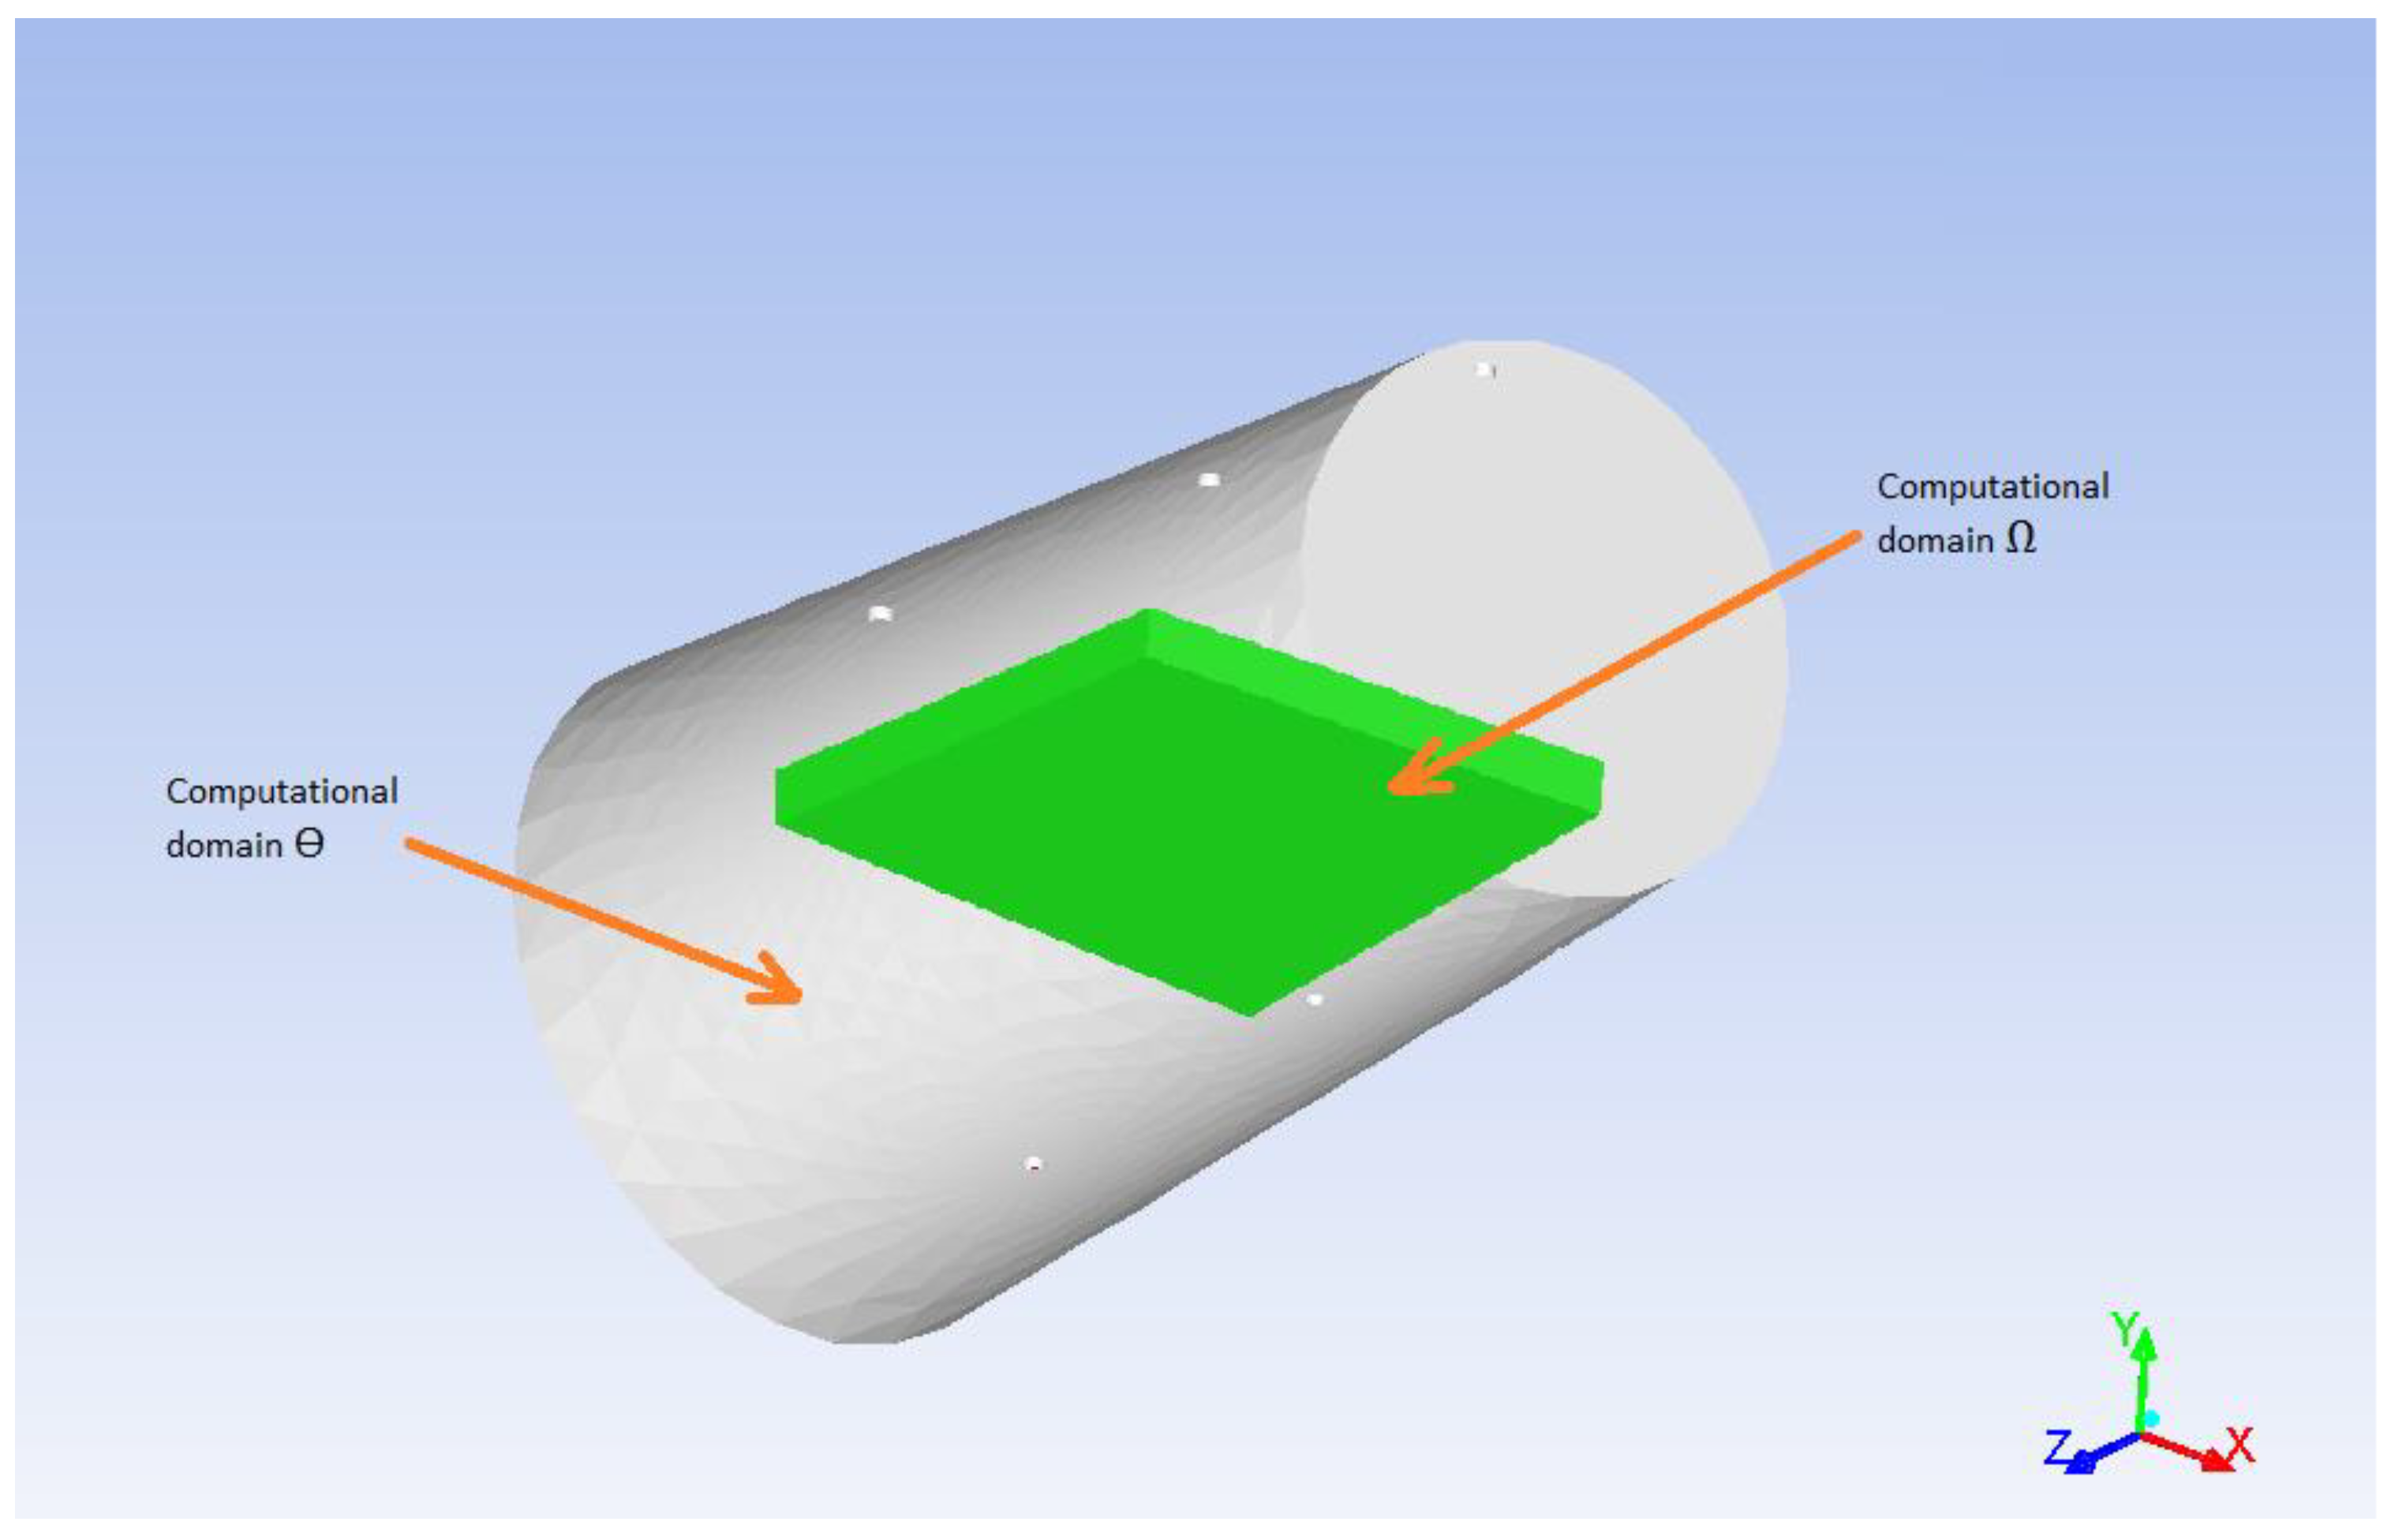
there are two computational domains—the void volume of the reactor ϴ and the porous body volume (catalyst with aniline) Ω;
the mass flow in the porous body is described by Fick’s diffusion equation using the calculated effective diffusion coefficient without any convective transport;
the reactor’s wall temperature is constant.
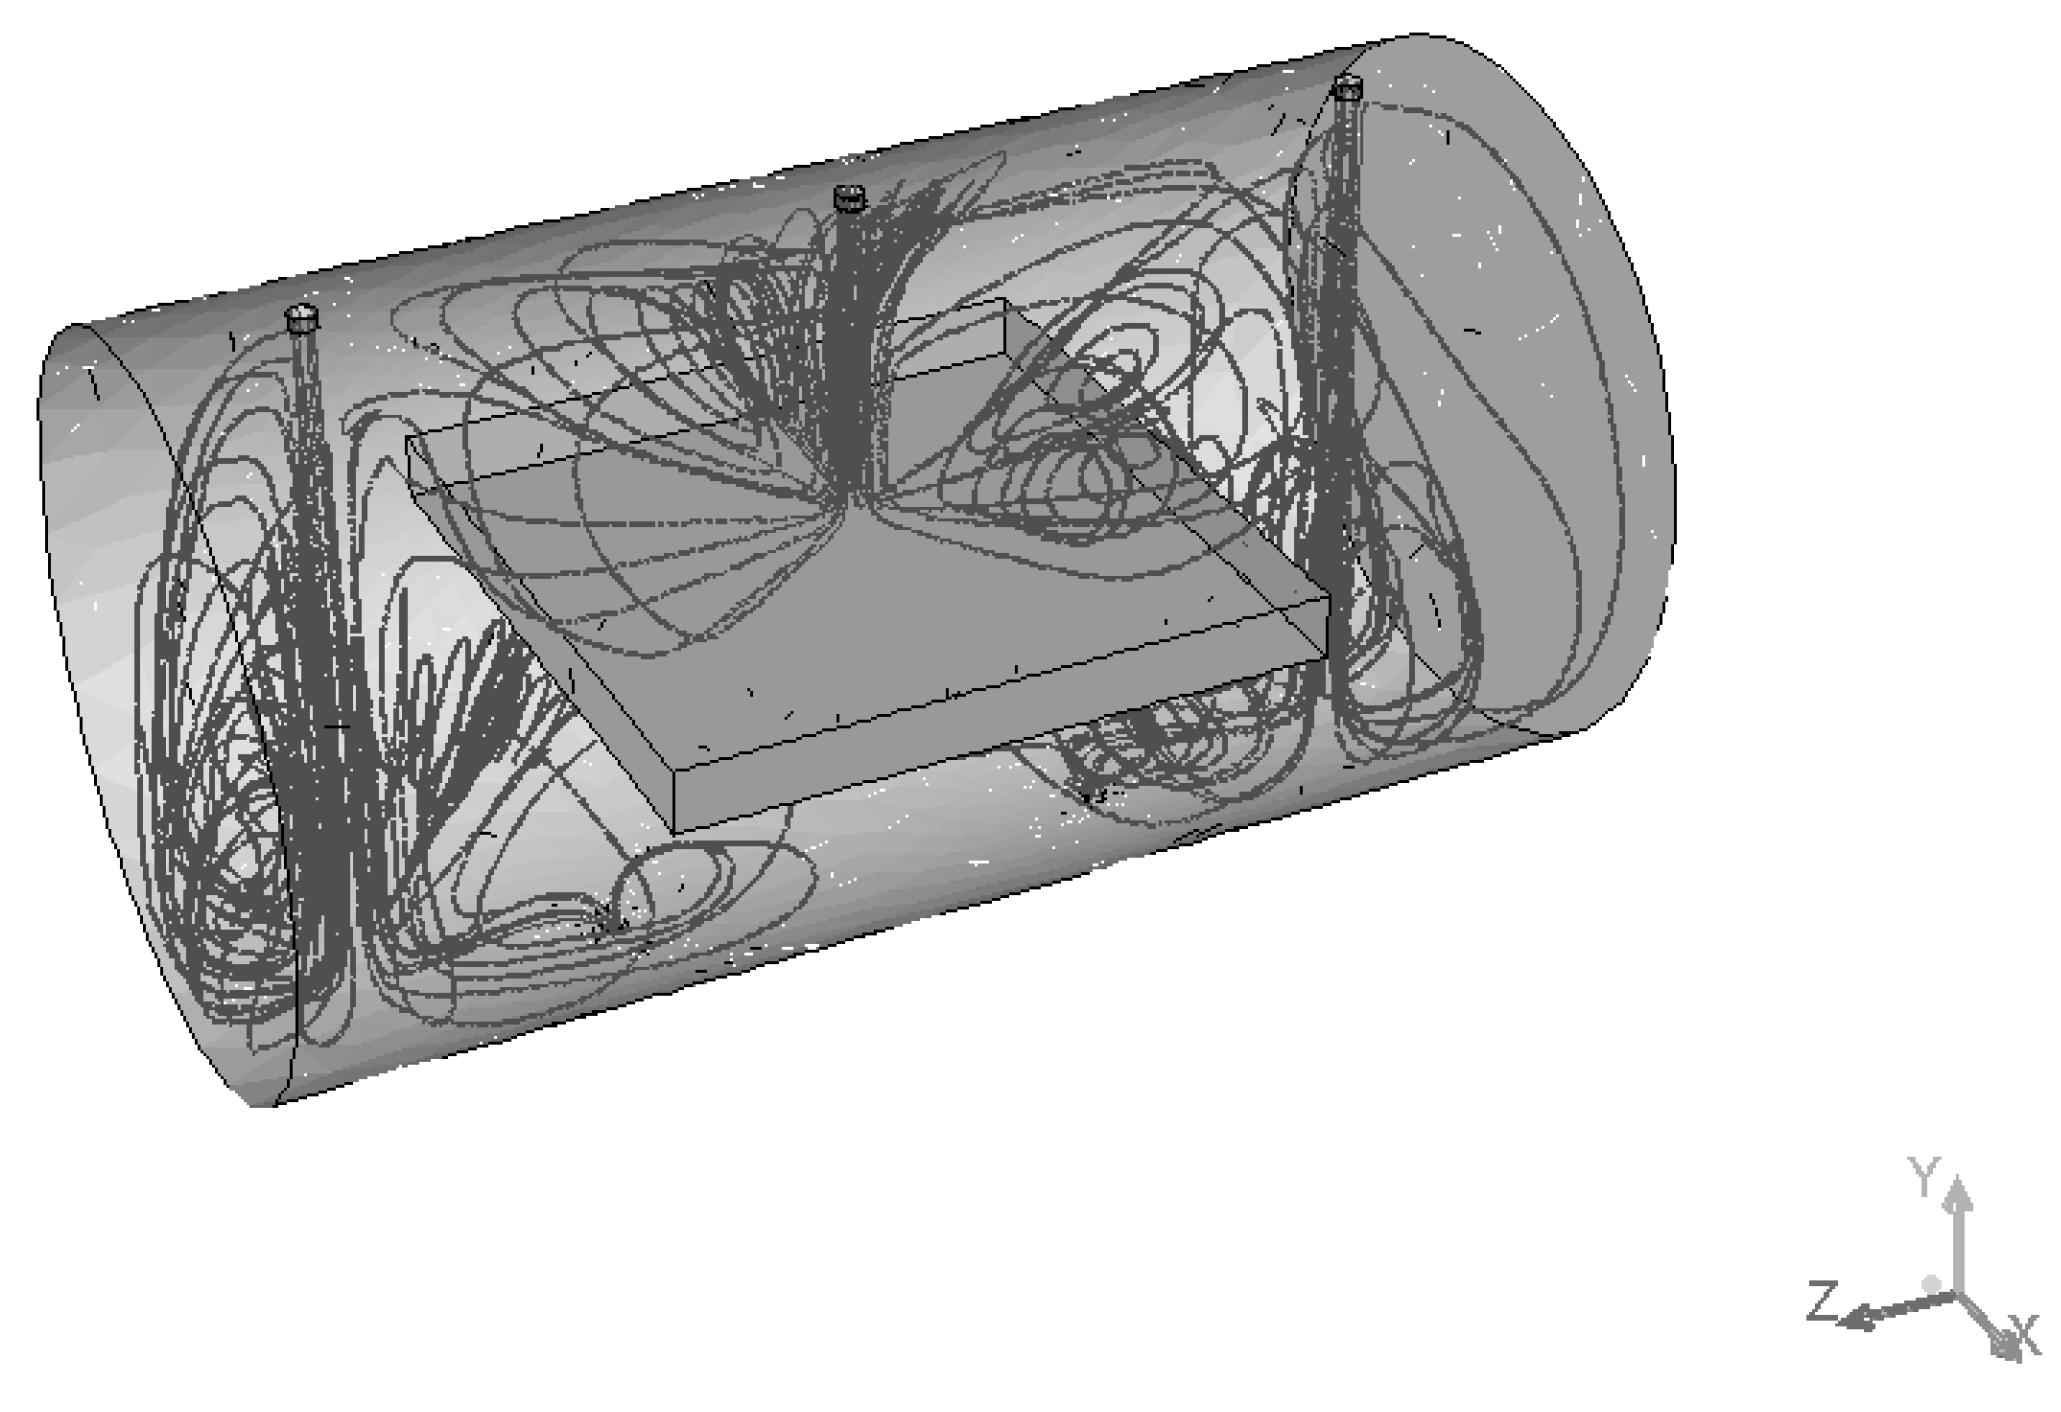
The model’s geometry is shown in
Figure 3. It consists of two computational domains—the void volume of the reactor and the porous catalyst. The reactor has 3 inlets and 2 outlets 2 mm in diameter each. The reactor is represented as a horizontal cylinder with 55 mm diameter and 105 mm length. The catalyst has a form of a box with dimensions 50 × 50 × 5 mm (L × W × H).
The mathematical model of the aniline extraction process is a system of differential equations, which includes the mass conservation equations of methanol and aniline, the momentum conservation equations, and the equation of energy conservation.
The model equations for the void volume of the reactor (computational domain ϴ) are:
The model equations for the volume of the catalyst (computational domain Ω) are:
Additional correlations are:
where
ρ is the mixture density, kg/m
3;
is the mixture velocity vector, m/s;
T is the mixture temperature, K;
P is the pressure, Pa;
Y1 is the methanol mass fraction, kg/kg;
Y2 is the aniline mass fraction;
is the gravity acceleration, m/s
2;
D is the diffusion coefficient, m
2/s;
λ is the thermal conductivity, W/m∙K;
E is the specific total energy, J/kg;
τkl is the stress tensor;
J1 and
J2 are mass transfer fluxes of components through the interior, dividing two domains; Γ is the interior, dividing two domains (catalyst border);
Y1Ω is the methanol mass fraction at the border of the domain Ω;
Y2Ω is the aniline mass fraction at the border of the domain Ω;
Y1Θ is the methanol mass fraction at the border of the domain Θ;
Y2Θ is the aniline mass fraction at the border of the domain Θ;
ael is the border unit area, m
2;
μ is the viscosity, kg/m∙s;
I is the unit tensor; indexes:
in corresponds to a value at the inlet,
w corresponds to a value at the wall,
b corresponds to a value at the border between two domains.
The considered system is a compressible liquid, therefore the Peng–Robinson (Equation (16)) equation of state [
31] was used for density calculations. This equation was chosen as the most universal one and the most suitable one for describing multicomponent systems:
where ν is the molar volume, m
3/kmol;
R is the universal gas constant, J/kmol∙K;
a,
b are empirical coefficients, that depend on the nature of substances and mixture composition.
Coefficients
a and
b are calculated as:
where ω is the acentric factor of the mixture.
Van der Waals mixing rules have been used for the calculation of mixture pseudocritical parameters:
where
Tcr is the pseudocritical temperature of the mixture, K;
Pcr is the pseudocritical pressure of the mixture, Pa.
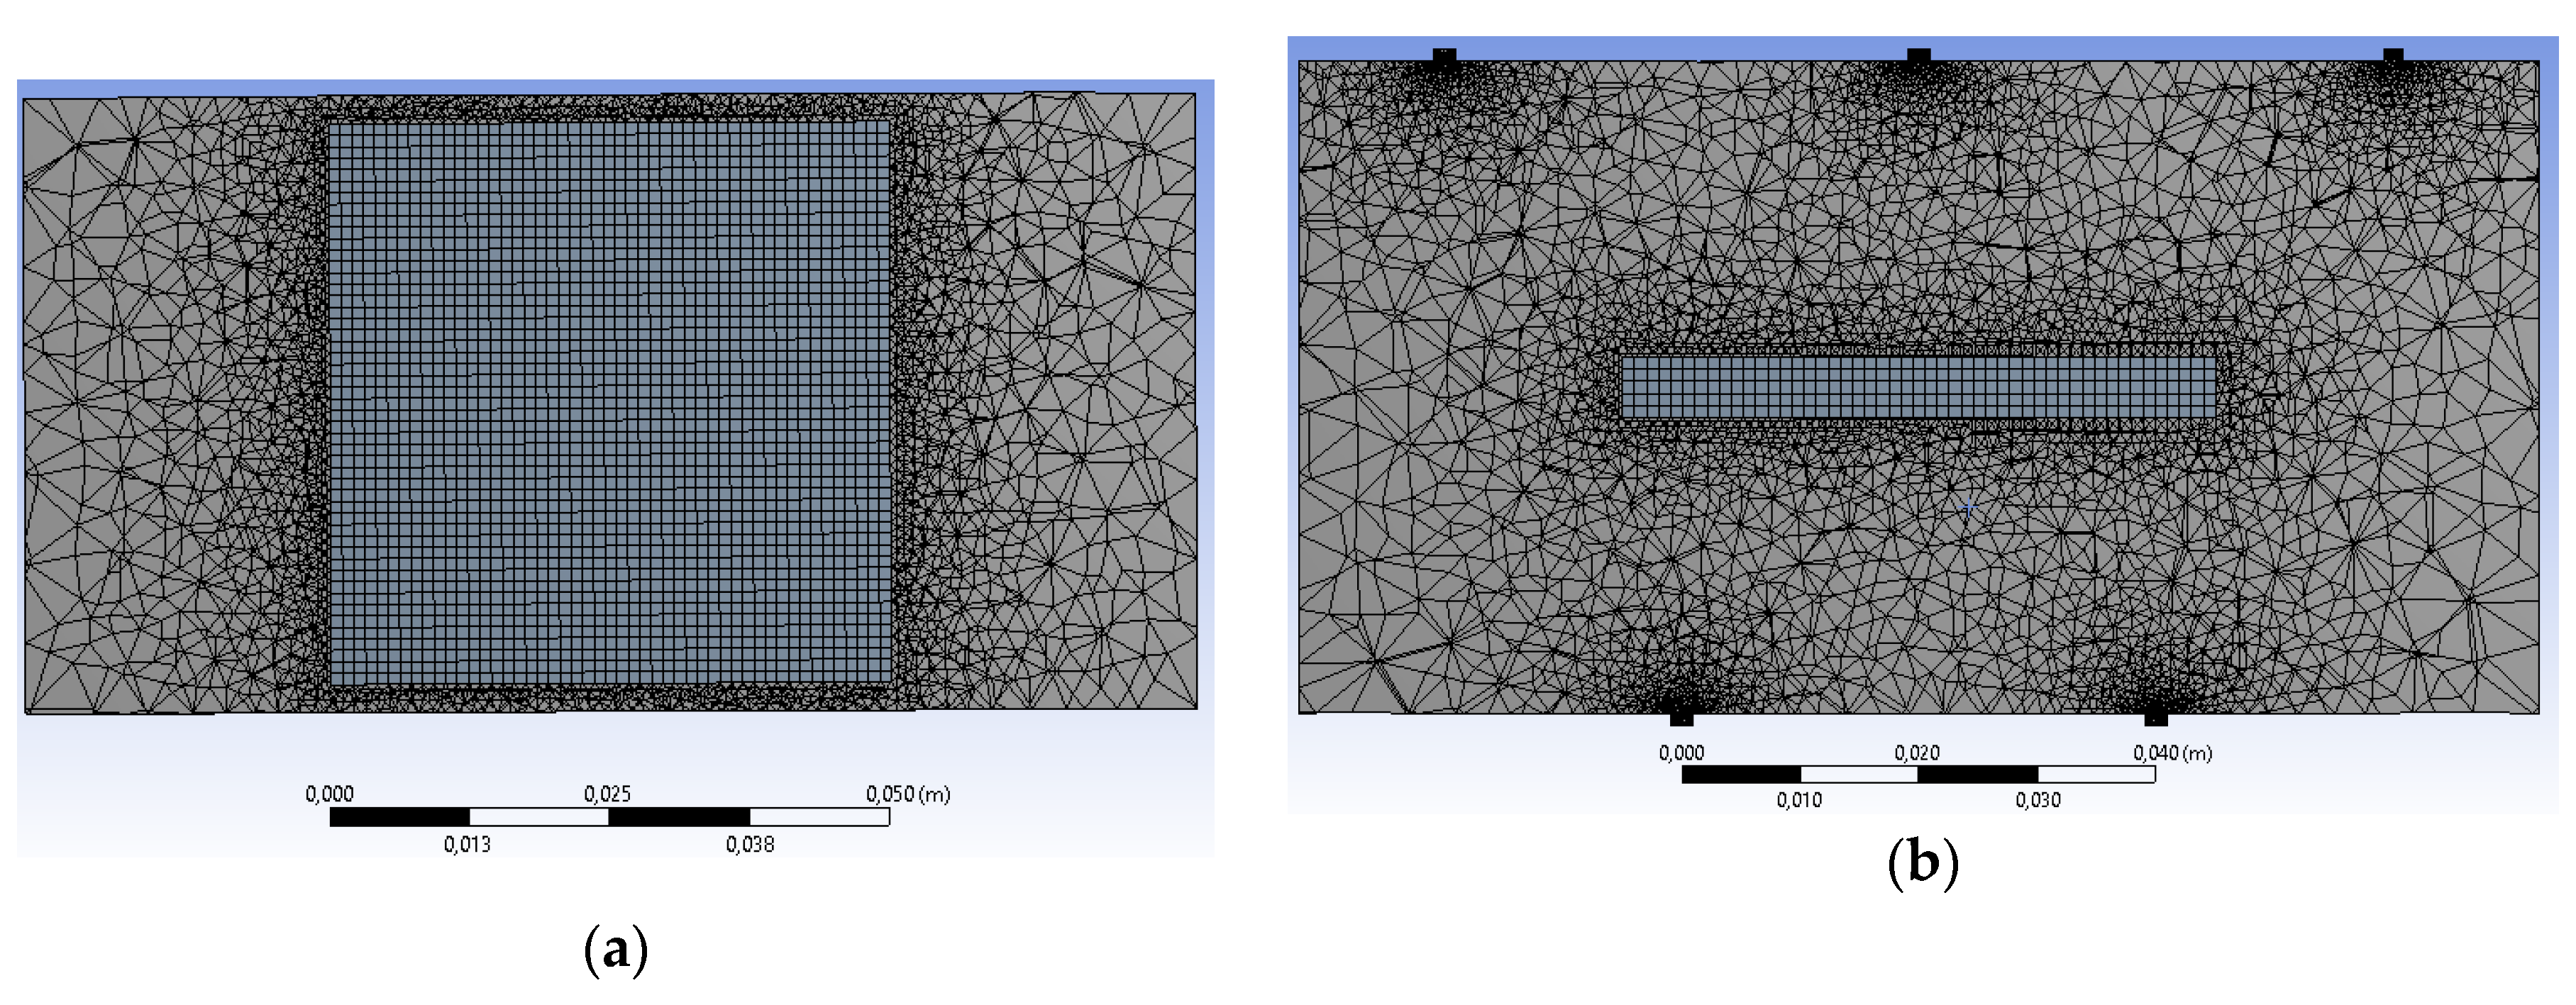
The described CFD model was implemented using ANSYS Fluent 17.0 software. The corresponding generated initial mesh consists of tetrahedrons and hexahedral cells (tetrahedrons are used for the void volume of the reactor, hexahedrons are used for the catalyst to create structured mesh for this zone). The total number of cells is around 280,000. The initial mesh was adapted using an iterative procedure to increase the model’s accuracy. A second-order pressure-based segregated algorithm was used for numerical solution.
XZ and YZ cross sections of the initial mesh are shown in
Figure 4. XZ cross section of the adapted mesh is shown in
Figure 5.
CFD calculations were performed using HP ProLiant BL460c server with Xeon E5345 Quad Core CPU and 16 GB RAM. Each numerical experiment required approximately 3–4 h of real time.
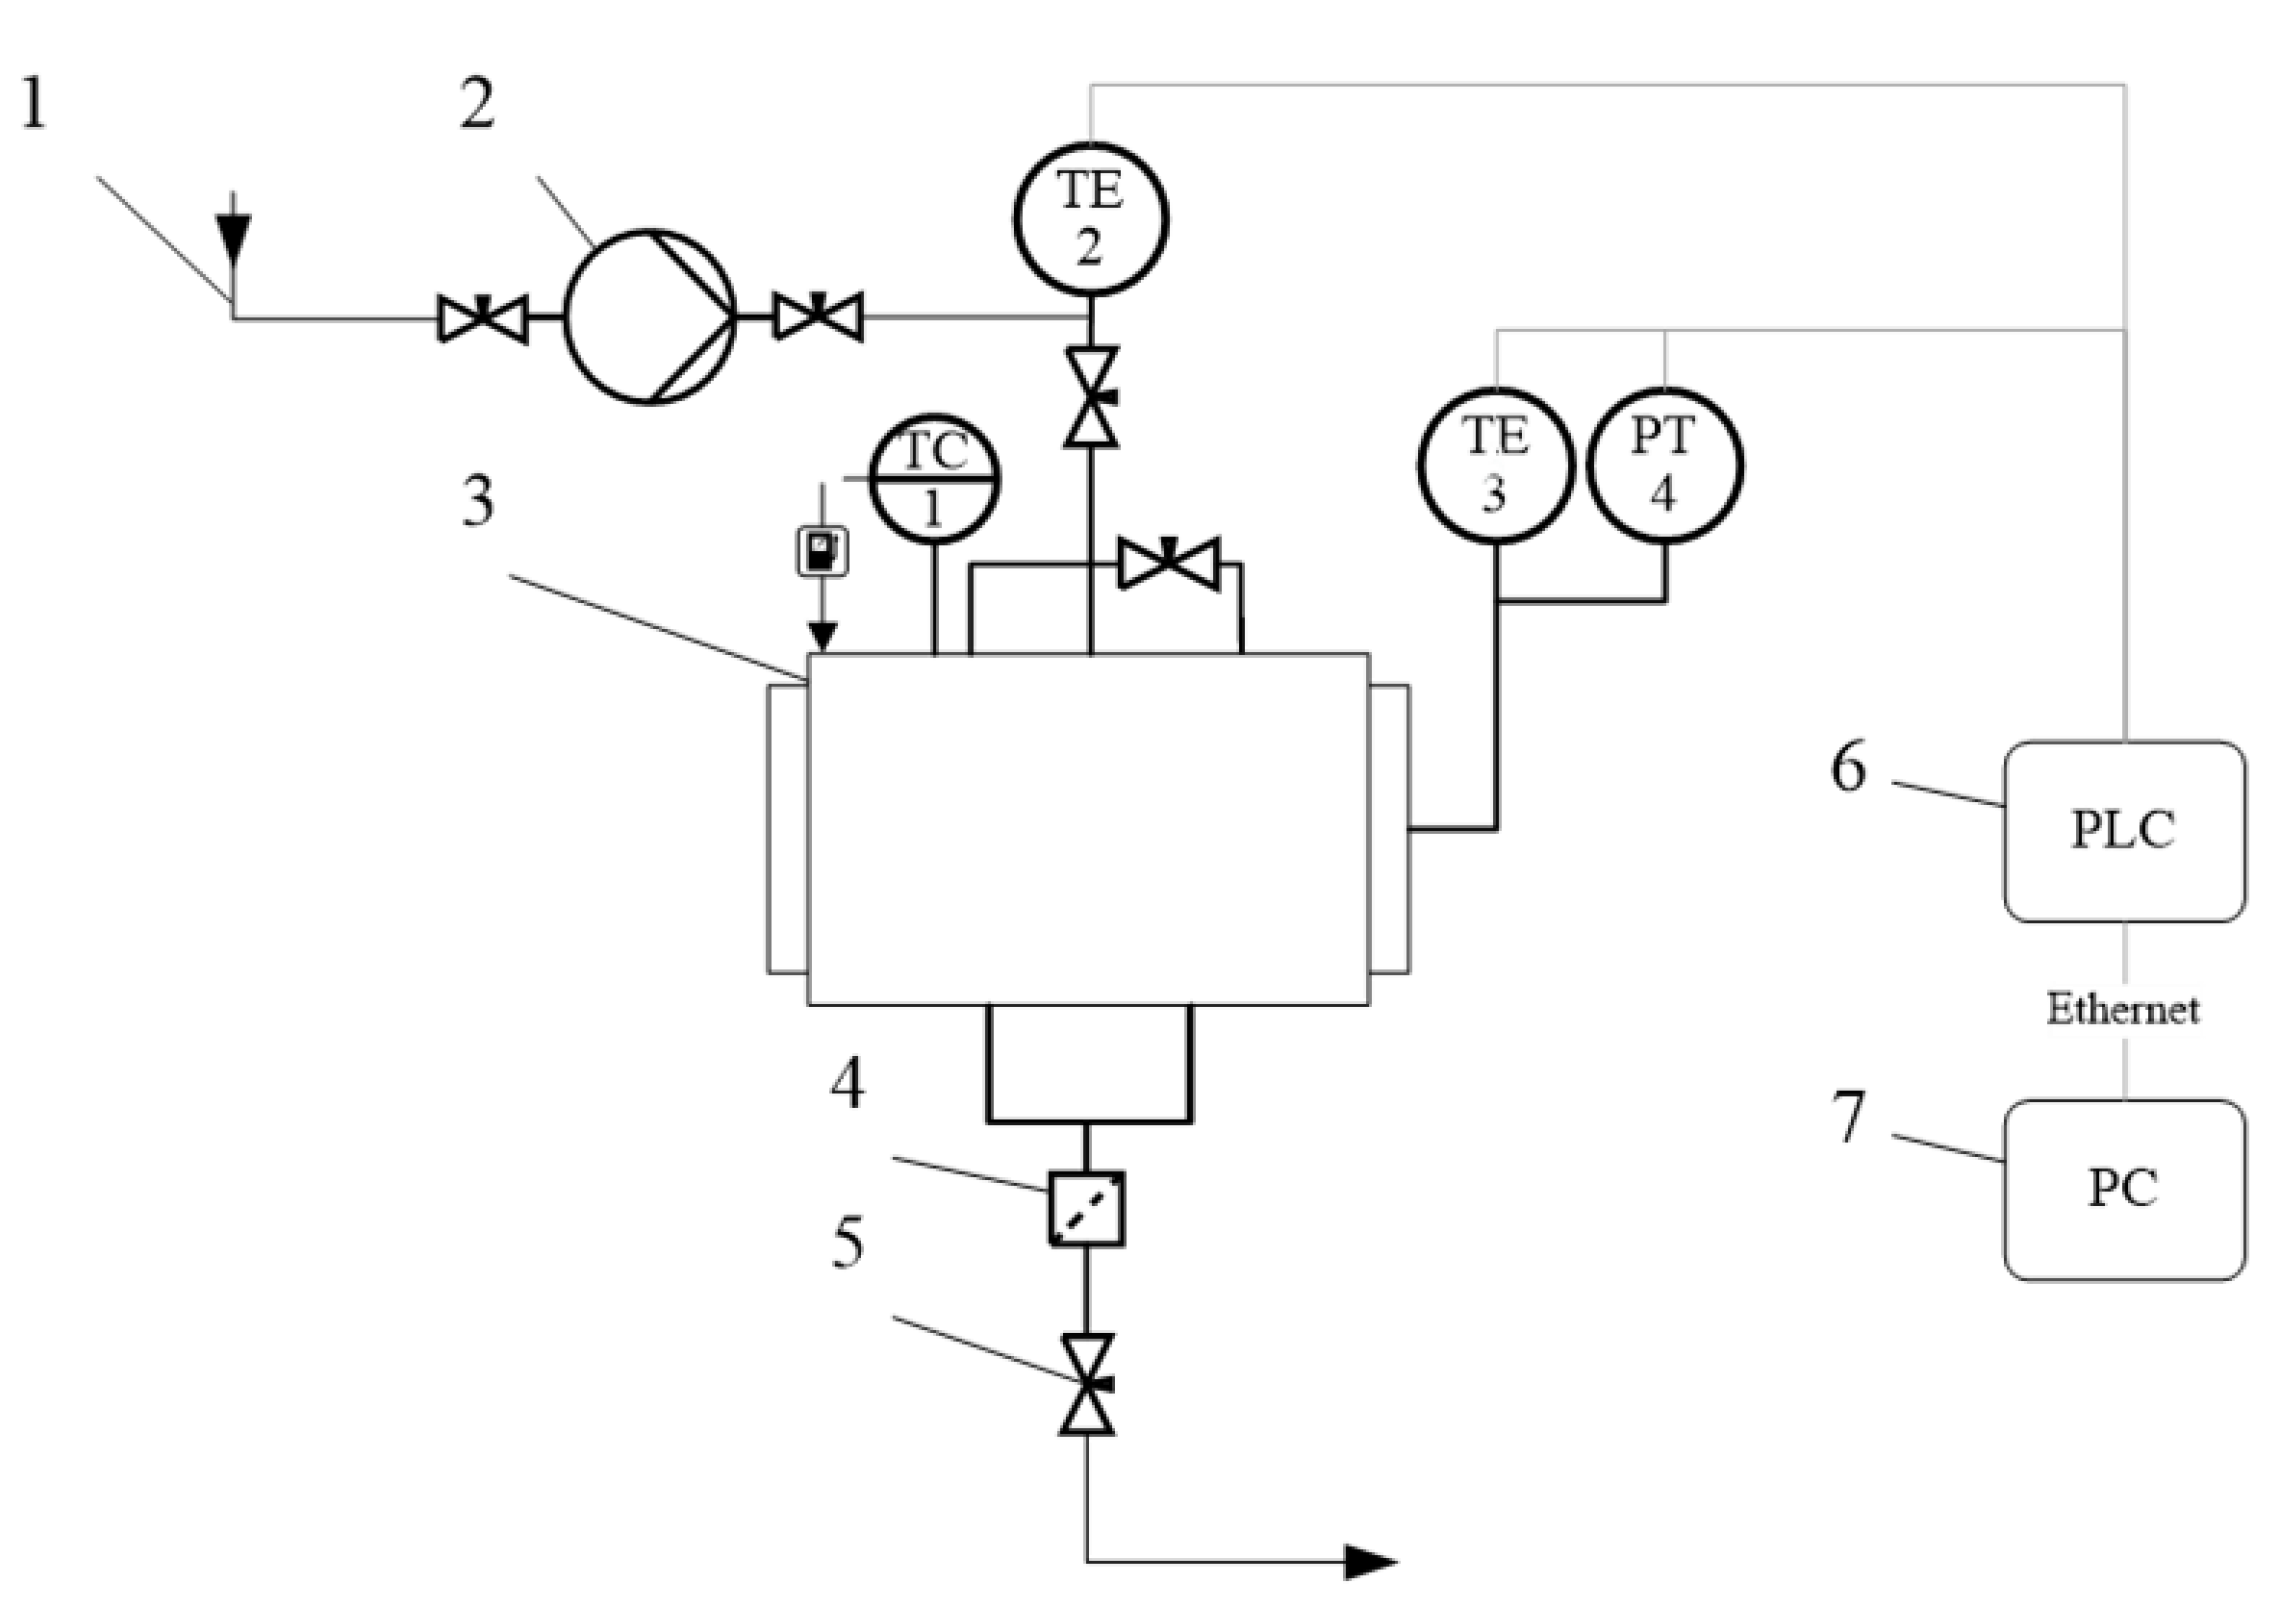
To conduct an experiment on the extraction of aniline from a porous aluminosilicate catalyst, an installation of its own design was used. The installation principal diagram is shown in
Figure 6.
The methanol was supplied to the system using pump (2) from methanol suction line (1) at ambient temperature. Methanol was fed to a 250 mL reactor (3). The flow of methanol was controlled using the pump flow rate. The temperature inside the reactor was controlled by a temperature controller (TC). The temperature inside the reactor was determined using a KTL-01 thermocouple (TE 3, accuracy of ±0.1 ℃), and the pressure was measured using a manometer (accuracy ± 0.01 bar). The temperature of the flow was determined using a KTL-01 thermocouple (TE 2).
Data collection from TE3, PT4 sensors was carried out by a programmable logic controller (6). Furthermore, all data from the programmable logic controller (PLC) were transferred to a personal computer (7).
Aluminosilicate catalyst filled with aniline was loaded into the reactor. The reactor was hermetically sealed and methanol was fed into it. The output aniline concentration was measured using High Performance Liquid Chromatography (HPLC).
3. Results and Discussion
After a number of test generations with the developed software, it was decided to use the DLCA algorithm as the most appropriate for generating particle-based structures similar to aluminosilicate catalysts. The DLCA algorithm was chosen based on the comparison of a catalyst sample’s measured characteristics and the corresponding values calculated for the generated structures. Specific surface areas and mean pore diameters were compared (
Table 1).
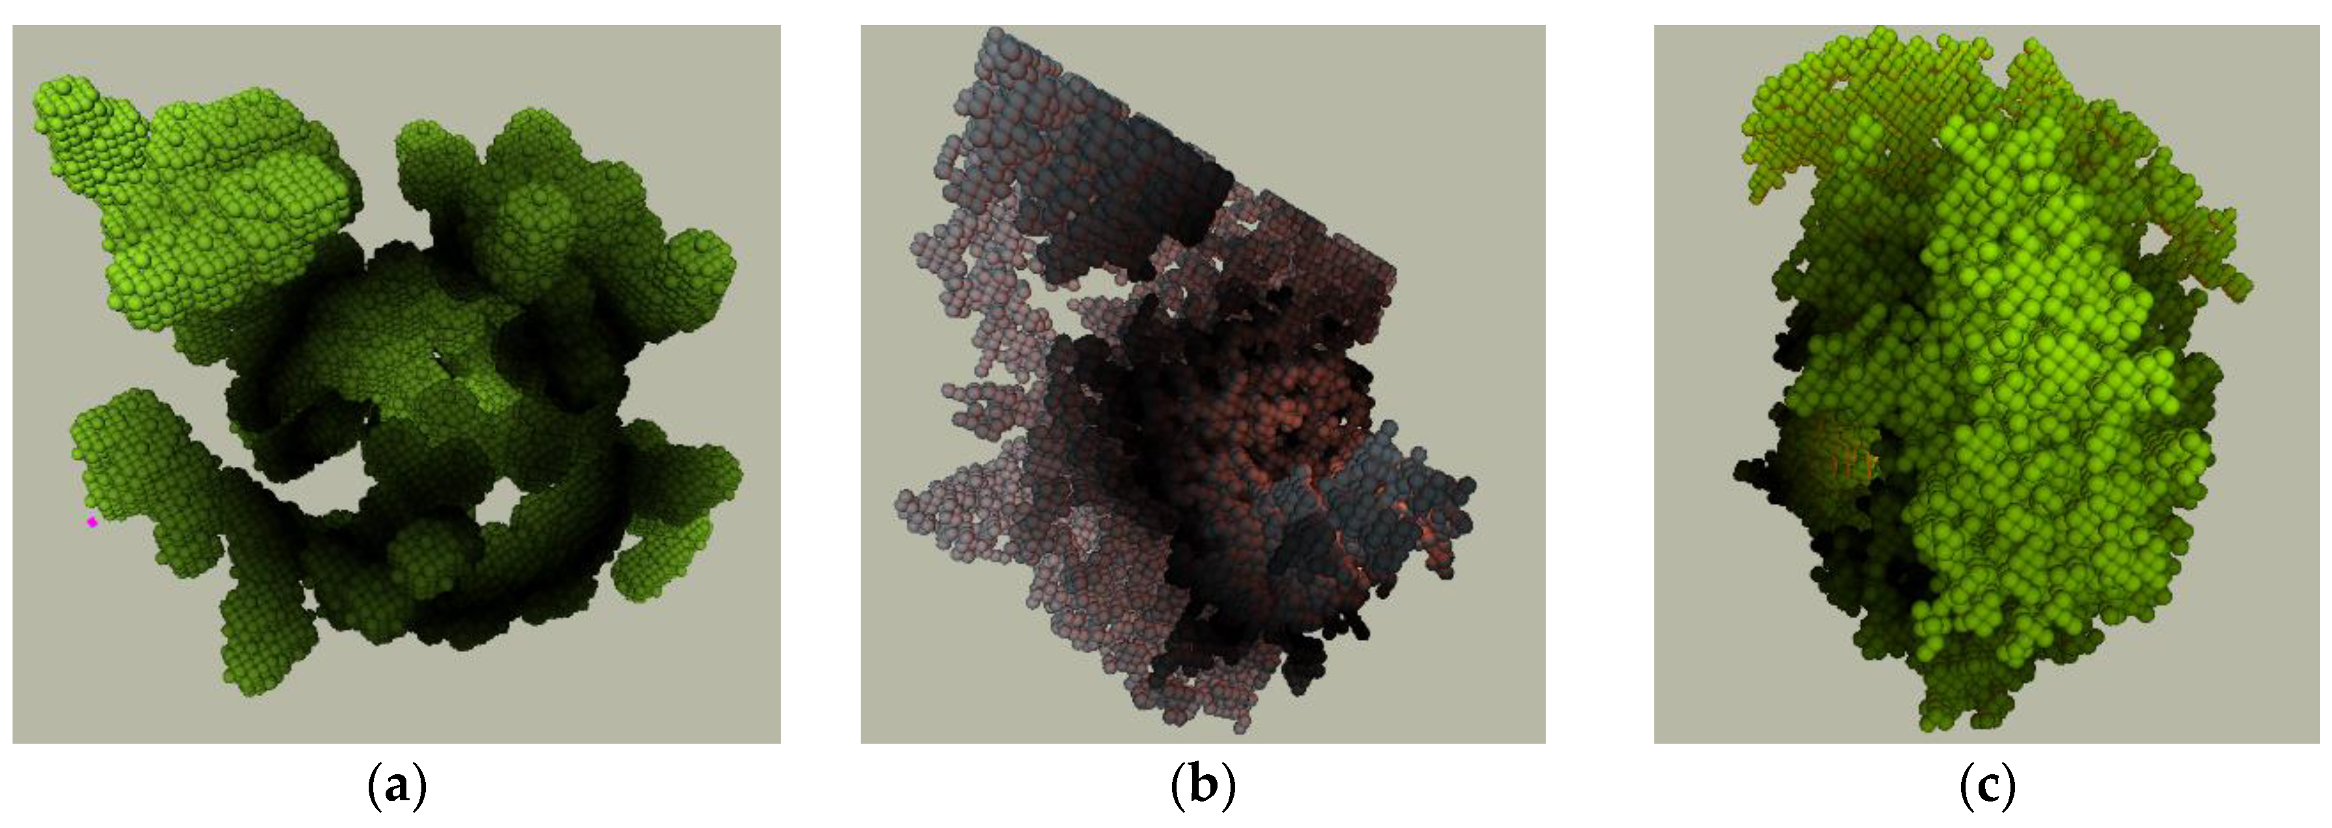
3D structures were generated for 3 catalysts:
the specific surface area is approximately 250 m2/g, average pore diameter is 10 nm (catalyst 1);
the specific surface area is approximately 500 m2/g, average pore diameter is 5–15 nm (catalyst 2);
the specific surface area is approximately 700 m2/g, average pore diameter is 5.7 nm (catalyst 3).
The generated structures are shown in
Figure 7.
The model parameters were adjusted in such a way as to ensure a given catalyst surface area, which was the main criterion for the suitability of the created structures for subsequent modeling. A separate verification of the generated structures by such a parameter as the pore size distribution was not performed, since the calculation results obtained using the developed complex model, taking into account the features of virtual structures, were evaluated.
The generated structures were imported into a diffusion modeling CA-based software to calculate the effective diffusion coefficient, taking into account the influence on the components’ diffusion both the catalyst structure and the nature of the substances.
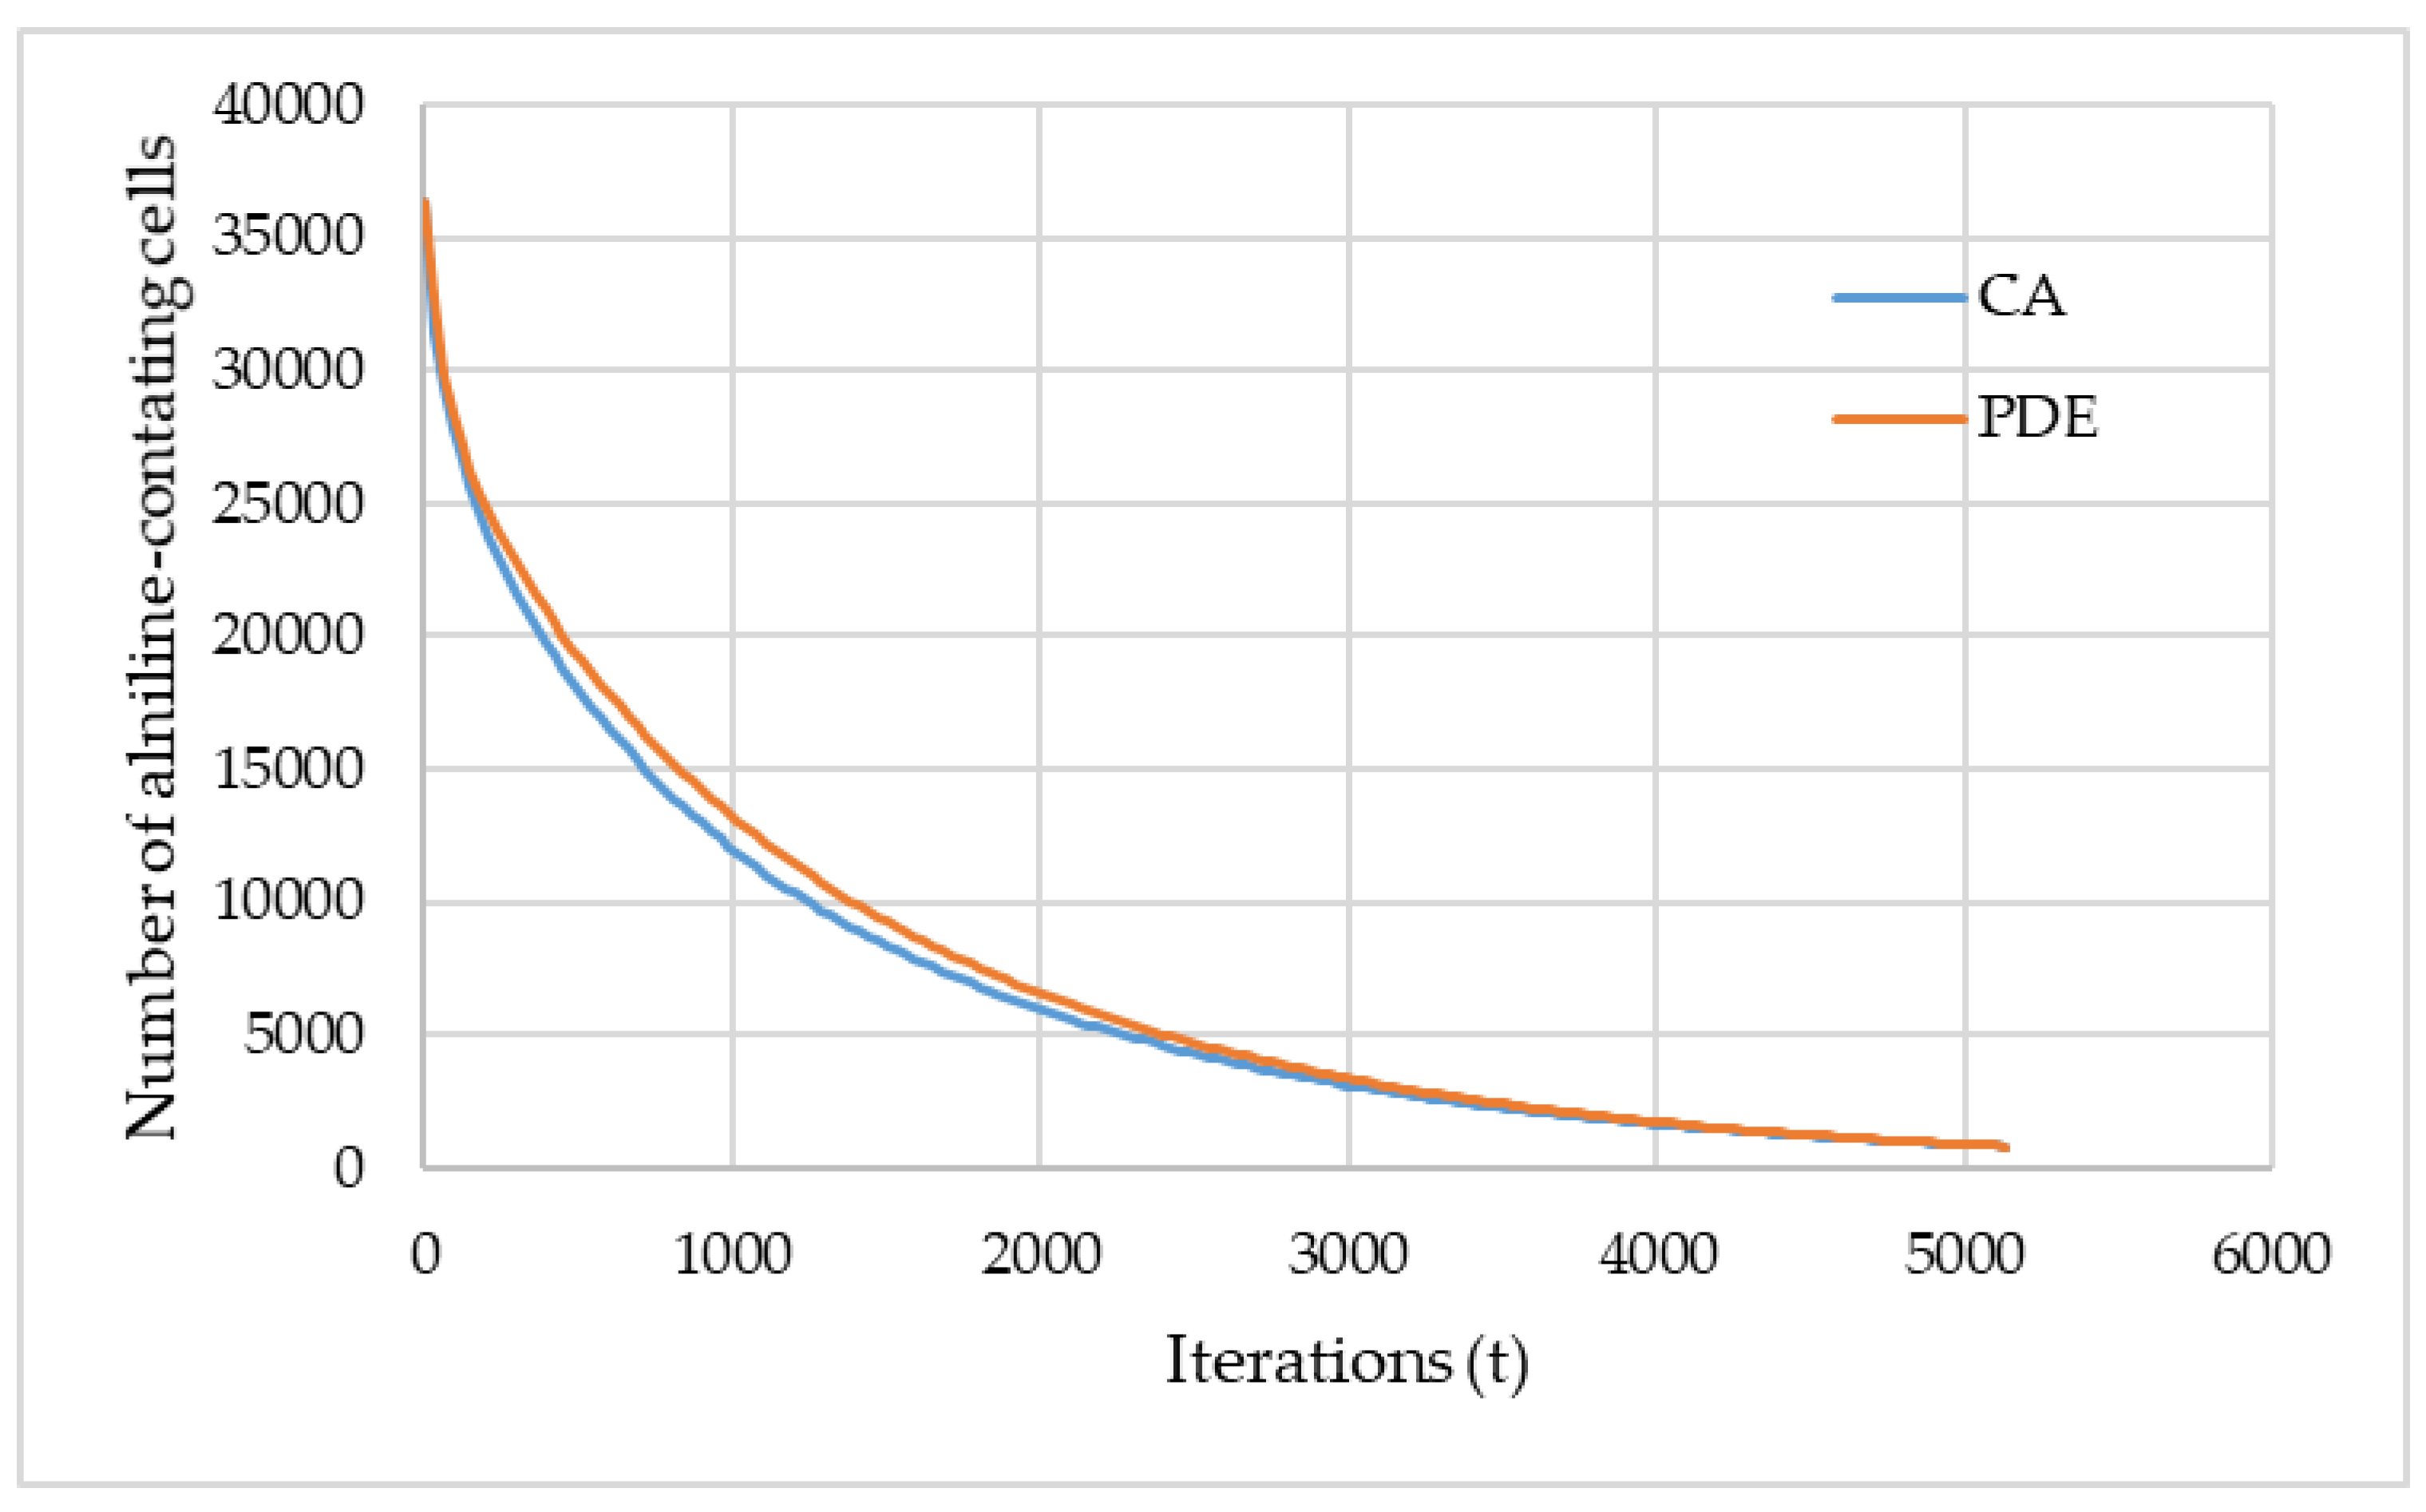
Assuming that the aniline extraction time of CA and of the numerical solution of the model should match, the most suitable value for the effective diffusion coefficient
Deff can be found as described above. The corresponding curves obtained using the PDE (partial differential equation) and CA approach are shown in
Figure 8. These data were obtained for the catalyst 1.
The presented curves demonstrate the evolution of the number of cells with the state “S1” (corresponds to aniline) predicted by the CA and PDE approaches, and the main target of comparing these curves is to adjust the CA model parameters. During the adjustment of the CA model parameters, the corresponding curve approaches the curve obtained using the PDE model.
Figure 8 shows the accuracy achieved in this work with regard to the adjustment.
First-type boundary conditions were used for the numerical solution
and the following initial condition:
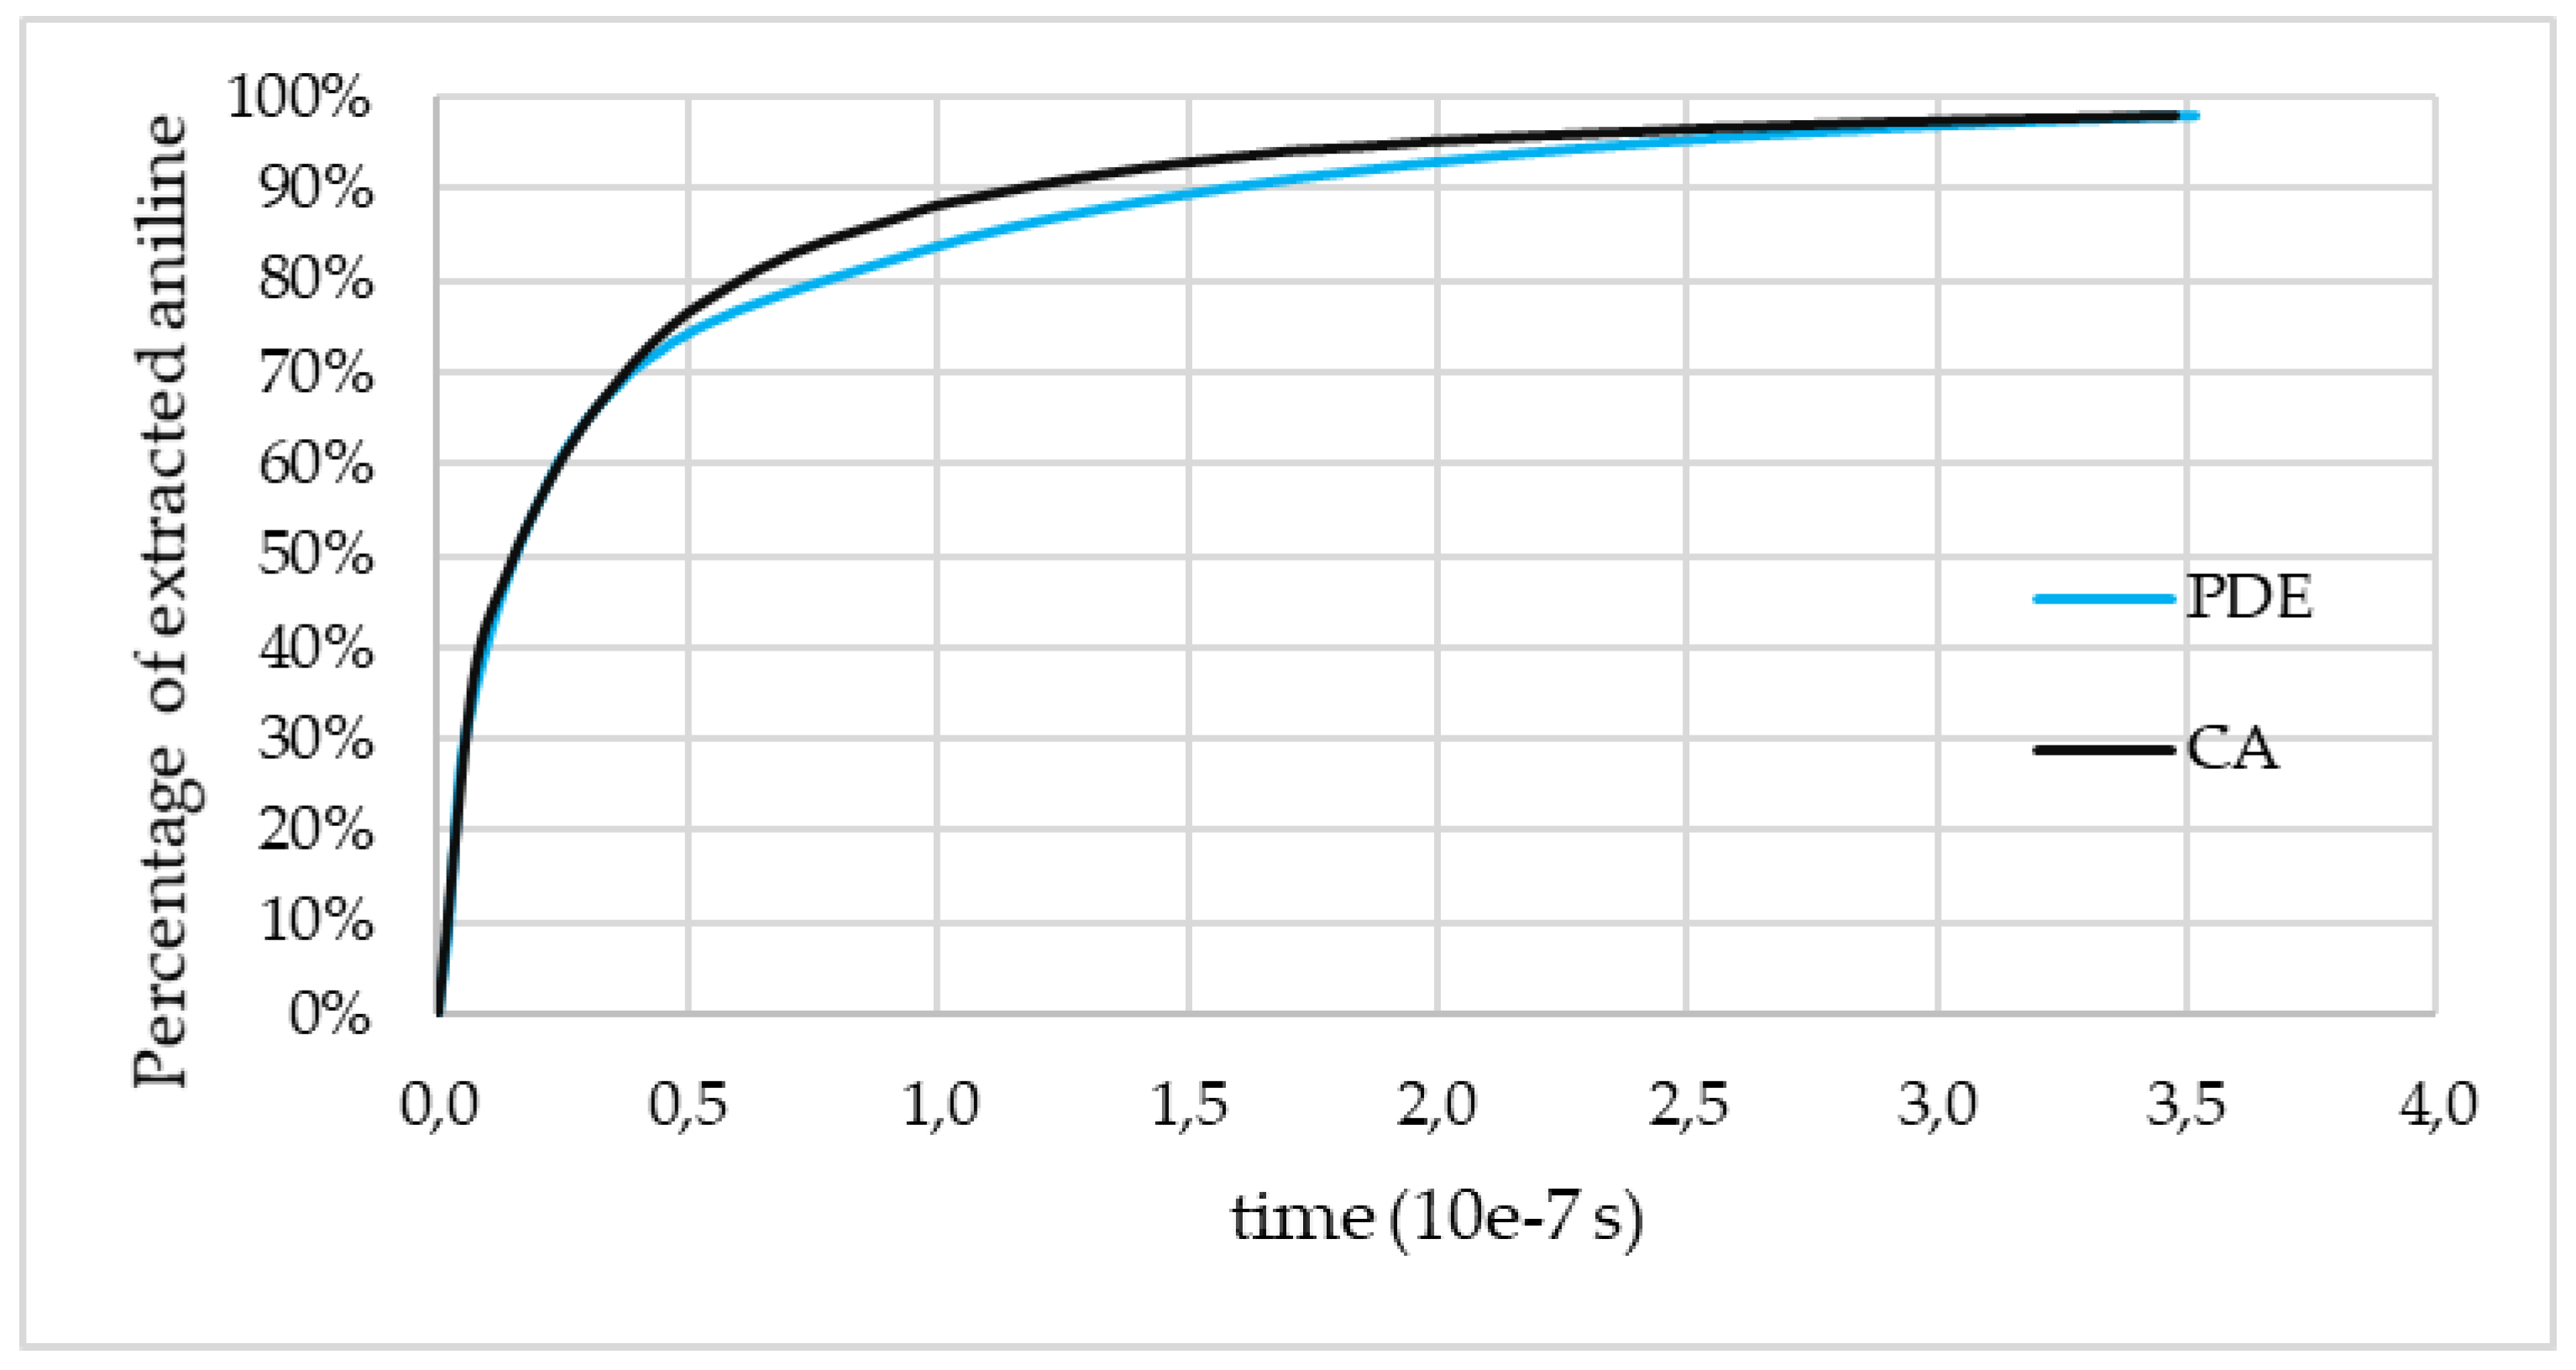
To verify the developed CA model, experimental data on the aniline extraction from a porous catalyst were used. For this, a sample of a porous catalyst of a cylindrical shape with a diameter of 5 mm and a height of 15 mm, impregnated with aniline, was placed in an experimental cell with an inner diameter of 5 mm. Thus, the possibility of methanol flowing around the catalyst sample was excluded. The experimental data is the change of the aniline concentration leaving the catalyst over time, which was measured using HPLC.
Based on the provided experimental data, the average diffusion coefficient of aniline in methanol was determined, which is equal to 1.3 × 10
−9 m
2/s. This coefficient corresponds to the fixed free diffusion coefficient in the used CA model. Based on this, the single time step of the cellular automaton is equal to:
The ratio of free (
D0) and effective (
Deff) diffusion coefficients was also determined from experimental data, which was 2.5/0.41. Using this relation, Equation (4) was numerically solved. As a result of this, the aniline extraction kinetics was obtained, which was compared with the results obtained using a cellular automaton (
Figure 9). The presented curves describe the aniline amount decrease due to diffusion in a relatively small area of the porous catalyst. In this case, the PDE curve corresponds to experimental data. Thanks to the comparison of experimental and calculated curves, the interaction energy of aniline molecules with the structure of the catalyst was determined by optimizing the parameters of the cellular automaton. This energy is 9300 J/mol.
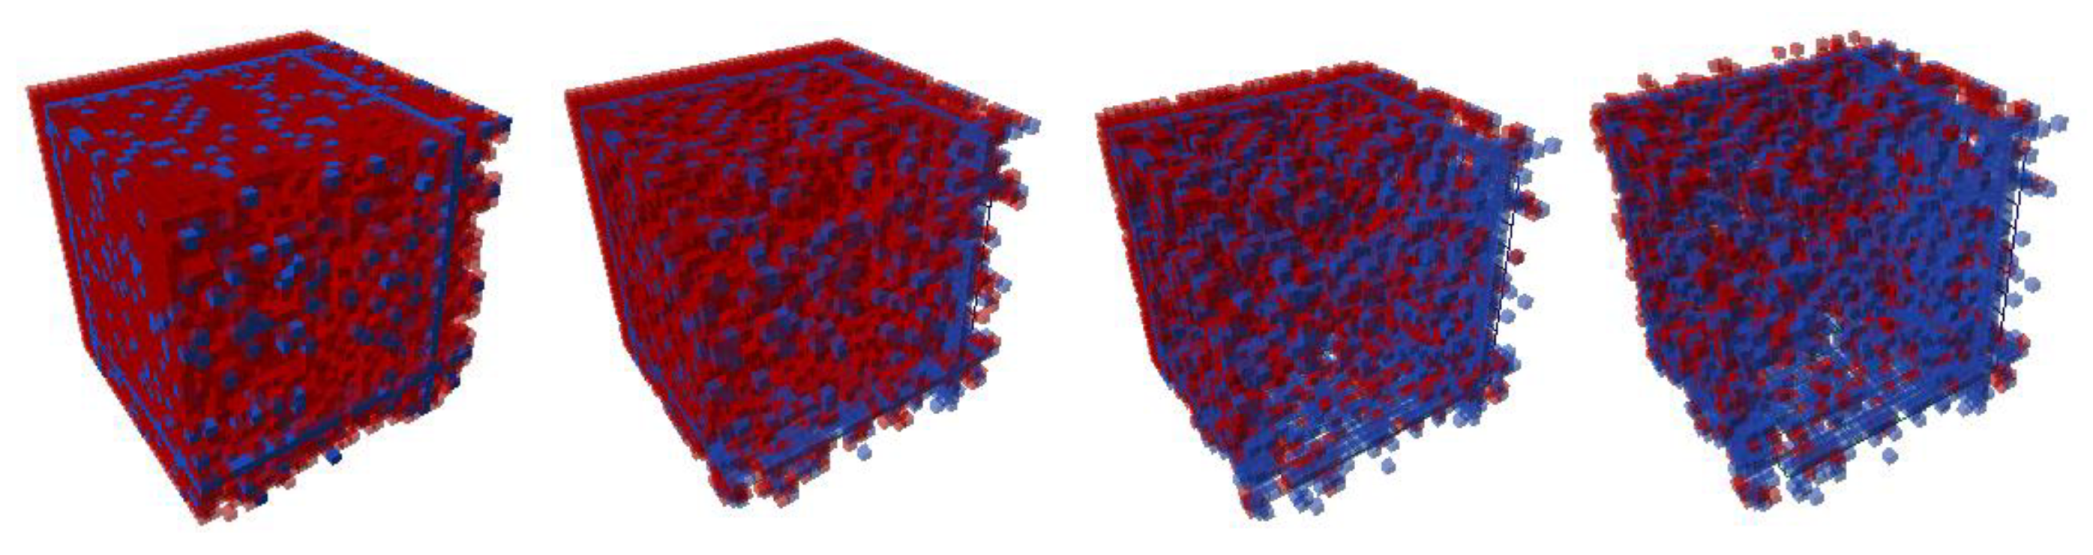
A visual representation of aniline diffusion in a porous catalyst, obtained using a cellular automaton model, is shown in
Figure 10. Cells marked in red correspond to the aniline, the blue color relates to the catalyst skeleton. As one can see, the aniline leaves the catalyst internal volume in a certain direction determined by the alcohol flux and boundary conditions. However, the aniline spatial inhomogeneity itself is not analyzed in this work, and the aniline integrated amount is considered as the most important data.
A comparison of the curves presented in
Figure 9 shows that the simulation results obtained using the used CA model are in a good agreement with the experimental data.
However, the above data do not take into account phenomena occurring outside the catalyst, which is observed in real systems. Therefore, a combination of the cellular automaton approach and CFD was required.
After substitution of the calculated effective diffusion coefficient in the CFD model several numerical experiments were carried out. The studied cases were both transient and steady-state.
The velocity of methanol at the inlet was set to 0.006 m/s. The temperature at the inlet was 293.15 K. The temperature of the wall was 318.15 K. The properties of aniline and methanol are taken from ChemCAD database and the reference conditions are shown in
Table 2.
Steady-state simulations were used to analyze methanol path lines, temperature, and velocity profiles.
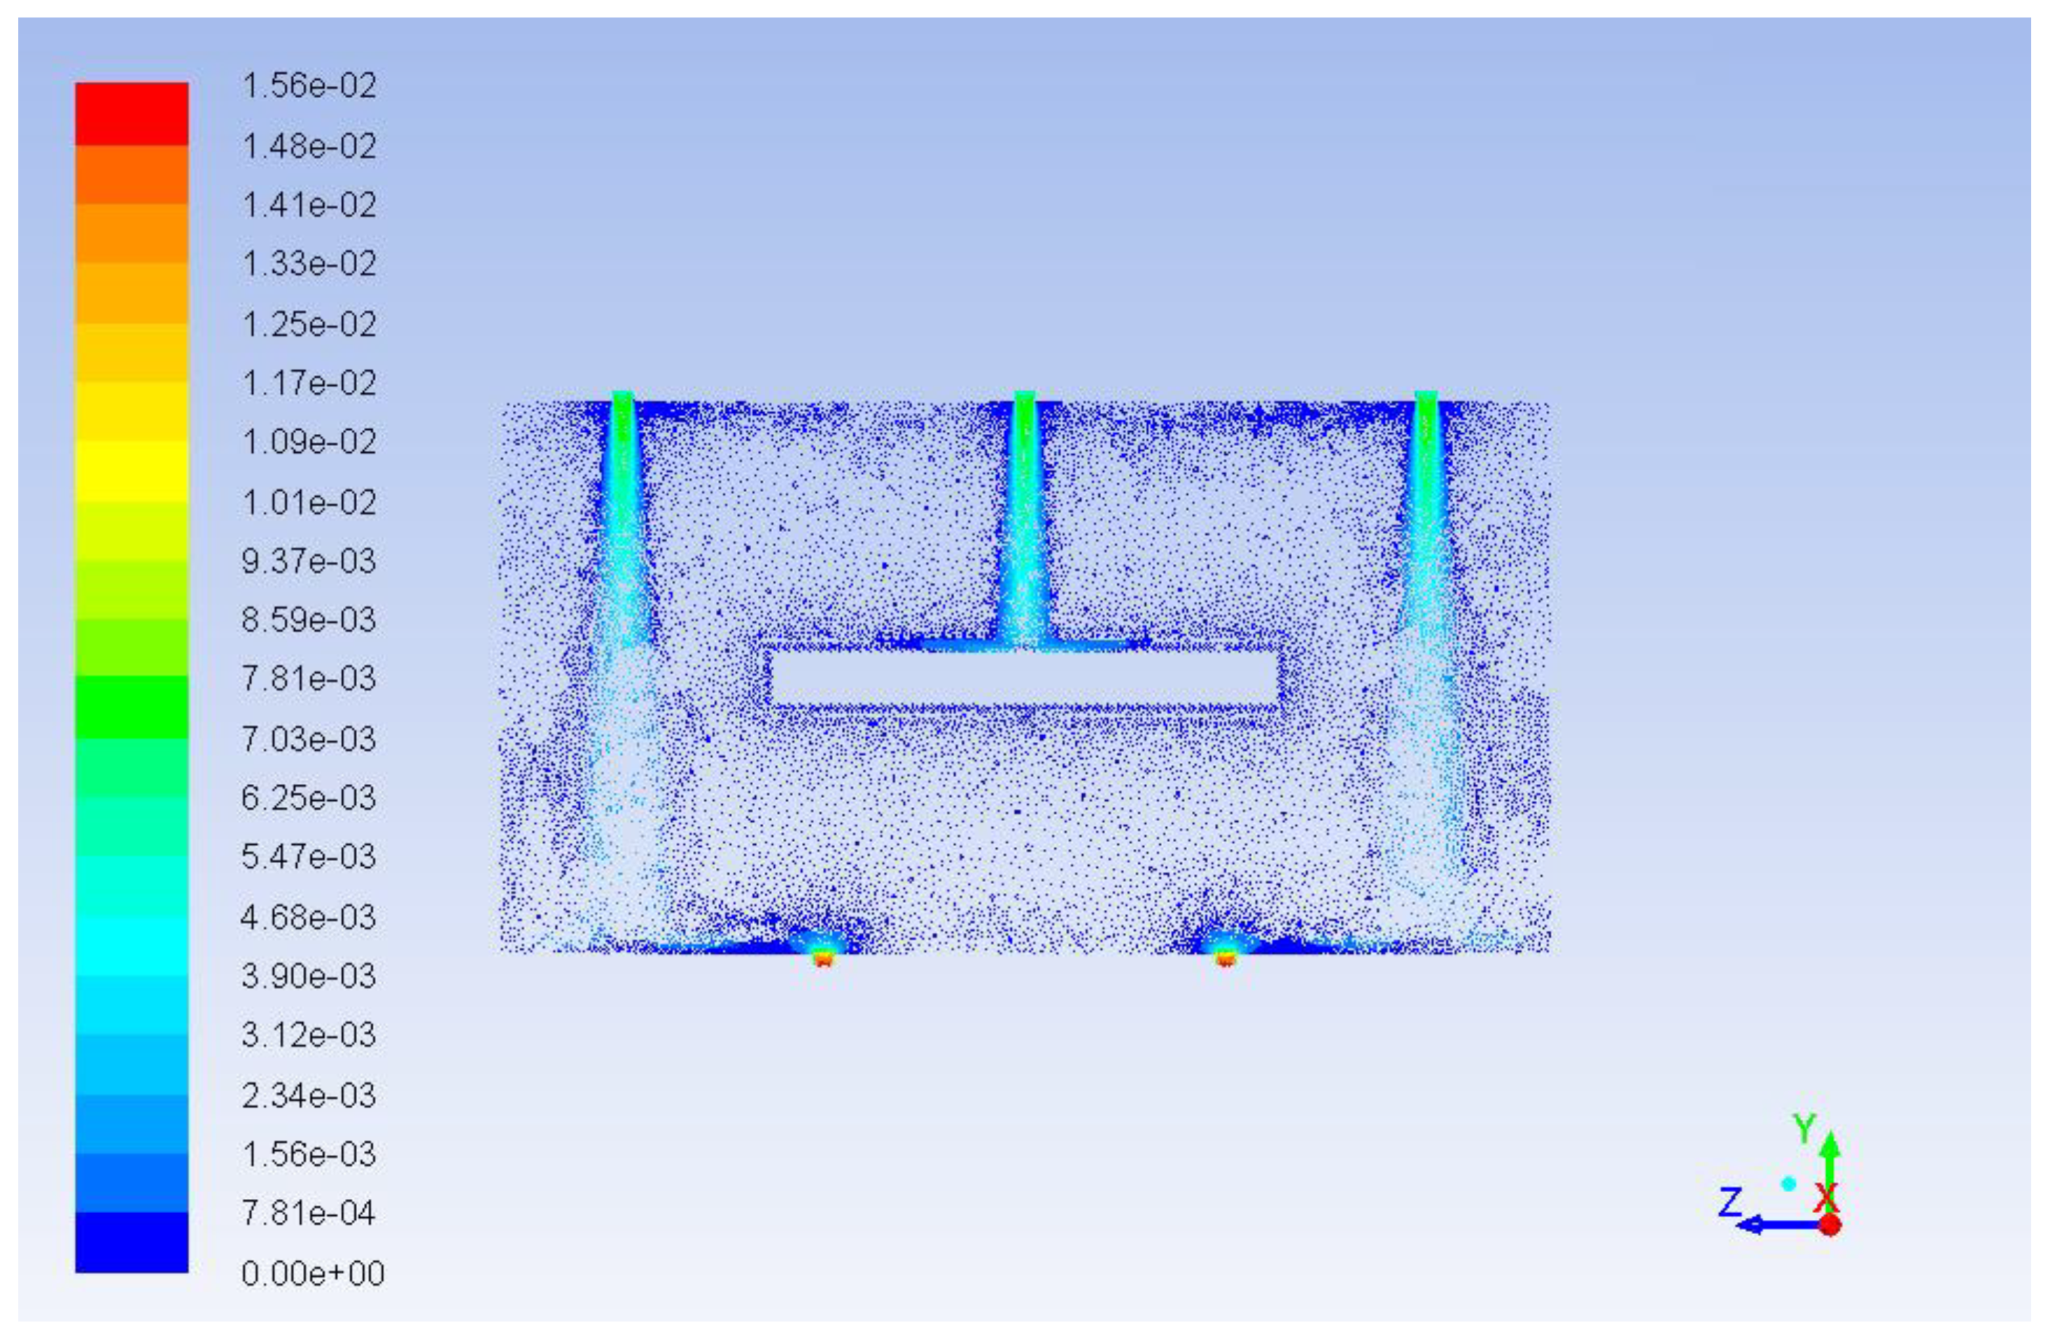
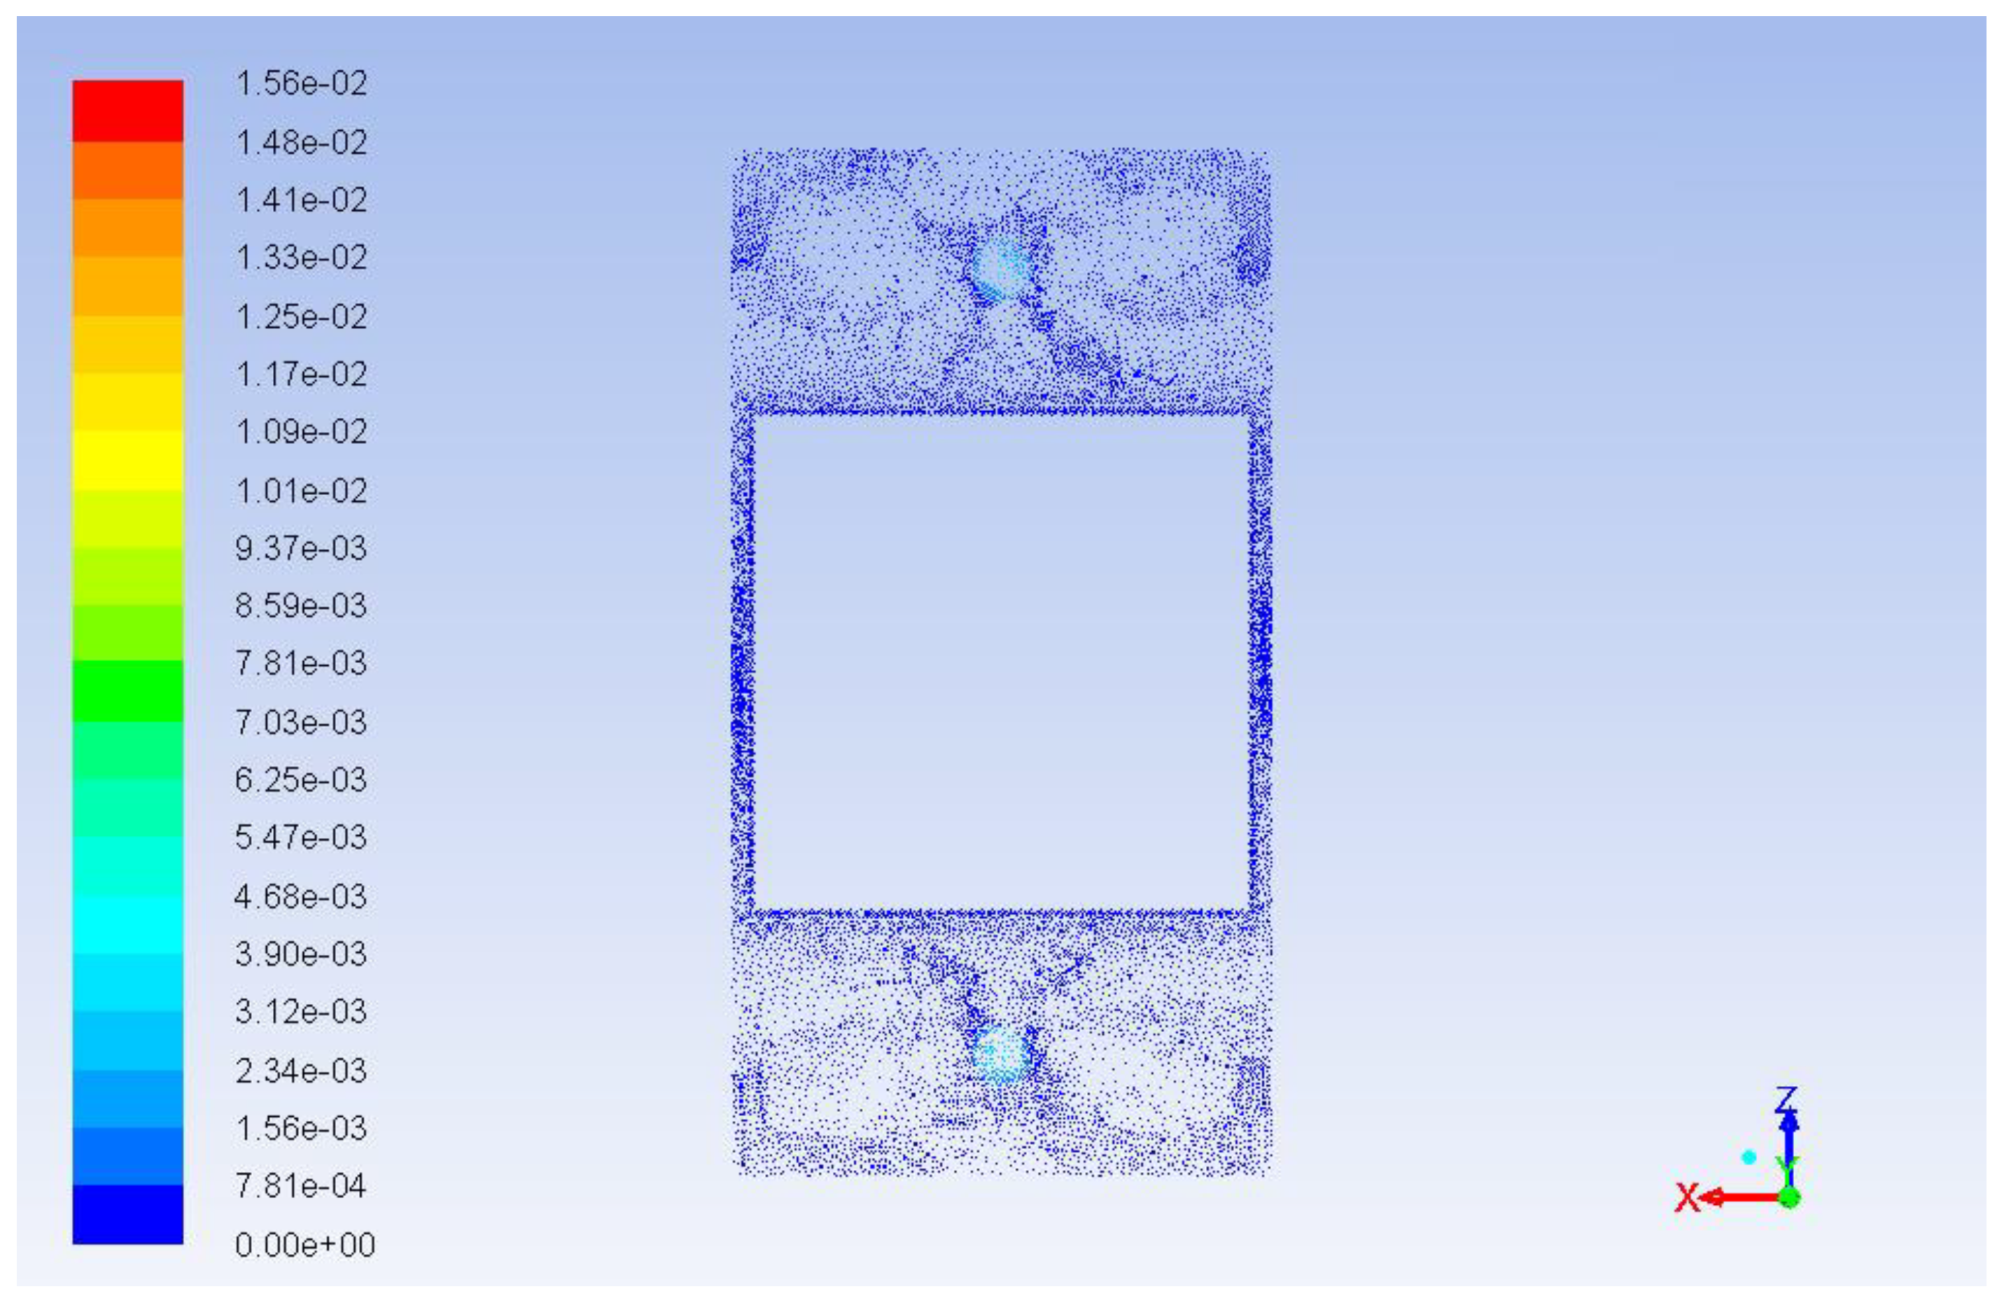
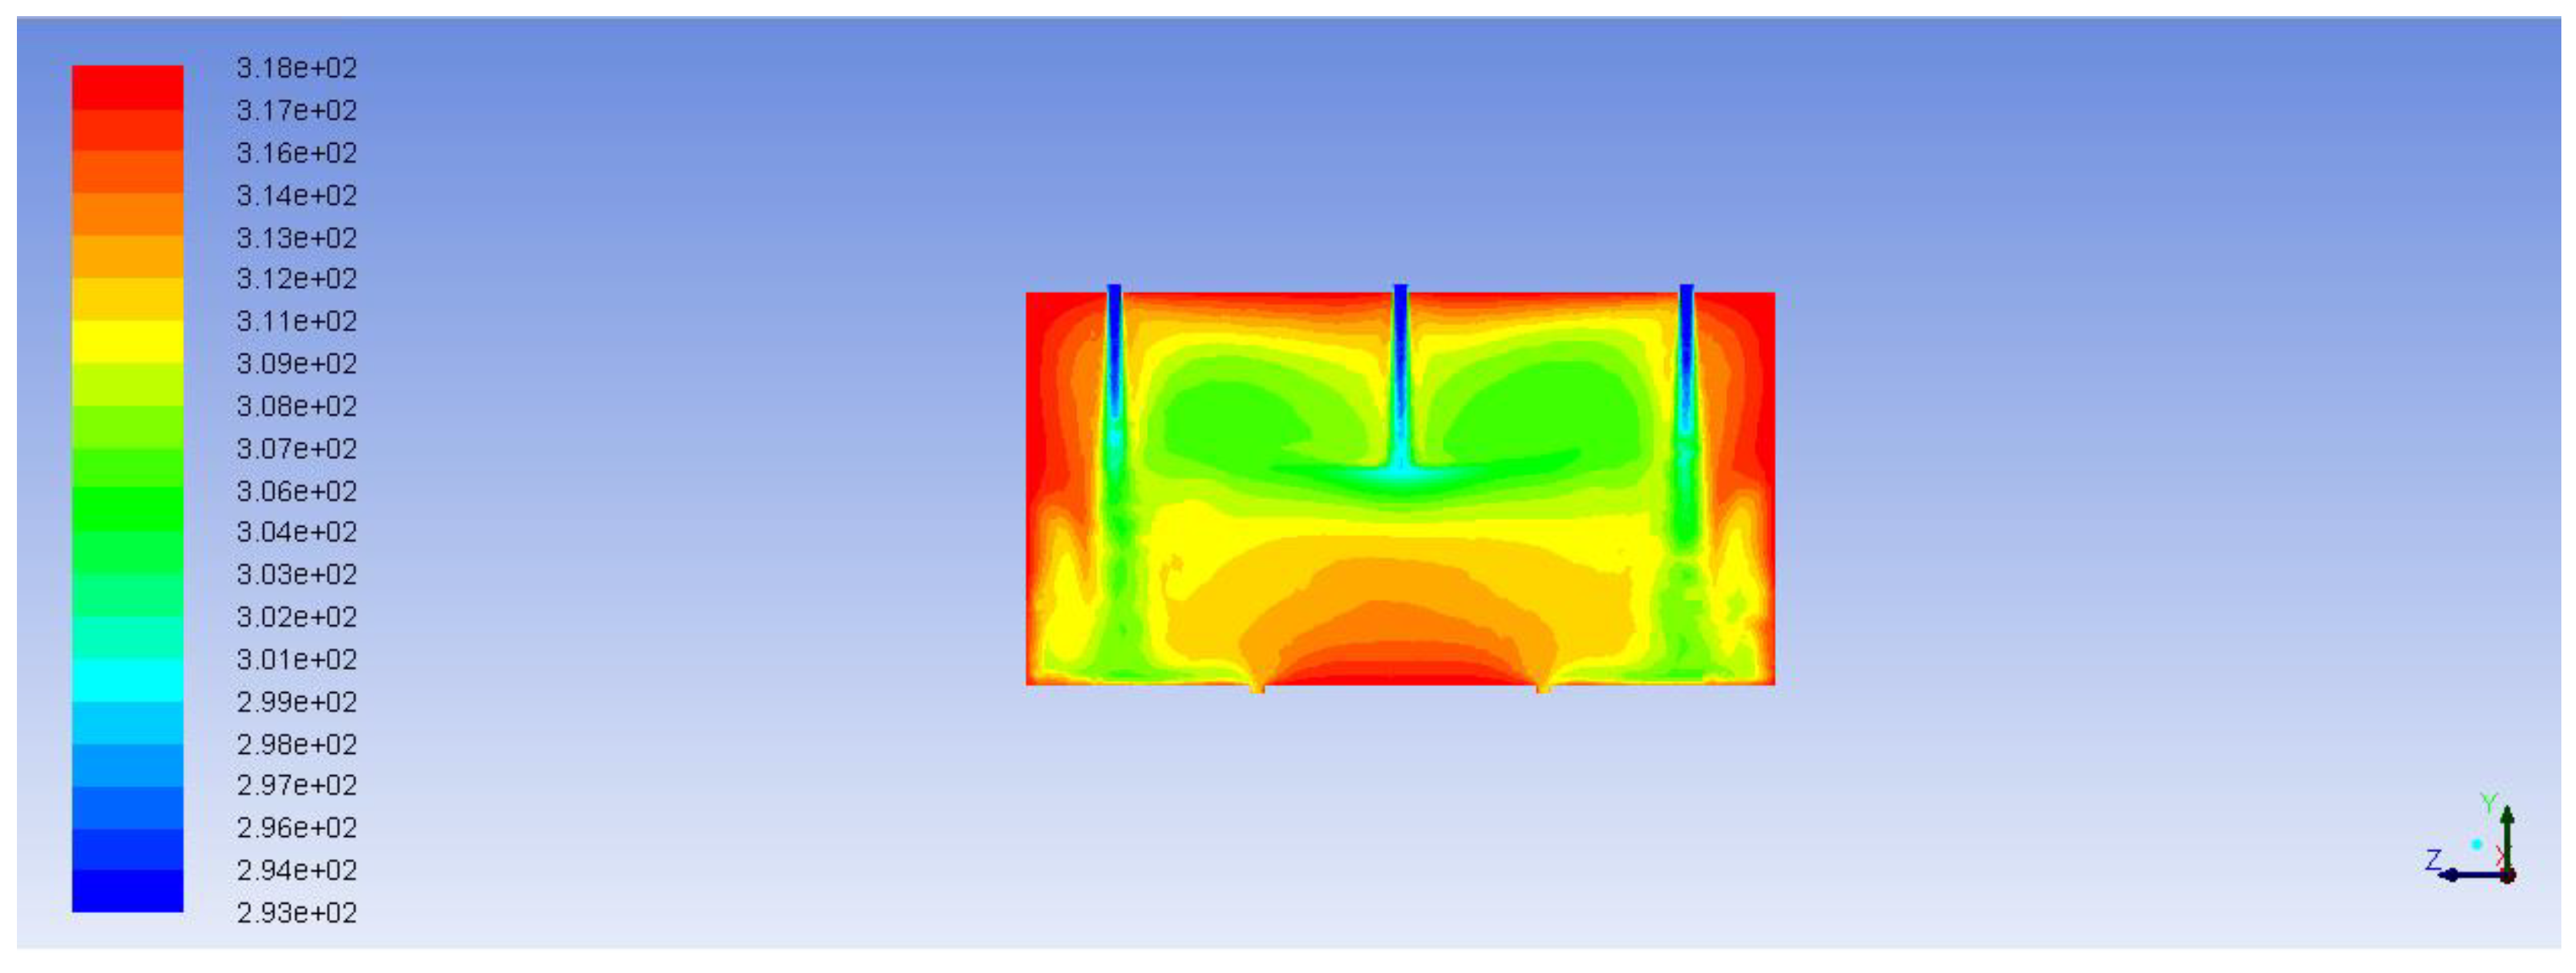
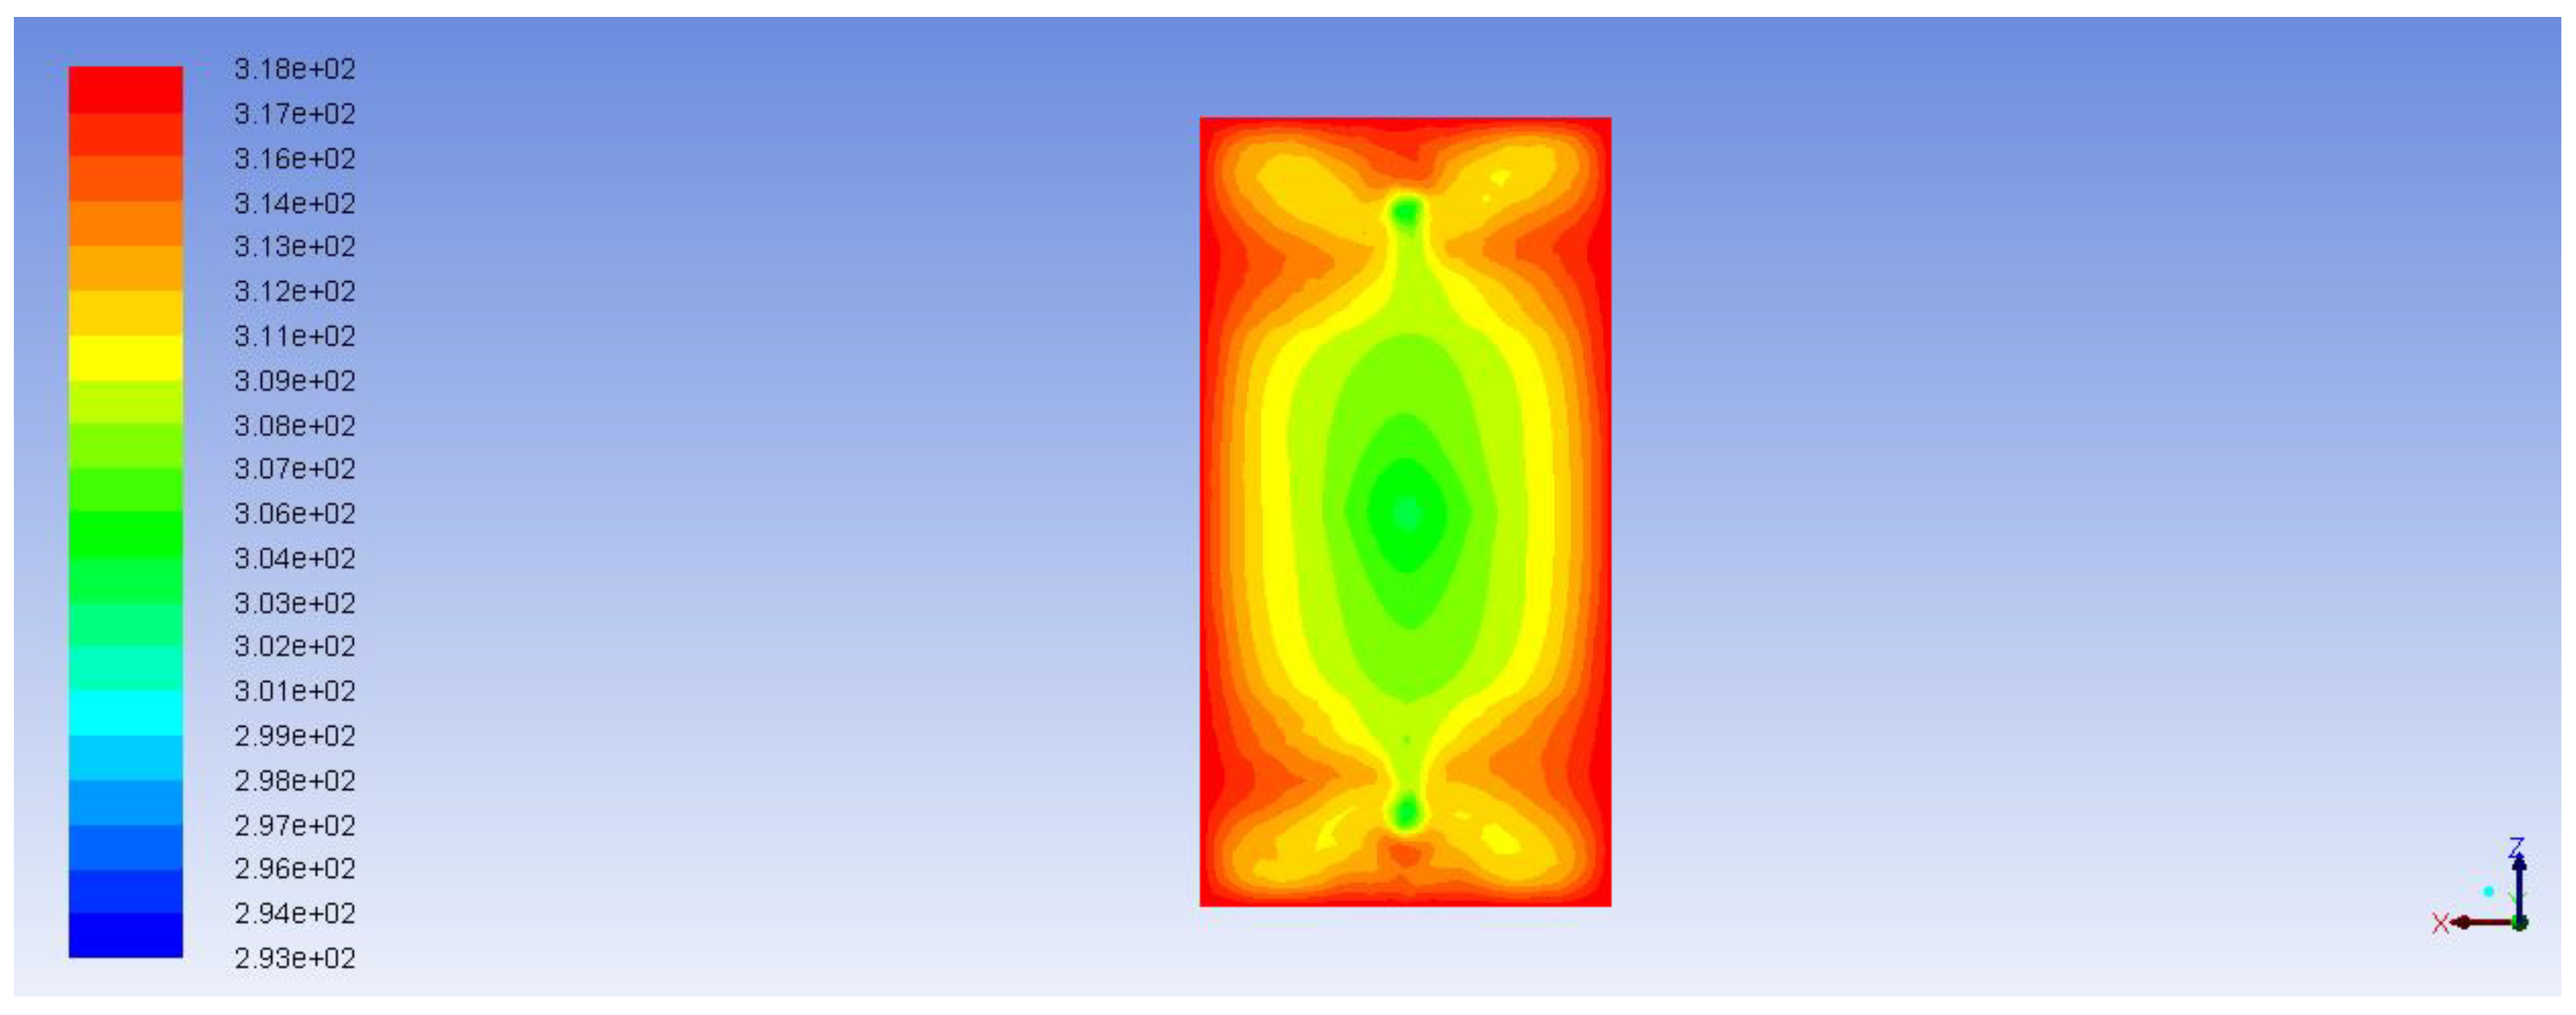
Figure 11 demonstrates the path lines starting from inlets. As can be seen, there are some circular loops because of hydrodynamic effects. These circulating flows cause substances to stay in the reactor longer than they should. The same thing can be seen from the velocity vector fields shown in
Figure 12 and
Figure 13. These velocity vector fields are projections of velocity vectors on YZ and XZ cross sections respectively. In spite of comparatively low velocities three jets are clearly visible underneath the inlets. The central jet because of the impact with the porous body surface goes sidewards and upwards then creating multiple loops. At the same time outer jets interacting with the reactor wall at the bottom show a similar behavior with circular loops underneath the catalyst.
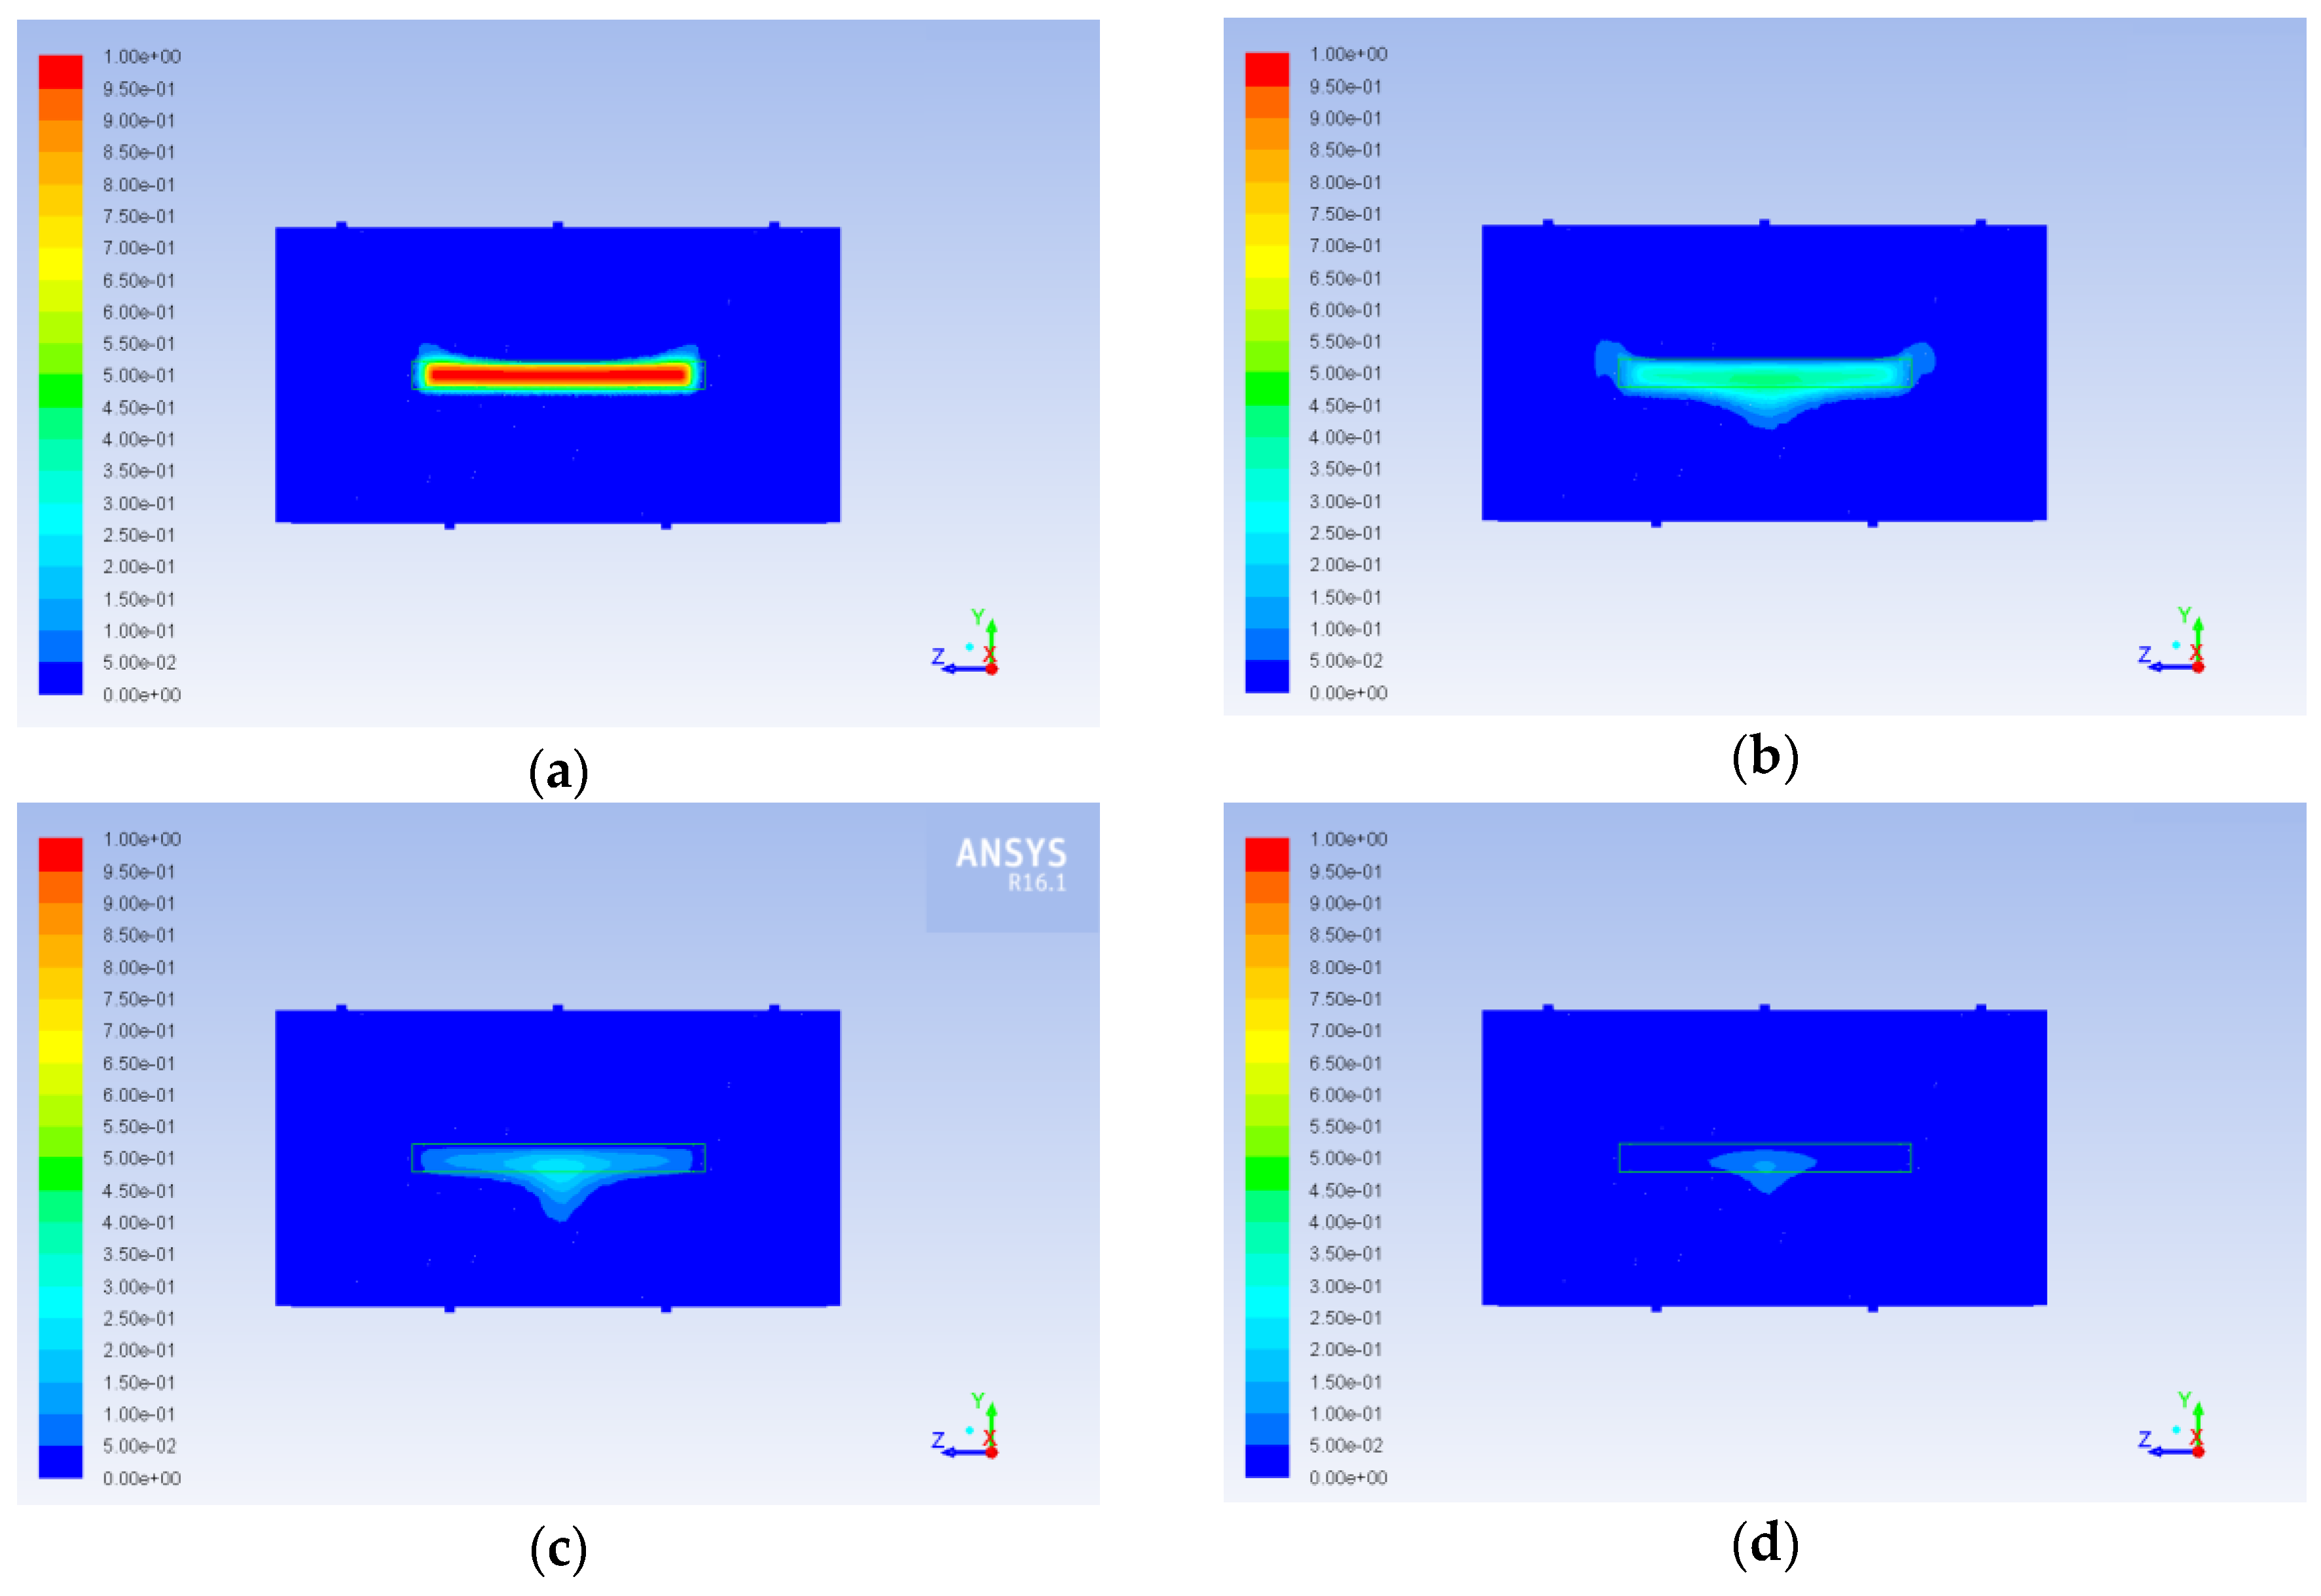
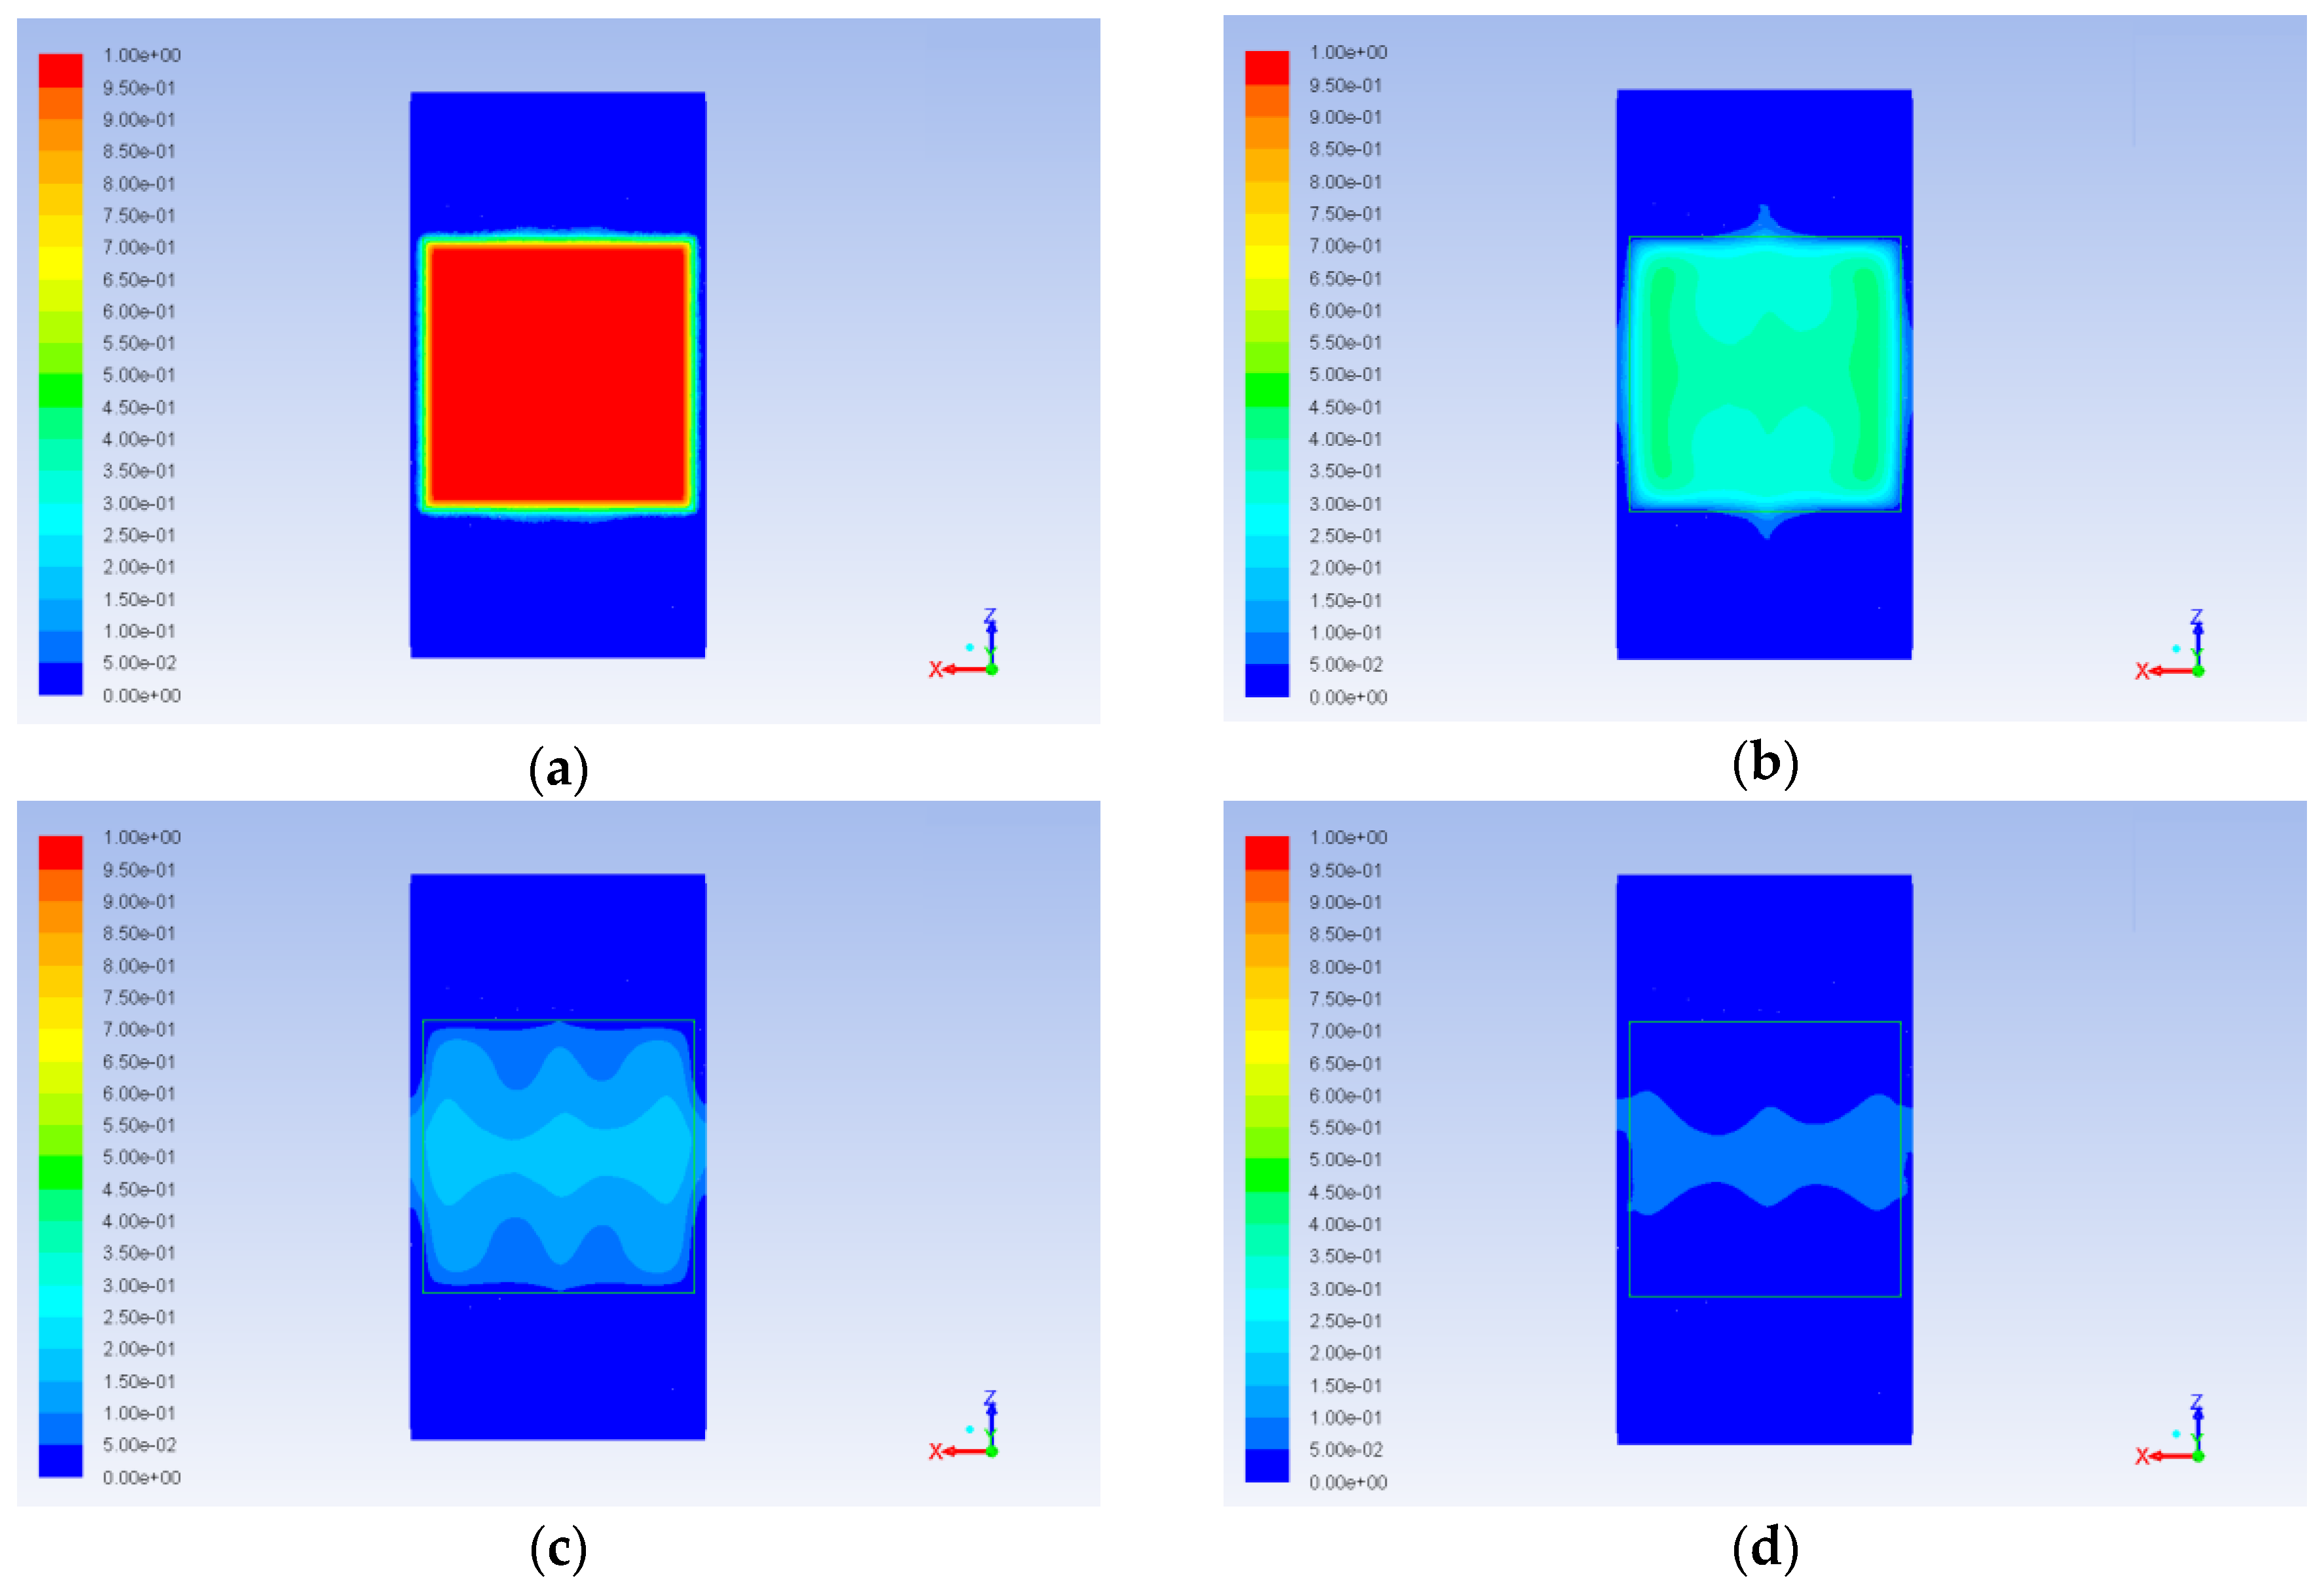
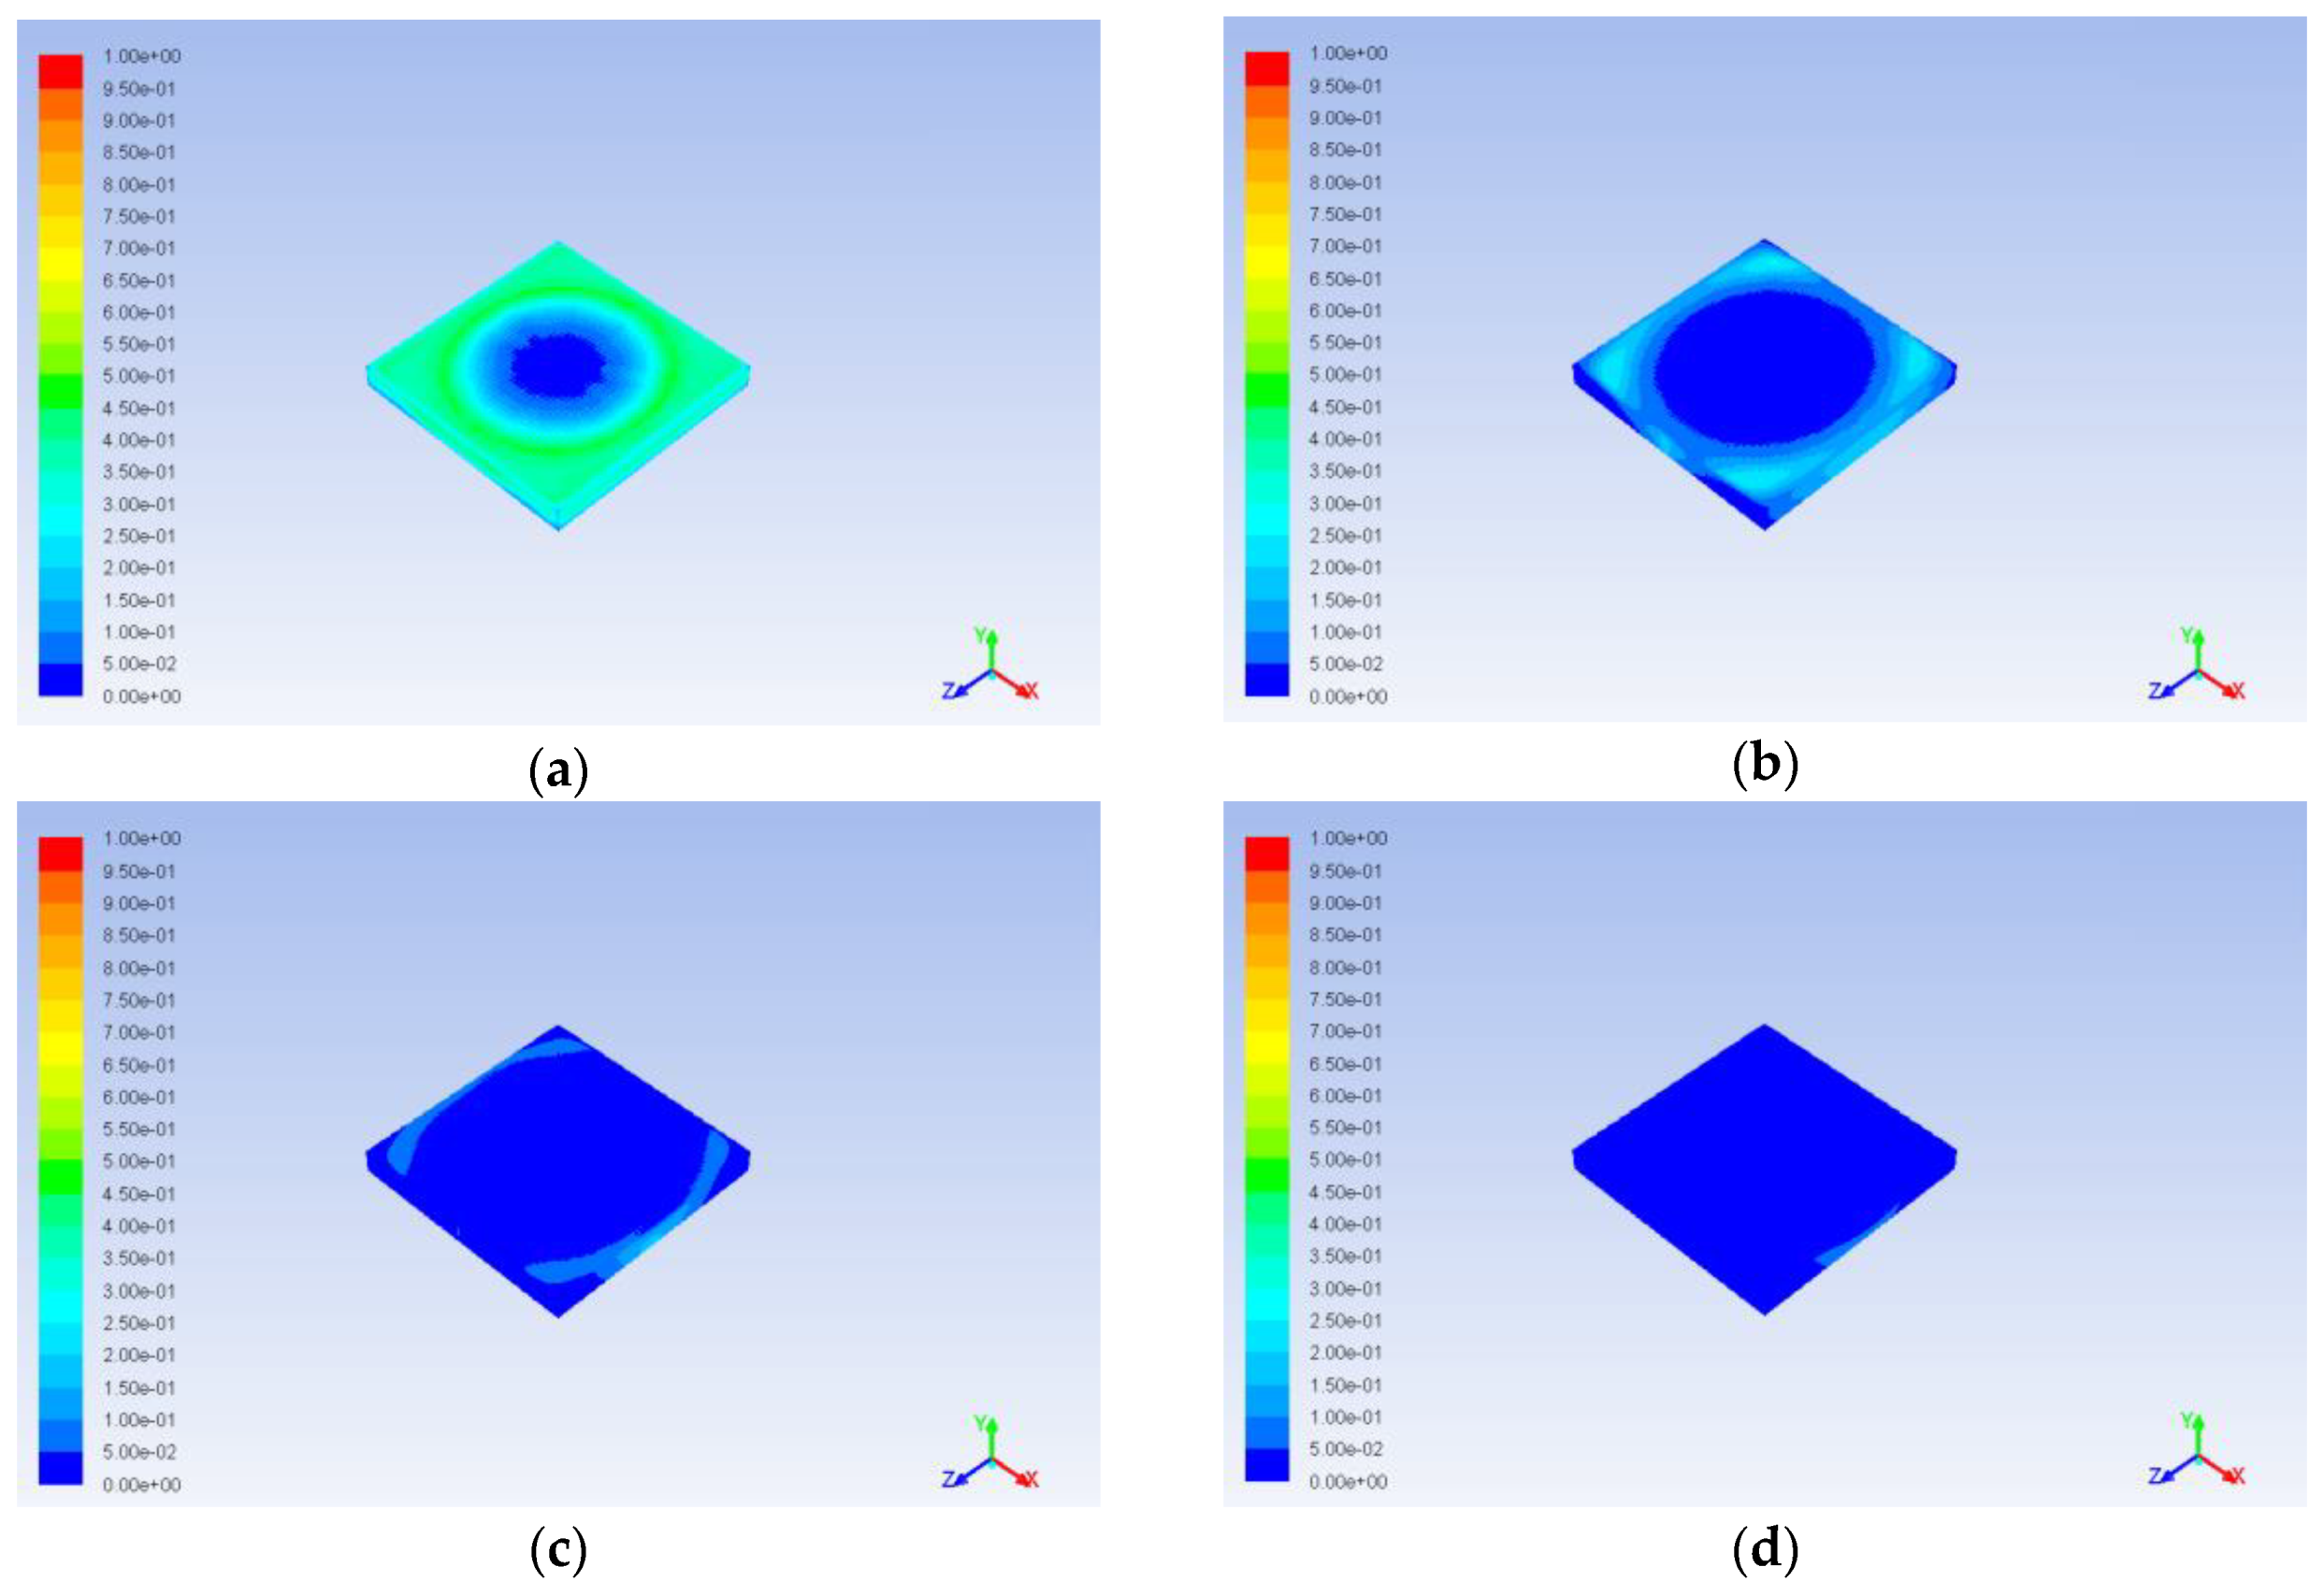
Circulation occurring due to impact of the catalyst on the alcohol flux (in case of the central jet) and due to the position of the inlets (in case of side inlets, where incoming jets come in contact with the wall of the reactor) causes non uniform aniline concentration distribution. Obviously, this is especially important at the boundary of the catalyst. Increase or decrease of aniline concentration at the boundary limits or intensifies the diffusion mass transfer inside the catalyst. This can be clearly seen in
Figure 17 and
Figure 18 at the early stages of the process (ribbed patterns in the cross section of the catalyst and circle patterns on its surface respectively). As a result, concentration gradients occur in the catalyst. These gradients are not so important for the first step of our work, since no chemical reactions were currently considered, but they definitely had to be taken into account at later stages. Similarly, aniline concentration nonuniformity in the bulk fluid does not affect the description in this work process, since the diffusion inside the catalyst is the main bottle neck, and it is sensitive mainly to the concentration at the boundary.
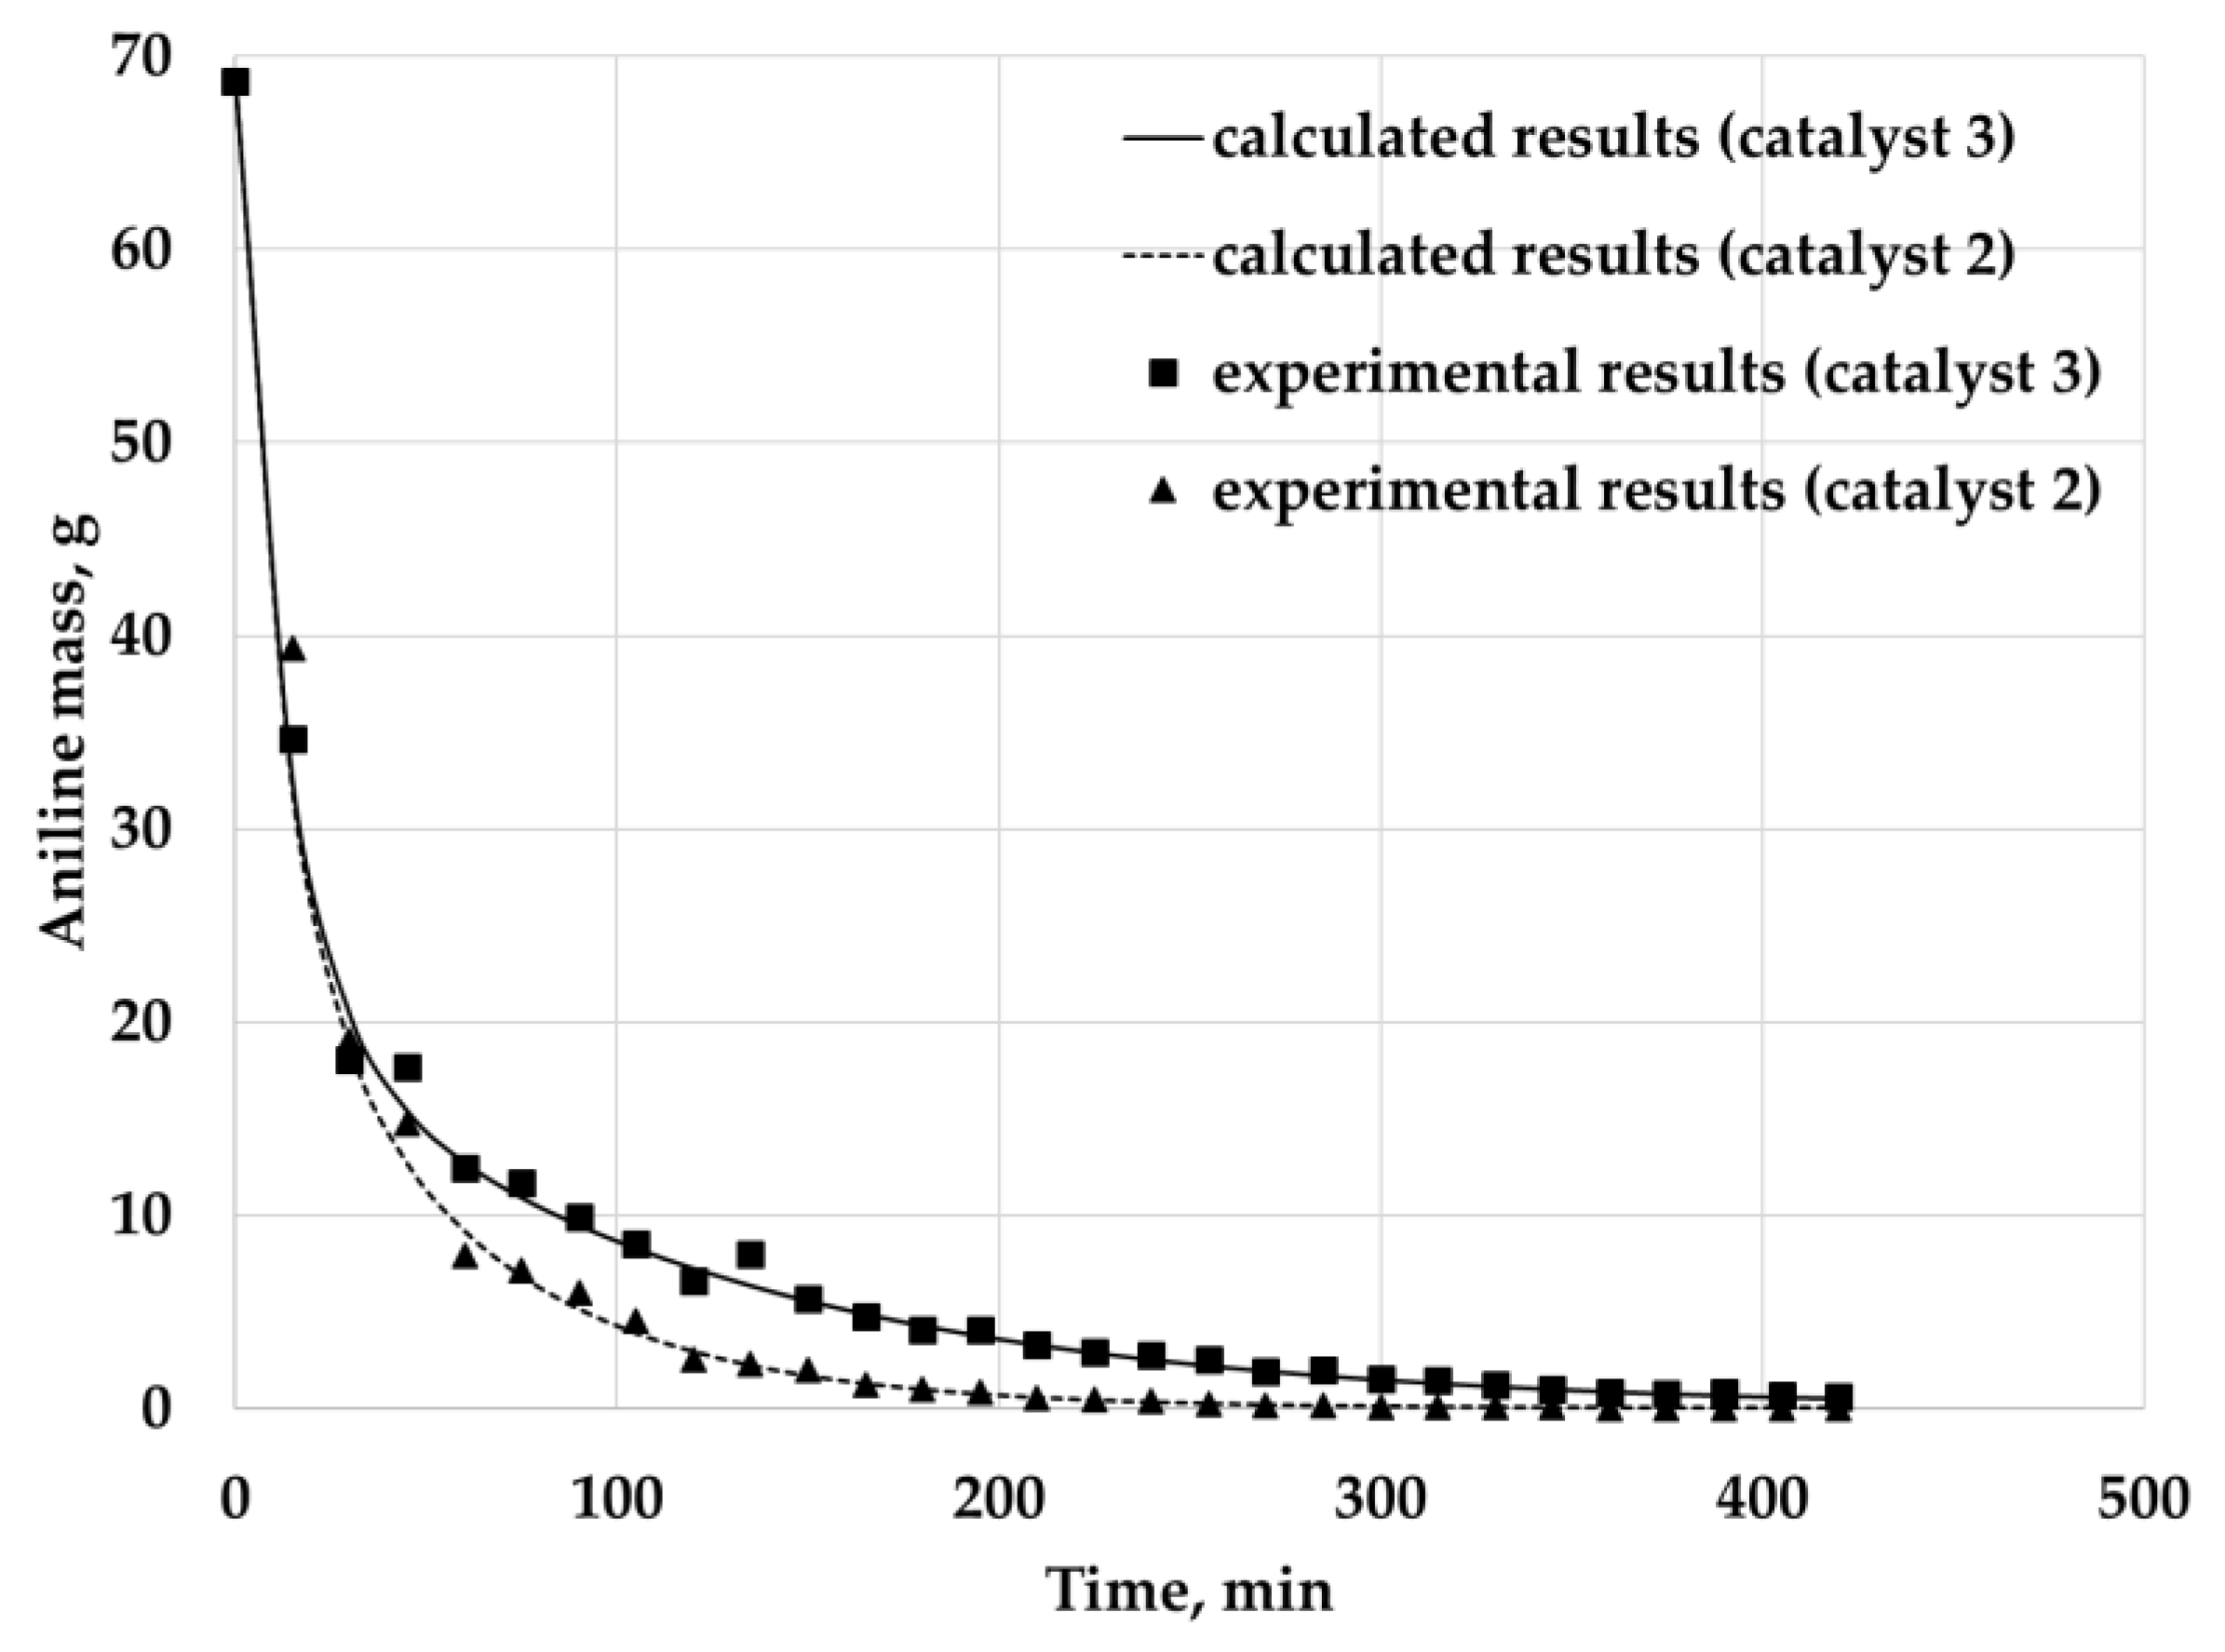
Comparison of experimental and calculated data is shown in
Figure 19. The curves represent change of aniline total mass inside the reactor within time. Experimental data were calculated using the measured concentrations at the outlet of the reactor. Calculated data were obtained via integration over the computational domain.
The calculated relative deviation is 7.3% for catalyst 3 and 10.1% for catalyst 2.
The simulation results show that the proposed multiscale approach is quite suitable for describing the diffusion of the reaction mixture components in a porous catalyst, which is one of the most important steps to build a complete model of a catalytic synthesis process. However, it should be noted that even with respect to diffusion, additional studies should be carried out, since the proposed model has not yet considered the issues of multicomponent diffusion, when individual components can significantly affect the transport of other components. This aspect is very important, since more than two components are involved in many catalytic processes.
Despite this drawback, the proposed model is a good starting point for further development. The calculation results showed that the model explicitly allows considering the influence of the catalyst structure on the process: extraction of the substance from the catalyst with a larger surface area and smaller pore size proceeds more slowly (
Figure 19). In addition to this, the use of the cellular automaton approach itself is also advantageous, since adding new transition rules to the cellular automaton is relatively simple, CA calculations can be efficiently parallelized, CA models can reproduce the behavior of rather complex systems while maintaining the simplicity of the transition rules. Spatial scales of individual cells in CA are large enough not to consider intramolecular degrees of freedom and intermolecular interactions, and at the same time it is still possible to simulate processes associated with these phenomena. As a result, there is a potential opportunity to take into account phenomena of multicomponent diffusion and chemical reactions, considering them at the microscopic level, which will allow the behavior of a system with a high spatial discretization to be studied.


