Effect of Graphene vs. Reduced Graphene Oxide in Gold Nanoparticles for Optical Biosensors—A Comparative Study


 ,
,  ,
,  , and
, and 
Abstract
:1. Introduction
Application Framework
2. Results and Discussion
2.1. Sequence 1—Addition of Carbon-Based Derivatives to AuNPs (SQ1)
2.2. Sequence 2—Addition of Carbon-Based Derivatives Prior to AuNP Formation (SQ2)
2.3. AuNP Stability Study
2.4. Simulation (Mie Theory)
3. Materials and Methods
4. Conclusions
Supplementary Materials
Author Contributions
Funding
Institutional Review Board Statement
Informed Consent Statement
Conflicts of Interest
References
- Wang, C.; Liu, M.; Wang, Z.; Li, S.; Deng, Y.; He, N. Point-of-care diagnostics for infectious diseases: From methods to devices. Nano Today 2021, 37, 101092. [Google Scholar] [CrossRef]
- IUPAC. Biosensor Definition. In Glossary for Chemists of Terms Used in Biotechnology; Blackwell Scientific Publications: Oxford, UK, 1997. [Google Scholar] [CrossRef]
- Yaseen, M.; Humayun, M.; Khan, A.; Usman, M.; Ullah, H.; Tahir, A.A.; Ullah, H. Preparation, Functionalization, Modification, and Applications of Nanostructured Gold: A Critical Review. Energies 2021, 14, 1278. [Google Scholar] [CrossRef]
- Špačková, B.; Wrobel, P.; Bocková, M.; Homola, J. Optical Biosensors Based on Plasmonic Nanostructures: A Review. Proc. IEEE 2016, 104, 2380–2408. [Google Scholar] [CrossRef]
- Ou, J.; Zhou, Z.; Chen, Z.; Tan, H. Optical Diagnostic Based on Functionalized Gold Nanoparticles. Int. J. Mol. Sci. 2019, 20, 4346. [Google Scholar] [CrossRef] [PubMed] [Green Version]
- Khalil, I.; Julkapli, N.; Yehye, W.; Basirun, W.; Bhargava, S. Graphene–Gold Nanoparticles Hybrid—Synthesis, Functionalization, and Application in a Electrochemical and Surface-Enhanced Raman Scattering Biosensor. Materials 2016, 9, 406. [Google Scholar] [CrossRef] [PubMed] [Green Version]
- Banerjee, A.N. Graphene and its derivatives as biomedical materials: Future prospects and challenges. Interface Focus 2018, 8, 20170056. [Google Scholar] [CrossRef]
- Jung, I.; Dikin, D.A.; Piner, R.D.; Ruoff, R.S. Tunable Electrical Conductivity of Individual Graphene Oxide Sheets Reduced at “Low” Temperatures. Nano Lett. 2008, 8, 4283–4287. [Google Scholar] [CrossRef]
- Guo, W.; Wu, L.; Fan, K.; Nie, D.; He, W.; Yang, J.; Zhao, Z.; Han, Z. Reduced Graphene Oxide-Gold Nanoparticle Nanoframework as a Highly Selective Separation Material for Aflatoxins. Sci. Rep. 2017, 7, 14484. [Google Scholar] [CrossRef]
- Alegria, E.; Ribeiro, A.; Mendes, M.; Ferraria, A.; do Rego, A.; Pombeiro, A. Effect of Phenolic Compounds on the Synthesis of Gold Nanoparticles and its Catalytic Activity in the Reduction of Nitro Compounds. Nanomaterials 2018, 8, 320. [Google Scholar] [CrossRef] [Green Version]
- Dortez, S.; González, M.C.; Crevillen, A.G.; Escarpa, A. Gold nanostructure-related non-plasmon resonance absorption band as a fingerprint of ortho-alkyl substituted phenolic compounds. Microchem. J. 2021, 171, 106788. [Google Scholar] [CrossRef]
- Al-Radadi, N.S. Facile one-step green synthesis of gold nanoparticles (AuNp) using licorice root extract: Antimicrobial and anticancer study against HepG2 cell line. Arab. J. Chem. 2021, 14, 102956. [Google Scholar] [CrossRef]
- Chelly, M.; Chelly, S.; Zribi, R.; Bouaziz-Ketata, H.; Gdoura, R.; Lavanya, N.; Veerapandi, G.; Sekar, C.; Neri, G. Synthesis of Silver and Gold Nanoparticles from Rumex roseus Plant Extract and Their Application in Electrochemical Sensors. Nanomaterials 2021, 11, 739. [Google Scholar] [CrossRef] [PubMed]
- Verma, S.; Singh, A.; Shukla, A.; Kaswan, J.; Arora, K.; Ramirez-Vick, J.; Singh, P.; Singh, S.P. Anti-IL8/AuNPs-rGO/ITO as an Immunosensing Platform for Noninvasive Electrochemical Detection of Oral Cancer. ACS Appl. Mater. Interfaces 2017, 9, 27462–27474. [Google Scholar] [CrossRef]
- Vashist, S.K.; Luppa, P.B.; Yeo, L.Y.; Ozcan, A.; Luong, J.H.T. Emerging Technologies for Next-Generation Point-of-Care Testing. Trends Biotechnol. 2015, 33, 692–705. [Google Scholar] [CrossRef] [PubMed]
- Zeng, S.; Baillargeat, D.; Ho, H.-P.; Yong, K.-T. Nanomaterials enhanced surface plasmon resonance for biological and chemical sensing applications. Chem. Soc. Rev. 2014, 43, 3426–3452. [Google Scholar] [CrossRef] [PubMed]
- Sharma, P.; Tuteja, S.K.; Bhalla, V.; Shekhawat, G.; Dravid, V.P.; Suri, C.R. Bio-functionalized graphene–graphene oxide nanocomposite based electrochemical immunosensing. Biosens. Bioelectron. 2013, 39, 99–105. [Google Scholar] [CrossRef] [PubMed] [Green Version]
- Fantoni, A.; Vygranenko, Y.; Maçarico, A.F.; Serafinelli, C.; Fernandes, M.; Mansour, R.; Jesus, R.; Vieira, M. Arrayed graphene enhanced surface plasmon resonance for sensing applications. In Optical Components and Materials XVIII; Digonnet, M.J., Jiang, S., Eds.; SPIE: Bellingham, DC, USA, 2021. [Google Scholar]
- Gao, X.-G.; Cheng, L.-X.; Jiang, W.-S.; Li, X.-K.; Xing, F. Graphene and its Derivatives-Based Optical Sensors. Front. Chem. 2021, 9, 615164. [Google Scholar] [CrossRef]
- Galande, C.; Mohite, A.D.; Naumov, A.V.; Gao, W.; Ci, L.; Ajayan, A.; Gao, H.; Srivastava, A.; Weisman, R.B.; Ajayan, P.M. Quasi-Molecular Fluorescence from Graphene Oxide. Sci. Rep. 2011, 1, 85. [Google Scholar] [CrossRef] [Green Version]
- Tsai, M.-F.; Chang, S.-H.G.; Cheng, F.-Y.; Shanmugam, V.; Cheng, Y.-S.; Su, C.-H.; Yeh, C.-S. Au Nanorod Design as Light-Absorber in the First and Second Biological Near-Infrared Windows for In Vivo Photothermal Therapy. ACS Nano 2013, 7, 5330–5342. [Google Scholar] [CrossRef]
- Pramanik, A.; Fan, Z.; Chavva, S.R.; Sinha, S.S.; Ray, P.C. Highly Efficient and Excitation Tunable Two-Photon Luminescence Platform For Targeted Multi-Color MDRB Imaging Using Graphene Oxide. Sci. Rep. 2015, 4, 6090. [Google Scholar] [CrossRef] [Green Version]
- Kalluru, P.; Vankayala, R.; Chiang, C.-S.; Hwang, K.C. Nano-graphene oxide-mediated In vivo fluorescence imaging and bimodal photodynamic and photothermal destruction of tumors. Biomaterials 2016, 95, 1–10. [Google Scholar] [CrossRef] [PubMed]
- Song, X.; Li, S.; Guo, H.; You, W.; Shang, X.; Li, R.; Tu, D.; Zheng, W.; Chen, Z.; Yang, H.; et al. Graphene-Oxide-Modified Lanthanide Nanoprobes for Tumor-Targeted Visible/NIR-II Luminescence Imaging. Angew. Chem. Int. Ed. 2019, 58, 18981–18986. [Google Scholar] [CrossRef] [PubMed]
- Lai, H.; Xu, F.; Zhang, Y.; Wang, L. Recent progress on graphene-based substrates for surface-enhanced Raman scattering applications. J. Mater. Chem. B 2018, 6, 4008–4028. [Google Scholar] [CrossRef]
- Ouyang, L.; Hu, Y.; Zhu, L.; Cheng, G.J.; Irudayaraj, J. A reusable laser wrapped graphene-Ag array based SERS sensor for trace detection of genomic DNA methylation. Biosens. Bioelectron. 2017, 92, 755–762. [Google Scholar] [CrossRef] [PubMed] [Green Version]
- Ilkhani, H.; Hughes, T.; Li, J.; Zhong, C.J.; Hepel, M. Nanostructured SERS-electrochemical biosensors for testing of anticancer drug interactions with DNA. Biosens. Bioelectron. 2016, 80, 257–264. [Google Scholar] [CrossRef]
- Liu, Z.; Li, S.; Hu, C.; Zhang, W.; Zhong, H.; Guo, Z. pH-dependent surface-enhanced Raman scattering of aromatic molecules on graphene oxide. J. Raman Spectrosc. 2013, 44, 75–80. [Google Scholar] [CrossRef]
- Yin, F.; Wu, S.; Wang, Y.; Wu, L.; Yuan, P.; Wang, X. Self-assembly of mildly reduced graphene oxide monolayer for enhanced Raman scattering. J. Solid State Chem. 2016, 237, 57–63. [Google Scholar] [CrossRef]
- Shivananju, B.N.; Yu, W.; Liu, Y.; Zhang, Y.; Lin, B.; Li, S.; Bao, Q. The Roadmap of Graphene-Based Optical Biochemical Sensors. Adv. Funct. Mater. 2017, 27, 1603918. [Google Scholar] [CrossRef]
- Yao, B.; Wu, Y.; Cheng, Y.; Zhang, A.; Gong, Y.; Rao, Y.-J.; Wang, Z.; Chen, Y. All-optical Mach–Zehnder interferometric NH3 gas sensor based on graphene/microfiber hybrid waveguide. Sens. Actuators B Chem. 2014, 194, 142–148. [Google Scholar] [CrossRef]
- Gan, S.; Cheng, C.; Zhan, Y.; Huang, B.; Gan, X.; Li, S.; Lin, S.; Li, X.; Zhao, J.; Chen, H.; et al. A highly efficient thermo-optic microring modulator assisted by graphene. Nanoscale 2015, 7, 20249–20255. [Google Scholar] [CrossRef]
- Some, S.; Xu, Y.; Kim, Y.; Yoon, Y.; Qin, H.; Kulkarni, A.; Kim, T.; Lee, H. Highly Sensitive and Selective Gas Sensor Using Hydrophilic and Hydrophobic Graphenes. Sci. Rep. 2013, 3, 1868. [Google Scholar] [CrossRef] [PubMed] [Green Version]
- Xing, F.; Meng, G.-X.; Zhang, Q.; Pan, L.-T.; Wang, P.; Liu, Z.-B.; Jiang, W.-S.; Chen, Y.; Tian, J.-G. Ultrasensitive Flow Sensing of a Single Cell Using Graphene-Based Optical Sensors. Nano Lett. 2014, 14, 3563–3569. [Google Scholar] [CrossRef] [PubMed]
- Jiang, W.-S.; Xin, W.; Xun, S.; Chen, S.-N.; Gao, X.-G.; Liu, Z.-B.; Tian, J.-G. Reduced graphene oxide-based optical sensor for detecting specific protein. Sens. Actuators B Chem. 2017, 249, 142–148. [Google Scholar] [CrossRef]
- Gao, X.; Chen, G.; Li, D.; Li, X.; Liu, Z.; Tian, J. High-accuracy measurement of the crystalline orientation of anisotropic two-dimensional materials using photothermal detection. J. Mater. Chem. C 2018, 6, 5849–5856. [Google Scholar] [CrossRef]
- Biris, A.R.; Pruneanu, S.; Pogacean, F.; Lazar, M.D.; Borodi, G.; Ardelean, S.; Dervishi, E.; Watanabe, F.; Biris, A.S. Few-layer graphene sheets with embedded gold nanoparticles for electrochemical analysis of adenine. Int. J. Nanomed. 2013, 8, 1429–1438. [Google Scholar] [CrossRef] [Green Version]
- Aldewachi, H.; Chalati, T.; Woodroofe, M.N.; Bricklebank, N.; Sharrack, B.; Gardiner, P. Gold nanoparticle-based colorimetric biosensors. Nanoscale 2018, 10, 18–33. [Google Scholar] [CrossRef] [Green Version]
- Giangregorio, M.M.; Jiao, W.; Bianco, G.V.; Capezzuto, P.; Brown, A.S.; Bruno, G.; Losurdo, M. Insights into the effects of metal nanostructuring and oxidation on the work function and charge transfer of metal/graphene hybrids. Nanoscale 2015, 7, 12868–12877. [Google Scholar] [CrossRef]
- Aldewachi, H.; Woodroofe, N.; Turega, S.; Gardiner, P. Optimization of gold nanoparticle-based real-time colorimetric assay of dipeptidyl peptidase IV activity. Talanta 2017, 169, 13–19. [Google Scholar] [CrossRef]
- Zoladek, S.; Rutkowska, I.A.; Blicharska, M.; Miecznikowski, K.; Ozimek, W.; Orlowska, J.; Negro, E.; Di Noto, V.; Kulesza, P.J. Evaluation of reduced-graphene-oxide-supported gold nanoparticles as catalytic system for electroreduction of oxygen in alkaline electrolyte. Electrochim. Acta 2017, 233, 113–122. [Google Scholar] [CrossRef] [Green Version]
- Zhou, J.; Chen, M.; Xie, J.; Diao, G. Synergistically Enhanced Electrochemical Response of Host–Guest Recognition Based on Ternary Nanocomposites: Reduced Graphene Oxide-Amphiphilic Pillar[5]arene-Gold Nanoparticles. ACS Appl. Mater. Interfaces 2013, 5, 11218–11224. [Google Scholar] [CrossRef]
- Chowdhury, A.D.; Nasrin, F.; Gangopadhyay, R.; Ganganboina, A.B.; Takemura, K.; Kozaki, I.; Honda, H.; Hara, T.; Abe, F.; Park, S.; et al. Controlling distance, size and concentration of nanoconjugates for optimized LSPR based biosensors. Biosens. Bioelectron. 2020, 170, 112657. [Google Scholar] [CrossRef] [PubMed]
- Klekotko, M.; Matczyszyn, K.; Siednienko, J.; Olesiak-Banska, J.; Pawlik, K.; Samoc, M. Bio-mediated synthesis, characterization and cytotoxicity of gold nanoparticles. Phys. Chem. Chem. Phys. 2015, 17, 29014–29019. [Google Scholar] [CrossRef] [PubMed]
- Parnianchi, F.; Nazari, M.; Maleki, J.; Mohebi, M. Combination of graphene and graphene oxide with metal and metal oxide nanoparticles in fabrication of electrochemical enzymatic biosensors. Int. Nano Lett. 2018, 8, 229–239. [Google Scholar] [CrossRef] [Green Version]
- Liao, R.; Tang, Z.; Lei, Y.; Guo, B. Polyphenol-Reduced Graphene Oxide: Mechanism and Derivatization. J. Phys. Chem. C 2011, 115, 20740–20746. [Google Scholar] [CrossRef]
- Clogston, J.D.; Patri, A.K. Zeta Potential Measurement. In Characterization of Nanoparticles Intended for Drug Delivery; Humana Press: Totowa, NJ, USA, 2011; pp. 63–70. [Google Scholar] [CrossRef]
- Maier, S.A. Plasmonics: Fundamentals and Applications; Springer Science & Business Media: New York, NY, USA, 2007; ISBN 978-0-387-33150-8. [Google Scholar]
- Mulvaney, P. Surface plasmon spectroscopy of nanosized metal particles. Langmuir 1996, 12, 788–800. [Google Scholar] [CrossRef]
- Cittadini, M.; Bersani, M.; Perrozzi, F.; Ottaviano, L.; Wlodarski, W.; Martucci, A. Graphene oxide coupled with gold nanoparticles for localized surface plasmon resonance based gas sensor. Carbon N. Y. 2014, 69, 452–459. [Google Scholar] [CrossRef]
- Beamson, G.; Briggs, D. High Resolution XPS of Organic Polymers: The Scienta ESCA300 Database, 1st ed.; Wiley: Chichester, UK; Wiley: New York, NY, USA, 1992; ISBN 0471935921. [Google Scholar]
- Dias, A.; Bundaleska, N.; Felizardo, E.; Tsyganov, D.; Almeida, A.; Ferraria, A.M.; do Rego, A.M.B.; Abrashev, M.; Strunskus, T.; Santhosh, N.M.; et al. N-Graphene-Metal-Oxide(Sulfide) hybrid Nanostructures: Single-step plasma-enabled approach for energy storage applications. Chem. Eng. J. 2022, 430, 133153. [Google Scholar] [CrossRef]
- Carapeto, A.P.; Ferraria, A.M.; Boufi, S.; Vilar, M.R.; do Rego, A.M.B. Ion reduction in metallic nanoparticles nucleation and growth on cellulose films: Does substrate play a role? Cellulose 2015, 22, 173–186. [Google Scholar] [CrossRef]
- Boufi, S.; Ferraria, A.M.; do Rego, A.M.B.; Battaglini, N.; Herbst, F.; Vilar, M.R. Surface functionalisation of cellulose with noble metals nanoparticles through a selective nucleation. Carbohydr. Polym. 2011, 86, 1586–1594. [Google Scholar] [CrossRef]
- Clifford, M.N. Diet-Derived Phenols in Plasma and Tissues and their Implications for Health. Planta Med. 2004, 70, 1103–1114. [Google Scholar] [CrossRef] [Green Version]
- Tao, Y.; García, J.F.; Sun, D.-W. Advances in Wine Aging Technologies for Enhancing Wine Quality and Accelerating Wine Aging Process. Crit. Rev. Food Sci. Nutr. 2014, 54, 817–835. [Google Scholar] [CrossRef] [PubMed]
- Bohren, C.F.; Huffman, D.R. Absorption and Scattering of Light by Small Particles; Wiley: Hoboken, NJ, USA, 1998; ISBN 9780471293408. [Google Scholar]
- Fantoni, A.; Fernandes, M.; Vygranenko, Y.; Louro, P.; Vieira, M.; Alegria, E.C.B.A.; Ribeiro, A.; Texeira, D. A Simulation Study of Surface Plasmons in Metallic Nanoparticles: Dependence on the Properties of an Embedding a-Si:H Matrix. Phys. Status Solidi 2018, 215, 1700487. [Google Scholar] [CrossRef]
- Fantoni, A.; Fernandes, M.; Vygranenko, Y.; Louro, P.; Vieira, M.; Silva, R.P.O.; Texeira, D.; Ribeiro, A.P.C.; Prazeres, M.; Alegria, E.C.B.A. Analysis of metallic nanoparticles embedded in thin film semiconductors for optoelectronic applications. Opt. Quantum Electron. 2018, 50, 246. [Google Scholar] [CrossRef]
- Bhagwat, S.; Haytowitz, D.B.; Holden, J.M. USDA Database for the Flavonoid Content of Selected Foods; Release 3.1; U.S. Department of Agriculture: Beltsville, MD, USA, 2011; pp. 1–156. [Google Scholar]
- ChemSpider. Available online: http://www.chemspider.com/Chemical-Structure.58575.html (accessed on 19 April 2021).
- Jeon, H.B.; Tsalu, P.V.; Ha, J.W. Shape Effect on the Refractive Index Sensitivity at Localized Surface Plasmon Resonance Inflection Points of Single Gold Nanocubes with Vertices. Sci. Rep. 2019, 9, 13635. [Google Scholar] [CrossRef] [Green Version]
- Zalyubovskiy, S.J.; Bogdanova, M.; Deinega, A.; Lozovik, Y.; Pris, A.D.; An, K.H.; Hall, W.P.; Potyrailo, R.A. Theoretical limit of localized surface plasmon resonance sensitivity to local refractive index change and its comparison to conventional surface plasmon resonance sensor. J. Opt. Soc. Am. A 2012, 29, 994. [Google Scholar] [CrossRef] [Green Version]
- Bhuyan, M.S.A.; Uddin, M.N.; Islam, M.M.; Bipasha, F.A.; Hossain, S.S. Synthesis of graphene. Int. Nano Lett. 2016, 6, 65–83. [Google Scholar] [CrossRef] [Green Version]
- Carapeto, A.P.; Ferraria, A.M.; do Rego, A.M.B. Unraveling the reaction mechanism of silver ions reduction by chitosan from so far neglected spectroscopic features. Carbohydr. Polym. 2017, 174, 601–609. [Google Scholar] [CrossRef]


| Optical Sensors | Material | Application | Ref. |
|---|---|---|---|
| Fluorescence sensing | GO | Effect of pH on fluorescence | [20] |
| Fluorescence sensing | GO | Fluorescence quencher | [21] |
| Fluorescence sensing | GO | Two-photon multi-color bio-imaging of multiple drug-resistant bacteria (MDRB) | [22] |
| Fluorescence sensing | GO | Fluorescence imaging | [23] |
| Fluorescence sensing | GO | High-sensitivity detection of miRNA in cells | [24] |
| Graphene-Based SERS Sensing | G | Adsorbed molecules | [25] |
| Graphene-Based SERS Sensing | G | Detection of biomarkers and biomolecules | [26] |
| Graphene-Based SERS Sensing | G | Bio-imaging, cancer diagnostics | [27] |
| Graphene-Based SERS Sensing | GO | Effects of pH values on SERS intensities of some aromatic molecules | [28] |
| Graphene-Based SERS Sensing | RGO | SERS effects of RGO with different degrees of reduction | [29] |
| Graphene-Based Optical Fiber Sensing | G | Biochemical sensing | [30] |
| Graphene-Based Optical Fiber Sensing | G | Gas sensor | [31] |
| Graphene-Based Optical Fiber Sensing | G | Biomolecule detector | [32] |
| Graphene-Based Optical Fiber Sensing | GO and RGO | Sensors for volatile organic compounds | [33] |
| Other Kind of Graphene-Based Optical Sensors | G | Detection of cancer cells | [34] |
| Other Kind of Graphene-Based Optical Sensors | RGO | Detection of cancer cells | [35] |
| Other Kind of Graphene-Based Optical Sensors | G and RGO | Photothermal detection (PTD) | [36] |
| Sample | Zeta Potential (mV) | Standard Deviation (mV) |
|---|---|---|
| 5%_AuNPs | −15.59 | 0.595 |
| 5%_AuNPs/rGO | −20.17 | 0.868 |
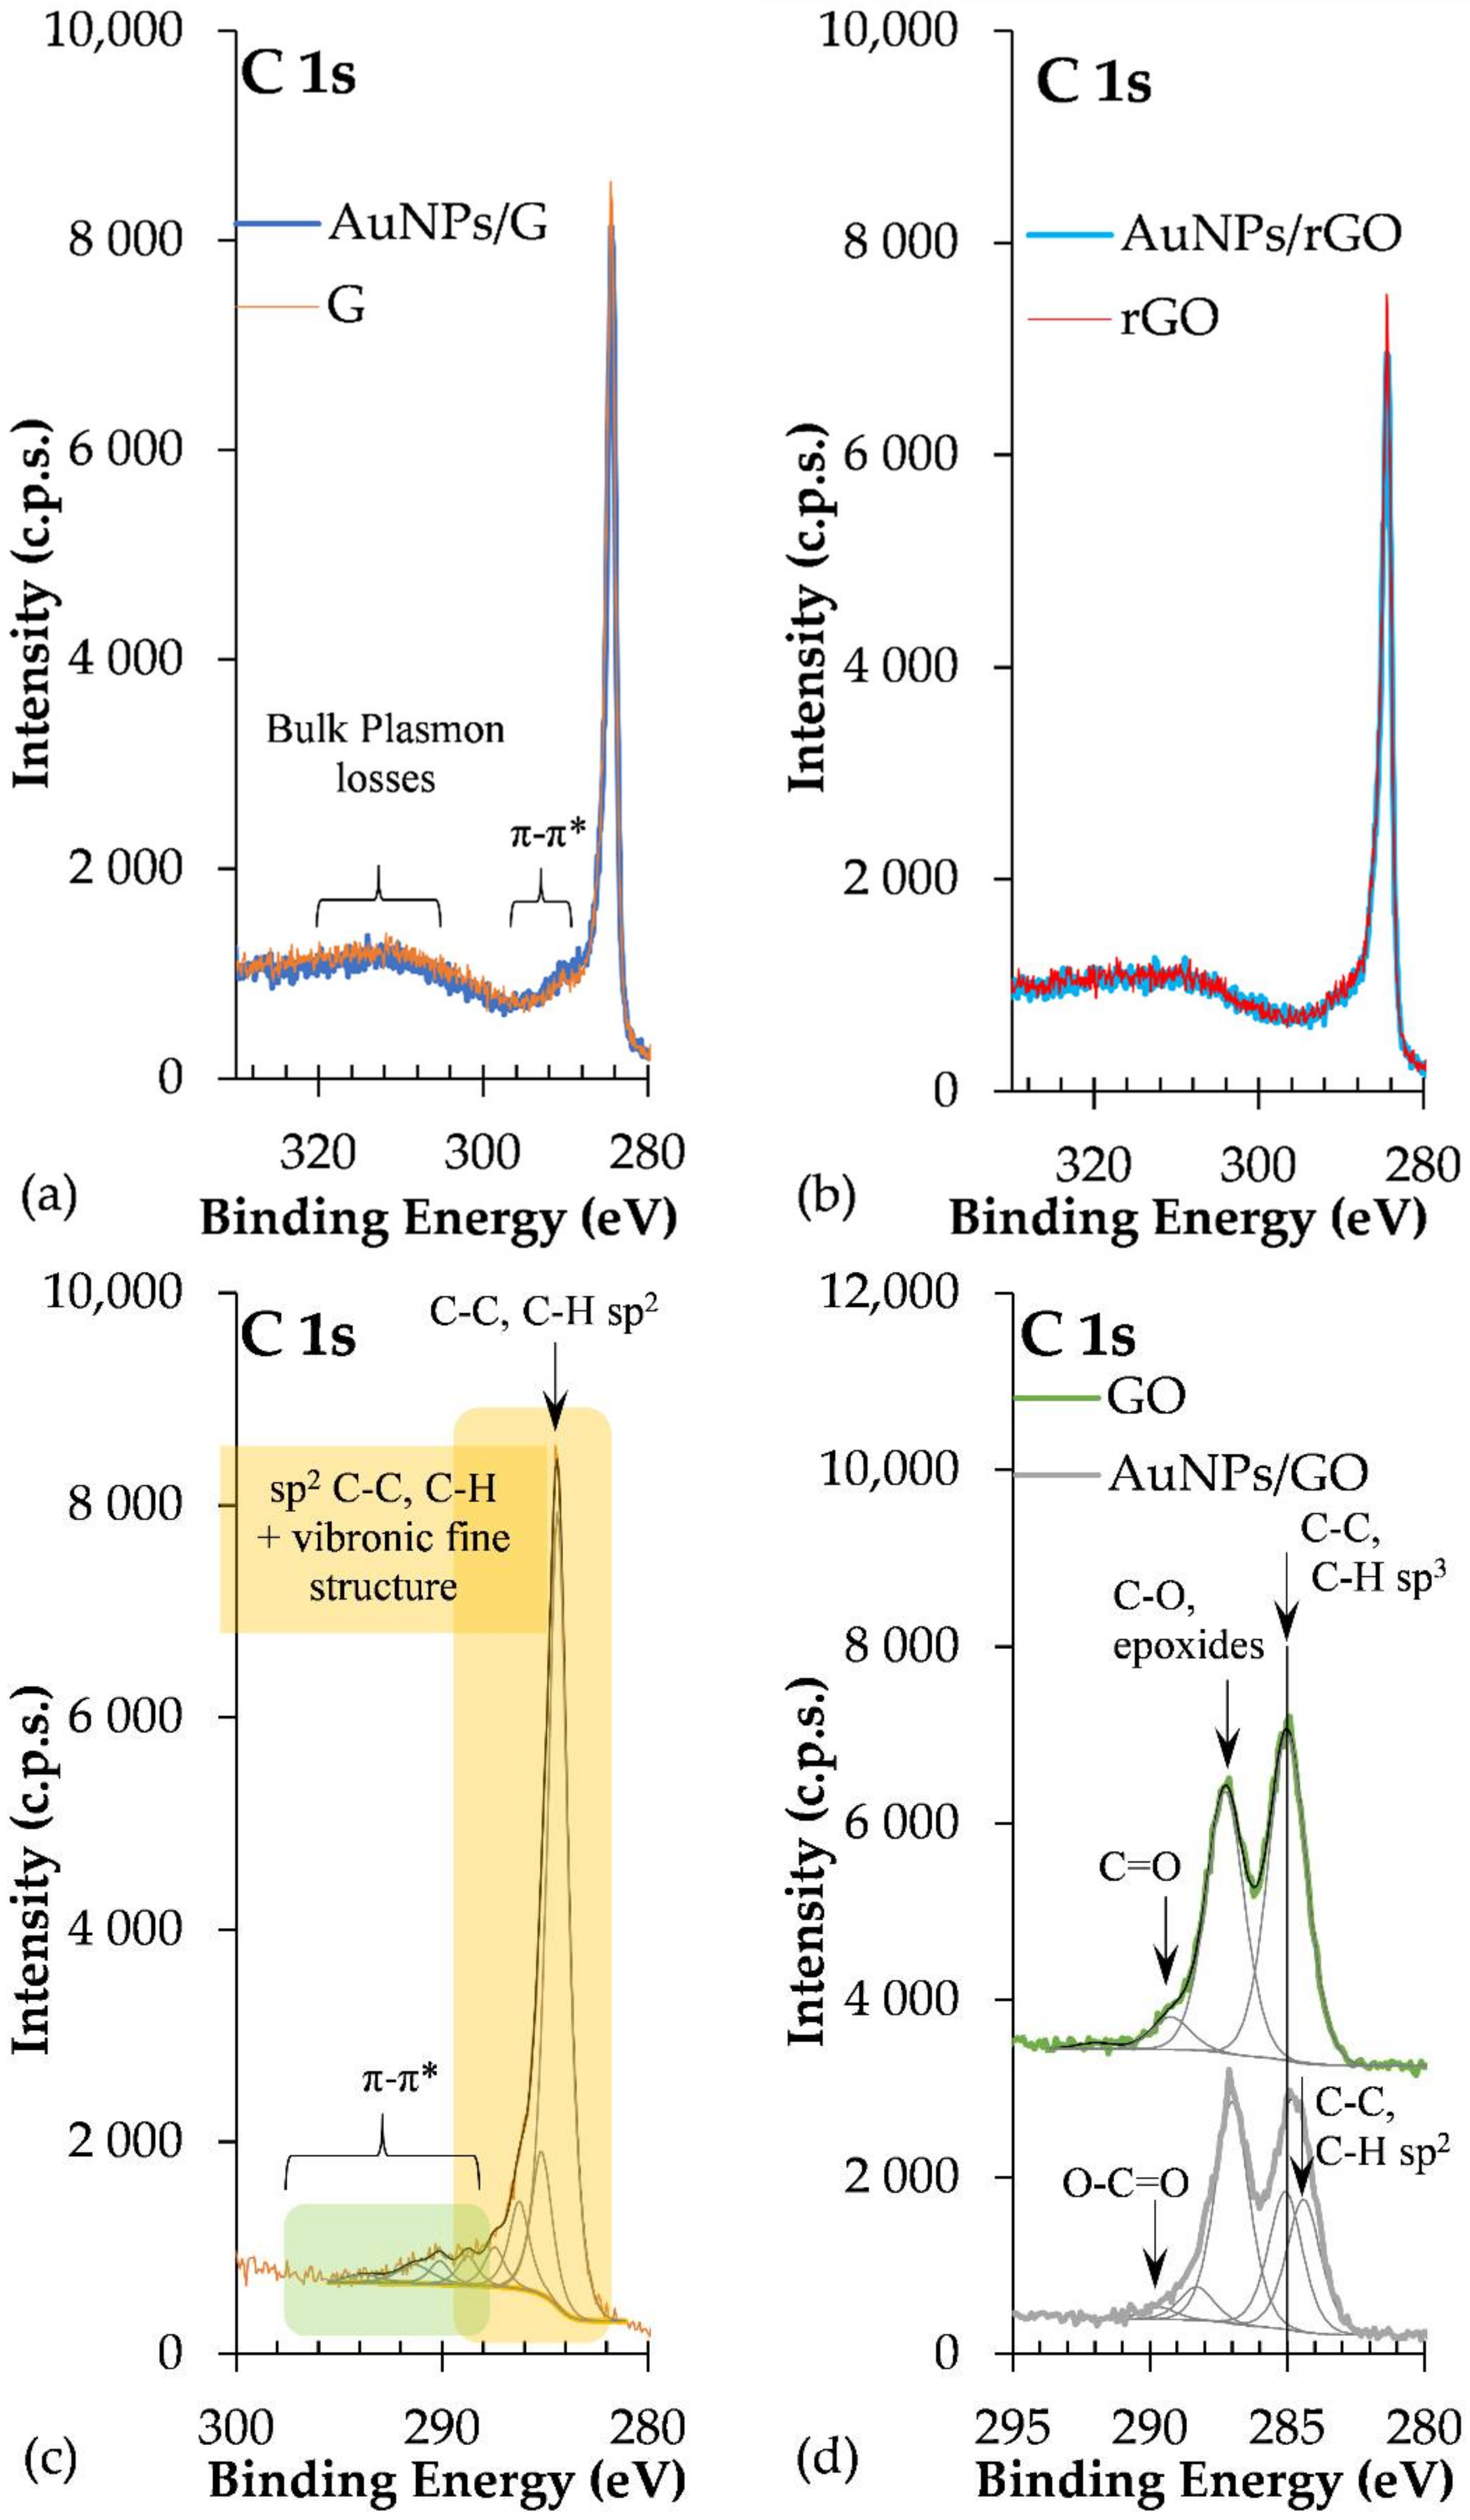
| AuNPs/ rGO | AuNPs/ GO | AuNPs/ G | rGO | GO | G | Assignments [51,52] | |
|---|---|---|---|---|---|---|---|
| C 1s | 284.4 | 284.4 | 284.4 | 284.4 | 284.4 (1) | 284.4 | C-C and C-H sp2 |
| 285.5 | 285.1 | 285.7 | 285.4 | 285.0 | 285.2 | C-C and C-H sp3 | |
| 286.3 | 287.0 | 286.7 | 286.4 | 287.3 | 286.2 | C-O or epoxide | |
| 287.6 | 288.3 | 287.9 | 287.7 | 287.4 | C=O | ||
| 288.8 | 289.1 | 288.8 | 289.2 | 288.8 | XO-C=O (X=H or C) | ||
| 290.2 | 289.7 | 290.3 | 289.9 | 290.1 | π-π* | ||
| 291.3 | 291.6 | 291.3 | 292.0 | 291.3 | |||
| 293.3 | 292.6 | 294.1 | 293.8 | ||||
| 295.6 | 294.9 | ||||||
| O 1s | 531.5 | 531.6 | 530.7 | 531.3 | O in electropositive vicinity | ||
| 532.7 | 532.9 | 532.3 | 532.9 | 532.9 | 532.3 | O bonded to C | |
| Au 4f7/2 | 84.1 | 84.6 | 84.1 | Au0; in “AuNPs/GO”: Au+? (see text) | |||
| Au 4f5/2 | 87.8 | 88.3 | 87.8 | ||||
| S 2p3/2 | 168.6 | 169.0 | SO42− | ||||
| S 2p1/2 | 169.8 | 170.0 | |||||
| Si 2p3/2 | 101.7 | 101.7 | 101.6 | 102.0 | silicone | ||
| Si 2p1/2 | 102.3 | 102.4 | 102.2 | 102.6 |
| AuNPs/ rGO | AuNPs/ GO | AuNPs/ G | rGO | GO | G | |
|---|---|---|---|---|---|---|
| Atomic Concentrations (%) | ||||||
| C | 86.2 | 66.5 | 92.8 | 87.2 | 71.2 | 93.9 |
| O | 13.4 | 32.3 | 7.1 | 12.6 | 27.3 | 6.1 |
| Au | 0.12 | 0.03 | 0.06 | |||
| S | 0.8 | 1.0 | ||||
| Si | 0.2 | 0.4 | 0.2 | 0.6 | ||
| Atomic ratios | ||||||
| Au/C | 0.0014 | 0.0004 | 0.0006 | |||
| O/C | 0.15 | 0.44 | 0.08 | 0.14 | 0.33 | 0.06 |
Publisher’s Note: MDPI stays neutral with regard to jurisdictional claims in published maps and institutional affiliations. |
© 2022 by the authors. Licensee MDPI, Basel, Switzerland. This article is an open access article distributed under the terms and conditions of the Creative Commons Attribution (CC BY) license (https://creativecommons.org/licenses/by/4.0/).
Share and Cite
Carvalho, A.P.G.; Alegria, E.C.B.A.; Fantoni, A.; Ferraria, A.M.; do Rego, A.M.B.; Ribeiro, A.P.C. Effect of Graphene vs. Reduced Graphene Oxide in Gold Nanoparticles for Optical Biosensors—A Comparative Study. Biosensors 2022, 12, 163. https://0-doi-org.brum.beds.ac.uk/10.3390/bios12030163
Carvalho APG, Alegria ECBA, Fantoni A, Ferraria AM, do Rego AMB, Ribeiro APC. Effect of Graphene vs. Reduced Graphene Oxide in Gold Nanoparticles for Optical Biosensors—A Comparative Study. Biosensors. 2022; 12(3):163. https://0-doi-org.brum.beds.ac.uk/10.3390/bios12030163
Chicago/Turabian StyleCarvalho, Ana P. G., Elisabete C. B. A. Alegria, Alessandro Fantoni, Ana M. Ferraria, Ana M. Botelho do Rego, and Ana P. C. Ribeiro. 2022. "Effect of Graphene vs. Reduced Graphene Oxide in Gold Nanoparticles for Optical Biosensors—A Comparative Study" Biosensors 12, no. 3: 163. https://0-doi-org.brum.beds.ac.uk/10.3390/bios12030163