
Colistin Treatment Affects Lipid Composition of Acinetobacter baumannii

Enzyme and Cell Engineering UPJV, UMR CNRS 7025, Centre de Recherche Royallieu, Université de Technologie de Compiègne, CEDEX, 60205 Compiègne, France
*
Author to whom correspondence should be addressed.
Antibiotics 2021, 10(5), 528; https://0-doi-org.brum.beds.ac.uk/10.3390/antibiotics10050528
Submission received: 16 April 2021
/
Revised: 30 April 2021
/
Accepted: 1 May 2021
/
Published: 3 May 2021
(This article belongs to the Special Issue Bacterial Lipids and Mechanisms Associated with Bacterial Resistance)
Abstract
:Multidrug-resistant Acinetobacter baumannii (A. baumannii) causes severe and often fatal healthcare-associated infections due partly to antibiotic resistance. There are no studies on A. baumannii lipidomics of susceptible and resistant strains grown at lethal and sublethal concentrations. Therefore, we analyzed the impact of colistin resistance on glycerolipids’ content by using untargeted lipidomics on clinical isolate. Nine lipid sub-classes were annotated, including phosphatidylcholine, rarely detected in the bacterial membrane among 130 different lipid species. The other lipid sub-classes detected are phosphatidylethanolamine (PE), phosphatidylglycerol (PG), lysophosphatidylethanolamine, hemibismonoacylglycerophosphate, cardiolipin, monolysocardiolipin, diacylglycerol, and triacylglycerol. Under lethal and sublethal concentrations of colistin, significant reduction of PE was observed on the resistant and susceptible strain, respectively. Palmitic acid percentage was higher at colistin at low concentration but only for the susceptible strain. When looking at individual lipid species, the most abundant PE and PG species (PE 34:1 and PG 34:1) are significantly upregulated when the susceptible and the resistant strains are cultivated with colistin. This is, to date, the most exhaustive lipidomics data compilation of A. baumannii cultivated in the presence of colistin. This work is highlighting the plasma membrane plasticity used by this gram-negative bacterium to survive colistin treatment.
1. Introduction
Acinetobacter baumannii (A. baumannii) is a member of the ESKAPE group, which is the main bacterial group that causes infections in humans [1]. This emerging pathogen is a major cause of hospital-acquired infections frequently associated with bloodstream infection and pneumonia [2]. A. baumannii has been ranked as a bacterium that poses the greatest health threat by the World Health Organization and for which new antibiotics are desperately needed [3]. As a gram-negative bacterium, the A. baumannii outer membrane consists of a monolayer of glycerophospholipids and an exposed monolayer of endotoxin. To combat A. baumannii infections, polymyxins, including polymyxin E (colistin), are used as agents of last resort against multidrug resistant strains [4]. Polymyxins are cyclic cationic peptides produced by gram-positive soil bacteria discovered in 1947 [5]. Colistin was used in the 1950s and was abandoned in most of the part of the world in the early 1980s because it was regarded as nephrotoxic [6]. The lack of new antibiotic discovery associated with the emergence of multidrug-resistant bacteria led to a regain of interest in colistin molecules [7]. The antibacterial activity of colistin relies on the endotoxin or lipopolysaccharide (LPS) interaction and the disruption of the bacterial outer and inner membranes cells [8,9,10] but with a mechanism of action not perfectly understood [11]. Three domains compose the LPS, the lipid A integrated in the outer membrane, the core oligosaccharide, and the O antigen. However, mucosal pathogens including A. baumannii often lack the O antigen and produce instead an extended core oligosaccharide. This endotoxin molecule is termed lipooligosaccharide (LOS) [12].
However, colistin overuse has led many gram-negative bacteria to develop several different resistance strategies such as loss or modifications of the LPS or LOS [13,14,15]. For example, a LOS-deficient colistin-resistant strain of A. baumannii showed changes in the membrane potential probably due to the impact on the colistin affinity of the outer membrane modification [16]. In A. baumannii LOS, modifications correspond mainly to the addition of galactosamine [17] or phosphoethanolamine (pEtN) moiety on lipid A. The enzyme EptA (also known as PmrC or LptA in Neisseria meningitidis) and MCR-1/2 are chromosome- and plasmid-encoded, respectively; they catalyze pEtN addition in many gram-negative bacteria [18,19,20]. Moreover, mutations in genes involved in LPS synthesis are often associated with colistin resistance [21,22]. The main substrate needed to transfer pEtN to LOS is the glycerophospholipid phosphoethanolamine (PE) [23], but how the colistin resistance impacts the lipid composition of the bacterial membrane is not well understood. Nonetheless, in several bacterial species, it is known that lipid composition of the membrane is correlated with antibiotic resistance [24,25,26,27,28,29]. The transcriptomic responses of A. baumannii to colistin highlighted significant lipid-related genes reenforcing the changes induced by this antibiotic on bacterial membrane [30]. Only a few studies with modern lipidomic approaches analyzed the alteration of lipid profiles in polymyxin-resistant bacteria [31,32,33]. For A. baumannii, one work analyzed key metabolites between polymyxin-susceptible and polymyxin-resistant strains, including some glycerolipids [32]. Shortly after, the most complete lipidomic study using combined MALDI-TOF/MS and TLC analyses was done on the strain ATCC19606T isolated in 1948 [34], long before the emergence of MDR strains and without antibiotic resistance [35].
The goal of the present study is to explore the impact of colistin resistance on the lipid composition of A. baumannii recently isolated from patients. We performed state-of-the-art liquid chromatography-high-resolution tandem mass spectrometry (LC-HRMS2)-based on untargeted lipidomics to improve our understanding of the mechanism of action of colistin resistance. Here, nine lipid sub-classes were identified, (PE), phosphatidylglycerol (PG), lysophosphatidylethanolamine (LPE), hemibismonoacylglycerophosphate (HBMP), cardiolipin (CL), monolysocardiolipin (MLCL), phosphatidylcholine (PC), and the glycerolipids, diacylglycerol (DAG), and triacylglycerol (TAG). For many of these lipids, the fatty acid composition is identified. When the colistin susceptible strain was grown with colistin, the palmitic acid content was upregulated. Inversely, for resistant and susceptible strains, PE significantly decreased. The most abundant lipid species are PE 34:1, PG 34:1, HBMP 50:2, CL 68:2, MLCL 52:2, PC 32:1, and TAG 50:1. These species are among the upregulated lipids when the bacteria are grown with colistin. Our findings describe the plasticity of the bacterial membranes during colistin treatment and show a significant effect for different glycerolipids. Therefore, understanding the mechanism(s) that bacteria develop to defeat antibiotics, and the lipids biosynthesis in particular, should lead to the development of new therapies [36,37].
2. Results
2.1. Colistin Susceptibility
Detection of colistin resistance for A. baumannii relies on minimal inhibition concentration (MIC). This method was chosen as the unique reference by the working group, including the Clinical and Laboratory Standards Institute (CLSI) and the European Committee on Antimicrobial Susceptibility Testing (EUCAST), with a concentration of 2 µg/mL of colistin required to kill susceptible bacteria [38]. A colistin-susceptible strain of a clinical isolate of A. baumannii denominated 721164 with acquired resistance to β-lactam with β-lactamase (AmpC), carbapenemase (OXA-23), and aminoglycoside resistance methylase (ArmA) was selected. After cultivation by gradually increasing colistin concentration from 0 to 5 μg/mL, a colistin resistant population was isolated. The native (susceptible) and the isolated (resistant) populations were tested by MIC at 0.5 and >128 µg/mL colistin concentrations (Table 1).
2.2. Lipids Annotated in Acinetobacter baumannii 721164 by LC-HRMS2
Lipid extraction was performed on harvested cells of the susceptible strain grown until the stationary phase was reached (16 h of growth) and analyzed by a liquid chromatography coupled with a hybrid quadrupole time-of-flights (QTOF). In negative mode, 87 glycerophospholipids were annotated, belonging to six lipid sub-classes: PE, PG, LPE, HBMP (also known as Acyl-PG), CL, and MLCL. In positive mode, 43 glycerolipids were annotated belonging to three lipid sub-classes: PC, DAG, and TAG (Figure 1). The percentage of each lipid species was calculated to identify the most representative ones. For CL and MLCL, PE and LPE, and TAG and DAG, the percentage was calculated by gathering the two sub-classes as the MLCL, LPE, and DAG are intermediates of mainly CL, PE, and TAG, respectively. The most abundant lipids for each sub-class are: PE 34:1, PG 34:1, HBMP 50:2, CL 68:2, MLCL 52:2, PC 32:1, and TAG 50:1 (highlighted in red in Table 2). These results are in good agreement with the results obtained on the strain ATCC19606T by MALDI-TOF/MS in the negative ion mode, but our analyses allow to annotate more lipid species. Furthermore, the analysis of the lipid extract by positive ion mode appends three lipid sub-classes in the A. baumannii lipidome [35]. For CL, 32 species were identified, 12 MLCL, 12 HBMP, 5 PC, 3 LPE, 15 PE, 13 PG, 11 DAG, and 27 TAG.
2.3. Colistin and Lipid Profiles of Acinetobacter baumannii by LC-HRMS2
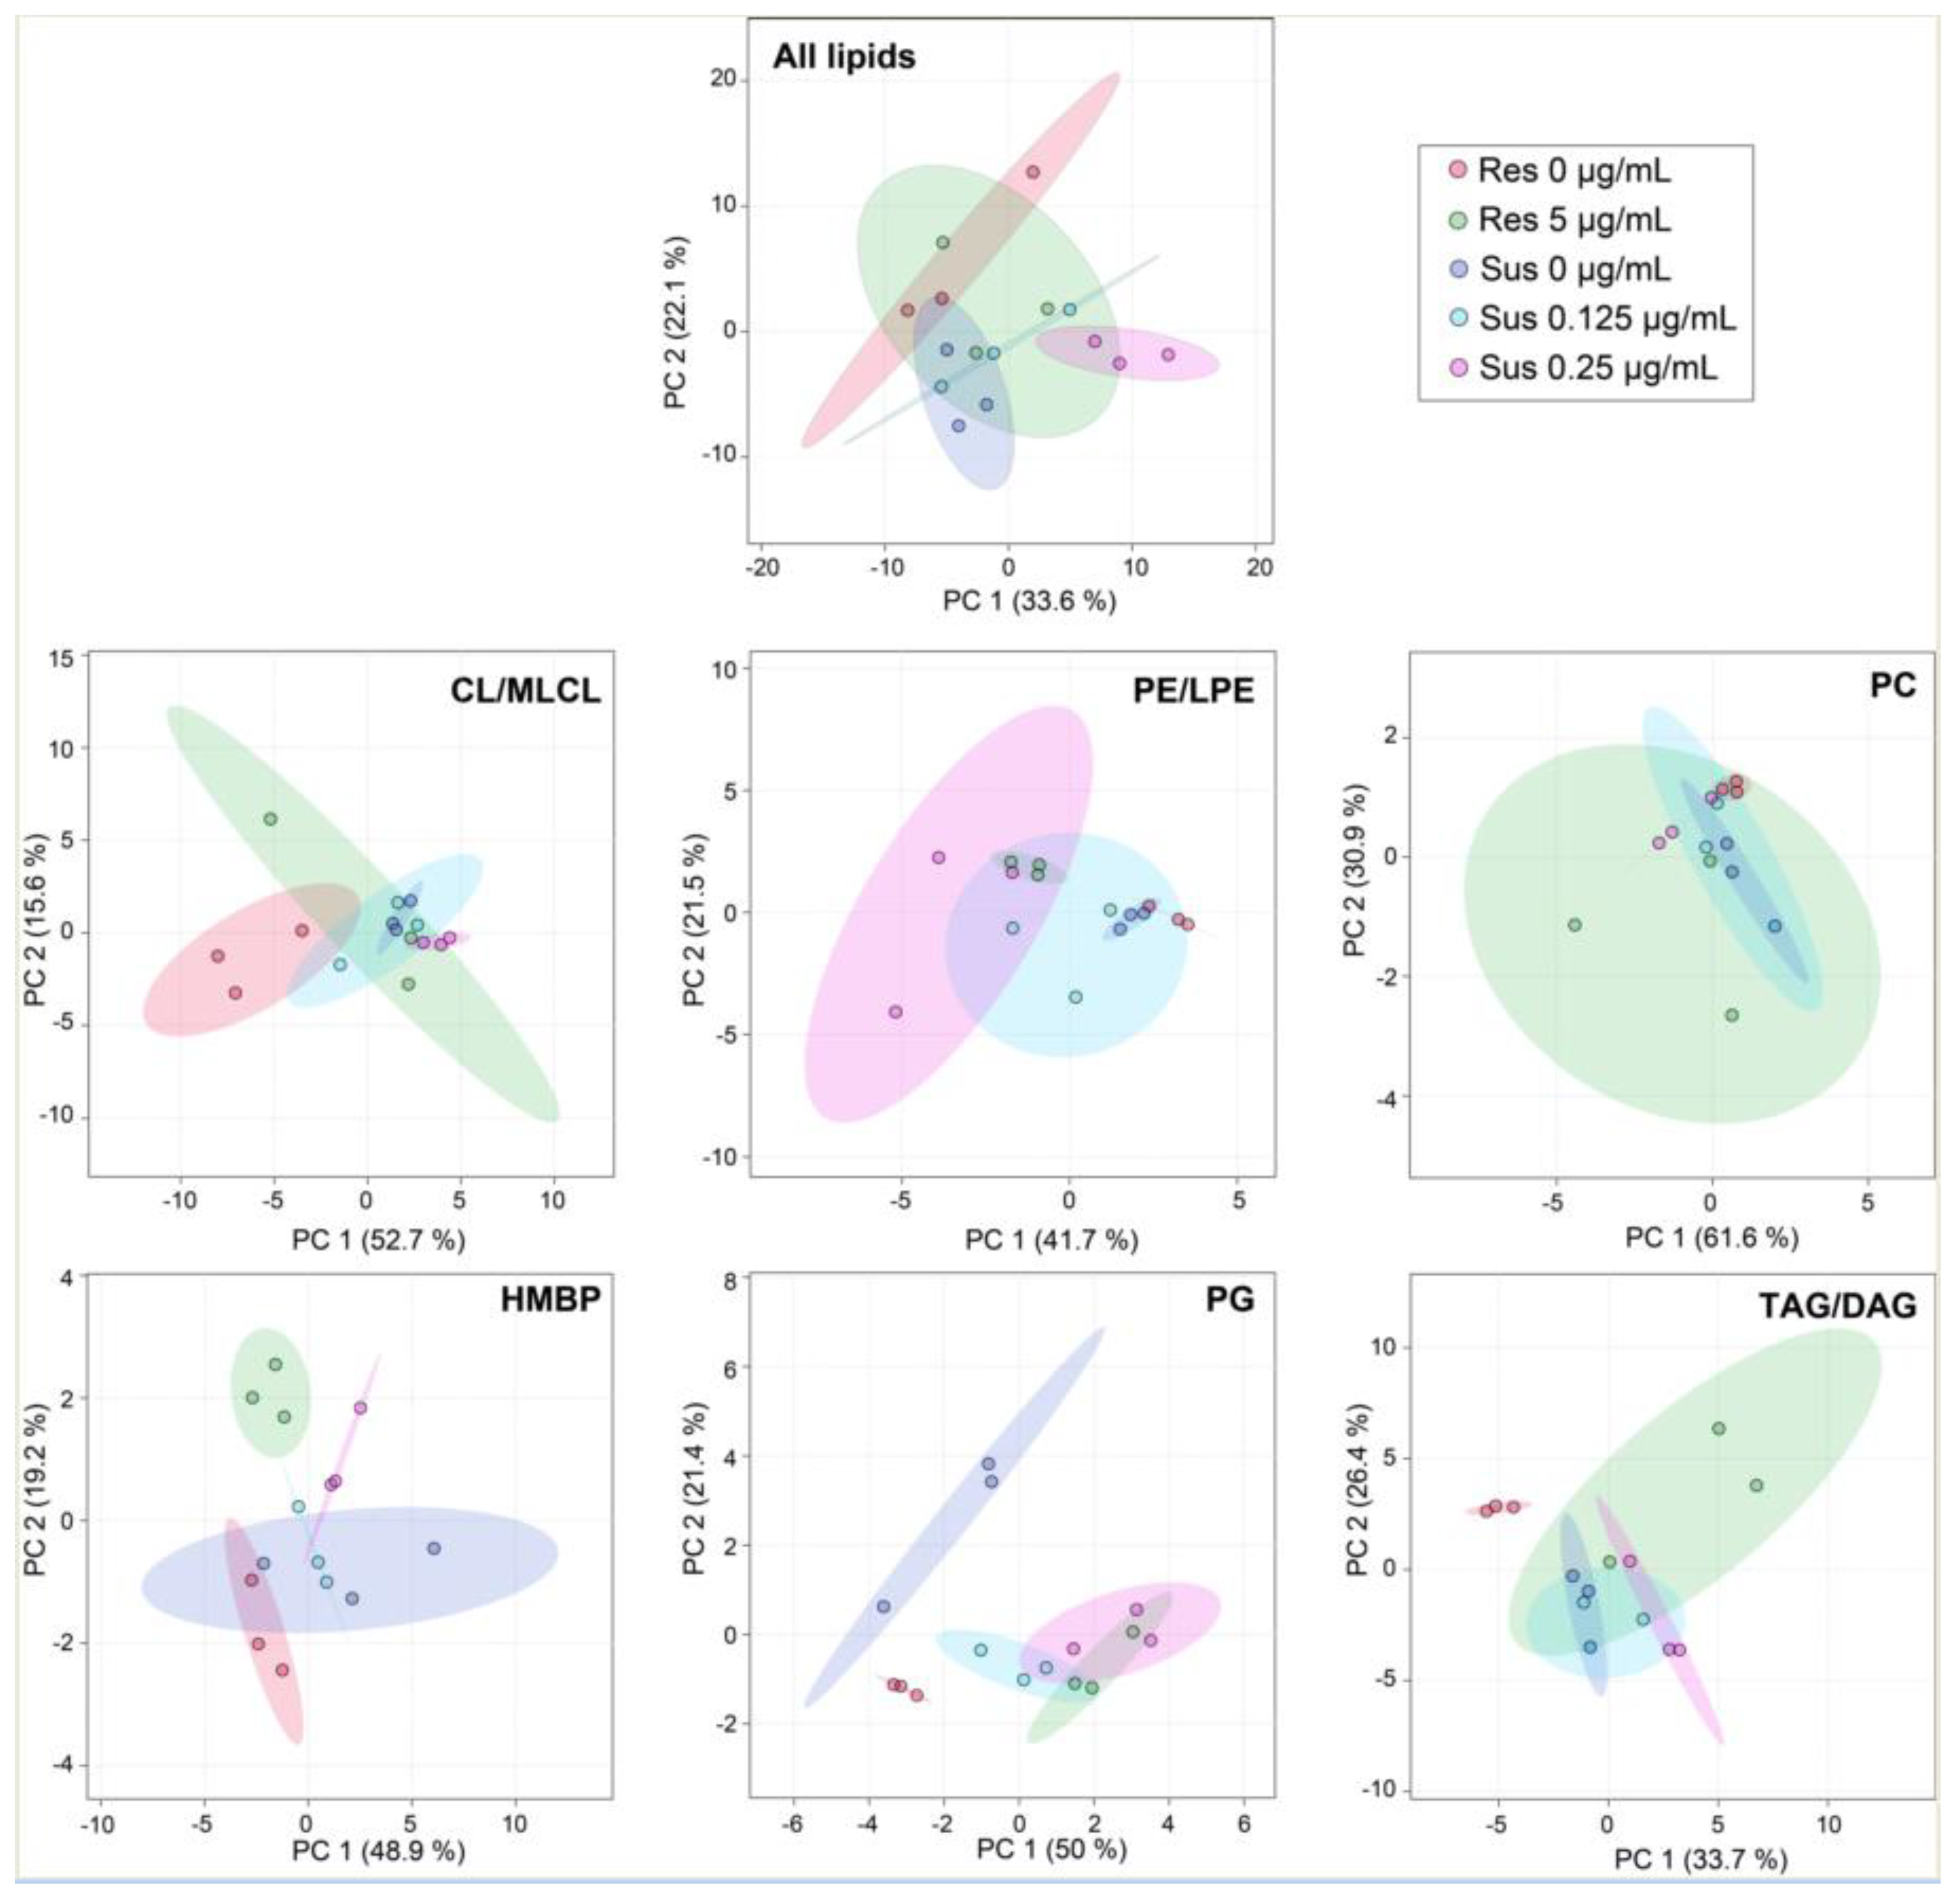
Comparative untargeted lipidomics were employed to identify differences between colistin-susceptible and colistin-resistant A. baumannii grown with or without colistin at non-lethal concentrations. The colistin-susceptible strain was cultivated with 0 µg/mL, 0.125 µg/mL, or 0.25 µg/mL of colistin. The colistin-resistant strain was cultivated with 0 µg/mL, 5 µg/mL. A principal component analysis (PCA) scores plot was used to highlight overall variances between the two strains cultivated at different concentrations of colistin using normalized values by employing the internal standard EquiSPLASH (Figure 1). Each sample is shown as a single point with a 95% confidence interval ellipse representing the range of the data. The colistin-resistant strain grown with 5 µg/mL of colistin overlaps with all other conditions. The colistin-susceptible strain grown with 0.25 µg/mL does not overlap with any growth conditions with this strain, indicating that these treatments affect at least in part of the A. baumannii lipid content. Among each lipid sub-class, PG has the largest confidence ellipses only for the colistin-susceptible and resistant strains grown without antibiotics, while the two strains cultivated with antibiotics overlapped. With less confidence, similar results were observed for CL/MLCL and TAG/DAG. PCA for PE/LPE and HBMP were the most dramatically affected by 0.25 µg/mL of colistin and between the two conditions of the colistin-resistant strain. The susceptible and the resistant strains without antibiotics (Figure 1, respectively, in purple and red) are overlapping for HBMP and to a less extent for all lipids and PE/LPE. These results indicate that the lipid content of the susceptible and resistant Acinetobacter strains is already affected in the absence of colistin.
The fatty acid content of the colistin-susceptible strain (Figure 2A) and colistin-resistant strain (Figure 2E) grown with different colistin concentrations was evaluated by gas chromatography with a flame ionization detector (GC-FID). Since C12:0 was not always detected, we decided not to represent this fatty acid in the figure. For the colistin-susceptible strain, a significantly higher quantity of palmitic acid (C16:0) was observed proportionally with an antibiotic concentration increase (Figure 2A). Based on the lipidomic data, the percentages of the glycerophospholipids annotated in negative ion mode (PE, PG, and LPE) were calculated and compared. PE significantly decreased concomitantly with an increase of PG for the colistin-susceptible strain (Figure 2B), whereas no significant differences were observed for CL, MLCL, and HBMP (Figure 2C). At the same time, glycerolipids annotated in the positive ion mode (DAG, PC and TAG) were significantly affected. TAG percentage was higher when incubated with 0.25 µg/mL and is associated with a decrease of PC (Figure 2D). Fatty acid analysis was also performed for the colistin-resistant strain grown with and without colistin (Figure 2E). Unlike the colistin-susceptible strain, no significant differences were observed for C16:0. Regarding the different lipid sub-classes, the same effect was observed on PE and PG (Figure 2F). However, a significant decrease of CL and an increase of HBMP were observed when growing the strain with antibiotics (Figure 2G) but with no effect for DAG, PC, or TAG (Figure 2H).
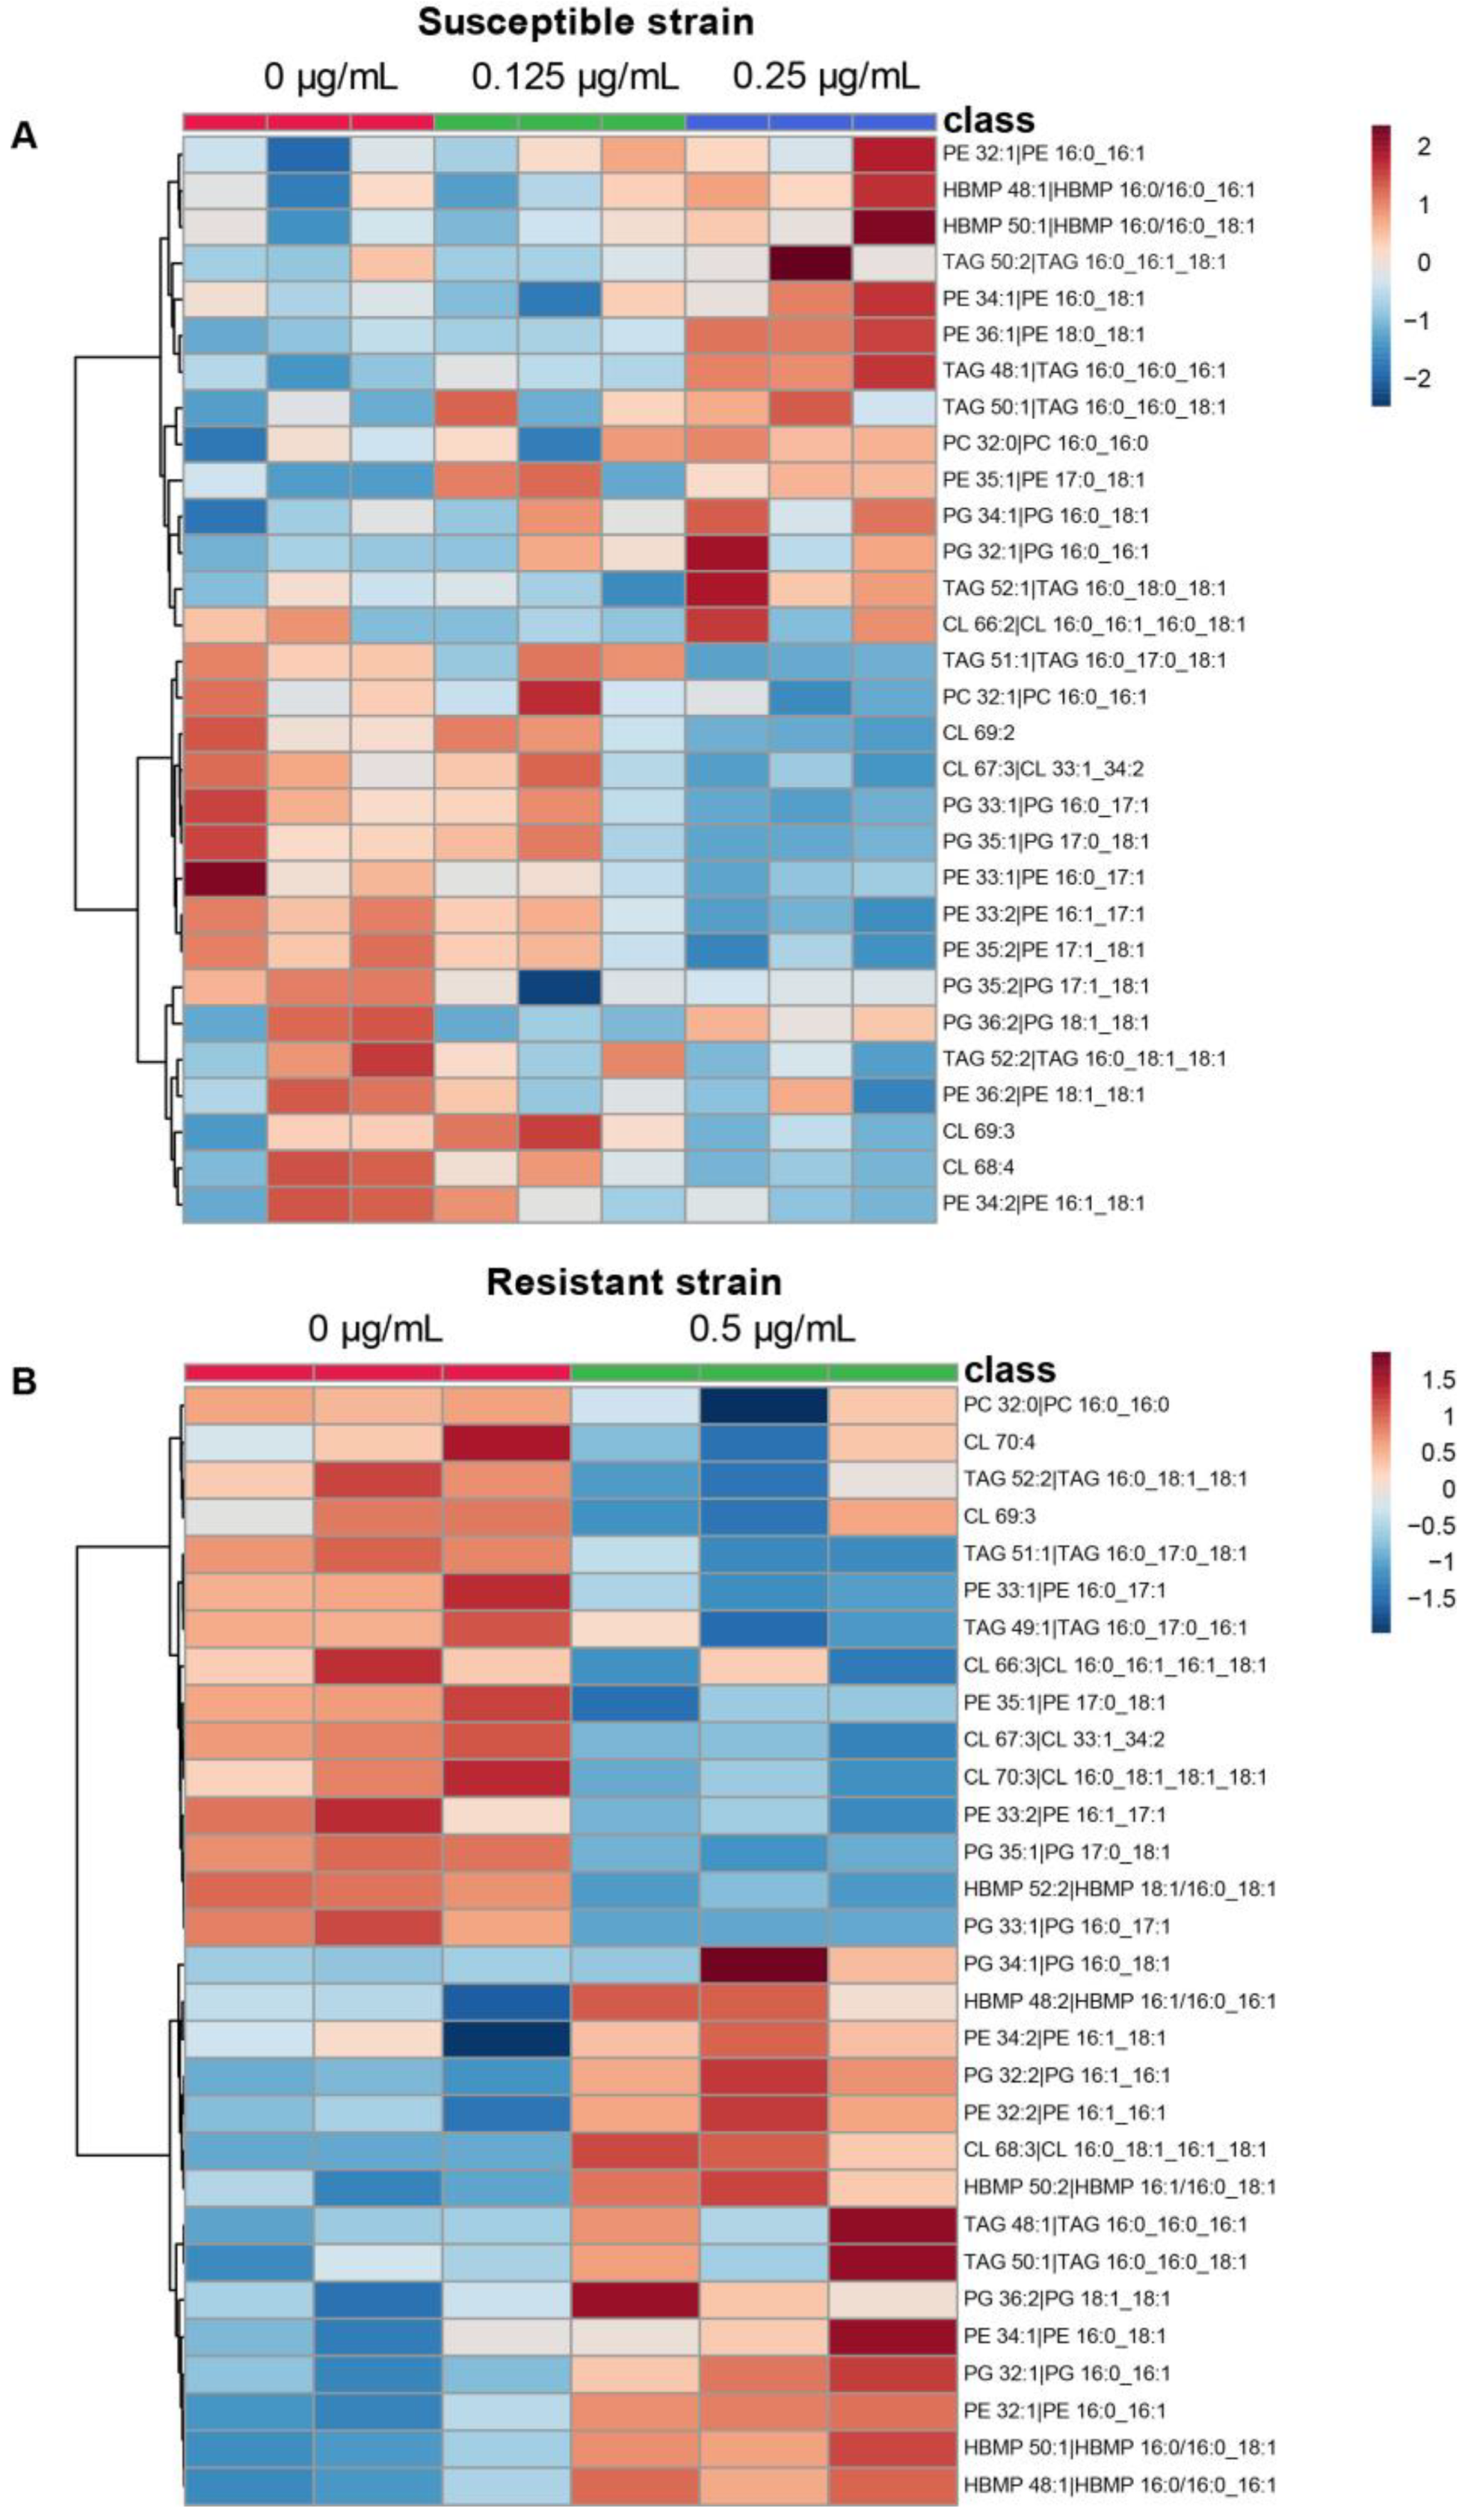
We next examined the individual lipid species involved in the bacterial adaptation in A. baumannii under colistin growth (Figure 3). The highest abundant species of PE and PG (PE 34:1 and PG 34:1) are upregulated for both susceptible and resistant strains grown with colistin. Most of the other species are within 5% of the total lipid sub-classes associated with a few abundant species. Eight species are upregulated at the highest concentration of colistin for the susceptible strain and for the resistant strain cultivated with colistin. These shared species are monounsaturated and include PE 32:1, PE 34:1, HBMP 48:1, HBMP 50:1, TAG 48:1, TAG 50:1, PG 34:1, and PG 32:1. Among them, only HBMP 48:1 is below 5%.
3. Discussion
Antibiotic resistance and lipid content adaptation of different bacterial species was reported for several bacteria including Staphylococcus aureus, Escherichia coli (E. coli), and Pseudomonas aeruginosa (P. aeruginosa) [25,27,28,31]. Understanding how bacteria overcome antibiotic treatment and notably the lipids biosynthesis could lead to the development of new therapies [36].
Gram-negative bacteria are enveloped by two lipid bilayers, separated by a periplasmic space containing a peptidoglycan cell wall. The inner and outer membranes are composed of glycerophospholipids. A. baumannii is composed of PE, PG, PC, CL, MLCL, HMBP, and LPE lipids. A recent study using 2D thin-layer chromatography on the inner and outer membranes of A. baumannii clearly identified PE, PG, and CL with three species of PE and PG corresponding to the 32:1, 34:1, and 36:2 of each sub-class. PE 34:1 and PG 34:1 were identified as the most abundant [39]. These results are in good agreement with our identification of the most abundant PE and PG lipids. The most complete work to date found 38 different species but without data concerning the fatty acids content of each species [35]. In the current study, we annotated and quantified 130 lipid species including TAG and DAG, reserve compounds widespread among bacteria [40]. Already detected in A. baumannii but with a composition not fitting the nine fatty acids found in this bacterium (C12:0, C14:0, C15:0, C16:0, C16:1, C17:0: C17:1, C18:0, and C18:1) with structures such as TAG 46:5 and TAG 64:13 [32]. While TAG with 46 fatty acids carbons was annotated in our analysis, five unsaturations were not compatible with the fatty acid content. Likewise, neither 13 unsaturations could be found in this bacterium nor 64 fatty acids carbons. Other glycerophospholipids detected in previous studies [32,35] such as phosphatidic acid (PA), phosphatidylserine (PS), lysophosphatidylglycerol (LPG), hydroxylated-PE, CL, and MLCL (PE-OH, CL-OH, and MLCL-OH) were not detected in our conditions. However, phosphatidylmethanol (PMeOH) lipids were annotated but, since these minor lipids are formed during lipid extraction, they were not considered [41]. Interestingly, PC was annotated with six different species. Despite being a major lipid in eukaryotic cells, this glycerophospholipid is estimated to be present in about 15% of the bacteria and often associated with pathogenic host-microbe interactions. The relative amount of PC can vary from a few percent for P. aeruginosa to up to 70% for Acetobacter aceti [42]. For A. baumannii, based on this study it seems to account for an amount below 1%. Bacteria can employ two pathways to synthesize PC, by using choline as a substrate via PC synthases or through PE methylation [43]. Homologs of PC synthase were found in A. baumannii by using the amino acid sequences from P. aeruginosa as query, which consolidate this observation (data not shown).
Trent and coworkers performed the analysis of LOS-deficient A. baumannii strains in comparison with a wild-type strain using the 32P-radiolabeled standard to quantify glycerophospholipids by TLC on PE, PG, and CL [44]. In the same work, a LC-MS/MS analysis for PE, PG, CL, LPE, and PA showed no notable differences in the ratio of glycerophospholipid structures. Furthermore, a previous report described for a colistin-resistant LOS-deficient A. baumannii an enrichment of glycerophospholipids with shorter fatty acids [32] associated with a slower growth rate because of complete loss of LOS [15]. Herein, neither shorter fatty acids nor a slower growth rate (data not shown) was found associated with colistin resistance, suggesting a correlation between LOS deficiency and shorter fatty acids in glycerophospholipids but not with colistin resistance. Nevertheless, these same authors described two key metabolites linked with PE (ethanolamine phosphate and glyceroethanolamine phosphate) that were significantly lower in abundance for A. baumannii colistin-resistant strains [32]. This observation could explain at least in part the quantitative decrease in PE observed here when bacteria were grown in the presence of colistin and points out the potential use of PE as a substrate to transfer pEtN moiety on lipid A as described [14,45]. LOS have a negative charge targeted by colistin, and the addition of pEtN helps A. baumannii to evade the colistin action by reducing the net-negative charge of the outer membrane.
Interestingly, this observation occurs for colistin-susceptible and resistant strains, suggesting a rapid adaptation of the bacteria to a sublethal concentration of colistin. While shorter fatty acids were not observed for colistin-resistant bacteria, a significant increase in palmitic acid was noticed for the colistin-susceptible strain grown with a low concentration of colistin. It was long established that bacteria can modify their fatty acid composition during antimicrobial treatment, which can affect bacterial susceptibility to antimicrobials [46,47,48]. Saturated fatty acids are hypothesized to limit pore-forming antimicrobial activity by lowering bacterial membrane fluidity [49,50]. Likewise, in the presence of colistin, susceptible A. baumannii could lower membrane fluidity to circumvent disruption of the outer membrane induced by colistin at a sublethal concentration. Since PE is known to be a regulator of membrane fluidity in most eukaryotic cells [51] and bacteria [52], the palmitic acid increase could compensate the impact of the PE decrease on the membrane fluidity. A recent study on E. coli highlighted the influence of PE on the distribution of other lipid sub-classes between leaflets by vectorial molecular probes [52]. By using the same approach, PE asymmetry and homeostasis under colistin treatment could be better characterized.
Gram-negative bacteria have an asymmetric lipid distribution, essential for their viability [39]. The addition of a sublethal concentration of colistin for A. baumannii 721164 resulted in an adaptation mechanism for the cells to maintain membrane structure and function. This work will help the lipid analysis of A. baumannii and, in more general terms, the understanding of the colistin effect on gram-negative bacteria. Obviously, further studies are necessary on more A. baumannii strains to elucidate the physiological consequences of our findings. Therefore, by using state-of-the-art LC-HRMS2 based on untargeted lipidomics, these results should also help future works focused on the analyses of outer and inner membranes. Deciphering the plasma membrane homeostasis of A. baumannii under environmental stresses will help to design new antimicrobial strategies.
4. Conclusions
Altogether, our present observations show that exposure of a clinical isolate of A. baumannii to sublethal and lethal amounts of colistin triggers a set of lipid changes. Palmitic acid percentage increases only for the susceptible strain, suggesting an adaptation of the plasma membrane fluidity to limit colistin membrane destabilization. PE percentage decreases significantly on both strains, which, in turn, provides pEtN for LOS modification. As described in the literature [53], this addition of pEtN moiety on lipid A reduces the overall net-negative charge of the bacterial surface and confers resistance to colistin. The present study gives us an interesting view on lipid homeostasis of one clinical isolate. The 130 lipid species described could help future works dealing with A. baumanni lipidomics in general and, more specifically, on inner and outer membrane asymmetry. Our efforts could contribute to the development of novel inhibitory molecules targeting bacterial lipids to fight the difficult-to-treat diseases associated with A. baumannii.
5. Materials and Methods
5.1. Bacterial Strains and Growth Conditions
A. baumannii 721164 (AmpC, OXA-23, ArmA), a clinical isolate obtained from the microbiology department of the hospital of Valenciennes, was grown with aeration at 180 rpm in lysogeny broth (LB) Miller at 37 °C. No heteroresistance for colistin was detected for this strain by using population analysis profiling, as described previously [54]. The colistin-resistant A. baumannii 721164 was selected by gradually increasing colistin concentration from 0 to 5 μg/mL in 5 mL LB Miller. The first inoculation was 5 × 10⁵ CFU/mL without colistin. 1 mL of this suspension was transferred into a new tube containing 4 mL LB Miller with a 0.125 µg/mL for 24 h. The obtained bacteria were transferred into a new tube of 4 mL LB Miller but with a final concentration of 0.25 µg/mL for the same incubation time. The same treatments were applied sequentially with 0.5, 1, 2, and 5 µg/mL of colistin to the treated cells. In total, six passages were performed.
5.2. Susceptibility Testing to Colistin
The minimal inhibitor concentration (MIC) of colistin against A. baumannii was measured with broth microdilution (BMD) according to the Clinical Laboratory Standard Institute (CLSI) and European Committee on Antimicrobial Susceptibility Testing (EUCAST) guidelines with some modifications (http://www.eucast.org/clinical_breakpoints/, accessed on 30 April 2021) [55]. BMD panels were prepared in sterile flat polystyrene 96-well microplates (P7491-1CS from Sigma Aldrich, Saint-Quentin Fallavier, France). A 1280 μg/mL stock solution of colistin sulfate (PHR1605-1G from Sigma Aldrich, Saint-Quentin Fallavier, France) was prepared in sterile Milli-Q (MQ) water. Incremental dilutions were made in a LB Miller medium to a final concentration of 5 × 10⁵ CFU/mL. Two-fold dilutions of colistin concentrations were tested and ranged from 0.125 to 128 μg/mL. For all the strains, eight replicates of 100 μL/well were incubated for 24 h at 37 °C. The OD was measured at 600 nm on a plate reader. The interpretations are based on CLSI that provided susceptibility breakpoints for colistin against A. baumannii: MIC ≤ 2 μg/mL (susceptible), MIC ≥ 4 μg/mL (resistant).
5.3. Lipid Extraction
The lipids were extracted by using the Bligh and Dyer method with methanol (MeOH)/chloroform (CHCl3)/H2O 2:1:0.8 v/v/v [56]. Briefly, A. baumannii was inoculated at an initial concentration of 5 × 10⁵ CFU/mL and grown in 100 mL of LB Miller medium at different concentrations of colistin (0, 0.125, and 0.25 μg/mL (susceptible) or 0, 0.5 µg/mL (resistant)) at 37 °C overnight on an orbital shaker with 180 rpm. Each condition was repeated three times. Cells were harvested by centrifugation at 3500× g for 5 min at 4 °C, washed twice in MQ water. The cell pellet was resuspended in 1ml MQ water in a 50 mL centrifuge tube and left on ice for 5–10 min. Then, 4 mL MeOH and 2 mL CHCl3 were added and vortexed for 5 min. After incubating on ice for 10 min, 4 mL of CHCl3 and 2 mL of MQ water were added and shaken for 3 min. The lower phase was collected and supplemented with 1 mL of 0.5 M sodium chloride (NaCl). After hand-shaking for 1 min, phase separation was enhanced by centrifugation at 1500× g for 5 min. The final lower phase, approximately 4 mL, was collected and dried with nitrogen (N2). The lipids were stored at −20 °C until needed for further analyses.
5.4. Fatty Acids Analysis by GC-FID
The extracted lipids were suspended in 1 mL of CHCl3. Then, 200 μL of this solution was transferred to a new glass tube and dried under a stream of nitrogen (N2) at room temperature. Then, 1 mL of freshly prepared 5% H2SO4 (v/v) in MeOH, containing 50 μL of butylated hydroxytoluene (BHT; 1 mM), were added and completed with 300 μL of toluene. The mix was vortexed vigorously for 30 s before being heated for 1 h at 85–90 °C. Fatty acid methyl esters (FAME) were extracted with 1.5 mL of 0.9% NaCl (w/v) and 1 mL of heptane. The tube was vortexed and then centrifuged briefly to facilitate phase separation. The heptane extracts (upper organic phase) were transferred to a new glass tube and evaporated under a stream of N2, then dissolved in 50 μL heptane. FAME composition was determined by GC-FID. The GC-FID analyses were carried out on a Shimadzu GC 2010 plus gas chromatography, and chromatographic separation was performed on a BPX70 column (60 m × 0.25 mm id, film thickness 0.25 μm). The GC parameters were the following: the oven temperature program was 120 °C to 250 °C at 10 °C/min with helium as carrier gas. One µL of sample was injected in a 250 °C inlet with a 40:1 split ratio. Methyl ester derivatives were detected using a FID at 280 °C.
5.5. LC-HRMS2 Analyses
The extracted lipids were resuspended in 200 µL of isopropanol. LC was performed based on a modified protocol, as described before [57]. Briefly, liquid chromatograph used a Waters Aquity UPLC C18 column (100 × 2.4 mm, 1.7 µm) coupled to an Acquity UPLC CSH C18 VanGuard precolumn (5 × 2.1 mm; 1.7 µm) at 65 °C. Mobile phases were 60:40 (vol/vol) acetonitrile/water (solvent A) and 90:10 (vol/vol) isopropanol/acetonitrile (solvent B). For the positive mode, mobile phases were buffered with 10 mM ammonium formate and 0.1% formic acid. For the negative mode, the mobile phases were buffered with 10 mM ammonium acetate and 0.1% acetic acid. The flow rate was set at 0.6 mL/min and with an injection volume of 2 µL. LC-electrospray ionization (ESI)-HRMS2 analyses were achieved by coupling the LC system to a hybrid quadrupole time-of-flight (QTOF) mass spectrometer Agilent 6538 (Agilent Technologies) equipped with dual electrospray ionization (ESI), as described before in [58]. The source temperature, fragmentor, and the skimmer were set up at 350 °C, 150 V, and 65 V, respectively. The acquisition was made in full scan mode between 100 m/z and 1700 m/z, with a scan of 2 spectra per second. Selected parent ions were fragmented to a collision energy of 35 eV. MS2 scans were performed on the sixth-most intense ions. Two internal reference masses were used for in-run calibration of the mass spectrometer (121.0509 and 922.0098 in positive-ion mode and 112.9856 and 1033.9881 in negative-ion mode). MassHunter B.07 software enabled the control of the parameters of the machine, and acquired and processed the data. The mass spectra were acquired in positive- and negative-ion modes. Internal standards were used to quantify lipid classes in positive and negative ion modes. Then, 2 µL of internal standards (EquiSPLASH LIPIDOMIX, 330731-1EA from Sigma Aldrich, Saint-Quentin Fallavier, France) were added prior to extraction. Among the 13 deuterated lipids present in the internal standard, CL, HBMP, and MLCL were not present and, deuterated PGs were used as these lipids shared the same head group.
5.6. Data Processing and Annotation
Agilent generated files (*.d) were converted to the *.mzML format using MSConvert [59]. File (*.mzML) data sets were processed using MZmine [60]. Data were processed with the software MS-DIAL version 4.38 [61]. Baseline correction, peak detection, alignment, gap filling, and adduct identification for raw data were performed with MS-DIAL, according the parameters described in [61]. Lipids were annotated according to m/z, retention time, and MS/MS spectra obtained from MS-DIAL. Peak height was used as the mass spectral intensity for each annotated lipid. The nomenclature for lipid sub-class follows the definition from [62].
5.7. Statistical Analysis
MetaboAnalyst 5.0 [63] was used to estimate variation across the sample group (PCA and Heat map). For each sample, the peak area of each lipids was normalized to the total peak areas of all lipids. Significance was analyzed using ANOVA, and Tukey’s HSD was used as a post hoc test. Graphs were made using Prism Software V 5.0 (https://www.graphpad.com/support/prism-5-updates/, accessed on 31 January 2021); statistical significance was evaluated with student’s t test or a one-way analysis of variance. The results were considered significant for a p value of ≤0.05. Three assays were carried out for lipid analysis.
Author Contributions
Conceptualization, Y.T. and Y.R.; methodology, Y.T.; data curation, E.B., H.G., S.A. and Y.R.; writing—original draft preparation, Y.R. and L.D.; writing—review and editing, Y.R., L.D. and Y.T.; funding acquisition, L.D. All authors have read and agreed to the published version of the manuscript.
Funding
We thank the European Regional Development Fund and the Region of Picardy (CPER 2007–2020). Y.T. was funded by the China Scholarship Council.
Institutional Review Board Statement
Not applicable.
Informed Consent Statement
Not applicable.
Data Availability Statement
The data presented in this study are available on request from the corresponding author.
Acknowledgments
We would like to thank Benoît Ménart from the Microbiology Department at the Hospital Center of Valenciennes for the Acinetobacter baumannii strain.
Conflicts of Interest
The authors have no conflict of interest to disclose.
References
- Boucher, H.W.; Talbot, G.H.; Bradley, J.S.; Edwards, J.E.; Gilbert, D.; Rice, L.B.; Scheld, M.; Spellberg, B.; Bartlett, J. Bad bugs, no drugs: No ESKAPE! An update from the infectious diseases society of america. Clin. Infect. Dis. 2009, 48, 1–12. [Google Scholar] [CrossRef] [PubMed] [Green Version]
- Peleg, A.Y.; Seifert, H.; Paterson, D.L. Acinetobacter baumannii: Emergence of a successful pathogen. Clin. Microbiol. Rev. 2008, 21, 538–582. [Google Scholar] [CrossRef] [Green Version]
- Willyard, C. Drug-resistant bacteria ranked. Nature 2017, 543, 15. [Google Scholar] [CrossRef] [Green Version]
- El-Sayed Ahmed, M.A.E.-G.; Zhong, L.-L.; Shen, C.; Yang, Y.; Doi, Y.; Tian, G.-B. Colistin and its role in the era of antibiotic resistance: An extended review (2000–2019). Emerg. Microbes Infect. 2020, 9, 868–885. [Google Scholar] [CrossRef] [PubMed] [Green Version]
- Kawahara, S.; Utsunomiya, C.; Ishikawa, S.; Sekiguchi, J. Purification and characterization of an autolysin of Bacillus polymyxa var. colistinus which is most active at acidic pH. J. Ferment. Bioeng. 1997, 83, 419–422. [Google Scholar] [CrossRef]
- Koch-Weser, J.; Sidel, V.; Federman, R.; Kanarek, M.; Finer, D.; Eaton, A. Adverse effects of sodium colistimethate. Ann. Intern. Med. 1970, 72, 857. [Google Scholar] [CrossRef] [PubMed]
- Falagas, M.E.; Kasiakou, S.K.; Saravolatz, L.D. Colistin: The revival of polymyxins for the management of multidrug-resistant gram-negative bacterial infections. Clin. Infect. Dis. 2005, 40, 1333–1341. [Google Scholar] [CrossRef] [PubMed] [Green Version]
- Schindler, M.; Osborn, M.J. Interaction of divalent cations and polymyxin B with lipopolysaccharide. Biochemistry 1979, 18, 4425–4430. [Google Scholar] [CrossRef] [PubMed]
- Koike, M.; Iida, K.; Matsuo, T. Electron microscopic studies on mode of action of polymyxin. J. Bacteriol. 1969, 97, 448–452. [Google Scholar] [CrossRef] [Green Version]
- Velkov, T.; Thompson, P.E.; Nation, R.L.; Li, J. Structure-activity relationships of polymyxin antibiotics. J. Med. Chem. 2010, 53, 1898–1916. [Google Scholar] [CrossRef] [Green Version]
- Kaye, K.S.; Pogue, J.M.; Tran, T.B.; Nation, R.L.; Li, J. Agents of last resort: Polymyxin resistance. Infect. Dis. Clin. N. Am. 2016, 30, 391–414. [Google Scholar] [CrossRef] [PubMed]
- Raetz, C.R.H.; Whitfield, C. Lipopolysaccharide endotoxins. Annu. Rev. Biochem. 2002, 71, 635–700. [Google Scholar] [CrossRef] [Green Version]
- Needham, B.D.; Trent, M.S. Fortifying the barrier: The impact of lipid A remodelling on bacterial pathogenesis. Nat. Rev. Microbiol. 2013, 11, 467–481. [Google Scholar] [CrossRef] [PubMed]
- Poirel, L.; Jayol, A.; Nordmann, P. Polymyxins: Antibacterial activity, susceptibility testing, and resistance mechanisms encoded by plasmids or chromosomes. Clin. Microbiol. Rev. 2017, 30, 557–596. [Google Scholar] [CrossRef] [Green Version]
- Moffatt, J.H.; Harper, M.; Harrison, P.; Hale, J.D.F.; Vinogradov, E.; Seemann, T.; Henry, R.; Crane, B.; St. Michael, F.; Cox, A.D.; et al. Colistin resistance in Acinetobacter baumannii is mediated by complete loss of lipopolysaccharide production. Antimicrob. Agents Chemother. 2010, 54, 4971–4977. [Google Scholar] [CrossRef] [Green Version]
- Soon, R.L.; Nation, R.L.; Cockram, S.; Moffatt, J.H.; Harper, M.; Adler, B.; Boyce, J.D.; Larson, I.; Li, J. Different surface charge of colistin-susceptible and -resistant Acinetobacter baumannii cells measured with zeta potential as a function of growth phase and colistin treatment. J. Antimicrob. Chemother. 2011, 66, 126–133. [Google Scholar] [CrossRef] [Green Version]
- Pelletier, M.R.; Casella, L.G.; Jones, J.W.; Adams, M.D.; Zurawski, D.V.; Hazlett, K.R.O.; Doi, Y.; Ernst, R.K. Unique structural modifications are present in the lipopolysaccharide from colistin-resistant strains of Acinetobacter baumannii. Antimicrob. Agents Chemother. 2013, 57, 4831–4840. [Google Scholar] [CrossRef] [Green Version]
- Adams, M.D.; Nickel, G.C.; Bajaksouzian, S.; Lavender, H.; Murthy, A.R.; Jacobs, M.R.; Bonomo, R.A. Resistance to colistin in Acinetobacter baumannii associated with mutations in the PmrAB two-component system. Antimicrob. Agents Chemother. 2009, 53, 3628–3634. [Google Scholar] [CrossRef] [PubMed] [Green Version]
- Liu, Y.-Y.; Wang, Y.; Walsh, T.R.; Yi, L.-X.; Zhang, R.; Spencer, J.; Doi, Y.; Tian, G.; Dong, B.; Huang, X.; et al. Emergence of plasmid-mediated colistin resistance mechanism MCR-1 in animals and human beings in China: A microbiological and molecular biological study. Lancet Infect. Dis. 2016, 16, 161–168. [Google Scholar] [CrossRef]
- Huang, J.; Zhu, Y.; Han, M.-L.; Li, M.; Song, J.; Velkov, T.; Li, C.; Li, J. Comparative analysis of phosphoethanolamine transferases involved in polymyxin resistance across 10 clinically relevant gram-negative bacteria. Int. J. Antimicrob. Agents 2018, 51, 586–593. [Google Scholar] [CrossRef] [PubMed]
- Dößelmann, B.; Willmann, M.; Steglich, M.; Bunk, B.; Nübel, U.; Peter, S.; Neher, R.A. Rapid and consistent evolution of colistin resistance in extensively drug-resistant Pseudomonas aeruginosa during morbidostat culture. Antimicrob. Agents Chemother. 2017, 61. [Google Scholar] [CrossRef] [Green Version]
- Cafiso, V.; Stracquadanio, S.; Lo Verde, F.; Gabriele, G.; Mezzatesta, M.L.; Caio, C.; Pigola, G.; Ferro, A.; Stefani, S. Colistin resistant A. baumannii: Genomic and transcriptomic traits acquired under colistin therapy. Front. Microbiol. 2019, 9. [Google Scholar] [CrossRef] [PubMed]
- Kanipes, M.I.; Lin, S.; Cotter, R.J.; Raetz, C.R.H. Ca2+-induced phosphoethanolamine transfer to the outer 3-deoxy-D-manno-octulosonic acid moiety of Escherichia coli lipopolysaccharide. J. Biol. Chem. 2001, 276, 1156–1163. [Google Scholar] [CrossRef] [Green Version]
- Sohlenkamp, C.; Galindo-Lagunas, K.A.; Guan, Z.; Vinuesa, P.; Robinson, S.; Thomas-Oates, J.; Raetz, C.R.H.; Geiger, O. The lipid lysyl-phosphatidylglycerol is present in membranes of Rhizobium tropici CIAT899 and confers increased resistance to polymyxin B under acidic growth conditions. Mol. Plant-Microbe Interact. 2007, 20, 1421–1430. [Google Scholar] [CrossRef] [Green Version]
- Bisignano, C.; Ginestra, G.; Smeriglio, A.; La Camera, E.; Crisafi, G.; Franchina, F.; Tranchida, P.; Alibrandi, A.; Trombetta, D.; Mondello, L.; et al. Study of the lipid profile of ATCC and clinical strains of Staphylococcus aureus in relation to their antibiotic resistance. Molecules 2019, 24, 1276. [Google Scholar] [CrossRef] [Green Version]
- Sun, W.; Dunning, F.M.; Pfund, C.; Weingarten, R.; Bent, A.F. Within-species flagellin polymorphism in Xanthomonas campestris pv campestris and its impact on elicitation of Arabidopsis FLAGELLIN SENSING2-dependent defenses. Plant Cell 2006, 18, 764–779. [Google Scholar] [CrossRef] [Green Version]
- Schenk, E.R.; Nau, F.; Thompson, C.J.; Tse-Dinh, Y.-C.; Fernandez-Lima, F. Changes in lipid distribution in E. coli strains in response to norfloxacin. J. Mass Spectrom. 2015, 50, 88–94. [Google Scholar] [CrossRef] [PubMed] [Green Version]
- Shireen, T.; Singh, M.; Dhawan, B.; Mukhopadhyay, K. Characterization of cell membrane parameters of clinical isolates of Staphylococcus aureus with varied susceptibility to alpha-melanocyte stimulating hormone. Peptides 2012, 37, 334–339. [Google Scholar] [CrossRef] [PubMed]
- Leung, L.M.; McElheny, C.L.; Gardner, F.M.; Chandler, C.E.; Bowler, S.L.; Mettus, R.T.; Spychala, C.N.; Fowler, E.L.; Opene, B.N.A.; Myers, R.A.; et al. A prospective study of Acinetobacter baumannii complex isolates and colistin susceptibility monitoring by mass spectrometry of microbial membrane glycolipids. J. Clin. Microbiol. 2018, 57. [Google Scholar] [CrossRef] [Green Version]
- Henry, R.; Crane, B.; Powell, D.; Deveson Lucas, D.; Li, Z.; Aranda, J.; Harrison, P.; Nation, R.L.; Adler, B.; Harper, M.; et al. The transcriptomic response of Acinetobacter baumannii to colistin and doripenem alone and in combination in an in vitro pharmacokinetics/pharmacodynamics model. J. Antimicrob. Chemother. 2015, 70, 1303–1313. [Google Scholar] [CrossRef] [PubMed] [Green Version]
- Han, M.-L.; Zhu, Y.; Creek, D.J.; Lin, Y.-W.; Anderson, D.; Shen, H.-H.; Tsuji, B.; Gutu, A.D.; Moskowitz, S.M.; Velkov, T.; et al. Alterations of metabolic and lipid profiles in polymyxin-resistant Pseudomonas aeruginosa. Antimicrob. Agents Chemother. 2018, 62. [Google Scholar] [CrossRef] [Green Version]
- Mahamad Maifiah, M.H.; Cheah, S.-E.; Johnson, M.D.; Han, M.-L.; Boyce, J.D.; Thamlikitkul, V.; Forrest, A.; Kaye, K.S.; Hertzog, P.; Purcell, A.W.; et al. Global metabolic analyses identify key differences in metabolite levels between polymyxin-susceptible and polymyxin-resistant Acinetobacter baumannii. Sci. Rep. 2016, 6, 22287. [Google Scholar] [CrossRef] [PubMed] [Green Version]
- Jasim, R.; Han, M.-L.; Zhu, Y.; Hu, X.; Hussein, M.; Lin, Y.-W.; Zhou, Q. (Tony); Dong, C.; Li, J.; Velkov, T. Lipidomic analysis of the outer membrane vesicles from paired polymyxin-susceptible and -resistant Klebsiella pneumoniae clinical isolates. Int. J. Mol. Sci. 2018, 19, 2356. [Google Scholar] [CrossRef] [Green Version]
- Hugh, R.; Reese, R. Designation of the type strain for Bacterium anitratum Schaub and Hauber 1948. Int. J. Syst. Bacteriol. 1967, 17, 245–254. [Google Scholar] [CrossRef]
- Lopalco, P.; Stahl, J.; Annese, C.; Averhoff, B.; Corcelli, A. Identification of unique cardiolipin and monolysocardiolipin species in Acinetobacter baumannii. Sci. Rep. 2017, 7, 2972. [Google Scholar] [CrossRef] [PubMed] [Green Version]
- Heath, R.J.; White, S.W.; Rock, C.O. Lipid biosynthesis as a target for antibacterial agents. Prog. Lipid Res. 2001, 40, 467–497. [Google Scholar] [CrossRef]
- White, S.W.; Zheng, J.; Zhang, Y.-M.; Rock, C.O. The structural biology of type II fatty acid biosynthesis. Annu. Rev. Biochem. 2005, 74, 791–831. [Google Scholar] [CrossRef]
- Satlin, M.J.; Lewis, J.S.; Weinstein, M.P.; Patel, J.; Humphries, R.M.; Kahlmeter, G.; Giske, C.G.; Turnidge, J. Clinical and laboratory standards institute and european committee on antimicrobial susceptibility testing position statements on polymyxin B and colistin clinical breakpoints. Clin. Infect. Dis. 2020. [Google Scholar] [CrossRef]
- Kamischke, C.; Fan, J.; Bergeron, J.; Kulasekara, H.D.; Dalebroux, Z.D.; Burrell, A.; Kollman, J.M.; Miller, S.I. The Acinetobacter baumannii Mla system and glycerophospholipid transport to the outer membrane. Elife 2019, 8. [Google Scholar] [CrossRef]
- Alvarez, H.; Steinbüchel, A. Triacylglycerols in prokaryotic microorganisms. Appl. Microbiol. Biotechnol. 2002, 60, 367–376. [Google Scholar] [CrossRef] [PubMed]
- Garrett, T.A.; Raetz, C.R.H.; Son, J.D.; Richardson, T.D.; Bartling, C.; Guan, Z. Non-enzymatically derived minor lipids found in Escherichia coli lipid extracts. Biochim. Biophys. Acta Mol. Cell Biol. Lipids 2011, 1811, 827–837. [Google Scholar] [CrossRef] [Green Version]
- Geiger, O.; López-Lara, I.M.; Sohlenkamp, C. Phosphatidylcholine biosynthesis and function in bacteria. Biochim. Biophys. Acta Mol. Cell Biol. Lipids 2013, 1831, 503–513. [Google Scholar] [CrossRef] [PubMed]
- Vasilopoulos, G.; Moser, R.; Petersen, J.; Aktas, M.; Narberhaus, F. Promiscuous phospholipid biosynthesis enzymes in the plant pathogen Pseudomonas syringae. Biochim. Biophys. Acta Mol. Cell Biol. Lipids 2021, 1866, 158926. [Google Scholar] [CrossRef]
- Boll, J.M.; Crofts, A.A.; Peters, K.; Cattoir, V.; Vollmer, W.; Davies, B.W.; Trent, M.S. A penicillin-binding protein inhibits selection of colistin-resistant, lipooligosaccharide-deficient Acinetobacter baumannii. Proc. Natl. Acad. Sci. USA 2016, 113, E6228–E6237. [Google Scholar] [CrossRef] [PubMed] [Green Version]
- Cox, A.D.; Wright, J.C.; Li, J.; Hood, D.W.; Moxon, E.R.; Richards, J.C. Phosphorylation of the lipid A region of meningococcal lipopolysaccharide: Identification of a family of transferases that add phosphoethanolamine to lipopolysaccharide. J. Bacteriol. 2003, 185, 3270–3277. [Google Scholar] [CrossRef] [PubMed] [Green Version]
- Stahl, R.S.; Bisha, B.; Mahapatra, S.; Chandler, J.C. A model for the prediction of antimicrobial resistance in Escherichia coli based on a comparative evaluation of fatty acid profiles. Diagn. Microbiol. Infect. Dis. 2020, 96, 114966. [Google Scholar] [CrossRef] [PubMed]
- Mazzotta, A.S.; Montville, T.J. Characterization of fatty acid composition, spore germination, and thermal resistance in a Nisin-resistant mutant of Clostridium botulinum 169B and in the Wild-Type strain. Appl. Environ. Microbiol. 1999, 65, 659–664. [Google Scholar] [CrossRef] [Green Version]
- Dunnick, J.K.; O’Leary, W.M. Correlation of bacterial lipid composition with antibiotic resistance. J. Bacteriol. 1970, 101, 892–900. [Google Scholar] [CrossRef] [Green Version]
- Gonçalves, F.D.A.; de Carvalho, C.C.C.R. Phenotypic modifications in Staphylococcus aureus cells exposed to high concentrations of vancomycin and teicoplanin. Front. Microbiol. 2016, 7. [Google Scholar] [CrossRef] [PubMed]
- Boudjemaa, R.; Cabriel, C.; Dubois-Brissonnet, F.; Bourg, N.; Dupuis, G.; Gruss, A.; Lévêque-Fort, S.; Briandet, R.; Fontaine-Aupart, M.-P.; Steenkeste, K. Impact of bacterial membrane fatty acid composition on the failure of daptomycin to kill Staphylococcus aureus. Antimicrob. Agents Chemother. 2018, 62. [Google Scholar] [CrossRef] [Green Version]
- Dawaliby, R.; Trubbia, C.; Delporte, C.; Noyon, C.; Ruysschaert, J.-M.; Van Antwerpen, P.; Govaerts, C. Phosphatidylethanolamine is a key regulator of membrane fluidity in eukaryotic cells. J. Biol. Chem. 2016, 291, 3658–3667. [Google Scholar] [CrossRef] [Green Version]
- Bogdanov, M.; Pyrshev, K.; Yesylevskyy, S.; Ryabichko, S.; Boiko, V.; Ivanchenko, P.; Kiyamova, R.; Guan, Z.; Ramseyer, C.; Dowhan, W. Phospholipid distribution in the cytoplasmic membrane of gram-negative bacteria is highly asymmetric, dynamic, and cell shape-dependent. Sci. Adv. 2020, 6, eaaz6333. [Google Scholar] [CrossRef]
- Samantha, A.; Vrielink, A. Lipid A phosphoethanolamine transferase: Regulation, structure and immune response. J. Mol. Biol. 2020, 432, 5184–5196. [Google Scholar] [CrossRef]
- El-Halfawy, O.M.; Valvano, M.A. Antimicrobial heteroresistance: An emerging field in need of clarity. Clin. Microbiol. Rev. 2015, 28, 191–207. [Google Scholar] [CrossRef] [Green Version]
- Dafopoulou, K.; Zarkotou, O.; Dimitroulia, E.; Hadjichristodoulou, C.; Gennimata, V.; Pournaras, S.; Tsakris, A. Comparative evaluation of colistin susceptibility testing methods among carbapenem-nonsusceptible Klebsiella pneumoniae and Acinetobacter baumannii clinical isolates. Antimicrob. Agents Chemother. 2015, 59, 4625–4630. [Google Scholar] [CrossRef] [PubMed] [Green Version]
- Bligh, E.G.; Dyer, W.J. A rapid method of total lipid extraction and purification. Can. J. Biochem. Physiol. 1959, 37, 911–917. [Google Scholar] [CrossRef] [Green Version]
- Cajka, T.; Fiehn, O. LC-MS-Based lipidomics and automated identification of lipids using the LipidBlast in-silico MS/MS Library. In Lipidomics: Methods and Protocols; Bhattacharya, S.K., Ed.; Springer: New York, NY, USA, 2017; pp. 149–170. ISBN 978-1-4939-6996-8. [Google Scholar]
- Cazzola, H.; Lemaire, L.; Acket, S.; Prost, E.; Duma, L.; Erhardt, M.; Čechová, P.; Trouillas, P.; Mohareb, F.; Rossi, C.; et al. The impact of plasma membrane lipid composition on flagellum-mediated adhesion of enterohemorrhagic Escherichia coli. mSphere 2020, 5. [Google Scholar] [CrossRef] [PubMed]
- Chambers, M.C.; Maclean, B.; Burke, R.; Amodei, D.; Ruderman, D.L.; Neumann, S.; Gatto, L.; Fischer, B.; Pratt, B.; Egertson, J.; et al. A cross-platform toolkit for mass spectrometry and proteomics. Nat. Biotechnol. 2012, 30, 918–920. [Google Scholar] [CrossRef] [PubMed]
- Pluskal, T.; Castillo, S.; Villar-Briones, A.; Orešič, M. MZmine 2: Modular framework for processing, visualizing, and analyzing mass spectrometry-based molecular profile data. BMC Bioinform. 2010, 11. [Google Scholar] [CrossRef] [PubMed] [Green Version]
- Tsugawa, H.; Ikeda, K.; Takahashi, M.; Satoh, A.; Mori, Y.; Uchino, H.; Okahashi, N.; Yamada, Y.; Tada, I.; Bonini, P.; et al. A lipidome atlas in MS-DIAL 4. Nat. Biotechnol. 2020, 38, 1159–1163. [Google Scholar] [CrossRef]
- Liebisch, G.; Fahy, E.; Aoki, J.; Dennis, E.A.; Durand, T.; Ejsing, C.S.; Fedorova, M.; Feussner, I.; Griffiths, W.J.; Köfeler, H.; et al. Update on LIPID MAPS classification, nomenclature, and shorthand notation for MS-derived lipid structures. J. Lipid Res. 2020, 61, 1539–1555. [Google Scholar] [CrossRef] [PubMed]
- Pang, Z.; Chong, J.; Li, S.; Xia, J. MetaboanalystR 3.0: Toward an optimized workflow for global metabolomics. Metabolites 2020, 10, 186. [Google Scholar] [CrossRef] [PubMed]
Figure 1.
Low concentrations of colistin alter Acinetobacter baumannii lipid profiles. PCA scores plot showing variances in lipid species between susceptible strains without and with colistin at 0.125 µg/mL or 0.25 µg/mL and resistant without or with colistin at 5 µg/mL of Acinetobacter baumannii 721164. The results correspond to n = 3 biologically independent samples. Ellipses represent 95% confidence intervals. The analysis was performed using MetaboAnalyst V5.0 (https://www.metaboanalyst.ca/, accessed on 15 January 2021).

Figure 2.
A. baumannii 721164 lipid content differs when incubated with colistin. (A) Fatty acid methyl ester analysis of A. baumannii 721164 by GC-FID cultivated without or with colistin at 0.125 µg/mL or 0.25 µg/mL. (B–D) mol % of different lipid species analyzed by LC-MS. (E) Fatty acid methyl ester analysis of A. baumannii 721164 resistant to colistin by GC-FID cultivated without or with colistin at 5 µg/mL. (F–H) mol % of different lipid species analyzed by LC-MS. The results correspond to n = 3 biologically independent samples. Statistical significances were determined by a two-tailed student’s t test ***, p ≤ 0.001; **, p ≤ 0.005; *, p ≤ 0.05.

Figure 3.
Colistin treated strains and lipid species. Heat map of the 30 most statistically different lipid species analyzed by LC-MS. (A) Comparison of A. baumannii 721164 susceptible strain at 0 (red), 0.125 µg/mL (green), and 0.25 µg/mL (blue) colistin. (B) Comparison of A. baumannii 721164 resistant without (red) or with 0.5 µg/mL (green) colistin, respectively. The results correspond to n = 3 biologically independent samples. Color coding indicates greater deviation from the mean from all samples for a particular lipid. The analysis was performed using MetaboAnalyst V5.0.


Table 1.
Minimal inhibitory concentration (MIC) of colistin of the investigated A. baumannii 721164 determined by broth microdilution.
Table 1.
Minimal inhibitory concentration (MIC) of colistin of the investigated A. baumannii 721164 determined by broth microdilution.
| Acinetobacter baumannii 721164 | Susceptible | Resistant |
|---|---|---|
| Colistin | 0.5 | >128 |
Note: MIC values are in µg/mL.
Table 2.
Lipid assignments of the total lipid extract of Acinetobacter baumannii 721164 grown in LB and analyzed by LC-HRMS2. The adduct type for Cardiolipin (CL), Monolysocardiolipin (MLCL), Hemibismonoacylglycerophosphate (HBMP), Lysophosphatidylethanolamine (LPE), Phosphoethanolamine (PE), and Phosphatidylglycerol (PG) is [M-H]-; for Phosphatidylcholine (PC) is [M+H]+; for Diacylglycerol (DAG) and Triacylglycerol (TAG) is [M+NH4]+. Lipids in grey are found in quantities over 5% of the total lipid sub-classes with CL/MLCL, PE/LPE, and DAG/TAG gathered to calculate the percentage of each lipid species. The highest abundant lipid species are in red.
| Lipids | m/z | Retention Time | Assignment |
|---|---|---|---|
| Cardiolipin (CL) | 1293.89026 | 9.502 | CL 60:1 |
| 1291.87561 | 9.099 | CL 60:2 | |
| 1289.85425 | 8.62 | CL 60:3 | |
| 1305.89014 | 9.326 | CL 61:2 | |
| 1303.8728 | 8.866 | CL 61:3 | |
| 1321.9187 | 9.991 | CL 62:1 | |
| 1319.90637 | 9.495 | CL 62:2 | |
| 1317.89062 | 9.138 | CL 62:3 | |
| 1335.93335 | 10.148 | CL 63:1 | |
| 1333.92212 | 9.805 | CL 63:2 | |
| 1331.90564 | 9.362 | CL 63:3 | |
| 1347.93762 | 10.034 | CL 64:2|CL 16:0_16:1_16:0_16:1 | |
| 1345.9209 | 9.483 | CL 64:3|CL 16:0_16:1_16:1_16:1 | |
| 1361.9541 | 10.21 | CL 65:2 | |
| 1359.93982 | 9.837 | CL 65:3 | |
| 1357.92249 | 9.389 | CL 65:4 | |
| 1375.96924 | 10.205 | CL 66:2|CL 16:0_16:1_16:0_18:1 | |
| 1373.953 | 10.067 | CL 66:3|CL 16:0_16:1_16:1_18:1 | |
| 1371.93896 | 9.656 | CL 66:4 | |
| 1389.98438 | 10.276 | CL 67:2 | |
| 1387.96814 | 10.219 | CL 67:3|CL 33:1_34:2 | |
| 1385.95239 | 9.863 | CL 67:4 | |
| 1403.99841 | 10.299 | CL 68:2|CL 16:0_18:1_16:0_18:1 | |
| 1401.98572 | 10.219 | CL 68:3|CL 16:0_18:1_16:1_18:1 | |
| 1399.96814 | 10.092 | CL 68:4 | |
| 1418.01538 | 10.313 | CL 69:2 | |
| 1415.99963 | 10.279 | CL 69:3 | |
| 1413.98303 | 10.223 | CL 69:4 | |
| 1430.01562 | 10.303 | CL 70:3|CL 16:0_18:1_18:1_18:1 | |
| 1427.99902 | 10.266 | CL 70:4 | |
| 1444.02808 | 10.317 | CL 71:3 | |
| 1456.02783 | 10.303 | CL 72:4 | |
| Monolysocardiolipin (MLCL) | 1107.68982 | 6.044 | MLCL 48:0 |
| 1121.70483 | 6.354 | MLCL 49:0 | |
| 1117.67041 | 8.435 | MLCL 49:2 | |
| 1135.72205 | 6.712 | MLCL 50:0 | |
| 1137.74084 | 7.17 | MLCL 50:2|MLCL 16:0_34:2 | |
| 1149.73999 | 7.012 | MLCL 51:0 | |
| 1163.75537 | 7.218 | MLCL 52:0 | |
| 1165.77185 | 7.785 | MLCL 52:2|MLCL 18:0_34:2 | |
| 1157.70374 | 6.694 | MLCL 52:3 | |
| 1191.78455 | 7.806 | MLCL 53:0 | |
| 1187.75085 | 7.762 | MLCL 53:2 | |
| 1185.7345 | 7.264 | MLCL 53:3 | |
| Hemibismonoacylglycerophosphate (HBMP) | 901.65656 | 7.196 | HBMP 44:1|HBMP 16:1/12:0_16:0 |
| 929.68842 | 7.81 | HBMP 46:1|HBMP 16:0/14:0_16:1 | |
| 927.67273 | 7.244 | HBMP 46:2|HBMP 14:0/14:1_18:1 | |
| 957.72144 | 8.389 | HBMP 48:1|HBMP 16:0/16:0_16:1 | |
| 955.70532 | 7.872 | HBMP 48:2|HBMP 16:1/16:0_16:1 | |
| 953.69006 | 7.32 | HBMP 48:3|HBMP 16:1/16:1_16:1 | |
| 970.72339 | 8.17 | HBMP 49:3 | |
| 985.75183 | 8.934 | HBMP 50:1|HBMP 16:0/16:0_18:1 | |
| 983.73761 | 8.36 | HBMP 50:2|HBMP 16:1/16:0_18:1 | |
| 981.72137 | 7.924 | HBMP 50:3|HBMP 16:1/16:1_18:1 | |
| 1000.76843 | 9.183 | HBMP 51:2 | |
| 1011.7688 | 8.998 | HBMP 52:2|HBMP 18:1/16:0_18:1 | |
| Phosphatidylcholine (PC) | 734.5694 | 6.325 | PC 32:0|PC 16:0_16:0 |
| 732.55377 | 6.661 | PC 32:1|PC 16:0_16:1 | |
| 730.53809 | 4.832 | PC 32:2|PC 16:1_16:1 | |
| 760.58508 | 6.182 | PC 34:1|PC 16:0_18:1 | |
| 758.5694 | 5.525 | PC 34:2|PC 16:1_18:1 | |
| Lysophosphatidylethaniolamine (LPE) | 450.26407 | 1.067 | LPE 16:1 |
| 464.28006 | 1.321 | LPE 17:1 | |
| 478.29681 | 1.648 | LPE 18:1 | |
| Phosphatidylethanolamine (PE) | 662.479 | 5.642 | PE 30:0|PE 14:0_16:0 |
| 660.46484 | 4.993 | PE 30:1|PE 14:0_16:1 | |
| 674.48035 | 5.368 | PE 31:1|PE 15:0_16:1 | |
| 690.5108 | 6.406 | PE 32:0|PE 16:0_16:0 | |
| 688.49481 | 5.736 | PE 32:1|PE 16:0_16:1 | |
| 686.47961 | 5.093 | PE 32:2|PE 16:1_16:1 | |
| 702.51129 | 6.114 | PE 33:1|PE 16:0_17:1 | |
| 700.49573 | 5.446 | PE 33:2|PE 16:1_17:1 | |
| 716.52686 | 6.519 | PE 34:1|PE 16:0_18:1 | |
| 714.51105 | 5.83 | PE 34:2|PE 16:1_18:1 | |
| 730.54224 | 8.1 | PE 35:1|PE 17:0_18:1 | |
| 730.54279 | 6.858 | PE 35:1|PE 17:0_18:1 | |
| 728.52765 | 6.2 | PE 35:2|PE 17:1_18:1 | |
| 744.55786 | 7.261 | PE 36:1|PE 18:0_18:1 | |
| 742.54224 | 6.598 | PE 36:2|PE 18:1_18:1 | |
| Phosphatidylglycerol (PG) | 693.47375 | 4.525 | PG 30:0|PG 14:0_16:0 |
| 691.45935 | 4.051 | PG 30:1|PG 14:0_16:1 | |
| 705.47412 | 4.327 | PG 31:1|PG 15:0_16:1 | |
| 719.49042 | 4.616 | PG 32:1|PG 16:0_16:1 | |
| 717.47479 | 4.155 | PG 32:2|PG 16:1_16:1 | |
| 733.50592 | 4.935 | PG 33:1|PG 16:0_17:1 | |
| 731.49005 | 4.407 | PG 33:2|PG 16:1_17:1 | |
| 747.52142 | 5.227 | PG 34:1|PG 16:0_18:1 | |
| 745.50616 | 4.751 | PG 34:2|PG 16:1_18:1 | |
| 761.53699 | 5.61 | PG 35:1|PG 17:0_18:1 | |
| 759.52203 | 5.016 | PG 35:2|PG 17:1_18:1 | |
| 775.55298 | 5.948 | PG 36:1|PG 18:0_18:1 | |
| 773.53888 | 5.322 | PG 36:2|PG 18:1_18:1 | |
| Diacylglycerol (DAG) | 586.54303 | 7.577 | DAG 32:0|DAG 16:0_16:0 |
| 584.53033 | 6.908 | DAG 32:1|DAG 16:0_16:1 | |
| 582.51422 | 6.23 | DAG 32:2|DAG 16:1_16:1 | |
| 598.54559 | 7.278 | DAG 33:1|DAG 16:0_17:1 | |
| 614.57684 | 8.293 | DAG 34:0|DAG 16:0_18:0 | |
| 612.55981 | 7.641 | DAG 34:1|DAG 16:0_18:1 | |
| 610.54663 | 7.159 | DAG 34:2|DAG 16:1_18:1 | |
| 626.57391 | 7.997 | DAG 35:1|DAG 17:0_18:1 | |
| 642.60565 | 8.969 | DAG 36:0|DAG 18:0_18:0 | |
| 640.59149 | 8.353 | DAG 36:1|DAG 18:0_18:1 | |
| 638.57568 | 7.692 | DAG 36:2|DAG 18:1_18:1 | |
| Triacylglycerol (TAG) | 768.71069 | 10.794 | TAG 44:0|TAG 14:0_14:0_16:0 |
| 766.69482 | 10.333 | TAG 44:1|TAG 12:0_16:0_16:1 | |
| 796.74341 | 11.257 | TAG 46:0|TAG 14:0_16:0_16:0 | |
| 794.72626 | 10.814 | TAG 46:1|TAG 14:0_16:0_16:1 | |
| 792.7085 | 10.435 | TAG 46:2|TAG 14:0_16:1_16:1 | |
| 810.75525 | 11.472 | TAG 47:0|TAG 15:0_16:0_16:0 | |
| 808.74298 | 11.046 | TAG 47:1|TAG 15:0_16:0_16:1 | |
| 824.77271 | 11.622 | TAG 48:0|TAG 16:0_16:0_16:0 | |
| 822.75842 | 11.276 | TAG 48:1|TAG 16:0_16:0_16:1 | |
| 820.74347 | 10.845 | TAG 48:2|TAG 16:0_16:1_16:1 | |
| 818.72485 | 10.461 | TAG 48:3|TAG 14:1_16:1_18:1 | |
| 838.7934 | 11.838 | TAG 49:0|TAG 16:0_16:0_17:0 | |
| 836.77765 | 11.492 | TAG 49:1|TAG 16:0_17:0_16:1 | |
| 834.75635 | 11.105 | TAG 49:2|TAG 16:0_16:1_17:1 | |
| 852.79919 | 11.729 | TAG 50:0|TAG 16:0_16:0_18:0 | |
| 850.78961 | 11.7 | TAG 50:1|TAG 16:0_16:0_18:1 | |
| 848.77393 | 11.296 | TAG 50:2|TAG 16:0_16:1_18:1 | |
| 846.75836 | 10.867 | TAG 50:3|TAG 16:1_16:1_18:1 | |
| 866.8172 | 11.865 | TAG 51:0|TAG 16:0_17:0_18:0 | |
| 864.80768 | 11.853 | TAG 51:1|TAG 16:0_17:0_18:1 | |
| 862.7915 | 11.503 | TAG 51:2|TAG 16:0_17:1_18:1 | |
| 878.82141 | 11.957 | TAG 52:1|TAG 16:0_18:0_18:1 | |
| 876.80676 | 11.706 | TAG 52:2|TAG 16:0_18:1_18:1 | |
| 874.78894 | 11.313 | TAG 52:3|TAG 16:1_18:1_18:1 | |
| 892.83417 | 12.027 | TAG 54:1|TAG 18:0_18:0_18:1 | |
| 890.8208 | 11.855 | TAG 54:2|TAG 18:0_18:1_18:1 | |
| 906.85333 | 12.085 | TAG 54:3|TAG 18:1_18:1_18:1 |
Publisher’s Note: MDPI stays neutral with regard to jurisdictional claims in published maps and institutional affiliations. |
© 2021 by the authors. Licensee MDPI, Basel, Switzerland. This article is an open access article distributed under the terms and conditions of the Creative Commons Attribution (CC BY) license (https://creativecommons.org/licenses/by/4.0/).
Share and Cite
MDPI and ACS Style
Tao, Y.; Acket, S.; Beaumont, E.; Galez, H.; Duma, L.; Rossez, Y. Colistin Treatment Affects Lipid Composition of Acinetobacter baumannii. Antibiotics 2021, 10, 528. https://0-doi-org.brum.beds.ac.uk/10.3390/antibiotics10050528
AMA Style
Tao Y, Acket S, Beaumont E, Galez H, Duma L, Rossez Y. Colistin Treatment Affects Lipid Composition of Acinetobacter baumannii. Antibiotics. 2021; 10(5):528. https://0-doi-org.brum.beds.ac.uk/10.3390/antibiotics10050528
Chicago/Turabian StyleTao, Ye, Sébastien Acket, Emma Beaumont, Henri Galez, Luminita Duma, and Yannick Rossez. 2021. "Colistin Treatment Affects Lipid Composition of Acinetobacter baumannii" Antibiotics 10, no. 5: 528. https://0-doi-org.brum.beds.ac.uk/10.3390/antibiotics10050528
Note that from the first issue of 2016, this journal uses article numbers instead of page numbers. See further details here.