Article

Snapshot of the Distribution and Biology of Alien Jellyfish Cassiopea andromeda (Forsskål, 1775) in a Mediterranean Touristic Harbour

1
Italian Institute for Environmental Protection and Research, Department for the Monitoring and Protection of the Environment and for the Conservation of Biodiversity, Unit for Conservation Management and Sustainable Use of Fish and Marine Resources, Lungomare Cristoforo Colombo 4521 (Ex Complesso Roosevelt), Località Addaura, 90149 Palermo, Italy
2
GRAM Gruppo di Ricerca Applicata al Mare Soc. Coop., 90100 Palermo, Italy
3
Italian Institute for Environmental Protection and Research, Department for the Monitoring and Protection of the Environment and for the Conservation of Biodiversity, Unit for Marine Waters and Ecosystems Monitoring and Characterisation, Località Brondolo, 30015 Chioggia, Italy
4
University of Palermo, Department of Earth and Marine Sciences (DiSTeM), Via Archirafi 22, 90123 Palermo, Italy
5
Stazione Zoologica Anton Dohrn, Department of Integrative Marine Ecology (EMI), Sicily Marine Centre, Lungomare Cristoforo Colombo 4521 (Ex Complesso Roosevelt), Località Addaura, 90149 Palermo, Italy
*
Author to whom correspondence should be addressed.
Submission received: 6 December 2021 / Revised: 10 February 2022 / Accepted: 11 February 2022 / Published: 16 February 2022
(This article belongs to the Special Issue Conservation of Marine Ecosystems: Selected Papers from MetroSea 2021)

Abstract

:

Simple Summary

Alien species are an important cause of biodiversity loss and changes to ecosystems. Harbors are hotspots for the introduction of these species, and, usually, the impacts and pathways of invasion of the host populations are poorly known. Since 2014, an alien jellyfish, Cassiopea andromeda, coming from the Red Sea, has invaded a Mediterranean touristic harbor and established a population there. In this study, the distribution and trophic behavior of C. andromeda were investigated to improve knowledge on this species within the Mediterranean. The preliminary results highlight and confirm that C. andromeda is a perfect invader thanks to its nutritional strategy and capacity to adapt to heavily anthropized areas. Therefore, its potential impact on the local biodiversity and thus on the ecosystem’s structure and functioning is worth considering.

Abstract

Harbors are hotspots for the introduction of alien species, and, usually, investigations on their host populations help fill the knowledge gap in their pathways of invasion and in their impacts on marine biodiversity and ecosystems. In 2014, the upside-down alien jellyfish Cassiopea andromeda invaded a Mediterranean touristic harbor (“Cala”), and its abundance has since increased over time. In the present study, the distribution and trophic behavior of C. andromeda in Cala were investigated for the years 2017–2018 through visual sampling, and GIS-based statistical and stable isotope analyses. Since Cala is a hard-to-reach area (with many anchor cables and boats), Megabenthos Underwater Video was used to count the number and estimate the size of jellyfishes. The variations in size throughout the study period suggest that the population of C. andromeda is quite established in Cala at depths lower than 7.5 m. The ranges of the environmental parameters recorded (temperature, salinity, and transparency) were consistent with the ideal conditions for maintaining a Cassiopea population, but they did not seem to influence aggregation. Additionally, the carbon and nitrogen isotopic signatures studied highlight the mixotrophic behavior of this species. These preliminary results confirm the capacity of C. andromeda to live and reproduce in heavily anthropized areas.

1. Introduction

The presence of non-indigenous species (NIS), also called alien species, is considered an important cause of biodiversity loss and changes in an ecosystem [1]. In the Mediterranean Sea, NIS can also be introduced via maritime traffic, by means of ballast waters and hull fouling. The diffusion of NIS has also been correlated with climate changes, which allows tropical and subtropical species to expand their distribution to other habitats [2,3,4]. For these reasons, harbors are hotspots for the introduction of NIS, and, usually, the host populations need to be studied to fill the knowledge gap in their pathways of invasion and in their impacts on the surrounding ecosystems. In 2014, the Lessepsian upside-down jellyfish Cassiopea andromeda (Forsskål, 1775) (Cnidaria, Rhizostomeae) invaded a touristic harbor of Palermo (Sicily, Italy) named Cala. Over the years, its abundance within Cala has increased [5].
C. andromeda (Figure 1) entered the Mediterranean from the Red Sea through the Suez Canal [5,6] and colonized several areas of the basin. This species is an epibenthic scyphozoan with a maximum umbrella diameter of about 30 cm commonly found in tropical and subtropical shallow coastal ecosystems such as mangroves, estuaries, and sandy mudflats. This species has a metagenetic cycle with the following phases: planula, benthic polyp, ephyra, and adult medusa [7].
Contrary to jellyfish with pelagic behaviors, these benthic jellyfish prefer habitats with less water movements [8,9,10]. They often lay down on their umbrella, exposing their oral arms to the sun. Similar to other Rhizostomeae jellyfish, they frequently exhibit a symbiotic relationship with dinoflagellates, such as Symbiodinium spp., which are present in the tentacular tissue on their oral arms [11]. This relationship allows the jellyfish species to feed via direct predation and through photosynthesis by the zooxanthellae [12,13]; this mixed feeding of the jellyfish is called mixotrophy (concurrent autotrophy and heterotrophy).
In this symbiotic interaction, the carbon needed for the basal metabolism of the host is provided by the photosynthetic process [14,15,16,17], whereas nitrogen is taken up from the environment through the digestive processes [12,13]. However, this amount of nutrient intake is not fixed but rather depends on the species and the environments in which they grow (see, e.g., [16,17,18,19,20]). As with other symbiotic cnidarians, Cassiopea jellyfish may acquire dissolved nutrients from the surrounding environment to meet the energetic needs of their photosynthetic partners [21], while zooxanthellae may provide much of the carbon requirements to the host, which are critical to the metamorphosis of ephyrae and to the survival of the jellyfish [8]. Stable carbon and nitrogen isotopes might be valuable indicators of the relative importance between the autotrophy and heterotrophy pathways [22,23,24]. Subsequent studies have found that several factors such as inorganic nitrogen uptake [25], terrestrial nitrogen loads [26], eutrophication [26,27,28,29], zooxanthellae population dynamics [30], light [31], and bleaching [32] may affect the nitrogen isotopic (δ15N) signature of mixotrophic coral organisms with zooxanthellae symbionts.
Some authors have demonstrated the success of a mutualistic interaction with C. andromeda under stressful environmental conditions in shallow waters, i.e., high temperatures, high levels of irradiation, eutrophic conditions, and changes in salinity [33]. These life history traits also permitted this species to become an invader in the Mediterranean Sea, where, being one of the earliest Lessepsian migrants, C. andromeda has spread, reaching the western Mar Menor in Spain, being randomly spotted in the Levant Sea, Aegean Sea, and Strait of Sicily [6,34,35,36]. Mediterranean C. andromeda populations form short-term outbreaks up to 20 individuals m−2 in semi-enclosed human-impacted coastal systems with eutrophic waters and low hydrodynamics [5]. Stoner et al. [8] observed that Cassiopea spp. populations were significantly denser, and that individuals from these populations were larger in areas with high human population densities (a proxy of nutrient enrichment) with respect to more natural sites. Equally, The et al. [37] reported high densities of Cassiopea jellyfish within shrimp farms where environmental conditions were stable and the concentrations of nutrients and organic matter were high.
Although knowledge about the biology and ecology of C. andromeda in its native distribution areas is available, little is known about its invasive behavior in the Mediterranean Sea [38]. Given the growing interest in invasive alien species and in their management in the Mediterranean, recently, the capability of C. andromeda to tolerate stressful/changing environments (such as harbor areas) has been studied [38]. The authors of that study showed that this jellyfish species has the ability to adapt to sudden changes in light exposure from eutrophic to meso-oligotrophic waters and to withstand different light conditions, thus suggesting that this species can colonize a wide range of shallow water environments. These characteristics make it a potential successful invader in the Mediterranean Sea.
In this paper, a preliminary investigation on a Mediterranean population of C. andromeda (Palermo, Italy) was carried out through visual sampling and specimen collection. The data were then organized and processed to provide insights into the distribution and trophic behavior of this species within the study area.

2. Materials and Methods
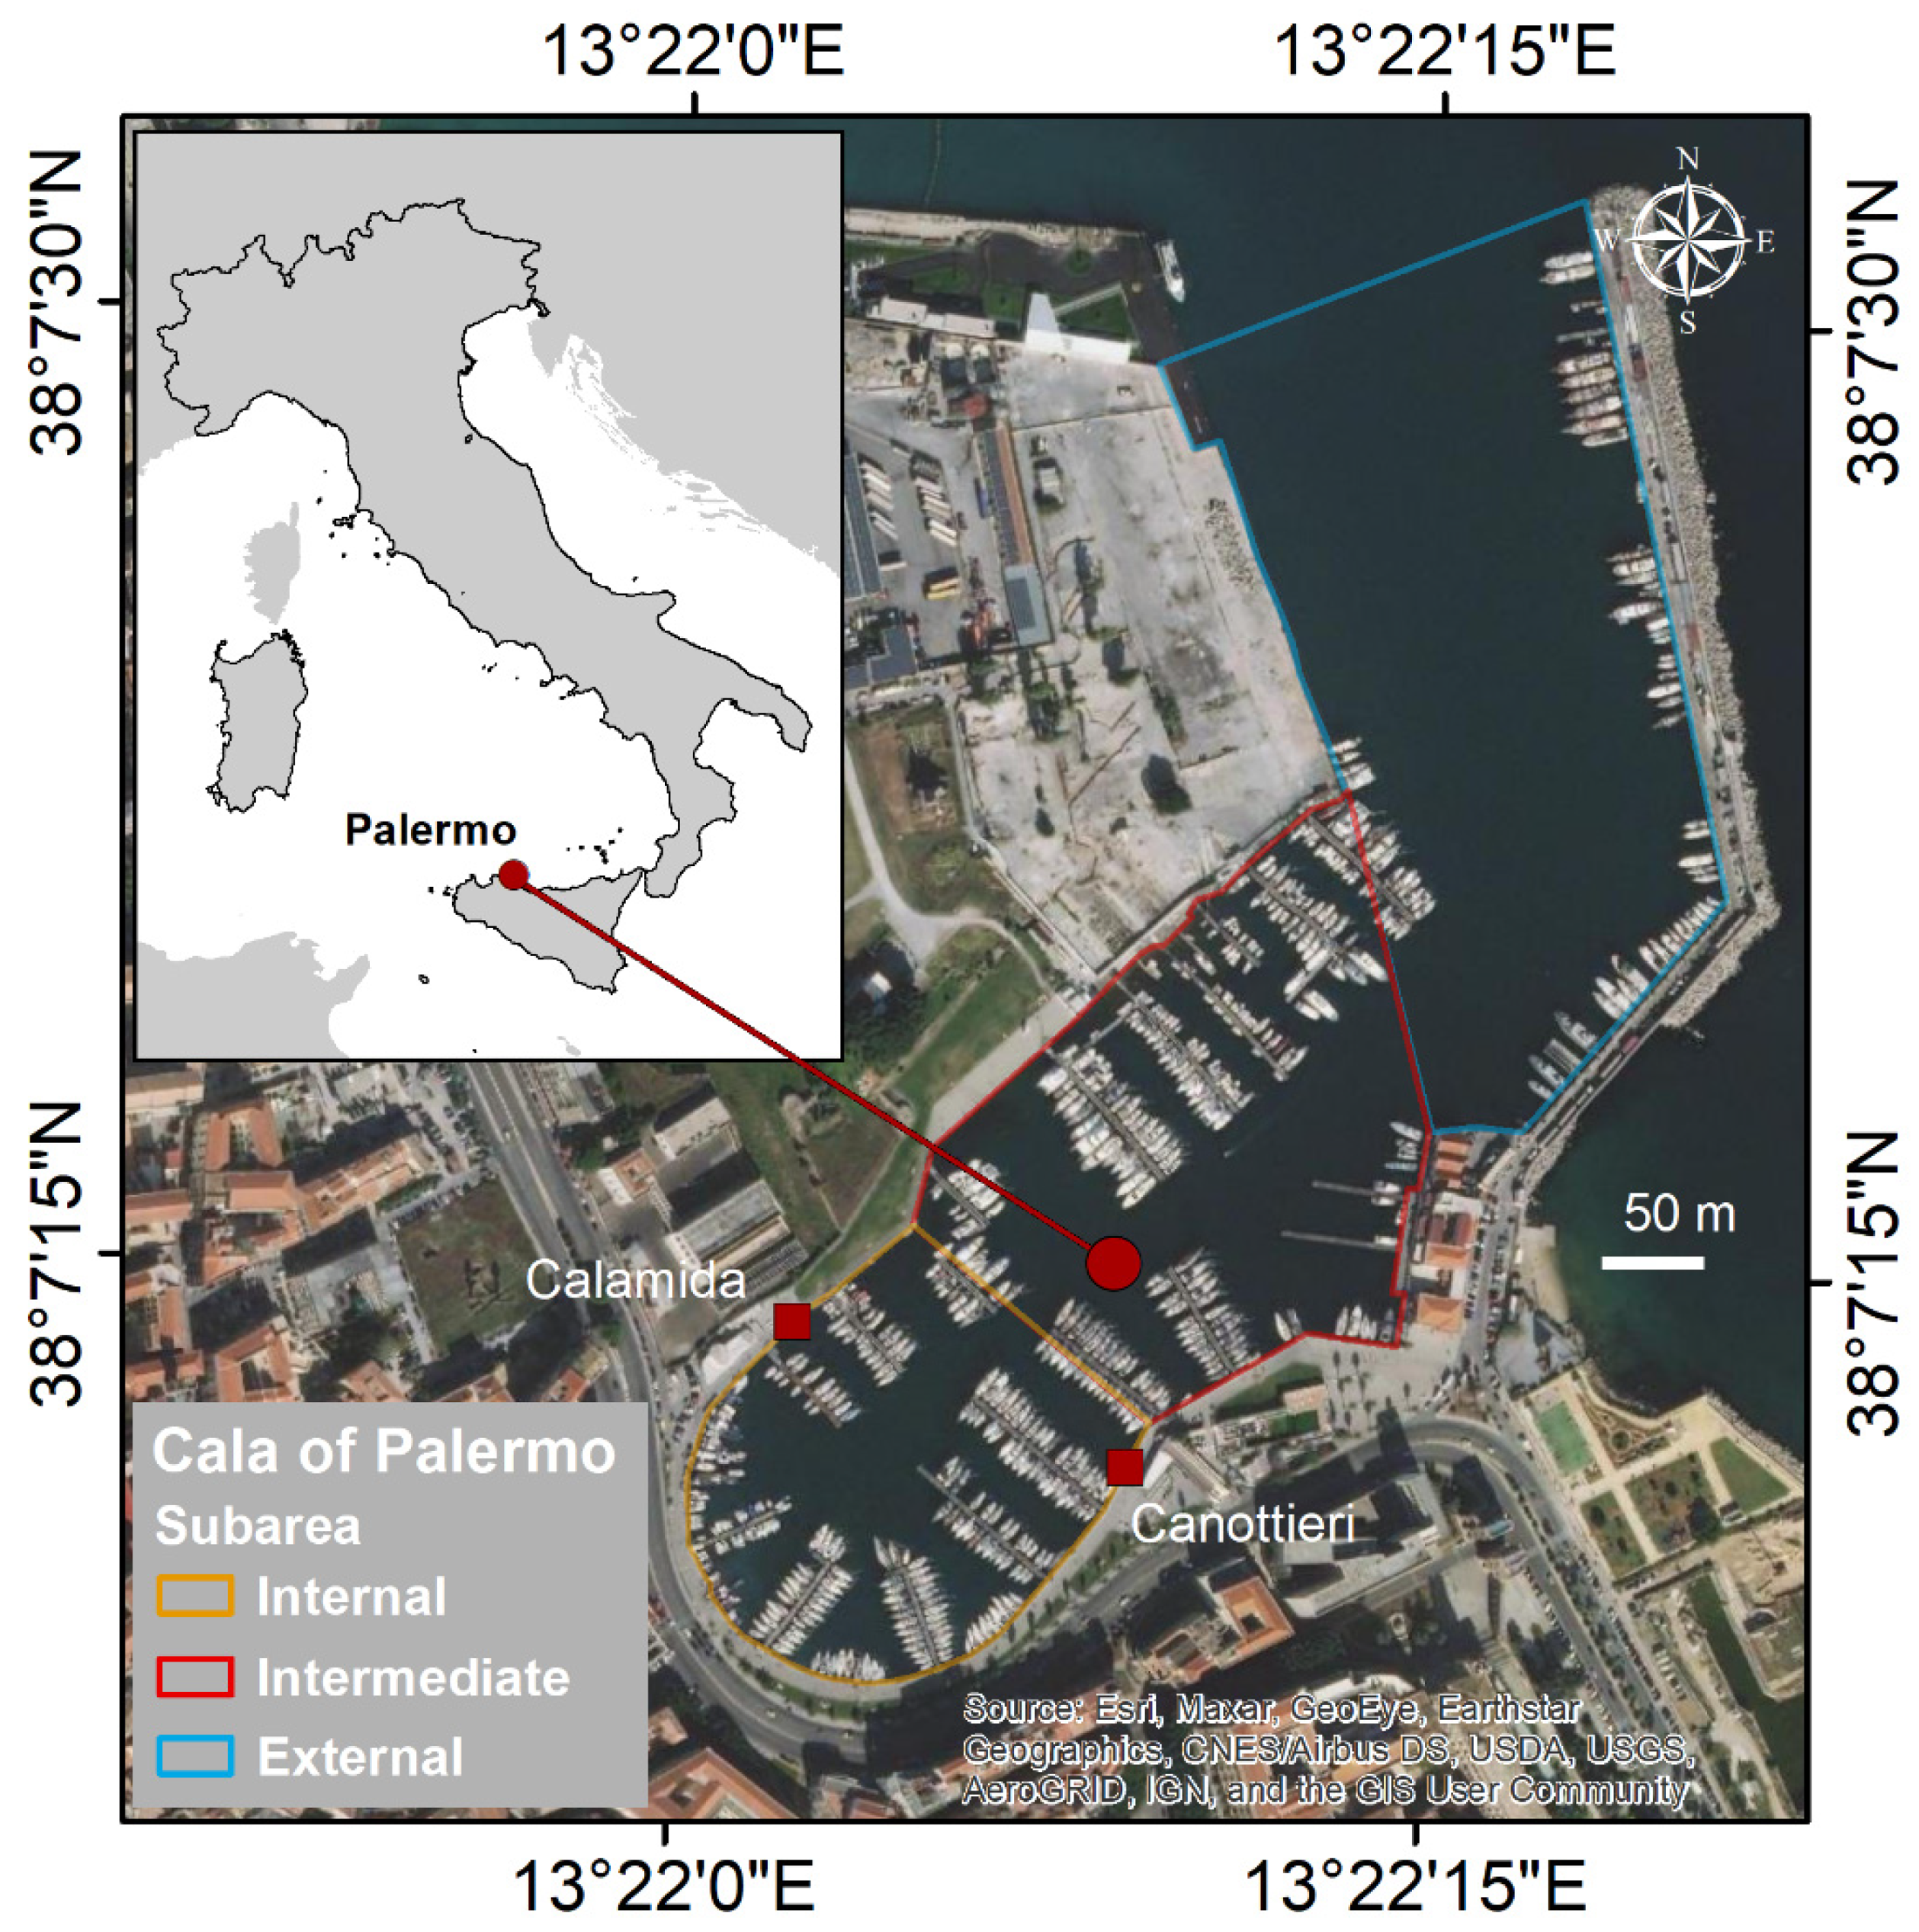
Cassiopea andromeda were studied using a visual census and by direct collection.

2.1. Study Area

Cala is a curvilinear boat basin for pleasure crafts reachable from the mouth of the port of Palermo (Figure 2); it has an area of 49,000 m2, and an average depth of 7 m [39]. The sea bottom is predominantly made up of clay and is subject to rearrangement due to shipping activities and possible inputs from the land (e.g., run-off water and old underground channels). This area is characterized by the presence of many piers located very close to each other, mainly during the tourist season, that can accommodate up to 370 boats [39]. This proximity results in a large presence of ropes, anchor cables, and boats that make the sea bottom difficult to access for classical visual observations.

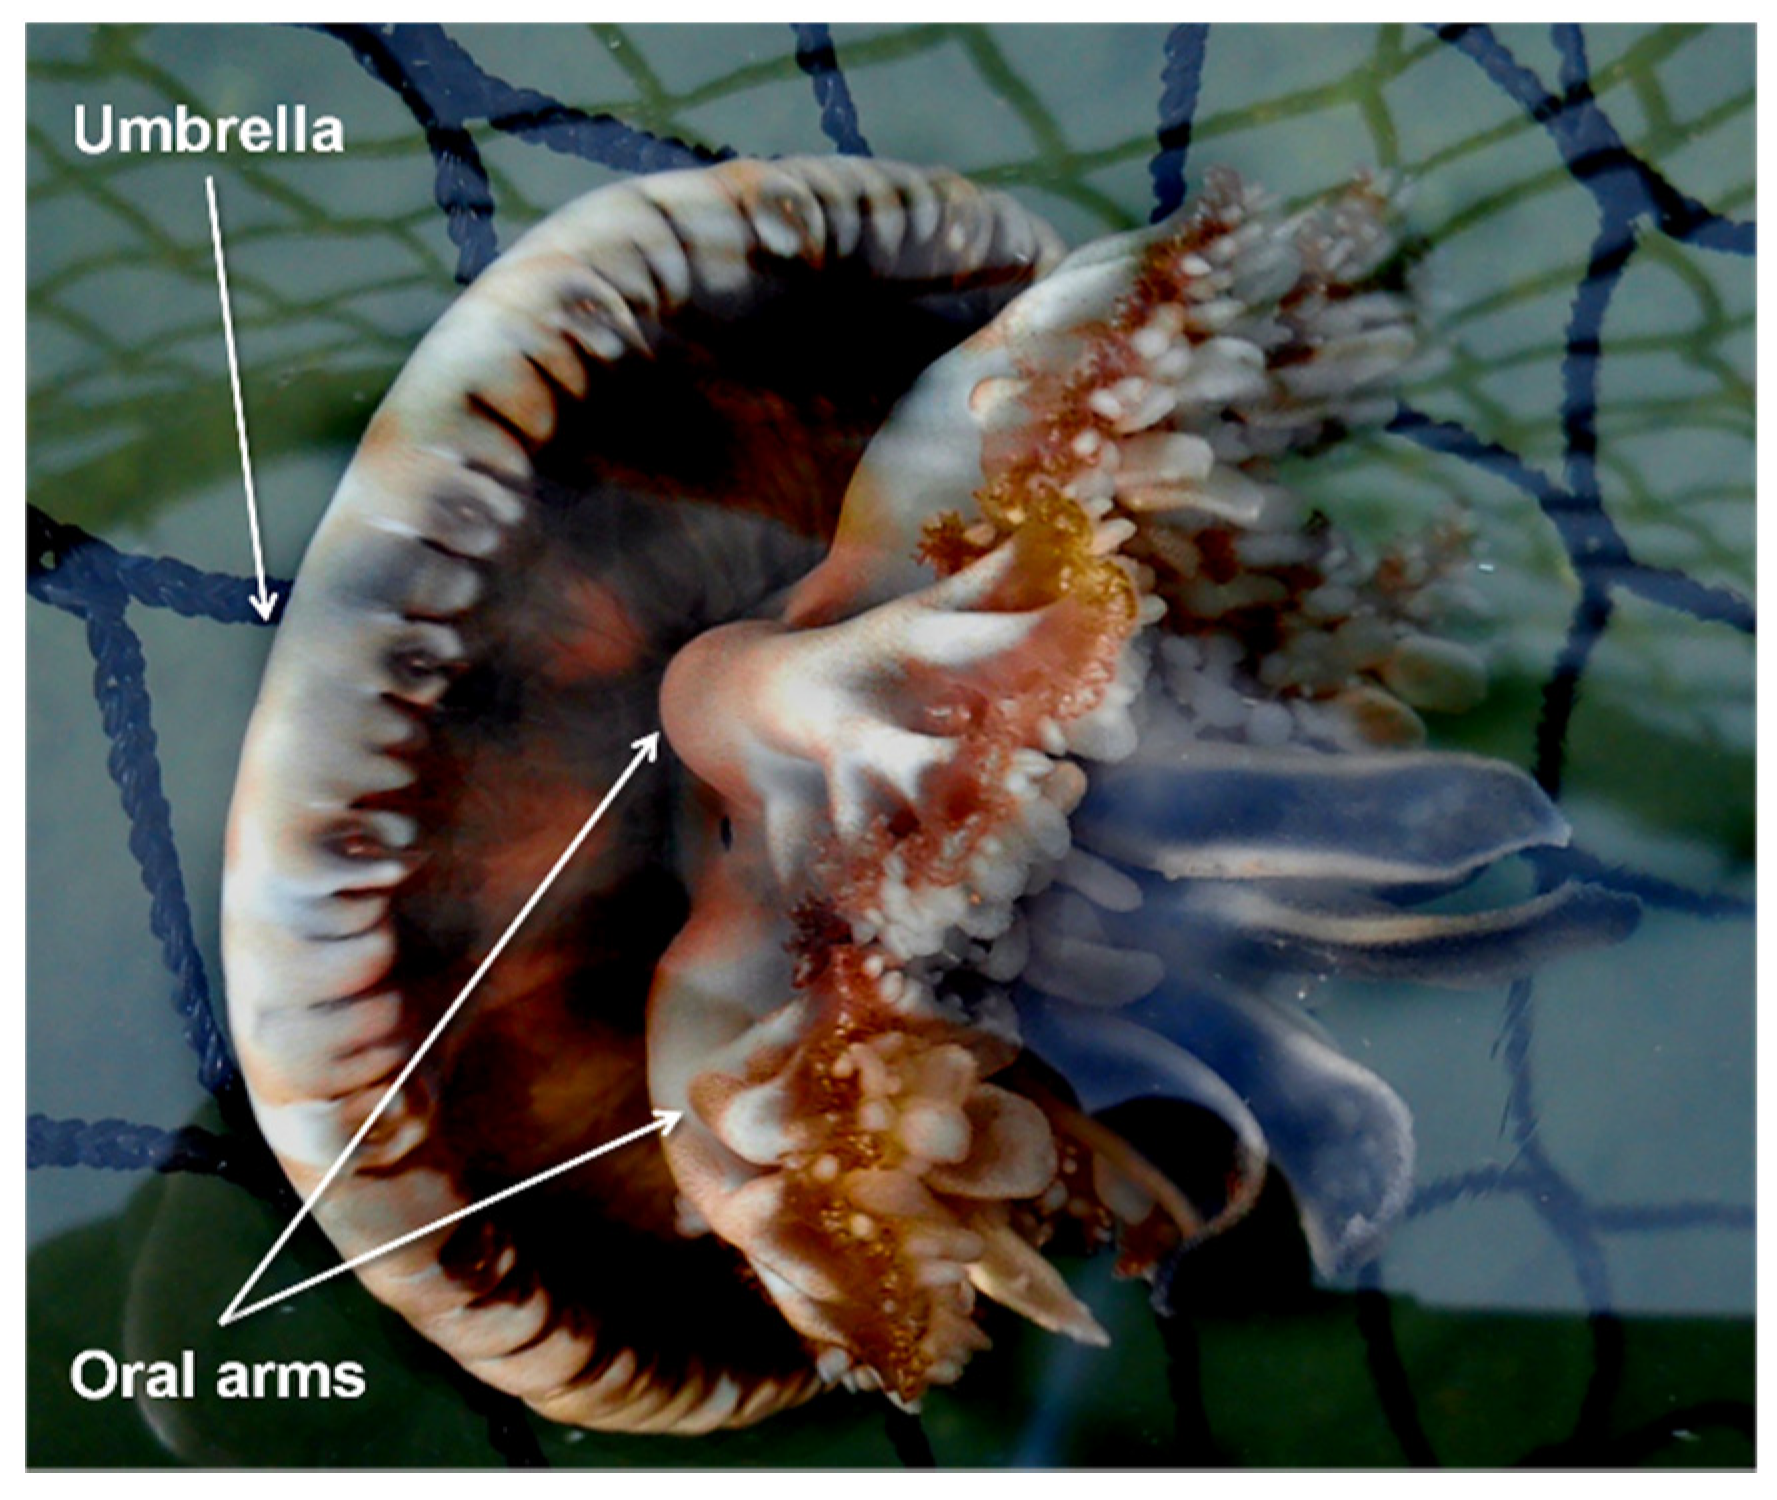
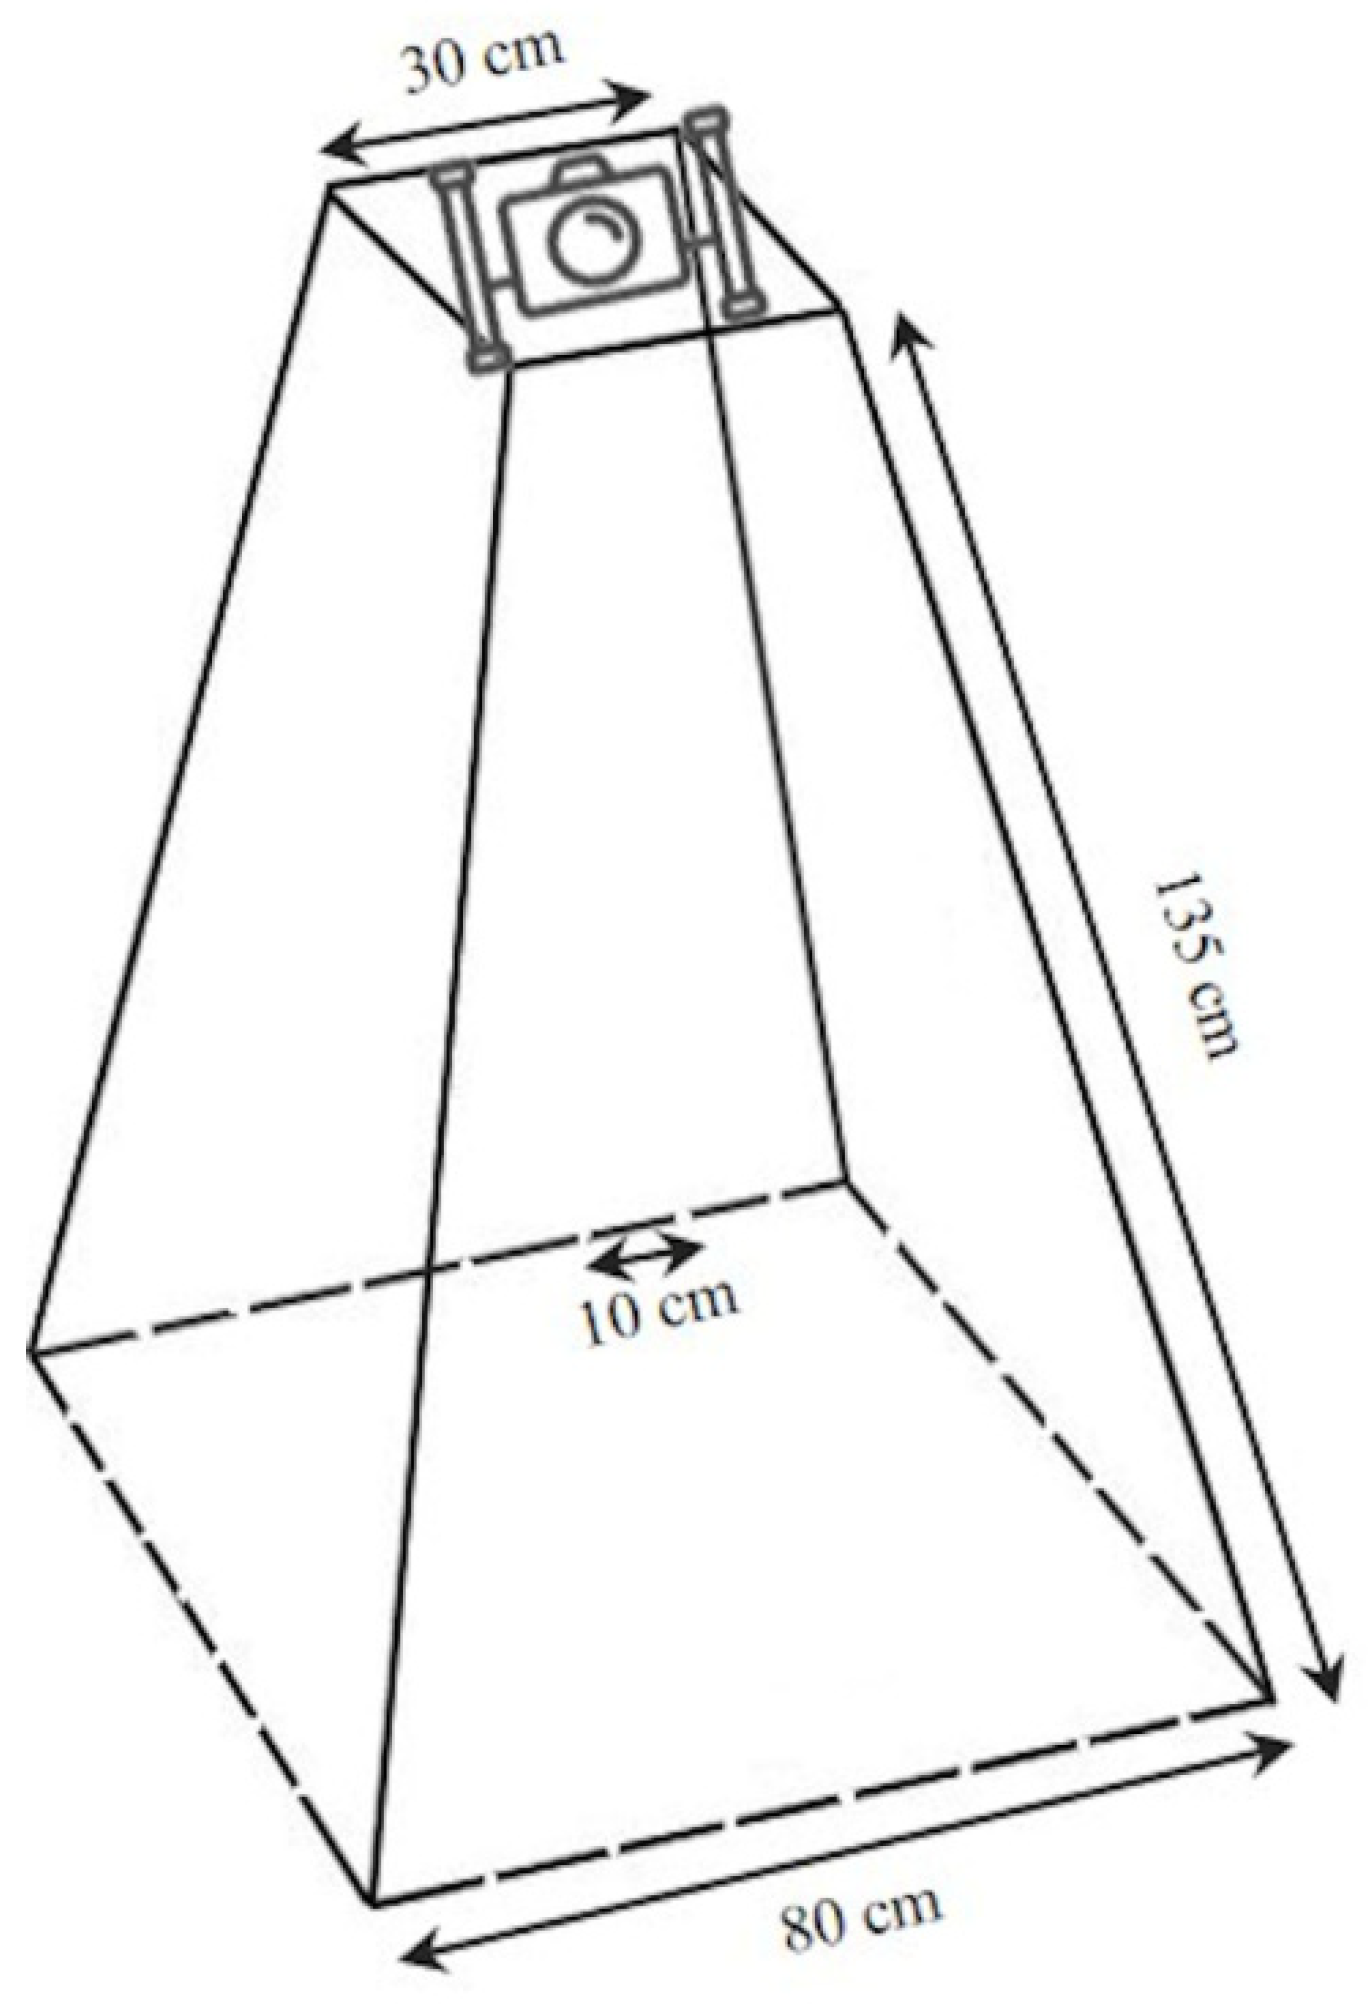
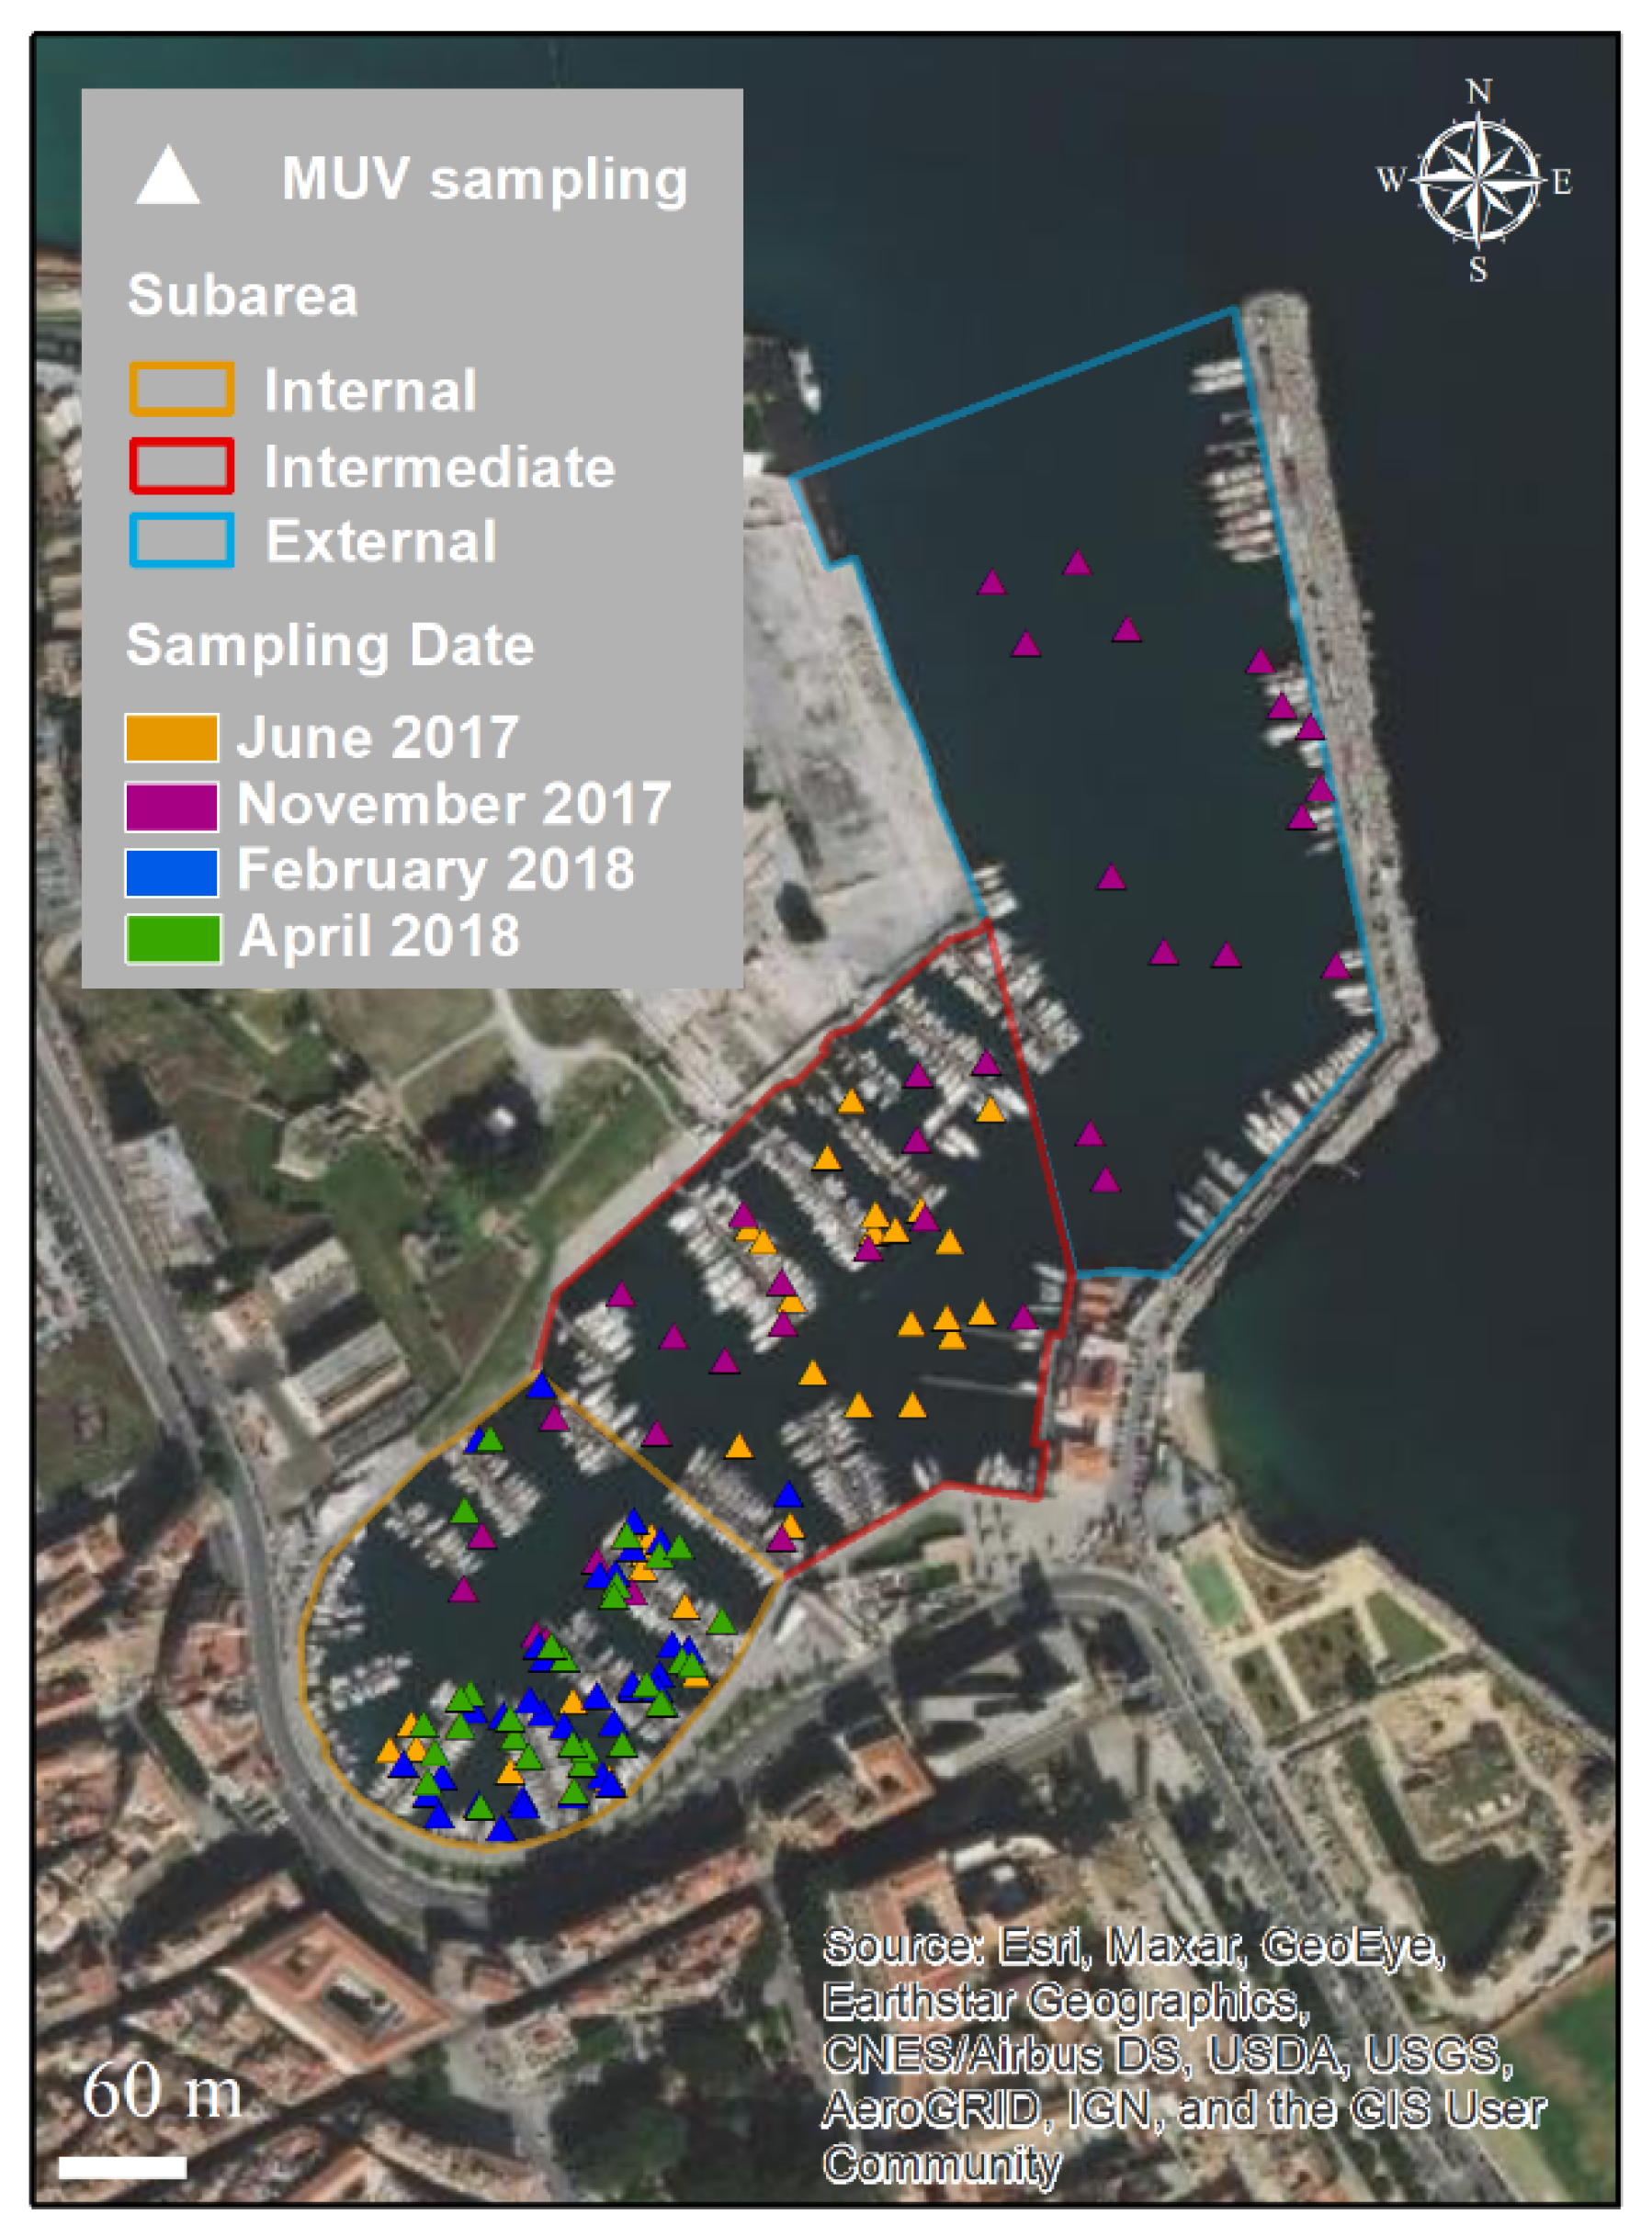
2.2. Visual Sampling Activities

The visual observations were carried out using Megabenthos Underwater Video (MUV), which was designed to overcome visual sampling difficulties in harbor areas [40].
This device consists of stainless-steel tubes with 5 mm diameters and has a truncated square pyramid shape with a base side of 80 cm (unit of sampling area = 0.64 m2), and an oblique side that is 135 cm long. An underwater video camera is located on the top. The base sides are marked at 10 cm intervals to be used as a tool for estimating the size of individuals (Figure 3). Its base is lead ballasted to maintain an upright position during hauling of the device to the seafloor; a metered rope is used to record depth.
MUV was used in Cala to collect data on the density and size of C. andromeda individuals. No a priori sampling design was planned; the MUV hauls were carried out at random sites within Cala on four dates (June 2017, November 2017, February 2018, and April 2018). The observations in each sampling data were considered independent from each other. The device was hauled from a small boat to the sea bottom, recording the haul using the cam. In addition to depth (m), at each sampling site, temperature (°C) and salinity along the water column were recorded using a portable meter (VWR EC300), and water transparency (m) was recorded with a Secchi disc. The latter parameter was reported as a percentage ratio between water transparency (m) and depth (m).

2.3. Specimen Collection and Sample Preparation

Ten live C. andromeda specimens were collected in the quay facing two sites of Cala (five individuals in front of “Calamida” and five in front of “Canottieri”—Figure 2) using a hand net for the subsequent stable isotope analysis (SI). The specimens were placed in a 50 L tank, and immediately after sampling (~2 h), the jellyfish were brought to the laboratory to proceed with the morphometric and morphological analysis. The gonadal tissue was dissected from the somatic tissue for each specimen, and each was separately frozen in liquid nitrogen for subsequent trophic biomarker analyses and stored at −80 °C.
To obtain the particulate organic matter for SI analysis, 3 L of seawater (sampled from each site at a depth of 1 m) was pre-filtered (200 μm) and then filtered under vacuum through one pre-ashed (4 h at 500 °C) Whatman GF/F glass fiber filter (47 mm).
The sediment was collected using sediment traps to analyze its role in the trophic web. Each trap consisted of two plastic bottles with a funnel (15 cm diameter), left at the bottom of the two sampling sites for 7 days. After 7 days, the traps were closed, removed from the bottom, and brought to the laboratory. The water and sediment contained in the trap were filtered under vacuum through pre-ashed (4 h at 500 °C) Whatman GF/F glass fiber filters.
At the same time as sampling of the jellyfish, POM, and sediments, other benthic organisms were sampled to obtain a clearer reference of the trophic positioning of jellyfish within Cala. These organisms were sorted, stored separately in falcon or labeled plastic bags, and stored at −80 °C. After storage, all samples were freeze-dried and ground to a fine powder.

2.4. Data Analysis

2.4.1. Visual Data Analysis

The data from the MUV observations were used to preliminarily investigate the C. andromeda size composition and distribution in the study area.
The videos from each sampling were analyzed visually on a PC workstation. For each video, the number of individuals of C. andromeda per unit of sampling area (m2) was recorded, counting the number of individuals for which their umbrella center was inside the unit area. The umbrella’s diameter was also measured. Three size classes (5–10 cm, 10–15 cm, and 15–20 cm) and four depth ranges (0–3 m, 3–6 m, 6–9 m, and 9–12 m) were defined. The average (±standard error) number of individuals belonging to each size class per unit area (average density, ind m−2) was calculated per sampling date and depth range. The variations in density among size classes were compared using PERMANOVA [41] with two fixed factors: sampling date and depth range. The analyses were based on a Euclidean distance matrix generated using square-root-transformed data and 999 permutations. A p value < 0.05 was considered statistically significant. The statistical analyses were run using the Primer 6 PERMANOVA+ software package (Plymouth Marine Laboratory). Finally, Cala was divided into three sub-areas (internal, intermediate, and external), and for each one of these, the average densities of individuals per size class and per depth range were calculated and displayed on maps using ArcGIS 10.3 software. PERMANOVA was also performed to detect differences in the densities of each size class: at each depth range among sampling dates; among sub-areas; and at each depth range among sub-areas.

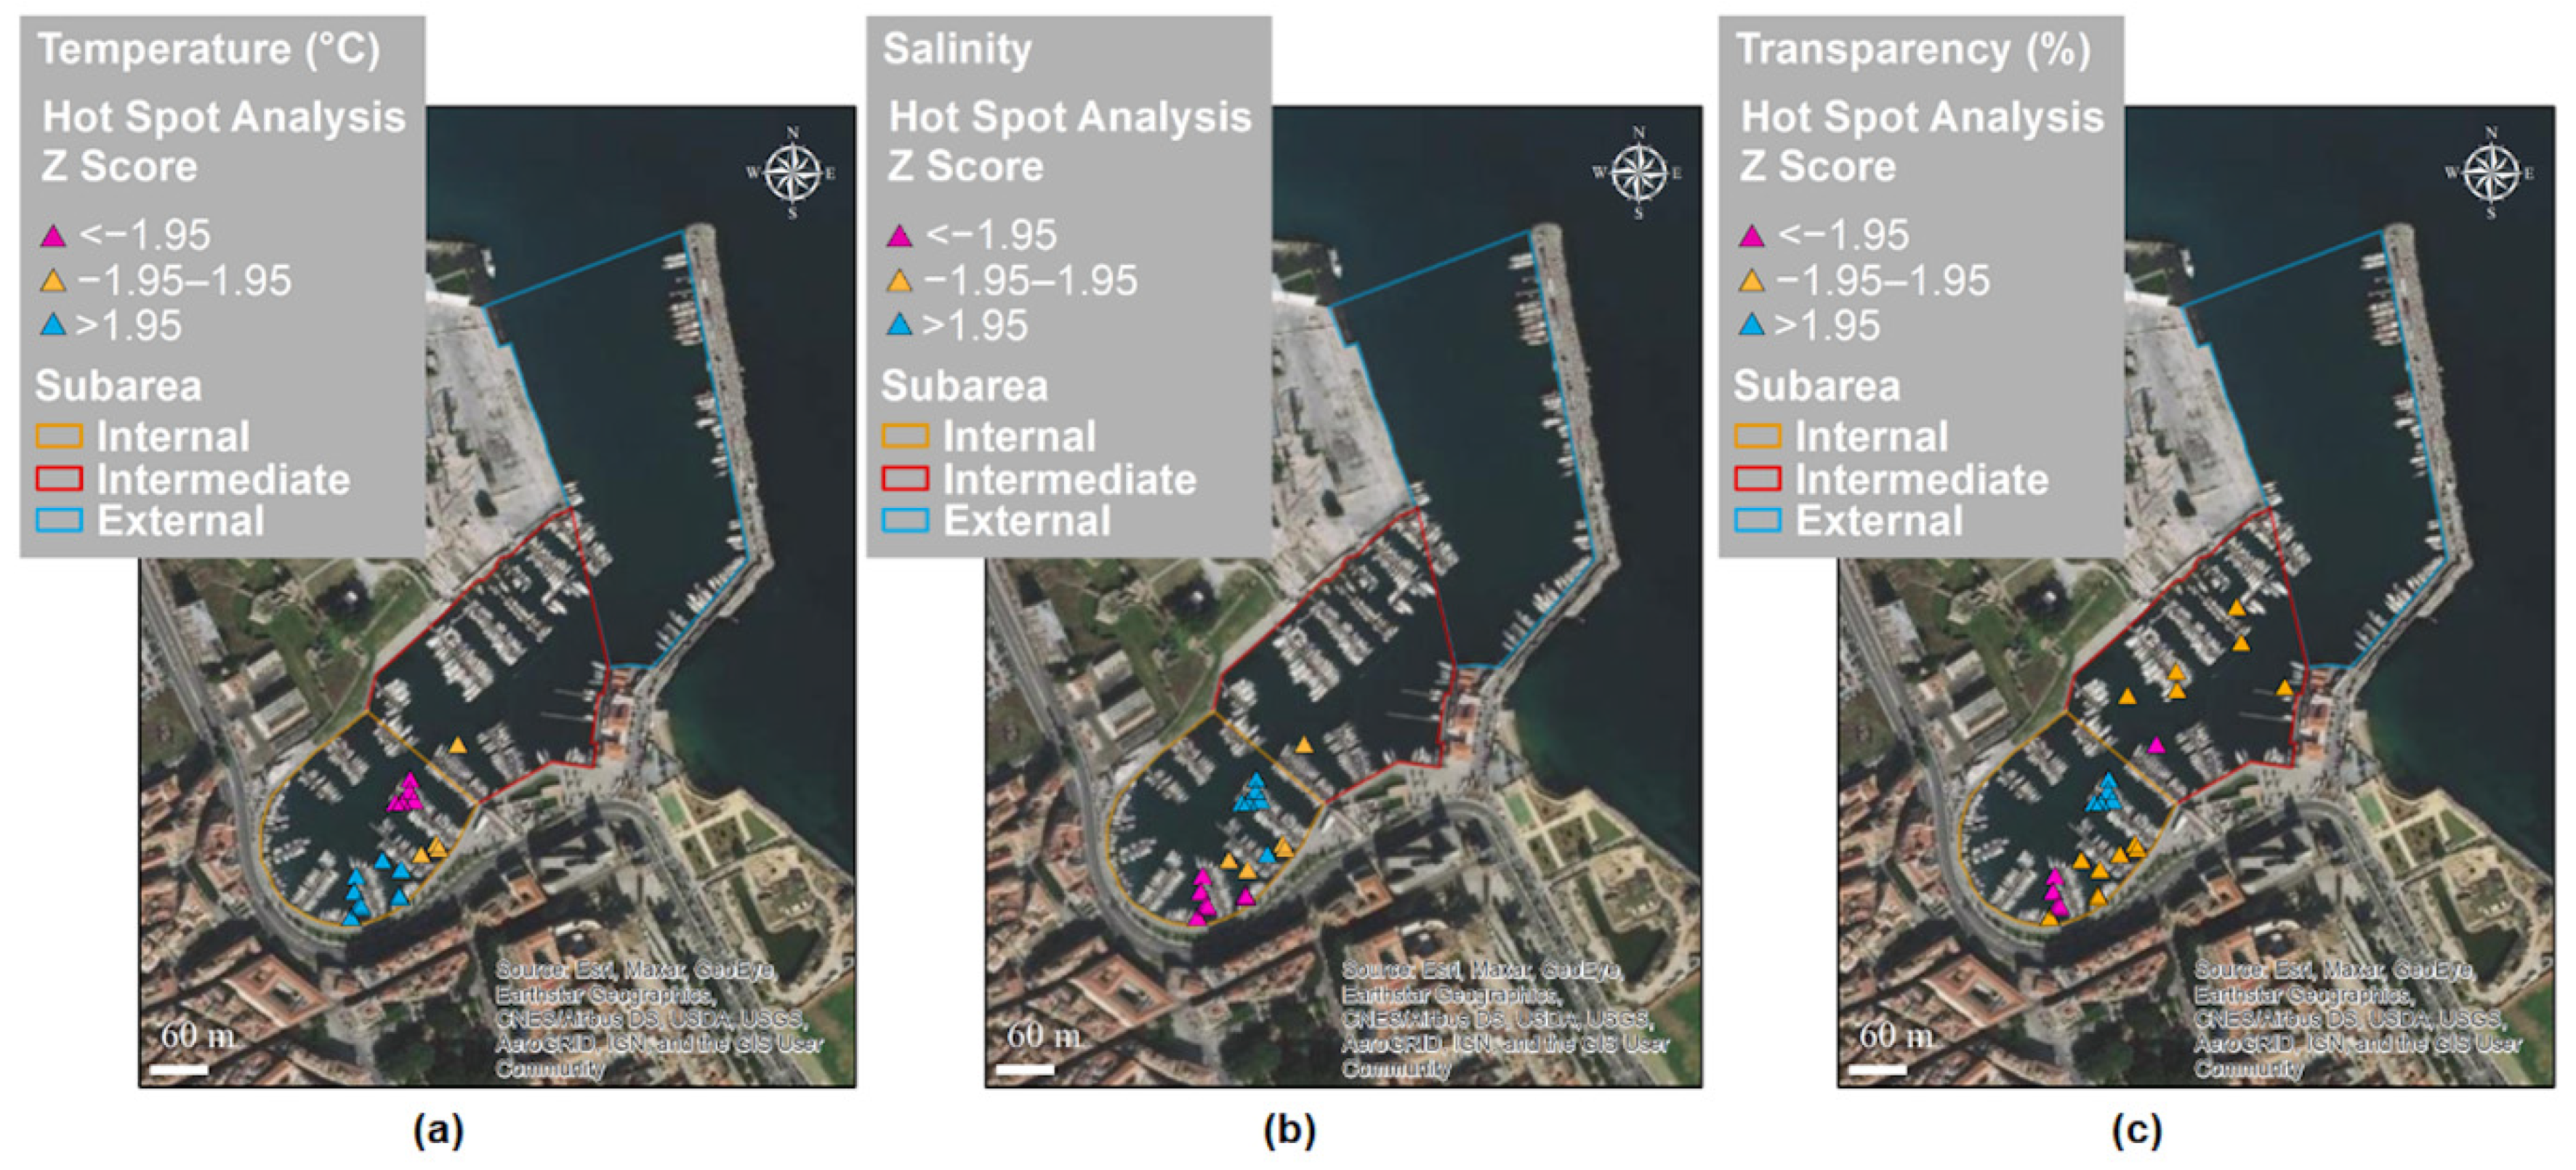
2.4.2. Spatial and Temporal Distribution Analysis

The data from the MUV observations were analyzed using ArcGIS 10.3 ESRI and its Spatial Statistics tools (Measuring Geographic Distributions, Analysing Patterns, and Mapping Clusters toolsets). GIS-based spatial statistics analysis is useful in the study of species distribution [42] and alien species distribution and spread [43,44]. These analyses were carried out to model the spatial and temporal distributions, aggregation patterns, and spatial structure of C. andromeda in the study area; these analyses allowed obtaining information related to the areas of concentration for this species on different sampling dates: the shape of the distributions (dispersed/compact or elongated); the distribution patterns (clustered, dispersed, or random); and their dependency on some environmental parameters such as temperature, salinity, and transparency.
To describe and summarize the key distribution characteristics and to track their changes over time and space, the indicators of central tendency (as a median center), species spatial dispersion, directional dispersion, and directional trend were calculated. These indicator values track the changes in distribution over time and space and allow for a comparison of the distributions of occurrences between sampling dates and size classes [45,46]. The spatial dispersion shows whether the distribution is concentrated or dispersed around the geometric mean center: the higher the standard distance (i.e., the radius of the generated circumference), the more dispersed the distribution [47]. The directional dispersion and directional trends allow us to visualize the shape of the distribution in the X and Y directions (Standard Deviational Ellipse) and the orientation of the distribution (the long-axis rotation of an ellipse measured clockwise from noon) [47]. The spatial dispersion and directional dispersion were calculated with a one-standard-deviation polygon that covers approximately 68% of the features. After data collection, a comparison of the distribution of C. andromeda specimens between the internal and intermediate sub-areas in June and November, when both sub-areas were investigated, was conducted. The distribution of the size classes (with the exception of the size class 15–20 cm, which had a number of observations that were insufficient for the analyses) was also analyzed in February, when the observations were carried out only in the internal sub-area. All data from April were excluded as the number of specimens recorded was not sufficient for the analyses.
In this study, the overall aggregation patterns and spatial structures of the distribution of C. andromeda in the area in relation to the environmental parameters temperature (T), salinity (S), and water transparency (Tr) were also evaluated. To assess if the species distribution pattern was clustered, dispersed, or random, spatial autocorrelation through Global Moran’s I (GMI) was carried out (cut-off distance of 60 m). The GMI method was performed simultaneously for the recorded position and for an associated attribute (ESRI ArcGIS, 2011). GMI ranges from −1 to +1, and when the z-score is statistically significant (p < 0.01), a positive or negative GMI indicates a spatially clustered or dispersed dataset, respectively [47]. Getis–Ord Gi* hot spot analyses (GOG) were carried out (cut-off distance of 60 m) to evaluate if the spatial structure featured statistically significant spatial clusters. Statistically significant z-scores (p < 0.05) indicate spatial clustering of high or low feature values (hot spots or cold spots, respectively). The higher (or lower) the z-score, the more (or less) intense the clustering. A z-score near zero indicates no apparent spatial clustering [47].

2.4.3. Stable Isotope

Stable isotope analysis (SIA) is useful in explaining the role and effects of alien species in the food web [48]. In this research, stable carbon (δ13C) and nitrogen (δ15N) isotopes, and C/N ratios in the oral arms, umbrella, and gonads of C. andromeda individuals, were assessed to better clarify the different nutrition behavior and growth processes of this species in the study area.
Small amounts (0.2 mg) of freeze-dried jellyfish tissue were prepared for the δ13C and δ15N analyses. The stable carbon and nitrogen isotopic signatures were determined using an isotope ratio mass spectrometer, DeltaV Advantage (Thermo Fisher Scientific, Bremen, Germany), coupled with a CHN Analyzer Flash 2000 (Thermo Fisher Scientific, Bremen, Germany). The analytical precision of the measurements for both δ13C and δ15N was 0.2%. Sucrose IAEA CH6 (International Atomic Energy Agency, Austria) and L-glutamic acid (RM 8574, National Institute of Standards and Technology, NIST, MA, USA) were used as certified reference materials.
The ratio of stable isotopes was expressed as delta (δ):
δ = [(Rsample/Rstandard) − 1)] × 103,
where δ is the isotopic ratio of the sample relative to the standards (international standard: Vienna Pee Dee Belemnite for C, and atmospheric nitrogen for N); Rsample and Rstandard are the fractions of heavy to light isotopes in the sample and standard, respectively. This number is then multiplied by 1000 so that δ is expressed in units of parts per thousand (‰).

3. Results

A total of 146 points were sampled using Megabenthos Underwater Video (MUV) within Cala, divided as follows: 94 in the internal sub-area, 37 in the intermediate sub-area, and 15 in the external sub-area (Figure 4). The sampling depth ranged from 1.5 to 12 m. The water transparency ranged from 34 to 100%; values greater than 70% were recorded for 109 sampling points. Temperature and salinity ranged from 13.9 to 24.1 °C, and from 34.4 to 35.7, respectively.

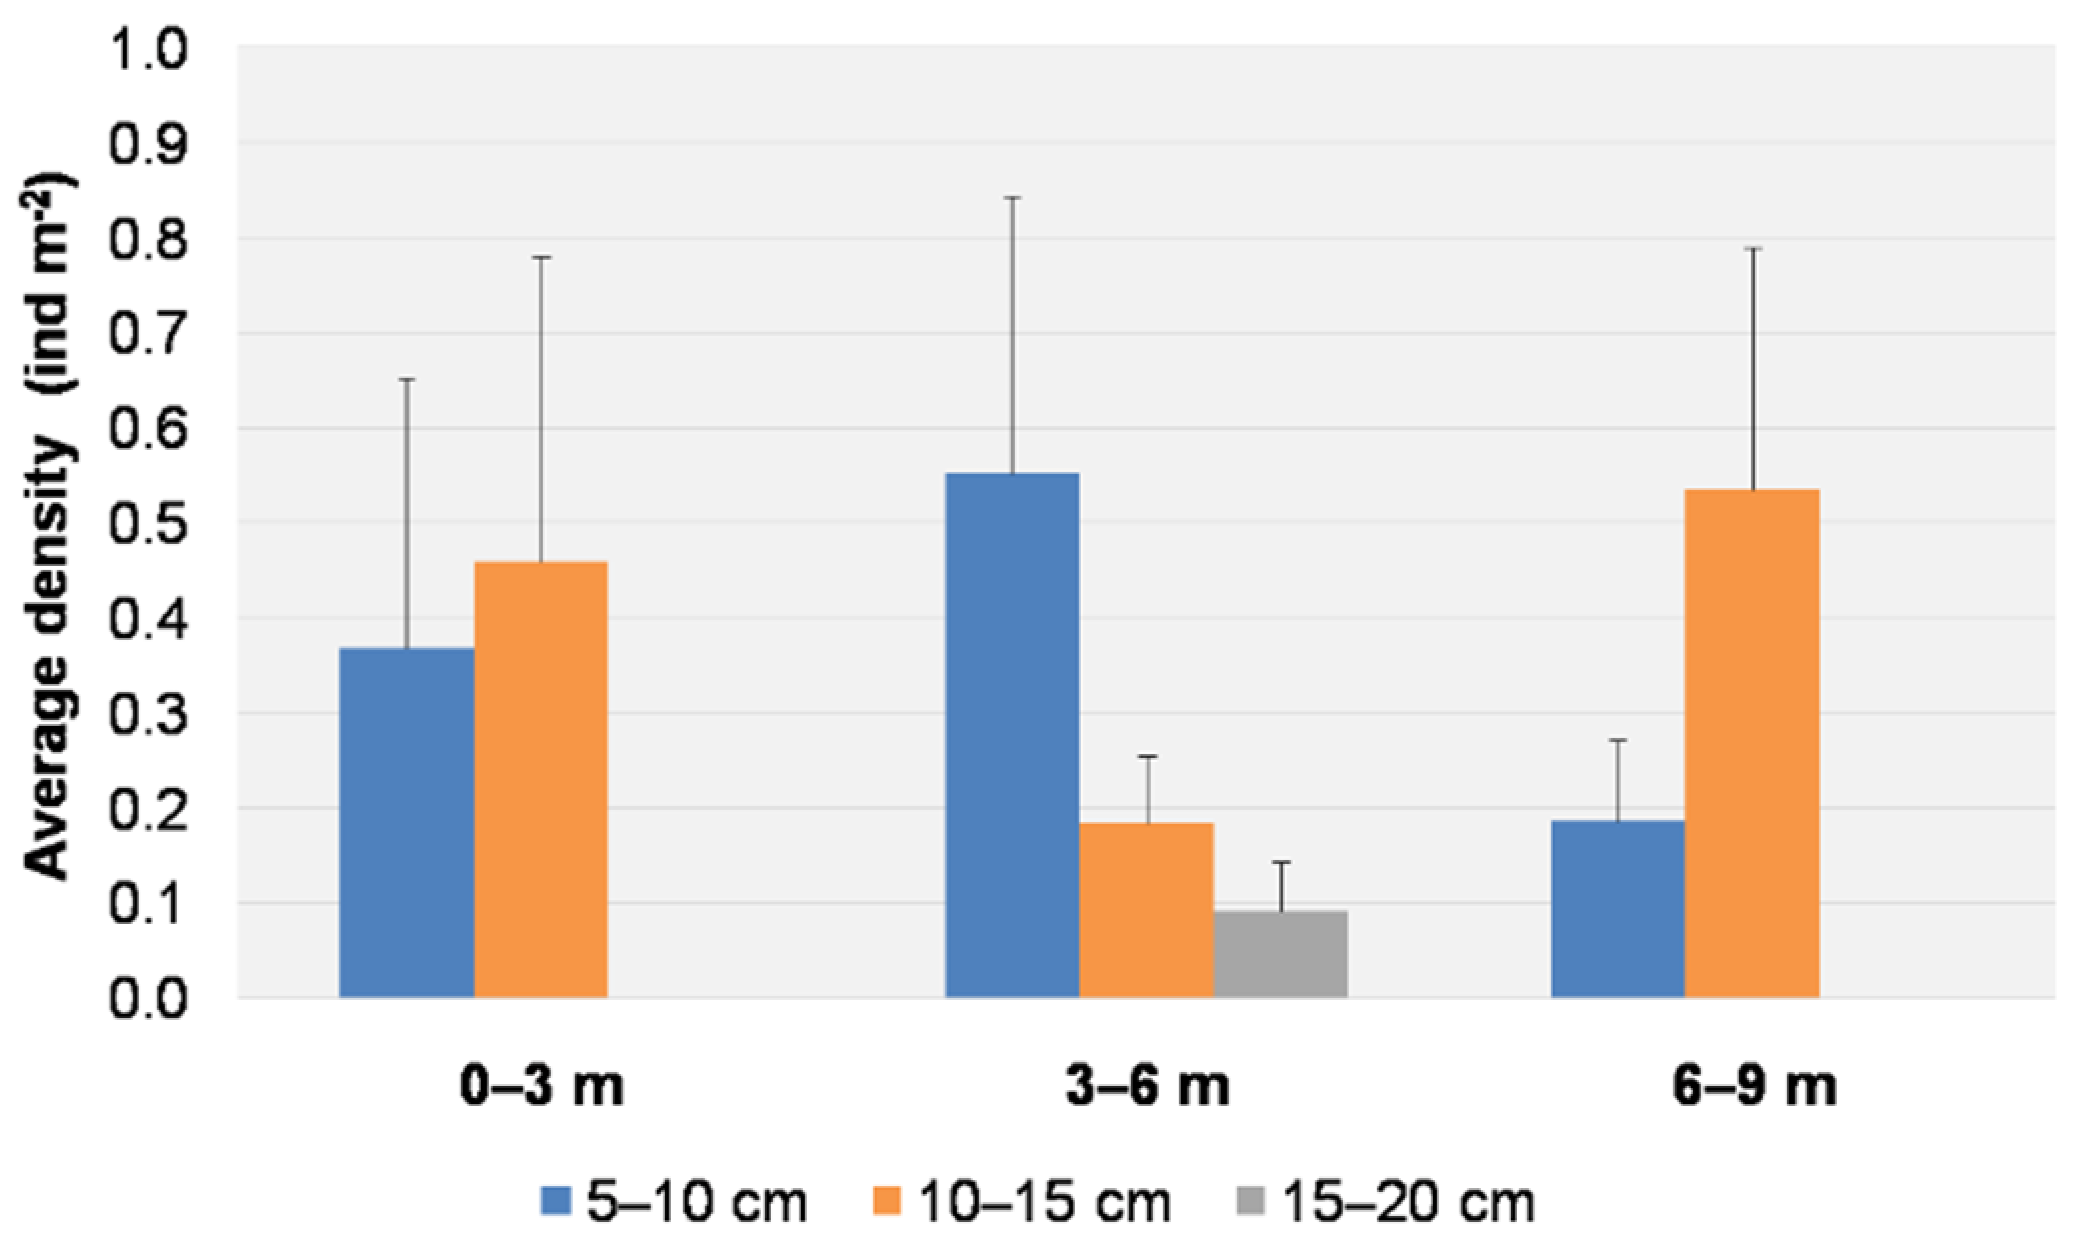
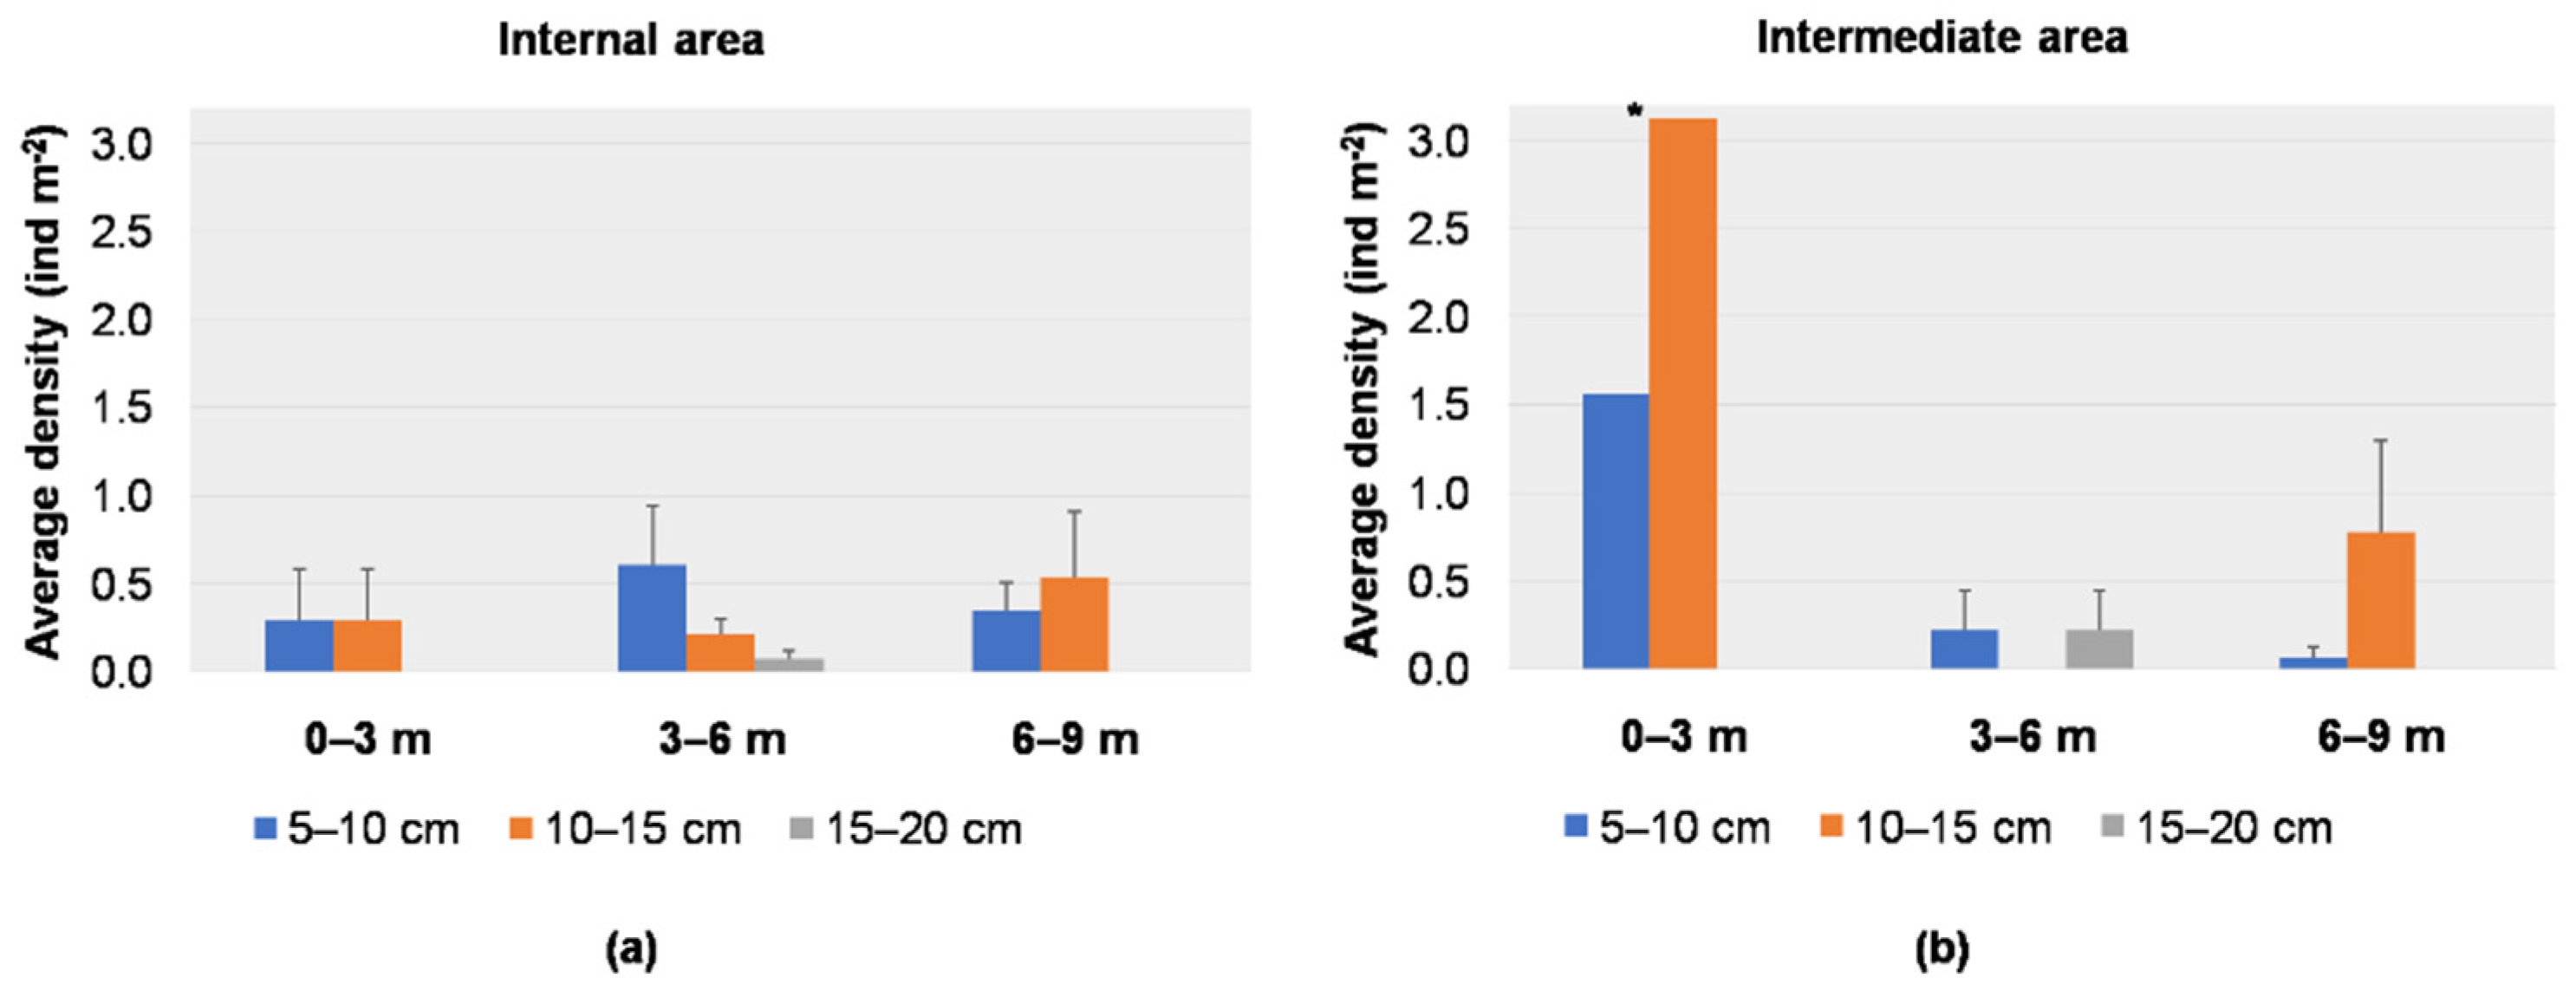
3.1. Visual Data Analysis

Out of the 146 hauls, 39 were carried out in June, 38 were carried out in November, 39 were carried out in February, and 30 were carried out in April. A total of 67 individuals of C. andromeda were recorded, of which 30 belonged to the size class 5–10 cm, 34 to the size class 10–15 cm, and 3 to the size class 15–20 cm.
The average densities for each size class per sampling date are reported in Figure 5. Individuals of the size class 5–10 cm were found on all dates, with a peak in density (0.76 ± 0.39 ind m−2) in February 2018, and were the only size class present in April 2018, with an average density of 0.10 ± 0.07 ind m−2. Individuals of the size class 10–15 cm were recorded in June 2017, November 2017, and February 2018, with higher average densities in June (0.60 ± 0.32 ind m−2) and November (0.57 ± 0.33 ind m−2). Larger individuals (15–20 cm) were observed only in June and November 2017, but at low densities (0.08 ± 0.05 ind m−2 and 0.04 ± 0.04 ind m−2, respectively).
All individuals were found at depths of 1.5–7.5 m. All results are therefore reported for three ranges of depth (0–3, 3–6, 6–9 m). Individuals of the size 5–10 cm were found in all ranges, with a higher average density (0.55 ± 0.29 ind m−2) at depths of 3–6 m. Individuals of the size class 10–15 cm were found at all depths, with a higher average density (0.54 ± 0.25 ind m−2) at depths ranging from 6 to 9 m (Figure 6). Individuals of the size class 15–20 cm were found only between depths of 3 and 6 m, with a low average density (0.09 ± 0.05 ind m−2). The date and depth did not show any statistical influence on the size distribution (PERMANOVA, p > 0.05) (Table 1).
Out of the 67 individuals recorded, 52 and 15 were found in the internal and intermediate sub-areas, respectively. No individual was recorded in the external sub-area. The total average density was not significantly different between the internal (0.82 ± 0.25 ind m−2) and the intermediate (0.76 ± 0.35 ind m−2) sub-areas. The average depths (±standard deviation) of the sampling points were 5.4 ± 1.8 m in the internal sub-area, 7.3 ± 2 m in the intermediate sub-area, and 8.4 ± 1.7 m in the external sub-area. The sub-areas did not show any statistical influence on the size distribution (PERMANOVA, p > 0.05) (Table 1).
The average density for each size class per depth range for each sub-area is reported in Figure 7a,b. In the internal sub-area, the average density of small individuals (5–10 cm) was higher in the range 3–6 m (0.60 ± 0.34 ind m−2), while individuals of 10–15 cm were recorded more abundantly between 6 and 9 m depths (0.54 ± 0.37 ind m−2); larger individuals (15–20 cm) were recorded only in the range 3–6 m, with a low value (0.07 ± 0.05 ind m−2) (Figure 7a). In the intermediate sub-area, the higher average densities of individuals of 5–10 cm and 10−15 cm were recorded in the range 0–3 m (1.56 ind m−2 and 3.13 ind m−2, respectively); individuals of 15−20 cm were recorded only between 3 and 6 m depths (0.22 ± 0.22 ind m−2) (Figure 7b). Sub-areas and depth did not show any statistical influence on the size distribution (PERMANOVA, p > 0.05) (Table 1).
In Table 1, the results of the PERMANOVA on the average density of each size class per sampling date and depth range, per sub-area, and per depth range and sub-area are reported.

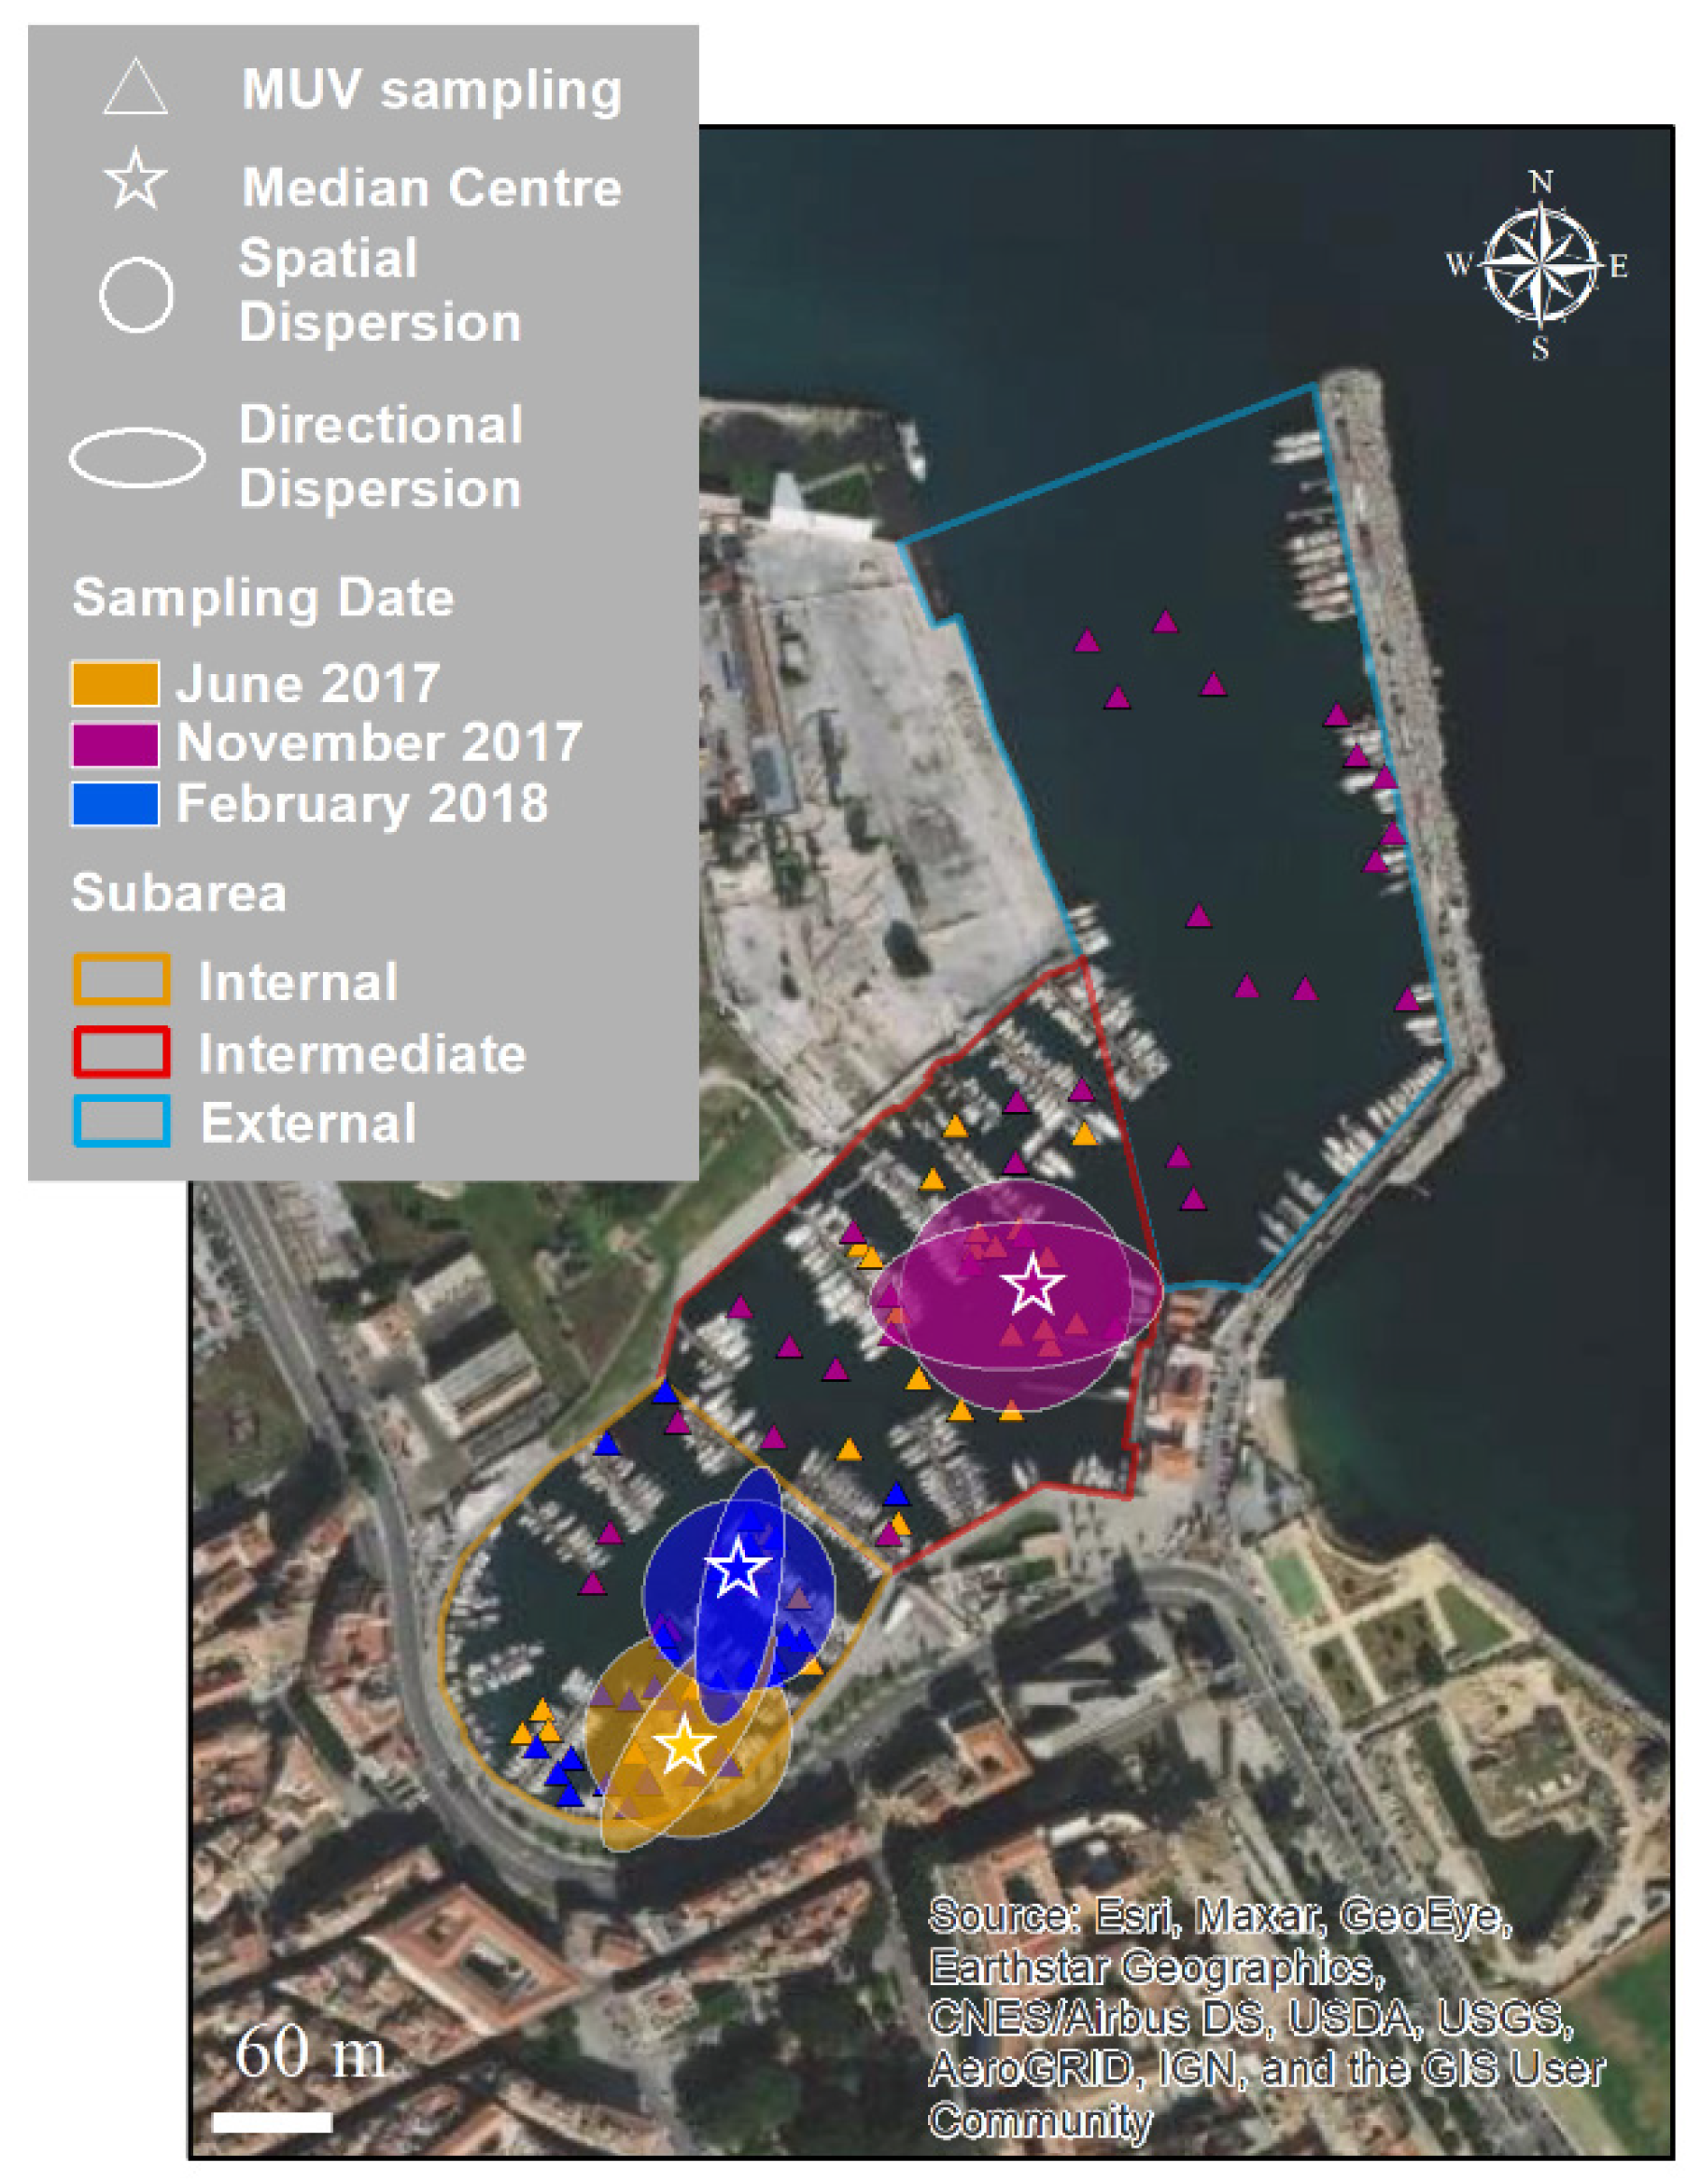
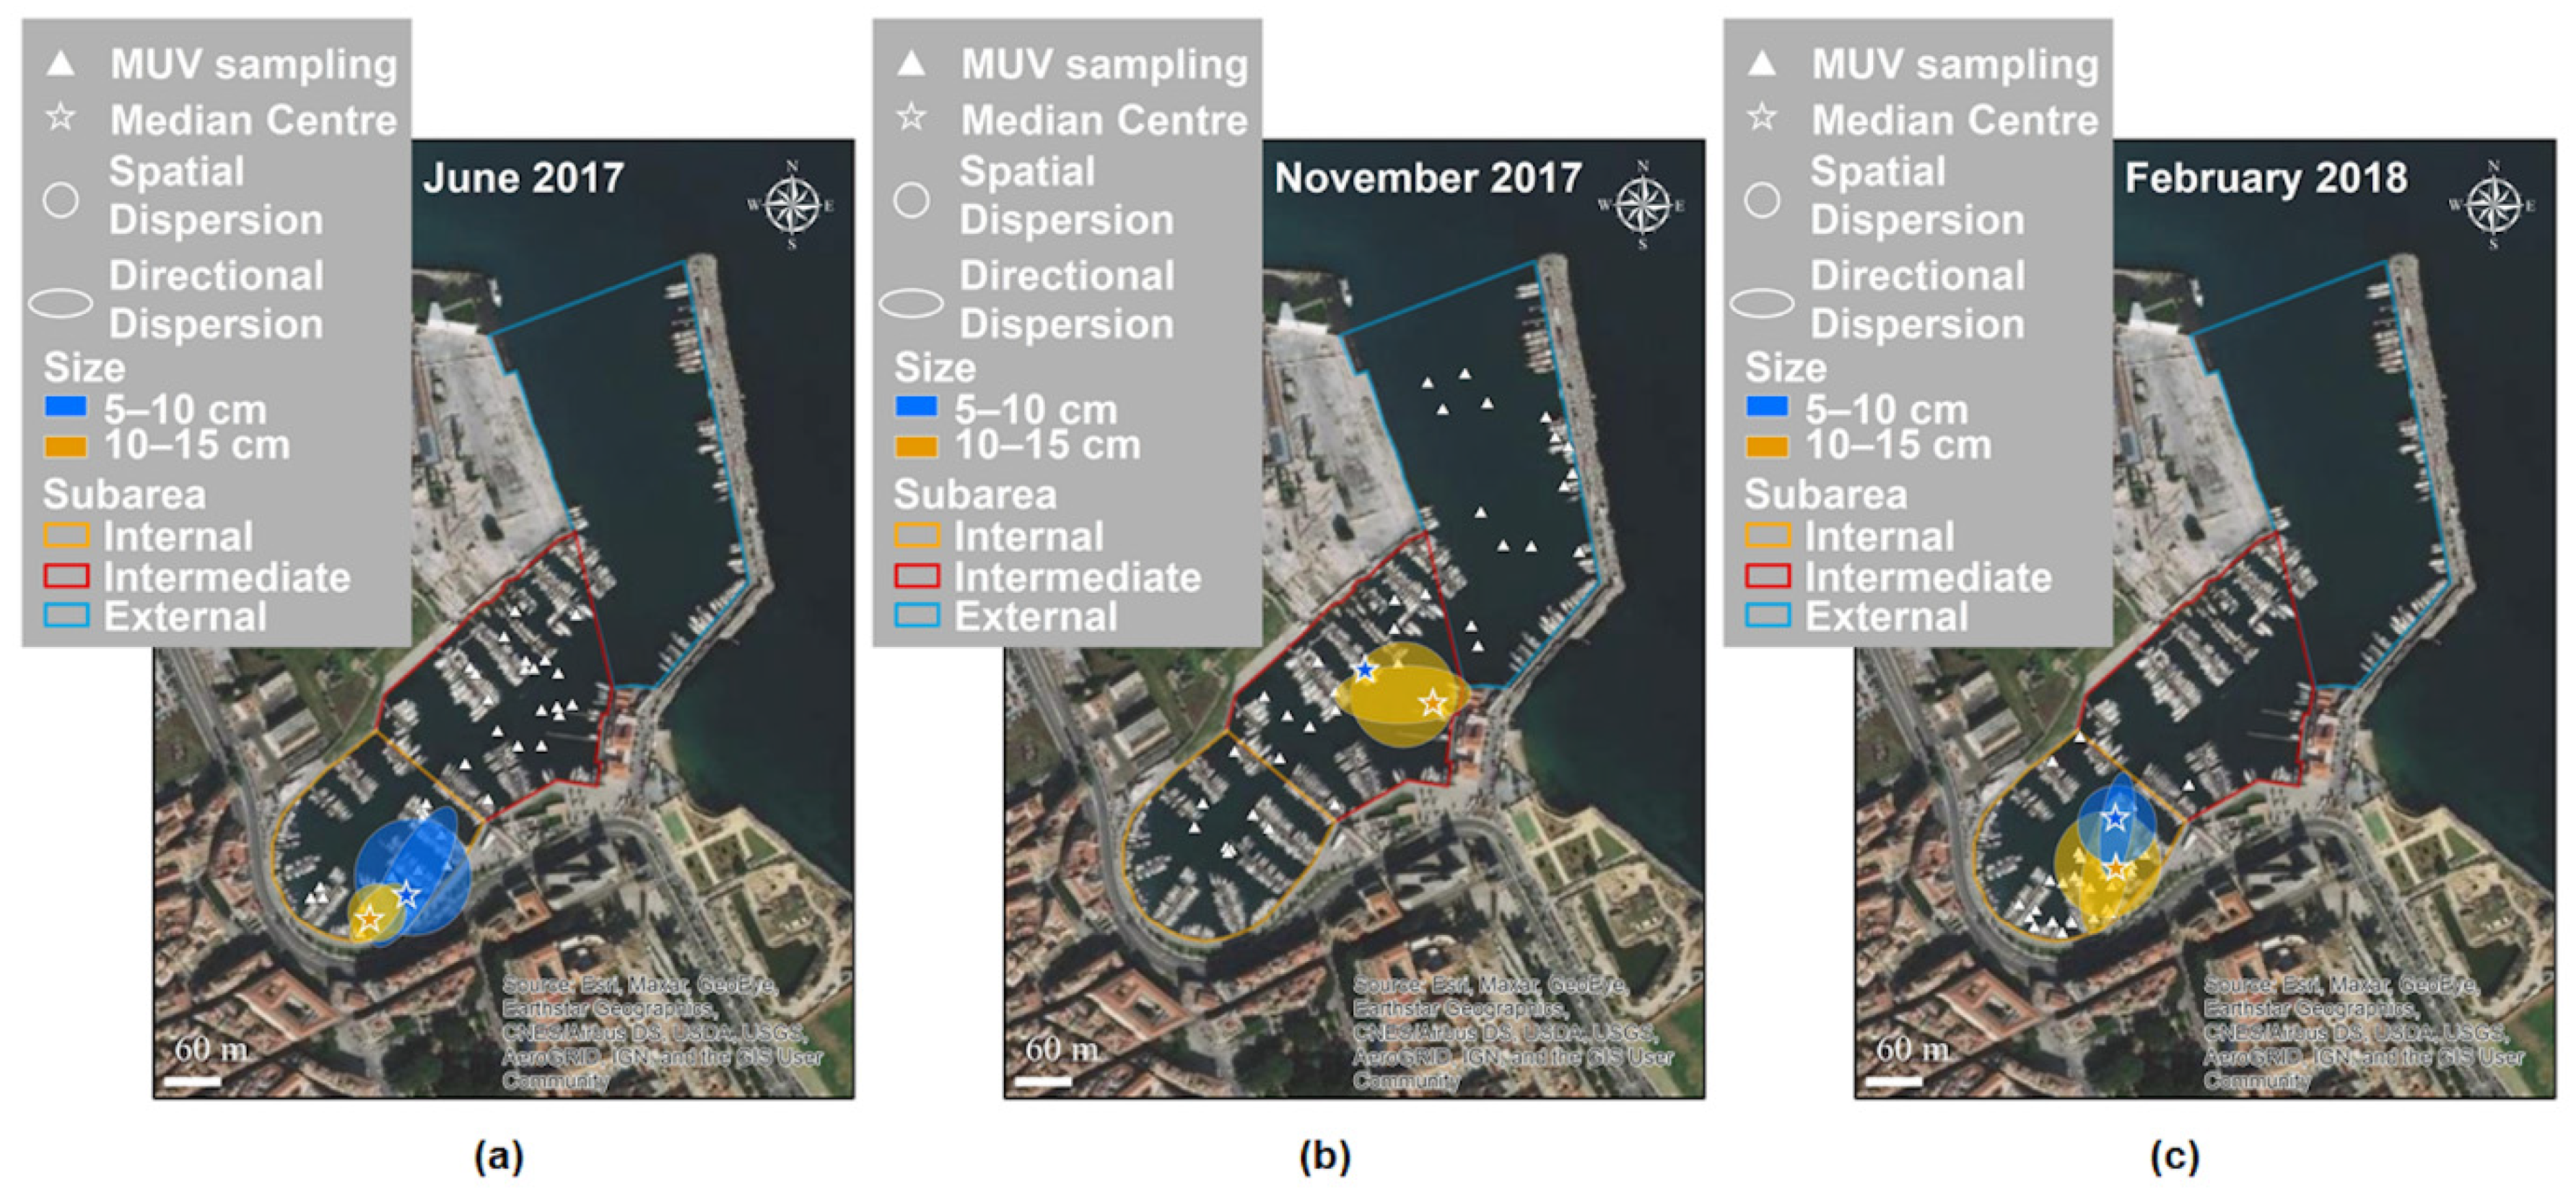
3.2. Spatial and Temporal Distributions

In Figure 8, the values for central tendency, spatial dispersion, directional dispersion, and directional trend are mapped for each sampling date. The species’ spatial and directional dispersions were quantitatively similar in all periods but showed changes over time and space. In June, C. andromeda was primarily located in the internal sub-area, while in November, it was primarily located in the intermediate area. The directional trends were different in June and November, with angles of 31° and 83°, respectively.
Clear differences between the size classes can be seen in the key characteristics of the distributions per sampling date (Figure 9a–c). In June, the distribution of the 10–15 cm size class was more compact than that of the 5–10 cm size class. In November, the specimens observed mainly belonged to the 10–15 cm size class; their distribution was more dispersed than in June. In February, the 10–15 cm size class was more dispersed than the smallest size class.
Global spatial autocorrelations among the C. andromeda recorded in Cala were found for temperature, salinity, and transparency. The GMI values reported in Table 2 suggest that the distribution is clustered and non-random. Temperature and transparency showed greater spatial autocorrelation than salinity.
Figure 10a–c report the results of the hot spot (Getis–Ord Gi*) analysis on the MUV sampling of C. andromeda in relation to the environmental parameters temperature (T), salinity (S), and water transparency (Tr). At the local spatial scale, areas showing statistically significant clustering of low values (cold spot) and of high values (hot spot) were found. The other records (yellow triangles) had non-significant index values. In Table 3, the mean values ± standard error of the T, S, and Tr parameters corresponding to hot and cold spots are reported.
The spatial distributions of the three parameters for each sampling date are reported in Figures S1–S4.

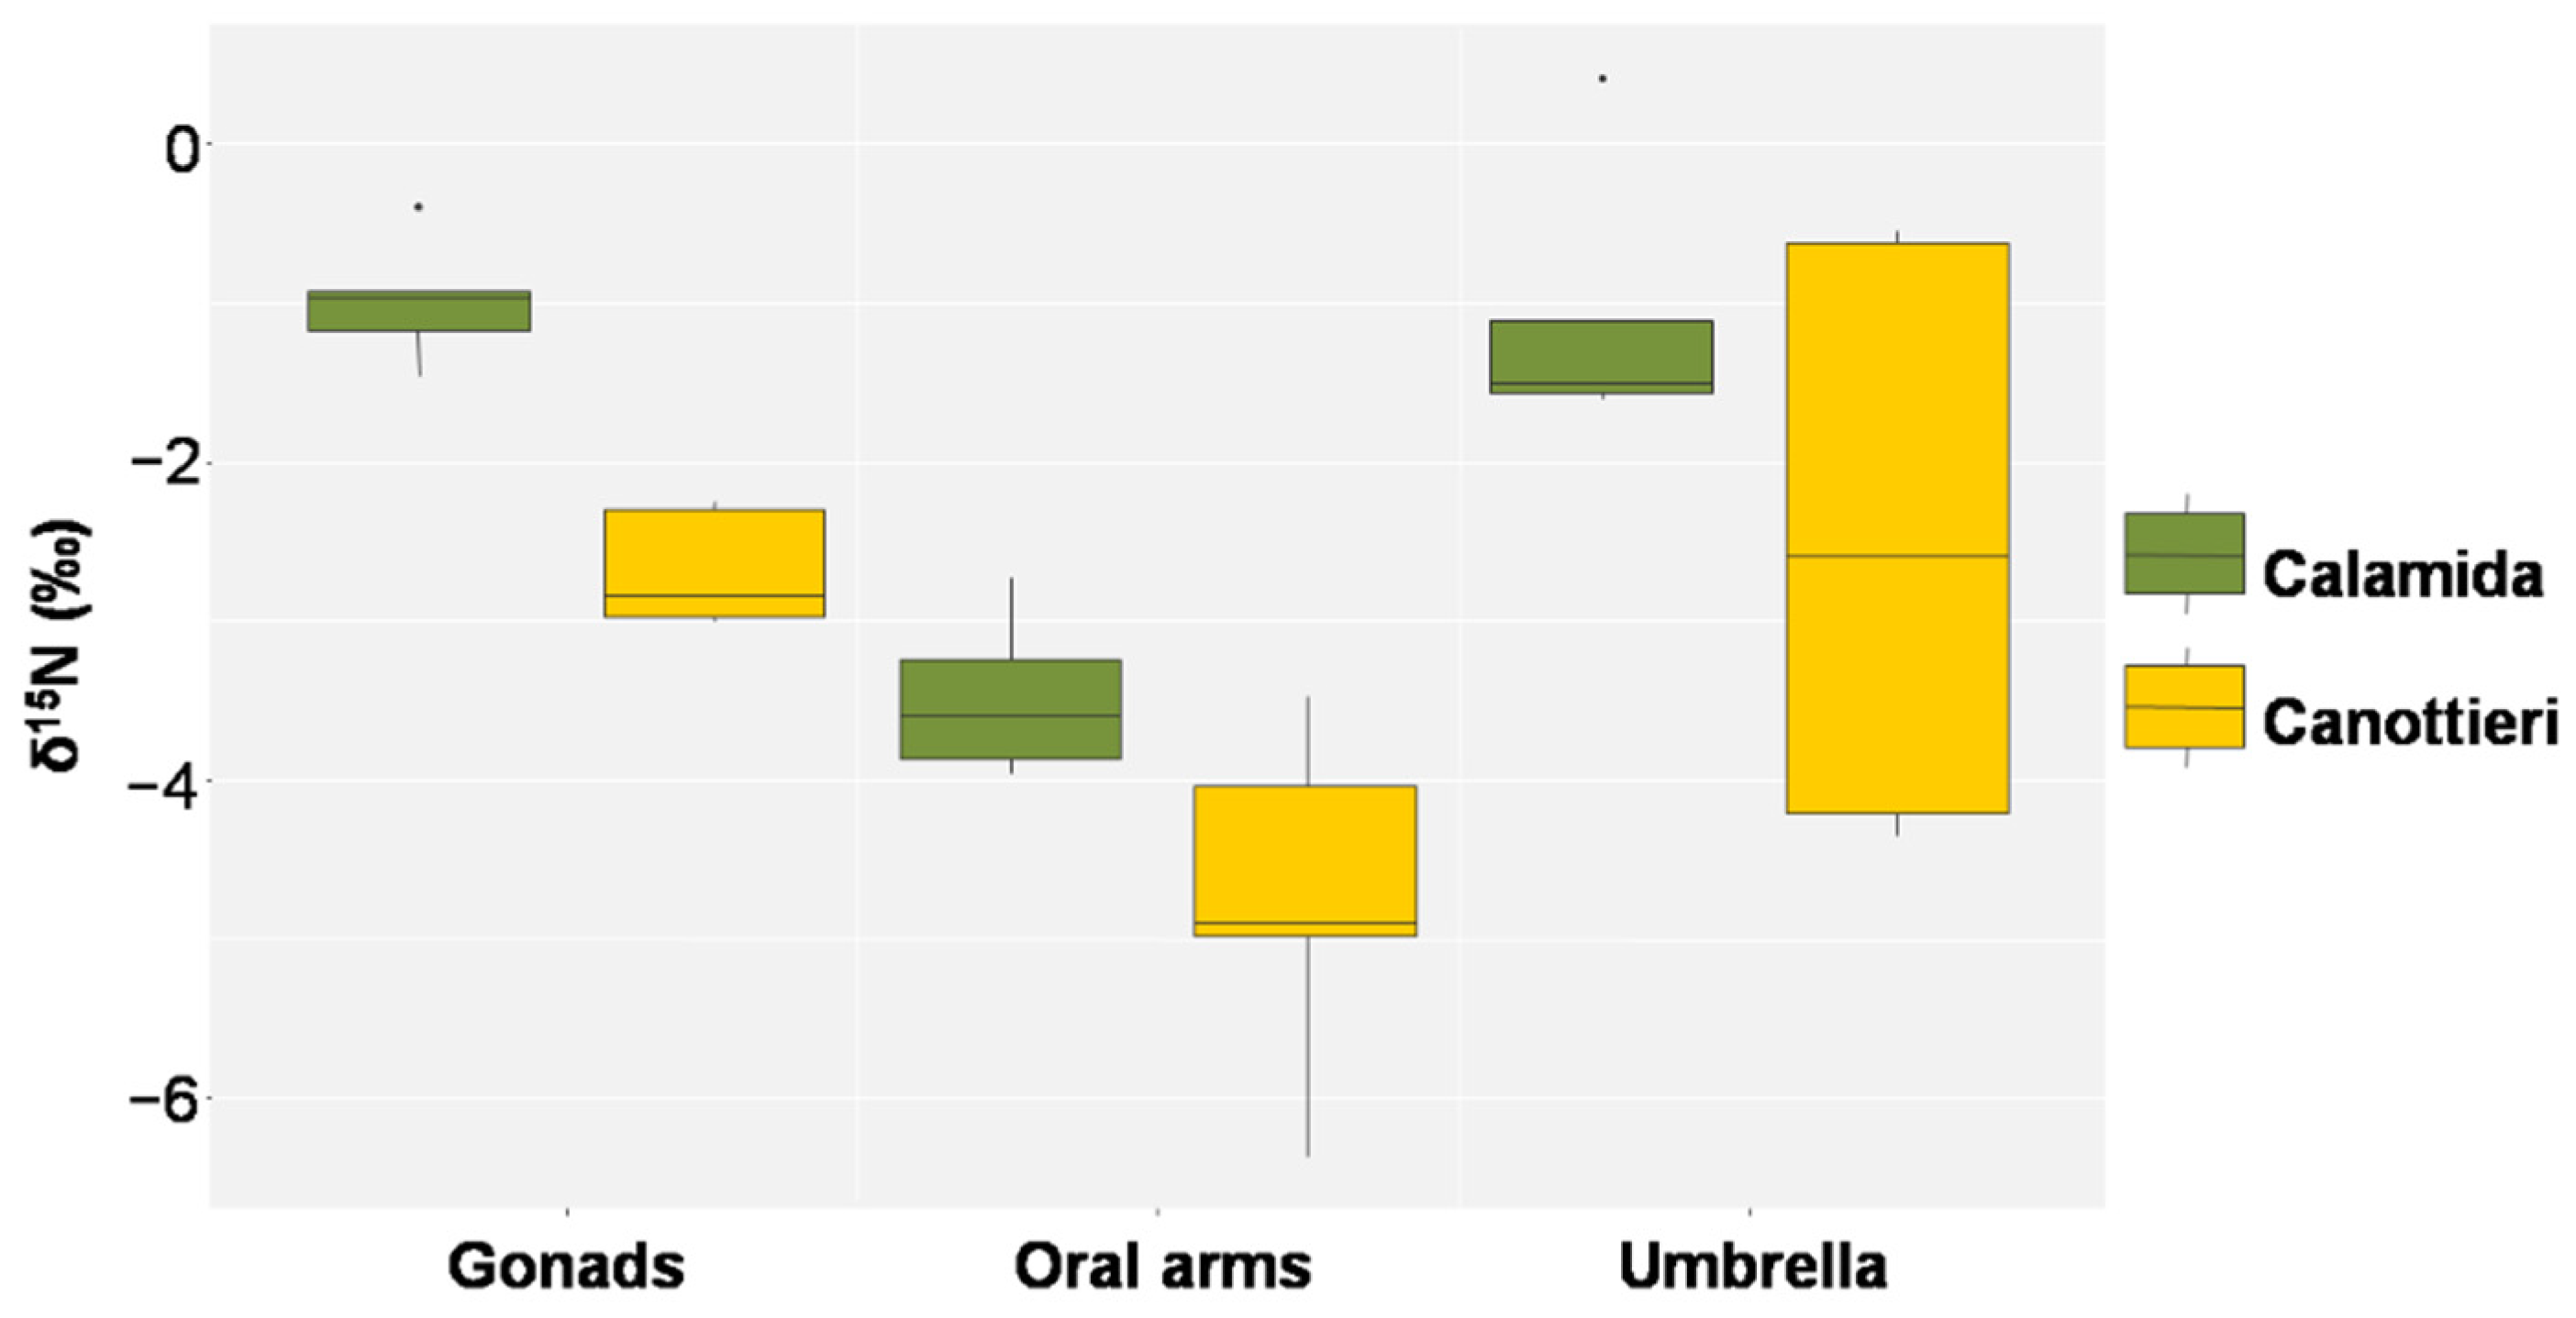
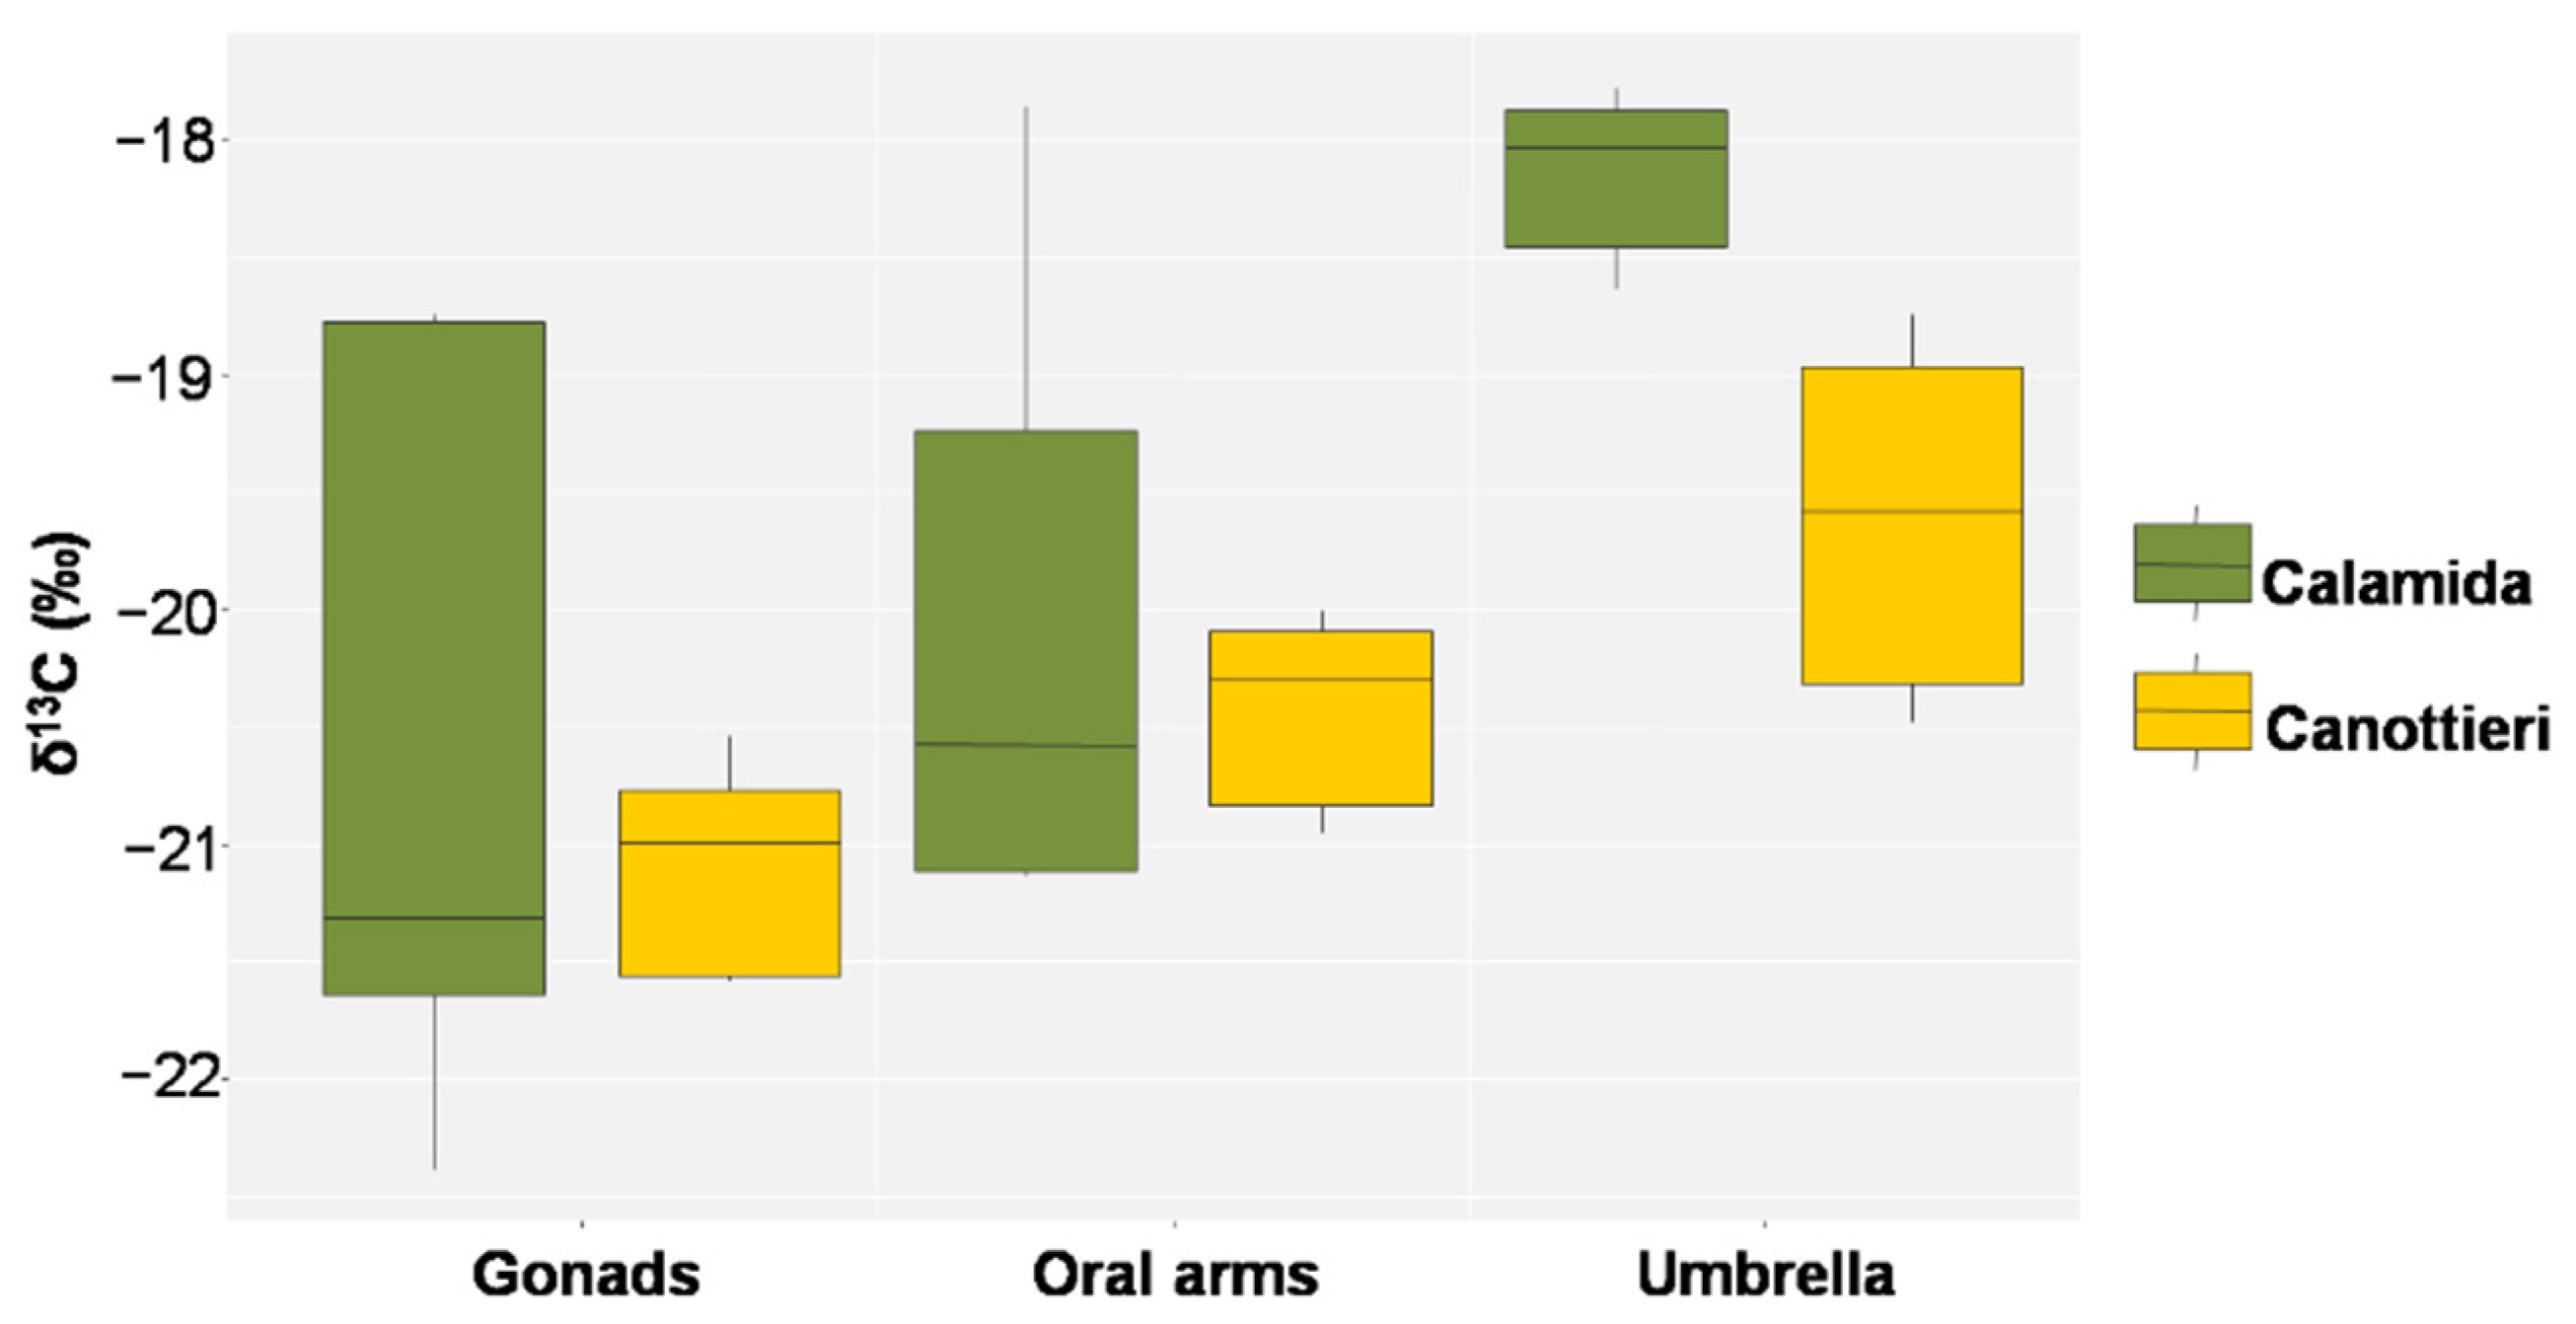
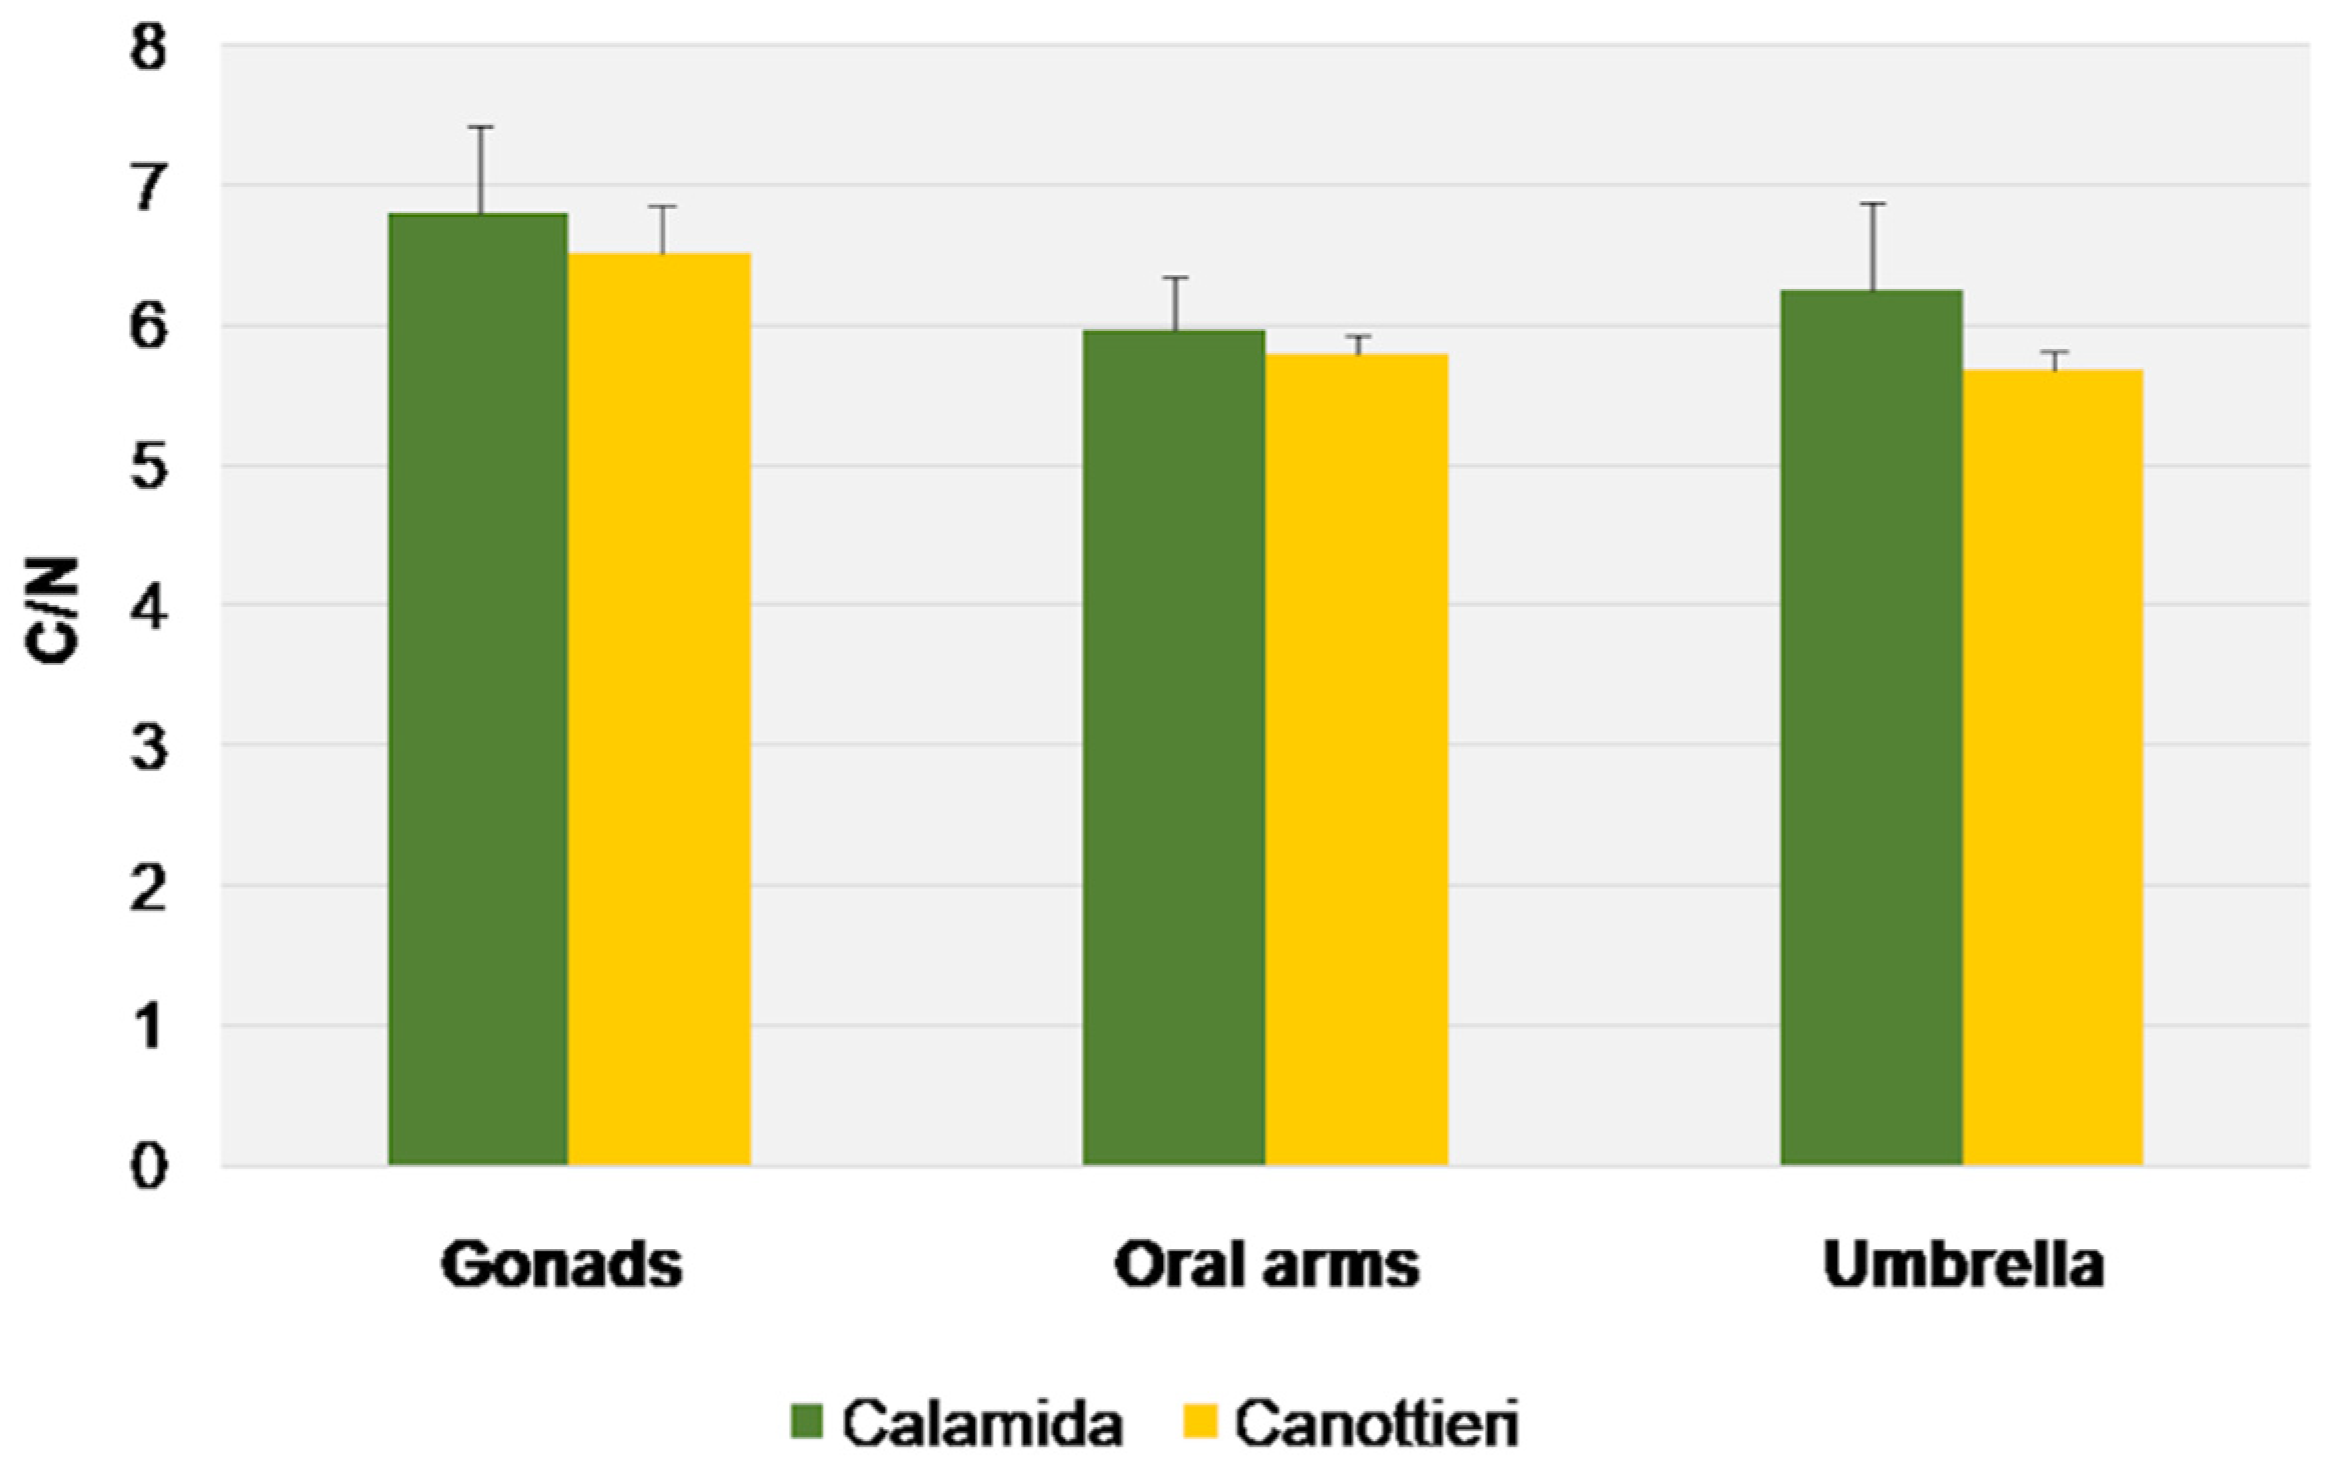
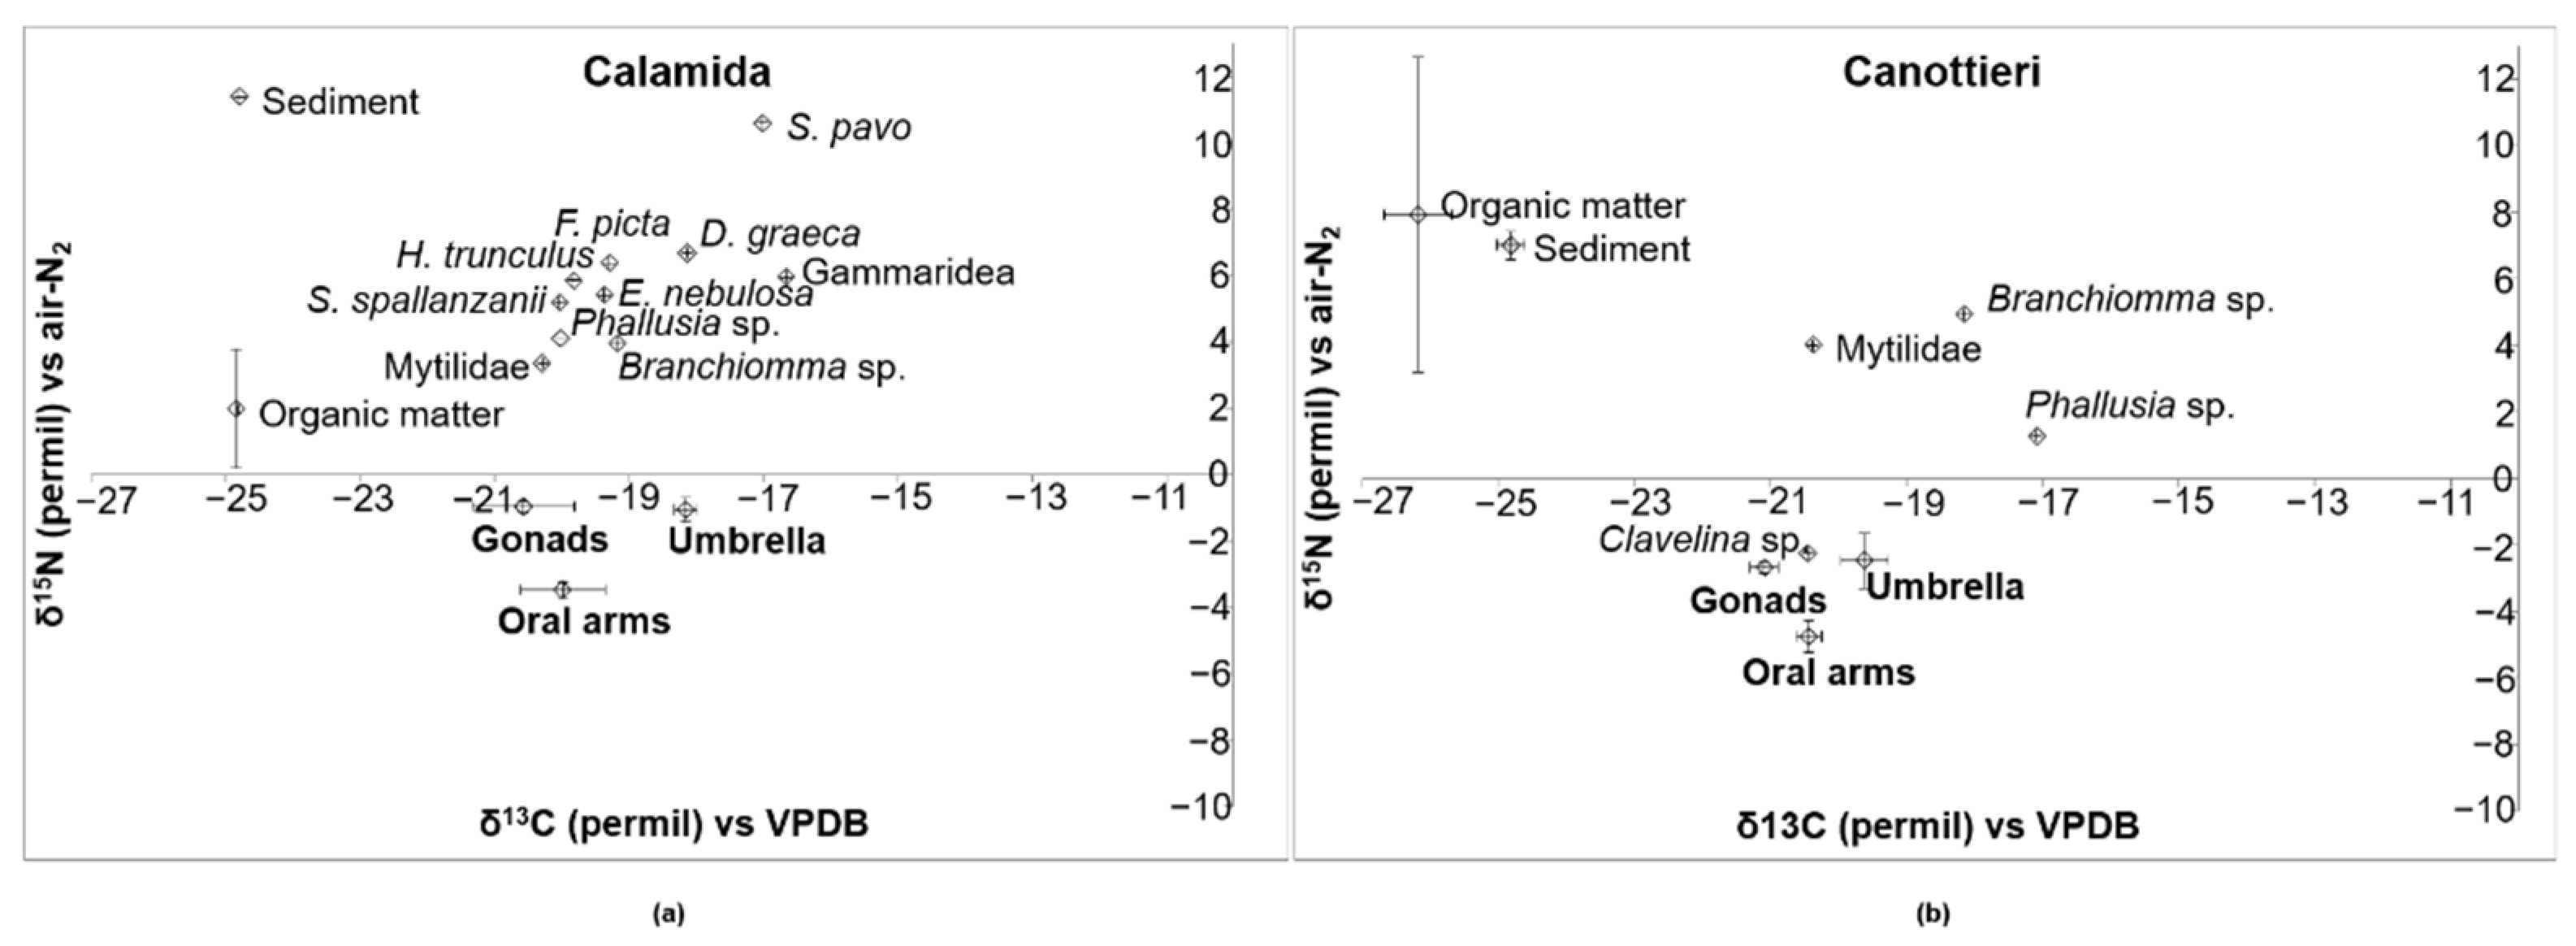
3.3. Stable Isotope Analysis

In Figure 11, Figure 12 and Figure 13, the results of δ15N, δ13C, and the C/N molar ratio, respectively, found in the gonads, oral arms, and umbrella of the C. andromeda specimens sampled at both the “Calamida” and “Canottieri” sites are shown. The data reported for δ15N show negative values. For both sites, the values of δ15N were similar for the umbrella and gonads and lower for the oral arms (Δ 2.3‰ and 2.4‰ for Canottieri and Calamida, respectively) (Figure 11).
This evidence is also confirmed by the values of δ13C, which showed similar behaviors, despite the more pronounced differences in Calamida (Δ 0.8‰ and 1.8‰ for Canottieri and Calamida, respectively). The more negative δ13C and higher C/N ratio values observed for the gonads could depend on the higher lipid content in this tissue (Figure 12 and Figure 13).
Figure 14a,b show bidimensional plots of δ15N and δ13C in three body parts of C. andromeda and the other community components sampled at the Calamida and Canottieri sites. The values of the two stable isotopes in C. andromeda show similar trends for the two sites, showing less negative values in the umbrella than in the oral arms. The Calamida site probably reflects a less disturbed situation, showing a shift from lower to higher values along the trophic chain for the two isotopes. Specifically, along with the three body parts of the jellyfish and the sediment (δ15N = 11.37‰ and δ13C = −24.79‰—one sample), Figure 14a shows three main groups (average ± S.E. of δ15N and δ13C): (1) organic matter (δ15N = 1.96 ± 1.79‰ and δ13C = −24.85 ± 0.01‰); (2) filter feeders/detritivores: Branchiomma sp. Anellida, Eupolymnia nebulosi Anellida, Mytilidae, Phallusia sp. Tunicata, and Sabella spallanzanii Anellida (δ15N = 4.39 ± 0.38‰ and δ13C = −19.77 ± 0.21‰); and (3) predators: Diodora graeca Mollusca, Felimare picta Mollusca, Hexaplex trunculus Mollusca, Gammaridea Crustacea, and Salaria pavo Osteichthyes (δ15N = 7.08 ± 0.88‰ and δ13C = −18.18 ± 0.61‰). The situation at the Canottieri site is different; even though the filter feeders/detritivores (Branchiomma sp., Mytilidae, Phallusia sp., and Clavelina sp. Tunicata) present similar values (δ15N = 1.99 ± 1.61‰ and δ13C = −19.01 ± 0.83‰) to those at the Calamida site, the organic matter (δ15N = 7.91 ± 4.72‰ and δ13C = −26.18 ± 0.50‰) and the sediments (δ15N = 7.00 ± 0.42‰ and δ13C = −24.81 ± 0.21‰) have very different values compared with other community components.

4. Discussion

Non-indigenous species (NIS) have attracted the attention of researchers due to the impacts they can have on biodiversity, the economy, and human health. Harbors and marinas are among the main hotspots for the introduction of alien species, due to maritime traffic being intense [49,50]. NIS monitoring and research are essential in improving the knowledge on species invasiveness, in evaluating their potential threat to the surrounding ecosystem, and in supporting management actions. One such alien species is the upside-down jellyfish Cassiopea andromeda, the invasion of which has been recently reported in a Mediterranean touristic harbor of Palermo (Italy): “Cala” [5].

4.1. Distribution of Cassiopea Andromeda

Studying NIS in harbor environments is not always easy due to the presence of obstacles (e.g., floating docks, anchored or moving nautical vehicles, and ropes) which hinder the use of standard visual methods and tools. A Megabenthos Underwater Video (MUV) device specially designed and built to overcome these sampling difficulties [40] allowed recording several C. andromeda specimens of different sizes in the different sub-areas of Cala. Their abundance and density varied across the four sampling dates. The large number of individuals of small sizes observed in February 2018 compared with that during previous months, when the intermediate size was the most abundant, suggests a previous reproductive event and indicates that the population of jellyfish in this study area is quite established.
The lowest values of abundance and density were recorded in April 2018, when the medusa stage population was clearly in decline. Since then, the medusa stage disappeared for two years and was subsequently spotted in October 2020 and in November 2021 (unpublished data from the authors’ on-site visual inspections), when a few small and medium-sized specimens were observed. The period of apparent absence of the species in this harbor of Palermo could correspond to the polyp phase, which is not macroscopically visible. After a long period of two years, the transition from the polyp to medusa (strobilation) phases could have been triggered by exogenous factors (according to [11]), which led to the reappearance of a visible population.
The presence of C. andromeda down to 7.5 m depths may be due to the jellyfish’s photosynthetic symbionts needing light, and its presence in the internal and intermediate zones of Cala could be due to the more eutrophic conditions [8]. Moreover, the dense packing of the smallest individuals in the internal zone could depend on the hypothetical presence of a close polyp population due to the lower hydrodynamics and the presence of many artificial substrates in this area of the harbor. Equally, the lack of C. andromeda observed at deeper and external sites (i.e., at the Cala mouth) may also be due to the greater amount of water movement typically caused by the continuous passage of boats.
From the results of the GIS-based statistical analyses, the jellyfish aggregation seen during June and November in different sub-areas and with different orientations suggests that the C. andromeda population is established in various zones of Cala. This is probably due to the environmental variability of the harbor, which is severely influenced by various factors (e.g., terrigenous and anthropogenic inputs) heterogeneously distributed over time and space, as well as by the variation in some environmental parameters (e.g., water turbidity due to vessel movements and external inputs).
The ranges of the environmental parameters measured in the study area (temperature, salinity, and transparency) were consistent with the conditions necessary to maintain a Cassiopean population [37] and did not influence the distribution of specimens, which clustered around both low and high parameter values. In fact, Cassiopea spp. tolerate a wide range of temperatures (up to about 29 °C), salinities (up to 36), and levels of light exposure (from 200 to 500 μmol photons m−1 s−1) [10,38]. The cluster behavior is possibly generated by other factors, such as a greater concentration of nutrients or organic matter in these areas, which would attract jellyfish to specific areas, as hypothesized by [37].

4.2. Trophic Behavior of Cassiopea Andromeda

In the literature, the use of δ15N from aquatic autotrophic organisms and consumers to trace anthropogenic sources of N has often been reported [51,52,53,54,55]. The generally most useful observation is that, in nutrient-rich environments, the δ15N of algae can track the δ15N from nitrate. The transformation of inorganic nitrogen compounds into an organic form during biosynthesis by living autotrophic organisms influences the reduction of oxidized forms of N to NH 4 + and, then, its assimilation into organic matter. This process generally prefers the incorporation of an isotope with a lower mass. Some authors [56,57] measured a large range of N fractionations (−30 to 0‰) for nitrate and ammonium assimilation by algae and bacteria. The atmospheric N2 bacterial fixation by the enzyme nitrogenase is reflected in organic material having δ15N values slightly less than 0‰ and lower than the environmental values for organic materials produced by other mechanisms [58]. For this reason, low δ15N values in organic matter are generally thought to indicate N2 fixation. Assimilation produces isotope fractionation by favoring the incorporation of lighter isotopes. Several authors measured a wide range of N fractionations (−30 to 0‰) in field studies [56,57] and in laboratory experiments for nitrate and ammonium assimilation by algae [59,60,61]. For ammonium assimilation, the authors of [58] reported a range of fractionation from −4 to −27‰, depending on whether the algae cells were nitrogen limited, enzyme limited, or diffusion limited.
The Cassiopea andromeda trophic position and energy assimilation strategy may vary according to the availability of food sources, allowing the species to subsist in water masses ranging from eutrophic to oligotrophic conditions [62,63,64].
In the study area, the lower values of δ15N for C. andromeda, indicating a depletion of 15N compared with 14N, were unexpected, but they could be the result of the availability of nitrogen sources rich in 14N, such as those from untreated urban waste [65]. These lower values could be more affected by the characteristic of the sampling sites (Calamida and Canottieri), which are confined and feature low hydrodynamics. The stable isotope values in C. andromeda were consistently lower than those in the other community components, suggesting the production of organic components based on the metabolism of associated symbionts.
Septic tank effluent contains predominantly organic and inorganic carbon, organic nitrogen, and ammonium. The septic sludge δ15N reported by [65] had low values (–2.1‰), whereas the corresponding particulate and dissolved fractions generally had different nitrogen and carbon ratios as a result of fractionation in the anaerobic or aerobic processes. Nevertheless, an influence of atmospheric precipitation was not excluded given that the δ15N of nitrate reported for a wet deposition showed values ranging from −11‰ to +3.5‰, with a mean value of −3.1‰ [66,67,68].
For both sampling sites, the lower δ15N values observed for the oral arms of jellyfish suggest a lower trophic level with respect to the umbrella, highlighting the higher concentration of autotrophic symbionts in these tissues [11,69]. Indeed, the pattern suggested is that the zooxanthellae, which colonize the oral arms of C. andromeda, uptake the dissolved inorganic nitrogen with a low δ15N value from the environment [63,64,70], while the umbrella uses a mix of the uptake of nitrogen with higher δ15N values, due to fractionation along the food web through predation [24,62,71], and degradation of the colonizers.
Less negative δ13C values (typically from −10‰ to −14‰) than those of particulate organic matter and plankton (ca. −20‰ [62]) are typical for the uptakes of dissolved inorganic carbon by zooxanthellae [20,22,72,73]. The δ13C values obtained for the umbrella in this study were higher than those obtained for the oral arms, in particular at the Calamida site, suggesting less translocation of the metabolites derived from symbionts and greater dependence on the heterotrophic metabolism of the jellyfish [63,64].
During synthesis, the isotopic signature evidenced that the metabolites derived from inorganic nutrient uptake and predation are then exchanged and recycled between the zooxanthellae and the host (e.g., [74]). The photosynthesis that occurs in the oral arms could involve processes depleting the nutrient pools derived from untreated discharge civil effluents and mixed with the discharge of wet depositions.

5. Conclusions

In the touristic harbor of Palermo, “Cala”, the Cassiopea andromeda population showed alternating periods of abundance, predominantly the medusa stage, and periods of apparent quiescence. The specimens showed adaptation to both winter and summer temperatures, settings found in the shallow bottoms of the more confined areas of Cala. However, further investigations on the species distribution, including other environmental parameters (such as nutrients and light exposure) and seasonal differences, are still needed to better understand how the species established itself and clustered within the study area.
C. andromeda showed a dual nutrition strategy (mixotrophic behavior) with stable isotope values that were consistently lower than those in the other community components, probably due to the presence of N derived from human sources. However, additional studies on the nutrient dynamics in this area and the isotopic values of other community components (phyto- and zooplankton) would help to clarify the trophic role of this species in the environment.
All preliminary results confirm that C. andromeda is capable of living and reproducing in heavily anthropized areas such as harbors, allowing the species to establish itself once introduced and to be transferred elsewhere by boats [10]. Moreover, the species seems to have the ability to cope with environmental changes. These traits, together with its mixotrophy, render the species a perfect invader in current and future scenarios of climate change. Its potential impact on the local biodiversity and thus on the marine ecosystem’s structure and functioning is worth considering. Therefore, specific surveillance actions, performed by trained staff, would allow for monitoring and control of these invasions, which may be a threat to the biodiversity and ecosystems of a certain region.

Supplementary Materials

The following supporting information can be downloaded at: https://0-www-mdpi-com.brum.beds.ac.uk/article/10.3390/biology11020319/s1, Figure S1: Spatial distribution of (a) temperature (°C), (b) salinity, and (c) transparency (%) in June 2017. The white triangles indicate the measurement points of the parameters; Figure S2: Spatial distribution of transparency (%) in November 2017. The white triangles indicate the measurement points of the parameter; Figure S3: Spatial distribution of (a) temperature (°C), (b) salinity, and (c) transparency (%) in February 2018. The white triangles indicate the measurement points of the parameters; Figure S4: Spatial distribution of (a) temperature (°C), (b) salinity, and (c) transparency (%) in April 2018. The white triangles indicate the measurement points of the parameters.

Author Contributions

Conceptualization, M.B.-B., M.F., T.M., G.M., M.S. and L.C.; methodology, A.A., D.B., M.B.-B., G.M. and M.S.; formal analysis, A.A., T.C., D.B., P.P., F.R. and L.C.; investigation, A.A., D.B., M.B.-B., M.F., T.M., G.M., F.R., M.S. and L.C.; resources, T.C., A.A., D.B., M.B.-B., M.F., T.M., G.M., P.P., F.R., M.S. and L.C.; data curation, T.C., A.A., D.B., P.P. and L.C.; writing—original draft preparation, T.C., T.M., P.P. and L.C.; writing—review and editing, T.C., D.B., M.B.-B., M.F., T.M., G.M., P.P., F.R., M.S. and L.C.; visualization, T.C. and P.P.; supervision, L.C. and M.S.; funding acquisition, M.S. All authors have read and agreed to the published version of the manuscript.

Funding

This research received no external funding.

Institutional Review Board Statement

Not applicable.

Informed Consent Statement

Not applicable.

Data Availability Statement

Data sharing not applicable.

Acknowledgments

The authors thank Lega Navale Italiana Palermo for technical support during sampling, and Capitaneria di Porto of Palermo for authorization to carry out the study within the harbor area.

Conflicts of Interest

The authors declare no conflict of interest.

References

  1. Katsanevakis, S.; Wallentinus, I.; Zenetos, A.; Leppäkoski, E.; Çinar, M.E.; Oztürk, B.; Grabowski, M.; Golani, D.; Cardoso, A.N. Impacts of Invasive Alien Marine Species on Ecosystem Services and Biodiversity: A Pan-European Review. Aquat. Invasions 2014, 9, 391–423. [Google Scholar] [CrossRef]
  2. Bianchi, C.N. Biodiversity issues for the forthcoming tropical Mediterranean Sea. Hydrobiologia 2007, 580, 7. [Google Scholar] [CrossRef]
  3. Parravicini, V.; Mangialajo, L.; Mousseau, L.; Peirano, A.; Morri, C.; Montefalcone, M.; Francour, P.; Kulbicki, M.; Bianchi, C.N. Climate change and warm-water species at the north-western boundary of the Mediterranean Sea. Mar. Ecol. 2015, 36, 897–909. [Google Scholar] [CrossRef]
  4. Lasram, B.F.; Tomasini, J.A.; Guilhaumon, F.; Romdhane, M.S.; Do Chi, T.; Mouillot, D. Ecological correlates of dispersal success of Lessepsian fishes. Mar. Ecol. Prog. Ser. 2008, 363, 273–286. [Google Scholar] [CrossRef] [Green Version]
  5. Maggio, T.; Allegra, A.; Bosch-Belmar, M.; Cillari, T.; Cuttitta, A.; Falautano, M.; Milisenda, G.; Nicosia, A.; Perzia, P.; Sinopoli, M.; et al. Molecular identity of the non-indigenous species Cassiopea sp. from Palermo Harbour (central Mediterranean Sea). J. Mar. Biolog. Assoc. UK 2019, 99, 1765–1773. [Google Scholar] [CrossRef]
  6. Maas, O. Die Scyphomedusen der Siboga-Expedition; Siboga-Expeditie, Buchhandlung und Druckerei Vormals, EJ Brill: Leiden, The Netherlands, 1903; Volume 11, pp. 1–91. [Google Scholar] [CrossRef]
  7. Stampar, S.N.; Gamero-Mora, E.; Maronna, M.M.; Fritscher, J.M.; Oliveira, B.S.P.; Sampaio, C.L.S.; Morandini, A.C. The puzzling occurrence of the upside-down jellyfish Cassiopea (Cnidaria: Scyphozoa) along the Brazilian coast: A result of several invasion events? Zoologia 2020, 37, 1–10. [Google Scholar] [CrossRef]
  8. Stoner, E.W.; Layman, C.A.; Yeager, L.A.; Hassett, H.M. Effects of anthropogenic disturbance on the abundance and size of epibenthic jellyfish Cassiopea spp. Mar. Pollut. Bull. 2011, 62, 1109–1114. [Google Scholar] [CrossRef] [PubMed]
  9. Heins, A.; Glatzel, T.; Holst, S. Revised descriptions of the nematocysts and the asexual reproduction modes of the scyphozoan jellyfish Cassiopea andromeda (Forsskål, 1775). Zoomorphology 2015, 134, 351–366. [Google Scholar] [CrossRef]
  10. Morandini, A.C.; Stampar, S.N.; Maronna, M.M.; Da Silveira, F.L. All non-indigenous species were introduced recently? The case study of Cassiopea (Cnidaria: Scyphozoa) in Brazilian waters. J. Mar. Biol. Assoc. UK 2017, 97, 321–328. [Google Scholar] [CrossRef] [Green Version]
  11. Ohdera, A.H.; Abrams, M.J.; Ames, C.L.; Baker, D.M.; Suescún-Bolívar, L.P.; Collins, A.G.; Freeman, C.J.; Gamero-Mora, E.; Goulet, T.L.; Hofmann, D.K.; et al. Upside-down but headed in the right direction: Review of the highly versatile Cassiopea xamachana system. Front. Ecol. Evol. 2018, 6, 1–15. [Google Scholar] [CrossRef] [Green Version]
  12. Kremer, P. Ingestion and elemental budgets for Linuche unguiculata, a scyphomedusa with zooxanthellae. J. Mar. Biol. Assoc. UK 2005, 85, 613–625. [Google Scholar] [CrossRef]
  13. Welsh, D.T.; Dunn, R.J.; Meziane, T. Oxygen and nutrient dynamics of the upside down jellyfish (Cassiopea sp.) and its influence on benthic nutrient exchanges and primary production. Hydrobiologia 2009, 635, 351–362. [Google Scholar] [CrossRef]
  14. Kremer, P.; Costello, J.; Kremer, J.; Canino, M. Significance of photosynthetic endosymbionts to the carbon budget of the scyphomedus Linuche unguiculata. Limnol. Oceanogr. 1990, 35, 609–624. [Google Scholar] [CrossRef]
  15. Kikinger, R. Cotylorhiza tuberculata (Cnidaria: Scyphozoa)—Life history of a stationary population. Mar. Ecol. 1992, 13, 333–362. [Google Scholar] [CrossRef]
  16. McCloskey, L.R.; Muscatine, L.; Wilkerson, F.P. Daily photosynthesis, respiration, and carbon budgets in a tropical marine jellyfish (Mastigias sp.). Mar. Biol. 1994, 119, 13–22. [Google Scholar] [CrossRef]
  17. Verde, E.A.; McCloskey, L.R. Production, respiration, and photophysiology of the mangrove jellyfish Cassiopea xamachana symbiotic with zooxanthellae: Effect of jellyfish size and season. Mar. Ecol. Prog. Ser. 1998, 168, 147–162. [Google Scholar] [CrossRef] [Green Version]
  18. Sugiura, Y. On the life-history of Rhizostome medusae V. On the relation between zooxanthellae and the strobilation of Cephea cephea. Bull. Mar. Biol. Stn. Asamushi 1969, 13, 227–233. [Google Scholar]
  19. Bolton, T.F.; Graham, W.M. Morphological variation among populations of an invasive jellyfish. Mar. Ecol. Prog. Ser. 2004, 278, 125–139. [Google Scholar] [CrossRef] [Green Version]
  20. Djeghri, N.; Stibor, H.; Lebeau, O.; Pondaven, P. δ13C, δ15N, and C:N ratios as nutrition indicators of zooxanthellate jellyfishes: Insights from an experimental approach. J. Exp. Mar. Biol. Ecol. 2020, 522, 151257. [Google Scholar] [CrossRef]
  21. Todd, B.D.; Thornhill, D.J.; Fitt, W.K. Patterns of inorganic phosphate uptake in Cassiopea xamachana: A bioindicator species. Mar. Pollut. Bull. 2006, 52, 515–521. [Google Scholar] [CrossRef]
  22. Muscatine, L.; Porter, J.W.; Kaplan, I.R. Resource partitioning by reef corals as determined from stable isotope composition I. δ13C of zooxanthellae and animal tissue versus depth. Mar. Biol. 1989, 100, 185–193. [Google Scholar] [CrossRef]
  23. Muscatine, L.; Kaplan, I.R. Resource partitioning by reef corals as determined from stable isotope composition II. δ15N of zooxanthellae and animal tissue versus depth. Pac. Sci. 1994, 48, 304–312. [Google Scholar]
  24. Ferrier-Pagès, C.; Peirano, A.; Abbate, M.; Cocito, S.; Negri, A.; Rottier, C.; Riera, P.; Metalpa, R.; Reynaud, S. Summer autotrophy and winter heterotrophy in the temperate symbiotic coral Cladocora caespitosa. Limnol. Oceanogr. 2011, 56, 1429–1438. [Google Scholar] [CrossRef]
  25. Yamamuro, M.; Kayanne, H.; Minagawa, M. Carbon and nitrogen stable isotopes of primary producers in coral reef ecosystems. Limnol. Oceanogr. 1995, 40, 617–621. [Google Scholar] [CrossRef]
  26. Sammarco, P.W.; Risk, M.J.; Schwarcz, H.P.; Heikoop, J.M. Cross-continental shelf trend in coral δ15N on the Great Barrier Reef: Further consideration of the reef nutrient paradox. Mar. Ecol. Prog. Ser. 1999, 180, 131–138. [Google Scholar] [CrossRef] [Green Version]
  27. Heikoop, J.M.; Dun, J.J.; Risk, M.J.; Tomascik, T.; Schwarz, H.P.; Sandeman, I.M.; Sammarco, P.W. Nitrogen-15 signals of anthropogenic nutrient loading in reef corals. Mar. Pollut. Bull. 2000, 40, 628–636. [Google Scholar] [CrossRef]
  28. Hoegh-Guldberg, O.; Muscatine, L.; Goiran, C.; Siggaard, D.; Marion, G. Nutrient-induced perturbations to δ13C and δ15N in symbiotic dinoflagellates and their coral hosts. Mar. Ecol. Prog. Ser. 2004, 280, 105–114. [Google Scholar] [CrossRef]
  29. Marion, G.S.; Hoegh-Guldberg, O.; McCulloch, M.T.; Jupiter, S.D. Coral isotopic records (δ15N) of unprecedented land-use stress in Great Barrier Reef coastal communities. EOS Trans. Am. Geophys. Union Ocean Sci. Meet. Suppl. 2006, 87. [Google Scholar]
  30. Heikoop, J.M.; Dun, J.J.; Risk, M.J.; McConnaughey, T.A.; Sandman, I.M. Separation of kinetic and metabolic effect in carbon-13 records preserved in reef coral skeletons. Geochim. Cosmochim. Acta 2000, 64, 975–987. [Google Scholar] [CrossRef]
  31. Heikoop, J.M.; Dunn, J.J.; Risk, M.J.; Sandeman, I.M.; Schwartz, H.P.; Waltho, N. Relationship between light and the δ15N of coral tissue: Examples from Jamaica and Zanzibar. Limnol. Oceanogr. 1998, 43, 909–920. [Google Scholar] [CrossRef] [Green Version]
  32. Rodrigues, L.; Grottoli, A. Calcification rate, and the stable carbon, oxygen and nitrogen isotopes in the skeleton, host tissue and zooxanthellae of bleached and recovering Hawaiian corals. Geochim. Cosmochim. Acta 2006, 70, 2781–2789. [Google Scholar] [CrossRef]
  33. Lampert, K.P. Cassiopea and its zooxanthellae. In The Cnidaria, Past, Present and Future; Springer: Cham, Switzerland, 2016; pp. 415–423. [Google Scholar]
  34. Schäfer, W. Eine Qualle aus dem Indischen Ozean in der Agais. Nat. Volk 1955, 85, 241–245. [Google Scholar]
  35. Schembri, P.J.; Deidun, A.; Vella, P.J. First record of Cassiopea andromeda (Scyphozoa: Rhizostomeae: Cassiopeidae) from the central Mediterranean Sea. Mar. Biodivers. Rec. 2010, 3, E6. [Google Scholar] [CrossRef] [Green Version]
  36. Cillari, T.; Andaloro, F.; Castriota, L. First documented record of Cassiopea cfr andromeda (Cnidaria: Scyphozoa) in Italian waters. Cah. Biol. Mar. 2018, 59, 193–195. [Google Scholar]
  37. Thé, J.; de Sousa Barroso, H.; Mammone, M.; Viana, M.; Melo, C.S.B.; Mies, M.; Banha, T.N.S.; Morandini, A.C.; Rossi, S.; de Oliveira Soares, M. Aquaculture facilities promote populational stability throughout seasons and increase medusae size for the invasive jellyfish Cassiopea andromeda. Mar. Environ. Res. 2020, 162, 105161. [Google Scholar] [CrossRef]
  38. Mammone, M.; Ferrier-Pagés, C.; Lavorano, S.; Rizzo, L.; Piraino, S.; Rossi, S. High photosynthetic plasticity may reinforce invasiveness of upside-down zooxanthellate jellyfish in Mediterranean coastal waters. PLoS ONE 2021, 16, e0248814. [Google Scholar] [CrossRef]
  39. Autorità di Sistema Portuale del Mare di Sicilia Occidentale- Porti/Porto di Palermo/Diporto. Available online: https://www.adsppalermo.it/palermo-diporto (accessed on 30 November 2021).
  40. Cillari, T.; Allegra, A.; Bosch-Belmar, M.; Castriota, L.; Falautano, M.; Milisenda, G.; Maggio, T.; Perzia, P.; Sinopoli, M. Megabenthos Underwater Video (MUV): A new device to evaluate species distribution in hard-to-reach marine areas. In Proceedings of the International Workshop on Metrology for the Sea, Learning to Measure Sea Health Parameters (MetroSea), Virtual Conference, Milazzo, Italy, 4–6 October 2021; pp. 199–203. [Google Scholar] [CrossRef]
  41. Anderson, M.J.; Gorley, R.N.; Clarke, K.R. PERMANOVA+ for PRIMER: Guide to Software and Statistical Methods; PRIMER-E: Plymouth, UK, 2008. [Google Scholar]
  42. Perzia, P.; Battaglia, P.; Consoli, P.; Andaloro, F.; Romeo, T. Swordfish monitoring by a GIS-based spatial and temporal distribution analysis on harpoon fishery data: A case of study in the central Mediterranean Sea. Fish. Res. 2016, 183, 424–434. [Google Scholar] [CrossRef]
  43. Lipej, L.; Mavric, B.; Paliska, D. New northernmost record of the blunthead pufferfish, Sphoeroides pachygaster (osteichthyes: Tetraodontidae) in the Mediterranean Sea/Nuova segnalazione a nord del pesce palla liscio, Sphoeroides pachygaster (Osteichthyes: Tetraodontidae), nel mare Mediterraneo. Ann. Ser. Hist. Nat. 2013, 23, 103. [Google Scholar]
  44. Falautano, M.; Perzia, P.; Castriota, L. First record of the Lessepsian fish Parexocoetus mento in Italian waters and GIS-based spatial and temporal distribution in Mediterranean Sea. J. Mar. Biolog. Assoc. 2020, 100, 1163–1169. [Google Scholar] [CrossRef]
  45. Mitchell, A. The ESRI Guide to GIS Analysis; ESRI Press: Redlands, CA, USA, 2005; Volume 2, ISBN 1-58948-116-X. [Google Scholar]
  46. Scott, L.M.; Janikas, M.V. Spatial statistics in ArcGis. In Handbook of Applied Spatial Analysis: Software Tools, Methods and Applications; Fischer, M.M., Getis, A., Eds.; Springer: Berlin/Heidelberg, Germany, 2010; pp. 27–41. [Google Scholar]
  47. ESRI ArcGIS. ArcGIS Desktop Help: Release 10.3; Environmental Systems Research Institute: Redlands, CA, USA, 2011. [Google Scholar]
  48. Alomar, C.; Deudero, S.; Andaloro, F.; Castriota, L.; Consoli, P.; Falautano, M.; Sinopoli, M. Caulerpa cylindracea Sonder invasion modifies trophic niche in infralittoral rocky benthic community. Mar. Environ. Res. 2016, 120, 86–92. [Google Scholar] [CrossRef]
  49. Ferrario, J.; Caronni, S.; Occhipinti-Ambrogi, A.; Marchini, A. Role of commercial harbours and recreational marinas in the spread of non-indigenous fouling species. Biofouling 2017, 33, 651–660. [Google Scholar] [CrossRef]
  50. Galil, B.S.; Marchini, A.; Occhipinti-Ambrogi, A. East is east and West is west? Management of marine bioinvasions in the Mediterranean Sea. Estuar. Coast. Shelf Sci. 2018, 201, 7–16. [Google Scholar] [CrossRef]
  51. Viana, I.G.; Bode, A.; Bartholomew, M.; Valiela, I. Experimental assessment of the macroalgae Ascophyllum nodosum and Fucus vesiculosus for monitoring N sources at different time-scales using stable isotope composition. J. Exp. Mar. Biol. Ecol. 2015, 466, 24–33. [Google Scholar] [CrossRef]
  52. McClellend, J.; Valiela, I. Linking nitrogen in estuarian producers to land-derived sources. Limnol. Oceanogr. 1998, 43, 577–585. [Google Scholar] [CrossRef] [Green Version]
  53. Risk, M. The reef crisis and the reef science crisis: Nitrogen isotopic ratios as an objective indicator of stress. Mar. Pollut. Bull. 2009, 58, 787–788. [Google Scholar] [CrossRef] [PubMed]
  54. Risk, M.J.; Sherwood, O.A.; Nairn, R.; Gibbons, C. Tracking the record of sewage discharge off Jeddah, Saudi Arabia, since 1950, using stable isotope records from antipatharians. Mar. Ecol. Prog. Ser. 2009, 397, 219–226. [Google Scholar] [CrossRef] [Green Version]
  55. Risk, M.J.; Erdmann, M.V. Isotopic composition of nitrogen in stomatopod (Crustacea) tissues as an indicator of human sewage impacts on Indonesian coral reefs. Mar. Pollut. Bull. 2000, 40, 50–58. [Google Scholar] [CrossRef]
  56. Cifuentes, L.A.; Fogel, M.L.; Pennock, J.R.; Sharp, J.H. Biogeochemical factors that influence the stable nitrogen isotope ratio of dissolved ammonium in the Delaware estuary. Geochim. Cosmochim. Acta 1989, 53, 2713–2721. [Google Scholar] [CrossRef]
  57. Montoya, P.; Korrigan, S.G.; McCarthy, J.J. Rapid, storm-induced changes in the natural abundance of 15N in a planktonic ecosystem, Chesapeake Bay, USA. Geochim. Cosmochim. Acta 1991, 55, 3627–3638. [Google Scholar] [CrossRef]
  58. Fogel, M.L.; Cifuentes, L.A. Isotope fractionation during primary production. In Organic Geochemistry; Engel, M.H., Macko, S.A., Eds.; Springer: Boston, MA, USA, 1993; Volume 11, pp. 73–98. [Google Scholar]
  59. Pennock, J.R.; Velinsky, D.J.; Ludlam, J.M.; Sharp, J.H.; Fogel, M.L. Isotopic fractionation of ammonium and nitrate during uptake by Skeletonema costatum: Implications for δ15N dynamics under bloom conditions. Limnol. Oceanogr. 1996, 41, 451–459. [Google Scholar] [CrossRef]
  60. Waser, N.A.D.; Harrison, P.J.; Nielsen, B.; Calvert, S.E.; Turpin, D.H. Nitrogen isotope fractionation during the uptake and assimilation of nitrate, nitrite, ammonium, and urea by a marine diatom. Limnol. Oceanogr. 1998, 43, 215–224. [Google Scholar] [CrossRef]
  61. Granger, J.; Sigman, D.M.; Needoba, J.A.; Harrison, P.J. Coupled nitrogen and oxygen isotope fractionation of nitrate during assimilation by cultures of marine phytoplankton. Limnol. Oceanogr. 2004, 49, 1763–1773. [Google Scholar] [CrossRef] [Green Version]
  62. Ferrier-Pagès, C.; Leal, M.C. Stable isotopes as tracers of trophic interactions in marine mutualistic symbioses. Ecol. Evol. 2018, 9, 723–740. [Google Scholar] [CrossRef] [PubMed]
  63. Freeman, C.J.; Stoner, E.W.; Easson, C.G.; Matterson, K.O.; Baker, D.M. Symbiont carbon and nitrogen assimilation in the CassiopeaSymbiodinium mutualism. Mar. Ecol. Prog. Ser. 2016, 544, 281–286. [Google Scholar] [CrossRef] [Green Version]
  64. Freeman, C.J.; Stoner, E.W.; Easson, C.G.; Matterson, K.O.; Baker, D.M. Variation in δ13C and δ15N values suggests a coupling of host and symbiont metabolism in the Symbiodinium-Cassiopea mutualism. Mar. Ecol. Prog. Ser. 2017, 571, 245–251. [Google Scholar] [CrossRef]
  65. Cravotta, C.A. Use of Stable Isotopes of Carbon, Nitrogen, and Sulfur to Identify Sources of Nitrogen in Surface Waters in the Lower Susquehanna River Basin, Pennsylvania; U.S. Department of the Interior, U.S. Geological Survey: Denver, CO, USA, 2002; p. 99.
  66. Elliott, E.M.; Kendall, C.; Burns, D.A.; Boyer, E.W.; Harlin, K.; Wankel, S.D.; Butler, T.J.; Carlton, R. Nitrate isotopes in precipitation to distinguish NOx sources, atmospheric processes, and source areas in the United States. In AGU Fall Meeting Abstracts; American Geophysical Union: San Francisco, CA, USA, 2006; Volume 2007, abstract id. H52B-01. [Google Scholar]
  67. Hastings, M.G.; Sigman, D.M.; Lipschultz, F. Isotopic evidence for source changes of nitrate in rain at Bermuda. J. Geophys. Res. 2003, 108, 4790. [Google Scholar] [CrossRef] [Green Version]
  68. Hastings, M.G. Studies of Reactive Nitrogen in the Atmosphere Using Global Modelling and Stable Isotope Measurements. Ph.D. Thesis, Princeton University, Princeton, NJ, USA, 2004; 217p. [Google Scholar]
  69. Arai, M.N. A Functional Biology of the Scyphozoa; Chapman & Hall: London, UK, 1997; p. 300. [Google Scholar]
  70. Balderston, W.L.; Claus, G. Study of the symbiotic relationship between Symbiodinium microadriaticum Freudenthal, a Zooxanthella and the upside down jellyfish, Cassiopea sp. Nova Hedwigia 1969, 17, 373–382. [Google Scholar]
  71. Post, D.M. Using stable isotopes to estimate trophic position: Models, methods, and assumptions. Ecology 2002, 83, 703–718. [Google Scholar] [CrossRef]
  72. Swart, P.K.; Saied, A.; Lamb, K. Temporal and spatial variation in the δ15N and δ13C of coral tissue and zooxanthellae in Montastraea faveolata collected from the Florida reef tract. Limnol. Oceanogr. 2005, 50, 1049–1058. [Google Scholar] [CrossRef] [Green Version]
  73. Alamaru, A.; Loya, Y.; Brokovich, E.; Yam, R.; Shemesh, A. Carbon and nitrogen utilization in two species of Red Sea corals along a depth gradient: Insights from stable isotope analysis of total organic material and lipids. Geochim. Cosmochim. Acta 2009, 73, 5333–5342. [Google Scholar] [CrossRef]
  74. Reynaud, S.; Martinez, P.; Houlbrèque, F.; Billy, I.; Allemand, D.; Ferrier-Pagès, C. Effect of light and feeding on the nitrogen isotopic composition of a zooxanthellate coral: Role of nitrogen recycling. Mar. Ecol. Prog. Ser. 2009, 392, 103–110. [Google Scholar] [CrossRef] [Green Version]
Figure 1. Cassiopea andromeda (Forsskål, 1775).
Biology 11 00319 g001
Figure 2. Study area: Cala of Palermo.
Biology 11 00319 g002
Figure 3. Technical features of the Megabenthos Underwater Video.
Biology 11 00319 g003
Figure 4. Sampling points per date using MUV within Cala.
Biology 11 00319 g004
Figure 5. Average density (+S.E. as vertical bar) of Cassiopea andromeda individuals for each size class per sampling date.
Biology 11 00319 g005
Figure 6. Average density (+S.E. as vertical bar) of Cassiopea andromeda individuals for each size class per depth range.
Biology 11 00319 g006
Figure 7. Average density (+S.E. as vertical bar) of Cassiopea andromeda individuals in the (a) internal sub-area and (b) intermediate sub-area; * one sampling point.
Biology 11 00319 g007
Figure 8. Key characteristics of the distribution of Cassiopea andromeda in Cala: central tendency (as a median center), spatial dispersion, and directional dispersion, calculated for June 2017, November 2018, and February 2018. The triangles indicate sampling points using MUV per date considered for the analysis.
Biology 11 00319 g008
Figure 9. Key characteristics of the distribution of Cassiopea andromeda in Cala in (a) June 2017, (b) November 2018, and (c) February 2018, calculated for each size class. The central tendency (as a median center), spatial dispersion, and directional dispersion show changes in the distribution of size classes in space and time. The triangles indicate sampling points using MUV considered for the analysis.
Biology 11 00319 g009
Figure 10. Results of the hot spot (Getis–Ord Gi*) analysis on Cassiopea andromeda records in Cala in relation to the environmental parameters (a) temperature, (b) salinity, and (c) transparency: blue and purple triangles indicate hot spots (high values) and cold spots (low values), respectively; yellow triangles indicate records with non-significant index values.
Biology 11 00319 g010
Figure 11. Box plot of δ15N in the gonads, oral arms, and umbrella of Cassiopea andromeda individuals collected at the two sites of Cala (N = 5 in Calamida and 5 in Canottieri).
Biology 11 00319 g011
Figure 12. Box plot of δ13C in the gonads, oral arms, and umbrella of Cassiopea andromeda individuals collected at the two sites of Cala (N = 5 in Calamida and 5 in Canottieri).
Biology 11 00319 g012
Figure 13. C/N molar ratio (average + S.E. as vertical bar) in the gonads, oral arms, and umbrella of Cassiopea andromeda individuals collected at the two sites of Cala.
Biology 11 00319 g013
Figure 14. Bidimensional plot of δ15N versus δ13C (average ± S.E. as vertical bar) in the gonads, oral arms, and umbrella of Cassiopea andromeda individuals; sediments, organic matter, and some benthic organisms (Branchiomma sp.; Clavelina sp.; Diodora graeca; Eupolymnia nebulosa; Felimare picta; Gammaridea; Hexaplex trunculus; Mytilidae; Phallusia sp.; Salaria pavo; and Sabella spallanzanii) collected from two sites of Cala: (a) Calamida and (b) Canottieri.
Biology 11 00319 g014
Table 1. Results of the PERMANOVA on the average density of each size class: per sampling date (SD) and depth range (DR), per sub-area (SA), and per depth range and sub-area.
Sourced.f.MSPseudo-Fp-Value
SD30.510.7640.57
DR30.390.5860.73
SD × DR80.470.6990.75
SA20.881.3420.24
DR30.250.3880.76
SA20.120.1930.78
DR × SA30.080.1330.93
Table 2. Spatial autocorrelation using Global Moran’s I (GMI) for the Cassiopea andromeda distribution in Cala performed on temperature (°C), salinity, and transparency (%). GMI expected index, variance, z-score, and p-value are also reported.
Moran’s IndexExpected IndexVariancez-Scorep-Value
Temperature (°C)0.89−0.020.006>2.58<0.01
Salinity 0.33−0.020.006>2.58<0.01
Transparency (%)0.71−0.020.005>2.58<0.01
Table 3. Average ± S.E. for temperature, salinity, and transparency corresponding to hot and cold spots, with the z-score and p-value.
Cold SpotHot Spotz-Scorep-Value
Temperature (°C)14.86 ± 1.9621.52 ± 3.30>1.96<0.01
Salinity 35.07 ± 0.1435.28 ± 0.16>1.96<0.01
Transparency (%)93 ± 13100 ± 0>1.96<0.01
Publisher’s Note: MDPI stays neutral with regard to jurisdictional claims in published maps and institutional affiliations.

