Hydrological Response to Drought Occurrences in a Brazilian Savanna Basin


Programa de Pós-Graduação em Recursos Hídricos, Departamento de Recursos Hídricos, Universidade Federal de Lavras, Lavras 3037, Brazil
*
Author to whom correspondence should be addressed.
Resources 2020, 9(10), 123; https://0-doi-org.brum.beds.ac.uk/10.3390/resources9100123
Submission received: 29 August 2020
/
Revised: 13 October 2020
/
Accepted: 14 October 2020
/
Published: 16 October 2020
(This article belongs to the Special Issue Analysis of Extreme Hydrometeorological Events)
Abstract
:The Brazilian savanna is one of the world’s 25 biodiversity hotspots. However, droughts can decrease water availability in this biome. This study aimed to analyze meteorological and hydrological droughts and their influence on the hydrological behavior in a Brazilian savanna basin. For that, hydrological indicators were calculated to analyze the hydrological behavior in the Pandeiros river basin (PRB). The Standardized Precipitation Index (SPI) and Standardized Streamflow Index (SSI) were calculated for the hydrological year and rainy season from 1977 to 2018. The propagation of the meteorological to hydrological drought was studied by means of the Pearson coefficient of correlation between the SSI and SPI with 0, 3, 6, 9, and 12-month lags. A longer meteorological drought was observed from 2014/15 to 2017/18 which caused a reduction in the groundwater recharge, besides potentially reducing the ecological functions of the Brazilian savanna. This drought was intensified by an increase in the average annual temperature, resulting in the increasing of evapotranspiration. Regarding drought propagation, there is no significant difference among the coefficients of correlation from 0 to 6-month lags. For the lags of 9 and 12 months, the correlation decreases, indicating a greater influence of the current rainy season than the past ones.
1. Introduction
The Brazilian savanna (known as “Cerrado”) is the second-largest biome in South America, covering an area of 2 million km2. It is one of the world’s 25 biodiversity hotspots due to the endemic species concentration and the high degree of threat [1,2]. Moreover, this biome plays an important role in providing water, maintaining its ecohydrological functionality for industry, agriculture, navigation, tourism, and hydroelectricity in several Brazilian and South American basins, including the São Francisco river basin (SFRB) [3]. Therefore, it is important to conduct hydrological studies for better assisting water resource management in the Brazilian savanna aiming to maintain its eco-hydrological services [4].
Hydrological indicators, such as the aquifer restitution rate (ARR) and the surface runoff rate (SRR), have been widely used to evaluate the hydrological behavior of Brazilian river basins [4,5,6]. Nevertheless, during extreme events, for example, floods and droughts, the basin may present different behavior. Extreme drought events can abnormally reduce the streamflow, agricultural production, lake and reservoir levels, and groundwater recharge [7].
Recently, several studies on drought have been developed in Brazil focused on meteorological droughts [8,9,10]. According to Van Loon [7], this drought is associated with a deficiency in precipitation, and possibly an increase in evapotranspiration. However, few studies have attempted to analyze the influence of meteorological drought on the streamflow (hydrological drought).
Although the origin of hydrological drought is commonly related to meteorological drought, other factors can influence it, highlighting lithology, vegetation, and human influence [11]. Junqueira et al. [12] reported a longer hydrological drought than meteorological ones from 2015 to 2017 due to the reduction in groundwater recharge in previous seasons in the Tocantins river basin, Brazil. As a result, the effects on irrigation, hydroelectricity, and urban supply were prolonged.
To analyze the occurrence, duration, and intensity of droughts, several indexes have been developed in recent years. The Standardized Precipitation Index (SPI) [13] has been widely used in Brazil and worldwide [12,14,15,16]. According to the World Meteorological Organization (WMO) [17], this index is considered standard due to its accuracy and simplicity. Several indexes have emerged from the SPI, such as the Standardized Streamflow Index (SSI) [11], a hydrological drought index with the same characteristics as the SPI. These indexes represent anomalies from a normal situation and allow for comparison in different regions [7].
To calculate a standardized index, a Probability Distribution Function (PDF) is required. McKee et al. [13] applied the two parameters of Gamma distribution for SPI. Nevertheless, to be more accurate in estimating droughts, Vicente-Serrano et al. [11] suggested it the most suitable PDF rather than adopting a single distribution for all situations. An inappropriate PDF may over- or underestimate the magnitude of the drought, as the extreme events are in the tail of the PDF [16]. Therefore, researchers have analyzed several PDFs to calculate standardized drought indexes and found different results worldwide [11,18,19].
In this context, this study aimed to analyze the occurrence, intensity, duration, and propagation of meteorological to hydrological droughts and their influence on the hydrological behavior in a Brazilian savanna basin.
2. Materials and Methods
2.1. Study Area
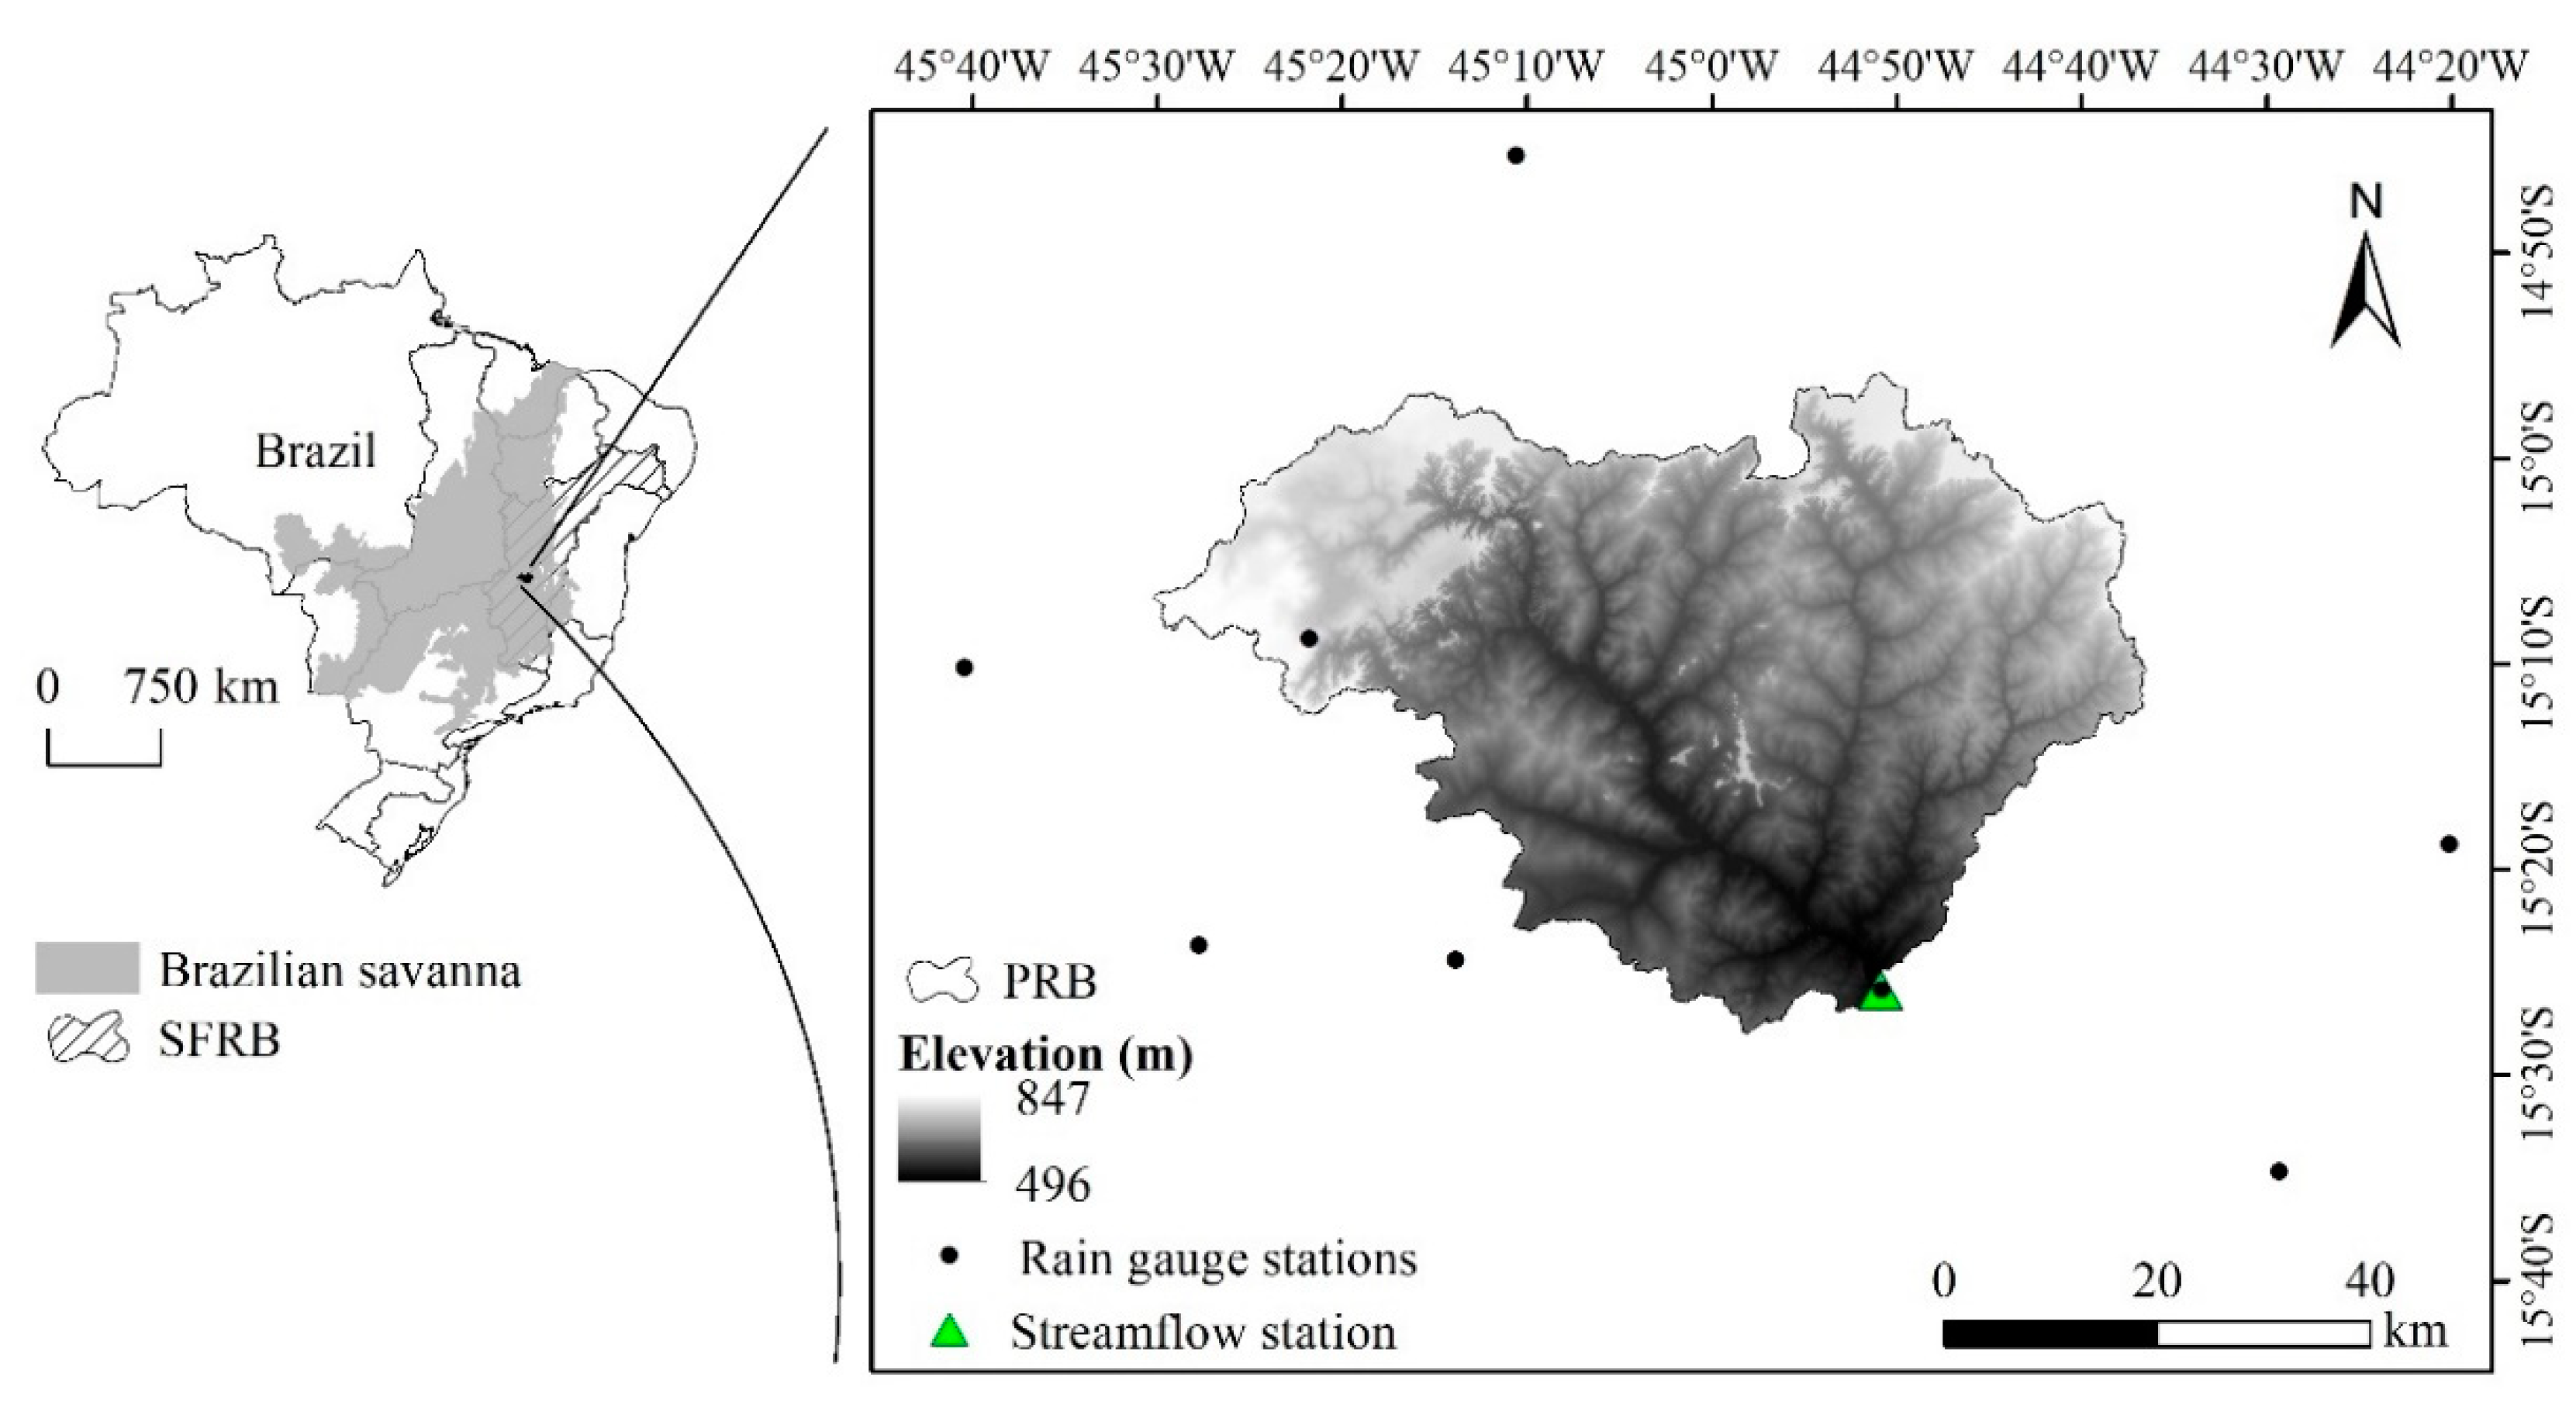
The Pandeiros river basin (PRB), located in the north Minas Gerais State, is inserted in the Brazilian savanna and has an area of 3220 km2. Due to its ecological relevance for the Brazilian savanna and for the SFRB, the Pandeiros River Environmental Protection Area was created through State Law n° 11,901 to protect the native fish species, which represent 70% of the reproduction and development fish from the middle São Francisco River [20,21]. Figure 1 shows the PRB location, the streamflow and rain gauge stations, and the Digital Elevation Model (DEM) ALOS (Advanced Land Observing Satellite) PALSAR (Phased Array L-band Synthetic Aperture Radar), with a spatial resolution of 12.5 m.
The elevation ranges from 496 to 847 m, with an average of 677 m. The climate, according to Köppen type-climate classification, is Aw (tropical with wet summers and dry winters) [22]. The average precipitation for the hydrological year (October to September) is 1085 mm, of which 92% occurs during the rainy period (October to March).
2.2. Input Data
Daily streamflow and precipitation datasets were obtained from the Brazilian National Water Agency (ANA) from October 1977 to September 2018 (41 hydrological years), using only those with up to 10% of gaps, aiming to meet the data quality standards for carrying out drought analysis [19]. The double mass curve was used to analyze the homogeneity and consistency of the precipitation series [25]. Then, gap filling was carried out on a monthly time scale using the Inverse Squared Distance Weighted method. The basin-scale precipitation was obtained using the area-weighted procedure with the eight rain gauge stations available (Figure 1) [26].
2.3. Hydrological Behavior
2.3.1. Baseflow
To appraise the hydrological behavior of the PRB, the baseflow was taken using the recursive digital filters method, which divides the streamflow into direct surface runoff and baseflow (Equation (1)) [27].
where y is the total streamflow (m3 s−1); f is the direct surface runoff (m3 s−1); b is the baseflow (m3 s−1); and k is the time step (day).
For bk calculation, the methodology proposed by Eckhardt [27] for the general form of the recursive filter with one parameter is given by Equation (2).
where BFImax is the maximum value of the baseflow index that can be assumed equal to 0.8 as recommended by Eckhardt [27] for perennial streams; and a corresponds to the groundwater recession constant (0.8925), dimensionless. This model assumes that the aquifer outflow is linearly proportional to its storage, which means an exponential recession of baseflow during the period without groundwater recharge [27].
2.3.2. Hydrological Indicators
The hydrological indicators adopted to study the hydrological behavior in the PRB are presented in Table 1.
BFI is the long-term ratio between baseflow and total streamflow and the closer to 1 it is, the greater the contribution of baseflow to the streamflow. The ARR was obtained by the long-term ratio between baseflow and precipitation and indicates the precipitation rate that contributes to aquifer restitution. The evapotranspiration was calculated based on annual water balance (ET = precipitation − total streamflow, in mm), and then the ETR was calculated as ET divided by precipitation. The SRR consists of the long-term ratio between direct surface runoff (SR = total streamflow − baseflow) and precipitation. The α and Af are described in Equations (3) and (4). According to Silva et al. [28], α values close to zero indicate higher natural regularization capacity.
where Q0 was the streamflow at the beginning of the recession, in m3 s−1; Qt is the streamflow after t days of the beginning of the recession, in m3 s−1; Qi is the streamflow at the end of the hydrological year, in m3 s−1; and Ab is the basin’s area, in km2.
The Qmean was obtained from the average of the daily streamflow, while the Qmin and Qmax were obtained from the average of the minimum and maximum daily annual streamflow, respectively. To obtain Q7,10, 10 PDFs fitted using the L-moments were analyzed [29]: the 3-parameter log-normal (LN3), 3-parameter Pearson (PE3), the Gumbel extreme value, the Generalized Extreme Values (GEV), Gamma, Weibull, the 4-parameter Kappa, the 5-parameter Wakeby, the generalized logistic (GLO), and the generalized Pareto (GPA). The PDF was then selected based on the best fitting according to the Anderson–Darling (AD) test. The Q90% and Q95% were obtained based on the flow-duration curve. The SY is the result of the calculated streamflows (Q90%, Q95%, etc.) divided by the basin’s area, which allows comparing them among different regions or sub-basins.
2.4. Meteorological and Hydrological Droughts
To analyze the occurrence, intensity, and duration of the droughts in the PRB, the SPI [13] and SSI [11] were calculated by year, considering the hydrological year (October to September), and for half-year time scales, considering the rainy season (October to March).
For the SPI and SSI calculation, the basin-scale precipitation and streamflow series, respectively, were accumulated for the studied period and a PDF was fitted. Following that, they were transformed into a normal distribution, with mean and variance, respectively, equal to zero and one. The analysis of the most suitable PDF was performed in a similar way to the Q7,10. This procedure, according to Vicente-Serrano et al. [11], allows higher precision in obtaining drought indexes. Afterward, the indexes were classified following the WMO [17] classification (Table 2).
The Pearson correlation of the coefficient (r) with a statistical significance of 5% (α = 0.05) was used to analyze the correlation between the SPI and SSI on different time scales. In addition, to assess the propagation of meteorological to hydrological drought, the correlations between the 0, 3, 6, 9, and 12-month lags with both the SSI and SPI were performed on an annual scale.
3. Results and Discussion
3.1. Hydrological Behavior
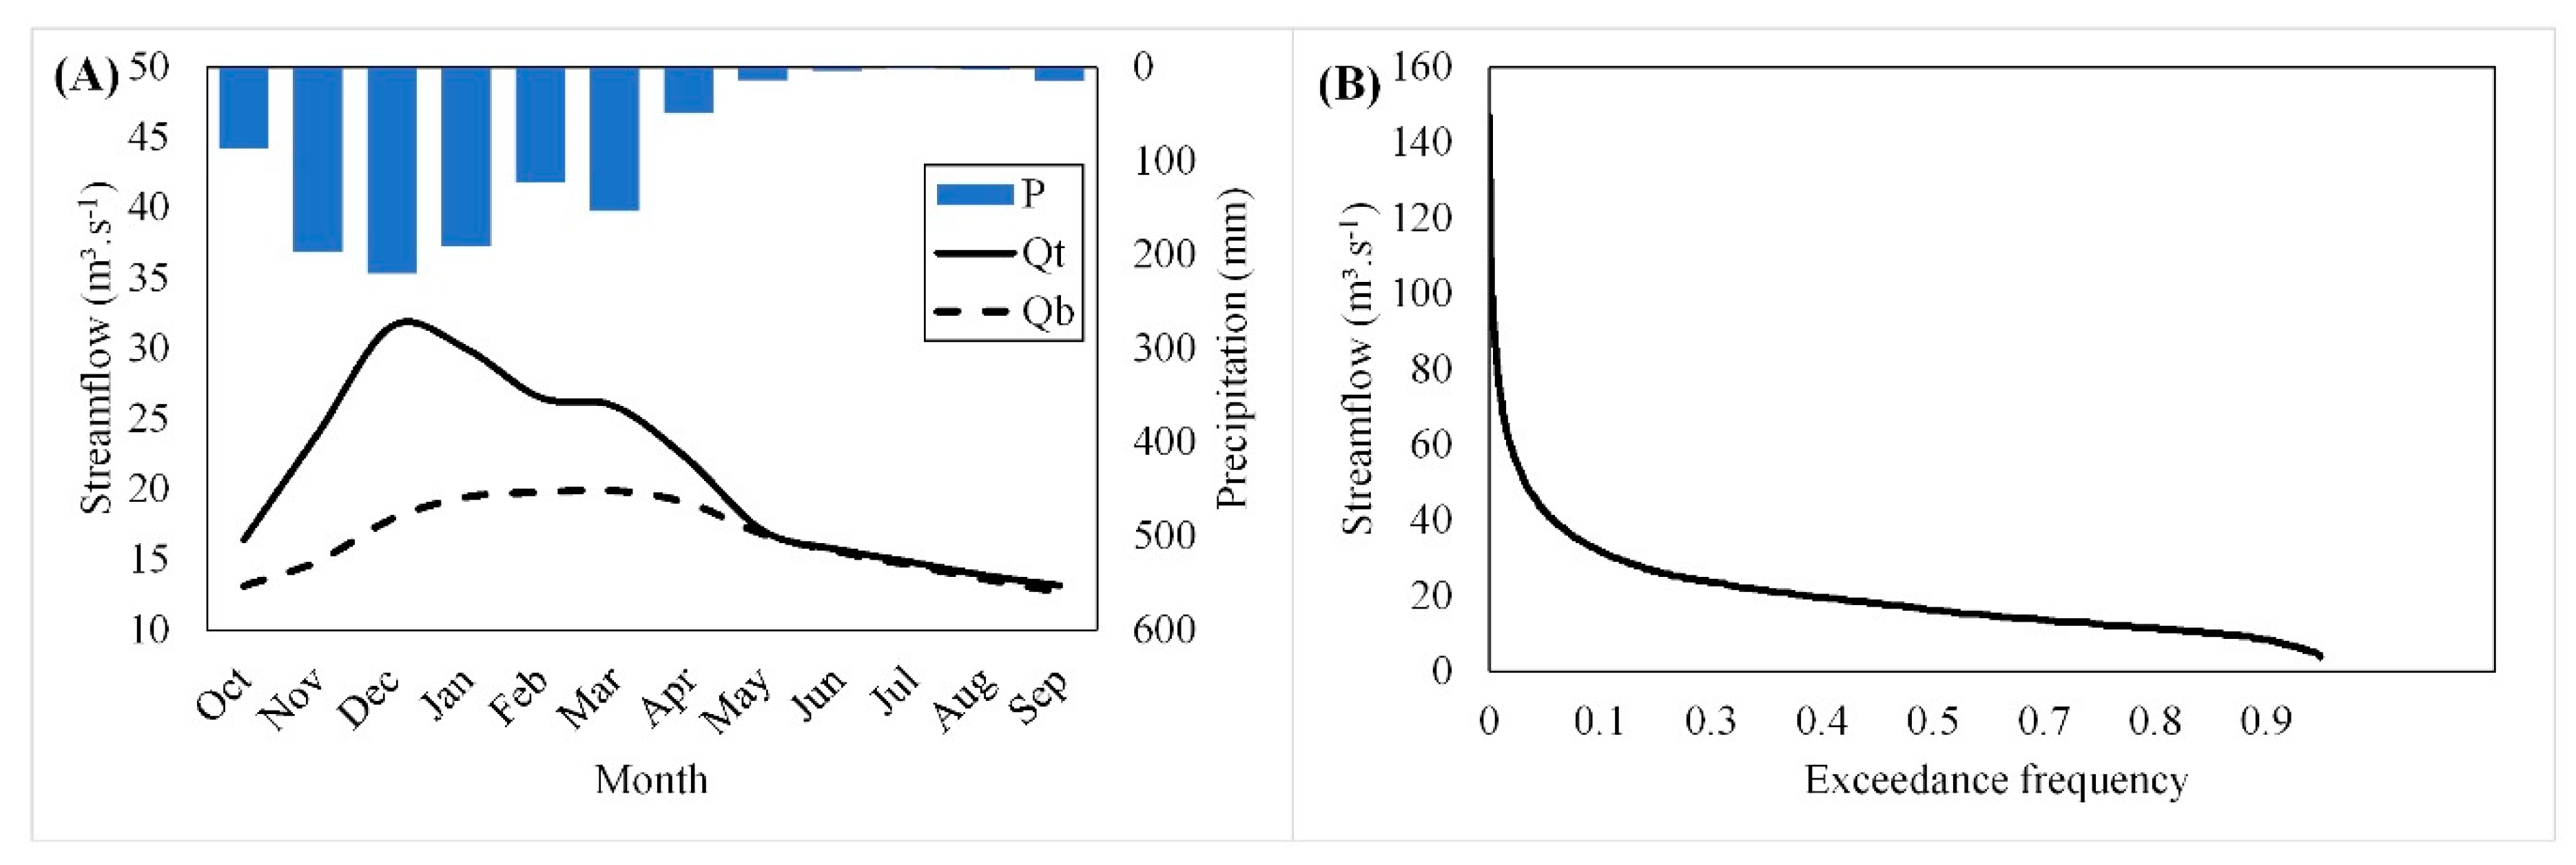
Figure 2A presents the average monthly precipitation, streamflow, and baseflow for the PRB. Surface runoff occurs predominantly in the rainy season, whereas in the dry season, it is the baseflow. The BFI indicator was equal to 0.80, which is a characteristic of perennial rivers [27], showing the importance of baseflow over the total streamflow in the studied basin. The ARR for the PRB was 14.9%, a high value when considering that 81.4% of the precipitation returns to the atmosphere by evapotranspiration (ETR). Besides, only 3.7% of the total precipitation is converted to surface runoff (SRR). The high ARR and low SRR values are associated with the predominance of Latosol, which is a deep soil with a high infiltration capacity [30], occurring in a flatter topography (average slope of 5.9%). Moreover, the PRB is part of an environmental protection area and its vegetation has been preserved, which favors the soil-water infiltration and reduces direct surface runoff.
The SYmean obtained for the PRB was 6.46 L s−1 km−2, while the SYmin and SYmax were 3.6 and 24.8 L s−1 km−2, respectively. These values are low when compared to others obtained for Brazilian savanna basins such as by Rodrigues et al. [4] in the Manual Alves da Natividade river basin. However, the ETR obtained by Rodrigues et al. [4] was 69.1%, lower than that obtained in the PRB (81.4%). Therefore, the high evapotranspiration contributed to the reduction of the streamflow in the PRB.
Regarding Q7,10 (6.9 m3 s−1), for the streamflow that is used as a basis for granting water resources in the region, the PDF that presented the best fitting was Wakeby, with AD equal to 0.30. Amorim et al. [29] found a similar result in the Mortes River, Southeastern Brazil, demonstrating the satisfactory performance of this PDF for the Q7 series. The SY7,10 was equal to 2.1 L s−1 km−2, similar to that obtained by Silva et al. [6] in the Minas Gerais State. According to the Euclydes et al. [31] classification, the PRB has a high natural regularization capacity once SY7,10 corresponds to 33% of SYmean, which follows the α value close to zero (0.0073). The α is close to that obtained by Freitas and Bacellar [32] in sub-basins of the upper São Francisco River and by Junqueira et al. [12] in the Tocantins river basin. From the flow-duration curve (Figure 2B), Q90% and Q95% was equal to 9.7 and 7.7 m3 s−1, respectively, which generated SY90 equal to 3.0 L s−1 km−2 and SY95 equal to 2.4 L s−1 km−2, higher than SY7,10.
3.2. Meteorological and Hydrological Droughts
Among the PDFs analyzed, Weibull presented a better fit in two historical series, whereas Wakeby showed better performance in six. Although McKee et al. [13] have used Gamma for the SPI calculation, this PDF did not produce the best fit in either case. GPA presented unsatisfactory results for the basin-scale precipitation and streamflow series, not being approved in the AD test in both time scales. Table 3 presents the AD test results for the basin-scale precipitation and streamflow series for the hydrological years and rainy seasons obtained from each PDF.
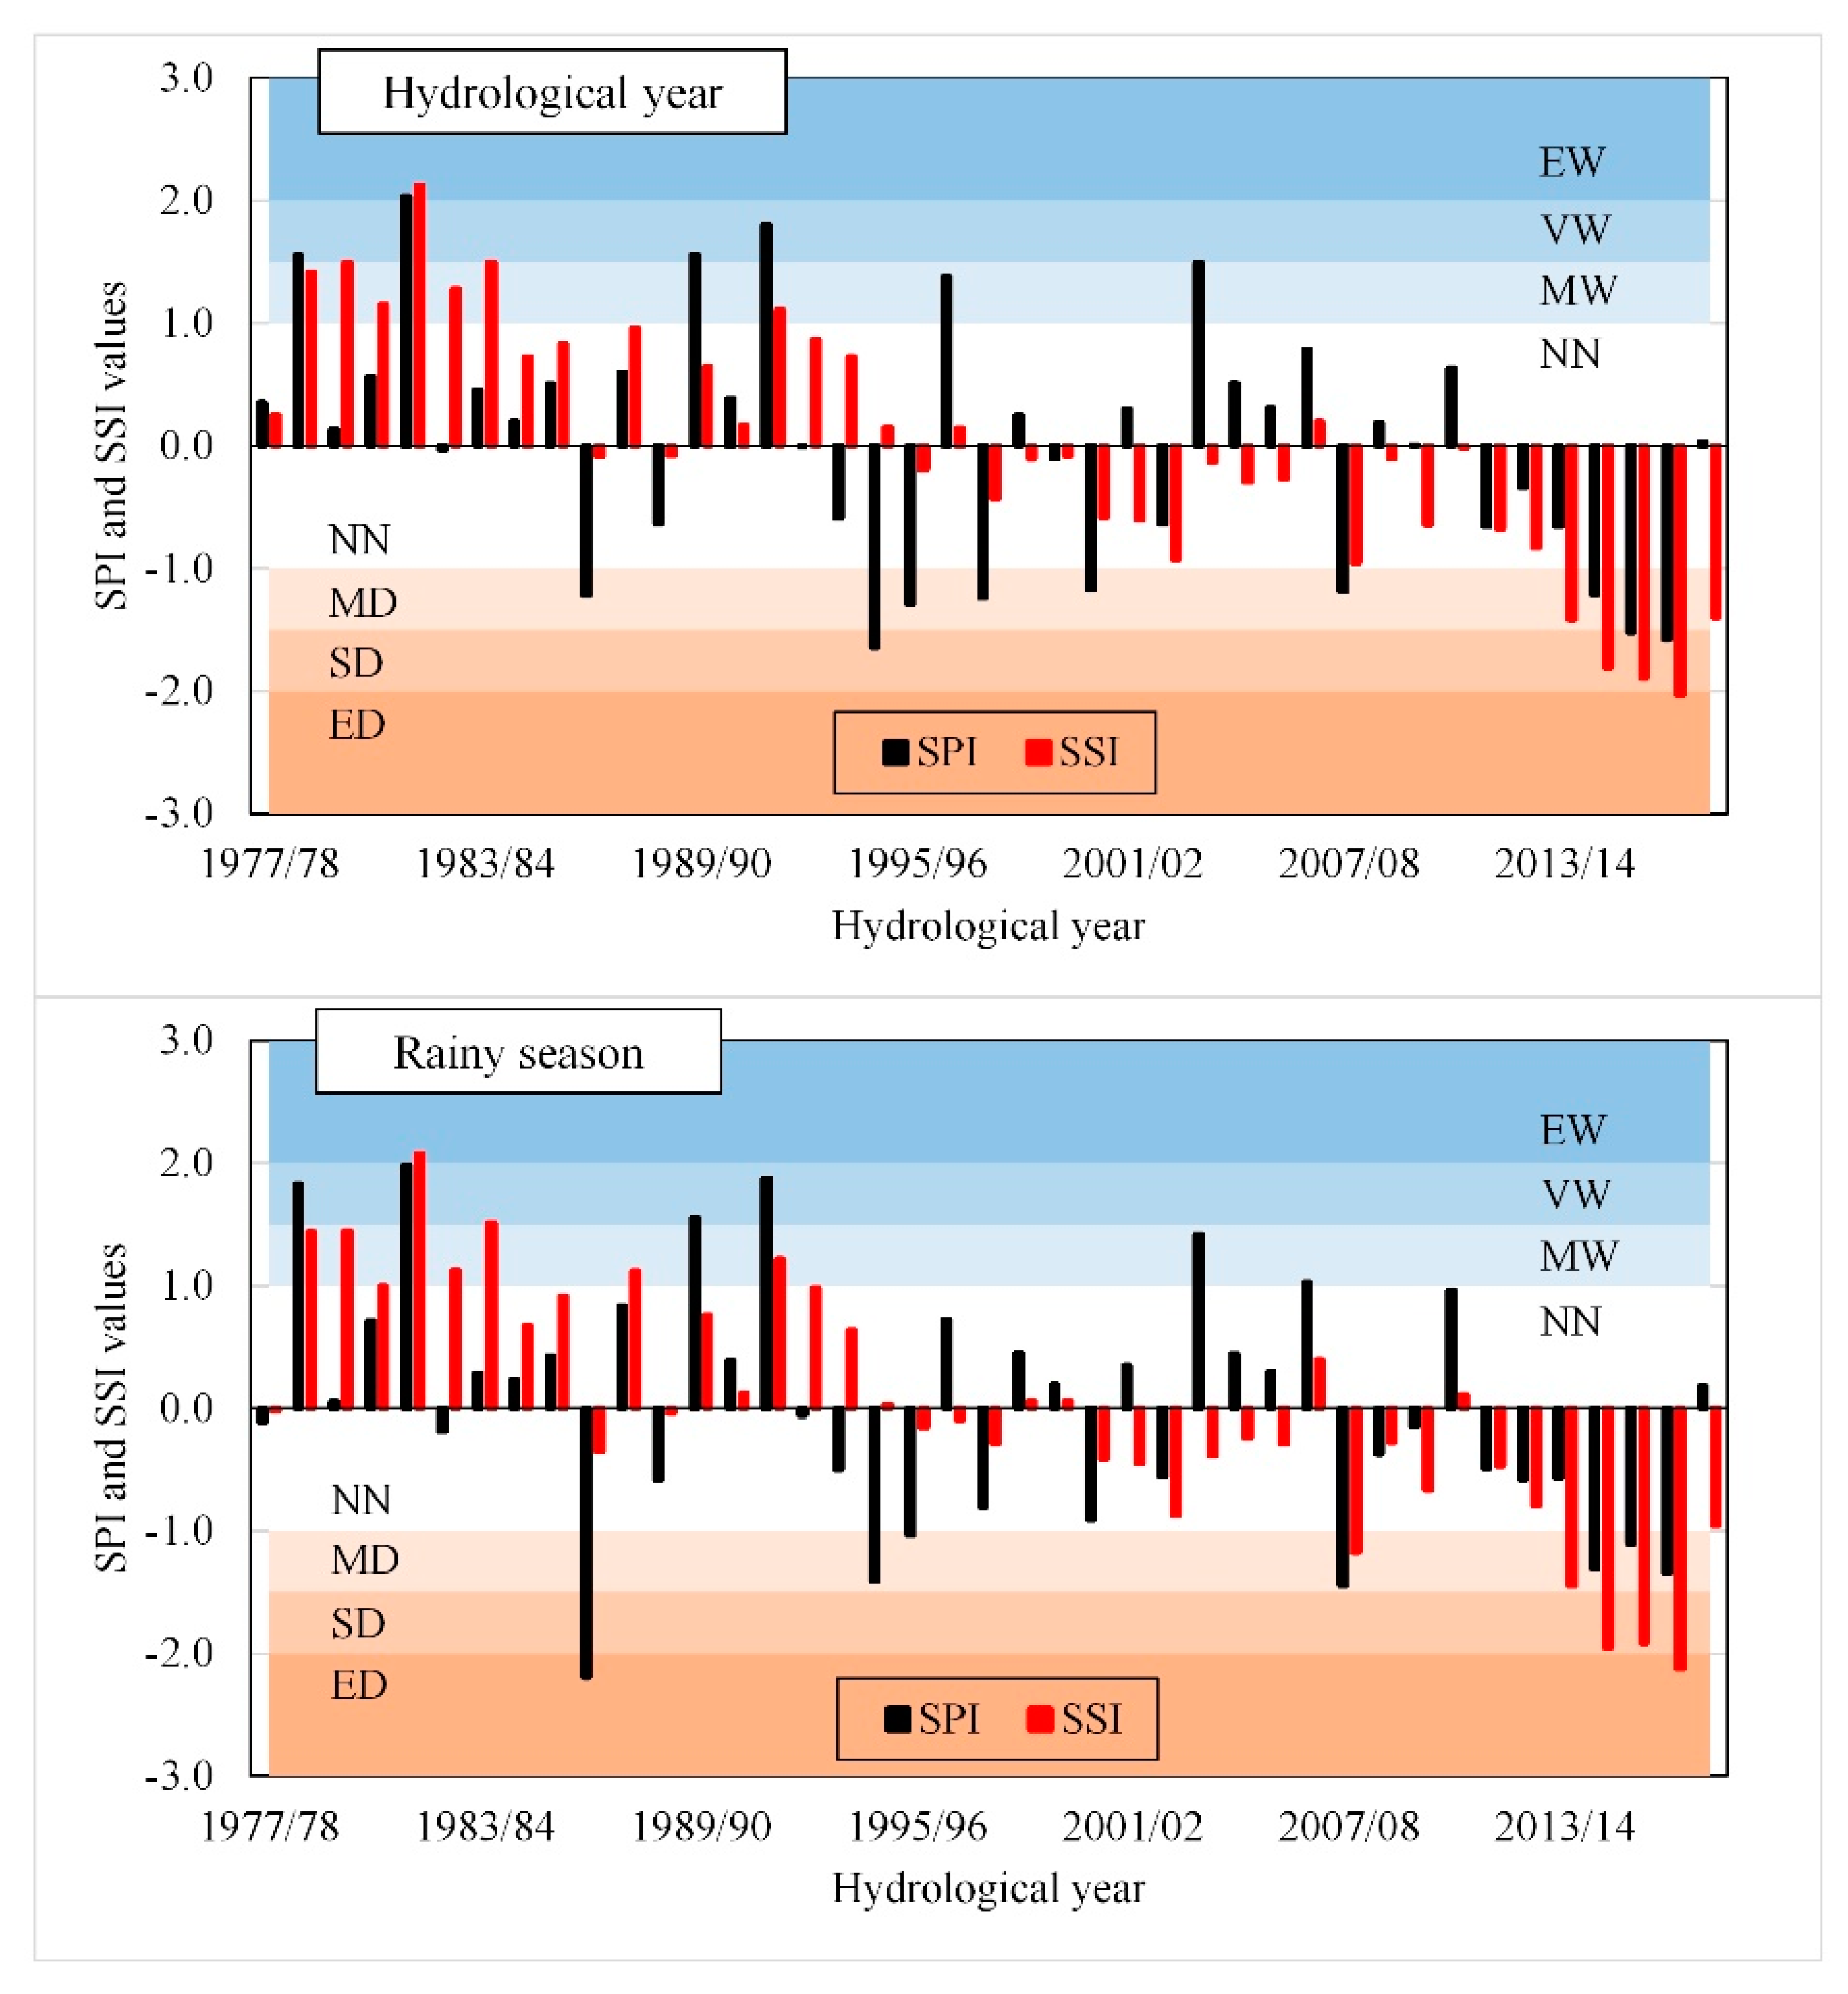
The SPI and SSI results for the hydrological years and rainy seasons, calculated according to the most suitable PDF, can be observed in Figure 3. There is an agreement between the SPI values for the hydrological year and the rainy season (r = 0.96). A similar result is observed in the SSI, where r = 0.99. However, when comparing the SPI against the SSI at the two-time scales, the correlation decreases (r = 0.64). This is due to the complexity of the factors associated with the hydrological cycle in the basins, where the response to precipitation depends on factors such as vegetation, lithology, and topography [11].
The most significant meteorological droughts occurred during the hydrological years of 1986/87, 1994/95, 1995/96, 1997/98, 2007/08, and between 2014/15 and 2016/17 in the PRB. Similar behavior was observed for the rainy season, however, with some differences concerning intensity. Although the dry season accounted for only 8% of annual precipitation, the total precipitation in this period for the hydrological year of 1986/87 was 171.1 mm, approximately twice the average (89.5 mm). Therefore, the attenuation of drought on a hydrological year scale may have occurred due to increased precipitation in the dry season.
As a result of some years with below-average precipitation, the hydrological years between 2013/14 to 2017/18 presented a long and intense hydrological drought. In these years, there was a high reduction in the long-term mean streamflow, from 20.8 m3 s−1 in the whole period to 10.3 m3 s−1 for the drought period (2013/14 to 2017/18), which is lower than the minimum streamflow for the entire studied period (11.5 m3 s−1). Also, there was a significant reduction in ARR (14.9 to 9.2%), SSR (3.7 to 2.4%), SYmean (6.5 to 3.2 L s−1 km−2), SYmin (3.6 to 1.5 L s−1 km−2), and SYmax (24.8 to 17.4 L s−1 km−2).
Besides the reduction in precipitation, the increase in temperature and, consequently, in evapotranspiration, contributed to the hydrological drought intensification, as highlighted by Van Loon [7] and Junqueira et al. [12]. According to data obtained from the Brazilian National Institute of Meteorology (INMET) using a weather station close to the basin (Januária station), the daily annual average temperature from 1977/78 to 2012/13 was 23.4 °C, however, from 2013/14 to 2017/18 there was an increase of 1.3 °C. Thus, the ETR in this period was equal to 88.4%, higher than the average observed in the studied period (81.4%).
Studies suggest an increase in the intensity and frequency of droughts by the end of the century worldwide due to atmospheric evaporative demand increases, reducing water availability, soil water storage, and agricultural production [15,33,34]. Yet, Santos et al. [35] observed a reduction in the water table in the PRB wetlands, downstream of the streamflow gauge station of this study, due to a reduction in precipitation and an increase in temperature in recent years, affecting vegetation dynamics in the wetland.
During the period 2013/14 to 2017/18, similar events were found in other Brazilian regions such as the Doce river basin [14], Tocantins river basin [12], Northeastern Brazil [36], Amazon [36], Paraná river basin [37], the metropolitan region of São Paulo [38], and Ceará State [9], affecting the hydropower generation and urban supply. Besides, droughts can affect the ecological functions of the Brazilian savanna [34], as well as reduce the native fish species and increase exotic species [39].
According to Azevedo et al. [40], after a long period of drought, the Sobradinho hydropower plant reservoir, located in SFRB and responsible for almost 60% of the water resources in Northeastern Brazil, presented a reduction of up to 50% in surface water in 2015/16. In that year, hydropower generation was only 170 MW (its total installed power is 1050 MW).
Some researchers associate drought occurrence with anomalies in sea surface temperatures in the Pacific and the Atlantic Oceans [9,12,36]. Santos et al. [41] reported that anomalies in the El Niño-Southern Oscillation (ENSO) phenomenon are related to the cycle of meteorological droughts in the region in which the PRB is located, however, the Pacific Decadal Oscillation (PDO) influence has not been identified as having a clear influence on drought events in this region. El Niño (positive phase of the ENSO) occurred during all the years in which there was a meteorological drought in the PRB, except for 2007/08 and 2016/17, when the La Niña phenomenon (negative phase of the ENSO) took place for some months. Junqueira et al. [12] and Marengo et al. [36] also found the influence of the ENSO on the drought occurrences in the Tocantins river basin and Northeastern Brazil. According to Garreaud et al. [42], although the PDO-related precipitation and temperature anomalies have the same behavior as the ENSO in South America, their effects seem to be less intense in the PRB region.
3.3. Drought Propagation
Table 4 presents the correlation results between the SSI and SPI with a lag of 0, 3, 6, 9, and 12 months, both on an annual scale. There is no difference between the r values from a 0 to 6-month lag. However, a higher correlation was obtained for the 3-month lag, indicating a lag in the propagation of the meteorological drought to the hydrological one. A similar result was found by Rodrigues et al. [34] in sub-basins of the Tocantins River, where the correlation between the indices was higher in the period from 0 to 3 months.
Furthermore, the correlation is lower for 9 and 12-month lags, that is, changes in streamflow are more influenced by the current than the past rainy season. According to Van Loon [7], rainfall deficit in the rainy season can influence following dry season conditions. In cases of longer meteorological drought, there may be a reduction in groundwater recharge, affecting the streamflow even after the meteorological conditions return to normal, as also reported by Jesus et al. [14] in the Doce river basin and by Junqueira et al. [12] in the Tocantins river basin. As an example, in the hydrological year 2017/18, the SPI was classified as near normal, however, the SSI was classified as moderately dry. This increase in precipitation from one year to the next attenuated the hydrological drought but was not enough to fill the recharge deficit from previous years.
According to Junqueira et al. [12], baseflow depends on the precipitation/recharge rate in previous months, as well as on aquifer characteristics. As the streamflow in the PRB is strongly influenced by baseflow (BFI = 0.80), the deficiency in groundwater recharge has a prolonged effect on the streamflow. This deficiency is confirmed by the Af values, where, from 2013/14 to 2017/18, the average was 21.1 mm, less than half the historical average (48.9 mm). The recharging deficiency increased during the drought until it reached its lowest value at the end of 2016/17 (Af = 16.3 mm). After the 2017/18 hydrological year, there was a slight recovery of water storage in the aquifer (Af = 20.0 mm) due to the increase in precipitation, however, it remained below the historical average.
4. Conclusions
The SPI allowed us to identify the main droughts that hit the PRB (1986/87, 1994/95, 1995/96, 1997/98, 2000/01, 2007/08, 2014/15, 2015/16, and 2016/17). These events may be related to the occurrence of macro-scale climatic phenomena such as the ENSO, as observed in other Brazilian regions. Although the droughts observed in hydrological years presented a high correlation with the drought during the rainy season, the dry season can occasionally influence the drought intensity.
The hydrological drought from 2013/14 to 2017/18 occurred mainly due to a prolonged reduction in precipitation, reducing water availability, and affecting the fish reproduction in the PRB and SFRB and the ecological functions of the Brazilian savanna. In addition to the reduction in precipitation, the increase in temperature and, consequently, in evapotranspiration contributed to the intensification of the hydrological drought in the cited period.
Based on the hydrological indicators, a high influence of baseflow on the total streamflow (BFI = 0.8) and evapotranspiration (81.4% of the total precipitation) on the hydrological behavior of the PRB was observed. Moreover, the analysis of hydrological indicators highlighted the influence of droughts on groundwater recharge, evidenced by a reduction in Af values.
The propagation of meteorological to hydrological drought occurred in shorter lags (0 to 6 months), with greater correlation in 3-month lag. However, for the lags of 9 and 12 months, the correlation decreased, indicating that changes in streamflow are more influenced by the current than previous rainy seasons.
Author Contributions
Conceptualization, R.J., M.R.V. and J.d.S.A.; methodology, R.J., M.R.V. and J.d.S.A.; software, R.J. and J.d.S.A.; validation, R.J.; formal analysis, R.J. and M.R.V.; investigation, R.J.; resources, R.J., M.R.V. and J.d.S.A.; data curation, R.J. and J.d.S.A.; writing—original draft preparation, R.J.; writing—review and editing, R.J., M.R.V., J.d.S.A. and C.R.d.M.; visualization, R.J. and M.R.V.; supervision: M.R.V.; project administration, R.J., M.R.V. and J.d.S.A.; funding acquisition, R.J., M.R.V. and J.d.S.A. All authors have read and agreed to the published version of the manuscript.
Funding
This study was funded by the Coordenação de Aperfeiçoamento de Pessoal de Nível Superior—CAPES (grant numbers 88882.446869/2019-01 and 88882.446854/2019-01) and the Conselho Nacional de Desenvolvimento Científico e Tecnológico (CNPq) with the grant for authors, and Universidade Federal de Lavras (UFLA) through public notice PRPG/UFLA n° 046/2020 with the support for publication.
Acknowledgments
We greatly acknowledge the Brazilian National Water Agency (ANA) and the Brazilian National Institute of Meteorology (INMET) for providing the input data to develop this study.
Conflicts of Interest
The authors declare no conflict of interest.
References
- Myers, N.; Mittermeier, R.A.; Mittermeier, C.G.; da Fonseca, G.A.B.; Kent, J. Biodiversity hotspots for conservation priorities. Nature 2000, 403, 853–858. [Google Scholar] [CrossRef] [PubMed]
- Hunke, P.; Mueller, E.N.; Schröder, B.; Zeilhofer, P. The Brazilian Cerrado: Assessment of water and soil degradation in catchments under intensive agricultural use. Ecohydrology 2015, 8, 1154–1180. [Google Scholar] [CrossRef]
- Oliveira, P.T.S.; Nearing, M.A.; Moran, M.S.; Goodrich, D.C.; Wendland, E.; Gupta, H.V. Trends in water balance components across the Brazilian Cerrado. Water Resour. Res. 2014, 50, 7100–7114. [Google Scholar] [CrossRef] [Green Version]
- Rodrigues, J.A.M.; Andrade, A.C.O.; Viola, M.R.; Morais, M.A.V. Indicadores hidrológicos para a gestão de recursos hídricos na bacia hidrográfica do rio Manuel Alves Da Natividade, Tocantins. Sci. Agrar. 2016, 16. [Google Scholar] [CrossRef]
- Mello, C.R.; Viola, M.R.; Beskow, S. Vazões máximas e mínimas na região do Alto Rio Grande, MG. Ciência e Agrotecnologia 2010, 34, 494–501. [Google Scholar] [CrossRef] [Green Version]
- Silva, L.A.; Silva, A.M.; Coelho, G.; Pinto, L.C.; Eduardo, E.N. Minimum and reference discharges and specific yield for the state of Minas Gerais, Brazil. Rev. Bras. Ciencias Agrar. 2017, 12, 543–549. [Google Scholar] [CrossRef] [Green Version]
- Van Loon, A.F. Hydrological drought explained. Wiley Interdiscip. Rev. Water 2015, 2, 359–392. [Google Scholar] [CrossRef]
- Rocha Júnior, R.L.; Santos Silva, F.D.; Costa, R.L.; Gomes, H.B.; Pinto, D.D.C.; Herdies, D.L. Bivariate assessment of drought return periods and frequency in brazilian northeast using joint distribution by copula method. Geosciences 2020, 10, 135. [Google Scholar] [CrossRef] [Green Version]
- Pontes Filho, J.D.; Souza Filho, F.D.A.; Martins, E.S.P.R.; de Studart, T.M.D.C. Copula-Based Multivariate Frequency Analysis of the 2012–2018 Drought in Northeast Brazil. Water 2020, 12, 834. [Google Scholar] [CrossRef] [Green Version]
- Juliani, B.H.T.; Okawa, C.M.P. Application of a standardized precipitation index for meteorological drought analysis of the semi-arid climate influence in Minas Gerais, Brazil. Hydrology 2017, 4, 26. [Google Scholar] [CrossRef] [Green Version]
- Vicente-Serrano, S.M.; López-Moreno, J.I.; Beguería, S.; Lorenzo-Lacruz, J.; Azorin-Molina, C.; Morán-Tejeda, E. Accurate Computation of a Streamflow Drought Index. J. Hydrol. Eng. 2012, 17, 318–332. [Google Scholar] [CrossRef] [Green Version]
- Junqueira, R.; Viola, M.R.; de Mello, C.R.; Vieira-Filho, M.; Alves, M.V.G.; Amorim, J.d.S. Drought severity indexes for the Tocantins River Basin, Brazil. Theor. Appl. Climatol. 2020, 140. [Google Scholar] [CrossRef]
- McKee, T.B.; Doesken, N.J.; Kleist, J. The relationship of drought frequency and duration to time scales. Proc. Conf. Appl. Climatol. 1993, 17, 179–183. [Google Scholar]
- Jesus, E.T.; Amorim, J.S.; Junqueira, R.; Viola, M.R.; Mello, C.R. Meteorological and hydrological drought from 1987 to 2017 in Doce River Basin, Southeastern Brazil. Rev. Bras. Recur. Hídricos 2020, 25, 1–12. [Google Scholar] [CrossRef]
- Vicente-Serrano, S.M.; Domínguez-Castro, F.; McVicar, T.R.; Tomas-Burguera, M.; Peña-Gallardo, M.; Noguera, I.; López-Moreno, J.I.; Peña, D.; El Kenawy, A. Global characterization of hydrological and meteorological droughts under future climate change: The importance of timescales, vegetation-CO2 feedbacks and changes to distribution functions. Int. J. Climatol. 2020, 40, 2557–2567. [Google Scholar] [CrossRef]
- Sienz, F.; Bothe, O.; Fraedrich, K. Monitoring and quantifying future climate projections of dryness and wetness extremes: SPI bias. Hydrol. Earth Syst. Sci. 2012, 16, 2143–2157. [Google Scholar] [CrossRef] [Green Version]
- WMO—World Meteorological Organization. Standardized Precipitation Index User Guide; WMO-No. 1090; World Meteorological Organization: Geneva, Switzerland, 2012; Volume 21, p. 24. [Google Scholar]
- Pieper, P.; Düsterhus, A.; Baehr, J. Global and regional performances of SPI candidate distribution functions in observations and simulations. Hydrol. Earth Syst. Sci. Discuss. 2020, 1–33. [Google Scholar] [CrossRef] [Green Version]
- Jahangir, M.H.; Abolghasemi, M. Determining the most appropriate probability distribution function for calculate and compare the SPEI and SPI drought index in Tehran. Desert Ecosyst. Eng. J. 2019, 8, 1–16. [Google Scholar] [CrossRef]
- Santos, U.; Silva, P.C.; Barros, L.C.; Dergam, J.A. Fish fauna of the Pandeiros River, a region of environmental protection for fish species in Minas Gerais state, Brazil. Check List 2015, 11, 1507. [Google Scholar] [CrossRef] [Green Version]
- Nunes, Y.R.F.; Azevedo, I.F.P.; Neves, W.V.; Veloso, M.D.D.M.; Souza, R.d.A.; Fernandes, G.W. Pandeiros: O Pantanal Mineiro. MG Biota 2009, 2, 4–17. [Google Scholar]
- Alvares, C.A.; Stape, J.L.; Sentelhas, P.C.; de Moraes Gonçalves, J.L.; Sparovek, G. Köppen’s climate classification map for Brazil. Meteorol. Zeitschrift 2013, 22, 711–728. [Google Scholar] [CrossRef]
- Minas Gerais State Environmental Foundation (FEAM) Mapa de solos do Estado de Minas Gerais 2010. Available online: http://www.feam.br/-qualidade-do-solo-e-areas-contaminadas/mapa-de-solos (accessed on 6 November 2019).
- Brazilian Institute of Geography and Statistics (IBGE) Mapa de Cobertura e Uso da Terra do Brasil 2010 2018. Available online: https://www.ibge.gov.br/geociencias/informacoes-ambientais/cobertura-e-uso-da-terra/15831-cobertura-e-uso-da-terra-do-brasil.html?edicao=16023&t=sobre (accessed on 7 November 2019).
- Gao, P.; Li, P.; Zhao, B.; Xu, R.; Zhao, G.; Sun, W.; Mu, X. Use of double mass curves in hydrologic benefit evaluations. Hydrol. Process. 2017, 31, 4639–4646. [Google Scholar] [CrossRef]
- Gao, C.; Li, X. Precipitation thresholds of drought disaster for maize in areas in front of Bengbu Sluice, Huaihe River Basin, China. Water 2018, 10, 1395. [Google Scholar] [CrossRef] [Green Version]
- Eckhardt, K. How to construct recursive digital filters for baseflow separation. Hydrol. Process. 2005, 19, 507–515. [Google Scholar] [CrossRef]
- Silva, R.F.G.; Bacellar, L.d.A.P.; Fernandes, K.N. Estimativa de parâmetros de aquíferos através do coeficiente de recessão em áreas de embasamento cristalino de Minas Gerais. Rem Rev. Esc. Minas 2010, 63, 465–471. [Google Scholar] [CrossRef] [Green Version]
- Amorim, J.D.S.; Junqueira, R.; Mantovani, V.A.; Viola, M.R.; de Mello, C.R.; Bento, N.L. Streamflow regionalization for the Mortes River Basin upstream from the Funil Hydropower Plant, MG. Ambient. Água 2020, 15, 1–11. [Google Scholar] [CrossRef]
- Junqueira Junior, J.A.; Mello, C.R.; Owens, P.R.; Mello, J.M.; Curi, N.; Alves, G.J. Time-stability of soil water content (SWC) in an Atlantic Forest—Latosol site. Geoderma 2017, 288, 64–78. [Google Scholar] [CrossRef]
- Euclydes, H.P.; Ferreira, P.A.; Faria Filho, R.F. Atlas digital das águas de Minas, 1st ed.; UFV: Viçosa, Brazil, 2005. [Google Scholar]
- Freitas, S.; Bacellar, L. Avaliação da Recarga de Aquíferos em Microbacias do Alto Rio das Velhas, Minas Gerais. Rev. Bras. Recur. Hídricos 2013, 18, 31–38. [Google Scholar] [CrossRef]
- Dai, A.; Zhao, T.; Chen, J. Climate Change and Drought: A Precipitation and Evaporation Perspective. Curr. Clim. Chang. Reports 2018, 4, 301–312. [Google Scholar] [CrossRef]
- Rodrigues, J.A.M.; Viola, M.R.; Alvarenga, L.A.; Mello, C.R.; Chou, S.C.; Oliveira, V.A.; Uddameri, V.; Morais, M.A.V. Climate change impacts under representative concentration pathway scenarios on streamflow and droughts of basins in the Brazilian Cerrado biome. Int. J. Climatol. 2019, 1–16. [Google Scholar] [CrossRef]
- Santos, G.L.; Pereira, M.G.; Delgado, R.C.; Magistrali, I.C.; Silva, C.G.; Oliveira, C.M.M.; Teodoro, P.E. Anthropogenic and climatic influences in the swamp environment of the Pandeiros River basin, Minas Gerais-Brazil. Environ. Monit. Assess. 2020, 192. [Google Scholar] [CrossRef] [PubMed]
- Marengo, J.A.; Alves, L.M.; Alvala, R.C.S.; Cunha, A.P.; Brito, S.; Moraes, O.L.L. Climatic characteristics of the 2010-2016 drought in the semiarid northeast Brazil region. An. Acad. Bras. Cienc. 2018, 90, 1973–1985. [Google Scholar] [CrossRef] [PubMed]
- Melo, D.C.D.; Scanlon, B.R.; Zhang, Z.; Wendland, E.; Yin, L. Reservoir storage and hydrologic responses to droughts in the Paraná River basin, south-eastern Brazil. Hydrol. Earth Syst. Sci. 2016, 20, 4673–4688. [Google Scholar] [CrossRef] [Green Version]
- Nobre, C.A.; Marengo, J.A.; Seluchi, M.E.; Cuartas, L.A.; Alves, L.M. Some Characteristics and Impacts of the Drought and Water Crisis in Southeastern Brazil during 2014 and 2015. J. Water Resour. Prot. 2016, 8, 252–262. [Google Scholar] [CrossRef] [Green Version]
- Ramírez, A.; Gutiérrez-Fonseca, P.E.; Kelly, S.P.; Engman, A.C.; Wagner, K.; Rosas, K.G.; Rodríguez, N. Drought facilitates species invasions in an urban stream: Results from a long-term study of tropical island fish assemblage structure. Front. Ecol. Evol. 2018, 6, 1–11. [Google Scholar] [CrossRef] [Green Version]
- Azevedo, S.C.D.; Cardim, G.P.; Puga, F.; Singh, R.P.; Silva, E.A.D. Analysis of the 2012–2016 drought in the northeast Brazil and its impacts on the Sobradinho water reservoir. Remote Sens. Lett. 2018, 9, 438–446. [Google Scholar] [CrossRef] [Green Version]
- Santos, M.S.; Costa, V.A.F.; Fernandes, W.D.S.; de Paes, R.P. Time-space characterization of droughts in the São Francisco river catchment using the Standard Precipitation Index and continuous wavelet transform. Rev. Bras. Recur. Hidricos 2019, 24, 1–12. [Google Scholar] [CrossRef] [Green Version]
- Garreaud, R.D.; Vuille, M.; Compagnucci, R.; Marengo, J. Present-day South American climate. Palaeogeogr. Palaeoclimatol. Palaeoecol. 2009, 281, 180–195. [Google Scholar] [CrossRef]
Figure 1.
Locations of the PRB, streamflow and rain gauge stations, and DEM.

Figure 2.
Hydrograph containing average monthly precipitation (P), total streamflow (Qt), and baseflow (Qb) (A); and permanent flow curve (B).
Figure 2.
Hydrograph containing average monthly precipitation (P), total streamflow (Qt), and baseflow (Qb) (A); and permanent flow curve (B).

Figure 3.
SPI and SSI results for hydrological years and rainy seasons in the PRB.


Table 1.
Hydrological indicators used in this study.
| Hydrological Indicator | Abbreviation | Unit |
|---|---|---|
| Depletion coefficient | α | day−1 |
| Water depth stored in the aquifer at the end of the hydrological year | Af | mm |
| Baseflow index | BFI | - |
| Aquifer restitution rate | ARR | % |
| Evapotranspiration rate | ETR | % |
| Surface runoff rate | SRR | % |
| Long-term streamflow | Qmean | m3 s−1 |
| Minimum streamflow | Qmin | m3 s−1 |
| Maximum streamflow | Qmax | m3 s−1 |
| Minimum streamflow that occurs in 90% of the time | Q90% | m3 s−1 |
| Minimum streamflow that occurs in 95% of the time | Q95% | m3 s−1 |
| Minimum streamflow in seven consecutive days and a return period of 10 years | Q7,10 | m3 s−1 |
| Specific yield (SY) related to Qmean, Qmin, Qmax, Q90%, Q95%, and Q7,10 | SYmean, SYmin, SYmax, SY90%, SY95%, and SY7,10, respectively | L s−1 km−2 |
Table 2.
Classification for the SPI and SSI values.
| Classification | Indexes Values | Probability (%) |
|---|---|---|
| Extremely dry (ED) | SPI and SSI ≤ −2.0 | 2.3 |
| Severely dry (SD) | −2.0 < SPI and SSI ≤ −1.5 | 4.4 |
| Moderately dry (MD) | −1.5 < SPI and SSI ≤ −1.0 | 9.2 |
| Near normal (NN) | −1.0 < SPI and SSI < 1.0 | 68.2 |
| Moderately wet (MW) | 1.0 ≤ SPI and SSI < 1.5 | 9.2 |
| Very wet (VW) | 1.5 ≤ SPI and SSI < 2.0 | 4.4 |
| Extremely wet (EW) | SPI and SSI ≥ 2.0 | 2.3 |
Table 3.
AD test results for the basin-scale precipitation and streamflow for the PRB.
| Precipitation | Streamflow | |||||||
|---|---|---|---|---|---|---|---|---|
| Hy | L3 | L6 | L9 | L12 | Rs | Hy | Rs | |
| Gumbel | 0.929 | 0.874 | 0.690 | 0.886 | 0.249 | 0.527 | 0.348 | 0.462 |
| Gamma | 0.562 | 0.452 | 0.386 | 0.376 | 0.250 | 0.262 | 0.381 | 0.524 |
| GEV | 0.552 | 0.421 | 0.387 | 0.320 | 0.216 | 0.258 | 0.350 | 0.465 |
| Kappa | 0.537 | 0.398 | 0.368 | 0.318 | 0.217 | 0.243 | 0.359 | 0.520 |
| GLO | 0.612 | 0.492 | 0.456 | 0.359 | 0.244 | 0.341 | 0.423 | 0.567 |
| GPA | - | - | - | - | - | - | - | - |
| Weibull | 0.528 * | 0.397 * | 0.358 | 0.300 | - | 0.239 | - | - |
| Wakeby | 0.711 | 0.467 | 0.325 * | 0.279 * | 0.202 * | 0.206 * | 0.281 * | 0.388 * |
| PE3 | 0.552 | 0.424 | 0.385 | 0.315 | 0.229 | 0.260 | 0.363 | 0.478 |
| LN3 | 0.553 | 0.425 | 0.388 | 0.315 | 0.222 | 0.262 | 0.356 | 0.470 |
Note: * Best fit, Hy = Hydrological year, L3 = 3 months lag, L6 = 6 months lag, L9 = 9 months lag, L12 = 12 months lag, Rs = Rainy season.
Table 4.
r results between the SSI and the SPI with a lag of 0, 3, 6, 9, and 12 months.
| SPI Lags (Months) | 0 | 3 | 6 | 9 | 12 |
| R | 0.64 | 0.65 | 0.64 | 0.47 | 0.39 |
Publisher’s Note: MDPI stays neutral with regard to jurisdictional claims in published maps and institutional affiliations. |
© 2020 by the authors. Licensee MDPI, Basel, Switzerland. This article is an open access article distributed under the terms and conditions of the Creative Commons Attribution (CC BY) license (http://creativecommons.org/licenses/by/4.0/).
Share and Cite
MDPI and ACS Style
Junqueira, R.; Viola, M.R.; Amorim, J.d.S.; Mello, C.R.d. Hydrological Response to Drought Occurrences in a Brazilian Savanna Basin. Resources 2020, 9, 123. https://0-doi-org.brum.beds.ac.uk/10.3390/resources9100123
AMA Style
Junqueira R, Viola MR, Amorim JdS, Mello CRd. Hydrological Response to Drought Occurrences in a Brazilian Savanna Basin. Resources. 2020; 9(10):123. https://0-doi-org.brum.beds.ac.uk/10.3390/resources9100123
Chicago/Turabian StyleJunqueira, Rubens, Marcelo R. Viola, Jhones da S. Amorim, and Carlos R. de Mello. 2020. "Hydrological Response to Drought Occurrences in a Brazilian Savanna Basin" Resources 9, no. 10: 123. https://0-doi-org.brum.beds.ac.uk/10.3390/resources9100123
Note that from the first issue of 2016, this journal uses article numbers instead of page numbers. See further details here.