
Multi-Objective Energy Management Strategy for PV/FC Hybrid Power Systems


1
Faculty of Electronics, Communications and Computers, University of Pitesti, 1 Targu din Vale, 110040 Pitesti, Romania
2
Doctoral School, Polytechnic University of Bucharest, 313 Splaiul Independentei, 060042 Bucharest, Romania
3
Renewable Energy Research Centre (RERC), Department of Teacher Training in Electrical Engineering, Faculty of Technical Education, King Mongkut’s University of Technology North Bangkok, 1518, Pracharat 1 Road, Bangsue, Bangkok 10800, Thailand
*
Author to whom correspondence should be addressed.
Electronics 2021, 10(14), 1721; https://0-doi-org.brum.beds.ac.uk/10.3390/electronics10141721
Submission received: 30 June 2021
/
Revised: 14 July 2021
/
Accepted: 16 July 2021
/
Published: 18 July 2021
(This article belongs to the Special Issue Photovoltaic Energy Systems and Storage)
Abstract
:In this paper, a new control of the DC–DC power converter that interfaces the fuel cell (FC) system with the DC bus of the photovoltaic (PV) power system is proposed to increase the battery lifespan by its operating in charge-sustained mode. Thus, the variability of the PV power and the load demand is compensated by the FC power generated considering the power flows balance on the DC bus. During peak PV power, if the PV power exceeds the load demand, then the excess power on the DC bus will power an electrolyzer. The FC system operation as a backup energy source is optimized using a new fuel economy strategy proposed for fueling regulators. The fuel optimization function considers the fuel efficiency and electrical efficiency of the FC system to maximize fuel economy. The fuel economy obtained in the scenarios considered in this study is compared with reference strategies reported in the literature. For example, under scenarios considered in this paper, the fuel economy is between 4.82–20.71% and 1.64–3.34% compared to a commercial strategy based on static feed-forward (sFF) control and an advanced strategy recently proposed in the literature, respectively.
1. Introduction
The issue of the decision to continue using fossil fuels is related to their still very high percentage (about 80%) in world energy production [1]. However, even if new exploits are discovered, it is obvious that the limited amount of fossil fuel, compared to the growing energy demand, will lead, sooner or later, to the need to use alternative energy sources. For example, the predictions of oil companies over the next decade highlighted a peak in the exploitation of fossil fuels, gasoline and natural gas, somewhere in the years 2022–2024 [2]. However, the most serious problem caused by the heavy use of fossil fuels is related to environmental damage and climate change (due to global warming, acid rain, pollution, ozone depletion, etc.) and the annual cost of remedial measures of about USD 5 trillion worldwide [3]. One solution identified and proposed since 1970 is the use of renewable energy sources combined with hydrogen-based energy generation and storage systems [4]. Taking into account the recent research and development activities in laboratories of universities and research institutes, it can be said that hydrogen technology is already mature, and can be used successfully in various mobile [5] and stationary applications [6]. In addition, it is a cleaner and more efficient source of energy compared to, for example, the diesel generator [7], and the price of hydrogen production decreases every year [8,9]. In the electrochemical processes in the fuel cell (FC) system, hydrogen is transformed with an efficiency of 50–60% into electricity [10]. For example, in FC electric vehicles, this energy is converted into mechanical energy much more efficiently than using conventional fuels [11]. However, additionally, the electricity produced by FC systems can be converted to AC energy and used to power buildings or injected into the grid, by integrating renewable/FC hybrid power systems into standalone [12] or grid-connected [13] nano- and micro-grids.
The renewable/FC microgrids based on hybrid energy storage systems (ESS) represent the most viable and performant solutions for reducing Greenhouse Gases (GHG) and other environmentally harmful gases [14]. The microgrids integrate renewable/FC hybrid power systems (called distributed energy resources—DERs), which use locally available energy sources (such as hydro-turbines, photovoltaic (PV) panels, wind turbines, etc.) [15]. The level of energy generated depends directly on the water flow, the level of solar radiation, wind speed, but also indirectly on the ambient temperature, air humidity, weather, season, etc. [16]. In addition, the energy demand is variable during the day and depends on the geographical location, season, etc. [17]. Therefore, an energy storage system [18] or a backup energy source (such as a FC system [19] or diesel generator [20]) is needed to compensate for this variability in power generated and load demand using an appropriate energy management strategy [21,22,23].
If a backup energy source is not used, then the capacity of the batteries is projected based on the forecasts made for renewable energy and load demand, generally resulting in a large capacity for the batteries [24]. In addition, regardless of the type of strategy used [21,22,23,25,26,27], batteries are frequently charged and discharged within state-of-charge (SOC) limits, reducing their lifespan [15,28]. Different algorithms are used to identify the parameters of the FC system [29], PV panel [30] and battery SOC [31].
Therefore, in this study, it is proposed to use a FC system as a green backup power source to operate the battery stack in charging mode in order to reduce the size of the battery and increase its life. The objectives and novelty of this research study are as follows:
- ▪
- Control of the DC–DC power converter that interfaces the FC system with the DC bus to operate the battery stack in charge-sustained mode, increasing their life due to a limited number of charge–discharge cycles (which may occur if it is not used an electrolyzer to be powered by excess power from the DC bus; note that frequent charge–discharge cycles usually appear in a PV/ESS hybrid power system without the support of a backup energy source); a new power-following (PF) control is proposed based on the power flows balance on the DC bus;
- ▪
- Optimization of the FC system operation as a backup energy source; a new fuel economy strategy (called below as strategy S2) is proposed for fueling regulators using a new fuel optimization function based on fuel efficiency and FC electrical efficiency to maximize fuel economy.
The fuel economy obtained is compared with that reported in [31], using the best fuel economy strategy from those analyzed in [32] (called as strategy Air/Fuel-PF in [33] and strategy S1 below), and with the fuel economy obtained using the reference strategy S0 based on the static feed-forward (sFF) control of the fueling regulator [34] and the proposed PF control of the FC power converter.
The architecture of the PV/FC/ESS hybrid power supply system and PF control is presented in Section 2. The results for PV/ESS and PV/FC/ESS are presented in Section 3 and Section 4 for comparison in seven scenarios of variable solar irradiation profiles. Total fuel consumption and fuel economy obtained using different PF-based strategies to test the performance of the PV/FC/ESS system are summarized and discussed in Section 4. The main findings are mentioned in Section 5.
2. PV/FC/ESS Hybrid Power System
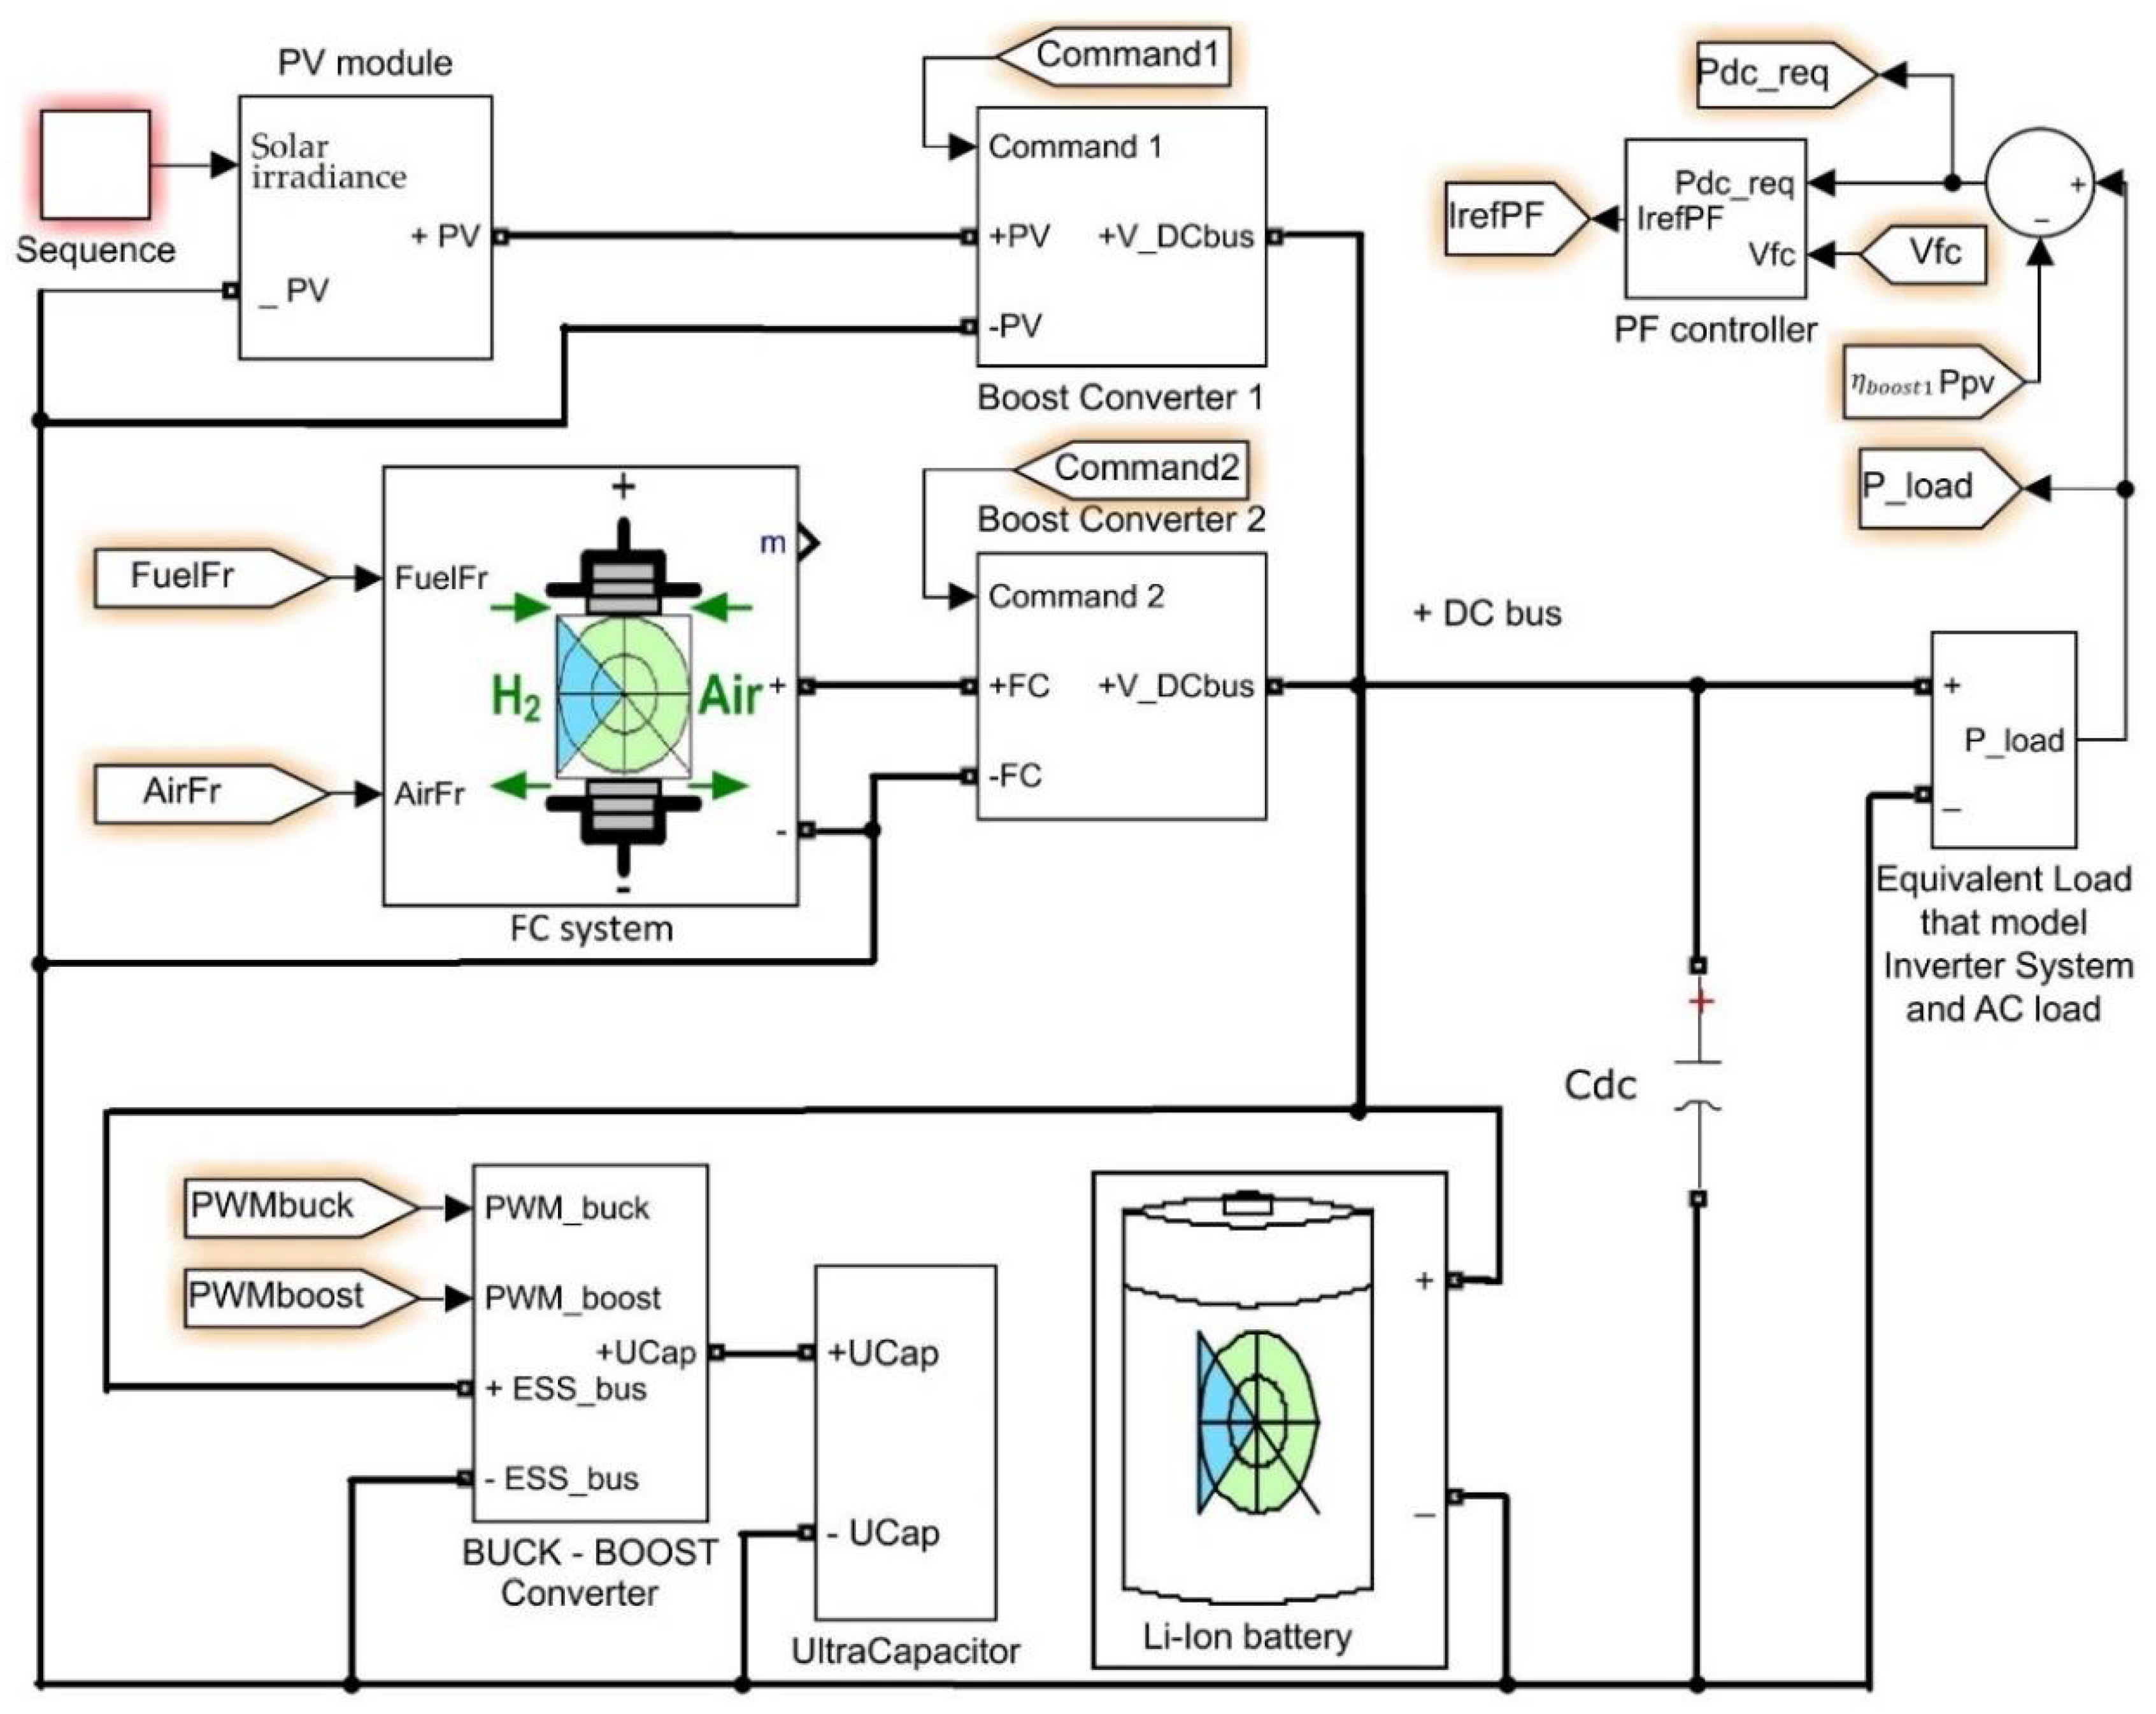
The PV/FC/ESS hybrid power system is shown in Figure 1. The inverter and the AC load are equivalent to a DC load at the DC bus level. Thus, the balance of power flows at the DC bus level is given by Equation (1):
where:
- -
- is the PV power available under a solar irradiance set by the insolation sequence;
- -
- is the FC net power under fueling flows set by the air flow rate (AirFr) and the fuel flow rate (FuelFr);
- -
- is the load demand at the DC bus level set by the selected load profile;
- -
- is the power exchanged by the batteries (Batt) stack at the DC bus level;
- -
- is the power exchanged by the ultracapacitors (UC) stack via the buck-boost DC–DC power converter to dynamically compensate the balance of power flows at the DC bus level;
- -
- and are the efficiency of the boost DC–DC power converters 1 and 2. and is the efficiency of the buck-boost DC–DC power converter;
- -
- is the capacitors stack used to filter the voltage of the DC bus.
The parameters of the PV/FC/ESS hybrid power system are mentioned in Table 1.
The 6 kW FC system was chosen to support a variable load demand (having 8 kW maximum power and 0.1 s time constant) without power support from the PV panel (at night) and battery (which has only 10 Ah capacity and will be operated in charge-sustained mode).
The design of the battery, UC and has been performed for pulses of load using the design relationships mentioned in [35].
Neglecting the power exchanged by the UC stack and capacitor, Equation (1) can be written as Equation (2):
An objective of FC system control is to maintain the state of charge of the battery, avoiding the frequent charge–discharge cycles that occur in the PV/ESS system, as will be shown in Section 3. Therefore, considering in Equation (2), the FC net power to be generated is given by Equation (3):
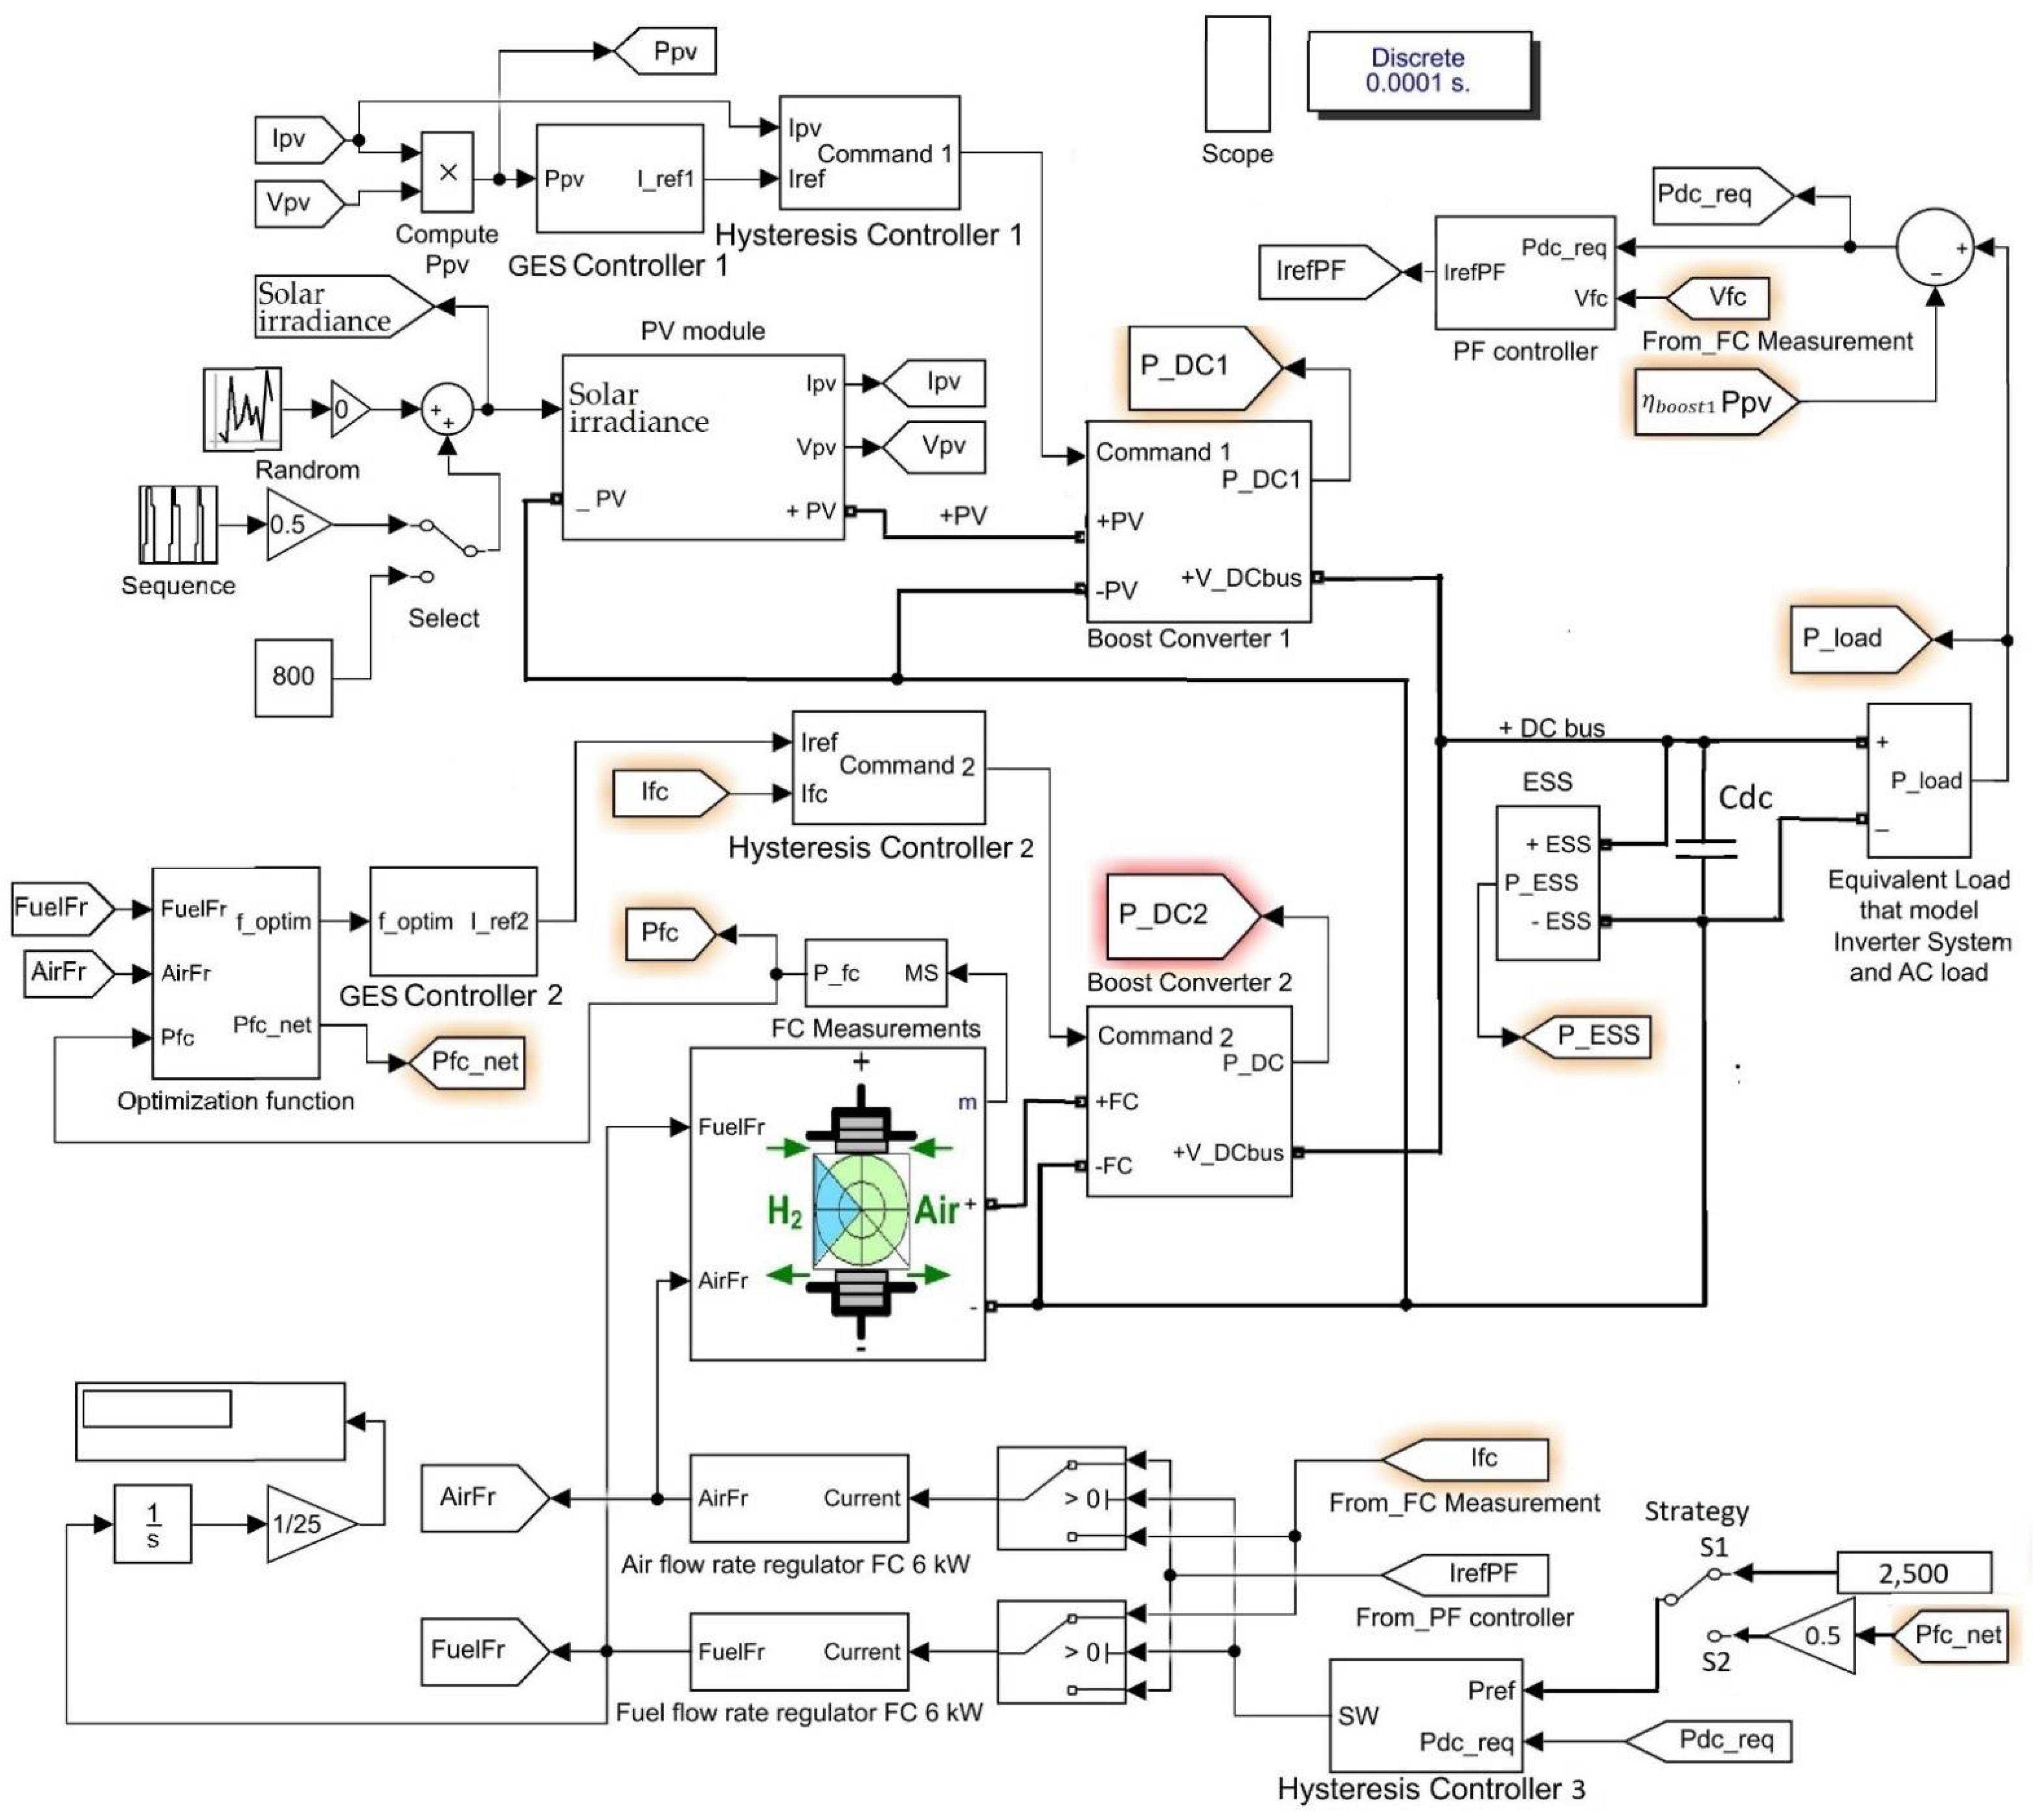
Thus, the power requested () from the FC system to operate the batteries stack in charge-sustained regime will be obtained if the inputs of the fueling regulators or FC current will follow the reference generated by the power following (PF) controller (see Figure 2 and Figure 3, respectively), which is given by Equation (4):
where the , and are the values for PV power, load demand and FC voltage after a low-pass filter (LPF) or a filter block based on average value. It is obvious that .
The air flow rate (AirFr) and the fuel flow rate (FuelFr) are measured in liters per minute (Lpm), being given by Equations (5) and (6) [36]:
where the default values are used for parameters , [37] and the fueling flow rates are limited to 100 A/s, which is the maximum slope of the current during the acceleration phase of electric vehicle [38,39].
The optimization of the FC system operation as a backup energy source is based on the new fuel economy strategy of the fueling regulators selected as strategy S2 in Figure 2. Therefore, the references or are given by Equations (7) and (8):
where the FC net power is estimated by (9)
and the power losses of the air compressor () given by (10)
The parameter used in modeling are , , , and for the static model Equation (10) and 100 Hz natural frequency and 0.7 damping ratio for the dynamic model based on a second-order transfer function [40,41].
If the switch selects the strategy S1 (as it is presented in Figure 3), then the references and are given by Equations (11) and (12) [32]:
where the reference of 2500 W is set using the sensitivity analysis for this parameter and the FC profile resulting from the case studies analyzed in Section 4.
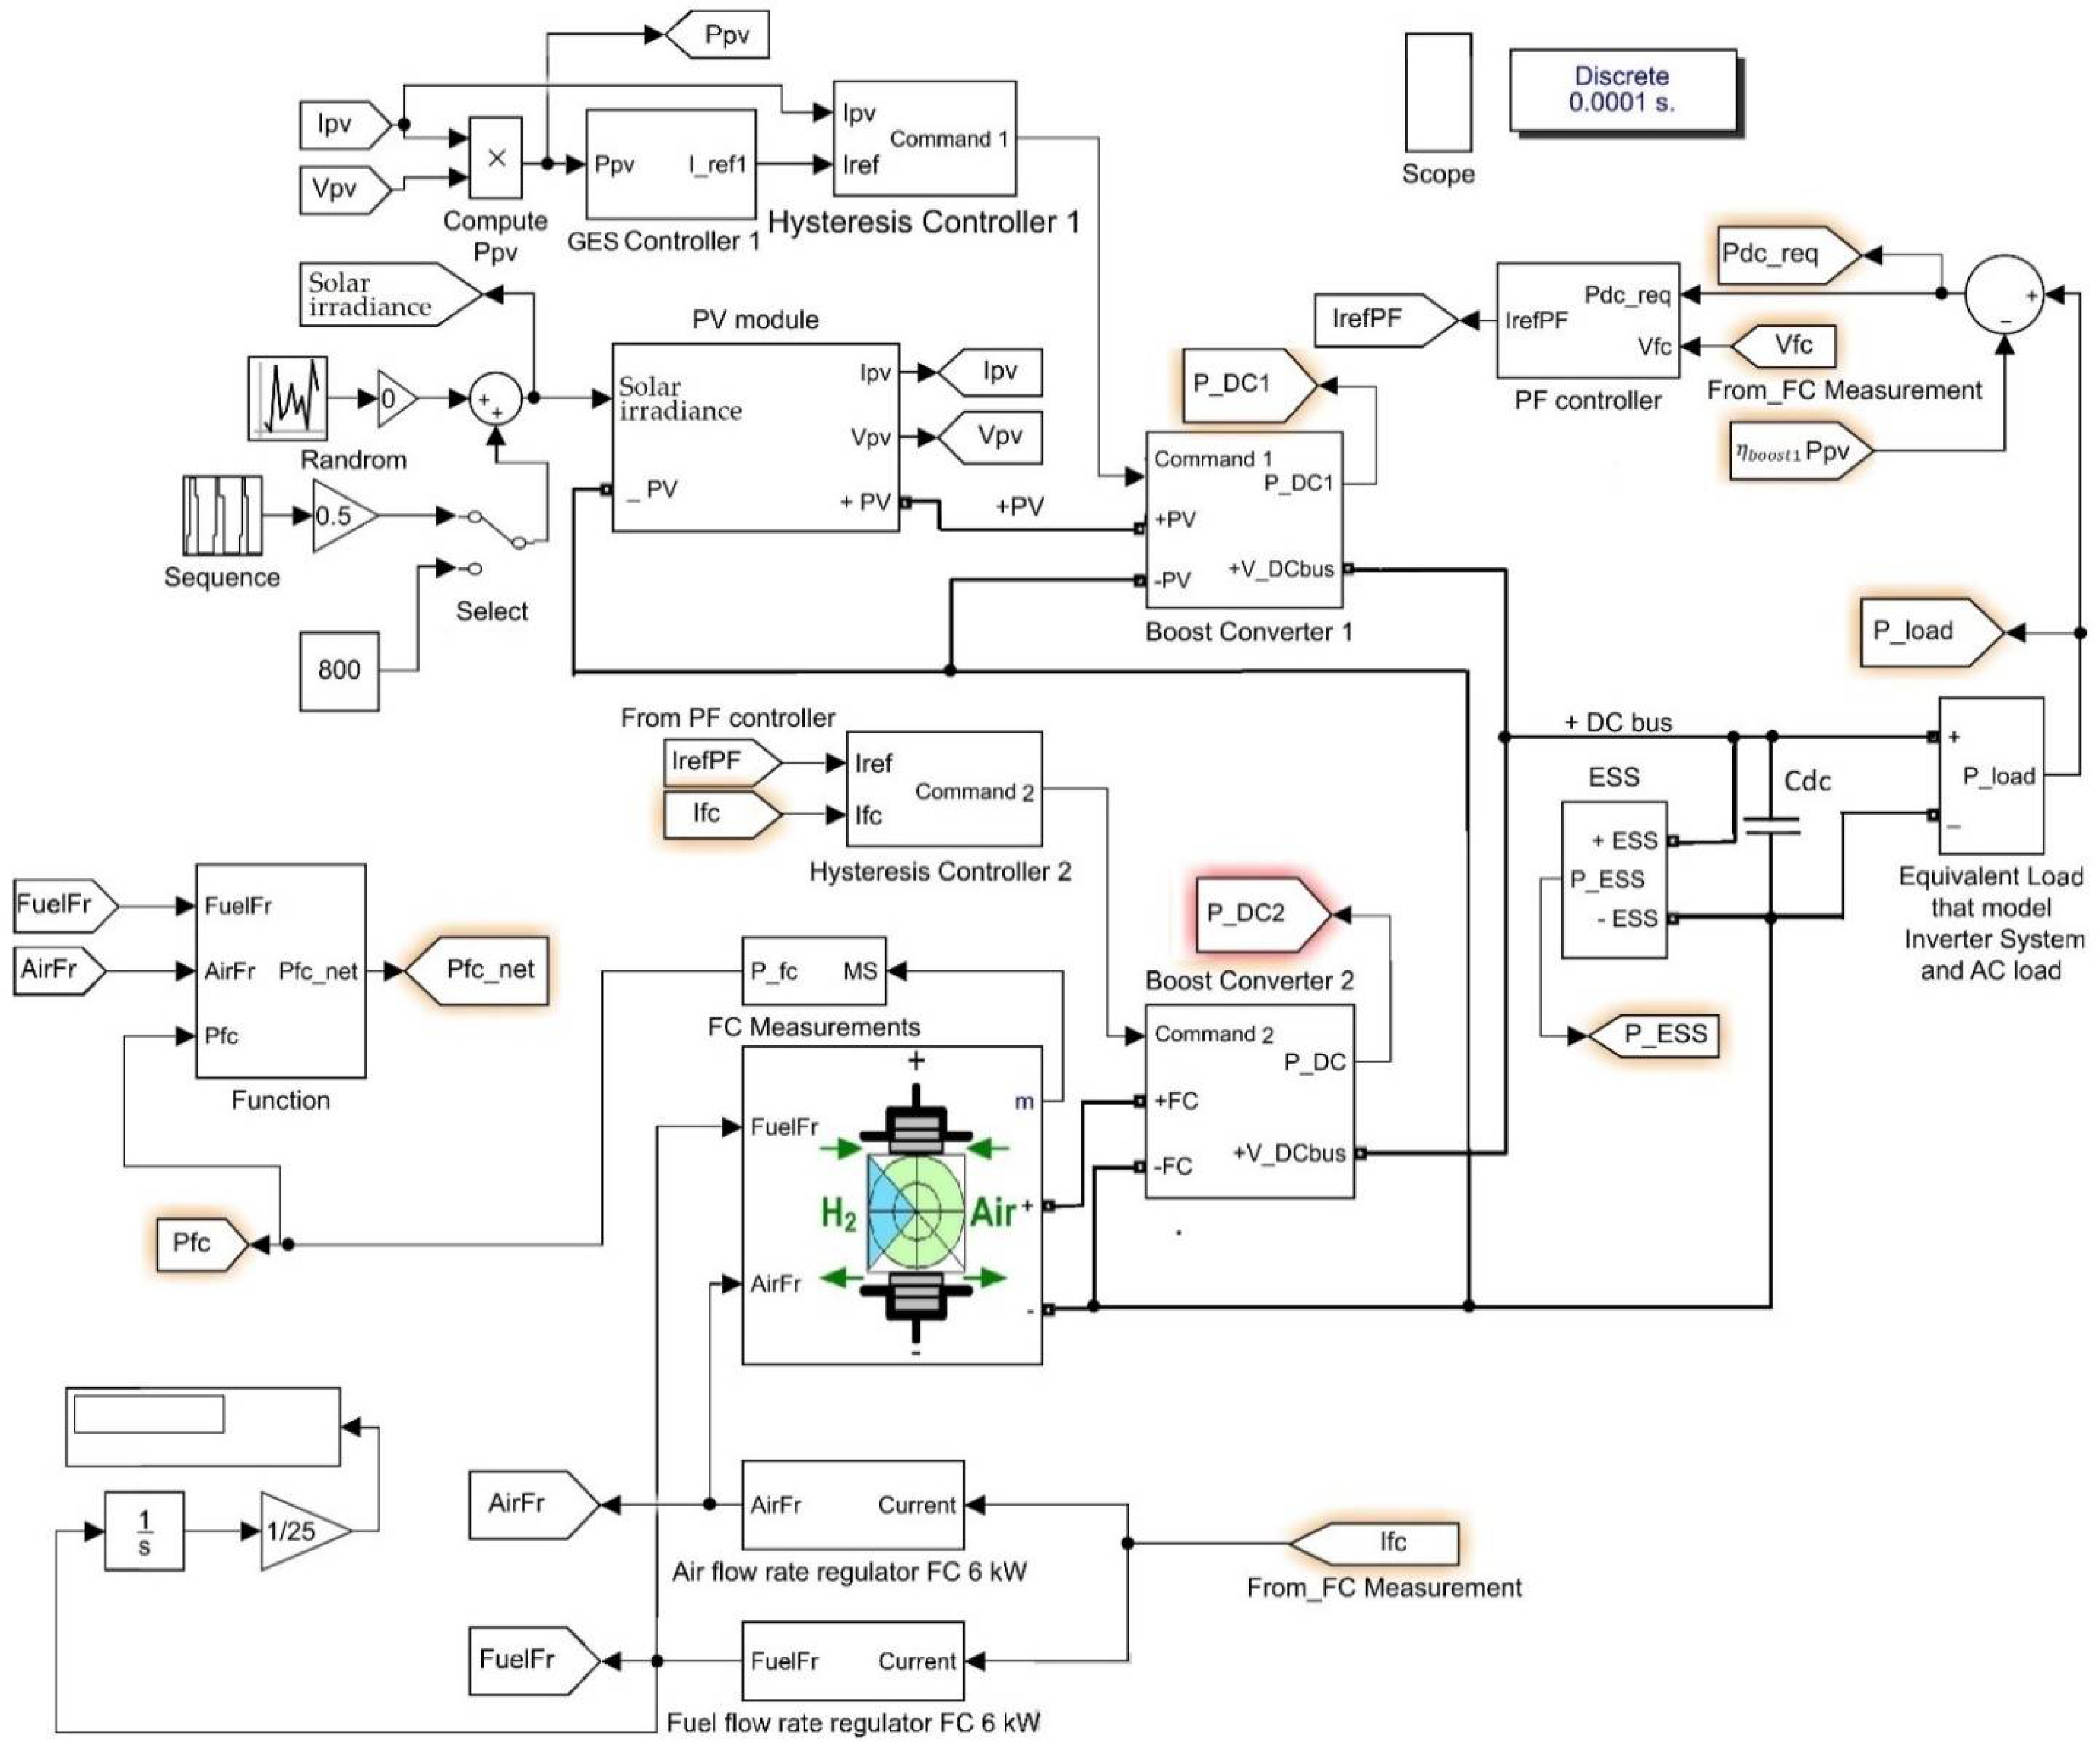
The reference strategy S0 based on the sFF control of the fueling regulator and the proposed PF control of the FC power converter is presented in Figure 3. Therefore, the references or are given by Equations (13) and (14):
Thus, all the analyzed strategies (S0, S1 and S2) use PF control of the FC system, and the same control and operation conditions of the PV system for a fair comparison of the fuel economy obtained.
It is worth mentioning that the optimization loop is the same for the S1 and S2 strategies shown in Figure 2, being detailed below. However, the results presented in Section 4 show a substantial fuel economy for strategy S2 compared to strategy S1 due to the use of a variable reference () instead of a constant one ( kW).
The optimization function (15) mixes the FC electrical efficiency (PFCnet/PFC [%]) and the fuel consumption efficiency (Fueleff ≅ PFCnet/FuelFr [W/Lpm]):
where vector x represents the FC state variables [34,42], the perturbations, and was set to 2 based on sensitivity analysis to maximize the fuel economy.
The controler that implement the optimization algorithm is based on the Global Extremum Seeking (GES) [43], but any global maximum search algorithm that meets the performance requirements specific to this application (search time less than 100 ms at an amplitude step jump half of the maximum allowed value, stationary search accuracy higher than 99%, etc.) can be used as well [44]. The GES controller 2 shown in Figure 2 operate using the following modeling relationships [43,45]:
The normalized value () of the optimization function (by using kNy = 1/100) is processed with a band-pass filter (having the cut-off frequencies and , where and ) to obtain the signal (an approximation of the first harmonic). By demodulation of the signal with a sinusoidal dither (, where and fd = 100 Hz) is obtained signal. Integration of the signal results in the search gradient (). The search and location signals ( and ) are tuned using = 1 and = 2 to speed up tracking of the best fuel economy. The reference and FC current () are the inputs of the hysteresis controller 2 with 0.1 A hysteresis band (which is shown in Figure 2), so the FC current will follow the reference (). The gain kNp = 50 adapts the search range for the reference . The reader interested in designing GES-based control can analyze the design applications presented in [46,47].
The inputs of the fueling regulators or FC current will follow the reference or the FC current considering the switching rules Equations (7) and (8) for the strategy S2 (or the switching rules Equations (11) and (12) for the strategy S1). As , the switching strategies S1 and S2 produce minor disturbances in the fueling flows after switching. To avoid frequent switching, the power requested () is low-pass filtered and 500 W hysteresis band is used for the hysteresis controller 3.
In strategy S0 (presented in Figure 3) the reference and FC current () are the inputs of the hysteresis controller 2 with 0.1 A hysteresis band, so the FC current will follow the reference , resulting . The inputs of the fueling regulators are controlled by the FC current as in the sFF control proposed in [34].
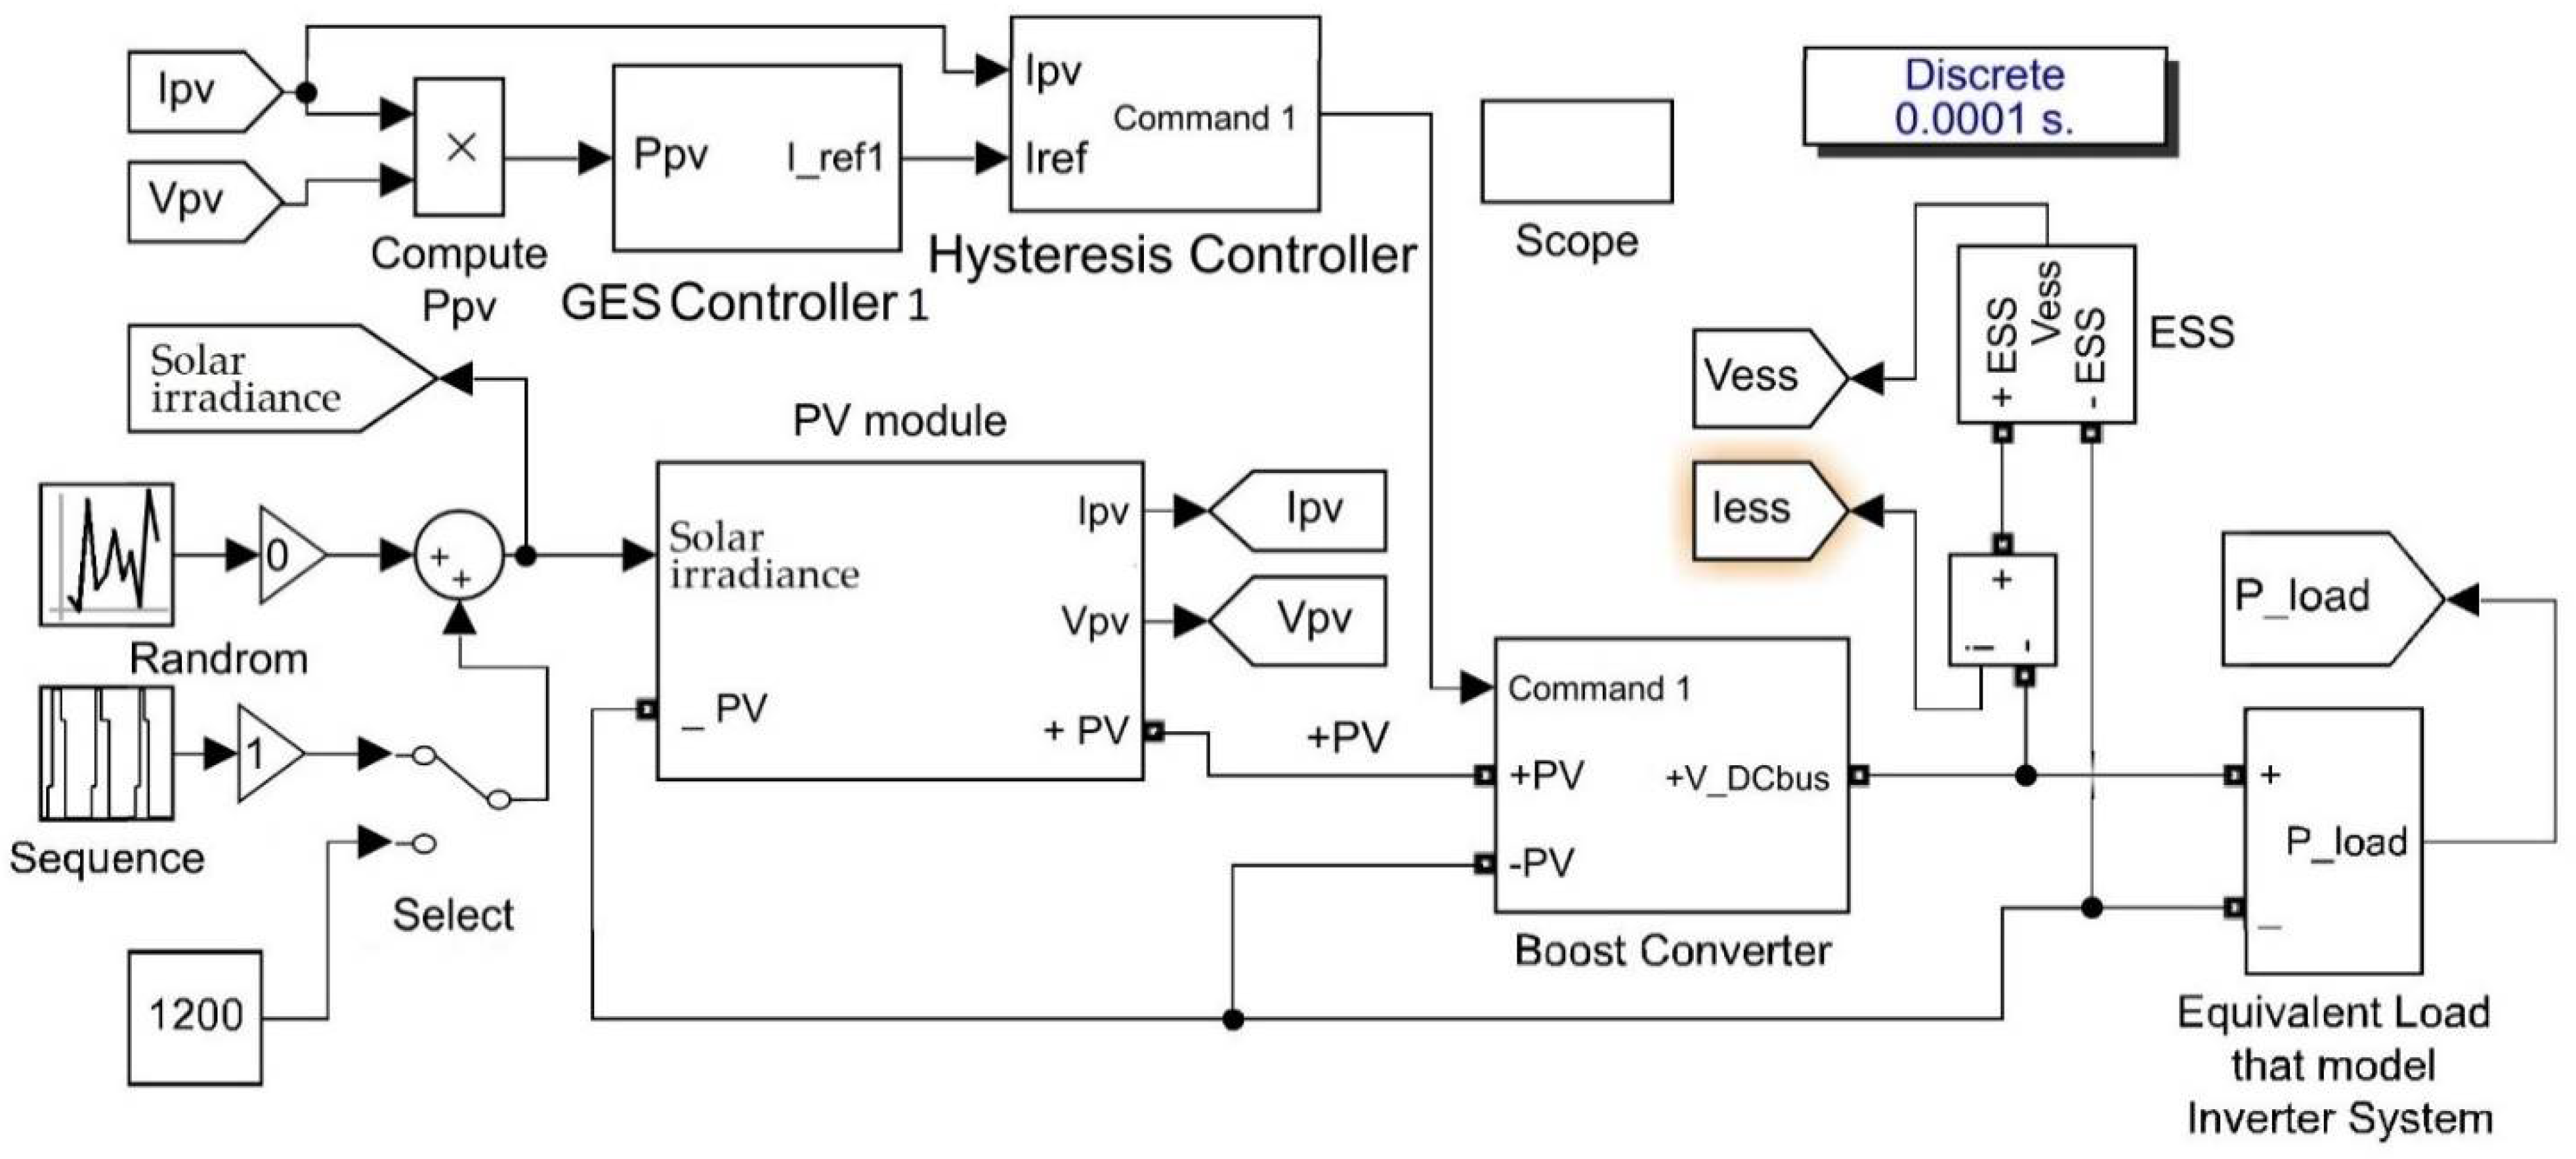
The PV system (shown in top of Figure 1, Figure 2 and Figure 3) generates 5.4 kW at 1000 W/m2 solar irradiance. The voltage and current at maximum power are 60 V and 90 A, and the short-cut current is 120 A (see Table 1). Thus, if the GES-based algorithm will be used for maximum power point (MPP) tracking control, then the global MPP will be tracked under variable solar irradiance. The normalized value () of the PV power will be found using kNy = 1/3000 and the gain kNp = 20 will adapt the search range for the reference (due to use of 0.1 A hysteresis band for the hysteresis controller 1).
The operation of the PV system will be presented in Section 3 without the use of the FC system (see Figure 4) to highlight the operation regime of the batteries stack and the efficiency of harvesting PV power using the GES control. In order to compensate the power flow balance on the DC bus, the battery’s power must be at level of the FC power. Thus, a 100 Ah battery is used in simulation of the PV/ESS system.
3. Results for PV/ESS System
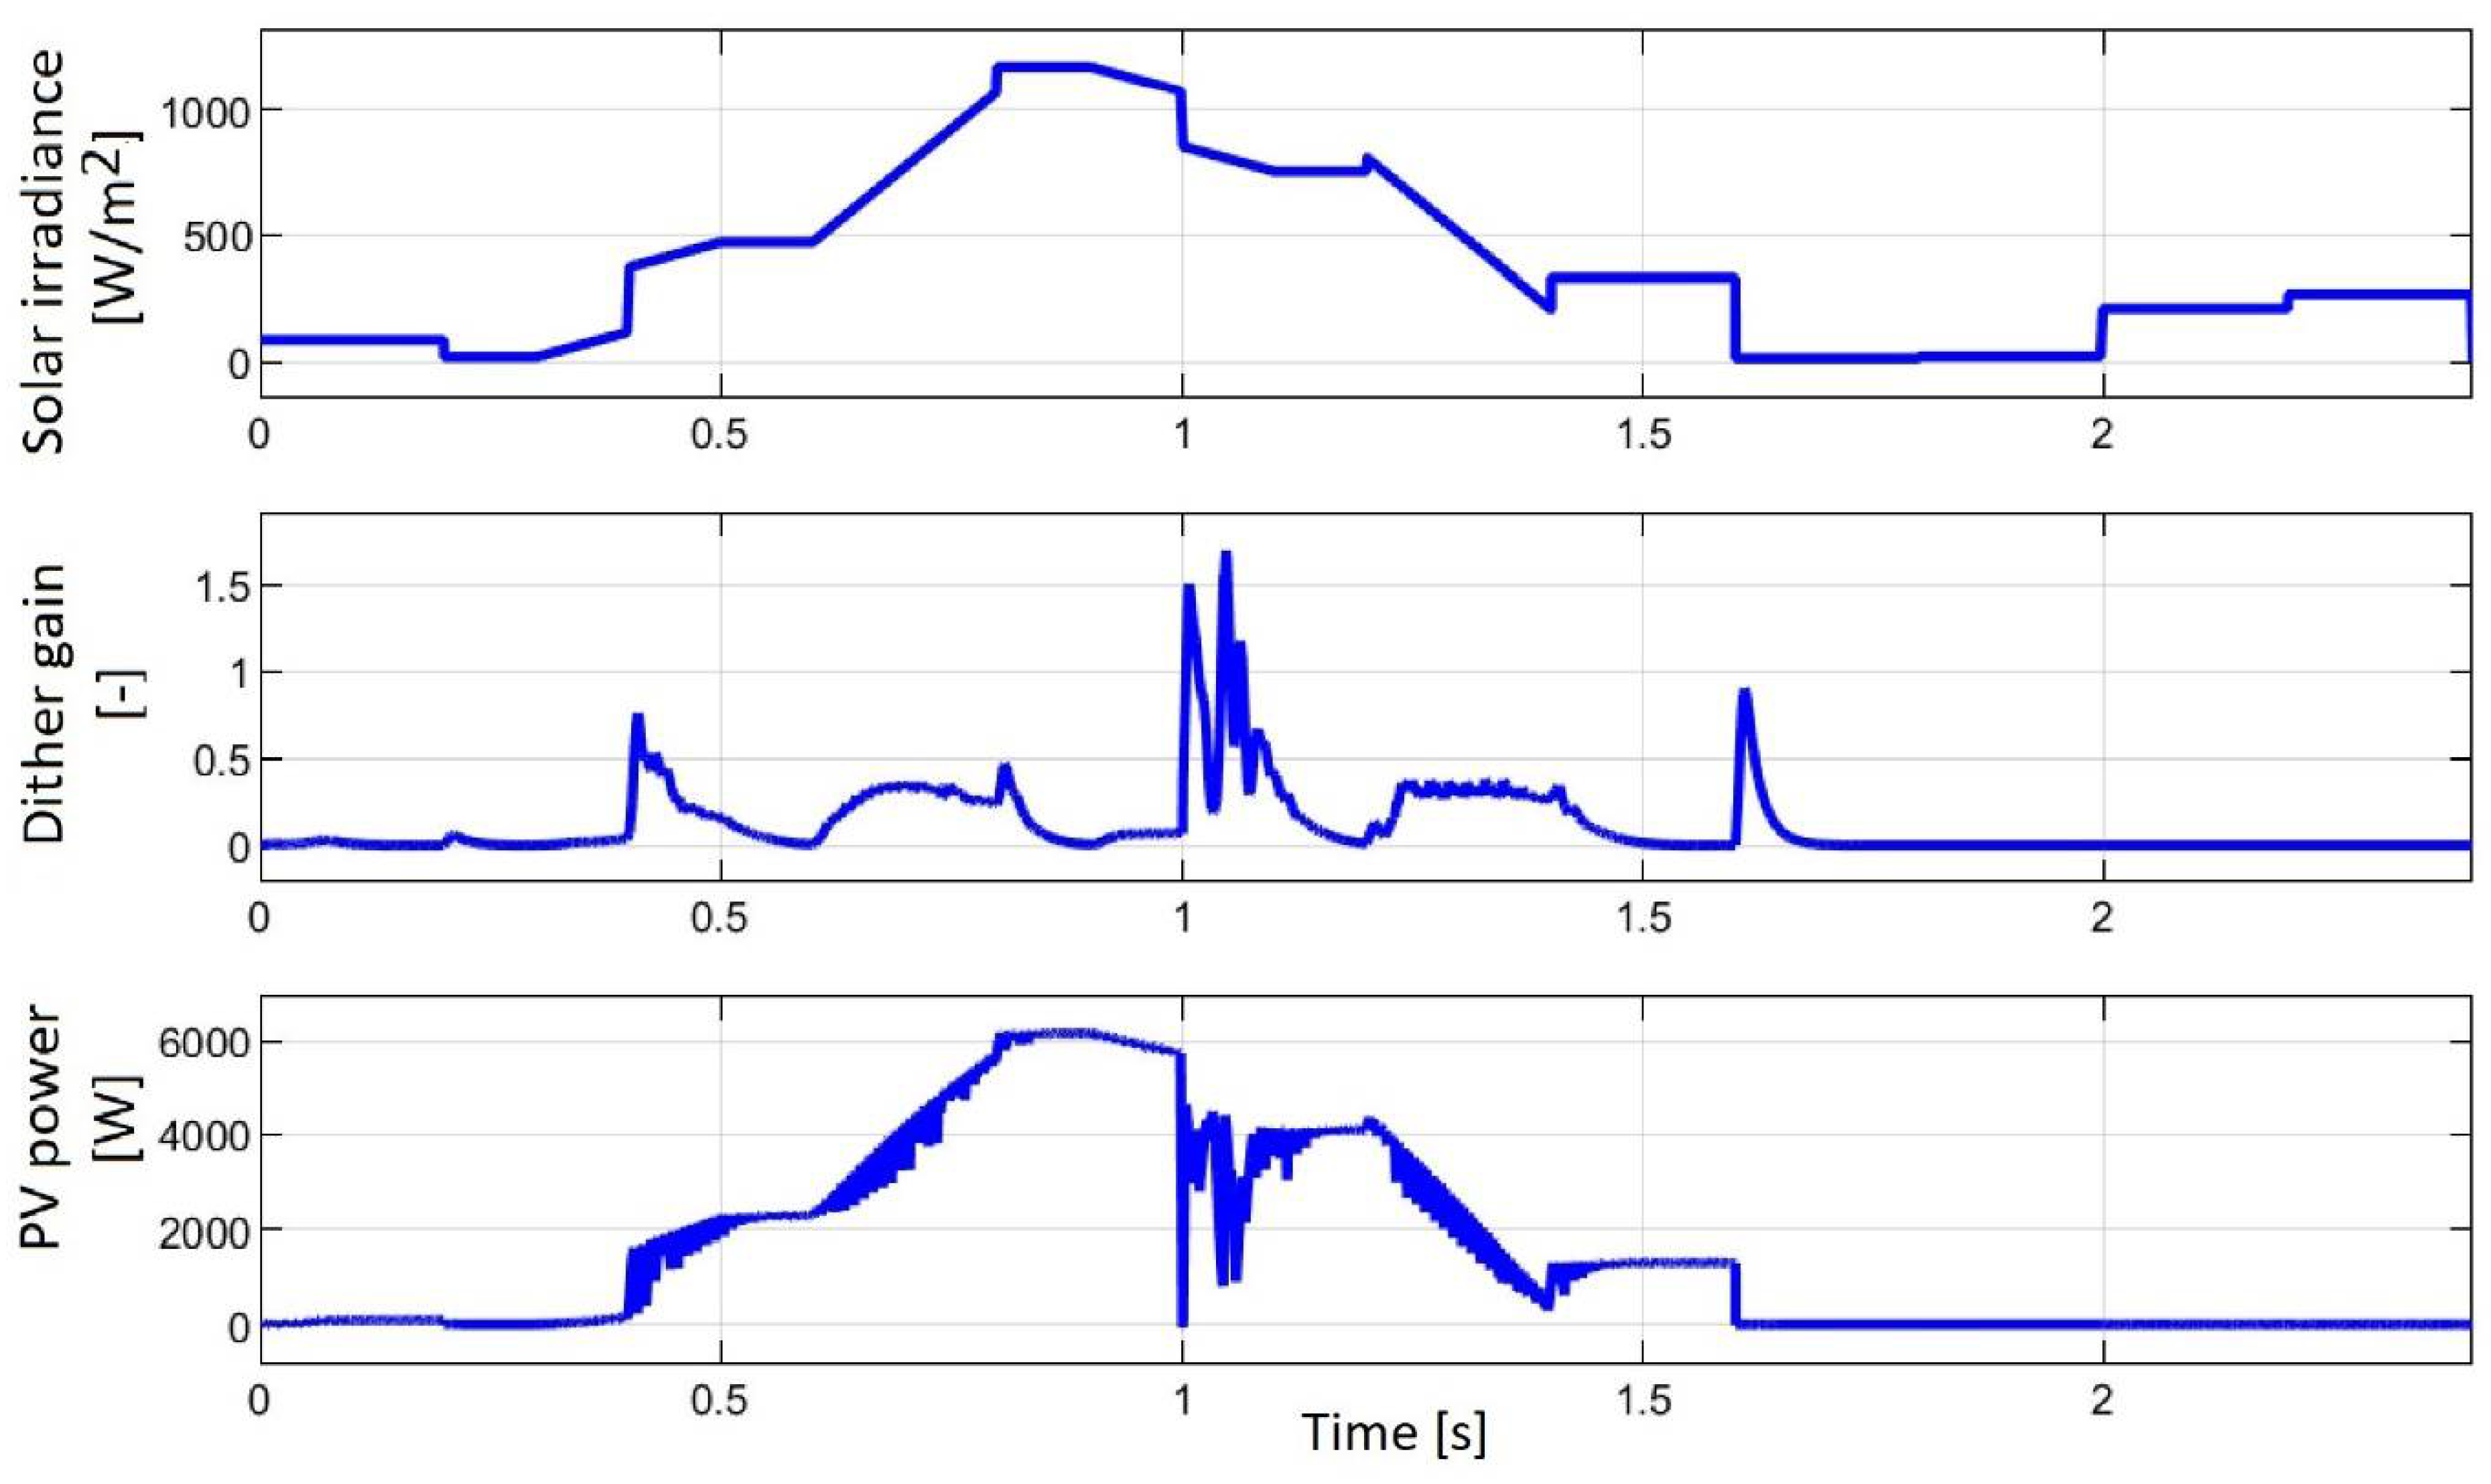
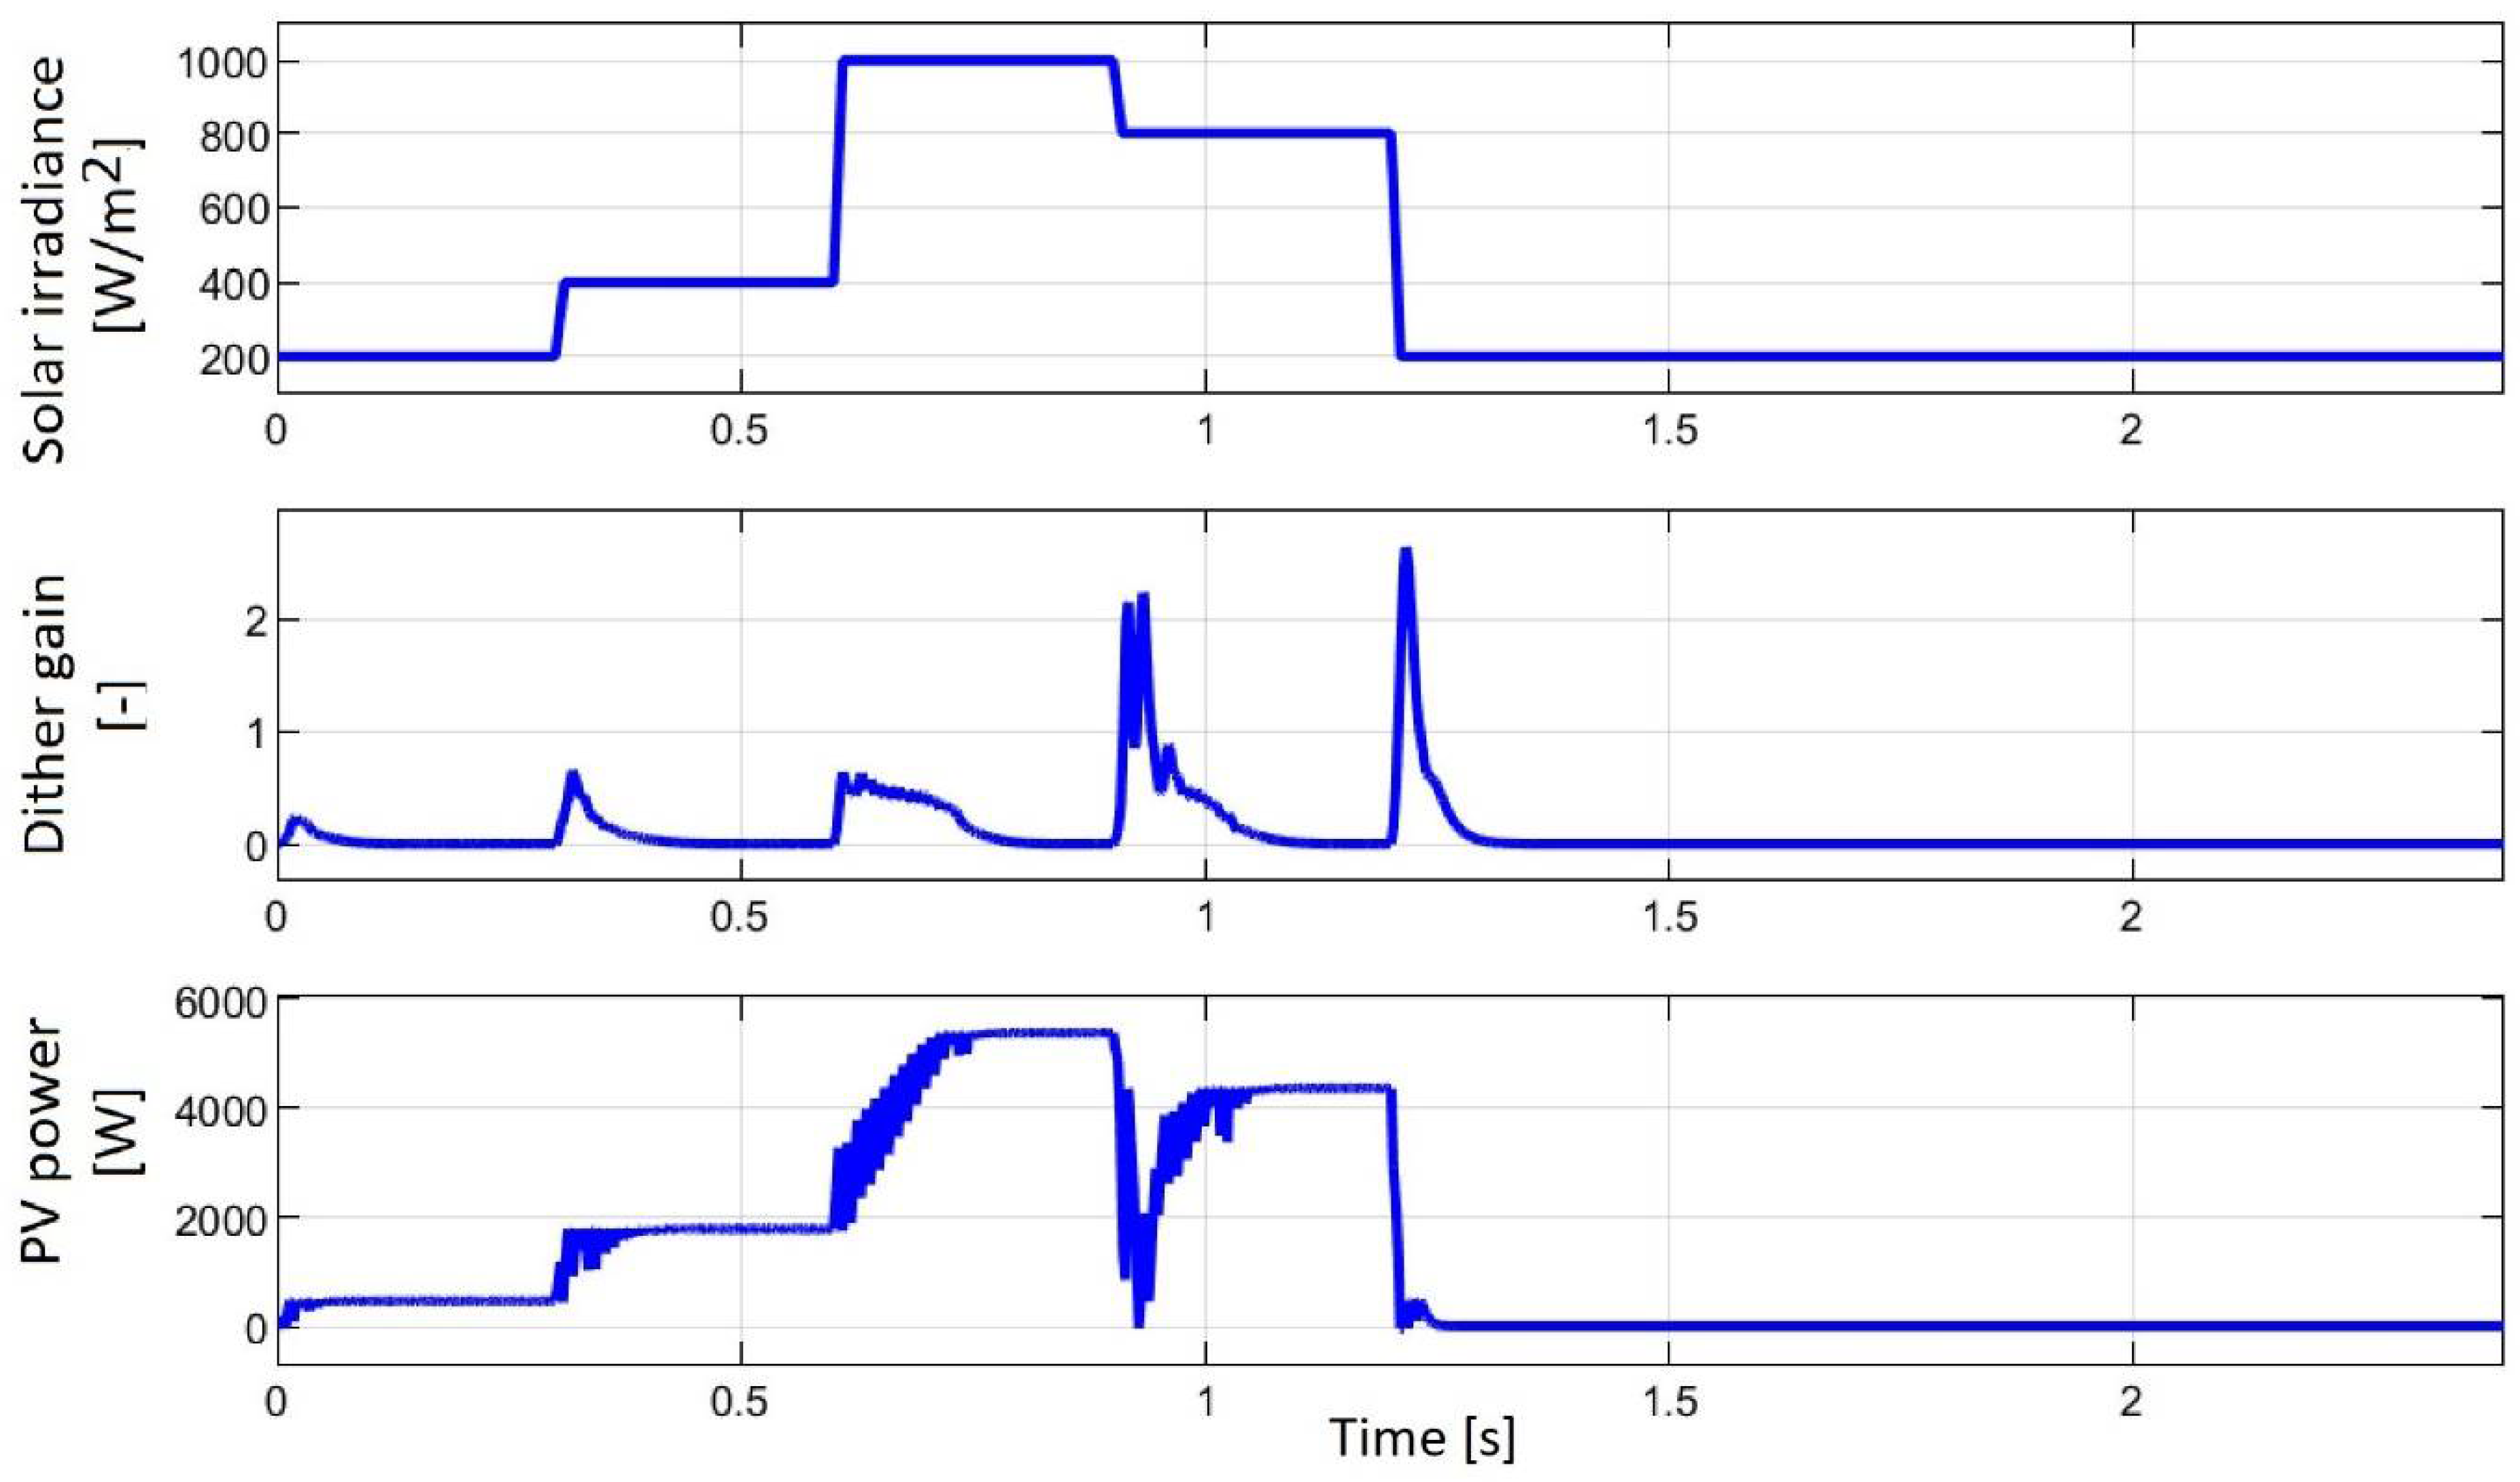
The results for PV/ESS system under variable solar irradiance (SI) profile with slow slopes (SI profile shown in Figure 5), with random pulses of maximum 200 W/m2 added to the SI profile shown in Figure 5 (see Figure 6) and with very high slopes of the SI profile (see Figure 7).
The plots in Figure 1, Figure 2 and Figure 3 present (top to down) solar irradiance, dither gain ( signal) and PV power during a cycle of 2.4 s (chosen shorter to obtain a reasonable simulation time duration, but similar to a 24-h cycle for the variation of solar irradiance and which can highlight the performance of the proposed strategies to be analyzed in this paper).
It can be seen that the dither signal has the amplitude almost zero during the constant solar irradiation and variable during changes in solar irradiation. Thus, the search time of next MPP is reduced, and the MPP is found with 99% accuracy and without power ripple, improving the tracking efficiency.
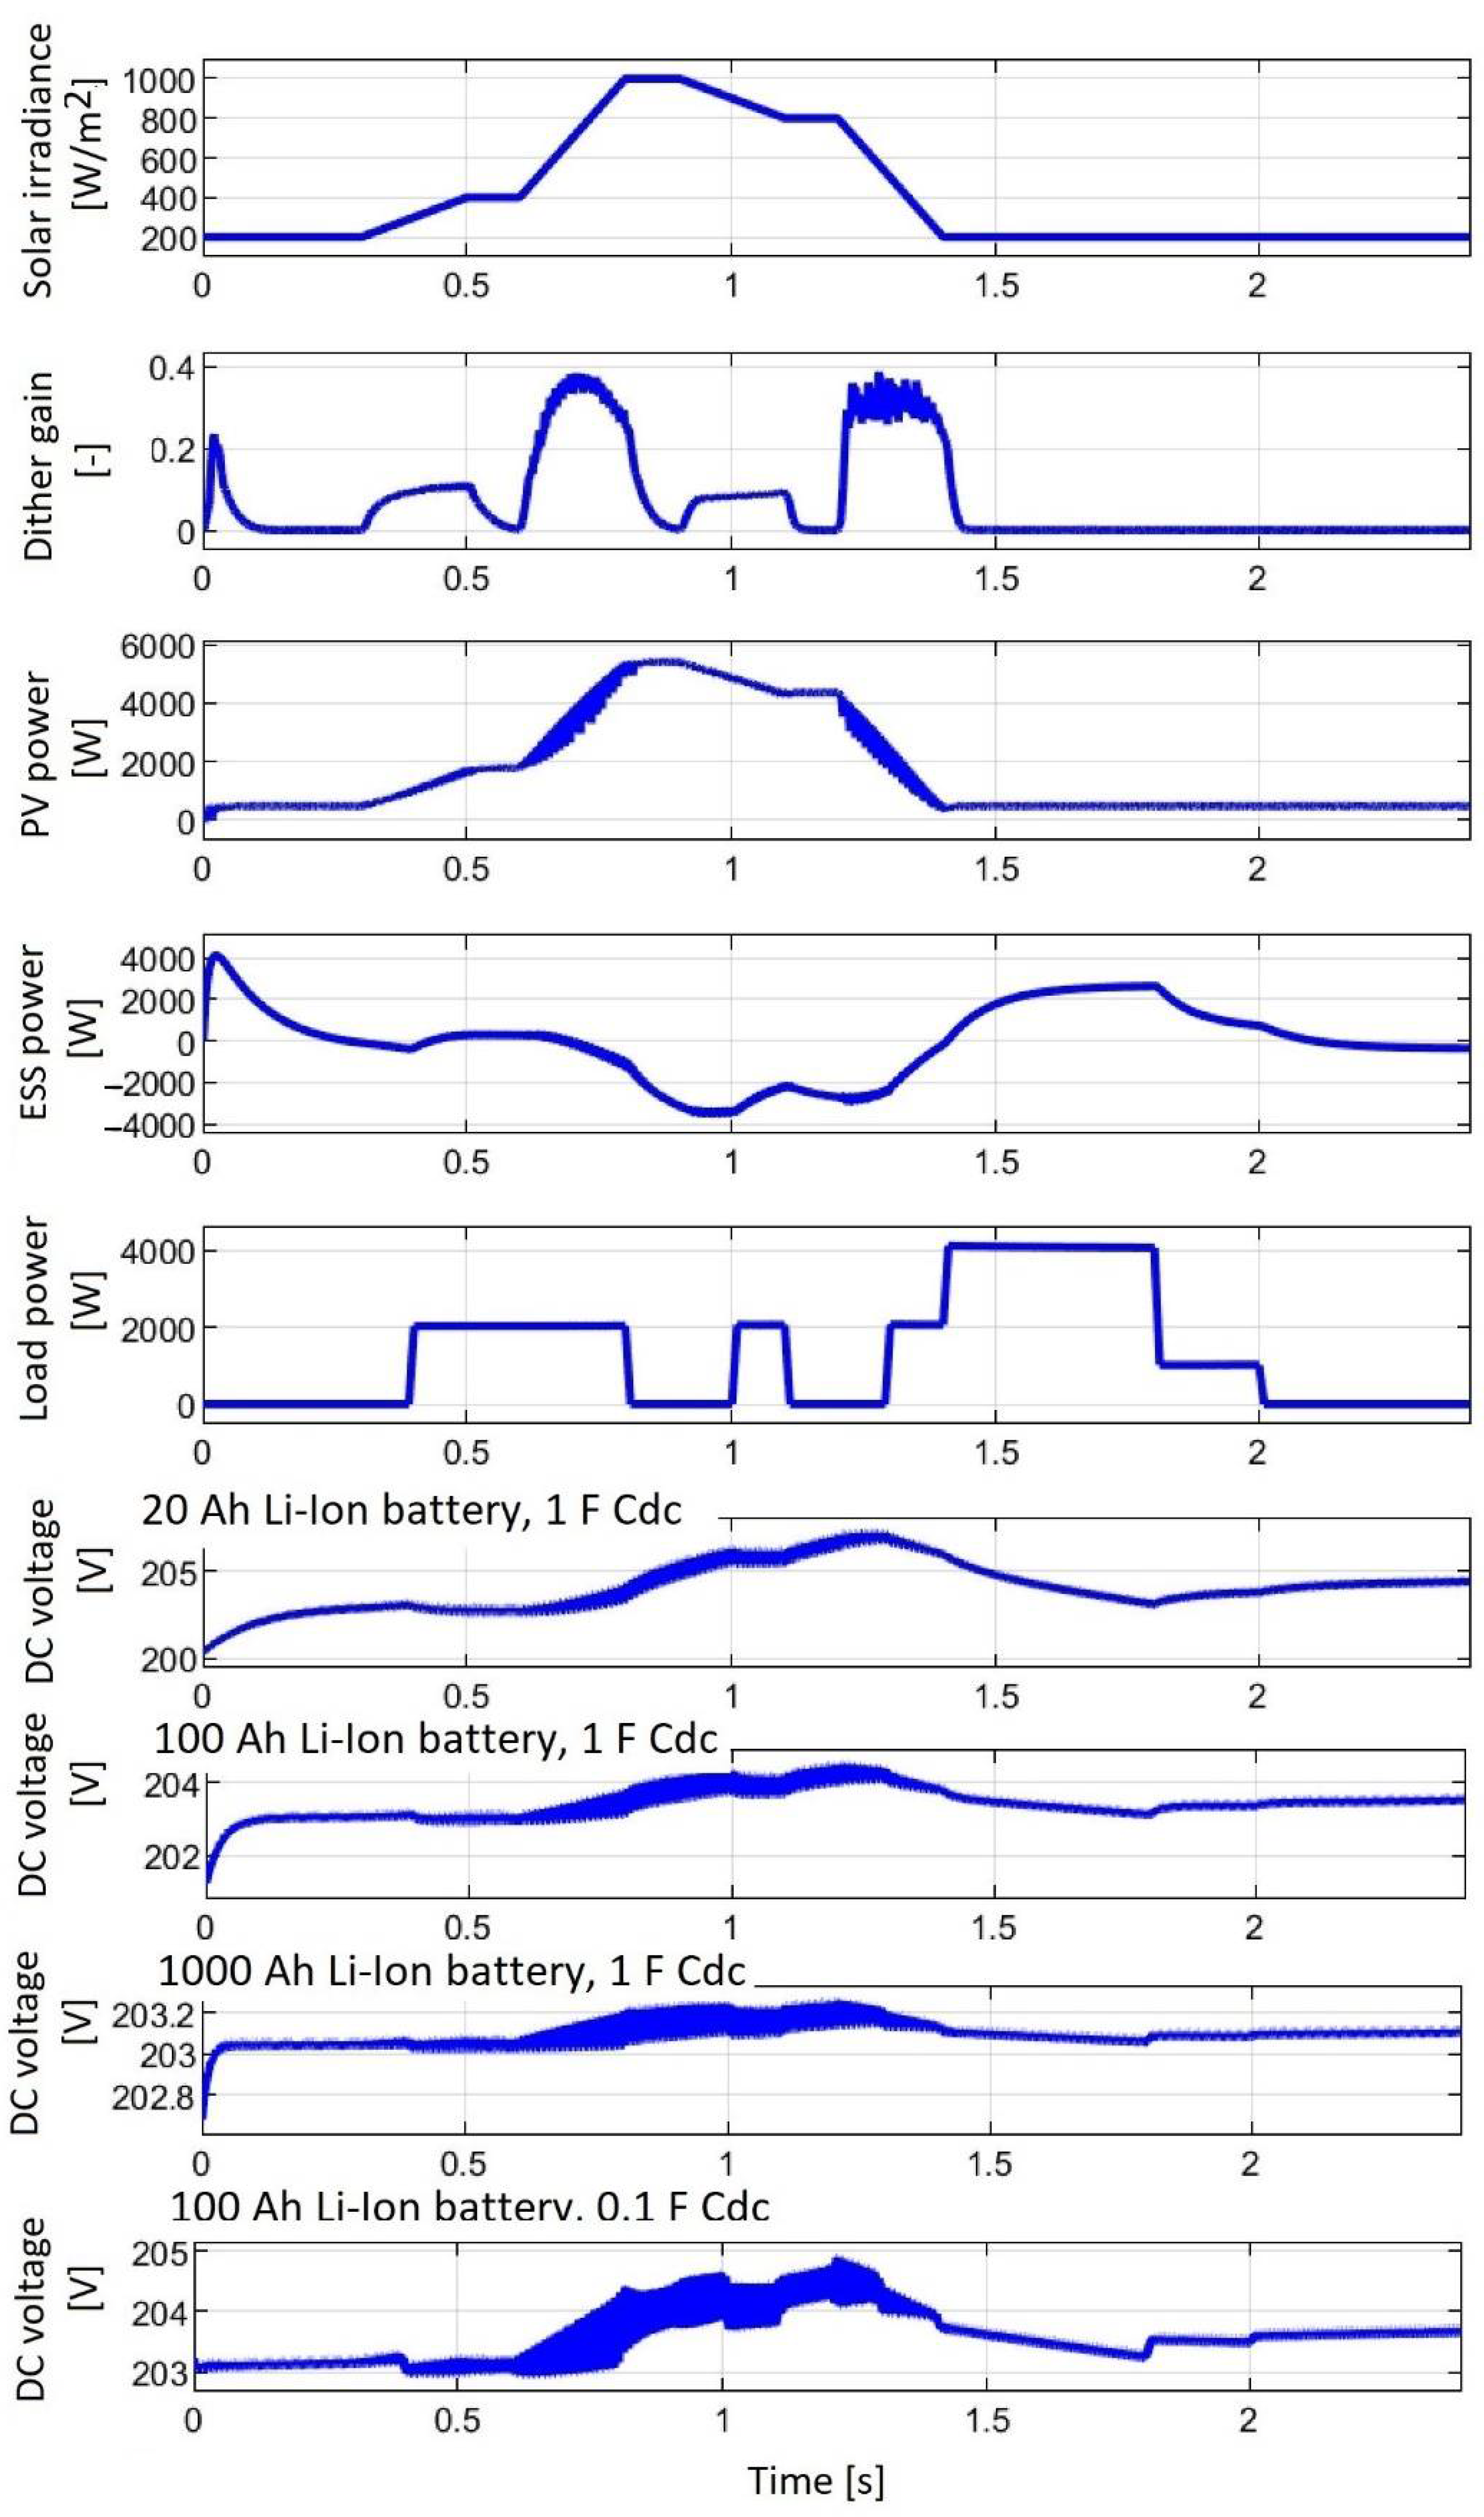
In Figure 8 are added more plots to those presented in Figure 5 to highlight the behavior of the PV system.
Therefore, beside the three plots from Figure 5, in Figure 8 are presented the following plots (top to down): battery power, load power and DC voltage for different values of battery capacity and capacitance mentioned in the last four plots.
The battery power compensates the power flow balance (1) without FC system (), which can be written as below:
Therefore, neglecting the power exchanged by the capacitor, (22) can be written as Equation (23):
This will cause a lot of battery charging and discharging cycles for variable solar irradiation and load demand, which may reduce battery life. In addition, to maintain DC voltage variation in a range of less than 10%, the battery capacity must be greater than 100 Ah. The high frequency noise of the DC voltage is reduced below 1% if the value of the filter capacitor is higher than 1 F.
The behavior of the PV/FC/ESS system (under variable solar irradiance profile with very high slopes and variable load demand with the profile shown in Figure 8) will be analyzed in next section using a filtering capacitor of 1 F and a UC stack of 5 F, but with a battery capacity of only 10 Ah.
4. Results for PV/FC/ESS System
Seven scenarios (SC 1–7) have been defined and summarized in Table 2 to highlight the behavior and performance of PV/FC/ESS system.
4.1. Scenario 1 (SC1)
The first scenario (SC1) consider the solar irradiance and load demand profiles shown in Figure 5 and Figure 8. The total fuel consumption ( estimated with Equation (24) during the 2.4 s load cycle LDP1 and measured in liters [L]) is 0.54372 L, 0.52908 L and 0.5114 L for strategies S0, S1 and S2, respectively.
Note that the fuel flow rate () is measured in liters per minute (Lpm). Therefore, for a cycle different to 60 s, it is necessary to use a gain () that is of 1/25 (=2.4 s/60 s) in case studies considered in this paper (see Figure 2 and Figure 3).
For example, it is worth mentioning that the fuel economy for strategy S2 compared to strategy S1 is of 0.01768 L, which means 0.442 Lpm. All data from the scenarios SC 1–7 will be summarized and commented in the discussion section.
4.2. Scenario 2 (SC2)
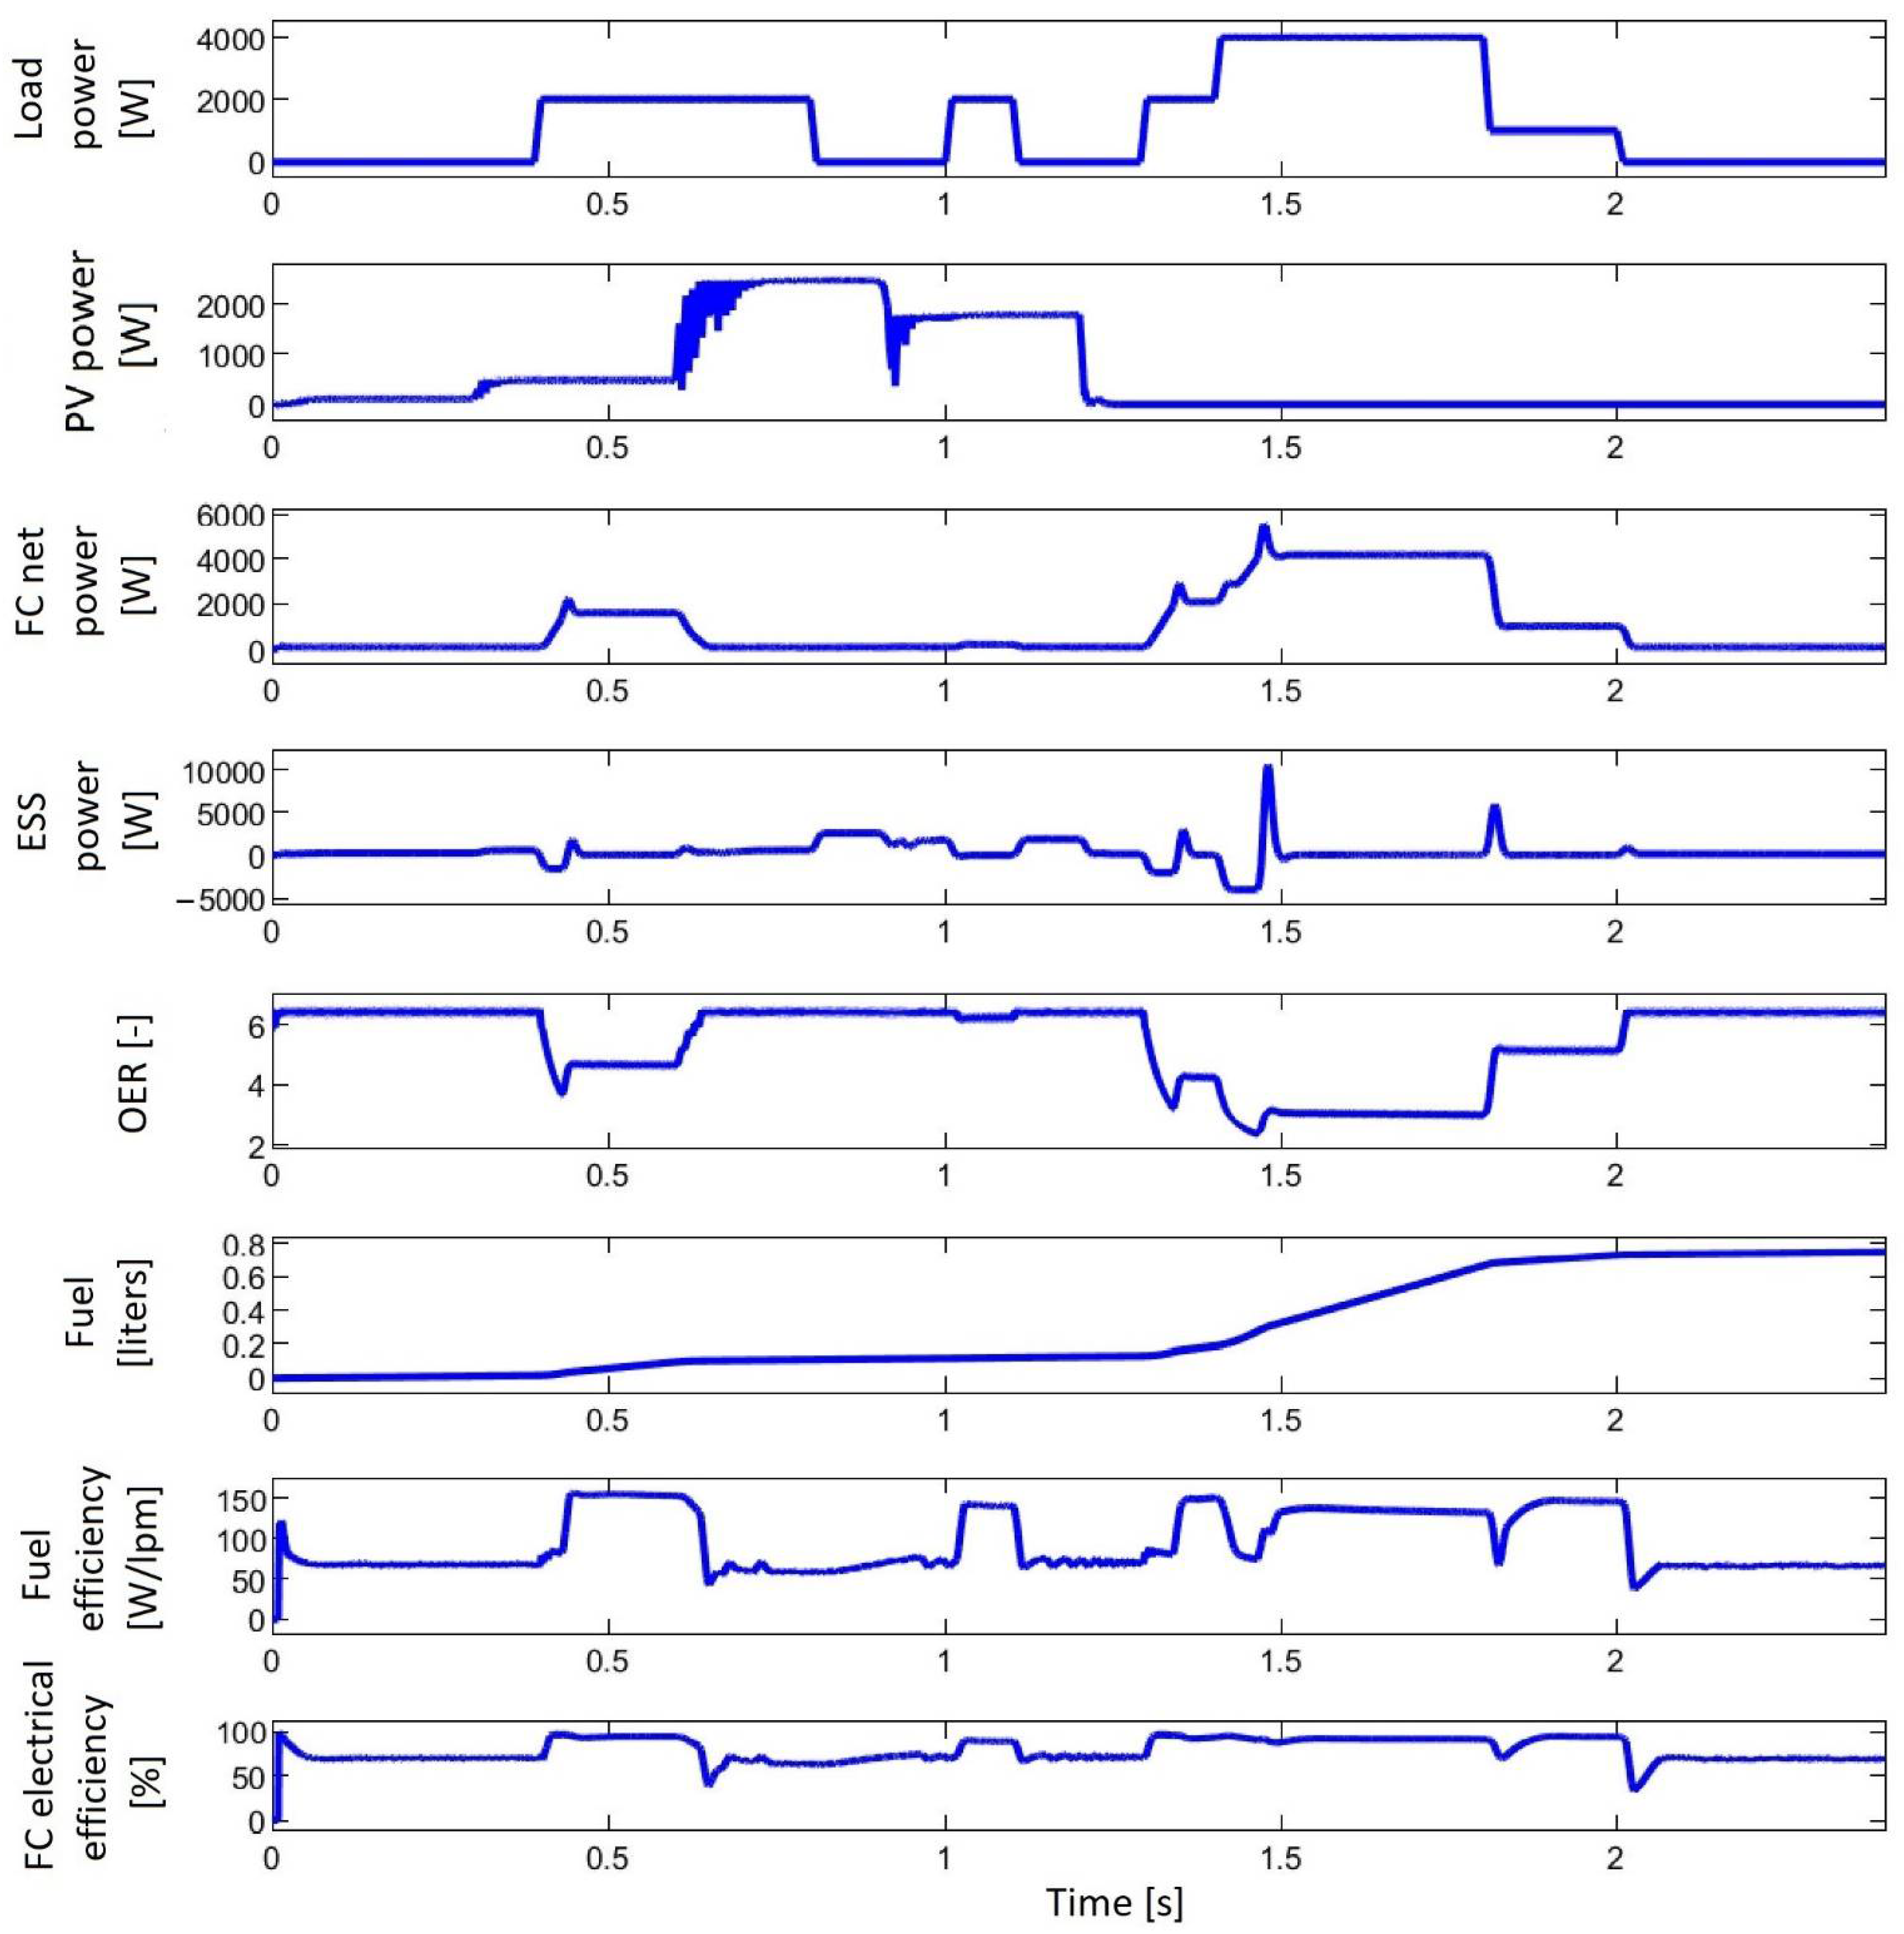
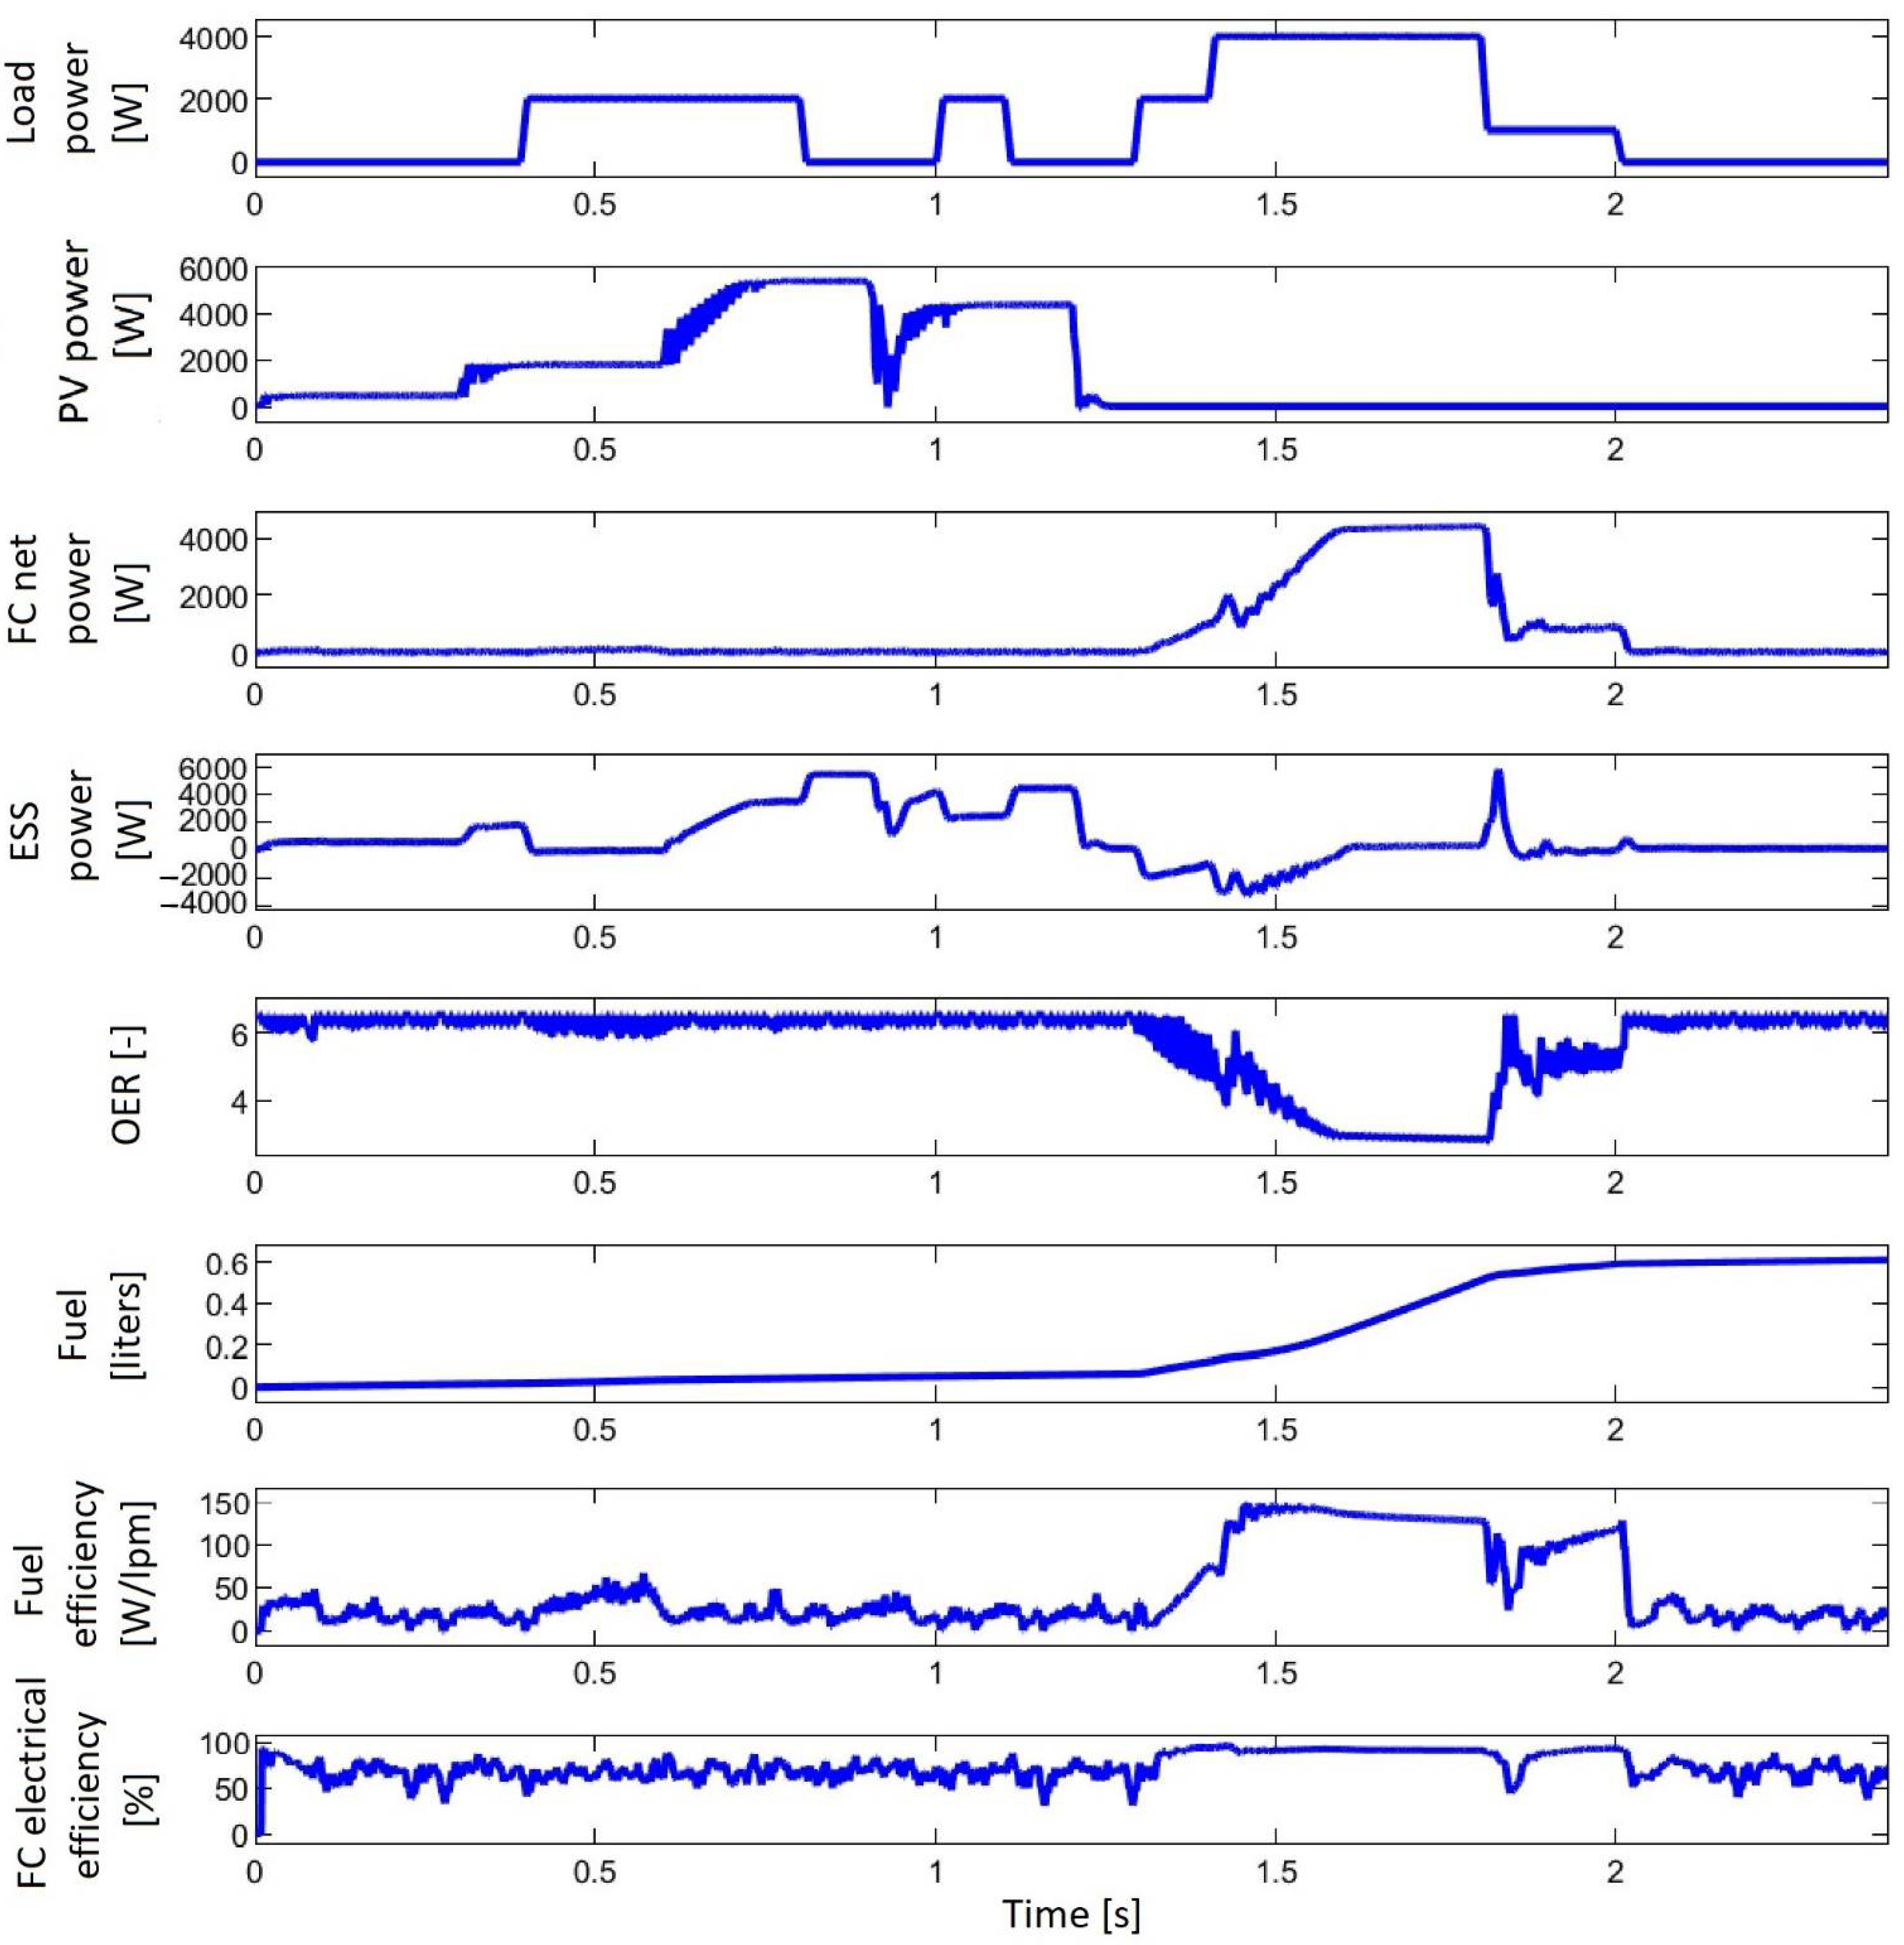
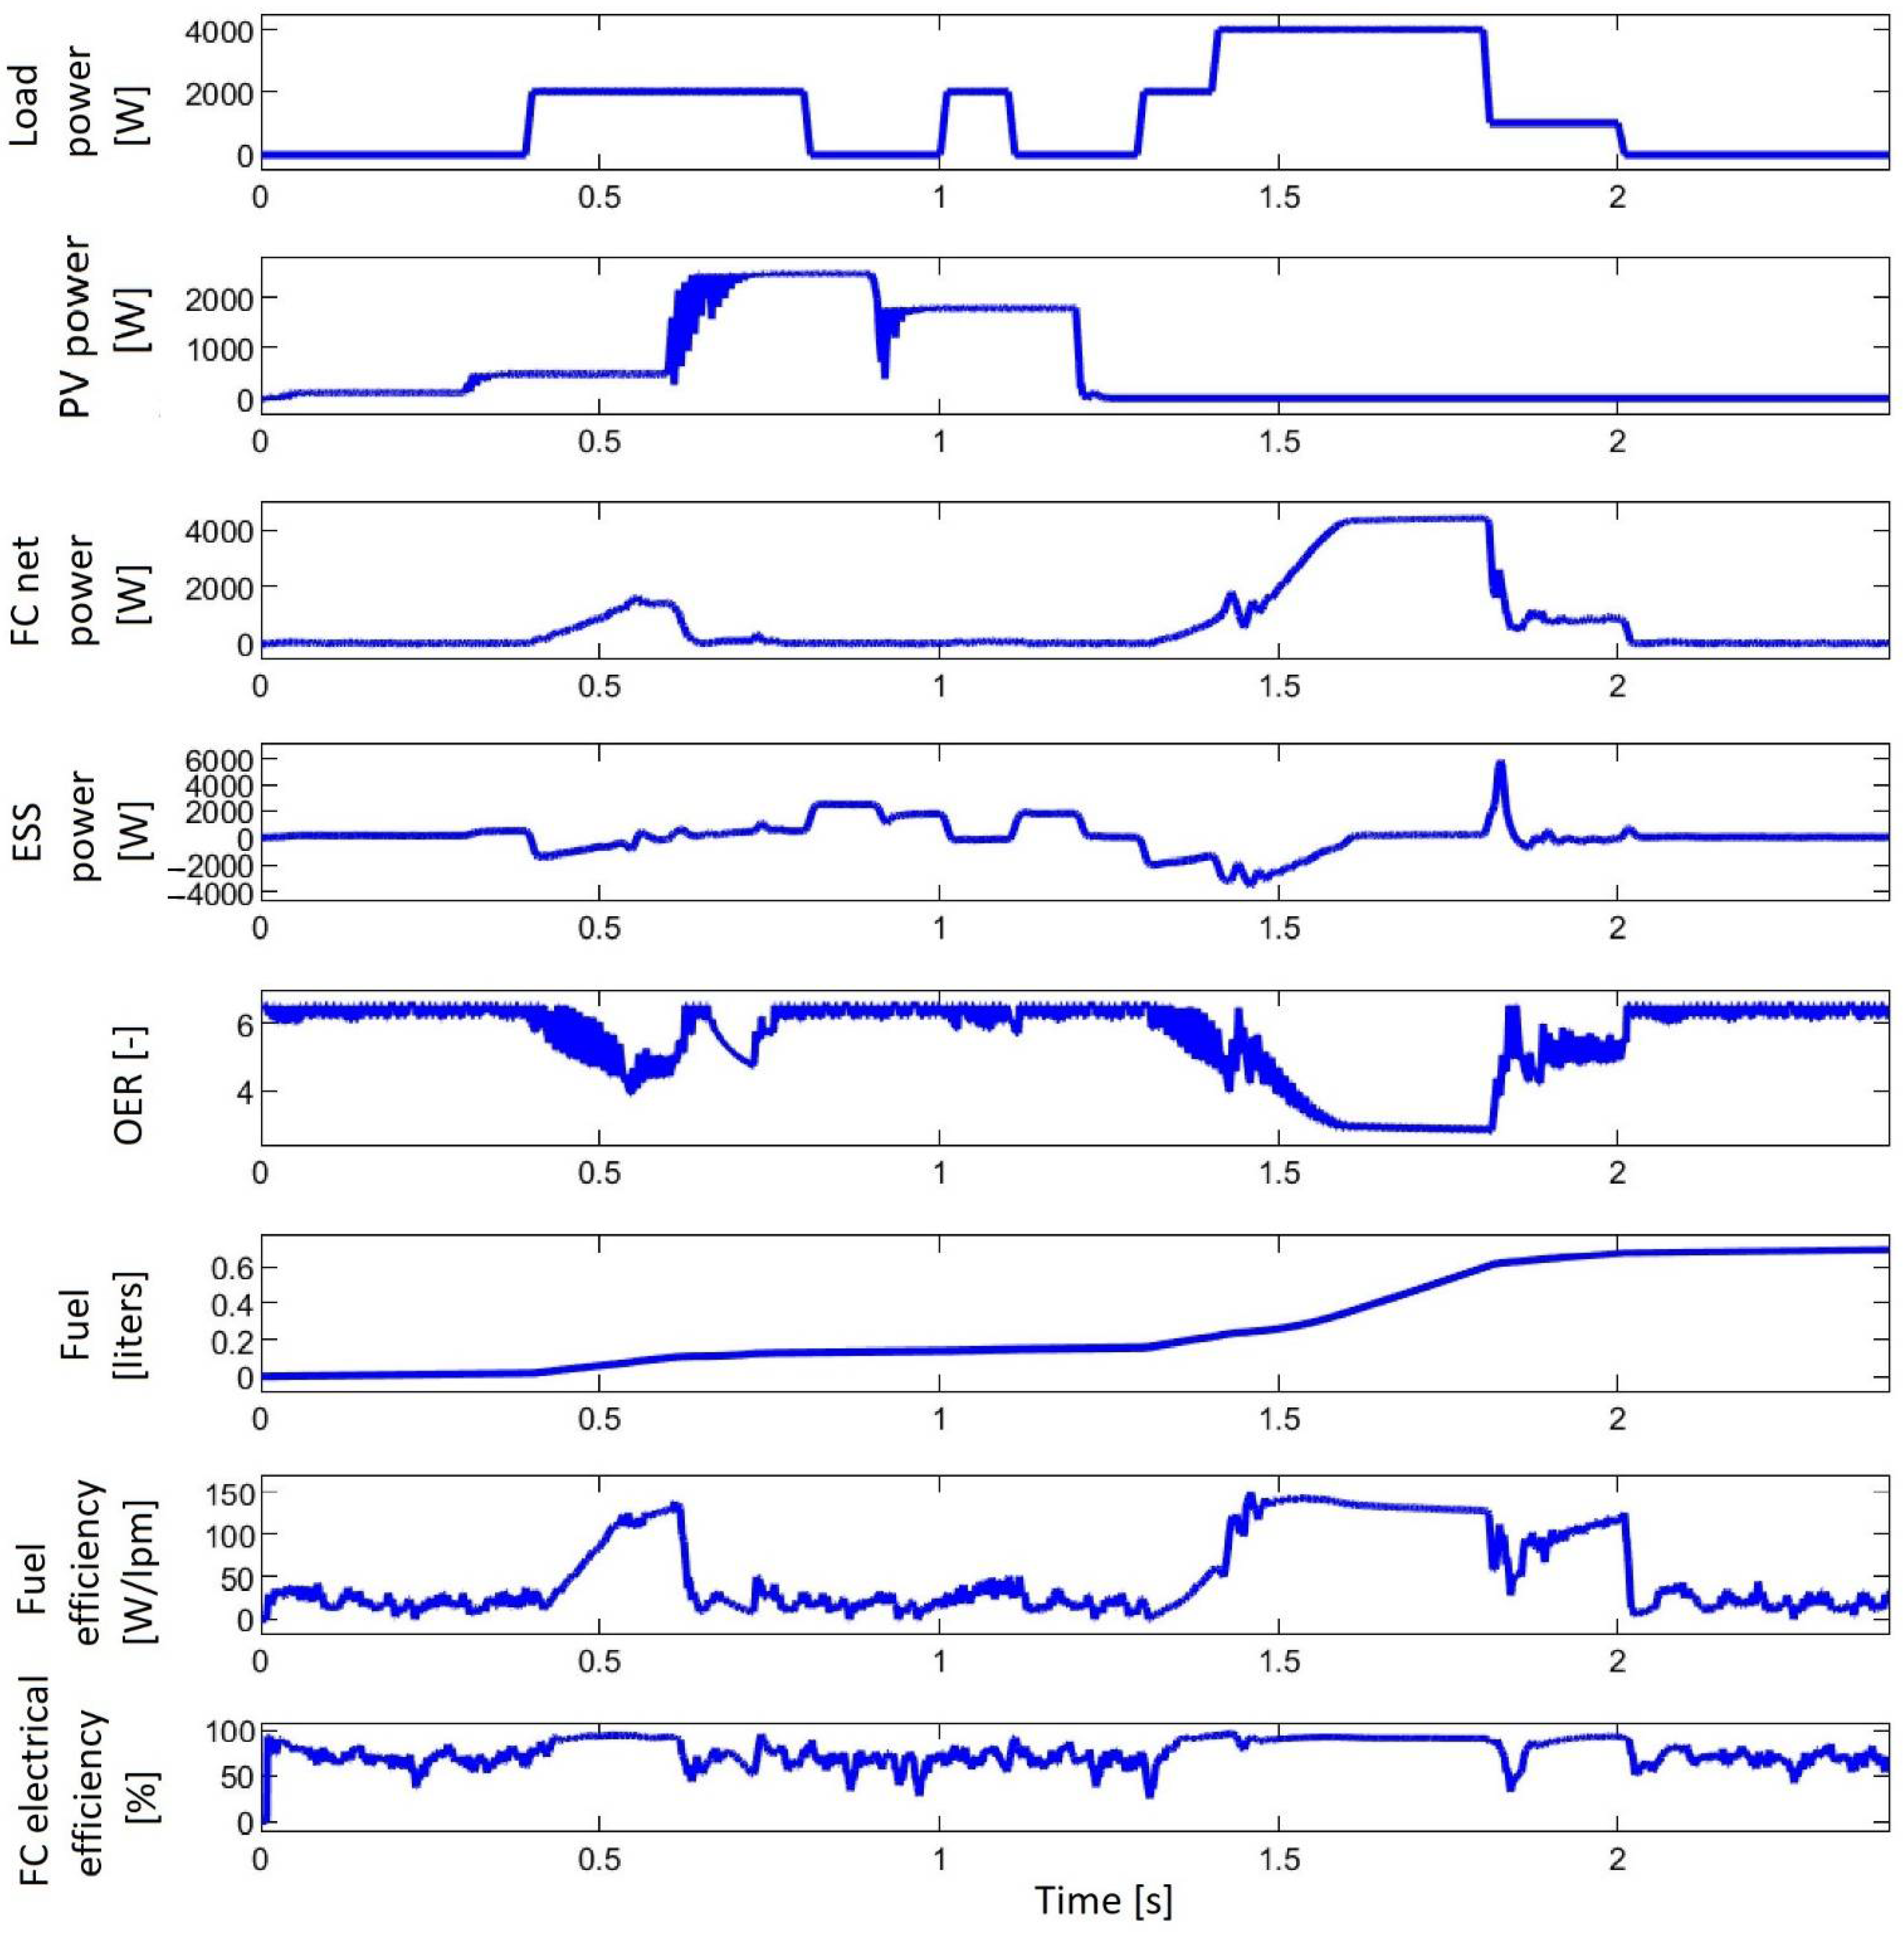
The second scenario (SC2) takes into account the solar irradiance and load demand profiles shown in Figure 7 and Figure 8. The behavior of the PV/FC/ESS system using strategies S0 and S2 is presented in Figure 9 and Figure 10. The plots in Figure 9 and Figure 10 (and those that will be presented in the scenarios below) shown (from top to bottom): load demand profile, harvested PV power, FC net power, ESS power, oxygen excess ratio (OER) estimated using Equation (25), total fuel consumption, fuel consumption efficiency (Fueleff ≅ PFCnet/FuelFr) and FC electrical efficiency (PFCnet/PFC).
where: , , , , , and [48].
It is observed that some differences appear in shapes of the variables plotted for strategies S0 and S2, but these differences are minor for strategies S1 and S2. Therefore, the behavior of the system using the S1 strategy was not represented.
However, it can be mentioned that the FC system operates safely (OER > 2) and the batteries in charge-sustained mode (except for the time interval when PPV > PLoad, when the batteries are charged). If the system also includes an electrolyzer, then it can take up the excess energy (PPV–PLoad) to produce hydrogen, and the batteries would be operated all the time in charge-sustained mode, as shown in scenario SC7 (where PPV < PLoad).
The PV power profile has higher slopes for SIP2 SIP2 compared to SIP1 (see the 3rd plot in Figure 10 compared with the 3rd plots in Figure 8), which means a little less PV power harvested.
The total fuel consumption is 0.6648 L, 0.609 L and 0.593 L for strategies S0, S1 and S2. Therefore, the fuel economy for strategy S2 compared to strategy S1 is of 0. 016 L, which means 0.4 Lpm. The fuel economy for strategy S2 is slightly lower in scenario SC2 than that obtained in scenario SC1 due to the photovoltaic power harvested less in scenario SC2 which had to be offset by the FC system, resulting in additional fuel consumption.
This will be much more evident in the SC3 scenario, where the same load demand profile (LDP1) is kept, but solar irradiance is halved (0.5 × SIP2).
4.3. Scenario 3 (SC3)
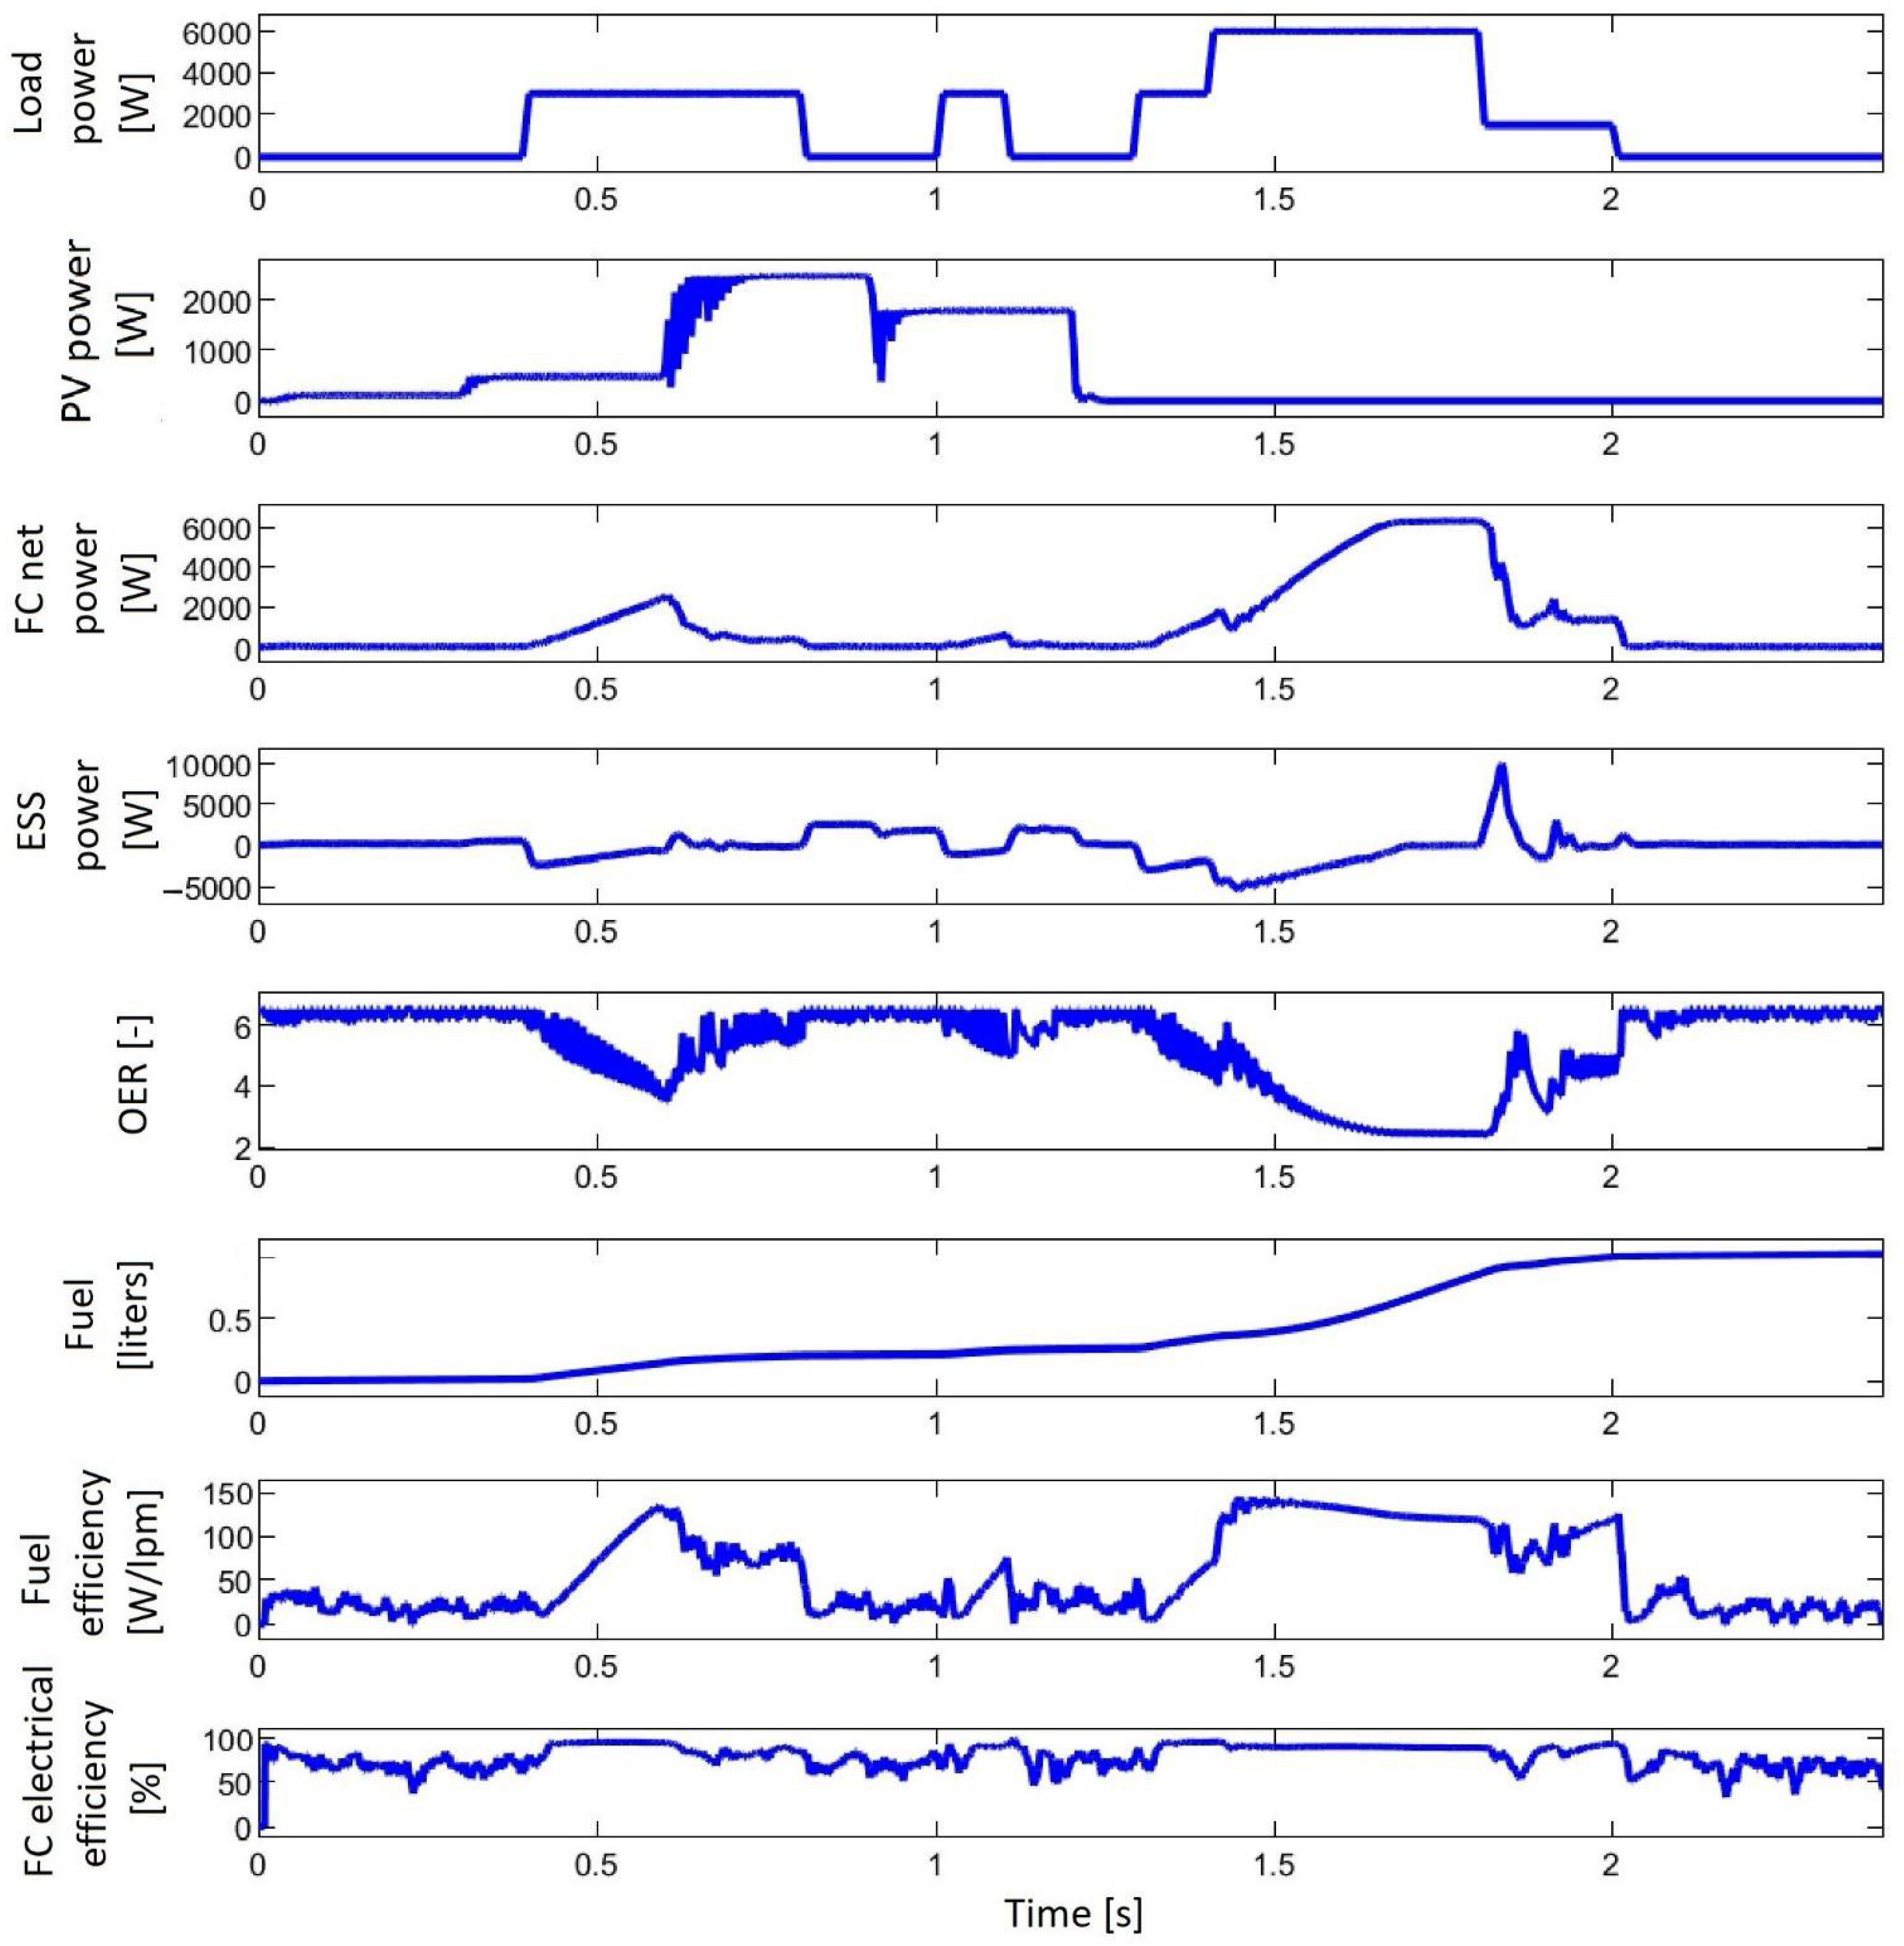
The behavior of the PV/FC/ESS system using S2 strategy is presented in Figure 11.
The FC system will generate additional power in the time interval when PPV < PLoad (between 4 and 6 s) and the batteries will operate in charge-sustaining mode, as shown in Figure 11.
The total fuel consumption is 0.74784 L, 0.696 L and 0.682 L for strategies S0, S1 and S2. Therefore, the fuel economy for strategy S2 compared to strategy S1 is of 0.014 L, which means 0.35 Lpm.
This fuel economy will be almost double and triple in next scenarios (SC4 and SC5), where the same solar irradiance is kept (0.5 ∙ SIP2), but the load demand profile is increased (by multiplying with 1.5 and 2).
This fuel economy will almost double and triple in the next two scenarios (SC4 and SC5), where the same solar irradiation is kept (0.5 ∙ SIP2), but the load demand profile is increased by 150% in the Sc5 scenario, and doubled in the SC5 scenario (multiplying by 1.5 and 2 the LDP1 profile).
4.4. Scenario 4 (SC4)
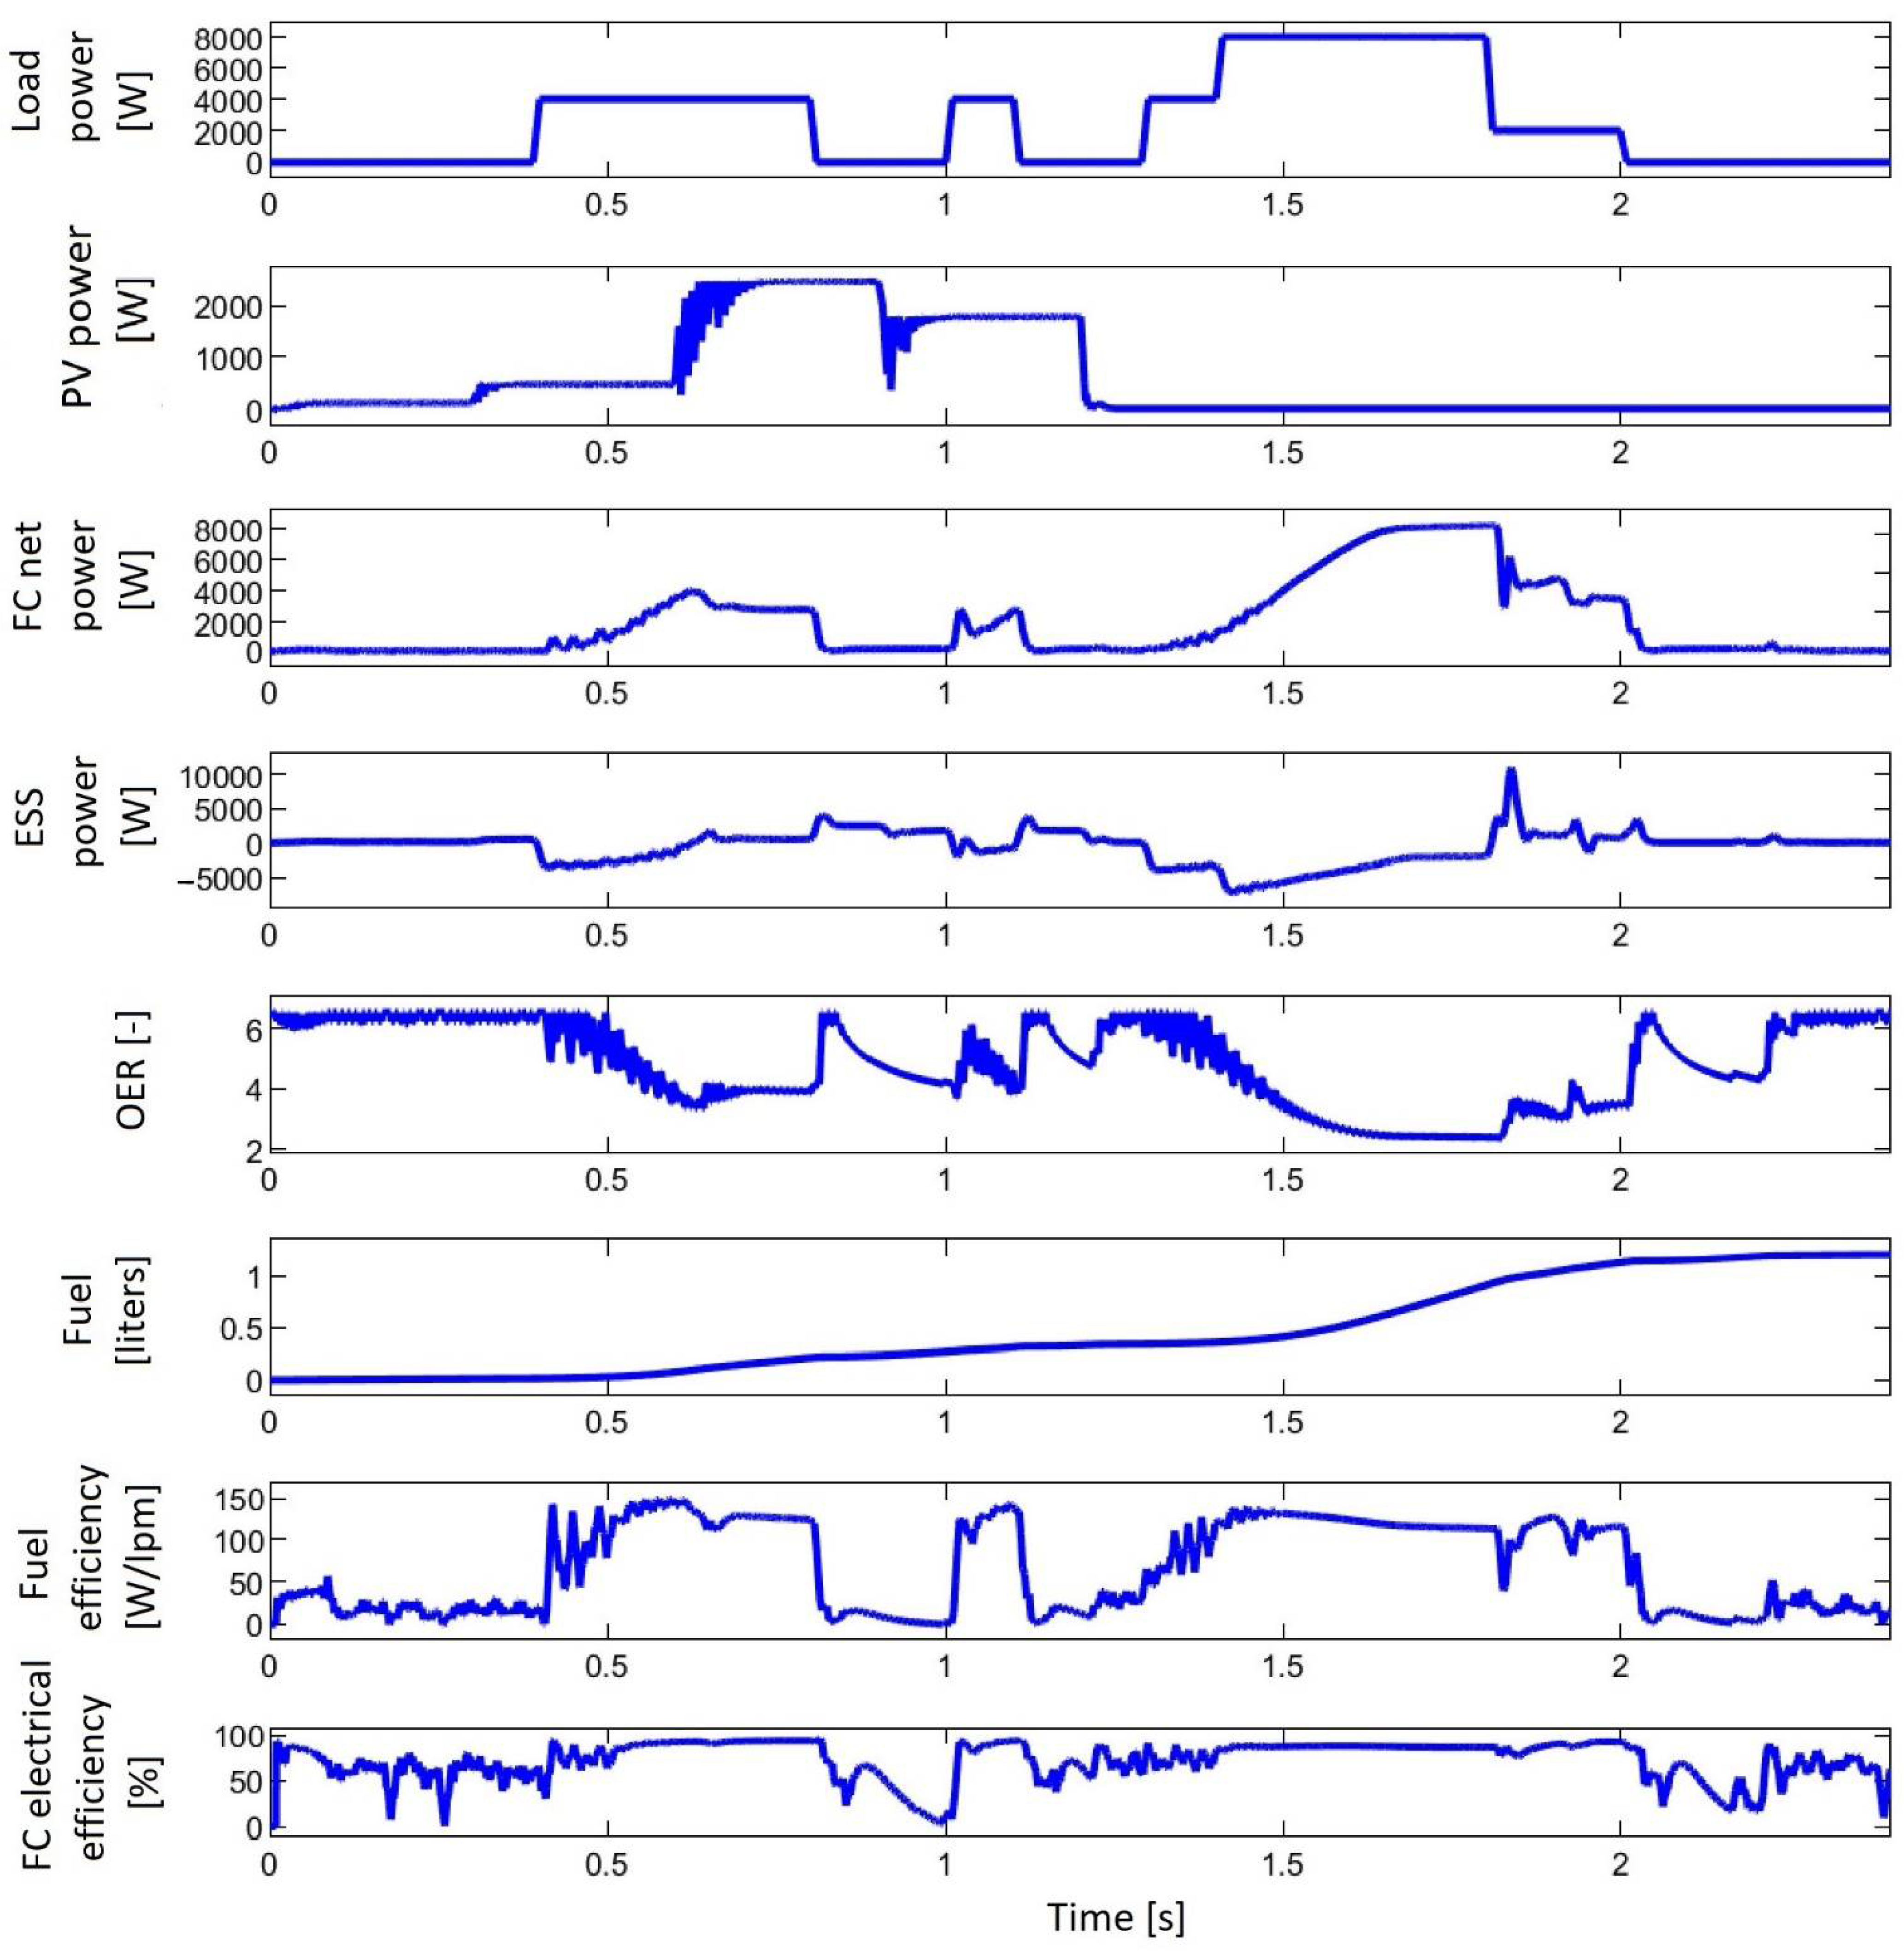
The behavior of the PV/FC/ESS system using S2 strategy is presented in Figure 12 under scenario 4.
As the load demand profile is increased compared to scenario SC3, more FC power will be requested to compensate the power flow balance on the DC bus. Thus, the total fuel consumption will be 1.2624 L, 1.027 L and 1.001 L for strategies S0, S1 and S2. Therefore, the fuel economy for strategy S2 compared to strategy S1 is of 0.026 L, which means 0.65 Lpm. Compared to the fuel economy of 0.35 Lpm resulted in scenario SC3, fuel economy of 0.65 Lpm resulted in scenario SC3 increased about twice.
To test whether the fuel economy for the S2 strategy compared to that for the S1 strategy increases with FC power, double the load demand profile is used in the following scenario.
4.5. Scenario 5 (SC5)
The behavior of the PV/FC/ESS system using strategies S1 and S2 is shown in Figure 13 and Figure 14 for scenario 5. As mentioned before, minor differences can be observed in the form of the representations in the graphs of Figure 13 and Figure 14. However, the fuel economy obtained using the S2 strategy proposed in this paper is higher than that obtained using the S1 strategy. The total fuel consumption will be 1.46676 L, 1.249 L and 1.213 L for strategies S0, S1 and S2.
Therefore, the fuel economy for strategy S2 compared to strategy S1 is of 0.036 L, which means 0.9 Lpm. Compared to the fuel economy of 0.35 Lpm resulting in scenario SC3, the fuel economy of 0.9 Lpm resulting in scenario SC5 increased about three times.
It turns out that a linear dependency relationship is obtained between fuel economy and FC power. This aspect will be analyzed in future papers, where a linear dependency relationship between fuel economy and FC power will researched for PF control-based strategies.
It can be noticed that the PF control ensures the operation of the batteries in charge-sustained mode (see the fourth plot in Figure 12, Figure 13 and Figure 14). In order to fully highlight that the PF control ensures the operation of the batteries in charge-sustained mode, a load demand of 6 kW is considered in scenario 7, which is higher than the PV power obtained at a solar irradiance of 0.5 ∙ SIP2.
4.6. Scenario 6 (SC6)
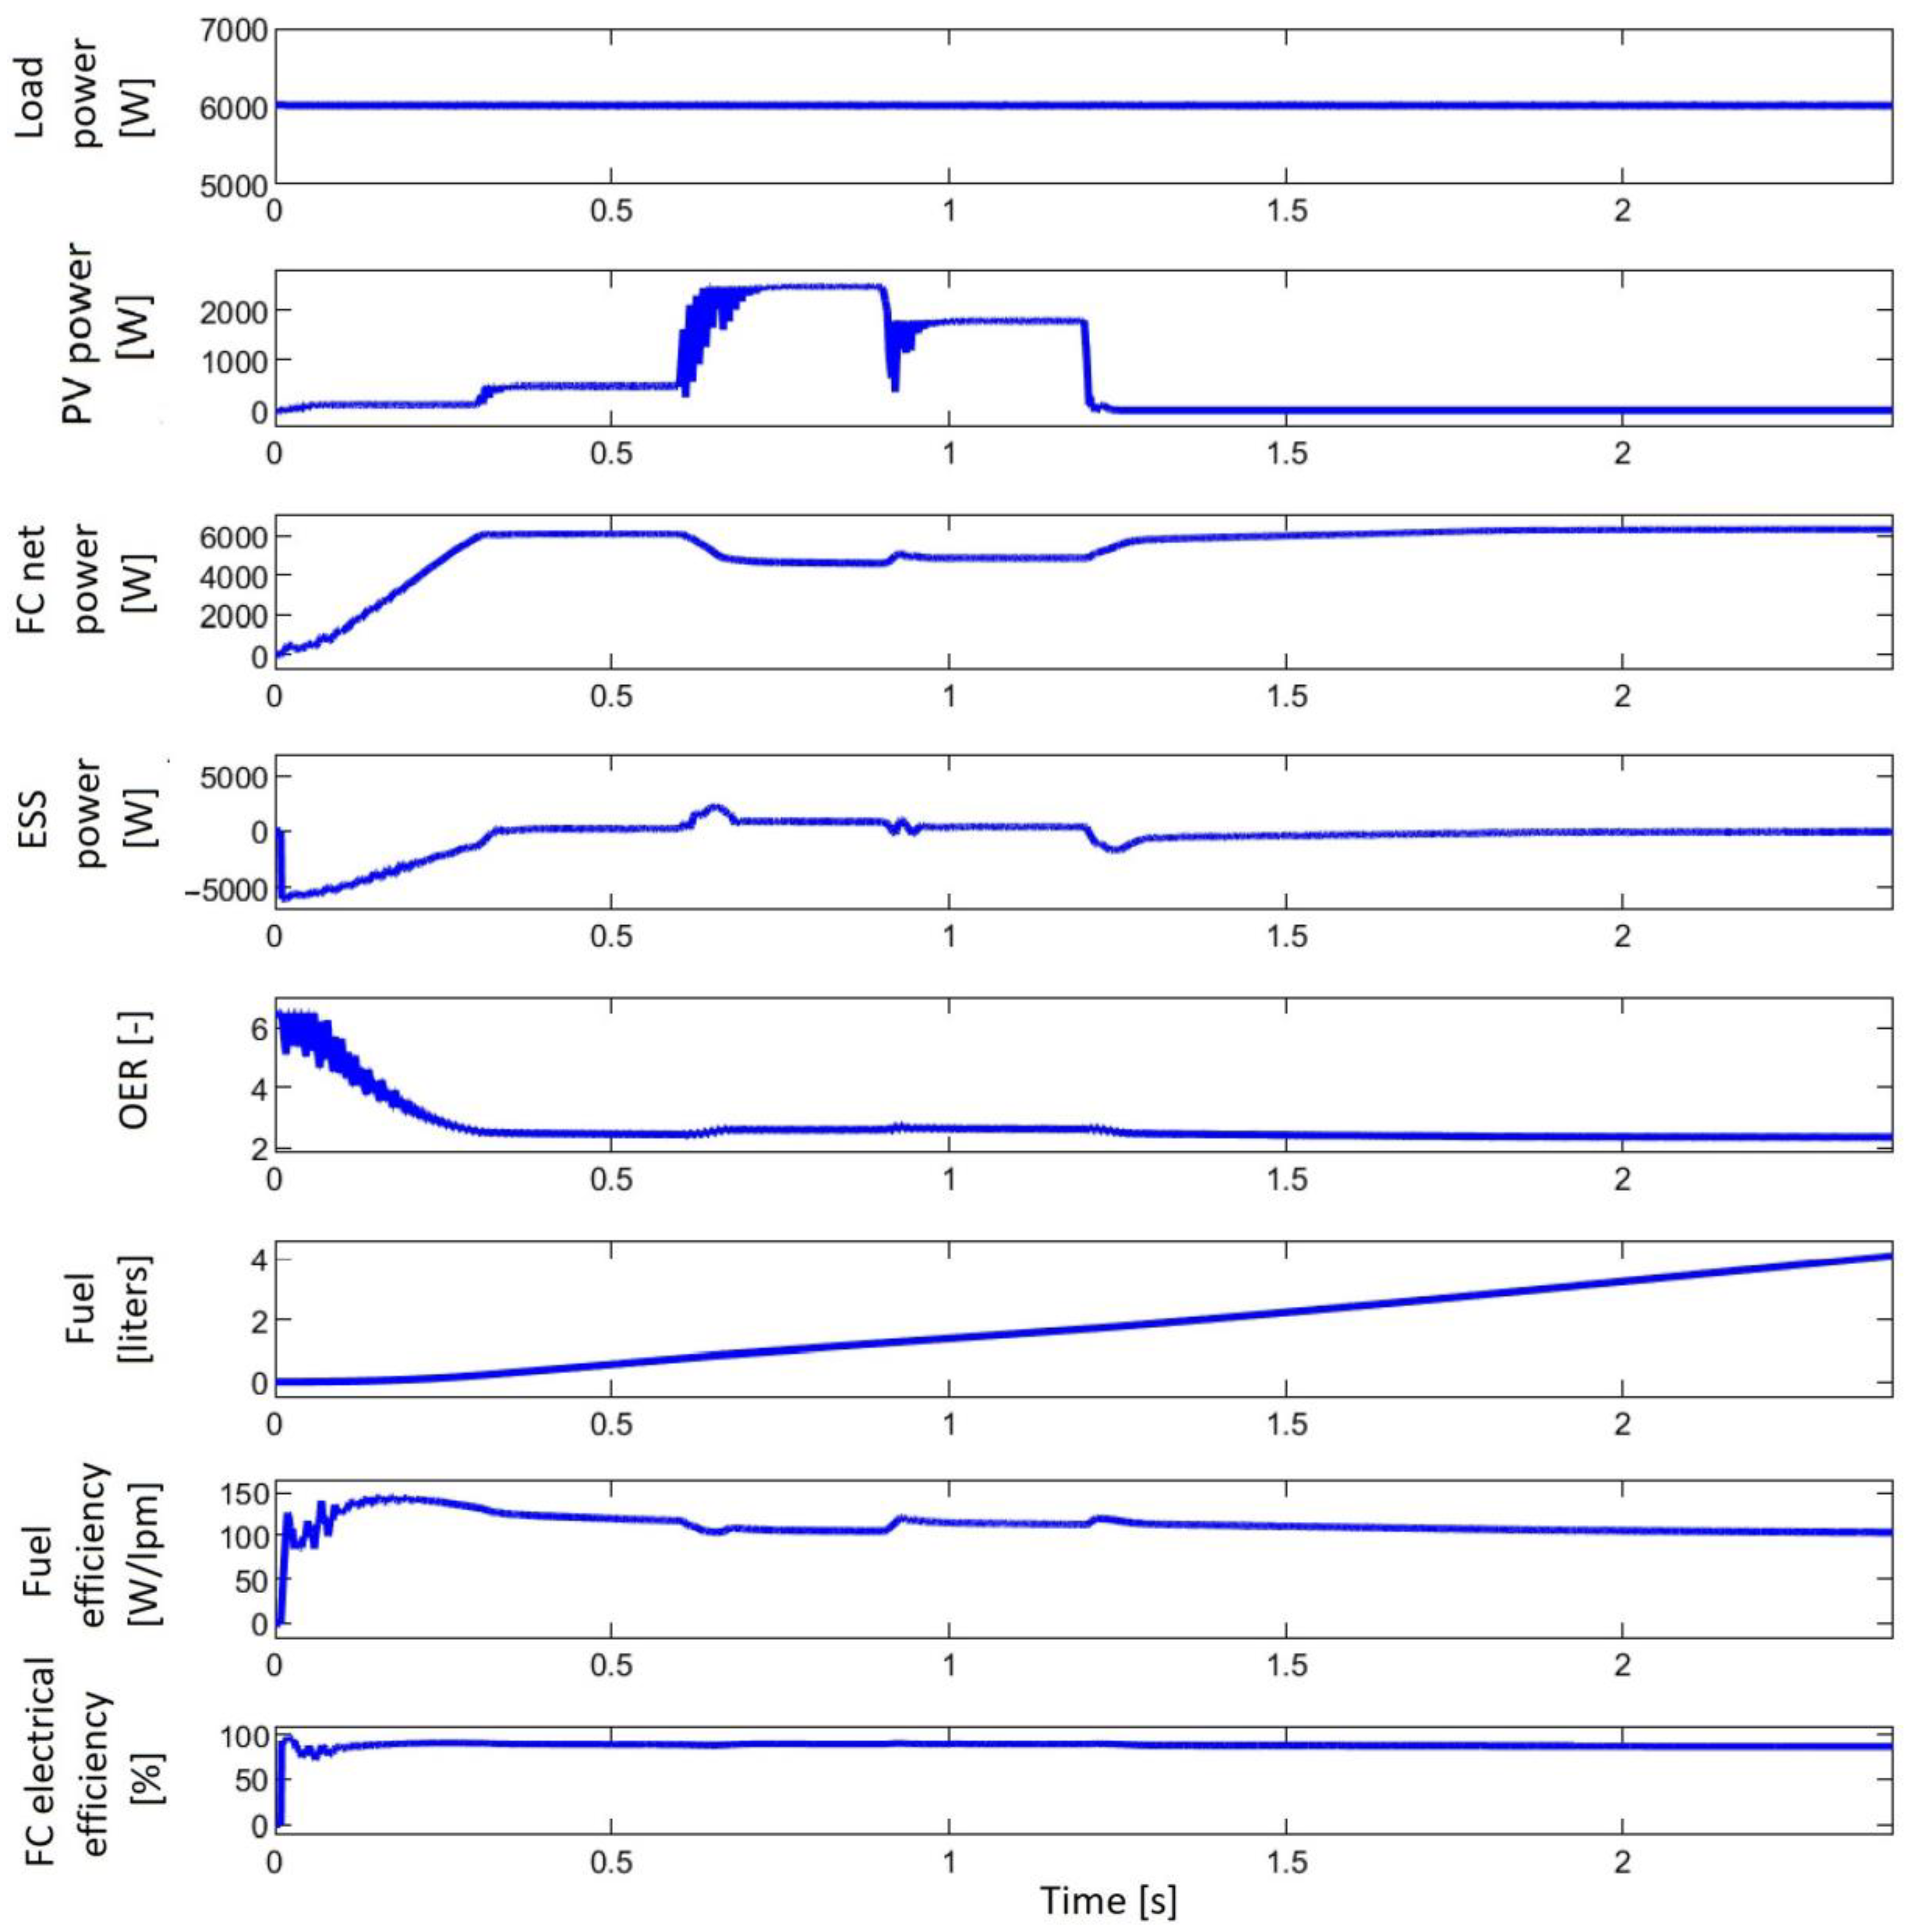
The behavior of the PV/FC/ESS system using strategy S2 is shown in Figure 15 for scenario 6. As mentioned before, a load demand of 6 kW is higher than the PV power obtained at a solar irradiance of 0.5 ∙ SIP2 (see plots 1 and 2 in Figure 15). Therefore, except for starting the FC system (see plot 3 in Figure 15) and sharp changes in the PV power or load demand, the battery operates in charge-sustained mode (see plot 4 in Figure 15).
The FC system operates safely (with OER higher than 2) and efficiently (see plot 5, and plots 7 and 8 in Figure 15, respectively). The total fuel consumption (see plot 6 in Figure 15) will be 4.23 L, 4.093 L and 4.026 L for strategies S0, S1 and S2. Therefore, the fuel economy for strategy S2 compared to strategy S1 is of 0.067 L, which means 1.6750 Lpm.
4.7. Voltage Variation
The DC voltage variation of the PV/FC/ESS system using strategy S2 is shown in Figure 16 for scenario 3. For the designed values of the battery, UC and mentioned in Table 1, the DC voltage is very well regulated (see plot 3 in Figure 16) under sharp profiles of the solar irradiance and load demand (see plots 1 and 2 in Figure 16).
The filtering role of the capacitor (reduction of high frequency noise due to the switching control that is added to the DC voltage) is shown in plot 4 in Figure 15.
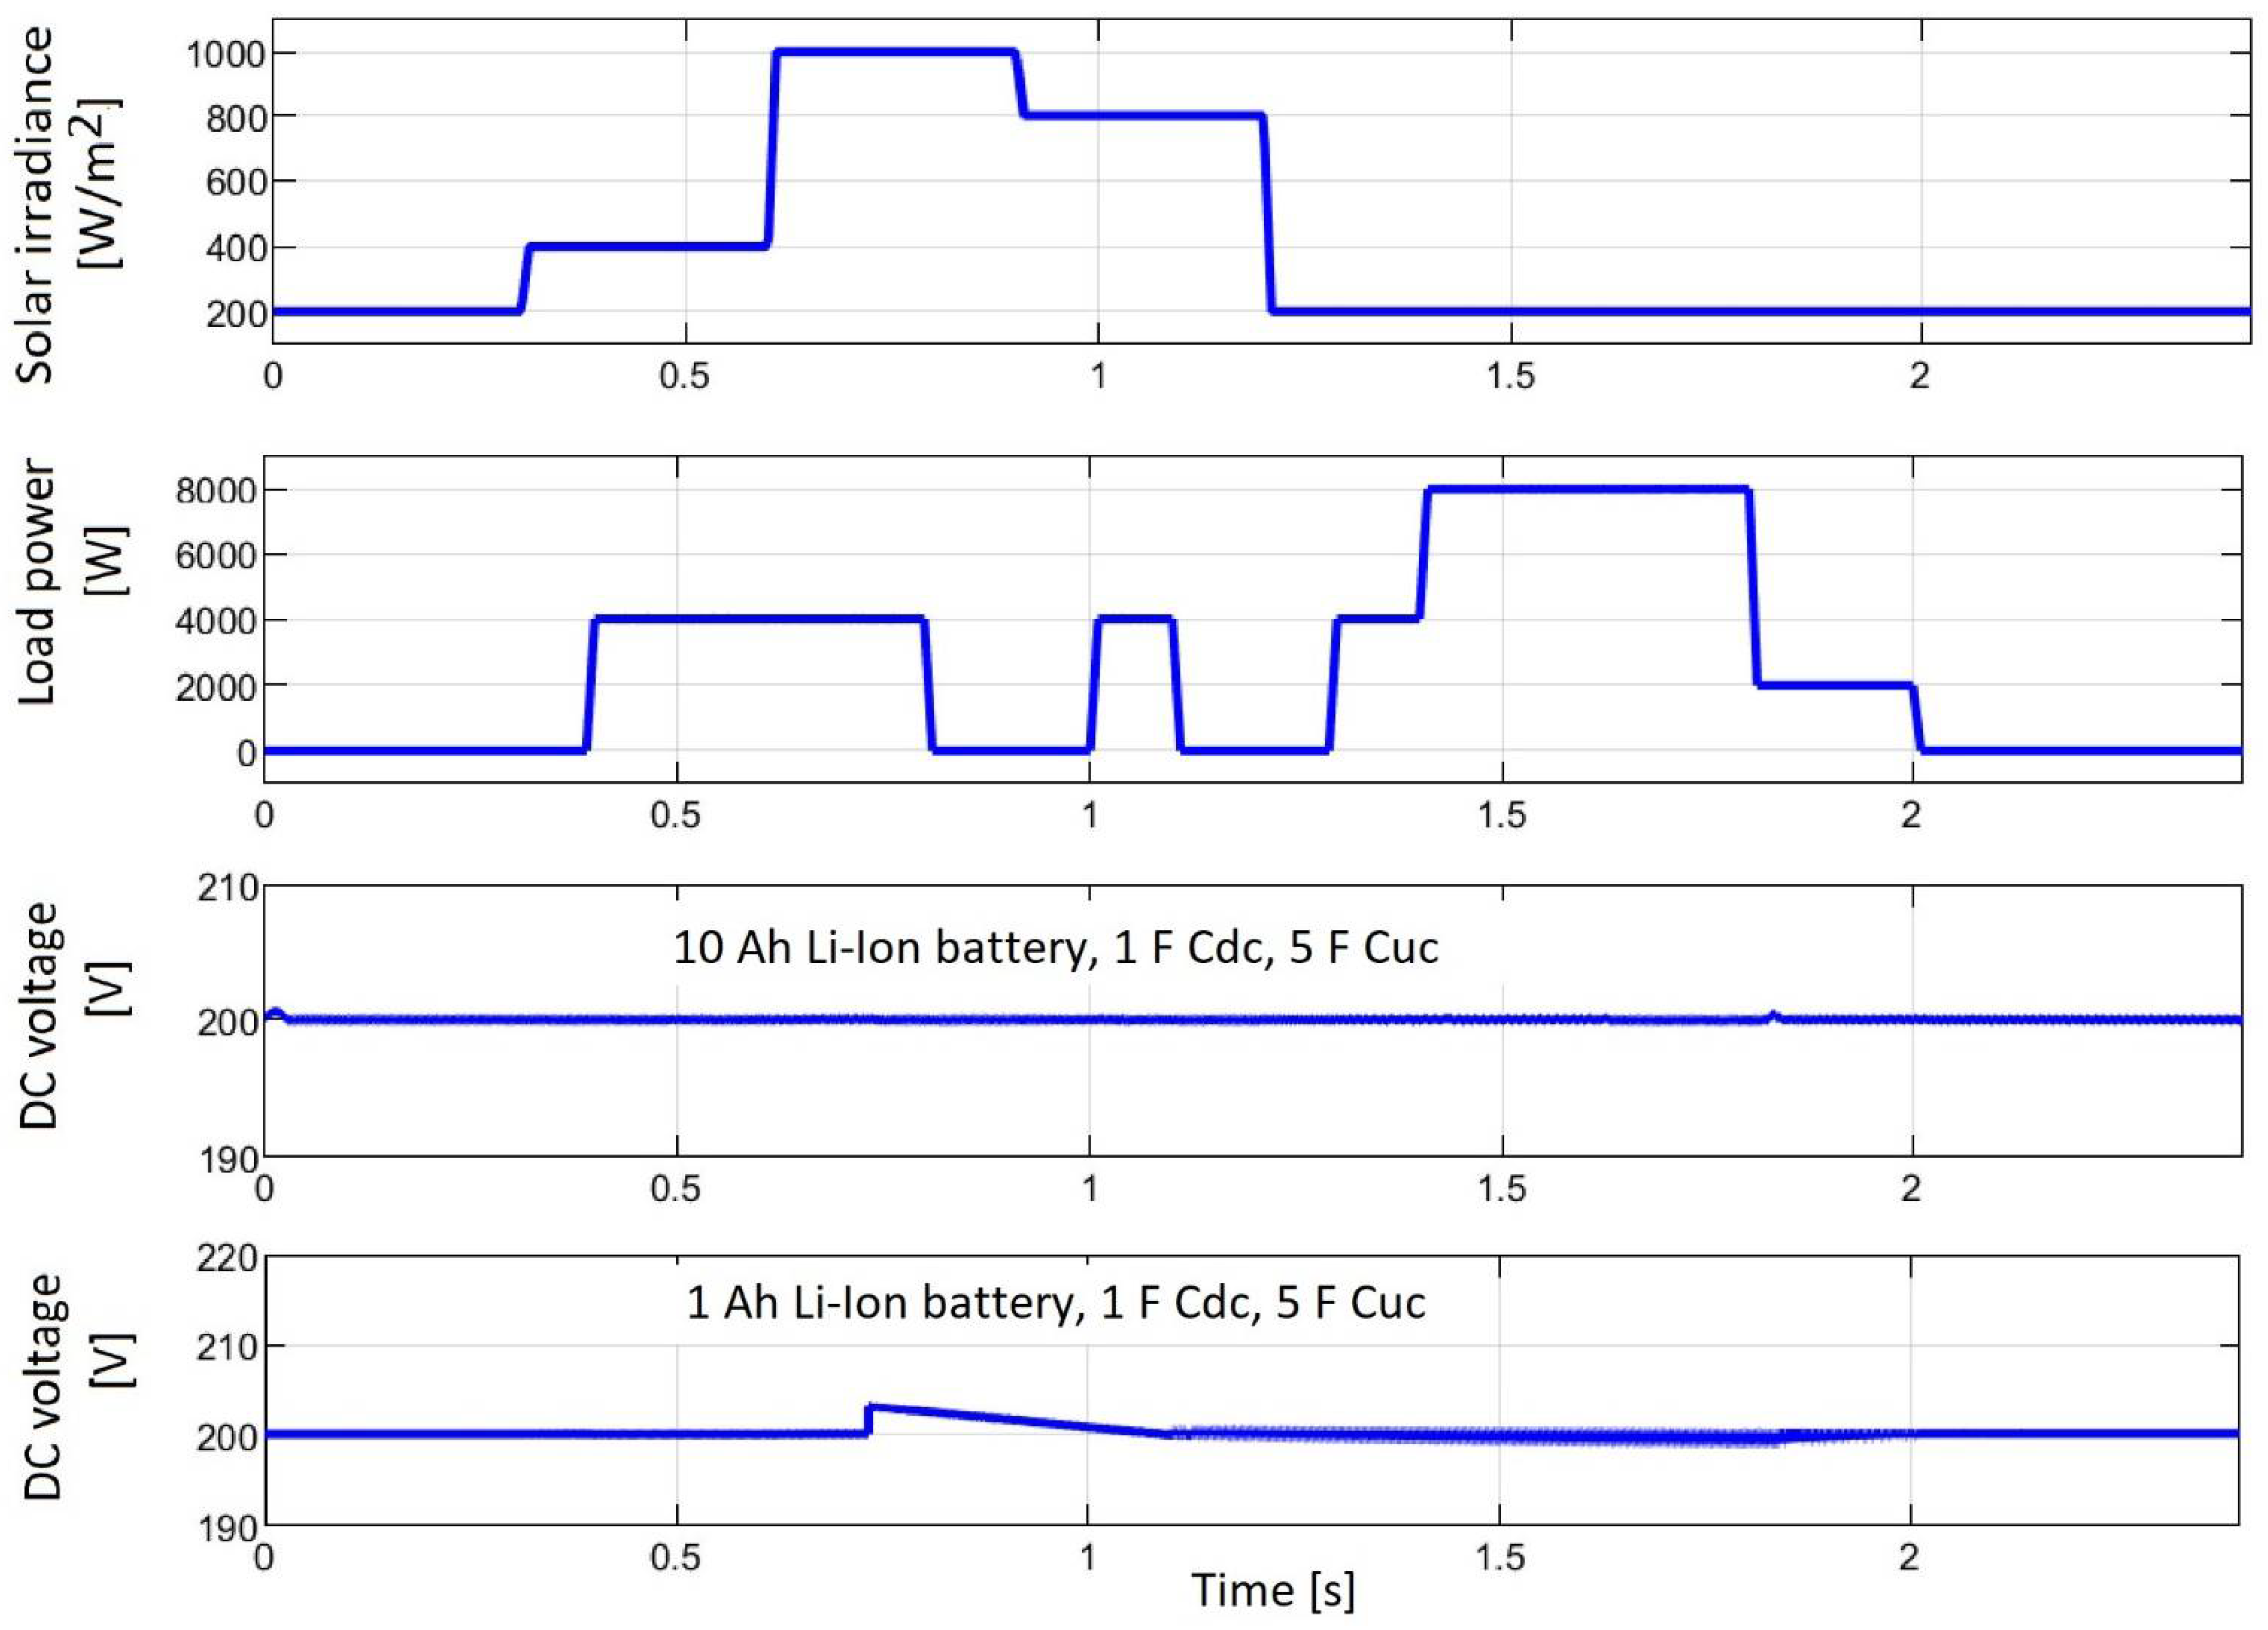
The DC voltage variation of the PV/FC/ESS system using strategy S2 is shown in Figure 17 for scenario 7, in which the solar irradiance is for a sunny day (see diagram 1 in Figure 17) and the load demand requires a FC power close to the maximum value of 8.3 kW (see plot 3 in Figure 14).
It can also be seen that for the projected values of the battery, UC and mentioned in Table 1, the DC voltage is still very well regulated, even for a battery capacity of 1 Ah. (see plots 3 and 4 in Figure 17).
The overvoltage observed on the DC voltage (see plot 4 in Figure 17) is due to the fact that PPV > PLoad and the battery will be operated in charging mode. Note that this study did not include an electrolyzer as DC load controlled by excess energy on the DC bus. The control of the electrolyzer based on the excess energy on the DC bus must be maintained to avoid the frequent connection of the electrolyzer to the DC bus and this will be tested in next work for different scenarios.
The results obtained in different scenarios for total fuel consumption are centralized and processed in the next section to analyze the fuel economy obtained using strategy S2 compared to strategies S0 and S1.
5. Discussion
The total fuel consumption during a 2.4 s cycle () and 60 s cycle () was mentioned in the previous sections in different scenarios considered in this study and summarized in Table 3 and Table 4.
Percentage decrease in fuel consumption ( and ) has been estimated for strategy S2 compared to strategies S0 and S1 using (26) and (27) and the values from Table 3 or Table 4, and registered in Table 5:
It is worth mentioning that the percentage decrease in fuel consumption for the proposed S2 strategy depends on the level of FC power generated (which is set by the profiles of the solar irradiance and load demand, considering the power flow balance on the DC bus and the proposed PF control), being in range 4.82–20.71% and 1.64–3.34% compared to strategies S0 and S1, respectively.
Percentage decrease in fuel consumption has been estimated for strategy S1 compared to strategy S0 in [32] using (28) for a given profile of the renewable power (a different scenario compared to SC1–SC6):
The reported result was 13.43%, so the values obtained for in the scenarios considered in this study are in the same range (see Table 5), validating the performance of the proposed S2 strategy compared to the S1 strategy.
6. Conclusions
The new fuel economy strategy (S2 strategy) is proposed in this paper based on PF control and a new technique for switching input references for fuel regulators. The S2 strategy uses the GES control of the DC–DC power converter that interfaces the FC system with the DC bus to maximize fuel economy. A new fuel optimization function based on fuel efficiency and FC electrical efficiency is proposed.
The fuel economy obtained with strategy S2 is compared with other two strategies based on the PF control: strategy S1 [32] and strategy S0 [34].
The main findings of this research study are as follows:
- ▪
- The advantage of using a FC system based on PF-control as a backup energy source in a PV/FC/ESS system is highlighted by the operation of the battery in charging mode, which leads to increased life by avoiding frequent charge–discharge cycles;
- ▪
- The performance of the S2 strategy compared to the S1 and S0 strategies is demonstrated by the fuel economy obtained in different operating scenarios of the PV/FC/ESS system;
- ▪
- The percentage decrease in fuel consumption for the proposed S2 strategy depends on the level of FC power generated (which is set by the profiles of the solar irradiance and load demand, considering the power flow balance on the DC bus and the proposed PF control), being in range 4.82–20.71% and 1.64–3.34% compared to strategies S0 and S1, respectively, under the scenarios considered in this study;
- ▪
- All strategies based on the proposed PF control operate the battery stack in charge-sustained mode with advantages related to its size and lifespan;
- ▪
- The new fuel optimization function and the new technique for switching input references for fuel regulators ensure better fuel economy for the S2 strategy compared to other strategies based on PF control.
The advantages of using a FC system as backup energy source for a PV/ESS system are obvious, being related to the battery’s capacity (which is ten times lower for the PV/FC/ESS system compared to the PV/ESS system) and its lifespan, but the fuel economy reported in this research study must be validated on a laboratory prototype, using a control technique based on hardware-in-loop (HIL) in the first step, and then implementation and testing in real environmental conditions.
Limiting the application of PF-control-based strategies is mainly related to implementation costs (use of continuously controlled hydrogen flow valve to regulate FC power instead of an operation of FC system at constant power using a fixed flow valve). To overcome this problem, for example, the FC power range can be divided into eight zones. For the eight values of the FC power, the optimal fuel flows are generated using three fixed flow valves and three on-off switches for the hydrogen flow and the appropriate control of the air compressor. This may be the idea for the next paper.
Author Contributions
Conceptualization, N.B.; methodology, N.B.; validation, N.B. and P.T.; formal analysis, N.B.; writing—original draft preparation, N.B.; writing—review and editing, N.B. and P.T.; visualization, P.T.; supervision, P.T. Both authors have read and agreed to the published version of the manuscript.
Funding
This work was partially supported by the International Research Partnerships: Electrical Engineering Thai–French Research Center (EE-TFRC) between Université de Lorraine (UL) and King Mongkut’s University of Technology North Bangkok (KMUTNB) and Framework Agreement between University of Pitesti and King Mongkut’s University of Technology North Bangkok through the Research Program Cooperation under Grant KMUTNB-BasicR-64-17.
Data Availability Statement
The fuel economy obtained in this paper using the strategy S2 is compared with other two strategies based on the PF control, strategy S1 and strategy S0, with data available at https://0-doi-org.brum.beds.ac.uk/10.3390/app10228310 (accessed on 30 June 2021) and https://0-ieeexplore-ieee-org.brum.beds.ac.uk/document/1275430 (accessed on 30 June 2021).
Conflicts of Interest
The authors declare no conflict of interest.
Nomenclature
| Abbreviations: | |
| Air/Fuel-PF | Strategy based on the PF control of the fueling regulators |
| DER | Distributed energy resources |
| ES | Extremum seeking |
| ESS | Energy storage system |
| GES | Global extremum seeking |
| GHG | Greenhouse Gases |
| Fuel-PFC | Strategy based on the control of the fuel regulator |
| FC | Fuel cell |
| HPS | Hybrid power system |
| LPF | Low-pass filter |
| LPM | Liter per minute |
| MPP | Maximum power point |
| PEMFC | proton exchange membrane fuel cell |
| PF | Power-following control |
| OER | Oxygen excess ratio |
| RES | Renewable energies source |
| sFF | Static feed-forward |
| SoC | State-of-charge |
| SW | Switch |
| UC | Ultracapacitor |
| Symbols: | |
| AirFr | Airflow rate |
| CDC | Capacitor on the DC bus |
| fd | Dither frequency |
| foptim | Optimization function |
| F | Faraday constant |
| Fueleff | Fuel consumption efficiency |
| FuelFr | Fuel flow rate |
| FuelT | Total fuel consumption |
| kfuel | Weighting coefficient of the fuel consumption efficiency |
| kNy, kNy | Normalization gains of the GES controller |
| k1, k2 | Tuning gains of the GES controller |
| p1, p2 | Search and location signals generated by the GES controller |
| βl, βh | BPF parameters |
| Icm | Air compressor current |
| IFC | FC stack current |
| Iref(Air) | Air flow reference |
| Iref(Fuel) | Fuel flow reference |
| Iref(GES) | GES reference |
| Iref(PF) | PF reference |
| Nc | Number of cells in series |
| Pf(H2) | Pressure of the fuel |
| Pf(O2) | Pressure of the air |
| PDCreq | Power requested on the DC bus |
| PBatt | Battery power |
| Pcm | Air compressor power |
| PFC | FC power |
| PPV | PV power |
| Pref | Power reference |
| PUC | UC power |
| PDCreq | Power requested on the DC bus from the FC system |
| PLoad | Load power |
| R | Universal gas constant |
| Vcm | Air compressor voltage |
| VFC | FC stack voltage |
| uDC | DC bus voltage |
| Uf(H2) | Nominal utilization of hydrogen |
| Uf(O2) | Nominal utilization of oxygen |
| yBF | First harmonic of the FC power |
| yO2 | Composition of oxidant |
| xH2 | Composition of fuel |
| x | Vector of the FC state variables |
| θ | Operating temperature |
| ηsys | FC electrical efficiency |
| ηb-b | UC buck-boost converter efficiency |
| ηboost1 | PV boost converter efficiency |
| ηboost2 | FC boost converter efficiency |
References
- Nunez, C. Fossil Fuels, Explained. Nationalgeographic.com, 2019. Available online: https://www.nationalgeographic.com/environment/energy/reference/fossil-fuels/ (accessed on 30 June 2021).
- Adomaitis, N. Oil Demand to Peak in Three Years, Says Energy Adviser DNV GL. www.reuters.com, 2019. Available online: https://www.reuters.com/article/us-oil-demand-dnv-gl/oil-demand-to-peak-in-three-years-says-energy-adviser-dnv-gl-idUSKCN1VV2UQ (accessed on 30 June 2021).
- Worland, J. Air Pollution Costs Global Economy Trillions Annually, World Bank Says. www.time.com, 2016. Available online: https://time.com/4484027/air-pollution-economic-toll-world-bank/ (accessed on 30 June 2021).
- Fuel Cell History—Fuel Cell Today. www.Fuelcelltoday.com. Available online: http://www.platinum.matthey.com/ (accessed on 30 June 2021).
- Sorlei, I.-S.; Bizon, N.; Thounthong, P.; Varlam, M.; Carcadea, E.; Culcer, M.; Iliescu, M.; Raceanu, M. Fuel Cell Electric Vehicles—A Brief Review of Current Topologies and Energy Management Strategies. Energies 2021, 14, 252. [Google Scholar] [CrossRef]
- Perez-DeLaMora, D.A.; Quiroz-Ibarra, J.E.; Fernandez-Anaya, G.; Hernandez-Martinez, E.G. Roadmap on community-based microgrids deployment: An extensive review. Energy Rep. 2021, 7, 2883–2898. [Google Scholar] [CrossRef]
- Alam, M.; Kumar, K.; Verma, S.; Dutta, V. Renewable sources based DC microgrid using hydrogen energy storage: Modelling and experimental analysis. Sustain. Energy Technol. Assess. 2020, 42, 100840. [Google Scholar] [CrossRef]
- Marqusee, J.; Becker, W.; Ericson, S. Resilience and Economics of Microgrids with PV, Battery Storage, and Networked Diesel Generators. Adv. Appl. Energy 2021. [Google Scholar] [CrossRef]
- Korn, T.; Volpert, G. The hybrid model of the new hydrogen combustion engine as the most efficient powertrain of tomorrow. In der Antrieb von Morgen 2019; Liebl, J., Ed.; Springer Vieweg: Wiesbaden, Germany, 2019. [Google Scholar]
- Arshad, A.; Ali, H.M.; Habib, A.; Bashir, M.A.; Jabbal, M.; Yan, Y. Energy and exergy analysis of fuel cells: A review. Therm. Sci. Eng. Prog. 2019, 9, 308–321. [Google Scholar] [CrossRef]
- Barbir, F. PEM Fuel Cells: Theory and Practice; Academic Press: Cambridge, MA, USA, 2012. [Google Scholar]
- Han, Y.; Zhang, G.; Li, Q.; You, Z.; Chen, W.; Liu, H. Hierarchical energy management for PV/hydrogen/battery island DC microgrid. Int. J. Hydrog. Energy 2019, 44, 5507–5516. [Google Scholar] [CrossRef]
- Thakar, S.; Vijay, A.S.; Doolla, S. System reconfiguration in microgrids. Sustain. Energy Grids Netw. 2019, 17, 100191. [Google Scholar] [CrossRef]
- Mandala, S.; Mandal, K.K. Optimal energy management of microgrids under environmental constraints using chaos enhanced differential evolution. Renew. Energy Focus 2020, 34, 129–141. [Google Scholar] [CrossRef]
- Zhang, Y.; Wei, W. Model construction and energy management system of lithium battery, PV generator, hydrogen production unit and fuel cell in islanded AC microgrid. Int. J. Hydrog. Energy 2020, 45, 16381–16397. [Google Scholar] [CrossRef]
- Guichi, A.; Mekhilef, S.; Berkouk, E.M.; Talha, A. Optimal control of grid-connected microgrid PV-based source under partially shaded conditions. Energy 2021, 230, 120649. [Google Scholar] [CrossRef]
- El-Hana Bouchekara, H.R.; Javaid, M.S.; Shaaban, Y.A.; Shahriar, M.S.; Ramli, M.A.M.; Latreche, Y. Decomposition based multiobjective evolutionary algorithm for PV/Wind/Diesel Hybrid Microgrid System design considering load uncertainty. Energy Rep. 2021, 7, 52–69. [Google Scholar] [CrossRef]
- Xua, D.; Dai, Y.; Yang, C.; Yan, X. Adaptive fuzzy sliding mode command-filtered backstepping control for islanded PV microgrid with energy storage system. J. Frankl. Inst. 2019, 356, 1880–1898. [Google Scholar] [CrossRef]
- Han, Y.; Yang, H.; Li, Q.; Chen, W.; Zare, F.; Guerrero, J.M. Mode-triggered droop method for the decentralized energy management of an islanded hybrid PV/hydrogen/battery DC microgrid. Energy 2020, 199, 117441. [Google Scholar] [CrossRef]
- Alramlawi, M.; Mohagheghi, E.; Li, P. Predictive active-reactive optimal power dispatch in PV-battery-diesel microgrid considering reactive power and battery lifetime costs. Sol. Energy 2019, 193, 529–544. [Google Scholar] [CrossRef]
- Hu, J.; Xu, Y.; Cheng, K.W.; Guerrero, J.M. A model predictive control strategy of PV-Battery microgrid under variable power generations and load conditions. Appl. Energy 2018, 221, 195–203. [Google Scholar] [CrossRef]
- Adefarati, T.; Bansal, R.C.; Bettayeb, M.; Naidoo, R. Optimal energy management of a PV-WTG-BSS-DG microgrid system. Energy 2021, 217, 119358. [Google Scholar] [CrossRef]
- Ouammi, A. Peak load reduction with a solar PV-based smart microgrid and vehicle-to-building (V2B) concept. Sustain. Energy Technol. Assess. 2021, 44, 101027. [Google Scholar] [CrossRef]
- Pourbehzadi, M.; Niknam, T.; Aghaei, J.; Mokryani, G.; Shafie-khah, M.; Catalão, J.P.S. Optimal operation of hybrid AC/DC microgrids under uncertainty of renewable energy resources: A comprehensive review. Electr. Power Energy Syst. 2019, 109, 139–159. [Google Scholar] [CrossRef]
- Yu, D.; Zhu, H.; Han, W.; Holburn, D. Dynamic multi agent-based management and load frequency control of PV/Fuel cell/ wind turbine/ CHP in autonomous microgrid system. Energy 2019, 173, 554–568. [Google Scholar] [CrossRef]
- Han, Y.; Chen, W.; Li, Q.; Yang, H.; Zare, F.; Zheng, Y. Two-level energy management strategy for PV-Fuel cell-battery-based DC microgrid. Int. J. Hydrog. Energy 2019, 44, 19395–19404. [Google Scholar] [CrossRef]
- Fahad Zia, M.F.; Elbouchikhi, E.; Benbouzid, M. Microgrids energy management systems: A critical review on methods, solutions, and prospects. Appl. Energy 2018, 222, 1033–1055. [Google Scholar] [CrossRef]
- Md Hossain, A.; Roy Pota, H.; Md Hossain, J.; Blaabjerg, F. Evolution of microgrids with converter-interfaced generations: Challenges and opportunities. Int. J. Electr. Power Energy Syst. 2019, 109, 160–186. [Google Scholar] [CrossRef]
- Abaza, A.; El-Sehiemy, R.A.; Mahmoud, K.; Lehtonen, M.; Darwish, M.M.F. Optimal Estimation of Proton Exchange Membrane Fuel Cells Parameter Based on Coyote Optimization Algorithm. Appl. Sci. 2021, 11, 2052. [Google Scholar] [CrossRef]
- Said, M.; Shaheen, A.M.; Ginidi, A.R.; El-Sehiemy, R.A.; Mahmoud, K.; Lehtonen, M.; Darwish, M.M.F. Estimating Parameters of Photovoltaic Models Using Accurate Turbulent Flow of Water Optimizer. Processes 2021, 9, 627. [Google Scholar] [CrossRef]
- El-Sehiemy, R.A.; Hamida, M.A.; Mesbahi, T. Parameter identification and state-of-charge estimation for lithium-polymer battery cells using enhanced sunflower optimization algorithm. Int. J. Hydrog. Energy 2020, 45, 8833–8842. [Google Scholar] [CrossRef]
- Bizon, N.; Oproescu, M.; Thounthong, P.; Varlam, M.; Carcadea, E.; Culcer, M.; Iliescu, M.; Raboaca, M.S.; Sorlei, I.S. Improving the Fuel Economy and Battery Lifespan in Fuel Cell/Renewable Hybrid Power Systems Using the Power-Following Control of the Fueling Regulators. Appl. Sci. 2020, 10, 8310. [Google Scholar] [CrossRef]
- Bizon, N. Optimization of the Fuel Cell Renewable Hybrid Power Systems; Springer: London, UK, 2020. [Google Scholar]
- Pukrushpan, J.T.; Stefanopoulou, A.G.; Peng, H. Control of fuel cell breathing. IEEE Control Syst. Mag. 2004, 24, 30–46. [Google Scholar] [CrossRef]
- Bizon, N. Hybrid power sources (HPSs) for space applications: Analysis of PEMFC/Battery/SMES HPS under unknown load containing pulses. Renew. Sustain. Energy Rev. 2019, 105, 14–37. [Google Scholar] [CrossRef]
- Pukrushpan, J.T.; Stefanopoulou, A.G.; Peng, H. Control of Fuel Cell Power Systems; Springer: New York, NY, USA, 2004. [Google Scholar]
- SimPowerSystems TM Reference, Hydro-Québec and the MathWorks; MathWorks Inc.: Natick, MA, USA, 2010; Available online: http://www.hydroquebec.com/innovation/en/pdf/2010G080-04A-SPS.pdf (accessed on 30 June 2021).
- Sun, Z.; Wen, Z.; Zhao, X.; Yang, Y.; Li, S. Real-World Driving Cycles Adaptability of Electric Vehicles. World Electr. Veh. J. 2020, 11, 19. [Google Scholar] [CrossRef] [Green Version]
- Bizon, N. Real-time optimization strategies of Fuel Cell Hybrid Power Systems based on Load-following control: A new strategy, and a comparative study of topologies and fuel economy obtained. Appl. Energy 2019, 241, 444–460. [Google Scholar] [CrossRef]
- Ramos-Paja, C.A.; Spagnuolo, G.; Petrone, G.; Mamarelis, M.E. A perturbation strategy for fuel consumption minimization in polymer electrolyte membrane fuel cells: Analysis, Design and FPGA implementation. Appl. Energy 2014, 119, 21–32. [Google Scholar] [CrossRef]
- Bizon, N. Fuel saving strategy using real-time switching of the fueling regulators in the Proton Exchange Membrane Fuel Cell System. Appl. Energy 2019, 252, 113449–113453. [Google Scholar] [CrossRef]
- Kunusch, C.; Puleston, P.F.; Mayosky, M.A.; Riera, J. Sliding mode strategy for PEM fuel cells stacks breathing control using a super-twisting algorithm. IEEE Trans. Control Syst. Technol. 2009, 17, 167–174. [Google Scholar] [CrossRef] [Green Version]
- Bizon, N. Searching of the Extreme Points on Photovoltaic Patterns using a new Asymptotic Perturbed Extremum Seeking Control scheme. Energy Convers. Management 2017, 144, 286–302. [Google Scholar] [CrossRef]
- Yamashita, D.Y.; Vechiu, I.; Gaubert, J.-P. A review of hierarchical control for building microgrids. Renew. Sustain. Energy Rev. 2020, 118, 109523-40. [Google Scholar] [CrossRef]
- Bizon, N. Tracking the maximum efficiency point for the FC system based on extremum seeking scheme to control the air flow. Appl. Energy 2014, 129, 147–157. [Google Scholar] [CrossRef]
- Bizon, N.; Kurt, E. Performance Analysis of Tracking of the Global Extreme on Multimodal Patterns using the Asymptotic Perturbed Extremum Seeking Control Scheme. Int. J. Hydrog. Energy 2017, 42, 17645–17654. [Google Scholar] [CrossRef]
- Bizon, N. Energy optimization of Fuel Cell System by using Global Extremum Seeking algorithm. Appl. Energy 2017, 206, 458–474. [Google Scholar] [CrossRef]
- Restrepo, C.; Ramos-Paja, C.A.; Girala, R.; Calvente, J.; Romero, A. Fuel cell emulator for oxygen excess ratio estimation on power electronics applications. Comput. Electr. Eng. 2012, 38, 926–937. [Google Scholar] [CrossRef]
Figure 1.
PV/FC/ESS hybrid power system.

Figure 2.
PV/FC/ESS hybrid power system diagram using strategies S1 and S2.

Figure 3.
PV/FC/ESS hybrid power system diagram using strategy S0.

Figure 4.
PV/ESS system diagram.

Figure 5.
PV/ESS system under variable solar irradiance profile with slow slopes.

Figure 6.
PV/ESS system under variable solar irradiance profile with slow slopes and random pulses of maximum 200 W/m2 added.
Figure 6.
PV/ESS system under variable solar irradiance profile with slow slopes and random pulses of maximum 200 W/m2 added.

Figure 7.
PV/ESS system under variable solar irradiance profile with very high slopes.

Figure 8.
The behavior of the PV/ESS system under variable solar irradiance profile with slow slopes.
Figure 8.
The behavior of the PV/ESS system under variable solar irradiance profile with slow slopes.

Figure 9.
The behavior of the PV/FC/ESS system using strategy S0 in the scenario SC2.

Figure 10.
The behavior of the PV/FC/ESS system using strategy S2 in the scenario SC2.

Figure 11.
The behavior of the PV/FC/ESS system using strategy S2 in the scenario SC3.

Figure 12.
The behavior of the PV/FC/ESS system using strategy S2 in the scenario SC4.

Figure 13.
The behavior of the PV/FC/ESS system using strategy S1 in the scenario SC5.

Figure 14.
The behavior of the PV/FC/ESS system using strategy S2 in the scenario SC5.

Figure 15.
The behavior of the PV/FC/ESS system using strategy S2 in the scenario SC6.

Figure 16.
The DC voltage variation of the PV/FC/ESS system using strategy S2 in the scenario SC3.

Figure 17.
The DC voltage variation of the PV/FC/ESS system using strategy S2 in the scenario SC7.


Table 1.
Parameters of the PV/FC/ESS hybrid power system.
| PV | FC | Batt | UC | ||
|---|---|---|---|---|---|
| Nominal voltage | 60 V | 45 V | 200 V | 100 V | 200 V |
| Maximum current | 120 A | 225 A | 4.34 A | 50 A 4 | - |
| Another parameter | 5.4 kW 1 | 6 kW 2 | 10 Ah 3 | 5 F 5 | 1 F 6 |
1 PV nominal power; 2 FC nominal power; 3 Battery nominal capacity; 4 limited by the buck-boost DC–DC power converter; 5 UC nominal capacitance; 6 nominal capacitance.
Table 2.
Scenarios used to test the performance of the PV/FC/ESS system.
| Scenario | SC1 | SC2 | SC3 | SC4 | SC5 | SC6 | SC7 |
|---|---|---|---|---|---|---|---|
| Solar irradiance profile (SIP) | SIP1 shown in Figure 5 | SIP2 shown in Figure 7 | 0.5 ∙ SIP2 | 0.5 ∙ SIP2 | 0.5 ∙ SIP2 | 0.5 ∙ SIP2 | SIP2 |
| Load demand profile (LDP) | LDP1 shown in Figure 8 | LDP1 | LDP1 | 1.5 ∙ LDP1 | 2.0 ∙ LDP1 | Constant load of 6 kW | 2.0 ∙ LDP1 |
Table 3.
Total fuel consumption ( under 2.4 s cycle) under different scenarios and PF-based strategies used to test the performance of the PV/FC/ESS system.
Table 3.
Total fuel consumption ( under 2.4 s cycle) under different scenarios and PF-based strategies used to test the performance of the PV/FC/ESS system.
| Scenario | ||||||
|---|---|---|---|---|---|---|
| Strategy | SC1 | SC2 | SC3 | SC4 | SC5 | SC6 |
| S0 | 0.54372 | 0.6648 | 0.74784 | 1.2624 | 1.46676 | 4.23 |
| S1 | 0.52908 | 0.609 | 0.696 | 1.027 | 1.249 | 4.093 |
| S2 | 0.5114 | 0.593 | 0.682 | 1.001 | 1.213 | 4.026 |
Table 4.
Total fuel consumption ( under 60 s cycle) under different scenarios and PF-based strategies used to test the performance of the PV/FC/ESS system.
Table 4.
Total fuel consumption ( under 60 s cycle) under different scenarios and PF-based strategies used to test the performance of the PV/FC/ESS system.
| Scenario | ||||||
|---|---|---|---|---|---|---|
| Strategy | SC1 | SC2 | SC3 | SC4 | SC5 | SC6 |
| S0 | 13.593 | 16.62 | 18.696 | 31.56 | 36.669 | 105.75 |
| S1 | 13.227 | 15.225 | 17.4 | 25.675 | 31.225 | 102.325 |
| S2 | 12.785 | 14.825 | 17.05 | 25.025 | 30.325 | 100.65 |
Table 5.
Percentage decrease in fuel consumption ( and ( ) under different scenarios used to test the performance of the PV/FC/ESS system.
Table 5.
Percentage decrease in fuel consumption ( and ( ) under different scenarios used to test the performance of the PV/FC/ESS system.
| Scenario | ||||||
|---|---|---|---|---|---|---|
| Strategy | SC1 | SC2 | SC3 | SC4 | SC5 | SC6 |
| 5.94 | 10.80 | 8.80 | 20.71 | 17.30 | 4.82 | |
| 3.34 | 2.63 | 2.01 | 2.53 | 2.88 | 1.64 | |
Publisher’s Note: MDPI stays neutral with regard to jurisdictional claims in published maps and institutional affiliations. |
© 2021 by the authors. Licensee MDPI, Basel, Switzerland. This article is an open access article distributed under the terms and conditions of the Creative Commons Attribution (CC BY) license (https://creativecommons.org/licenses/by/4.0/).
Share and Cite
MDPI and ACS Style
Bizon, N.; Thounthong, P. Multi-Objective Energy Management Strategy for PV/FC Hybrid Power Systems. Electronics 2021, 10, 1721. https://0-doi-org.brum.beds.ac.uk/10.3390/electronics10141721
AMA Style
Bizon N, Thounthong P. Multi-Objective Energy Management Strategy for PV/FC Hybrid Power Systems. Electronics. 2021; 10(14):1721. https://0-doi-org.brum.beds.ac.uk/10.3390/electronics10141721
Chicago/Turabian StyleBizon, Nicu, and Phatiphat Thounthong. 2021. "Multi-Objective Energy Management Strategy for PV/FC Hybrid Power Systems" Electronics 10, no. 14: 1721. https://0-doi-org.brum.beds.ac.uk/10.3390/electronics10141721
Note that from the first issue of 2016, this journal uses article numbers instead of page numbers. See further details here.