Investigation of Structural and Optoelectronic Properties of Organic Semiconductor Film Based on 8-Hydroxyquinoline Zinc

 , ,
, ,
Abstract
:
1. Introduction
2. Materials and Methods
3. Theoretical Calculations
4. Results and Discussion
5. Conclusions
Supplementary Materials
Author Contributions
Funding
Conflicts of Interest
References
- Kayunkid, N.; Tammarugwattana, N.; Mano, K.; Rangkasikorn, A.; Nukeaw, J. Growth and characterizations of tin-doped nickel-phthalocyanine thin film prepared by thermal co-evaporation as novel nanomaterial. Surf. Coat. Technol. 2016, 306, 101–105. [Google Scholar] [CrossRef]
- Abuelwafa, A.A.; El-Denglawey, A.; Dongol, M.; El-Nahass, M.M.; Soga, T. Influence of annealing temperature on structural and optical properties of nanocrystalline Platinum octaethylporphyrin (PtOEP) thin films. Opt. Mater. 2015, 49, 271–278. [Google Scholar] [CrossRef]
- Sevgili, O.; Canlı, S.; Akman, F.; Orak, I.; Karabulut, A.; Yıldırım, N. Characterization of aluminum 8-hydroxyquinoline microbelts and microdots, and photodiode applications. J. Phys. Chem. Solids 2020, 136, 109128. [Google Scholar] [CrossRef]
- Hari, B.; Lyu, C.; Yu, C.; Wen, Z.; Li, F.; Hao, X. Role of Central Metal Ions in 8-Hydroxyquinoline-Doped ZnO Interfacial Layers for Improving the Performance of Polymer Solar Cells. Adv. Mater. Interfaces 2018, 5, 1801172. [Google Scholar] [CrossRef]
- Curiel, D.; Más Montoya, M.; Hummert, M.; Riede, M.; Leo, K. Doped-carbazolocarbazoles as hole transporting materials in small molecule solar cells with different architectures. Org. Electron. 2015, 17, 28–32. [Google Scholar] [CrossRef]
- Husain, A.A.F.; Hasan, W.Z.W.; Shafie, S.; Hamidon, M.N.; Pandey, S.S. Renewable and Sustainable Energy Reviews. Renew. Sustain. Energy Rev. 2018, 94, 779–791. [Google Scholar] [CrossRef]
- Onlaor, K.; Tunhoo, B.; Thiwawong, T.; Nukeaw, J. Electrical bistability of tris-(8-hydroxyquinoline) aluminum (Alq3)/ZnSe organic-inorganic bistable device. Curr. Appl. Phys. 2011, 12, 331–336. [Google Scholar] [CrossRef]
- El-Menyawy, E.M. Optical properties of amorphous and crystalline tris(8-hydroxyquinoline) indium films. J. Alloys Compd. 2016, 683, 393–398. [Google Scholar] [CrossRef]
- Mohana, J.; Ahila, G.; Bharathi, M.D.; Anbalagan, G. Growth, spectral, optical, thermal, and mechanical behaviour of an organic single crystal: Quinolinium 2-carboxy 6-nitrophthalate monohydrate. J. Cryst. Growth 2016, 450, 181–189. [Google Scholar] [CrossRef]
- Shahedi, Z.; Jafari, M.R.; Zolonvari, A.A. Synthesis of ZnQ2, CaQ2, and CdQ2 for application in OLED: Optical, thermal, and electrical characterizations. J. Mater. Sci. Mater. Electron. 2016, 28, 7313–7319. [Google Scholar] [CrossRef]
- Keshmiri, L.; Elahi, S.M.; Jafari, M.R.; Jafari, F.; Parhizgar, S.S. The Blue-Shift of Photoluminescence Spectra of Zinc Complexes of 8-Hydroxyquinoline by Addition of ZnO Nanoparticles. J. Electron. Mater. 2017, 47, 1526–1532. [Google Scholar] [CrossRef]
- Haggag, S.M.S.; Farag, A.A.M.; Abdelrafea, M. Spectral, thermal and optical–electrical properties of the layer-by-layer deposited thin film of nano Zn (II)-8-hydroxy-5-nitrosoquinolate complex. Spectrochim. Acta Part A Mol. Biomol. Spectrosc. 2013, 110, 14–19. [Google Scholar] [CrossRef] [PubMed]
- Liu, W.; Liang, T.; Chen, Q.; Yu, Z.; Zhang, Y.; Liu, Y.; Fu, W.; Tang, F.; Chen, L.; Chen, H. Solution-processed 8-hydroquinolatolithium as effective cathode interlayer for high-performance polymer solar cells. ACS Appl. Mater. Interfaces 2016, 8, 9254–9261. [Google Scholar] [CrossRef] [PubMed]
- Sui, Y.L.; Yan, B. Fabrication and photoluminescence of molecular hybrid films based on the complexes of 8-hydroxyquinoline with different metal ions via sol–gel proces. J. Photobiochem. Photobiol. A Chem. 2006, 182, 1–6. [Google Scholar] [CrossRef]
- Colle, M.; Brutting, W. Thermal, structural and photophysical properties of the organic semiconductor Alq3. Phys. Status Solidi A 2004, 201, 1095–1115. [Google Scholar] [CrossRef]
- Brinkmann, M.; Gadret, G.; Muccini, M.; Taliani, C.; Masciocchi, N.; Sironi, A. Correlation between molecular Packing and optical properties in different crystalline polymorphs and amorphous thin films of mer-tris(8-hydroxyquinoline) aluminum(III). Am. Chem. Soc. 2000, 122, 5147–5157. [Google Scholar] [CrossRef]
- Tsuboi, T.; Torii, Y. Selective synthesis of facial and meridional isomers of Alq3. Mol. Cryst. Liq. Cryst. 2010, 529, 42–52. [Google Scholar] [CrossRef]
- Kovtun, Y.P.; Prostota, Y.O.; Tolmachev, A.I. Metallochromicmerocyanines of 8-hydroxyquinoline series. Dyes Pigments 2003, 58, 83–91. [Google Scholar] [CrossRef]
- Ghedini, M.; La Deda, M.; Aiello, I.; Grisolia, A. Synthesis and photo physical characterization of soluble photo luminescent metal complexes with substituted 8-hydroxyquinolines. Synth. Met. 2003, 138, 189–192. [Google Scholar] [CrossRef]
- Painuly, D.; Masram, D.T.; Rabanal, M.E.; Nagpure, I.M. The effect of ethanol on structural, morphological and optical properties of Li(I) 8–hydroxyquinoline phosphor. J. Lumin. 2017, 192, 1180–1190. [Google Scholar] [CrossRef]
- Demir, R.; Kaya, İ. Comparison of electrical characteristics of zinc oxide and cadmium sulfide films covered with 8-hydroxyquinoline for diode applications. J. Mater. Sci. Mater. Electron. 2019, 30, 7103–7109. [Google Scholar] [CrossRef]
- Kao, P.; Chu, S.; Huang, H.; Tseng, Z.; Chen, Y. Improved efficiency of organic photovoltaic cells using tris (8-hydroxy-quinoline) aluminum as a doping material. Thin Solid Films 2009, 517, 5301–5304. [Google Scholar] [CrossRef]
- Krishnakumar, V.; Nagalakshmi, R.; Janaki, P. Growth and spectroscopic characterization of a new organic nonlinear optical crystal—8-hydroxyquinoline. Spectrochim. Acta Part A 2005, 61, 1097–1103. [Google Scholar] [CrossRef] [PubMed]
- Gucciardi, P.G.; Trusso, S.; Vasi, C.; Patanè, S.; Allegrini, M. Nano-Raman imaging of Cu–TCNQ clusters in TCNQ thin films by scanning near-field optical microscopy. Phys. Chem. Chem. Phys. 2002, 4, 2747–2753. [Google Scholar] [CrossRef]
- Bendikov, M.; Wudl, F.; Perepichka, D.F. Tetrathiafulvalenes, oligoacenenes, and their buckministerfullerene derivatives: The brick and mortar of organic electronics. Chem. Rev. 2004, 104, 4891–4945. [Google Scholar] [CrossRef] [PubMed]
- Beck, A.D. Density-functional exchange-energy approximation with correct asymptotic behavior. Phys. Rev. A 1988, 38, 3098–3100. [Google Scholar] [CrossRef] [PubMed]
- Perdew, J.P.; Wang, Y. Accurate and simple analytic representation of the electron-gas correlation energy. Phys. Rev. B 1992, 45, 13244–13249. [Google Scholar] [CrossRef]
- Frisch, M.J.; Trucks, G.W.; Schlegel, H.B.; Scuseria, G.E.; Robb, M.A.; Cheeseman, J.R.; Scalmani, G.; Barone, V.; Petersson, G.A.; Nakatsuji, H.; et al. Gaussian16, Revision A.03; Gaussian Inc.: Wallingford, CT, USA, 2017. [Google Scholar]
- Crowley, J.M.; Tahir-Kheli, J.; Goddard, W.A., III. Resolution of the band gap prediction problem for material design. J. Phys. Chem. Lett. 2016, 7, 1198–1203. [Google Scholar] [CrossRef]
- Perdew, J.P.; Burke, K.; Ernzerhof, M. Generalized gradient approximation made simple. Phys. Rev. Lett. 1996, 77, 3865. [Google Scholar] [CrossRef] [Green Version]
- ADF2013.01 SCM. Theoretical Chemistry; Vrije Universiteit: Amsterdam, The Netherlands; Available online: https://www.scm.com/ (accessed on 30 November 2020).
- Santiago, P.F.; Mercado, J.R.S.; Brito, B.M. DFT/TD-DFT studies on electronic and photophysical properties of Auranofin: A reference Au(I) complex. Polyhedron 2020, 180, 114262. [Google Scholar] [CrossRef]
- Ari, H.; Büyükmumcu, Z. Comparison of DFT functionals for prediction of ban gap for conjugated polymers and effect of HF Exchange term percentage and basis set on the performance. Comput. Mater. Sci. 2017, 138, 70–76. [Google Scholar] [CrossRef]
- Newman, C.R.; Frisbie, C.D.; Filho, D.A.S.; Bredas, J.L.; Ewbank, P.C.; Mann, K.R. Introduction to Organic Thin Film Transistors and Design of n-Channel Organic Semiconductors. Chem. Mater. 2004, 16, 4436–4451. [Google Scholar] [CrossRef]
- Hutchison, G.; Ratner, M.; Marks, T. Hopping transport in conductive heterocyclic oligomers: Reorganization energies and substituent effects. J. Am. Chem. Soc. 2005, 127, 2339–2350. [Google Scholar] [CrossRef]
- Rainbolt, J.E.; Padmaperuma, A.B.; Govind, N.; Gaspar, D.J. Substituent effects on the geometric and electronic properties of tetracyano-p-quinodimethano (TCNQ): A theoretical study. Mol. Simul. 2013, 39, 350–356. [Google Scholar] [CrossRef]
- Phillips, J.P.; Deye, J.F. Infrared spectra of oxine chelates. Anal. Chim. Acta 1957, 17, 231–233. [Google Scholar] [CrossRef]
- Gavrilko, T.; Fedorovich, R.; Dovbeshko, G.; Marchenko, A.; Naumovets, A.; Nechytaylo, V.; Puchkovska, G.; Viduta, L.; Baran, J.; Ratajczak, H. FTIR spectroscopic and STM studies of vacuum deposited aluminium (III) 8-hydroxyquinoline thin films. J. Mol. Struct. 2004, 704, 163–168. [Google Scholar] [CrossRef]
- Tackett, J.E.; Sawyer, D.T. Properties and infrared spectra in the potassium bromide region of 8-quinolinol and its metal chelates. Inorg. Chem. 1964, 3, 692–696. [Google Scholar] [CrossRef]
- Engelter, C.; Jackson, G.E.; Knight, C.L.; Thornton, D.A.J. Spectra-structure correlations from the infrared spectra of some transition metal complexes of 8-hydroxyquinoline. J. Mol. Struct. 1983, 213, 133–144. [Google Scholar] [CrossRef]
- Pfeiffer, M.; Fritz, T.; Blochwitz, J.; Nollau, A.; Plönnigs, B.; Beyer, A.; Leo, K. Controlled Doping of Molecular Organic Layers: Physics and Device Prospects. Adv. Solid State Phys. 1999, 39, 77–90. [Google Scholar] [CrossRef]
- Kim, P.; Zhang, X.H.; Domercq, B.; Jones, S.C.; Hotchkiss, P.J.; Marder, S.R.; Kippelen, B.; Perry, J.W. Solution-processible high-permittivity nanocomposite gate insulators for organic field-effect transistors. Appl. Phys. Lett. 2008, 93, 243. [Google Scholar] [CrossRef]
- Heeger, A.J. Bulk Heterojunction Solar Cells: Understanding the Mechanism of Operation. Adv. Mater. 2014, 26, 10–28. [Google Scholar] [CrossRef] [PubMed]
- Gutiérrez-González, I.; Molina-Brito, B.; Götz, A.W.; Castillo-Alvarado, F.L.; Rodríguez, J.I. Structural and electronic properties of the P3HT-PCBM dimer: A theoretical study. Chem. Phys. Lett. 2014, 612, 234–239. [Google Scholar] [CrossRef] [Green Version]
- González, S.R.; Casado, J.; López Navarrete, J.T.; Blanco, R.; Segura, J.L. A β-naphthaleneimide-modified terthiophene exhibiting charge transfer and polarization through the short molecular axis. Joint spectroscopic and theoretical study. J. Phys. Chem. A 2008, 112, 6732–6740. [Google Scholar] [CrossRef] [PubMed]
- Blanco, R.; Gómez, R.; Seoane, C.; Segura, J.L.; Mena-Osteritz, E.; Bäuerle, P. An ambipolar peryleneamidine monoimide-fused polythiophene with narrow band gap. Org. Lett. 2007, 9, 2171–2174. [Google Scholar] [CrossRef]
- Hoshi, T.O.; Kumagai, K.; Inoue, K.; Enomoto, S.; Nobe, Y.; Kobayashi, M. Electronic absorption and emission spectra of Alq3 in solution with special attention to a delayed fluorescence. J. Lumin. 2008, 128, 1353–1358. [Google Scholar] [CrossRef]
- Kalinowski, J.; Fattori, V.; Di Marco, P. Surface reactions of singlet excitons in solid films of 8-hydroxyquinoline aluminium (Alq3). Chem. Phys. 2001, 266, 85–96. [Google Scholar] [CrossRef]
- Örek, C.; Arslan, F.; Gündüz, B.; Kaygili, O.; Bulut, N. Comparison of experimental photonic and refractive index characteristics of the TBADN films with their theoretical counterparts. Chem. Phys. Lett. 2018, 696, 12–18. [Google Scholar] [CrossRef]
- Farag, A.A.M.; Yahia, I.S. Structural, absorption and optical dispersion characteristics of rhodamine B thin films prepared by drop casting technique. Opt. Commun. 2010, 283, 4310–4317. [Google Scholar] [CrossRef]
- Tauc, J. Optical properties and electronic structure of amorphous Ge and Si. J. Mater. Res. Bull. 1968, 3, 37–46. [Google Scholar] [CrossRef]
- El-Nahass, M.M.; Sallam, M.M.; Alí, H.A.M. Optical properties of thermally evaporated metalfree phathalocyanine (H2Pc) thin films. Int. J. Mod. Phys. B 2005, 19, 4057–4071. [Google Scholar] [CrossRef]
- Servaites, J.D.; Ratner, M.A.; Marks, T.J. Organic solar cells: A new look at traditional models. Energy Environ. Sci. 2011, 4, 4410–4422. [Google Scholar] [CrossRef]
- Bässler, H.; Köler, A. Unimolecular and Supramoleculr Electronics I, Chemistry and Physics Meet at Metal Molecule Interfaces; Metzger, R.M., Ed.; Springer: Berlin/Heidelberg, Germany, 2012; Volume 312. [Google Scholar]
- Tsutsui, T.; Aminaka, E.; Lin, C.P.; Kim, D.-U. Extended molecular design concept of molecular materials for electroluminescence: Sublimed–dye films, molecularly doped polymers and polymers with chromophores. Phil. Trans. R. Soc. Lond. A 1997, 355, 801–814. [Google Scholar] [CrossRef]


| Compound | HOMO (eV) | LUMO (eV) |
|---|---|---|
| ZnQ2 | −5.333 | −1.904 |
| TCNQ | −7.429 | −4.925 |
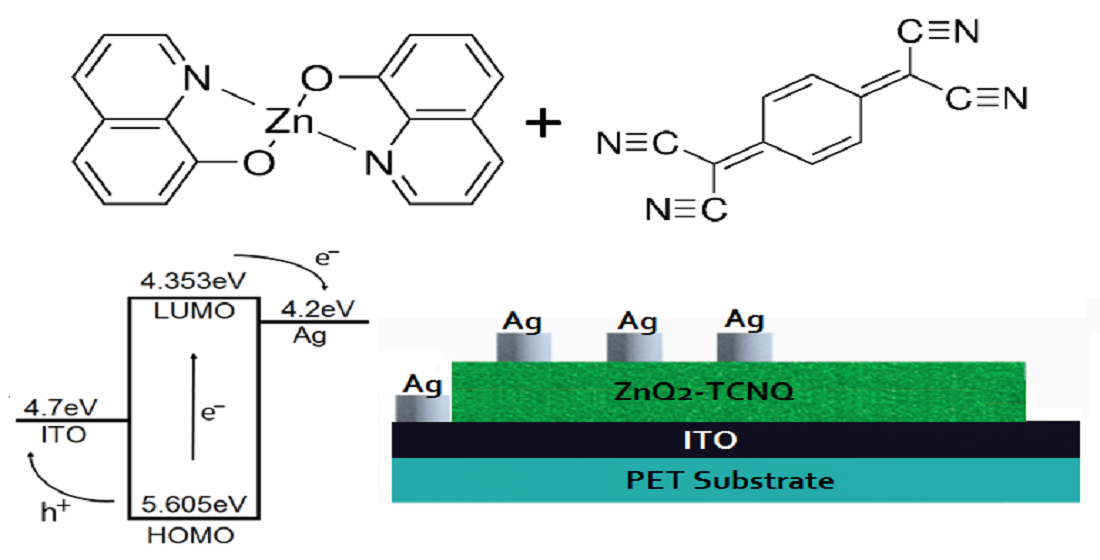
| ZnQ2-TCNQ | −5.605 | −4.353 |
| ZnQ2-TCNQ ν (cm−1) Experimental | ZnQ2-TCNQ ν (cm−1) B3PW91/6-31G** | ZnQ2-TCNQ ν (cm−1) PBE/TZ2P | Assignment |
|---|---|---|---|
| 2192 | 2297 | 2231 | C-N bond stretching in TCNQ |
| 1603 | 1628 | 1609 | C=C bond stretching in the ring-TCNQ |
| 1580 | 1593 | 1582 | In-plane deformations in the rings-Q2 by C-N and C-C bond stretching |
| 1462 | 1428 | 1450 | C-C symmetric bond stretching in the rings-Q2 |
| 1175 | 1142 | 1187 | Asymmetric H scissors in TCNQ |
| 734, 648, 600 | 755, 635, 611 | 734, 644, 613 | In-plane ring deformations and wagging vibrations in Q2 |
| ET (eV) | F (u.a.) |
|---|---|
| 0.080 | 0.0008 |
| 0.098 | 0.0023 |
| 1.486 | 0.0016 |
| 1.625 | 0.0006 |
| 1.662 | 0.0000 |
| 1.674 | 0.0011 |
| 2.152 | 0.0000 |
| 2.153 | 0.0000 |
| 2.393 | 0.0161 |
| 2.409 | 0.0023 |
| 2.434 | 0.0288 |
| 2.476 | 0.0078 |
| 2.493 | 0.0053 |
| 2.636 | 0.4101 |
| 2.781 | 0.0000 |
Publisher’s Note: MDPI stays neutral with regard to jurisdictional claims in published maps and institutional affiliations. |
© 2021 by the authors. Licensee MDPI, Basel, Switzerland. This article is an open access article distributed under the terms and conditions of the Creative Commons Attribution (CC BY) license (http://creativecommons.org/licenses/by/4.0/).
Share and Cite
Sánchez Vergara, M.E.; Ramírez Vargas, L.; Rios, C.; Molina, B.; Salcedo, R. Investigation of Structural and Optoelectronic Properties of Organic Semiconductor Film Based on 8-Hydroxyquinoline Zinc. Electronics 2021, 10, 117. https://0-doi-org.brum.beds.ac.uk/10.3390/electronics10020117
Sánchez Vergara ME, Ramírez Vargas L, Rios C, Molina B, Salcedo R. Investigation of Structural and Optoelectronic Properties of Organic Semiconductor Film Based on 8-Hydroxyquinoline Zinc. Electronics. 2021; 10(2):117. https://0-doi-org.brum.beds.ac.uk/10.3390/electronics10020117
Chicago/Turabian StyleSánchez Vergara, María Elena, Lorena Ramírez Vargas, Citlalli Rios, Bertha Molina, and Roberto Salcedo. 2021. "Investigation of Structural and Optoelectronic Properties of Organic Semiconductor Film Based on 8-Hydroxyquinoline Zinc" Electronics 10, no. 2: 117. https://0-doi-org.brum.beds.ac.uk/10.3390/electronics10020117