
An Active Power Coordination Control Strategy for AC/DC Transmission Systems to Mitigate Subsequent Commutation Failures in HVDC Systems

Abstract
:1. Introduction
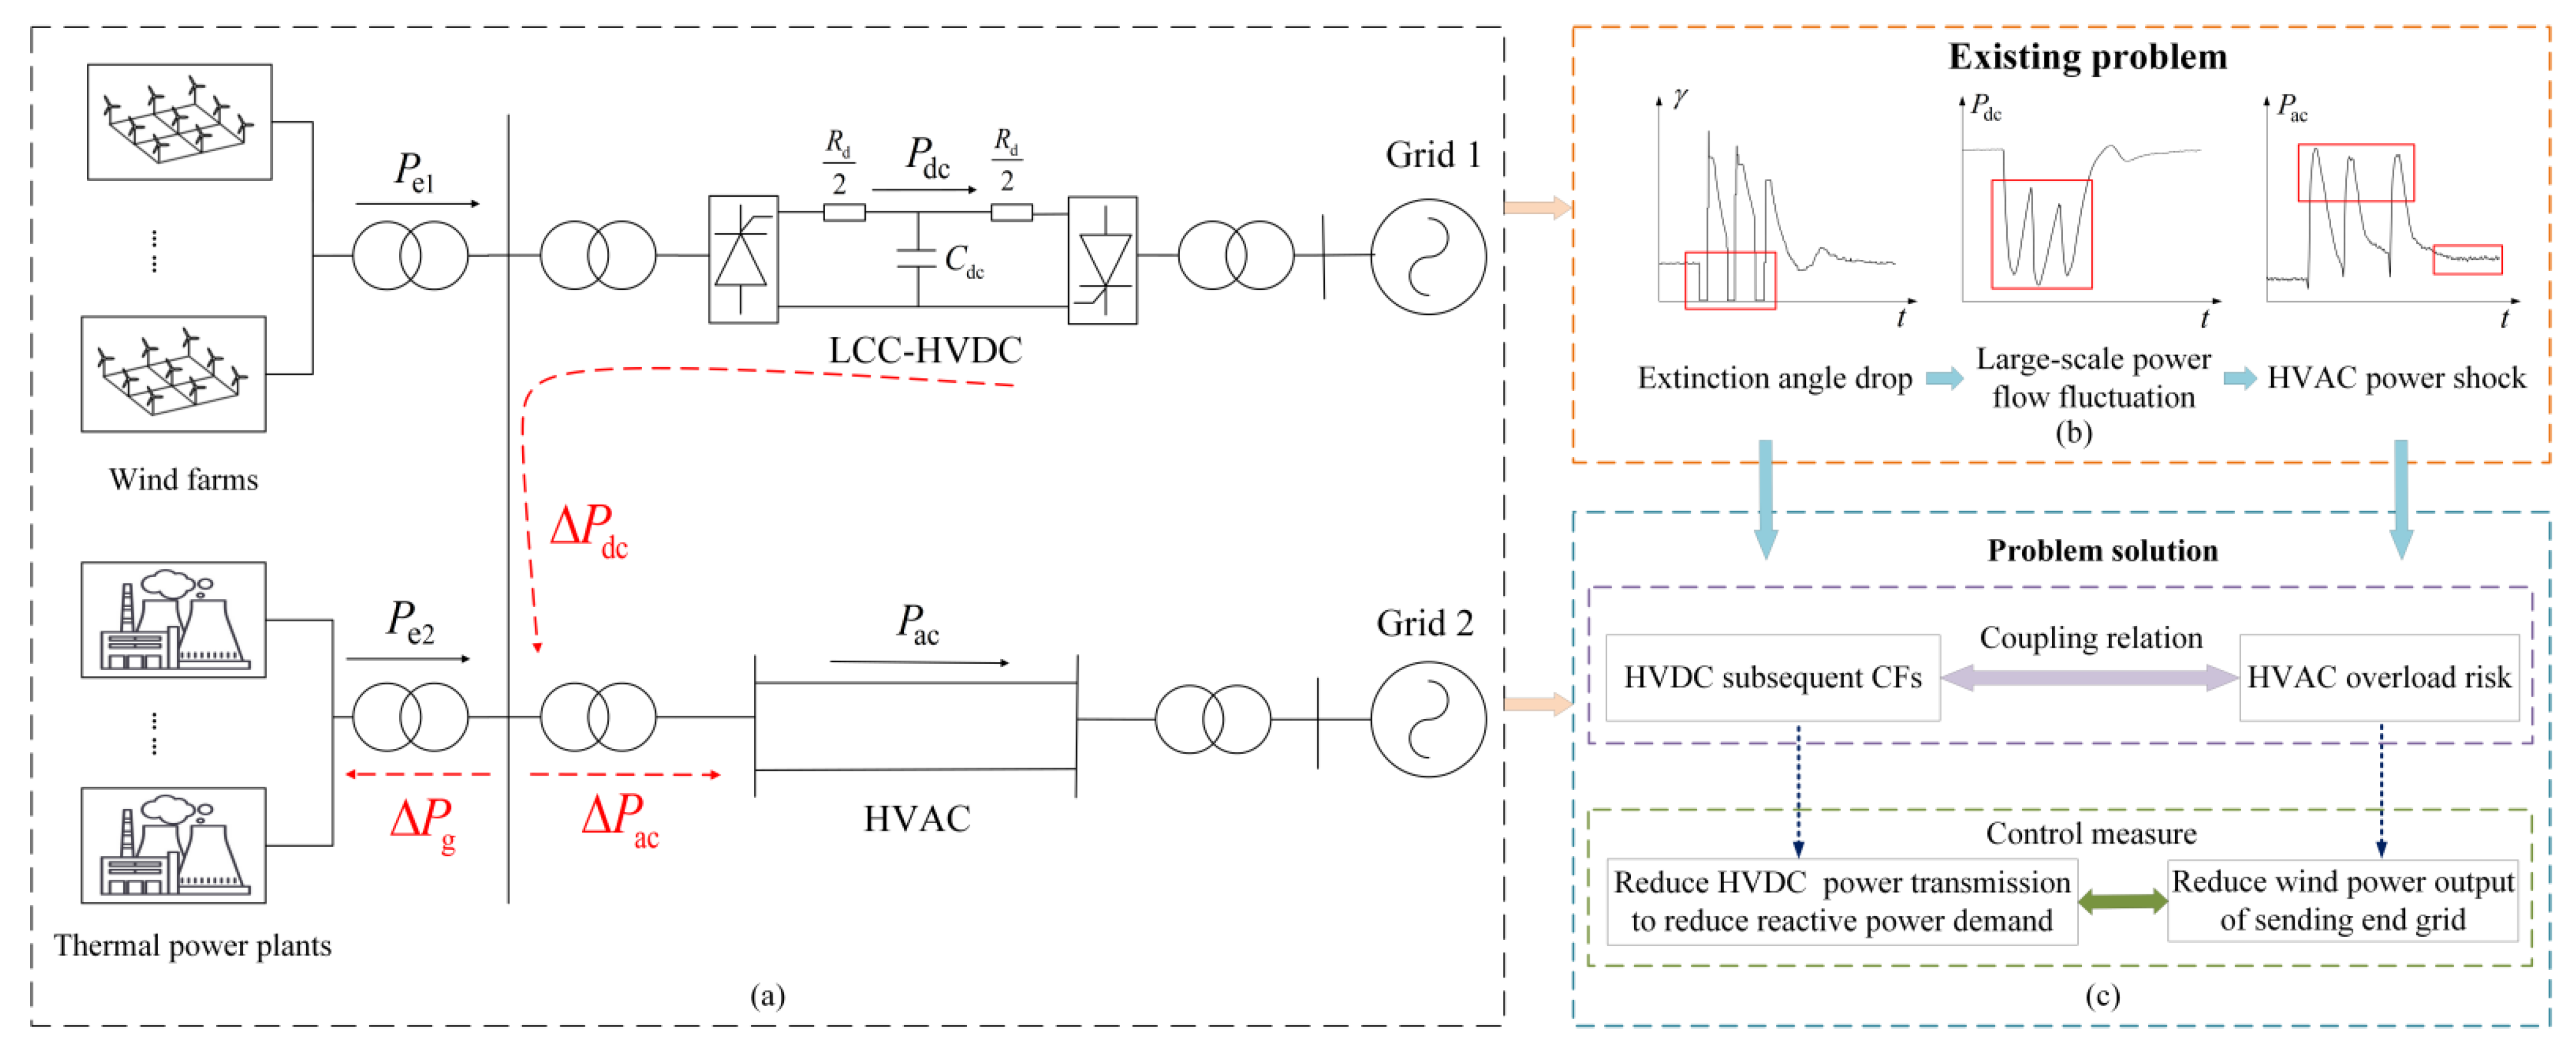
2. Overall Scheme
3. Characteristics Analysis of AC/DC Transmission System with High-Proportion Wind Power
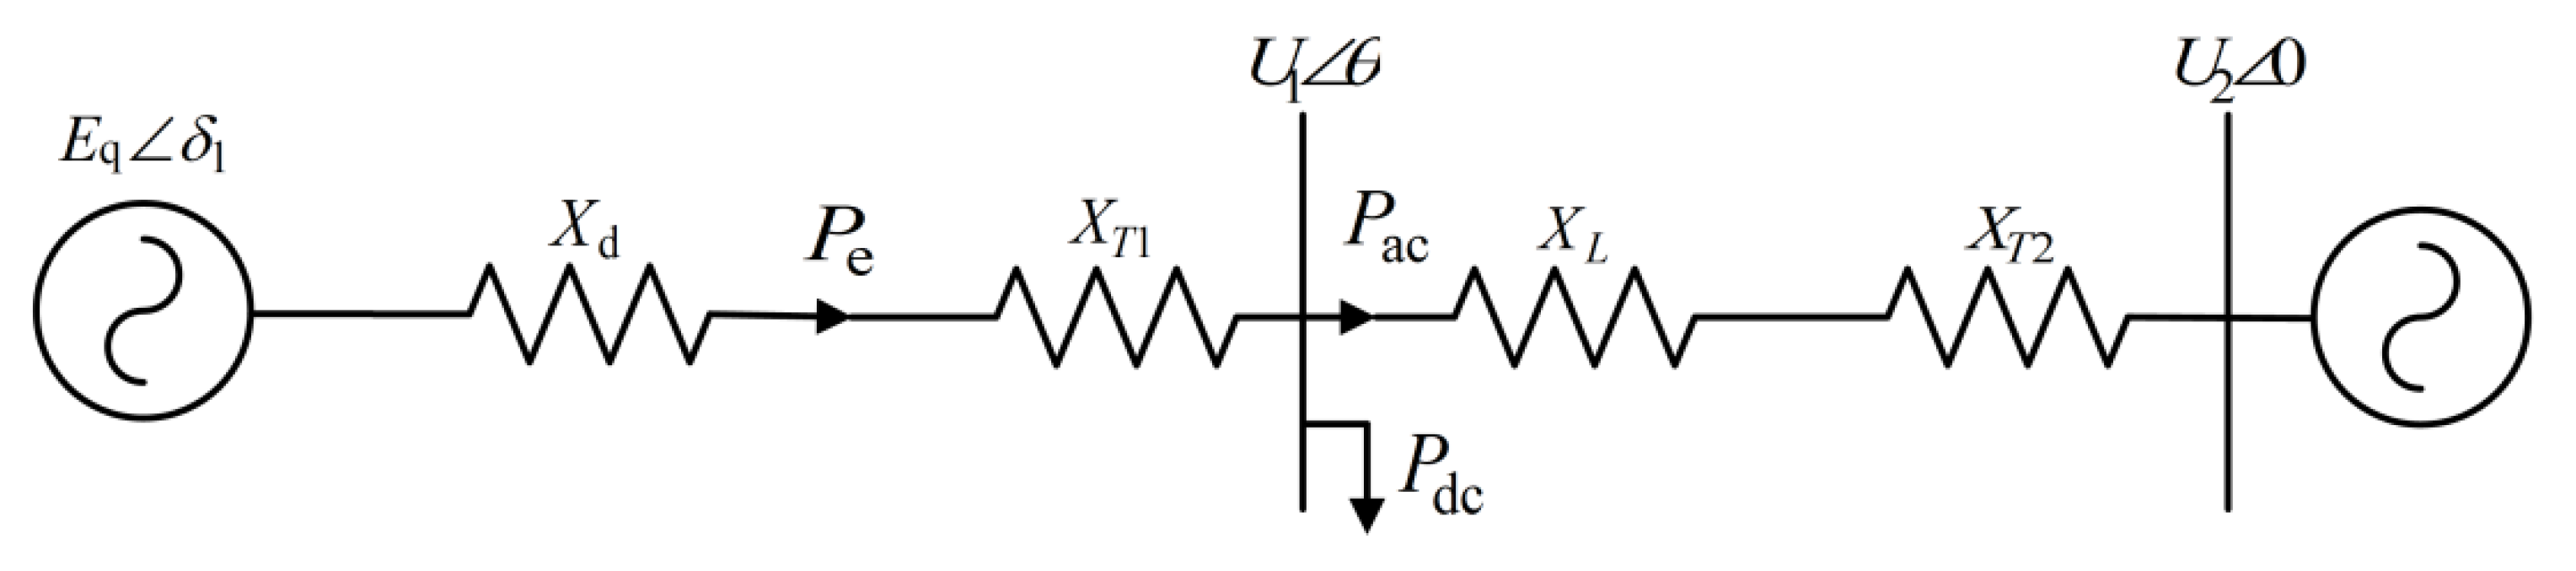
3.1. Analysis of AC/DC Transmission System
3.2. Model and Characteristics of D-PMSG
3.3. Principle of HVDC Quick Power Drop
4. Influence of HVDC Subsequent CFs on the HVAC System
4.1. Influence Factors of HVDC-CF
4.2. Power Flow Analysis of AC/DC Transmission System
4.3. Overload Risk of HVAC System
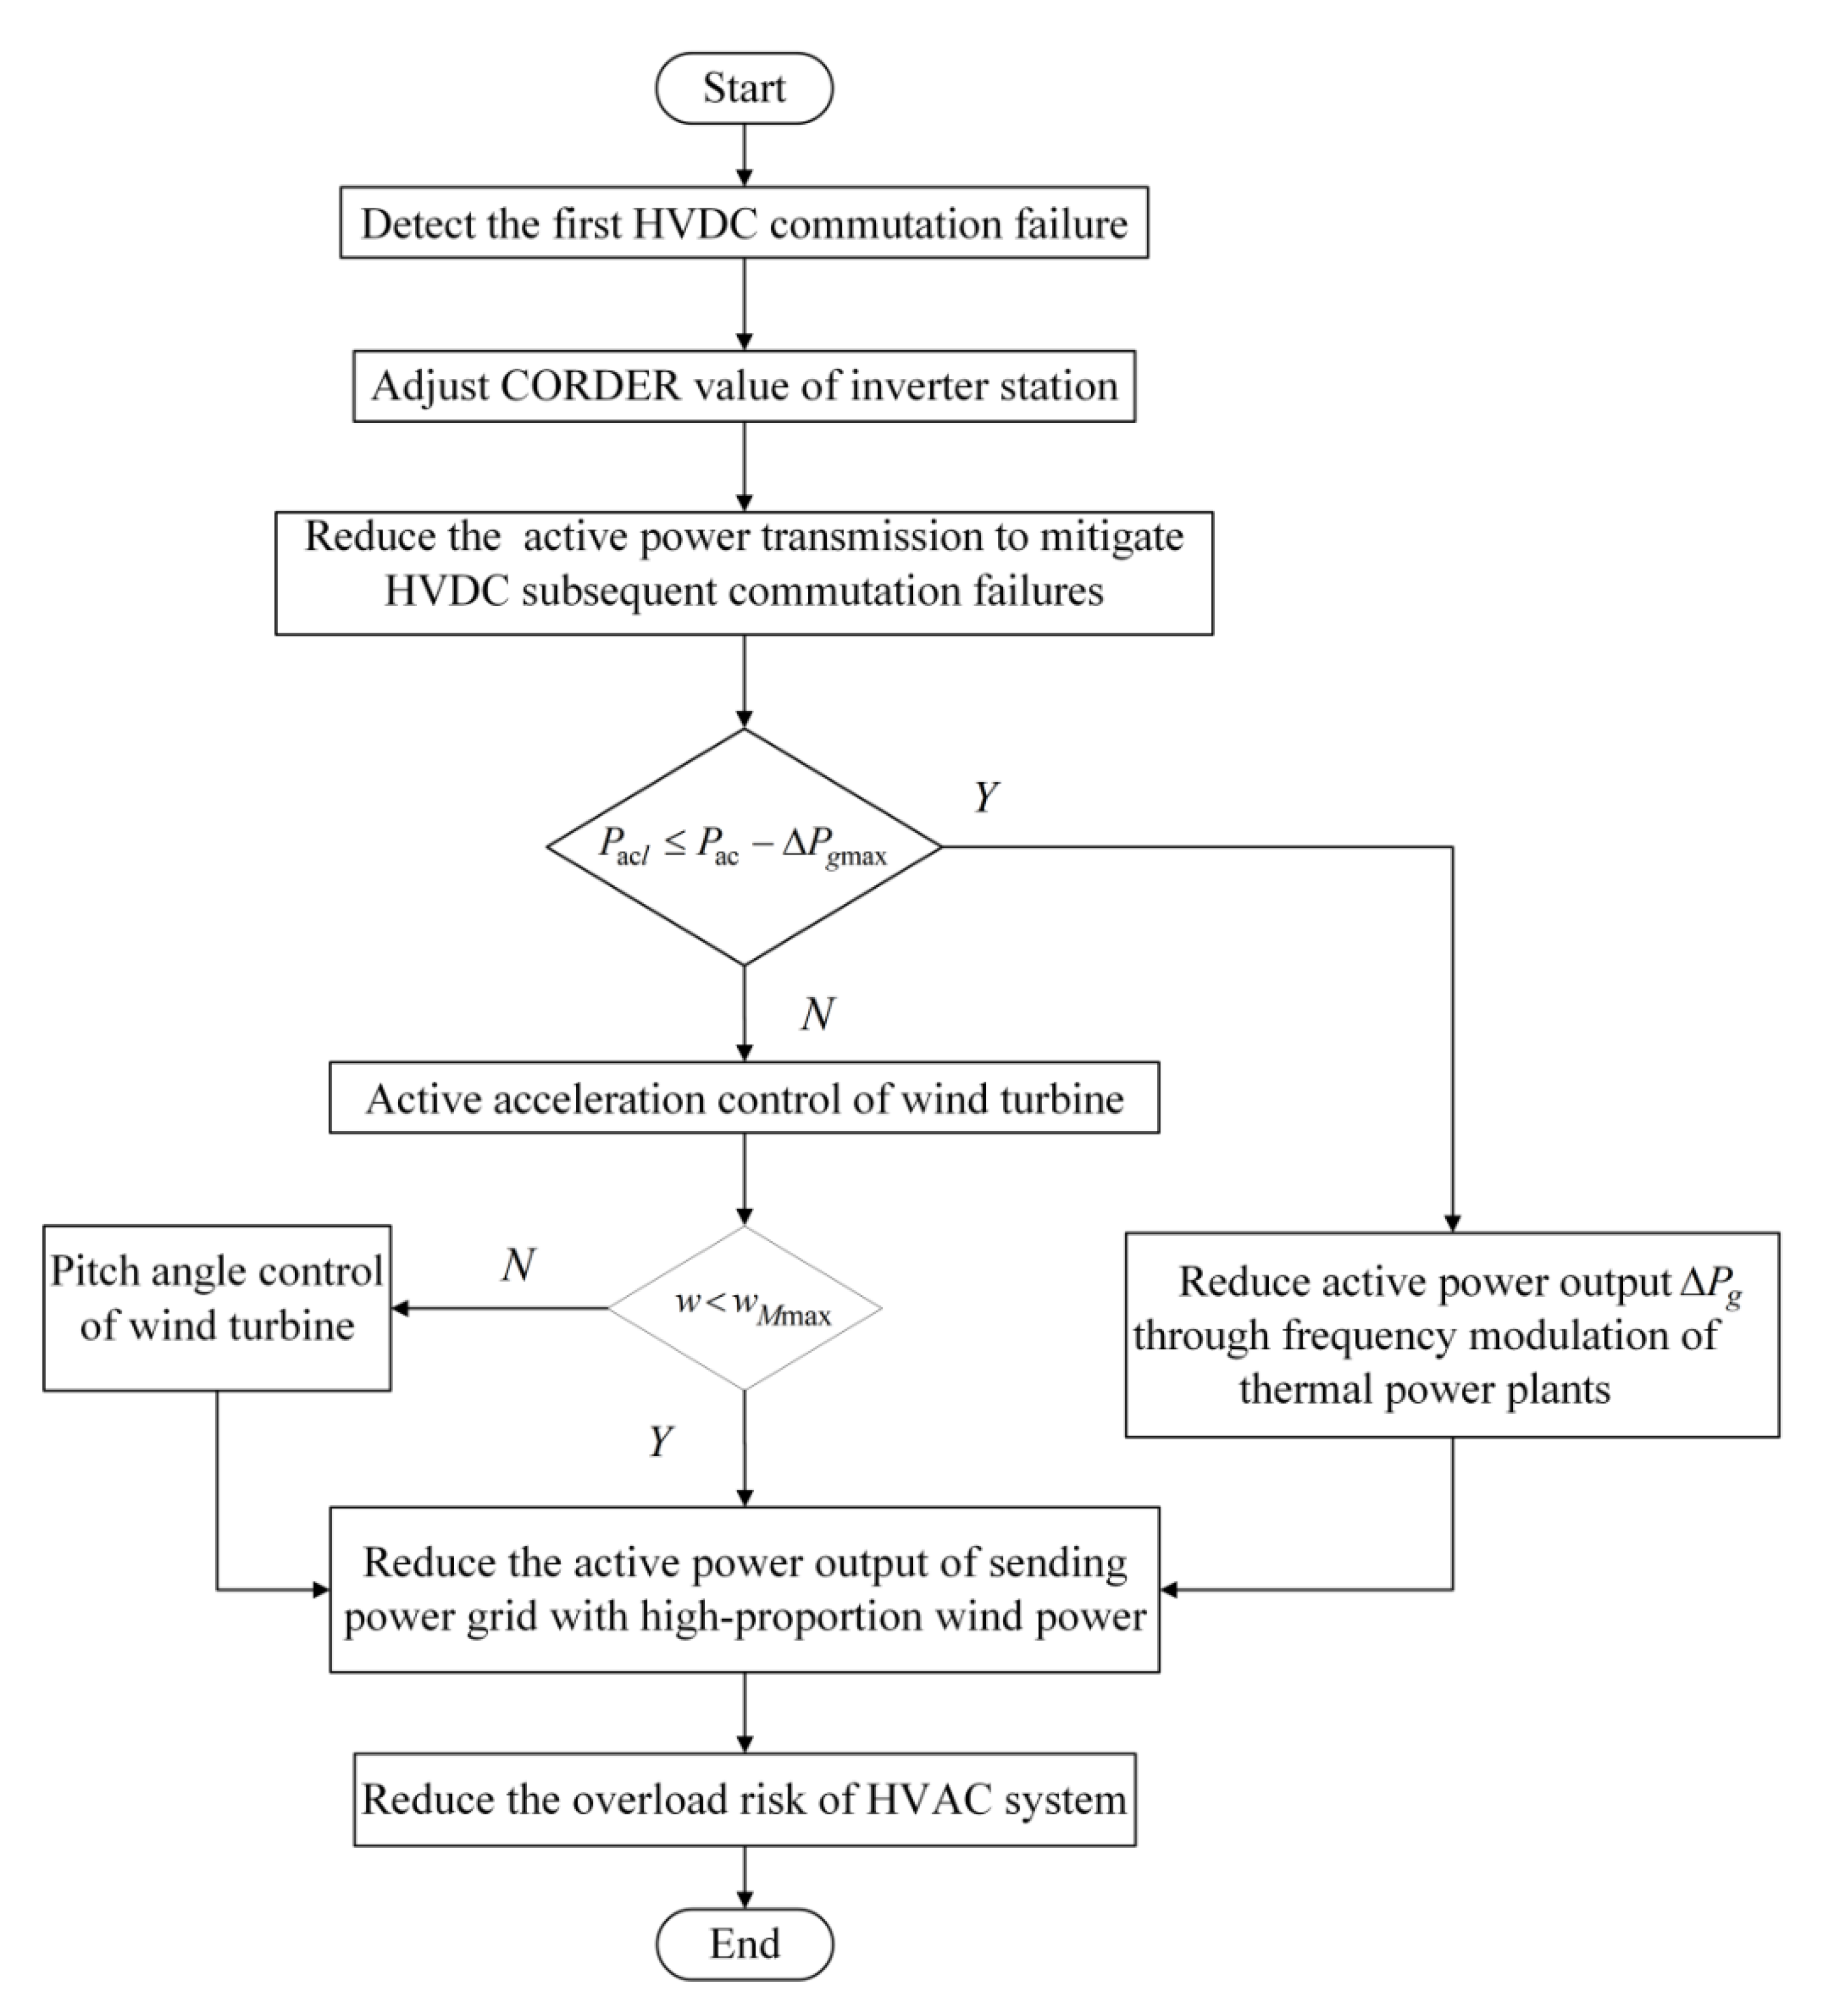
5. Coordination Control Strategy for the AC/DC Transmission System
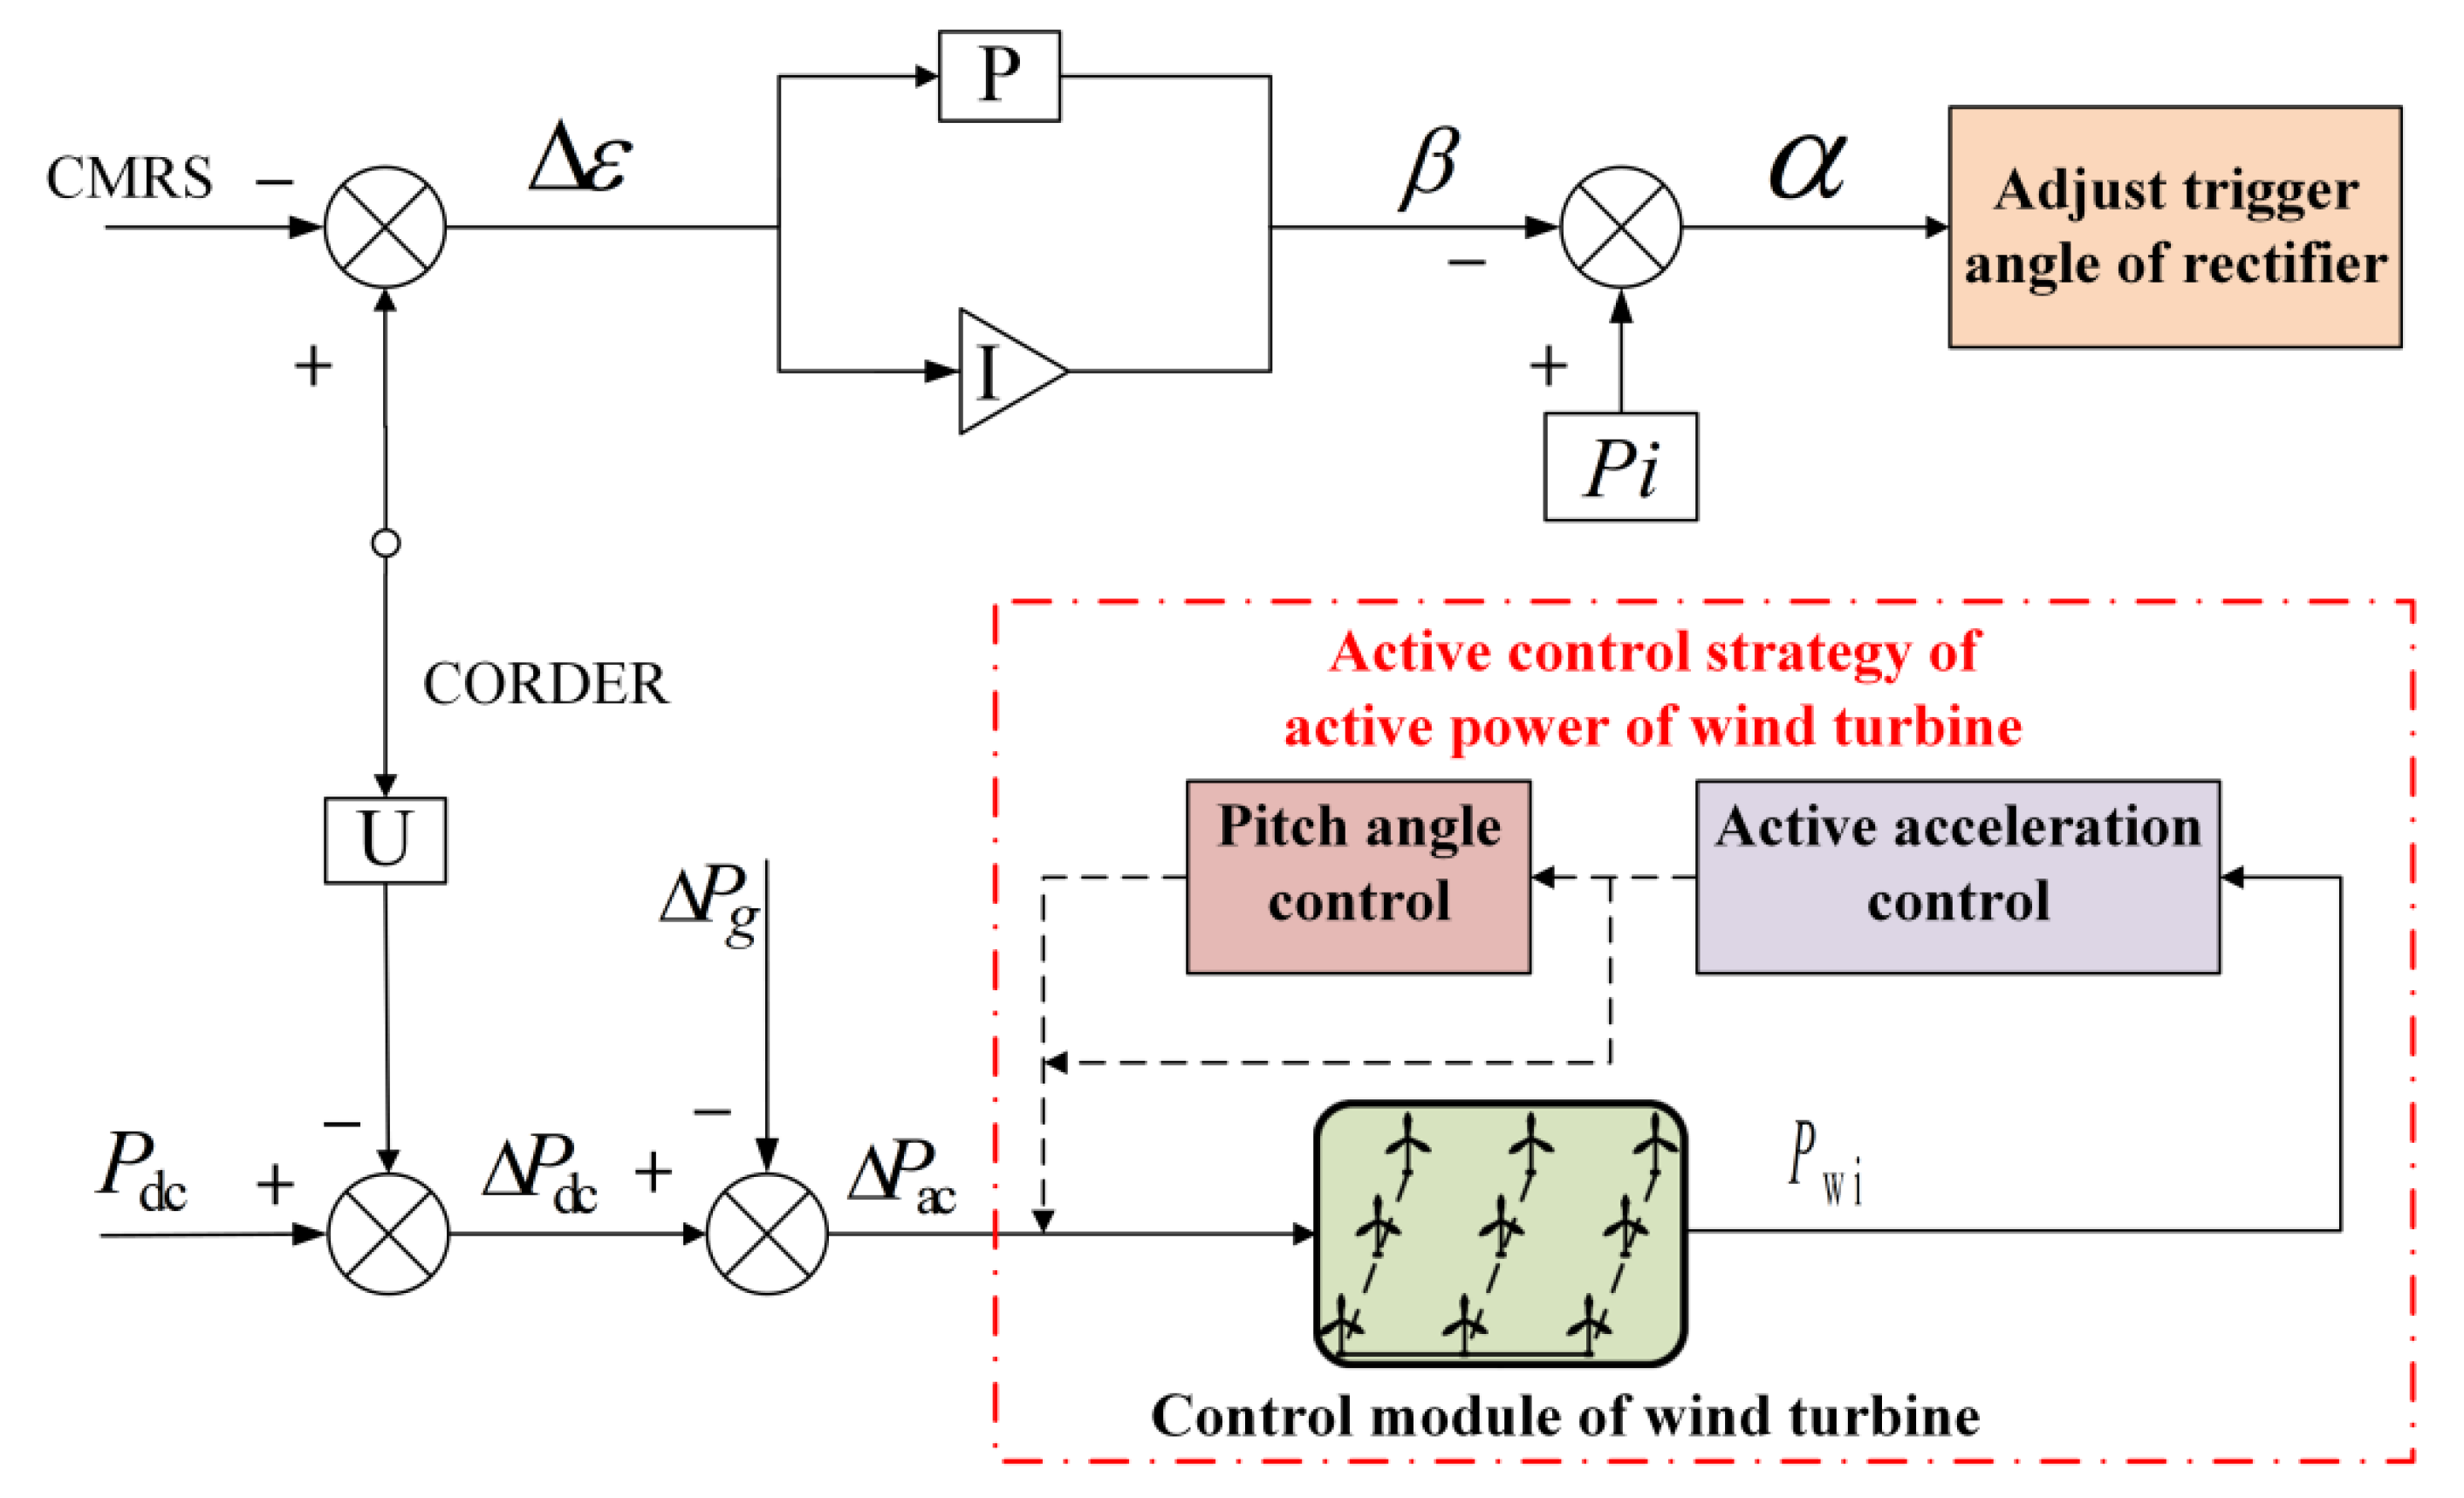
5.1. Measure for the Mitigation of HVDC Subsequent CFs by DC Power
5.2. Principle of Active Control of Wind Turbine Generator
5.3. Overload Control Strategy of HVAC System
6. Simulation Verification
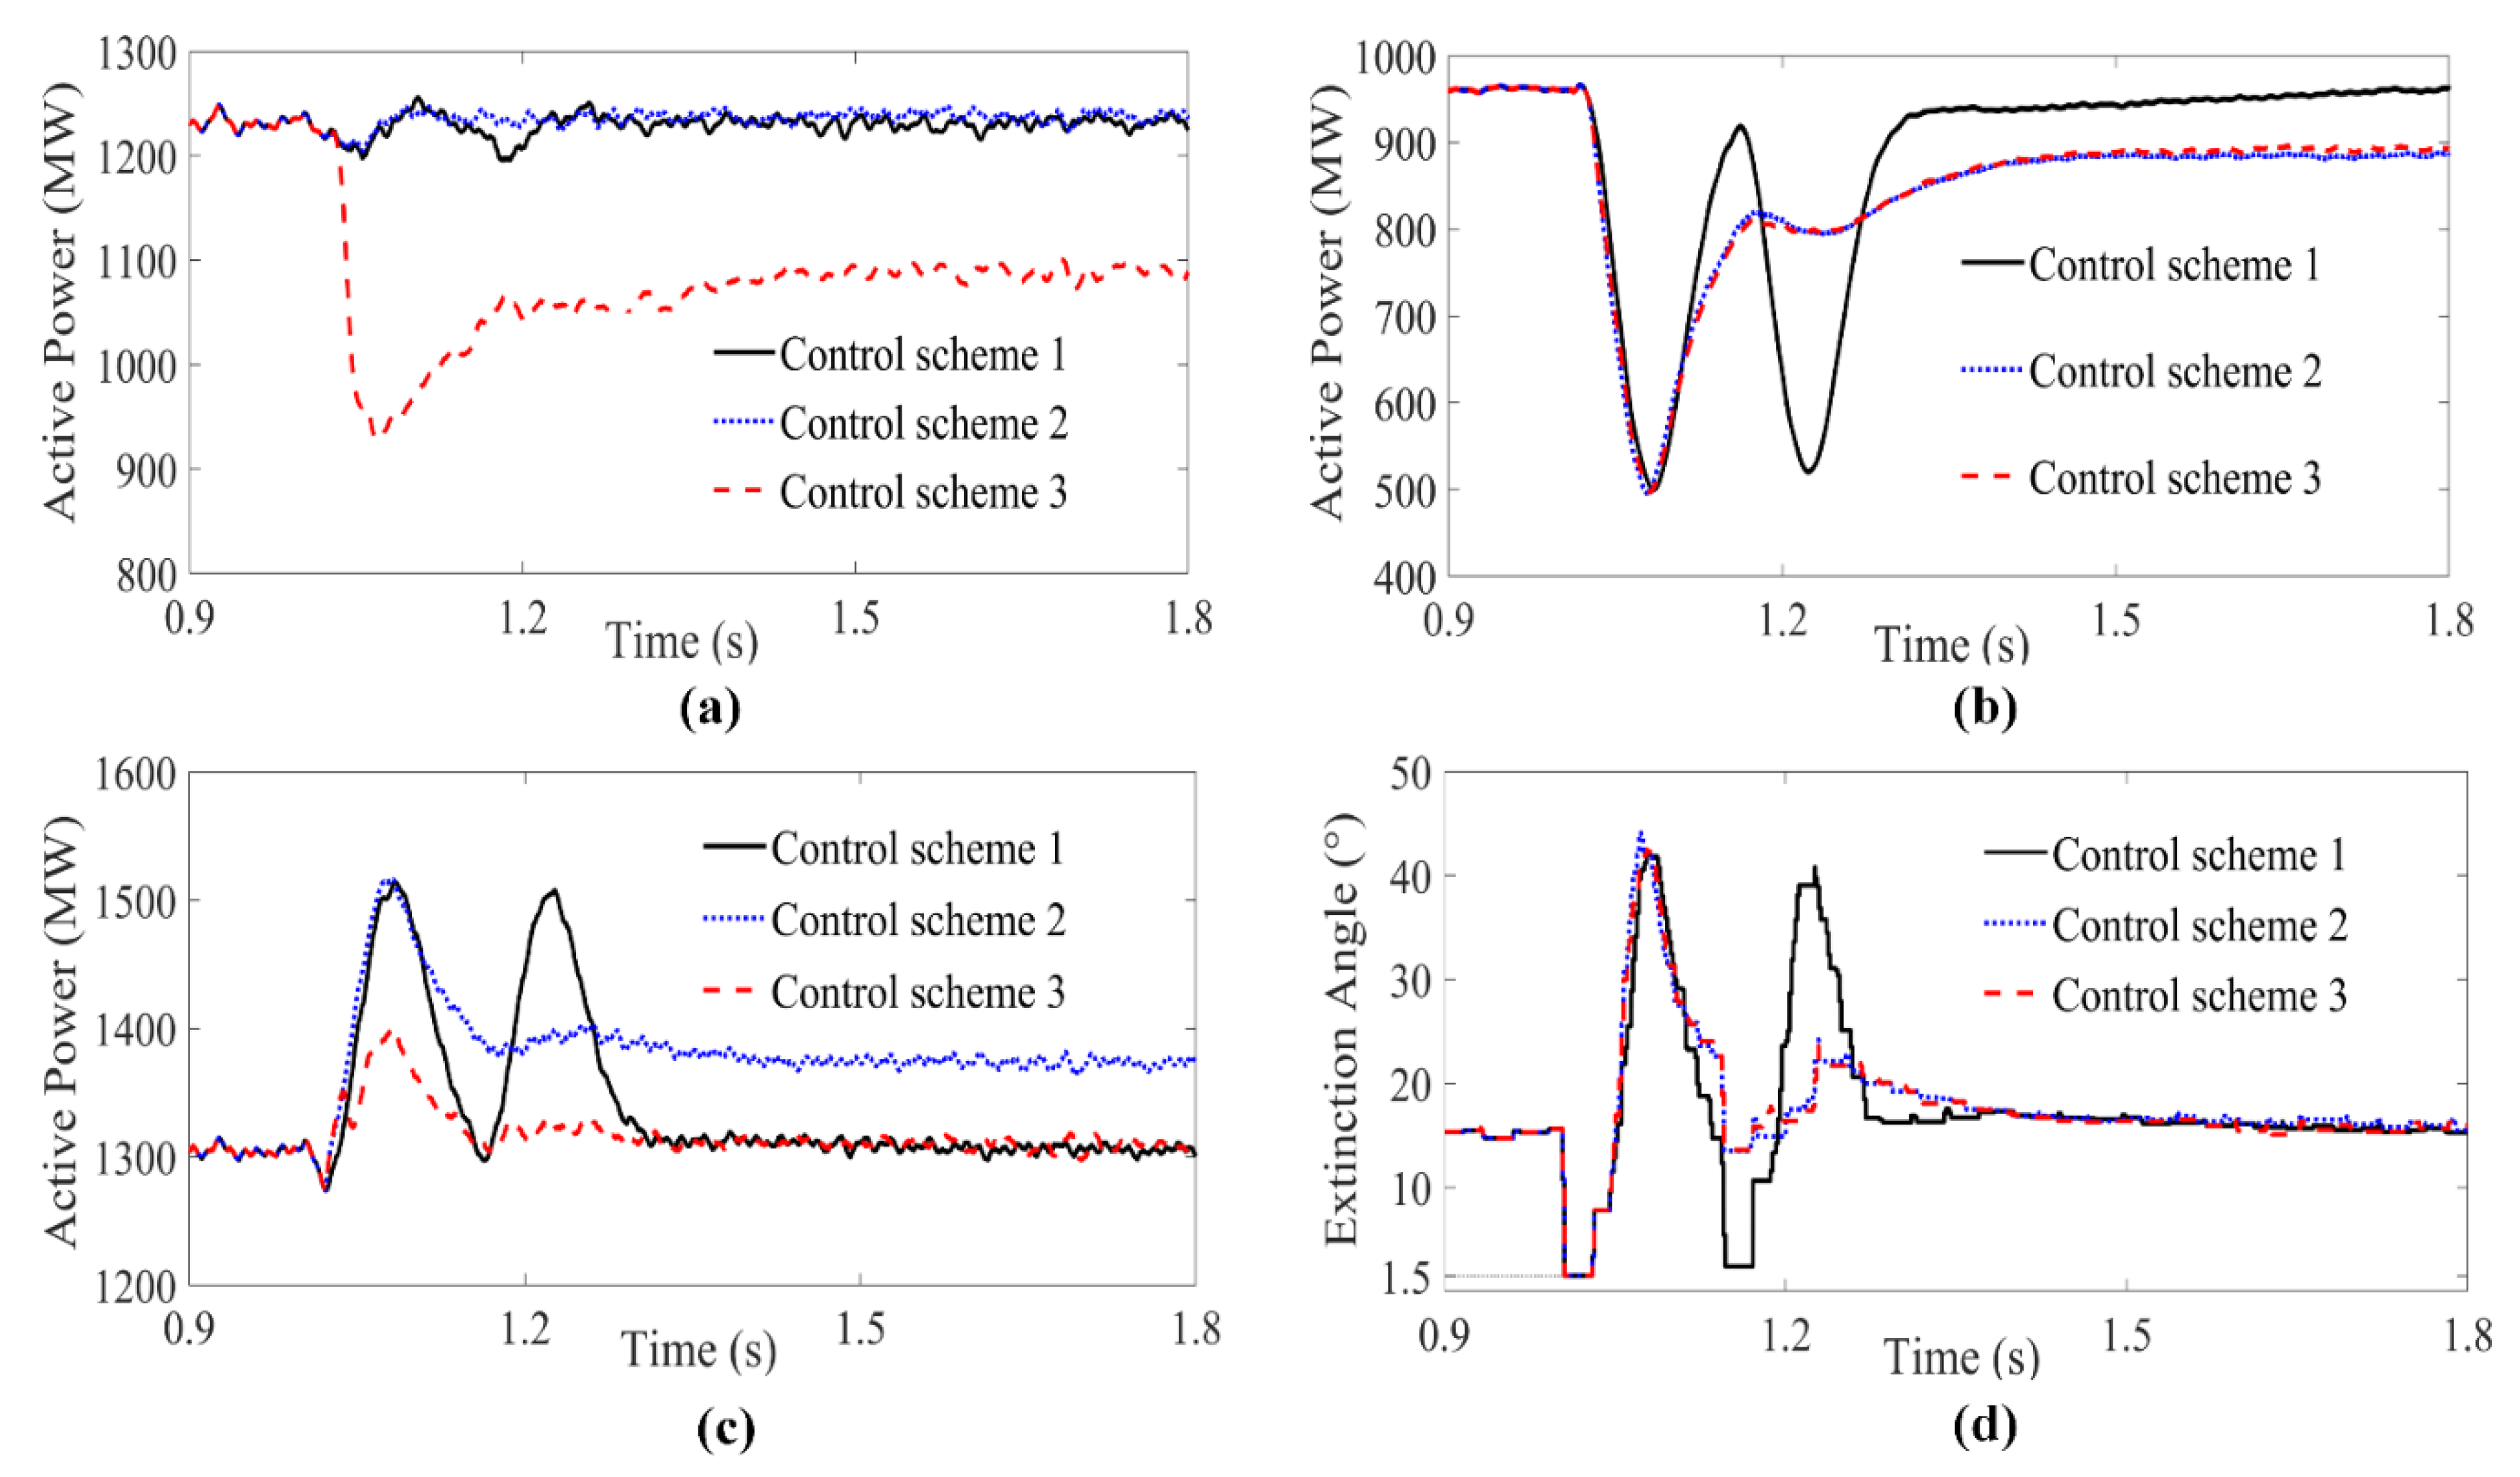
6.1. Electromagnetic Transient Simulation
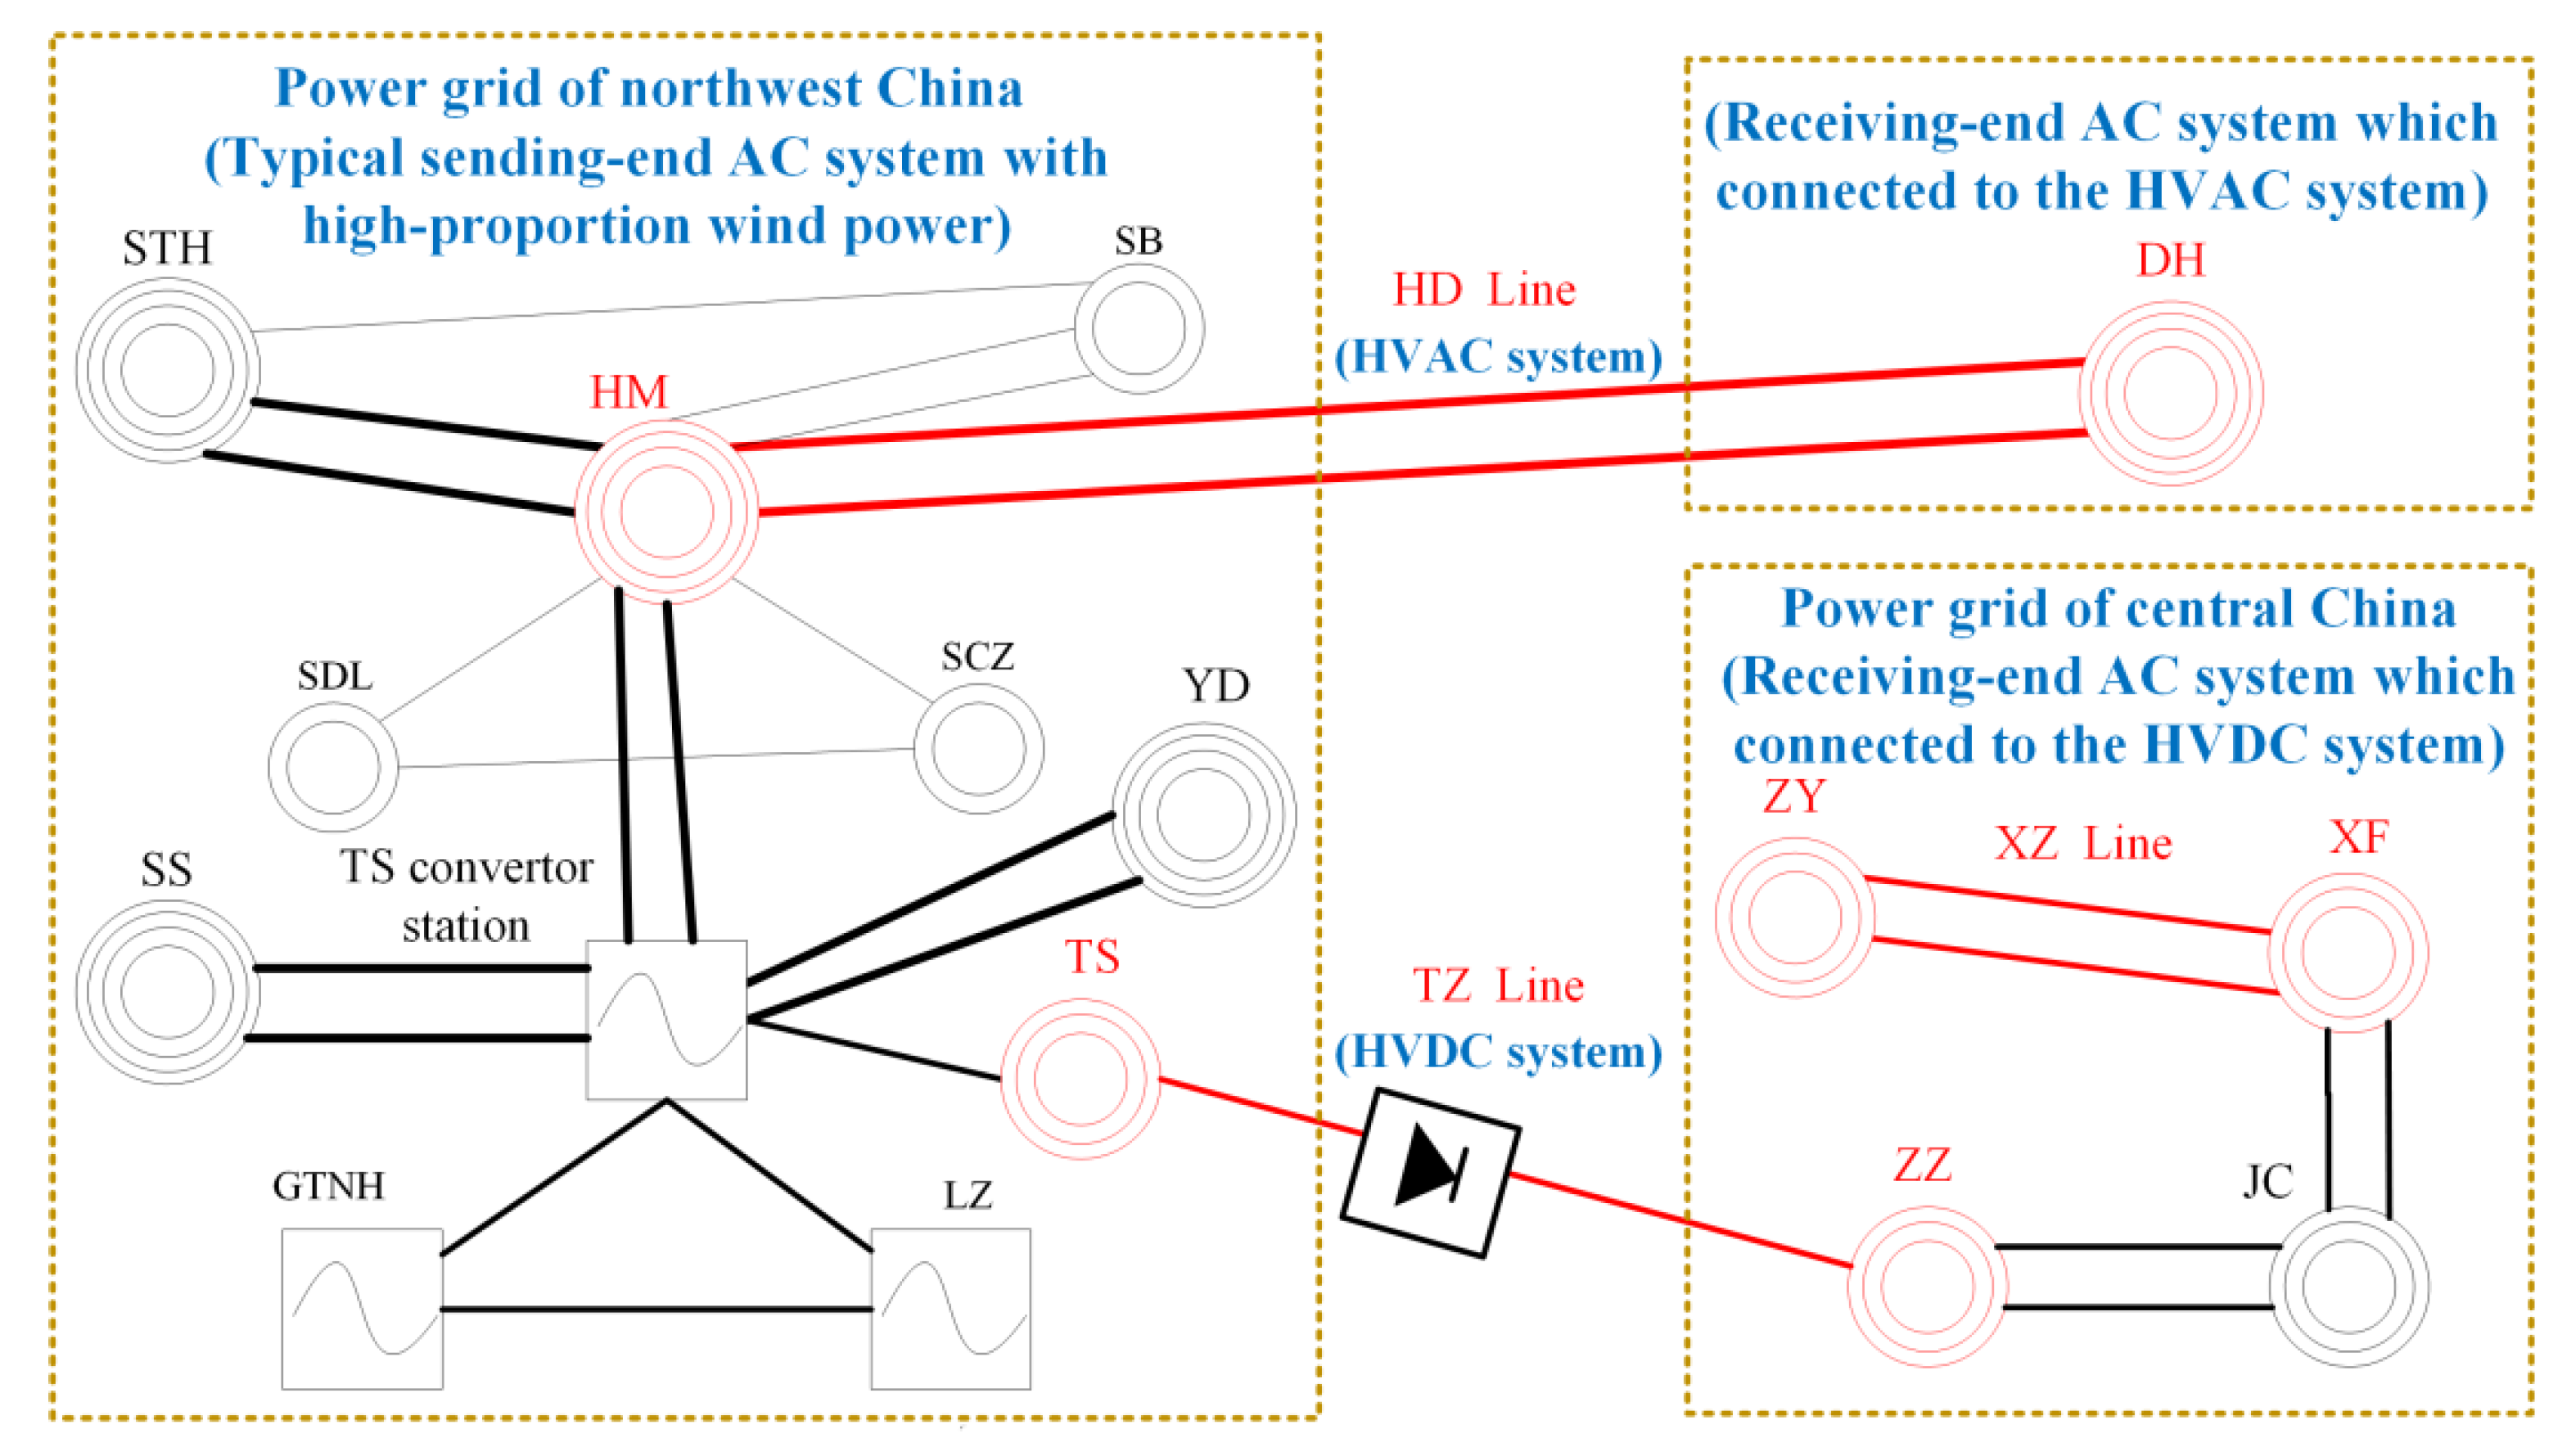
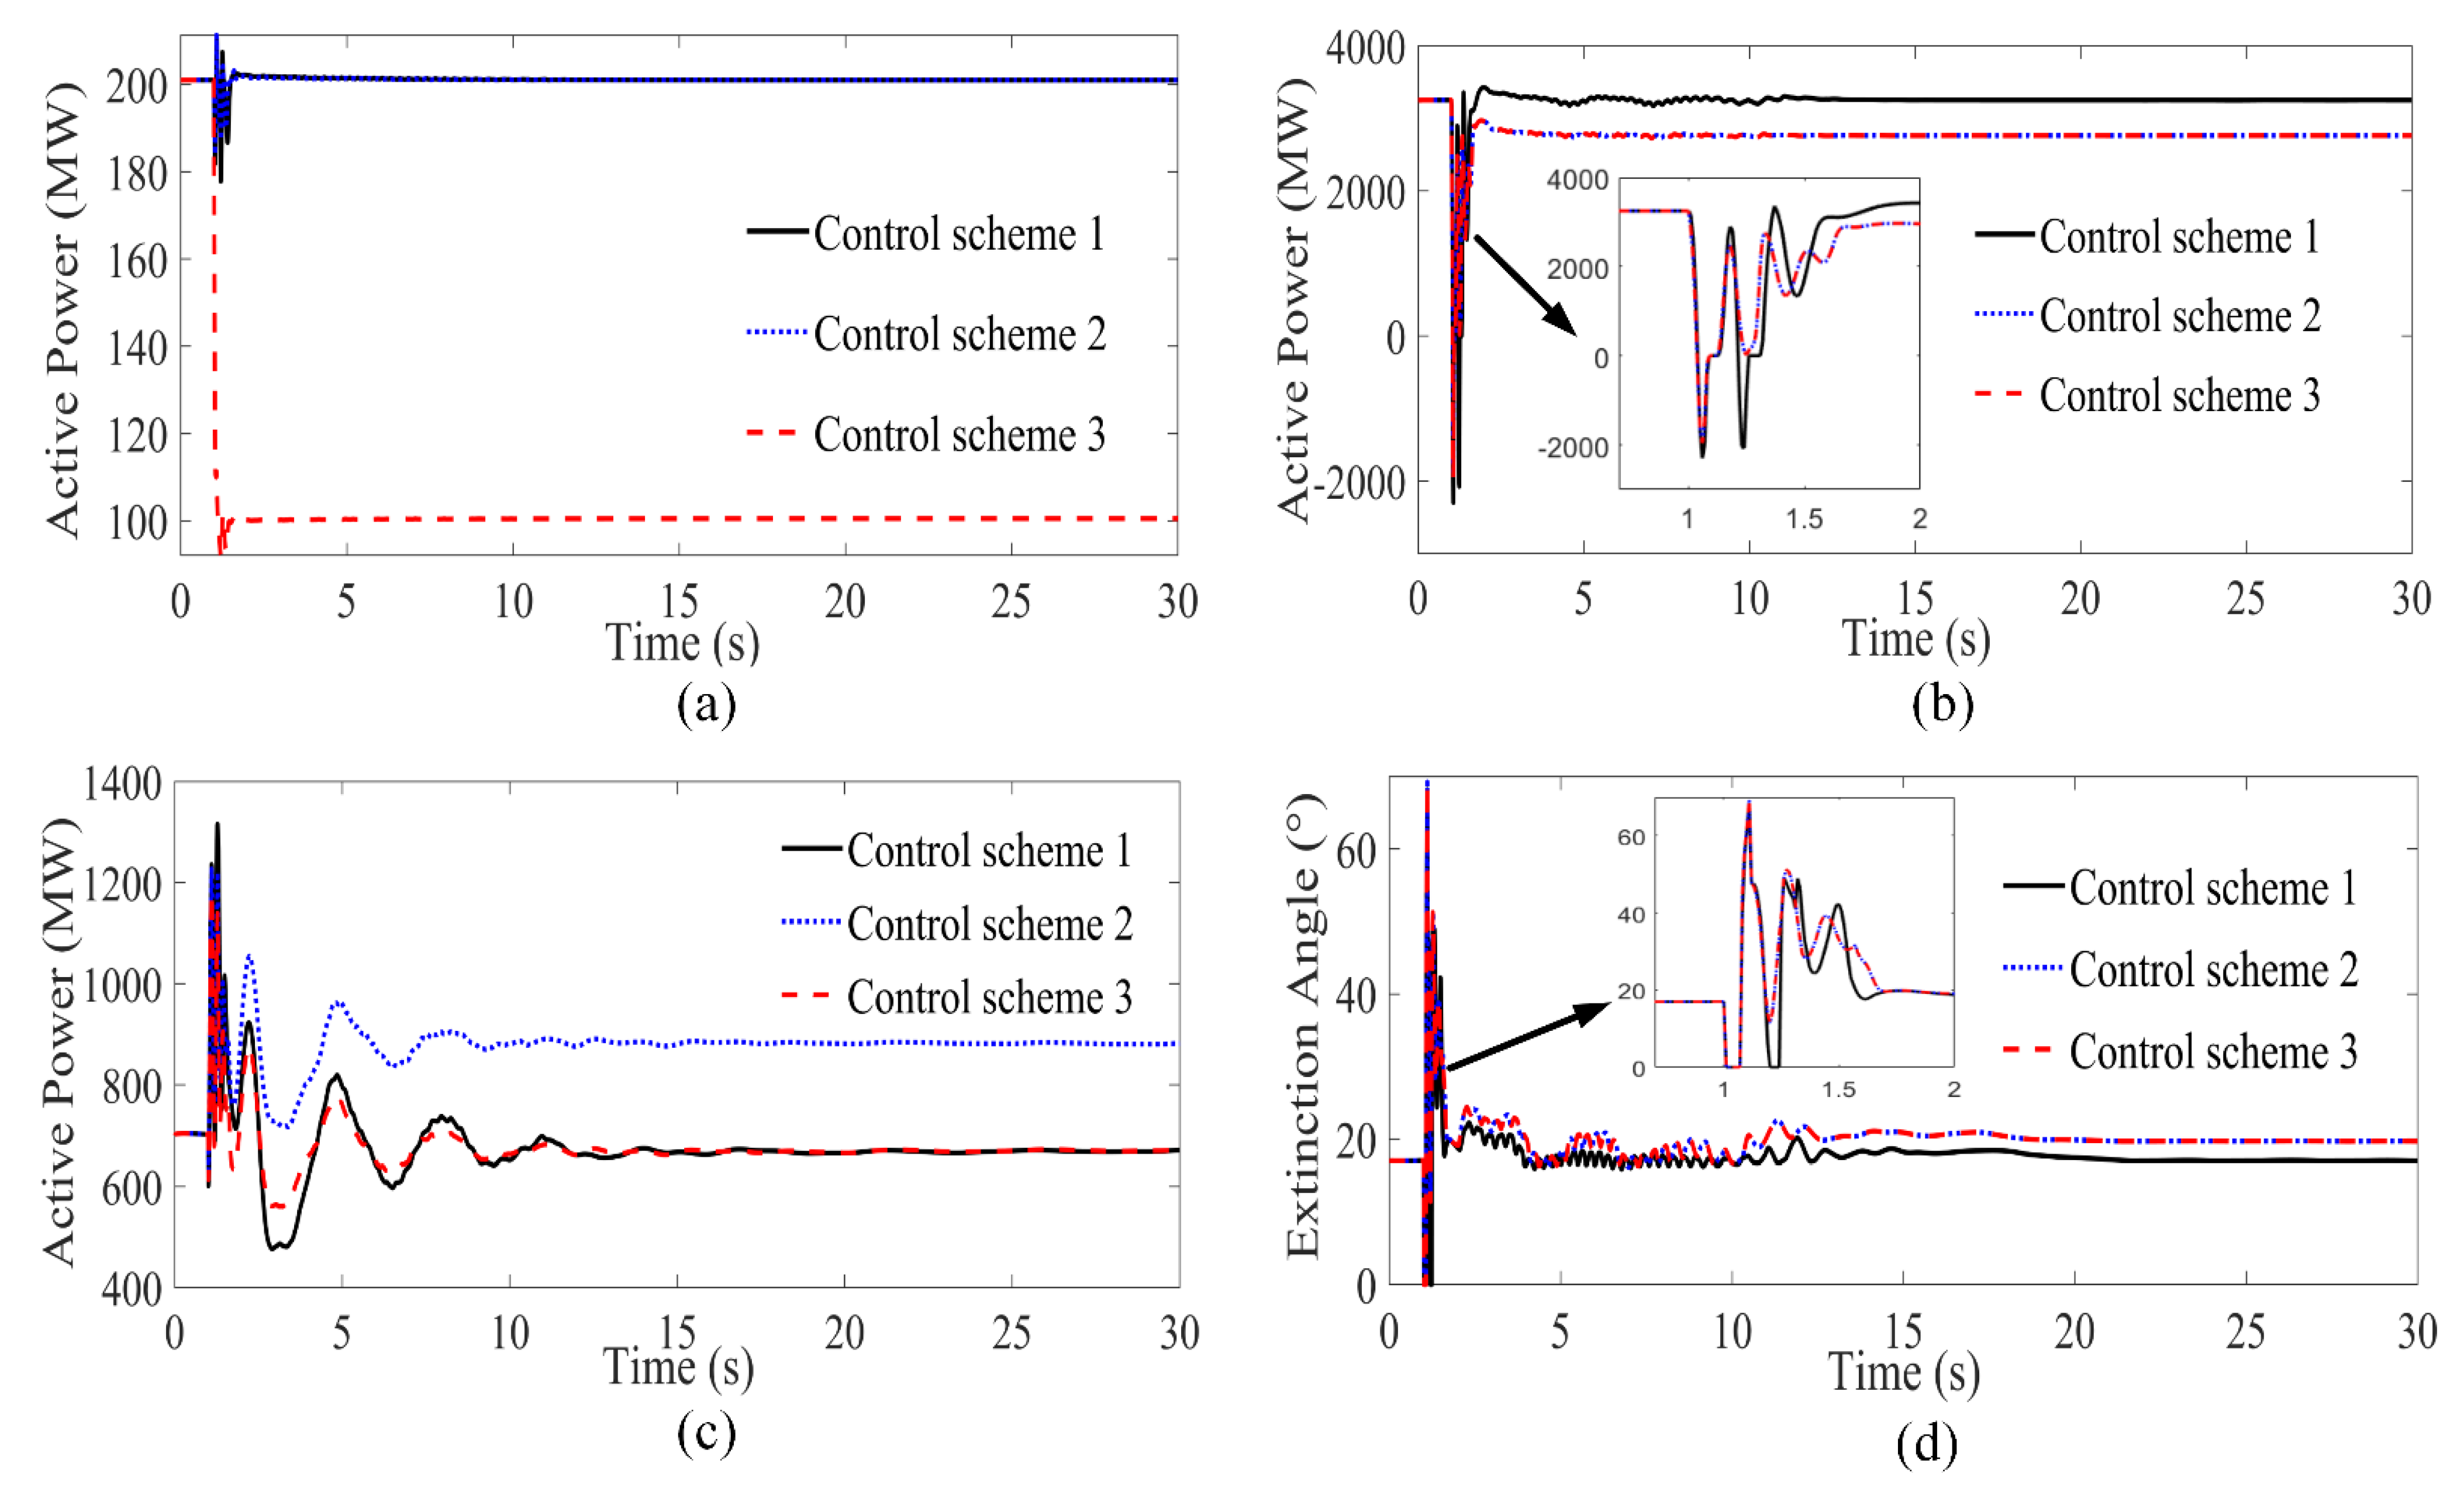
6.2. Actual Power Grid Simulation
7. Conclusions
Author Contributions
Funding
Data Availability Statement
Conflicts of Interest
Appendix A

| Parameter | Value |
|---|---|
| Rated capacity | 3 MW |
| Rated voltage | 690 V |
| Wind speed | 13 m/s |
| Stator resistance | 0.0108 p.u. |
| Stator leakage reactance | 0.102 p.u. |
| Rotor resistance | 0.01 p.u. |
| Rotor reactance | 0.11 p.u. |
| Inertia time constant | 3 s |
| Parameter | Value |
|---|---|
| Effective value of converter bus on inverter station | 215.09 kV |
| Ideal no-load DC voltage at rectifier side | 619.16 kV |
| Ideal no-load DC voltage at inverter side | 277.63 kV |
| Equivalent commutation resistance at rectifier side | 12.96 Ω |
| Equivalent commutation resistance at inverter side | |
| DC resistance | |
| Commutation reactance | |
| Trigger angle | 20° |
| Parameter | Value |
|---|---|
| Voltage level | 330 kV |
| Line length | 200 km |
| Line resistance | |
| Line inductance |
References
- Moradi-Sepahvand, M.; Amraee, T. Transmission AC/DC Transmission Expansion Planning Considering HVAC to HVDC Conversion Under Renewable Penetration. IEEE Trans. Power Syst. 2021, 36, 579–591. [Google Scholar] [CrossRef]
- Rehman, B.; ur Rehman, A.; Khan, W.A.; Sami, I.; Ro, J.-S. Operation and Challenges of Multi-Infeed LCC–HVDC System: Commutation Failure, AC/DC Power Flow, and Voltage Stability. Appl. Sci. 2021, 11, 8637. [Google Scholar] [CrossRef]
- Liu, Z.; Zhang, Q. Study on the development mode of national grid of China. Proc. CSEE 2013, 33, 1–10. [Google Scholar]
- Imdadullah; Alamri, B.; Hossain, M.A.; Asghar, M.S.J. Electric Power Network Interconnection: A Review on Current Status, Future Prospects and Research Direction. Electronics 2021, 10, 2179. [Google Scholar] [CrossRef]
- Lotfjou, A.; Fu, Y.; Shahidehpour, M. Transmission AC/DC transmission expansion planning. IEEE Trans. Power Syst. 2012, 27, 1620–1628. [Google Scholar] [CrossRef]
- Xu, Z.; Song, P.; Huang, H. Three macroscopic indices for describing the quality of AC/DC power grid structures. IET Gener. Transm. Distrib. 2016, 10, 175–182. [Google Scholar] [CrossRef]
- Li, X.; Zhang, X.; Wu, L.; Lu, P.; Zhang, S. Transmission Line Overload Risk Assessment for Power Systems with Wind and Load-Power Generation Correlation. IEEE Trans. Smart Grid. 2015, 6, 1233–1242. [Google Scholar] [CrossRef]
- Rahman, S.; Khan, I.; Alkhammash, H.I.; Nadeem, M.F. A Comparison Review on Transmission Mode for Onshore Integration of Offshore Wind Farms: HVDC or HVAC. Electronics 2021, 10, 1489. [Google Scholar] [CrossRef]
- Mirsaeidi, S.; Dong, X.; Said, D.M. A Fault Current Limiting Approach for CF Prevention in LCC-HVDC Transmission Systems. IEEE Trans. Power Deliv. 2019, 34, 2018–2027. [Google Scholar] [CrossRef]
- Lin, S.; Liu, J.; Liu, L.; Lei, Y.; Fu, C. A review of CF suppression methods for HVDC systems based on control protection measures. Proc. CSEE 2020, 40, 6045–6059. [Google Scholar]
- Mirsaeidi, S.; Dong, X.; Tzelepis, D.; Mat, D. A predictive control strategy for mitigation of CF in LCC-based HVDC systems. IEEE Trans. Power Electron. 2019, 34, 160–172. [Google Scholar] [CrossRef] [Green Version]
- Guo, C.; Li, C.; Liu, Y.; Jiang, B.; Zhao, C.; Zhou, Q. A DC current limitation control method based on virtual-resistance to mitigate the continuous CF for conventional HVDC. Proc. CSEE 2016, 36, 4930–4937. [Google Scholar]
- Ni, X.; Zhao, C.; Guo, C.; Liu, H.; Liu, Y. Enhanced line commutated converter with embedded fully controlled sub-modules to mitigate CFs in high voltage direct current systems. IET Power Electron. 2016, 9, 198–206. [Google Scholar] [CrossRef]
- Liu, L.; Lin, S.; Liao, K.; Sun, P.; Deng, Y.; Li, X.; He, Z. Extinction angle predictive control strategy for CF mitigation in HVDC systems considering voltage distortion. IET Gener. Transm. Distrib. 2019, 13, 5171–5179. [Google Scholar] [CrossRef]
- Tang, Y.; Zheng, C.; Lou, B.; Hua, W.; Wang, L. Research on DC Power Control Strategy for Mitigating Continuous Commutation Failure. Power System Technol. 2019, 43, 3514–3521. [Google Scholar]
- Ali, M.; Degefa, M.Z.; Humayun, M.; Safdarian, A.; Lehtonen, M. Increased Utilization of Wind Generation by Coordinating the Demand Response and Real-time Thermal Rating. IEEE Trans. Power Syst. 2016, 31, 3737–3746. [Google Scholar] [CrossRef]
- Song, P.; Xu, Z.; Dong, H. UPFC-based line overload control for power system security enhancement. IET Gener. Transmiss. Distrib. 2017, 11, 3310–3317. [Google Scholar] [CrossRef]
- Zhu, S.; Wang, T.; Wang, Z. Bi-level optimised emergency load/generator shedding strategy for AC/DC transmission system following DC blocking. IET Gener. Transmiss. Distrib. 2020, 14, 1491–1499. [Google Scholar] [CrossRef]
- Tai, L.; Lin, M.; Wang, J.; Hou, C. Synchronous Control Strategy with Input Voltage Feedforward for a Four-Switch Buck-Boost Converter Used in a Variable-Speed PMSG Energy Storage System. Electronics 2021, 10, 2375. [Google Scholar] [CrossRef]
- Mozayan, S.M.; Saad, M.; Vahedi, H.; Fortin-Blanchette, H.; Soltani, M. Sliding mode control of PMSG wind turbine based on enhanced exponential reaching law. IEEE Trans. Ind. Electron. 2016, 63, 6148–6159. [Google Scholar] [CrossRef]
- Tiwari, R.; Krishnamurthy, K.; Neelakandan, R.B.; Padmanaban, S.; Wheeler, P.W. Neural Network Based Maximum Power Point Tracking Control with Quadratic Boost Converter for PMSG—Wind Energy Conversion System. Electronics 2018, 7, 20. [Google Scholar] [CrossRef] [Green Version]
- Faruque, M.O.; Zhang, Y.; Dinavahi, V. Detailed modeling of CIGRE HVDC benchmark system using PSCAD/EMTDC and PSB/SIMULINK. IEEE Trans. Power Deliv. 2006, 21, 378–387. [Google Scholar] [CrossRef]


Publisher’s Note: MDPI stays neutral with regard to jurisdictional claims in published maps and institutional affiliations. |
© 2021 by the authors. Licensee MDPI, Basel, Switzerland. This article is an open access article distributed under the terms and conditions of the Creative Commons Attribution (CC BY) license (https://creativecommons.org/licenses/by/4.0/).
Share and Cite
Zhou, X.; Ding, C.; Dai, J.; Li, Z.; Hu, Y.; Qie, Z.; Xue, F. An Active Power Coordination Control Strategy for AC/DC Transmission Systems to Mitigate Subsequent Commutation Failures in HVDC Systems. Electronics 2021, 10, 3044. https://0-doi-org.brum.beds.ac.uk/10.3390/electronics10233044
Zhou X, Ding C, Dai J, Li Z, Hu Y, Qie Z, Xue F. An Active Power Coordination Control Strategy for AC/DC Transmission Systems to Mitigate Subsequent Commutation Failures in HVDC Systems. Electronics. 2021; 10(23):3044. https://0-doi-org.brum.beds.ac.uk/10.3390/electronics10233044
Chicago/Turabian StyleZhou, Xia, Cangbi Ding, Jianfeng Dai, Zhaowei Li, Yang Hu, Zhaohui Qie, and Feng Xue. 2021. "An Active Power Coordination Control Strategy for AC/DC Transmission Systems to Mitigate Subsequent Commutation Failures in HVDC Systems" Electronics 10, no. 23: 3044. https://0-doi-org.brum.beds.ac.uk/10.3390/electronics10233044