On the Design of Low-Cost IoT Sensor Node for e-Health Environments


1
Department of Computer Science and Engineering, ATEI of Thessaly, 41110 Larissa, Greece
2
Department of Electrical and Computer Engineering, University of Patras, Campus of Rion, 26504 Patras, Greece
3
Department of Informatics, Aristotle University of Thessaloniki, 54124 Thessaloniki, Greece
*
Author to whom correspondence should be addressed.
Electronics 2019, 8(2), 178; https://0-doi-org.brum.beds.ac.uk/10.3390/electronics8020178
Submission received: 31 December 2018
/
Revised: 24 January 2019
/
Accepted: 29 January 2019
/
Published: 2 February 2019
(This article belongs to the Special Issue Low-power Wearable Healthcare Sensors)
Abstract
:The proliferation of Internet of Things (IoT) devices for patient monitoring has gained much attention in clinical care performance, proficient chronic disease management, and home caregiving. This work presents the design of efficient medical IoT sensor nodes (SNs) in terms of low-cost, low power-consumption, and increased data accuracy based on open-source platforms. The method utilizes a Sensor Controller (SC) within the IoT SN, which is capable of performing medical checks supporting a broad coverage of medical uses. A communication protocol has been developed for data and command exchange among SC, local gateways, and physicians’ or patients’ mobile devices (tablets, smart phones). The SC supports moving average window (MAW) and principle component analysis (PCA) filtering algorithms to capture data from the attached low-cost body sensors of different sampling profiles. Significant extensions in SN’s portability is achieved through energy consumption minimization based on the idle time gaps between sensors’ activations. SN’s components are either deactivated or set to low activity operation during these idle intervals. A medical case study is presented and the evaluated results show that the proposed SN can be incorporated into e-health platforms since it achieves comparable accuracy to its certified and high-cost commercial counterparts.
1. Introduction
E-health monitor infrastructures can improve the quality of life in elderly people [1,2,3] while the advent of wearable sensors could also help in chronic disease management [4]. Typical medical checks or vital signals monitoring are performed by the aforementioned healthcare systems and data are utilized by physicians to monitor health conditions. The combination of low-cost devices and advanced information systems can reduce the cost of daily life monitoring while preventing unnecessary hospital admissions. Although high precision is the main target that has to be accomplished in the medical checks performed by e-health monitoring systems, low cost can encourage more users to adopt them. Additionally, the Internet of Things (IoT) technology is utilized to reduce costs in IoT-based healthcare services towards the support of a ubiquitous computing environment with medical data processing, monitoring, and prediction [5]. The IoT infrastructure is either based on expensive commercial devices or open-source technologies of low implementation cost. Patients of severe heart diseases were monitored by an e-health platform [6] that utilized commercial monitor devices and sensors [7,8] to perform Electrocardiograms (ECGs) in real-time. In this platform, Wi-Fi or Global System for Mobile communications (GSM) telecom protocols were employed to send sensor information to IoT infrastructure. The work in [9] proposes a similar monitoring architecture utilizing on-the-shelf sensor devices of high-cost while researchers in [10] focus on the implementation of a middleware to interface wireless protocols with the sensor devices and the rest of the IoT platform so as to transform raw-data to patient information without taking into account low-energy consumption or low-cost sensors. The work in [11] proposed a patient monitoring environment based on wearables by utilizing high-precision and low-power sensors. The authors in [12] developed a body area network of sensors that recorded vital signals stored in a database from where physicians could check the health status of individuals. The proposed system was based on Arduino and Raspberry PI as combined in the e-Health Sensor Shield [13]. However, no information was given about the features that are vital for this kind of an infrastructure (e.g., data communication mechanism, energy consumption, and accuracy).
The same pair of popular computing platforms (Arduino and Raspberry PI) are also used in [14] for monitoring the breeding behavior of vultures in their nests. A tiny version of Arduino called Miniduino connected to a number of sensors (temperature, accelerometers, etc.) is camouflaged as an egg. The data gathered are sent to a “data-relay” implemented with Raspberry PI through Bluetooth. The data relay, connected to the Internet, stores the sensor values in a data cloud. Although this application differs from health monitoring, the system architecture and the challenges faced are similar (power consumption, communication method between sensor controller and data relay, etc.). The in-home e-health monitoring platform that was proposed in [15], consists of an expandable WSN, which sends its sensor samples to an in-premises gateway (GW) through communication protocols that follow the Serial Port Profile (SPP) [16]. The gathered data are transmitted to a service based system that is responsible for database transactions, data processing, and medical assessment (e.g., vital signals, alerts). Heterogeneous sensors with different real time operating systems (tinyOS, Android, etc.) and communication interfaces are connected to the Gateway. However, this framework does not provide details for the connection of analog sensors.
The work in [17] designed a power-over-Ethernet GW to perform proper data filtering and streaming so as to send individuals’ vital signals to monitor devices. The MIThril system [18] uses body and ambient wearables, which are incorporated into a WSN and restricted to only short-term tele-monitoring. On the other hand, there is a plethora of proprietary IoT platforms like e-Shimmer Health BSN [19] or Simband health sensor [20] from Samsung, with proprietary components that don’t provide open-source hardware (HW) features. The cost of such an individual commercial sensor module may be many (2, 3, or more) times higher than the overall cost of the controller and the set of sensors used in our platform.
Approaches towards the exploitation of open hardware platforms for the implementation of IoT SNs and gateways have been proposed recently in the literature [21,22,23,24,25,26,27,28]. To this end, medical sensors are incorporated and plugged into the aforementioned platforms for monitoring patient vital signals while maintaining low-cost equipment and facilities.
Within the context discussed above, current work focuses on the development of an IoT Sensor Node which incorporates low-cost sensors to monitor elderly, disabled, or even healthy persons in non-life threatening situations. Our targets are:
- First, to design and implement a low-power communication protocol to efficiently deliver sensor data from the IoT SN to the medical staff that monitors the patient.
- Second, to improve the quality of the received sensor data from low-cost sensor devices by enhancing their accuracy through the usage of filtering algorithms.
- Third, to decrease energy-consumption and increase battery life-time ensuring portability.
Specifically, the developed system can be used to merely monitor a person’s habits like the amount of time being spent in bed, or it can be used to perform trivial medical tests like body temperature, blood pressure measurement, etc., or it can even support more advanced medical tests like ECG. Although the use of the developed computing platform can be scaled to multiple patients monitoring as the case is in a hospital environment, its main use is targeted to the monitoring of individual persons in their own environment. The low-cost e-Health kit of Libelium/Cooking Hacks, mentioned before, was also utilized by the authors towards the development of e-health monitoring systems [29,30]. The architecture of this platform is introduced in [29]. The methods employed for low power consumption and higher sensor accuracy are briefly described in [31,32,33]. Libelium discontinued the employed version (v2.0) of the e-Health platform and its successor called MySignals supports additional sensors with higher precision. However, the cost of the new MySignals platform is comparable to the cost of similar commercial products. Since our target is to keep the cost low we have developed methods that improve sensor accuracy and minimize power consumption using the older version v2.0. In this regard, several architectural features of the v2.0 version can be integrated in a new e-health system that could be offered as a low-cost platform that achieves though, high precision measurements flexibility and portability with low energy consumption. Specifically, in contrast to prior developments [29,30,31,32,33], we have significantly improved the platform’s functionalities by performing suitable procedures and hardware/software expansions. In this context, it was achieved to support a diversity of medical scenarios using an advanced control and communication mechanism (between the SN and the GW) in order to plan the proper time intervals where sensors’ sampling is performed based on user requirements. Moreover, we have activated low energy consumption methods that utilize the time gaps (idle-intervals) between successive sensor measurements in the sense that these are translated to appropriate “sleep mode” operation intervals. During these intervals, some of the SN’s processes are deactivated periodically so as to expand portability by prolonging its battery life-time. Furthermore, it was possible to significantly enhance the precision of specific sensors, making them in many cases competitive with certified medical devices as shown in our comparison study. Overall, by providing the developed platform with the aforementioned value added characteristics it is aimed to come up with a low-cost and advanced e-health sensor node suitable to accommodate a plethora of medical scenarios and checks.
The rest of the paper is organized as follows: Section 2 describes the proposed e-health infrastructure while focusing on the IoT SN’s features and its implementation. Furthermore, the work regarding enhancement of the sensors precision is also presented. This section analyzes the power dissipation issues whereas the applied techniques for power consumption reduction are introduced. Furthermore, the implemented communication protocol between the SC and the Local GW is also presented. Section 3 describes a demonstrative medical test case to show the efficiency of the proposed methods and procedures. Finally, we demonstrate and discuss the experimental evaluation results of the sensors of the developed IoT Sensor Node, including a comparison with commercial certified sensors where possible.
2. Materials and Methods
2.1. IoT Sensor Node Design
The IoT Sensor Node, developed in this work, is applicable to an e-health monitoring framework like the one in Figure 1, where a patient is monitored either in a hospital or a rehabilitation center. Orders can be given by a supervising physician for specific medical tests that can be performed by the patient himself or with nurse assistance, while the results are uploaded to a cloud or the Hospital’s Information System (HIS). Qualified staff can examine the results of the medical tests in order to define appropriate treatment or schedule additional tests. The IoT Sensor Node comprises an Arduino UNO Microcontroller and a Raspberry PI platform [13]. A set of medical sensors with either a simple analog or smart digital interface can be attached to the monitored person and they are all connected to the portable IoT Sensor Node (through the sensor coupler). A low power circuitry has been designed and incorporated as power control mechanism. The IoT Sensor Node communicates through the connectivity layer to a Local IoT Gateway which is installed on the premises. The Gateway gives comprehensive instructions to the smart phone or the tablet of the patient under supervision. The Gateway is also used to forward the measured sensor values to a database or cloud which is accessed by the supervising physician or nurse [5]. In the reverse direction, the Gateway accepts a scenario of medical tests that should be performed, translating this scenario into commands that are executed by the Sensor Controller (SC). The SC implements a protocol that is executed on the Raspberry PI processor and supports the communication with the Local Gateway using a wireless infrastructure (e.g., Wi-Fi, Bluetooth). The SC collects data from sensors and transmits them to the Gateway. Slight tasks like alerts regarding temperature, humidity conditions, patient behavior etc. can be directly retrieved via the GW, whereas, of course, the supervising doctor makes the significant conclusions by taking into account the stored medical values. At this point, it should be mentioned that although, as aforementioned, the developed system mainly aims to remote monitor individuals in their own environments, its use for a higher number of persons is not restricted as long as the supervising doctors are able to monitor all the sensor values stored in the cloud (or HIS) and the necessary privacy and security levels are preserved. The local gateway usually transmits its data to the cloud or HIS by employing the Message Queuing Telemetry Transport mechanism (MQTT protocol). The MQTT protocol utilizes publish-subscribe communication over the Transmission Control Protocol (TCP) layer (employing shorter header than typical TCP), and is used for Machine-to-Machine IoT applications, due to its flexibility and scalability [34].
Regarding security, we utilize the encryption as provided by the wireless communication method employed like IEEE 802.11, provided that all the persons that can connect to the local access point are authenticated. The File Transfer Protocol (FTP)/Hypertext Transfer Protocol (HTTP) server accessibility is also subject to authentication when sampling commands have to be downloaded or sensor data to be uploaded to the gateway. Authentication is also mandatory for access of the Real Time Operating System (RTOS) that runs on the IoT SN for debugging purposes. If more advanced security methods are required, libraries like OpenSSL that are compatible with many RTOS can be used. The additional encryption methods supported by OpenSSL can hide sensitive medical data exchanged between the IoT SN and the Gateway from other users that are connected to the Local Access Point. The security and access rights of the data stored in the remote cloud can be guaranteed by advanced private and public key distribution methods, but their study is out of the scope of this paper.
The developed system is based on a very low-cost IoT SN equipped with multiple sensors. Some of these are simple with an analog application interface (e.g., temperature, Galvanic Skin Response—GSR, ECG, electromyogram-EMG sensors), while others are smart with digital application interfaces (like blood pressure, pulsioximeter (SPO2) and glucose sensors. An analog sensor is coupled to one of the multiple channels of the Analog Digital Converters (ADCs) embedded in the microcontroller board. Passive or active analog circuitry may be needed to adapt the output range of the sensor’s values so as to match the ADC’s input value range. On the other hand, Low Noise Amplifiers (LNAs) apart from Wheatstone bridges or voltage dividers could be employed to extend the output range. Regarding digital sensors, these are often calibrated to easily retrieve their data and send them to the IoT SN through a dedicated digital serial or parallel bus. They could also be coupled to the GW. Accuracy of the digital sensors generally cannot (and usually need not) be improved, but filtering could be applied for enhancing accuracy of the analog sensors and stability as elaborated in the rest of the paper.
The digital interface of the smart sensors can be connected to the Sensor Node via serial interfaces. However, conflicts could happen if e.g., SC functionalities running on the IoT SN and the GW may also require the same (serial interface) so as to be controlled. This results in conflicts concerning the sensors which have to be coupled directly to the IoT SN. General Purpose I/O (GPIO) could be utilized to connect sensors that exhibit simple communication interface but this may increase the operation overhead of the serial bus while additional SW drivers are required to be installed.
A conflict could also appear due to limited software resources available, like the bus drivers. If SW switching is permitted, some conflicts can be controlled by letting sensors operate in an alternate way, i.e., by selecting one software or hardware resource at a time. Extra HW switching could be required support for different sensors that are attached to the same I/O. Hardware switching can be implemented using relays, optocouplers, etc.; a solution which has also been adopted in our case. Auxiliary GPIOs are usually used to perform the HW switching, or in the case of a microcontroller’s memory size not being large enough, RTOS (Real-Time Operating-System) scheduler (pre-emption and task prioritization) or semaphores could control access to the GPIO. The available HW resources of the microcontroller determines the storage capability of complicated firmware used for sensor data manipulation.
Libelium-Cooking Hacks provide a low-cost e-Health kit (v2.0) [13], which was chosen in the current work for the implementation of the IoT SN. This e-Health kit supports the following analog sensors: temperature, skin conductivity (Galvanic Skin Response—GSR), position detection, and breathing airflow sensor, as well as electrocardiogram (ECG) and electromyogram (EMG) ones (the last two sensors cannot be processed in the same time). The digital sensors supported include a sensor for blood pressure measurement that uses serial link communication, one for the measurement of heart pulses and the oxygen in blood (named pulsioximeter or SPO2 that requires 8 GPIO pins) and a glucometer. The glucometer and blood pressure sensors cannot be controlled in the same time since they share the same serial link (i.e., the Universal Asynchronous Receiver Transmitter—UART). An Arduino bridge is used to control the Arduino development board and the Raspberry PI one. Either one of them (Arduino or Raspberry PI) could alternatively form the required processing core for the operation of the e-Health kit platform. The scope of the Arduino bridge is to rearrange the pin-out of the Raspberry PI GPIOs and provide Arduino-compatible headers and support the shields that are already available for this platform. An additional ADC is also used to expand the number of analog inputs exhibited by the Raspberry PI. Although Libelium-Cooking Hacks has discontinued the version v2.0 of the e-Health kit, its successor (MySignals) is a much more expensive platform that would not be able to support a major target of this work: low cost. For this reason, we have developed techniques that enhance the sensors’ precision and the support of lower power operation without increasing the cost of the overall system.
The Raspberry PI processor of the e-Health kit was chosen since its 32-bit ARM core offers higher processing power than the 8-bit AVR of Arduino. Furthermore, the increased Flash and RAM memory embedded in the Raspberry PI module allows for more advanced and complicated software to be developed. It also provides the ability for local processing of the (sensors’) sampled data. The employed Libelium-Cooking Hacks e-Health kit v2.0 is not able to cooperate with other processors, although it would be desirable to employ a microcontroller that is computationally powerful but still offering low energy consumption options as AVR does. In a future version of our system, the low cost e-health kit circuits could be adapted to such a 32-bit low power microcontroller. A C-programming language library like the one currently offered by Libelium-Cooking Hacks for the support of Raspberry PI would have to be developed in such a case. Several of the techniques presented here such as sensor filtering, communication protocols between the SN and the Gateway, etc, would also be applicable to such a platform. Figure 2 delineates the specific way that the e-Health kit comprises both the Raspberry PI and Arduino bridge. This stacked connectivity eases the installation of wireless communication devices. This module could be a Wi-Fi, Bluetooth, GPRS, etc., and is used for enabling the communication link between the GW and IoT SN. The IEEE 802.11 b/g/n Wi-Fi protocol was adopted due to its connectivity reliability in comparison to Bluetooth devices. The top pin connectors of the e-Health as shown in Figure 2 have been employed to couple the aforementioned sensors.
Figure 3 shows the communication paths used between the proposed Internet of Things Sensor Node (IoT SN) and the Gateway when they operate in debug (Figure 3a) and real time mode (Figure 3b). As delineated in Figure 3, a secured FTP (sFTP) server (like FileZilla) has been installed on the Gateway side for the implementation of the Sensor Controller—Gateway communication protocol. This protocol is implemented through two types of files: (a) a command file which is prepared in the Gateway and downloaded by the Sensor Controller describing the sampling strategy and (b) the data file which is used to store the measured sensor values and is uploaded to the Gateway. In real time operation, the IoT SN is connected wirelessly to the Wi-Fi (IEEE 802.11g) router. The Gateway can be also connected in a wired manner to the router since it is not necessarily portable. In debug mode, the IoT SN is both wired and wirelessly connected to the router. The wired connection allows for the debugging of the IoT SN by the Raspbian operating system (OS), or simply by a telnet terminal (like putty) that can be opened at the gateway or a different computer.
Using the experimental set-up shown in Figure 2, we have focused on providing the specific platform with a number of value-added characteristics that could potentially make it competitive against much more expensive commercial e-health platforms. These key characteristics are analyzed in the following sections and include: significant enhancement of (analog mainly) sensors precision, increased portability by achieving low power consumption, and the development of a flexible and efficient communication protocol supporting all kinds of sensor sampling profiles and medical test scenarios.
2.2. Enhancement of Analog Sensor’s Precision
As described before, the analog sensors are coupled to ADC inputs through customized range value adaptation circuits. Specifically, we have employed a 3V Wheatstone bridge to connect the temperature sensor to it, subject to on-board calibration. The single-ended signal is produced through the amplification of the differential signal of the output of the Wheatstone bridge. It is required to measure the real resistance values (Ra, Rb, Rc) of the Wheatstone bridge calibration scheme according to the manufacturer’s suggestion. This has to be carried out with a multimeter that is also used to confirm the actual value of a reference voltage Vr = 3V. The actual values measured are used to overwrite the default ones set in the system software. Following this calibration scheme, any modification to the hard-written software parameters requires recompilation of the libraries’ software. Moreover, the indications of various analog sensors are sensitive to environmental conditions like temperature, humidity, power supply, etc., and their outputs may be rippling.
In this work, we have tried to enhance the accuracy and stability of the measurements through real time software calibration and filtering. One way to achieve the software calibration is to modify and read in real time the parameters stored in configuration files. Sensor values can be exploited to adjust parameters that affect other sensors. For example, an increase in the measured temperature by the corresponding (temperature) sensor can be used to calibrate the GSR or the breathing airflow sensor. The calibration can be based on look-up tables that define target parameter values based in turn on other measurements. These tables can be either stored with the Raspberry PI Software in the SD-card, or can be downloaded from the sFTP server at boot time for easier update. External environmental conditions can be used as well, but although they may have been derived from high precision sensors, they may not reflect exact conditions in the room where the Sensor Controller resides.
The temperature sensor calibration referred to above is used as an example on how to modify the default calibration scheme proposed by the e-Health kit manufacturer. First, the parameters Aux and Raux are estimated as:
The estimated Raux is exponentially related to the temperature as follows:
The exact f and p values depend on the measured temperature. Equation (3) can be exploited for more accurate corporal temperature estimation, as well as for the calibration of other sensor indications that depend on temperature. The e-Health kit library checks whether Raux lies within specific limits corresponding to draft temperature intervals of 5 °C in the range between 25 °C and 50 °C. The used values for f and p depend on the measured resistance Raux. Even if the temperature sensor is not needed in some medical cases it can still remain connected to the ΙοΤ SN to roughly indicate the environmental temperature to be used for the real time calibration of other sensors.
The stabilization of the analog sensor indications can be performed by a filtering procedure that takes place at the Sensor Controller Software, which is executed on the IoT SN. Please note that the intention is not to develop a radically new filtering algorithm, but rather to present a number of well-known ones with different computational complexities in order to assess their efficiency on the developed system. Specifically, a Moving Window Average has been used with extreme value exclusion. The initial average value i.e., Ainit is estimated by applying the moving average to the last k sample values (vt, vt−1, …, vt−k+1):
The k, vi’s are compared to Ainit and the vi’s for which their difference from Ainit is larger than the Th threshold, are dropped from the calculation of the final average computation. Alternatively, a fixed number of the k samples with the highest deviation from the initial average can be excluded. The associated binary index mi is assigned to 0 for the dropped samples and to 1 for the remaining ones. The estimation of the final average Afin is calculated by Equation (5).
It may not be possible to apply the averaging method in a moving window of samples especially when other sensors have to be sampled in between. This is because a significant delay may intervene in some samples, thus making their sampling irregular (i.e., the samples are not retrieved in equal time intervals). In this case, k dedicated samples may have to be retrieved just to extract a single Afin value. The time needed to retrieve these k samples may also not be negligible and has to be taken into consideration when the command file is prepared.
For instance, consider that one sensor must have to be successively sampled in 20 ms intervals and that k = 5. This means that an Afin average can be extracted in 5 × 20 ms = 100 ms. If successive values have to be returned to the Gateway every 500 ms, then the sampling interval in the command file should be defined as 400 ms, since 100 ms more will be needed to estimate an average sample from this sensor. Of course, this procedure poses some restrictions on how small the sensors’ sampling intervals can be.
More sophisticated methods like PCA [35] and Kalman Filters [36] have also been implemented and tested for higher sensor accuracy and avoidance of the delays caused by the Moving Window Average. PCA is used for extracting strong patterns in high dimensional data and can also be used to compress the data in a lossy way.
If Xrxn = [X1 X2 … Xn] is the measurements matrix, where Xi forms the sub-vector of r elements vj, that are essential for the estimation of the principal components.
The covariance matrix of each Xi is calculated for the measurement of the data variability or data spread:
The principal components transformation could be related to the singular value decomposition (SVD) of (R)rxr:
where S is a diagonal matrix that contains the R singular values, V is a matrix that its columns correspond to the R right singular vectors while U = [U1 U2 … Un] stands for the feature vector (matrix of vectors) with its columns being the R left singular vectors.
The reduced (Ureduced)nxm = [U1 U2 … Um], m < n is created by the m sub-vectors from U i.e., the first m eigenvectors which are ordered by magnitude. If a low m value is selected, a higher compression rate is achieved (m/n), as well as a higher level of smoothing. The compressed data received are:
While the original data can be recovered by:
In the simplified Kalman filter used, the initial state x0 is assigned to v0. The confidence factor Pk (generally set to the squared standard deviation of the input values model) is initially set to P0 = 1 (because the input values are not associated to a particular model). Similarly, we assign the measurement noise covariance Rn to be equal to 1. The iterative procedure of the Kalman filter updates the factors Ki and Pi as follows:
2.3. Sensor Controller’s Communication Protocol
The fundamental communication scheme between the subsystems of the e-health system of Figure 1 is depicted on Figure 4. At some specific time, (t0), the gateway reads the instructions concerning the case of the monitored person. If a set of medical tests is to be performed starting roughly at time t2, the patient is informed by the tablet to get prepared (e.g., wear the sensors) a little earlier (at t1). The instructions shown to the patient by the tablet are defined by the gateway. One of these instructions is to turn on the Sensor Controller, the software program executed on the IoT Sensor Node, and download the (sensors) sampling scenario by the gateway through the developed Sensor Controller-Gateway communication protocol. Acknowledgments (ACK) are exchanged to confirm that the patient has followed the instructions. The medical tests are performed in specific sampling intervals determined by the medical scenario. If these intervals are long enough, the Sensor Controller may enter a low power (sleep) mode to save power. When all of the tests defined in a scenario are completed, the sensor values are returned to the Gateway. Some local processing may be performed before the final values are uploaded to the Medical Database (DB). Meanwhile, the patient is informed that the tests have been successfully completed and he is instructed to turn off the Sensor Controller. Therefore, the communication mechanism of the protocol between the operating Sensor Controller and the Gateway is important for the support of a diversity of sampling strategies and thus, for supporting as many medical cases as possible.
In addition to the communication scheme shown in Figure 4, the proposed IoT SN supports the following features: (a) initial filtering of sensor values within the Sensor Controller software to stabilize the measurements, (b) upload capability of the intermediate sensor values to the Medical Database of HIS, (c) variable sampling interval duration that ranges from milliseconds to hours in accordance with the various levels of power saving modes, (d) capability of performing several medical tests throughout a day or days. The communication between the GW and the Sensor Controller software is able to successfully cover any desired sensor sampling rate and medical test scenario. The communication protocol administrates the data and command interchange between these devices. Sensor Controller uses the commands to plan the potentially concurrent sampling of various sensors in different sampling intervals according to the specific medical scenario.
The privacy/security of the medical data is an important issue that has to be guaranteed at all levels in such an environment. Since we focus on the design of the IoT SN in this paper, we are interested in secure communications between the gateway and the software program executed on it (i.e., Sensor Controller). The privacy and security of the medical data stored on their way to the remote cloud as well as the privileges of the user that can access these data from the cloud (operators, medical staff, etc.) is beyond the scope of this work.
As mentioned in previous subsections, a secured FTP (sFTP) server is installed on the Gateway for the exchange of command and data text files replacing the FTP that had been employed in our initial versions where the only security was provided by the encryption offered by the Wi-Fi module. In sFTP, the transmitted datum is encrypted and a public key is sent to the remote terminal through Secure Shell (SSH). The authentication process includes a host key that is used to identify the sFTP server to the client and ensure that the server is known and trusted. The host key prevents man-in-the-middle security breaks and is part of the sFTP server configuration. After the sFTP server has been installed and configured on the Gateway side, the communication with the IoT SN is initiated. The employed message passing communication protocol is implemented by exchanging command and data files. Both of these files are transferred after the IoT SN initialization (the execution of the Sensor Controller software is started). By using the secure protocol, as shown in Figure 3, we ensure that data are transmitted via a secure path to mitigate possible cyber-attacks.
A command file defines either a sleep interval (in ms) or a specific sampling scenario. The IoT SN goes either into light or deep sleep mode if the sleep interval is less or higher than 30 s, respectively. If a sampling scenario is defined, two parameters are also specified: Q (Quantum) and I (Interval). The parameter I determines that after the sensor which exhibits the lower sampling rate has been read once, the Sensor Controller will re-read the command file after a delay of I ms. Then, the new command file that will be read might have been modified by the Gateway if a new sampling scenario has to be applied. The same sampling scenario will be performed by the SC, if the SW that is executed on the GW does not modify the command file.
In the command file, an integer number N is also defined that is associated with a sampling interval of N × Q ms, which is to be applied to a specific sensor. If N is equal to 0 the sensor is not used and is never sampled.
According to the specification previously defined, the SW that is executed on the SC downloads the command file and initiates a sampling loop of the sensors provided that N is non-zero. At the end of each one of the iterations, a delay of Q ms is inserted. A sensor is read if the current iteration number modulo its N value is zero. For example, let’s assume that the parameter N is defined for the pulsioximeter, Airflow, ECG, temperature, body position, and GSR sensors as follows: NBS = 5, NAF = 2, NEC = 1, NBT = 200, NPP = 10, NGSR = 10, respectively. This means that the pulsioximeter sensor is read at the iterations numbered 5, 10, 15, etc. that correspond to 5 × 100 ms, 10 × 100 ms, 15 × 100 ms, etc., respectively if Q = 100 ms. Similarly, the ECG will be sampled at 100 ms, 200 ms, 300 ms, etc.; the airflow sensor will be sampled at 200 ms, 400 ms, 600 ms, etc. and so on. Both the Patient Position and the GSR will be read at 1 s, 2 s, 3 s, etc. The largest N value has been assigned to the Body Temperature sensor. This value may correspond to a dummy sensor read, since it will be read once and then after an interval of I ms a potentially different command file will be downloaded by the gateway.
It is obvious from the description above that the format of the command file can support any sampling scenario and interval of any duration. Furthermore, long sampling intervals could be exploited to trigger a transition to deep sleep mode for achieving lower power consumption. During shorter sampling intervals, the sleep commands of the operating system could be used that achieve slightly lower power consumption due to the reduced processor activity. Furthermore, the data samples are also stored in the text files and transmitted back to the sFTP server. These data files support the delivery of mixed sensor indications that are identified by the sensor name and the accompanied measured data value with timestamp. The timestamp that accompanies the data uploaded to the gateway can be exploited to detect missing data e.g., due to internet connection loss. In this case, the gateway can ask the Sensor Controller to upload again the missing measurements. Higher level protocols, or the supervising medical staff could order additional tests if some data seem to be missing, taking into consideration the timestamps. The GW can be programmed to separate the sensor values of different data files. Although the proposed communication protocol does not support the interoperability or extendibility of a digital sensor network like the one presented in [15], it can nevertheless handle analog sensors in a versatile way in the sense of supporting almost any sampling profile. Future work will incorporate a Message Queuing Telemetry Transport (MQTT) protocol to transmit data over a broker to the user so as to scale the architecture towards the support of multiple users [34].
2.4. IoT SN Control Circuitry and Power-Consumption Analysis
The power dissipation is another critical feature of the IoT SN stemming from the necessity for portability and the fact that it is powered by a light-weight battery that is required to last for a long time of period so as to minimize recharging rate. Therefore, energy-consumption of the IoT SN is a critical issue that should be as low as possible in a portable health monitoring platform, so that its usage proves to be efficient and easy to handle. As already mentioned in Section 2.1, the Raspberry PI platform is employed due to its higher computational power and memory that it offers in comparison with the other supported microcontroller, i.e., Arduino. However, Raspberry PI bears a problem regarding battery powered systems in the sense that it does not support sleep modes. For this purpose, special hardware extensions have been employed to overcome this drawback. The parameters that determine the power consumption of the IoT SN include: (a) the computational burden and the idle intervals of the microcontroller, (b) the power consumption of peripheral circuits like the wireless communication board, (c) the number of connected sensors, (d) other analog circuitry and glue logic existing on the Sensor Controller board like external ADCs, adaptation circuits (LNAs, bridges), etc. The control of the peripherals’ power, the processing core computational burden, the processor sleep modes etc., constitute the high level features that can be exploited to reduce the consumed power. Furthermore, the microcontroller used in the IoT SN may exhibit some restrictions that inhibit optimal low energy operations, as discussed in other sections.
Within this context, the power consumption of the individual modules is analyzed as follows: The power consumption of Raspberry is associated with the specific versions used. Models B/B+ have been employed in the present configuration due to their reasonable power consumption (with respect to other versions) while in the same time they provide the additional Universal Serial Bus (USB) host ports required to communicate with the Arduino and test various USB Wi-Fi modules. The PureLink/High Definition Multimedia Interface (PL/HDMI) interfaces are able to be switched off to save approximately 20 mA since it is not used at all in the present application.
The Wi-Fi module (RN-171 model) exhibits a sleep mode with power consumption of only 4 μA. This module enters into sleep mode automatically. One counter sets the sleep mode time interval set, while another wakes the device after another time interval. The maximum time delay for the Wi-Fi to enter/recover from sleep mode is estimated to be several hundred hours. The device can enter the sleep state either being in UDP or TCP modes. The receive (RX) and transmit (TX) paths of the Wi-Fi module consume 35 mA and 185–210 mA, respectively, for transmission power ranging from 12–18 dBm. The vendor of the e-Health platform does not include any reference to the specific power consumption of the kit or the Arduino Bridge; it is merely mentioned that they are supplied with 12 V/2 A. However, power-consumption tests have shown that in fully operating mode the measured current is 1 A. Therefore, if an external 1000 mAh battery is used and the IoT SN is continuously active, it will requires recharging every hour.
A large power amount is also dissipated by the (Arduino, Raspberry PI) boards’ voltage regulators of the e-Health kit. The Raspberry PI regulator is bypassed while the input of the Arduino regulator is set to 6 V, which is marginally the minimum input voltage that can be used. The small variance between the 6 V input and 5 V output of this regulator reduces thermal power losses.
The basic improvement that allows for the exploitation of idle intervals between measurements is to use Arduino to control the processor’s (Raspberry PI) sleep mode since this Raspberry PI processor core is not equipped with sleep mode capability. This is feasible due to the fact that measurements are taken after the elapse of long time intervals. Therefore, the IoT SN could enter the sleep mode switched-off during these idle intervals, and activated during the next measurement timing point. The implementation of such a configuration is presented in Figure 5, where the Arduino board is controlled by Raspberry PI through USB. Arduino controls, in turn, the power supply of the Raspberry PI as well as the (ECG/EMG) sensor software switching through a low power relay configuration. The power control of Raspberry PI is performed by Arduino according to the instructions received by the Raspberry PI through the USB port. According to Figure 5, Arduino is constantly connected to an external battery and a relay that is turned on (which is normally off) is used to power-up Raspberry PI. If Arduino is turned on, its SW sets on the relay to power up Raspberry PI. Additionally, Arduino is able to switch off Raspberry PI for a specified time period. In this case the Raspberry PI program is responsible for informing Arduino to perform the aforementioned action. Arduino’s microcontroller consumes less than 1 mA in normal operating mode and approximately 0.1 μ[email protected] V in power down mode. Two relays are connected to Arduino’s digital pins, which dissipate a current of approximately 50 mA each. Consequently, it is deduced that the total power consumption of Arduino’s board, along with the relays, is approximately 101 mA during normal operating mode. On the other hand, Arduino’s energy consumption is really insignificant while in power-down mode.
Regarding the relay’s power consumption, it should be mentioned that in order to avoid a constant current flow through the relay S1 (see Figure 5) either when it remains open or closed, the S1 was selected as a pulsed on-off type of relay. These relays change state when current flows for a short time interval to a specific direction. Then, when the current flow stops, it remains in this state until there is a current flow of opposite direction in the relay coil. The specific relay used requires a current of 100 mA for about 150 ms to change state. The current in this relay is controlled by four MOSFETs connected as a pair of CMOS inverters. Two digital pins (P1+, P1−) are used from Arduino for the control of this relay. The current drawn from these pins is negligible since the gate leakage of the MOSFETs is in the order of n A.
The e-Health kit has a 3-pin jumper (JEC, JCO, JEM) for connecting to either the ECG or the EMG sensor, since these sensors cannot be both used at the same time. In general, this is not a problem since they are targeted to different types of applications: ECG is a cardiac diagnostic test while EMG is used to control prosthetic limbs. When the common pin JCO of the 3-pin jumper is connected to JEC, the ECG sensor can be used, otherwise the JCO must be connected to JEM for enabling the use of the EMG sensor. Very low power relays can be used to control the connections of this 3-pin jumper in real time by software. Two digital Arduino pins are used to control these relays (ECGp and EMGp). The power consumed can be further reduced if optocouplers are used instead of magnetic relays or if a circuit like the one used for the control of the relay S1 is adopted.
When Raspberry PI is initially powered, a boot script is executed that starts the software of the health monitoring system. One of the first tasks performed by this software is the downloading of the command file from the file server installed at the gateway. This command file defines the sensor sampling profile. Intermediate sampling intervals can be defined that range between milliseconds and hours, as will be described in the next section. When the sampling interval is in the order of a few seconds, the only way to save power is to deactivate Raspberry PI peripherals that are not used, such as the wireless interface (light sleep). However, if the sampling interval is longer than 30 s, it is worth turning off the Raspberry PI completely (deep sleep) during consecutive samples. This is accomplished by sending an appropriate instruction to Arduino before Raspberry PI shuts down. Arduino waits for a while to let Raspberry PI completely shut down and then safely turns off its power through the relay S1 of Figure 5. Although each one of the Arduino’s digital pins can pull up to 50 mA, the power consumed on these pins is not taken into consideration, since they are connected to MOSFET gates, as already mentioned.
The ATmega1280 microcontroller of Arduino can remain in the supported sleep mode for a maximum of about 9 s, where it consumes approximately 100 μA. Long intervals of deep sleep mode can be supported as multiples of these 9 s intervals using the EEPROM of the ATmega1280 for storing a counter. At power up, this counter is cleared. When Arduino awakens from a 9 s sleep interval, it updates this counter and falls asleep again until the desired overall sleep interval is completed. In this case, the Raspberry PI is turned on again. When Raspberry PI is turned on, the health monitoring firmware recognizes that a deep sleep interval was completed (through the configuration information that was stored before it shuts down). In this way, it can continue sampling as instructed by the Gateway until a new sampling strategy is defined. The configuration information stored in the SD-card of the Raspberry PI and the EEPROM of the Arduino can be exploited to recover from power loss. In real time the Raspberry PI can also send commands to Arduino through USB that select either the ECG or the EMG sensor. Thus, the USB communication protocol between the Raspberry PI and the Arduino supports three commands: (a) the Sleep command where the Raspberry PI gets in sleep mode (b) the ECG select command and (c) the EMG select command. The Arduino replies with an appropriate acknowledgement.
Figure 6 shows the power consumption in various real time operating modes. It has been assumed that the total power consumption of the Arduino Bridge, the Raspberry PI, and the e-Health module is 700 mA after bypassing the voltage regulators. The PL/HDMI interface is switched off. The average power consumption of the Wi-Fi module is assumed to be 200 mA and is not included in the 700 mA consumption mentioned above. The Wi-Fi module is turned off during short idle periods (light sleep) but its “on” operation could be additionally limited to short time intervals, taking into account the time-schedule where data is sent to and received from the GW. Arduino’s microcontroller draws approximately 1 mA in normal mode and less than 1 μA in sleep mode. When Arduino awakens to perform updates to the EEPROM sleep counter, 1 mA is consumed by the microcontroller, and this operation can be completed in less than 10 ms (required for one read and one write to the EEPROM). The relay S1 of Figure 5 draws 100 mA for 150 ms when Raspberry PI is turned on or off. Consumption of the relays controlling the ECG/EGM sensors will not be taken into consideration since most of the time they will be in their default state: Normally Open (NO) or Normally Close (NC) state where no current is drawn. Even in the rare case where the non-default sensor (ECG or EMG) will be selected, the power consumption of the relays is less than 50 mA or completely negligible if a connection like that of the relay S1 is used.
At this point we would like to note that, as it is easily implied, our sensor node from time to time will have to be connected to an AC power adapter for recharging purposes. For this reason, all necessary safety measures have been taken to avoid possible accidents (of the monitored persons), such as the employment of suitable safety relays, special fusions, etc.
2.5. Case Study
An extended schedule of medical tests is examined to demonstrate the capabilities of the proposed IoT SN. The energy consumption improvement is compared to the energy that the system would dissipate if the presented power enhancement techniques had not been employed. The power savings always depend on the specific medical scenario that is examined. This is the best comparison we can provide since it is not easy to compare the power of the developed system with others that operate under similar conditions. The framework where this medical scenario can take place is described in Figure 1. Specifically, each one of the IoT SNs are placed next to the medical beds in the medical care premises (e.g., rehabilitation center, hospital), the patient wears the sensors that are attached to the IoT SN while physicians can either locally or remotely access the data provided by the sensors (either through the local Gateway or via cloud). The actions that take place at each step are compatible with the communication protocol described in Figure 4 and are described extensively in this section. The estimation of the reduced power consumption by employing the defined sleep modes is also given. Within this context, an indicative medical scenario to be demonstrated is the following: Initially, the person position is tested four times every minute to verify that the proper position has been taken for the following tests: an ECG test is executed by reading the ECG sensor for 2 min and 100 ms intervals (no averaging filtering was used), then a 10 min break gives the person or the nurse the opportunity to disconnect the ECG probes. After that, the airflow and the galvanic skin conductance sensors are sampled for 2 min (with filtered averaging samples k = 5 and 20 ms sampling interval). Samples of the airflow and the galvanic sensors should have 200 ms and 500 ms time distance, respectively.
The following actions have to take place in order to implement this medical scenario: A command file with a sleep instruction is sent to the sFTP server working directory from the last measurement while Raspberry PI (if not completely turned off) awakens, retrieves this file, and is switched to the sleeping mode again until a different than sleep command appears in this file. The patient is instructed by the tablet to wear the patient position sensor and the ECG electrodes.
The patient wears the body position sensor and the ECG electrodes, turns on IoT SN, and informs the gateway through the tablet or smart phone for his availability to start the test. The gateway changes the command file defining Q = 1000, I = 0, NPP = 60, NBT = 240. When this file is downloaded from the GW, the patient position sensor starts to be measured immediately by the Sensor Controller software every minute for NBT × Q = 240 × 1000 ms = 240000 ms = 4 min until a dummy read is performed to the temperature sensor. Then, the measured data concerning the patient position are uploaded and the next command file is downloaded from the FTP server.
In the previous 4 min interval, a new command file is prepared at the GW for the 2 min ECG test: Q = 100, I = 6000, NEC = 1, NBT = 1200. If this is not changed within the initial 4 min interval, the body position of the patient will be monitored for 4 more minutes before the ECG test starts. After the ECG’s test completion, a dummy read is performed of the body temperature sensor, and the ECG data is sent to the GW. However, the new command file is going to be read after 10 min, as defined by the last I and Q parameters. During this 10 min sleep interval, the patient is instructed by the tablet to remove the ECG electrodes and wear the airflow and galvanic skin conductance sensors.
In the next command file issued by the gateway within the 10 min sleep interval, the following parameters are defined: Q = 100, I = 6000, NAF = 1, NGA = 2, NBT = 480. It is noticed that the sampling intervals and the dummy read have been adapted appropriately, taking into consideration that 100 ms are required for the averaging of the sensor values. More specifically, the airflow sensor is sampled in every iteration but requires an extra 100 ms for performing averaging so as to estimate a single measurement. Taking into consideration that Q is equal to 100 ms, the airflow sensor generates one sample every 200 ms. Similarly, the GSR is sampled every two iterations, i.e., every 400 ms, but a delay of 100 ms is also inserted to take into account the time needed for its own averaging. This delay makes the sampling intervals of the airflow sensor irregular, in the sense that this sensor will be sampled, e.g., at 100 ms, 300 ms, 600 ms, 800 ms, etc. Regular sampling time intervals can be achieved if both sensors are sampled concurrently at the same rate, although some galvanic sensor values will be redundant in this case. The dummy read is carried out after 480 iterations. If r iterations are required for an interval of 2 min, then
The first term in (13) takes into account the 100 ms delay of the iteration and the 100 ms delay of the airflow averaging while the second term is the delay of 100 ms for the galvanic sensor’s averaging. Although these estimations may seem complicated, most cases do not need such precision for when to stop the sampling. The irregular sampling intervals could also be corrected at a higher level, e.g., through interpolation. The last I parameter defined (6000) calls for a 10 min sleep after the completion of the two sensors sampling. In this interval, the IoT SN can be turned off by the user if instructed to do so by the tablet. Otherwise, command files with sleep commands should be used to keep the IoT SN in low power operation.
In Figure 7, the various sampling and sleep intervals are shown as defined in the case study described earlier. Taking into consideration the power consumption during the normal sampling operation, i.e., the light, deep sleep, and shutdown modes, draft estimation can be performed on the energy consumed during this scenario. Specifically, in the first four minutes when the patient position sensor is sampled 4 times and each time the system goes to 1 min deep sleep mode, we can assume that for 4 × 30 s the power consumed is 1 A (shutdown mode). The power consumed during deep sleep mode is negligible and won’t be considered. The system also enters deep sleep mode after the 2 min interval where ECG is sampled, and after the 2 min interval where the breathing airflow and the galvanic skin conductance sensors are sampled. Thus, the corresponding 1 A power consumption has to also be taken into consideration for an additional 2 × 30 s.
During the 2 min of ECG sampling, the power can be assumed as equal to 700 mA, which is raised to 900 mA only when the communication with the gateway takes place (the Wi-Fi module can be turned on only during the data/command exchange). Regarding power estimation, we will assume that the Wi-Fi is active for an average duration of 10 s and that the overall Sensor Controller consumes 900 mA during this interval.
Similarly, in the two minute interval used for the airflow and the galvanic skin conductance sensors’ sampling, the power consumption can be assumed to be 700 mA since the averaging does not affect the consumption if the Wi-Fi is inactive (light sleep mode). Then, it is raised to 900 mA for about 10 s when the communication with the Gateway takes place for uploading the sensor data. Consequently, the overall power consumption is:
P1 = 4 × 30 × 1000 + 120 × 700 + 10 × 900 + 30 × 1000 + 120 × 700 + 10 × 900 + 30 × 1000 = 120,000 + 84,000 + 9000 + 30,000 + 84,000 + 9000 + 30,000 = 282,000 mA∙s = 78.3 mAh
If a full power operation of 900 mA had been used during the 18 min interval of the medical scenario described above, the consumed power would have been P2 = 972000 mA∙s = 270 mAh. Thus, an overall saving of 70% is achieved. If the afore-described scenario had to be performed every day, then even if the Sensor Controller was turned off before and after the tests, a 1000 mAh battery would require recharging in less than 4 days while the proposed scheme can extend the recharging interval to more than 12 days. Of course, power saving depends on the specific medical scenario as already mentioned. The energy consumption can vary considerably among various medical test-cases and sampling profiles, but the previously mentioned test scenario could be considered as indicative of the power savings that could be achieved when the proposed techniques are applied.
3. Results
This section presents the experimental results regarding the various sensors of the proposed low-cost IoT SN, as well as their comparison, where possible, with expensive certified sensors. The tested sensors mainly include the Galvanic Skin Response Sensor (GSR), the Body Temperature Sensor-(BT), the Airflow Sensor (AF), the Patient Position Sensor (PP), and the sensor for Electromyogram (EMG).
It should be mentioned that the e-Health kit of Libelium which has been used as the basis for the development of the IoT SN presented here, also supports the digital sensors for Blood Pressure (BP) and glucose measurement. However, they could not be used because these sensors, together with the Wi-Fi communication board, are required to be connected to the same physical resource: the serial port. Given that the communication of the IoT SN with the gateway is performed via Wi-Fi, it is obvious that these sensors could not be included in this evaluation procedure
Moreover, the digital pulsioximeter (SPO2) sensor is autonomous with its own display. The IoT SN is simply used to transfer the measured results from the particular sensor to the gateway without any change in accuracy of the measured values, and so it had no meaning to test it further. Regarding the remaining sensors that were tested, we attempted to provide an objective evaluation concerning their measurements. The results of some of them could be easily checked and evaluated, such as the Patient Position Sensor one. However, this is not always possible. For example, the airflow and the EMG sensors cannot be evaluated by comparing absolute values. It is sufficient though, to check whether these sensors can follow the breathing or muscle contraction patterns. Therefore, in this case, it is not required to compare their output with the output of similar commercial devices. However, such a comparison is performed whenever possible, like in the case of the temperature sensor, which was evaluated against a commercial medically certified one. Regarding the GSR sensor, an attempt was made to match the peaks of its output with another medically certified commercial one by Shimmer [19]. In the following, the evaluation-testing results of the various sensors are given, along with a number of conclusions that were derived from this procedure. It has to be stressed that the presented sensor curves are representative of numerous identical experiments carried out with similar results. This holds for all the different types of experiments described.
In Figure 8, the temperature sensor values are evaluated against the reference ones as provided by a certified thermometer and the values that are produced after the application of the filtering algorithms described in Section 2.2. The Moving Average Window is applied for k = 5 samples that are initially averaged, and two of these samples are excluded (the ones with the highest deviation from the initial average). The PCA algorithm was applied using m = 3 columns of the n = 10 of the U matrix (compression 30%). The Kalman filter is applied following the exact algorithm described in Section 2.2. The same filtering algorithms and configurations have also been used for the GSR sensor in Figure 9. The Mean Square Error (MSE), the Normalized MSE (NMSE) and the Signal to Noise Ratio (SNR) parameters were mainly used for comparison. The aforementioned parameters are defined for a reference signal vref of N samples and a real signal v according to Equations (14) and (15).
Table 1 depicts the MSE, NMSE, and SNR parameters for the signals illustrated in Figure 8 and Figure 9. Even though the skin resistance (Rs) and skin conductance (1/Rs) are used rather than the skin conductance voltage (Vs), these values are simply estimated taking into account the skin conductance voltage according to the formula Rs = 50 kΩ/V−0.5 V, as in our case.
It is deduced from Figure 8 and Figure 9 and Table 1 that the usage of the Moving Window Average filtering algorithm on the original (sensor) values has improved them significantly when compared to the reference measurements. Regarding application of the PCA algorithm, in most cases reduces the error and compresses the signal. Moreover, if a higher compression rate had been selected (with a lower m value) an even lower error would have been achieved in the particular examples where the smoothing is preferable than the preservation of the original signal details. At this point we would like to mention that, to our knowledge, this is one of the few works where PCA is used mainly for noise reduction of biometric signals. Undoubtedly, there exists a plethora of works in the literature where PCA techniques are applied to various biometric sensors (ECG, EEG, EMG etc.), like in [37,38], but their exclusive target in most of these cases was to achieve compression and classification. In the last few years the efficiency of PCA in noise reduction was acknowledged and it has been proposed to be used in applications like noise reduction for Doppler radars [39] and in SNR improvement for Inchoate Faulty Signals [40].
The application of the Kalman filter was not successful since a higher error appears. This error could have been reduced by tuning appropriately the parameters P0 and Rn defined in Section 2.2. However, a different tuning would have been required for different sensors. In Figure 10, a pair of GSR sensors was connected to different users responding to the same stimuli. As shown from this figure, the resistance pattern was quite similar in the two plots in terms of local peaks (minima and maxima), taking into consideration that the User 1 responds about 1 s earlier to the same stimuli than User 2. The dashed lines in Figure 10 show the peak correspondence between User 1 and User 2. However, the absolute resistance values corresponding to the two users and their amplitude are significantly different.
Figure 11, shows the resistance variation of a Libelium e-Health GSR sensor and a Shimmer one, attached to the same user that is subject to a Stroop test. The difference in the absolute values of the two plots should not be taken into consideration. The important issue noticed here is that the patterns are similar and most of their peaks match as shown by the dashed lines. This is an indication that the GSR sensor of the developed e-health system operates reliably.
In Figure 12, the airflow sensor of the developed system is tested with a pattern of two deep breaths followed by two moderate ones. The sensor was used without applying filtering (Section 2.2) and as a result of this, additional peaks appear. In Figure 13 and Figure 14, the breathing pattern used is alternately a deep and a moderate breath. A slightly different type of averaging is used in these figures. Filter type 1 depicted on Figure 13 extracts the average by employing three successive samples. Filter type 2 shown in Figure 14 follows the averaging method described in Section 2.2 with 5 initial samples, and rejecting 2 extremes for estimating the final average. As it is derived by these figures, both averaging schemes represent clearly the breathing pattern used. The rippling at the end of the curves is due to the fact that the sensor is removed at that time instant from the user.
The EMG sensor’s results are shown in Figure 15 and Figure 16. In Figure 15 a relatively small sampling period of 200 ms was used with no filtering. A moderate muscle contraction is followed by a strong and then a small one. Although an intense rippling appears, the muscle contraction pattern is recognizable. The same muscle contraction pattern is used in Figure 16 with a longer sampling interval of 1 s that allows the various filtering types to be applied. The reduced rippling allows the three muscle states to be recognized more clearly when averaging is used and especially when Filter type 2, of Section 2.2, is applied.
4. Discussion
Based on the aforementioned measurement results of the low-cost sensor controller platform, the following lessons were learned and conclusions drawn:
- The sensors that can operate reliably are those that do not require a high sampling rate i.e., the temperature sensor, the airflow sensor, the patient positioning sensor, and the Electromyogram one. Simple filtering techniques can be applied with success, such as simple averages of the measured values (Filter type 1) or averages derived after discarding excessive values (Filter type 2).
- The Galvanic Skin Response Sensor, when compared with the corresponding medically certified sensor (from Shimmer), does not exhibit the same voltage levels, something which was at a certain degree expected. Nevertheless, the important issue is that the local peaks of their waveforms (which carry the essential measurements information) coincide at a percentage of 85%.
- The application of the averaging methods along with PCA and Kalman filter to a temperature and a GSR sensor showed that the error can be improved up to 6 times.
- The use of the PCA filtering algorithm can improve the error and compress the sensor data
- The breathing airflow sensor seems to closely track the patient’s breathing represented by the shape and width of peaks in the graph formed by the measured results.
- The patient position sensor is absolutely reliable, detecting with 100% success the actual (patient) position (no specific testing diagrams were included for this sensor due to their trivial nature)
- The Electromyography diagram produced by the corresponding sensor represents the intensity of muscle contractions in a fairly clear way. It is more preferable to focus on the differences of the successive measurement values instead of the absolute ones in this graph.
Furthermore, in order to avoid confusion, it is useful to apply filtering methods with a relatively slow sampling rate so as not to result in rapid fluctuations that are not related with muscle contractions. Future work includes the deployment of multiple IoT SNs and incorporation of the MQTT mechanism between Gateway and those Nodes. An IoT platform with database could be also used within the Gateway to perform further analysis of the received sensor values and handle all critical alerts on premises.
5. Conclusions
A low-cost and low power IoT Sensor Node with advanced measurement precision for e-health application that enables continuous patient monitoring has been presented. The sensor node is based on the e-health kit from Libelium-Cooking Hacks, which can perform various medical checks ranging from temperature and glucose level measurement to ECG tests. We have enhanced the key characteristics of the operations of the Raspberry PI single-board computer (model B/B+), which constitutes the basis for the aforementioned e-health kit, by improving the accuracy, through the incorporation of filtering algorithms to sensors’ values within the implemented Sensor Controller. A flexible communication mechanism, which enables the definition of any type of sampling of sensors at the desired frequency, is also employed for successful data transmission and Sensor Node control. Furthermore, a power consumption minimization scheme has been developed by imposing suitable sleep intervals to the IoT Sensor Node (corresponding to the associated idle intervals between sensors’ successive measurements) and periodically deactivating specific functions of the node (thus, expanding its battery life-time and autonomy from hours to days). A representative medical test-case was demonstrated and explored, elucidating the efficiency of the presented key features of the e-health IoT Sensor Node. These features, in combination with the successful testing/evaluation of most of its sensor functions, paves the way for further evolvement of the developed system to a low-cost e-health monitoring platform with capabilities comparable to high cost commercial counterparts. In this regard, future improvements encompass the utilization of the MQTT protocol that employs shorter TCP header and thus in turn will lead to even more lower power consumption and communication overhead for the IoT Sensor Node.
Author Contributions
Conceptualization, N.P., F.G. and M.B.; methodology, N.P., M.B. and F.G.; Software, N.P.; validation, N.P., M.B. and F.G.; project administration, M.B., writing—original draft preparation, N.P.; writing—review and editing, N.P., F.G. and M.B.; investigation, N.P., F.G. and M.B.; resources, F.G.
Funding
This research was partially funded by ELTAB project, grant number 46543.
Conflicts of Interest
The authors declare no conflict of interest.
References
- Sadri, F. Ambient Intelligence: A Survey. ACM Comp. Surv. 2011, 43, 1–66. [Google Scholar] [CrossRef]
- Dishongh, T.J.; McGrath, M.; Kuris, B. Wireless Sensor Networks for Healthcare Applications, 1st ed.; Artech House Publishing: Norwood, MA, USA, 2009; ISBN 1596933054. [Google Scholar]
- Zhang, Y.; Sun, L.; Song, H.; Cao, H. Ubiquitous WSN for Healthcare: Recent Advances and Future Prospects. IEEE Internet Things J. 2014, 1, 311–318. [Google Scholar] [CrossRef]
- Dang, W.; Manjakkal, L.; Navaraj, W.T.; Lorenzelli, L.; Vinciguerra, V.; Dahiya, R. Stretchable wireless system for Softwareeat pH monitoring. Elsevier BV Biosens. Bioelectron. 2018, 107, 192–202. [Google Scholar] [CrossRef] [PubMed]
- Islam, S.M.R.; Kwak, D.; Kabir, M.H.; Hossain, M.; Kwak, K. The Internet of Things for Health Care: A Comprehensive Survey. IEEE Access 2015, 3, 678–708. [Google Scholar] [CrossRef]
- Gay, V.; Leijdekkers, P. Health Monitoring System Using Smart Phones and Wearable Sensors. Int. J. ARM 2007, 8, 29–35. [Google Scholar]
- Blood Pressure Monitors and Telemedicine Products. Available online: http://www.andmedical.com.au/ (accessed on 22 December 2018).
- AliveCor KardiaMobile ECG for Phone and Android, Alive Technologies. Available online: https://www.alivetec.com/pages/alivecor-heart-monitor (accessed on 20 December 2018).
- Chan, V.; Ray, P.; Parameswaran, N. Mobile e-Health monitoring: An agent-based approach. IET Commun. Telemed. E-Health Commun. Syst. 2008, 2, 223–230. [Google Scholar] [CrossRef]
- Mukherjee, S.; Dolui, K.; Datta, S.K. Patient Health Management System using e-Health Monitoring Architecture. In Proceedings of the 4th IEEE International Advance Computing Conference (IACC’14), New Delhi, India, 21–22 February 2014; IEEE Conference Publications: New Delhi, India, 2014; pp. 400–405. [Google Scholar] [CrossRef]
- Patel, S.; Park, H.; Bonato, P.; Chan, L.; Rodgers, M. A review of wearable sensors and systems with application in rehabilitation. J. NeuroEng. Rehabil. 2012, 9. [Google Scholar] [CrossRef] [PubMed]
- Khelil, A.; Shaikh, F.K.; Sheikh, A.A.; Felemban, E.; Bojan, H. DigiAID: A Wearable Health Platform for Automated Self-tagging in Emergency Cases. In Proceedings of the 4th International Conference on Wireless Mobile Communication and Healthcare (Mobihealth), Athens, Greece, 3–5 November 2014; IEEE Conference Publications: Athens, Greece, 2014; pp. 279–282. [Google Scholar] [CrossRef]
- e-Health Sensor Platform V1.0 for Arduino and Raspberry PI from Cooking-Hacks. Available online: https://www.cooking-hacks.com/documentation/tutorials/ehealth-v1-biometric-sensor-platform-arduino-raspberry-pi-medical/ (accessed on 22 December 2018).
- Feng, B.; Liu, B.; Pan, K. Vulture Voyeur a Sensor-Packed Egg Monitors Nests from the Inside. IEEE Spectr. 2016, 53, 17–18. [Google Scholar] [CrossRef]
- Antonopoulos, C.; Panagiotakopoulos, T.; Panagiotou, C.; Touliatos, G.; Koubias, S.; Kameas, A.; Voros, N.S. On Developing a Novel Versatile Framework for Heterogeneous Home Monitoring WSN networks. EAI End Trans. Pervasive Health Technol. 2015, 1. [Google Scholar] [CrossRef] [Green Version]
- Noueihed, J.; Diemer, R.; Chakraborty, S.; Biala, S. Comparing Bluetooth HDP and SPP for Mobile Health Devices. In Proceedings of the International Conference on Body Sensor Networks (BSN), Singapore, 7–9 June 2010; IEEE Conference Publications: Singapore, 2010; pp. 222–227. [Google Scholar] [CrossRef]
- Granados, J.; Rahmani, A.M.; Nikander, P.; Liljeberg, P.; Tenhunen, H. Towards energy-efficient HealthCare: An Internet-of-Things architecture using intelligent gateways. In Proceedings of the International Conference on Wireless Mobile Communication and Healthcare (Mobihealth), Athens, Greece, 3–5 Novmber 2014; IEEE Conference Publications: Athens, Greece, 2014; pp. 279–282. [Google Scholar] [CrossRef]
- MIThril, the Next Generation Research Platform for Context Aware Wearable Computing. Available online: https://www.media.mit.edu/wearables/mithril/ (accessed on 22 December 2018).
- The Shimmer Platform. Available online: http://www.shimmersensing.com/ (accessed on 22 December 2018).
- Samsung Simband. Available online: https://www.simband.io/ (accessed on 22 December 2018).
- Ferreira, F.; Carvalho, V.; Soares, F.; Machado, J.; Pereira, F. Vital Signs Monitoring System Using Radio Frequency Communication: A Medical Care Terminal for Beddridden People Support. Sens. Transducers 2015, 185, 93–99. Available online: http://www.sensorsportal.com/HTML/DIGEST/february_2015/Vol_185/P_2607.pdf (accessed on 22 December 2018).
- Srikanth, C.; Pradeep, D.S.; Charan, S. Smart Embedded Medical Diagnosis using Beaglebone Black and Arduino. Int. J. Eng. Trends Technol. 2014, 8, 43–48. [Google Scholar] [CrossRef]
- Massot, B.; Baltenneck, N.; Gehin, C.; Dittmar, A.; McAdams, E. EmoSense: An Ambulatory Device for the Assessment of ANS Activity Application in the Objective Evaluation of Stress with the Blind. IEEE Sens. J. 2012, 2, 543–551. [Google Scholar] [CrossRef]
- Ibrahim, H.; Ewais, S.; Chatterjee, S. A Novel, Low-Cost NeuroIS Prototype for Supporting Bio Signals Experimentation Based on BITalino. In Information Systems and Neuroscience; Gmunden Retreat on NeuroIS; Lecture Notes on Information Systems and Organization; Davis, F.D., Riedl, R., Brocke, J., Léger, P., Randolph, A., Eds.; Springer: London, UK, 2015; Volume 10, pp. 73–83. [Google Scholar] [CrossRef]
- Da Silva, H.P.; Carreiras, C.; Lourenço, A.; Fred, A.; das Neves, R.C.; Ferreira, R. Off-the-person electrocardiography: Performance assessment and clinical correlation. Health Technol. 2015, 4, 309–318. [Google Scholar] [CrossRef]
- Domingues, A. Smartphone Based Monitoring System for Long-Term Sleep Assessment. In Springer Mobile Health Technologies Methods and Protocols; Rasooly, A., Herold, K.E., Eds.; Methods in Molecular Biology; Springer: London, UK, 2015; Volume 1256, pp. 391–403. [Google Scholar] [CrossRef]
- Verhulst, A.; Yamaguchi, T.; Richard, P. Physiological-based dynamic difficulty adaptation in a theragame for children with cerebral palsy. In Proceedings of the International Conference on Physiological Computing Systems (PhyCS), SCITEPRESS (Science and Technology Publications, Lda.), Angers, France, 11–13 February 2015; pp. 64–171. [Google Scholar] [CrossRef]
- Fernandes, T.J.T.; Chȩć, A.; Olczak, D.; Ferreira, H.A. Physiological computing gaming: Use of electrocardiogram as an input for video gaming. In Proceedings of the International Conference on Physiological Computing Systems (PhyCS), SCITEPRESS (Science and Technology Publications, Lda.), Angers, France, 11–13 February 2015; pp. 157–163. [Google Scholar] [CrossRef]
- Birbas, M.; Petrellis, N.; Gioulekas, F. A Low Cost Sensor Controller for Health Monitoring. J. Phys. Conf. Ser. 2015, 637, 012021. [Google Scholar] [CrossRef] [Green Version]
- Petrellis, N.; Birbas, M.; Gioulekas, F. Precision and Power Issues in a Medical Sensor Controller. In Proceedings of the 19th Panhellenic Conference on Informatics, (PCI’15), Athens, Greece, 1–3 October 2015; ACM Press: Athens, Greece, 2015; pp. 171–176. [Google Scholar] [CrossRef]
- Petrellis, N.; Kosmadakis, I.E.; Vardakas, M.; Gioulekas, F.; Birbas, M.; Lalos, A. Compressing and Filtering Medical Data in a Low Cost Health Monitoring System. In Proceedings of the 21st Pan-Hellenic Conference on Informatics (PCI-2017), Larissa, Greece, 28–30 September 2017; ACM: New York, NY, USA, 2017; pp. 1–5, Article No. 40. [Google Scholar] [CrossRef]
- Petrellis, N.; Birbas, M.; Vardakas, M.; Kosmadakis, I.E. Power saving issues in a low cost eHealth sensor controller. In Proceedings of the International Conference on Modern Circuits and Systems Technologies (MOCAST), Thessaloniki, Greece, 7–9 May 2018; pp. 1–4. [Google Scholar] [CrossRef]
- Kosmadakis, I.E.; Petrellis, N.; Birbas, M.; Vardakas, M. Employing Savitzky-Golay Smoothing in a Low Cost eHealth Platform. In Proceedings of the International Conference on Telecommunications and Signal Processing (TSP), Athens, Greece, 4–6 July 2018; pp. 1–5. [Google Scholar] [CrossRef]
- OASIS. MQTT 3.1.1 Protocol. Available online: http://mqtt.org/ (accessed on 22 December 2018).
- Xu, H.; Caramanis, C.; Sanghavi, S. Robust PCA via outlier pursuit. IEEE Tran. Inf. Theory 2012, 58, 3047–3064. [Google Scholar] [CrossRef]
- Carmi, A.; Gurfil, P.; Kanevsky, D. Methods for Sparse Signal Recovery Using Kalman Filtering With Embedded Pseudo-Measurement Norms and Quasi-Norms. IEEE Trans. Signal Process. 2010, 58, 2405–2409. [Google Scholar] [CrossRef]
- Bosco, G. Principal Component Analysis of Electromyographic Signals: An Overview. Open Rehabil. J. 2010, 3, 127–131. [Google Scholar] [CrossRef]
- Kanaujia, M.; Srivastava, G. ECG Signal Decomposition Using PCA and ICA. In Proceedings of the National Conference on Recent Advances in Electronics & Computer Engineering, Roorkee, India, 13–15 February 2015; pp. 301–305. [Google Scholar] [CrossRef]
- Du, L.; Wang, B.; Wang, P.; Ma, Y.; Liu, H. Noise Reduction Method Based on Principal Component Analysis with Beta Process for Micro-Doppler Radar Signatures. IEEE J. Sel. Top. Appl. Earth Obs. Remote Sens. 2015, 8, 4028–4040. [Google Scholar] [CrossRef]
- Hamadache, M.; Lee, D. Principal Component Analysis Based Signal-to-noise Ratio Improvement for Inchoate Faulty Signals: Application to Ball Bearing Fault Detection. Int. J. Control Autom. Syst. 2017, 15, 506–517. [Google Scholar] [CrossRef]
Figure 1.
Architecture of the IoT e-Health environment. The IoT SN consists of the Body Sensors, the Sensor couplers, the circuitry system for low power control, the SC as SOFTWARE program that operates on the open source HW of Arduino and Raspberry PI and the connectivity infrastructure (Wi-Fi and Ethernet card). The sensor data are collected by an in-premises Gateway, which in turns sends them to the cloud platform based on the MQTT protocol. Each IoT SN is connected to the relevant individual under monitoring. Smartphones or Tablets can be used to monitor the vital signals of the individual either by connecting to the local gateway or to the cloud platform (or HIS).

Figure 2.
Stacking of the IoT SN modules.

Figure 3.
Sensor Controller and Gateway configuration in (a) debug and (b) real time mode.

Figure 4.
Typical communication scheme between the subsystems of the e- health monitoring system.

Figure 5.
Block Diagram of Arduino and external relays for sensor selection and sleep intervals implementation.
Figure 5.
Block Diagram of Arduino and external relays for sensor selection and sleep intervals implementation.

Figure 6.
Power Consumption during normal operation and sleep modes.

Figure 7.
Description of sampling and sleep modes during the case study.

Figure 8.
Temperature measurement with sampling period 1 s.

Figure 9.
Skin Conductance Voltage Measurement with sampling period 500 ms.

Figure 10.
Comparison of two identical Libelium GSR sensors attached to different users that are subject to the same test. The vertical dashed lines denote the corresponding local minima between the two users.
Figure 10.
Comparison of two identical Libelium GSR sensors attached to different users that are subject to the same test. The vertical dashed lines denote the corresponding local minima between the two users.

Figure 11.
Comparison of the Libelium and the Shimmer GSR sensors behavior on the same person. The vertical dashed lines denote the corresponding local minima between the two sensors.
Figure 11.
Comparison of the Libelium and the Shimmer GSR sensors behavior on the same person. The vertical dashed lines denote the corresponding local minima between the two sensors.

Figure 12.
Airflow sensor tested; the user takes two deep breaths followed by two moderate ones. No filtering is used.
Figure 12.
Airflow sensor tested; the user takes two deep breaths followed by two moderate ones. No filtering is used.

Figure 13.
Airflow sensor tested; the user takes alternately a deep and a moderate breath. Filter type 1 was applied.
Figure 13.
Airflow sensor tested; the user takes alternately a deep and a moderate breath. Filter type 1 was applied.

Figure 14.
Airflow sensor tested; the user alternately takes a deep and a moderate breath. Filter type 2 was applied.
Figure 14.
Airflow sensor tested; the user alternately takes a deep and a moderate breath. Filter type 2 was applied.

Figure 15.
EMG measurement: a moderate muscle contraction is followed by a strong and a loose one. 200 ms sampling period is used with no filtering.
Figure 15.
EMG measurement: a moderate muscle contraction is followed by a strong and a loose one. 200 ms sampling period is used with no filtering.

Figure 16.
EMG measurement with the same muscle contraction pattern as in Figure 15. A sampling period of 1 s is used with various filtering options.
Figure 16.
EMG measurement with the same muscle contraction pattern as in Figure 15. A sampling period of 1 s is used with various filtering options.


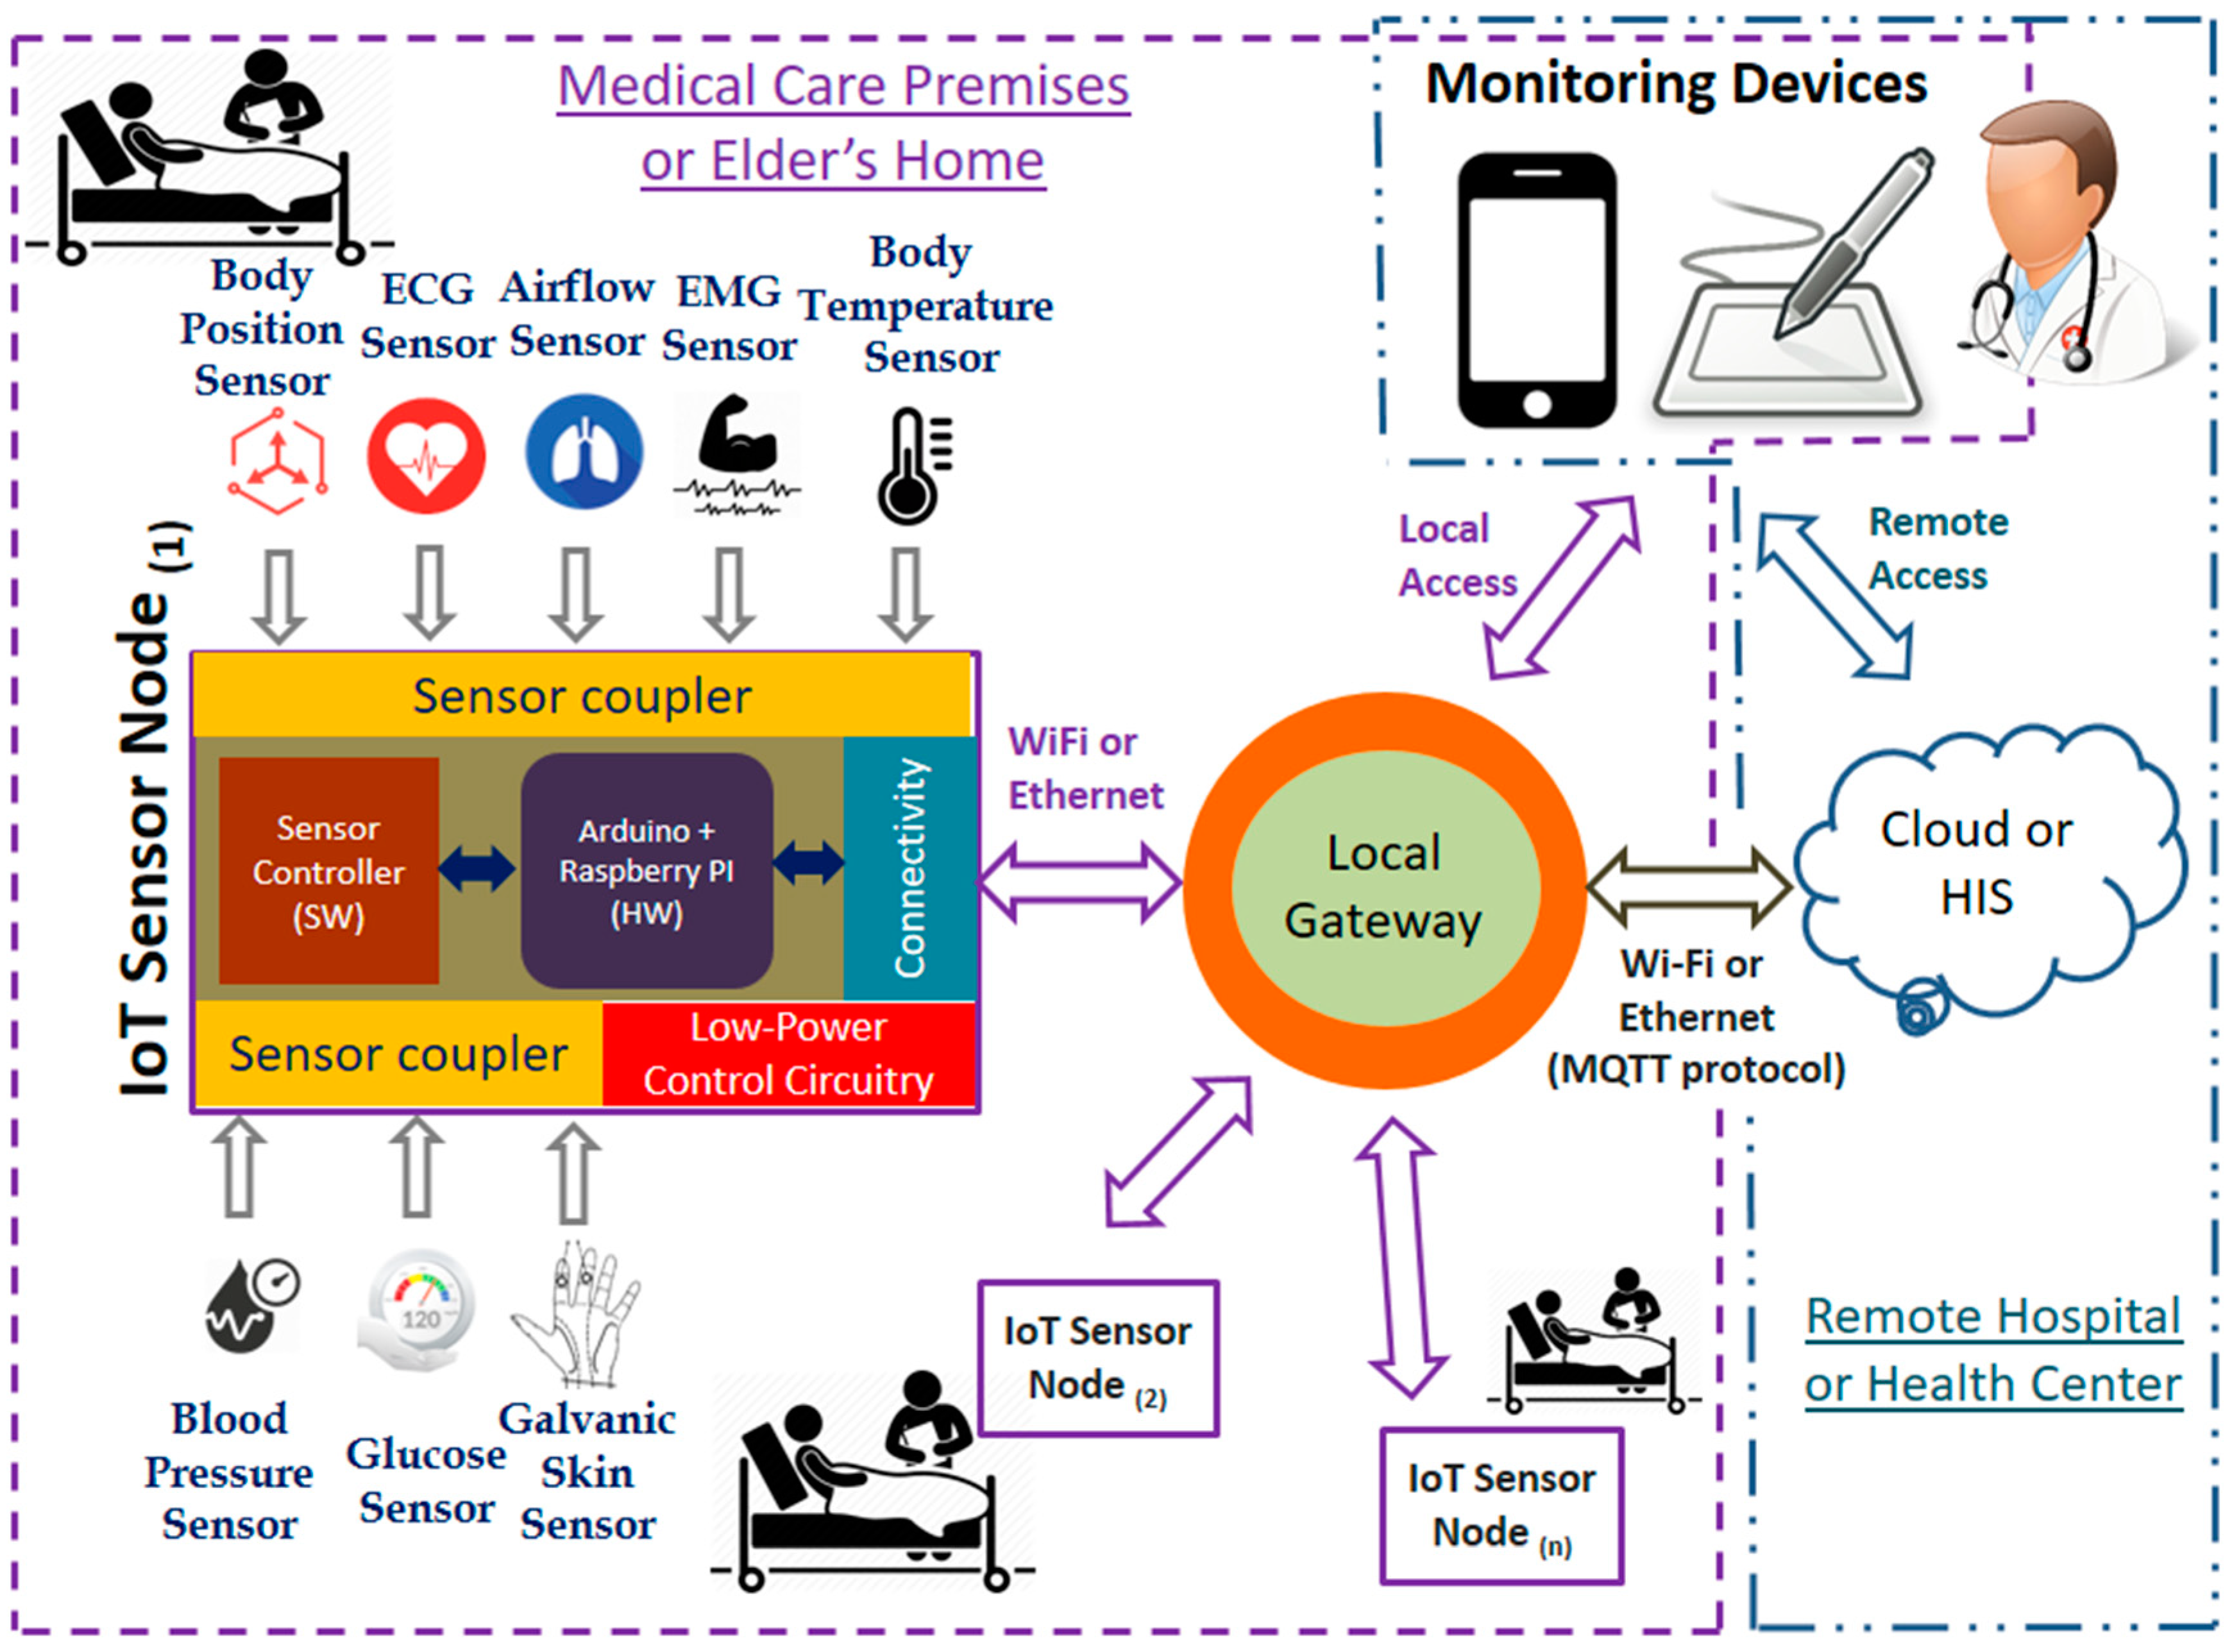
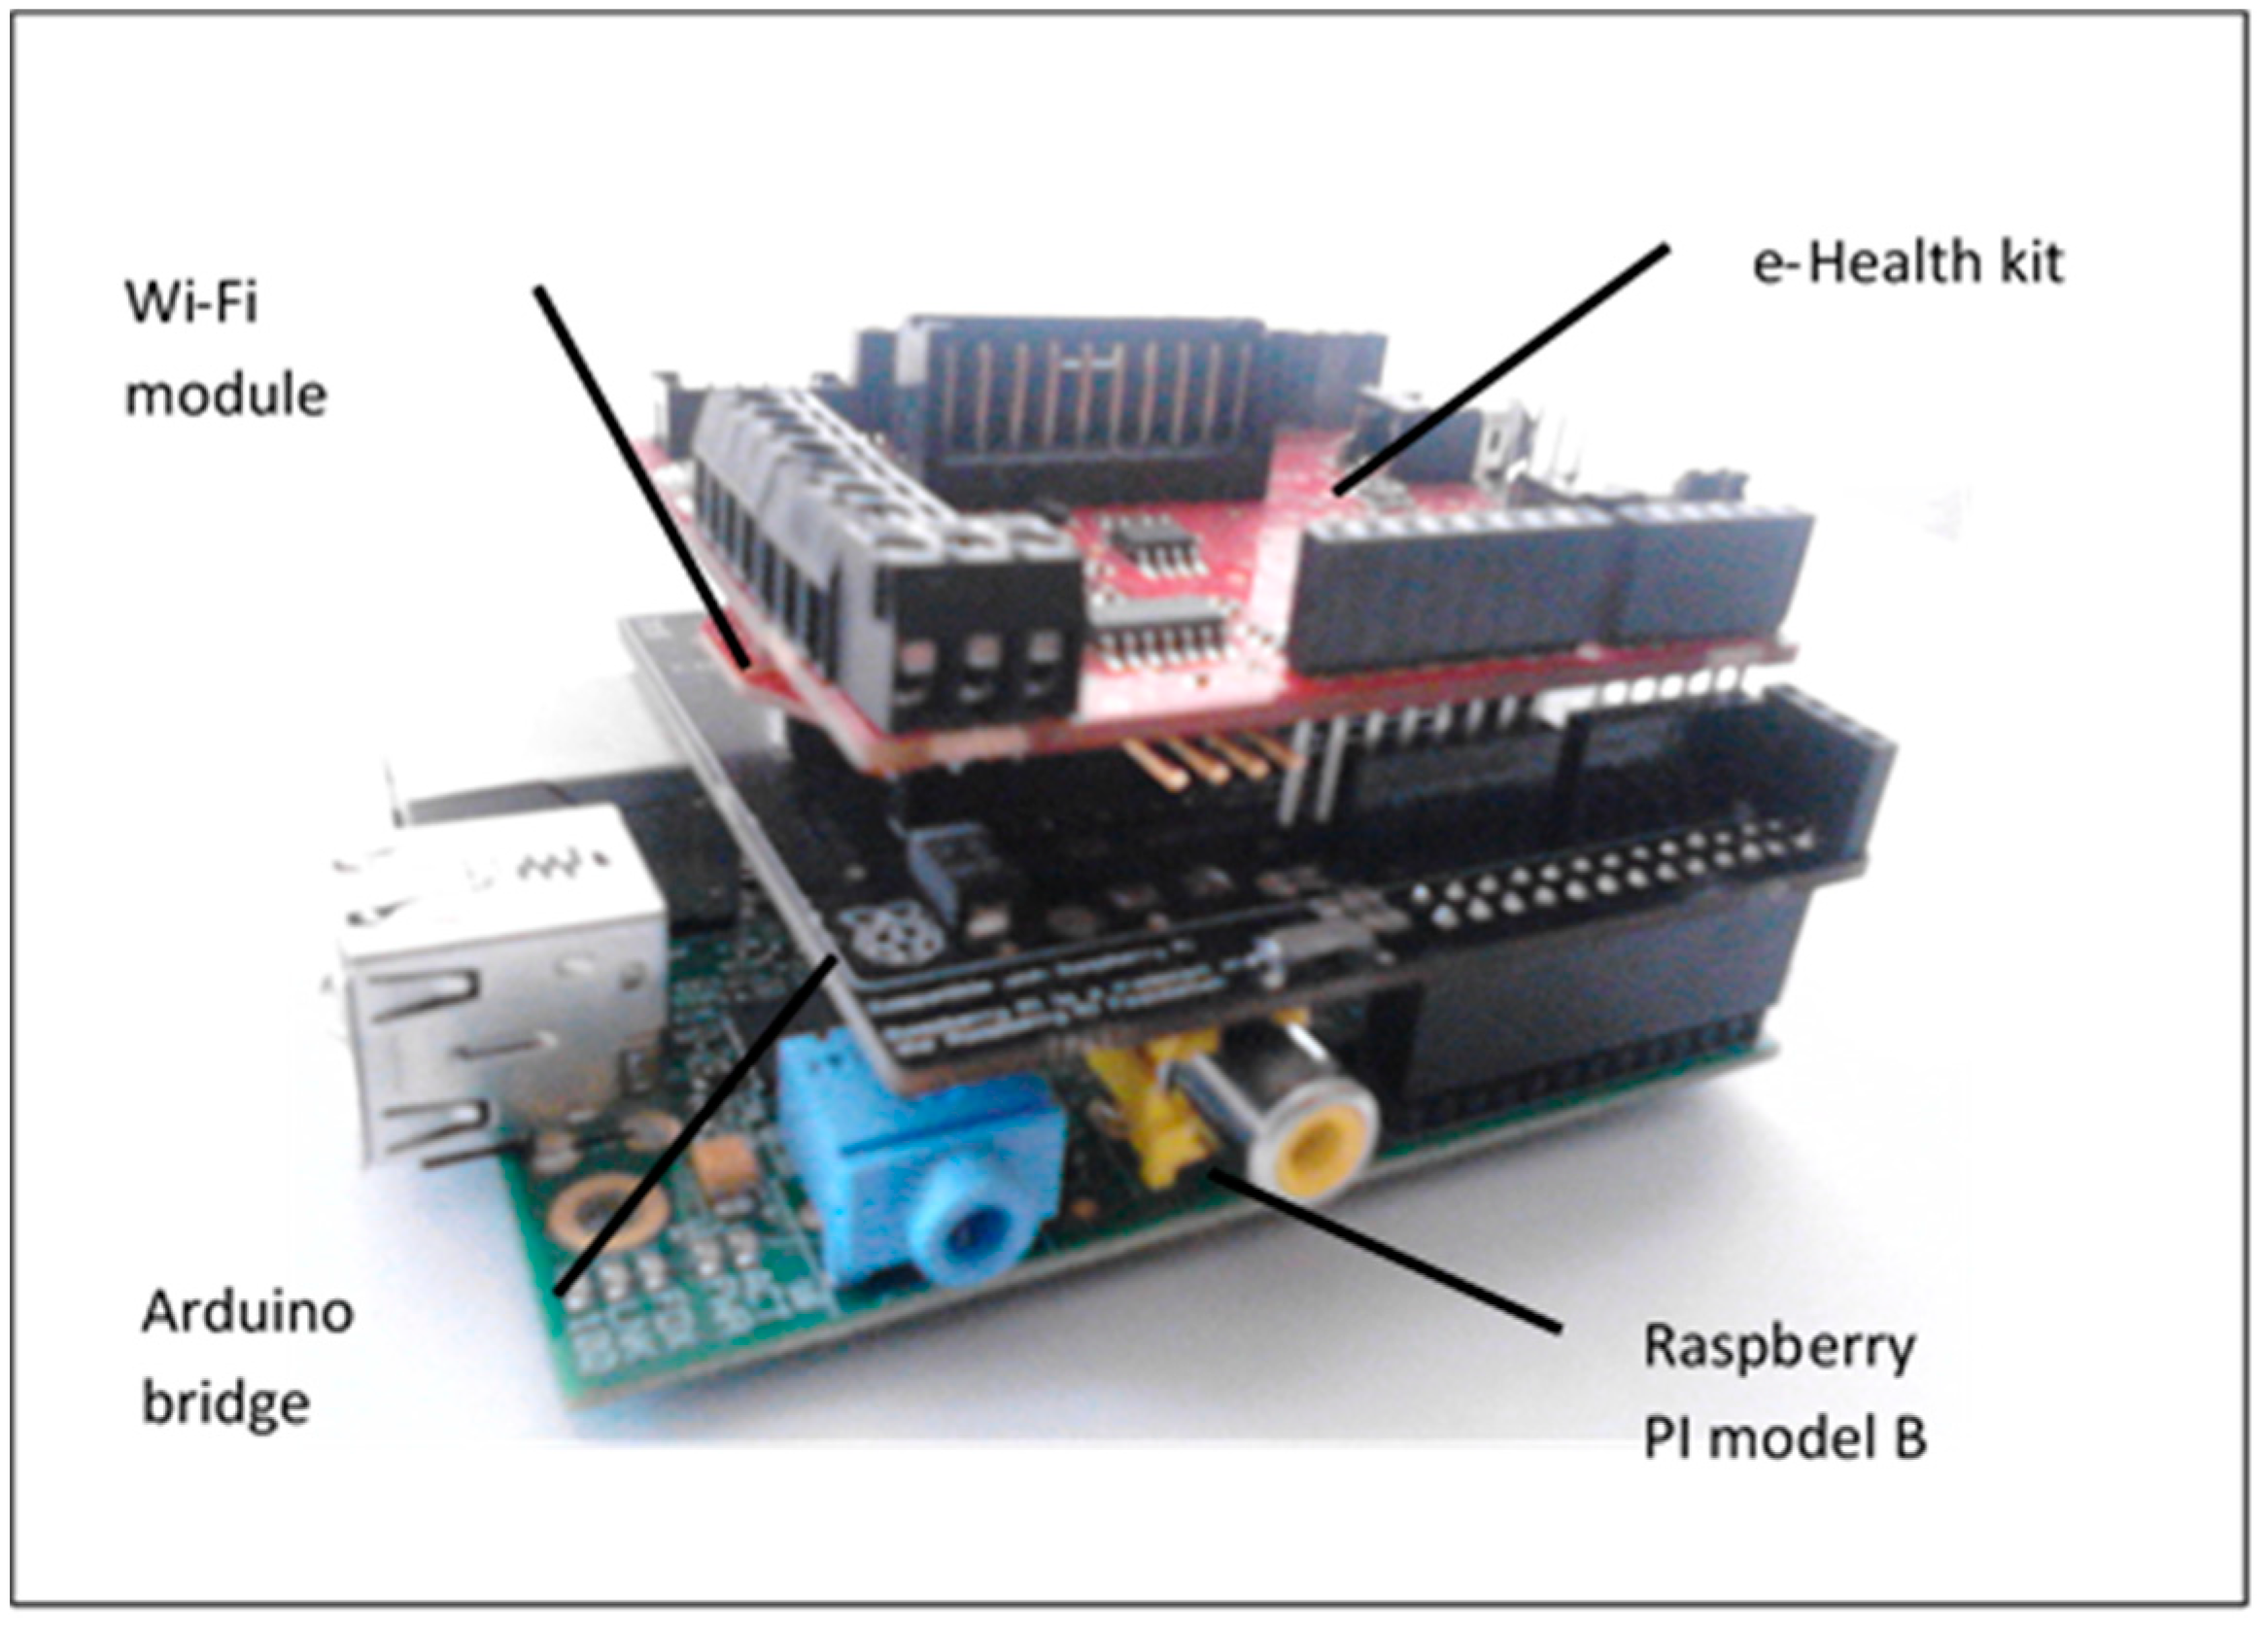
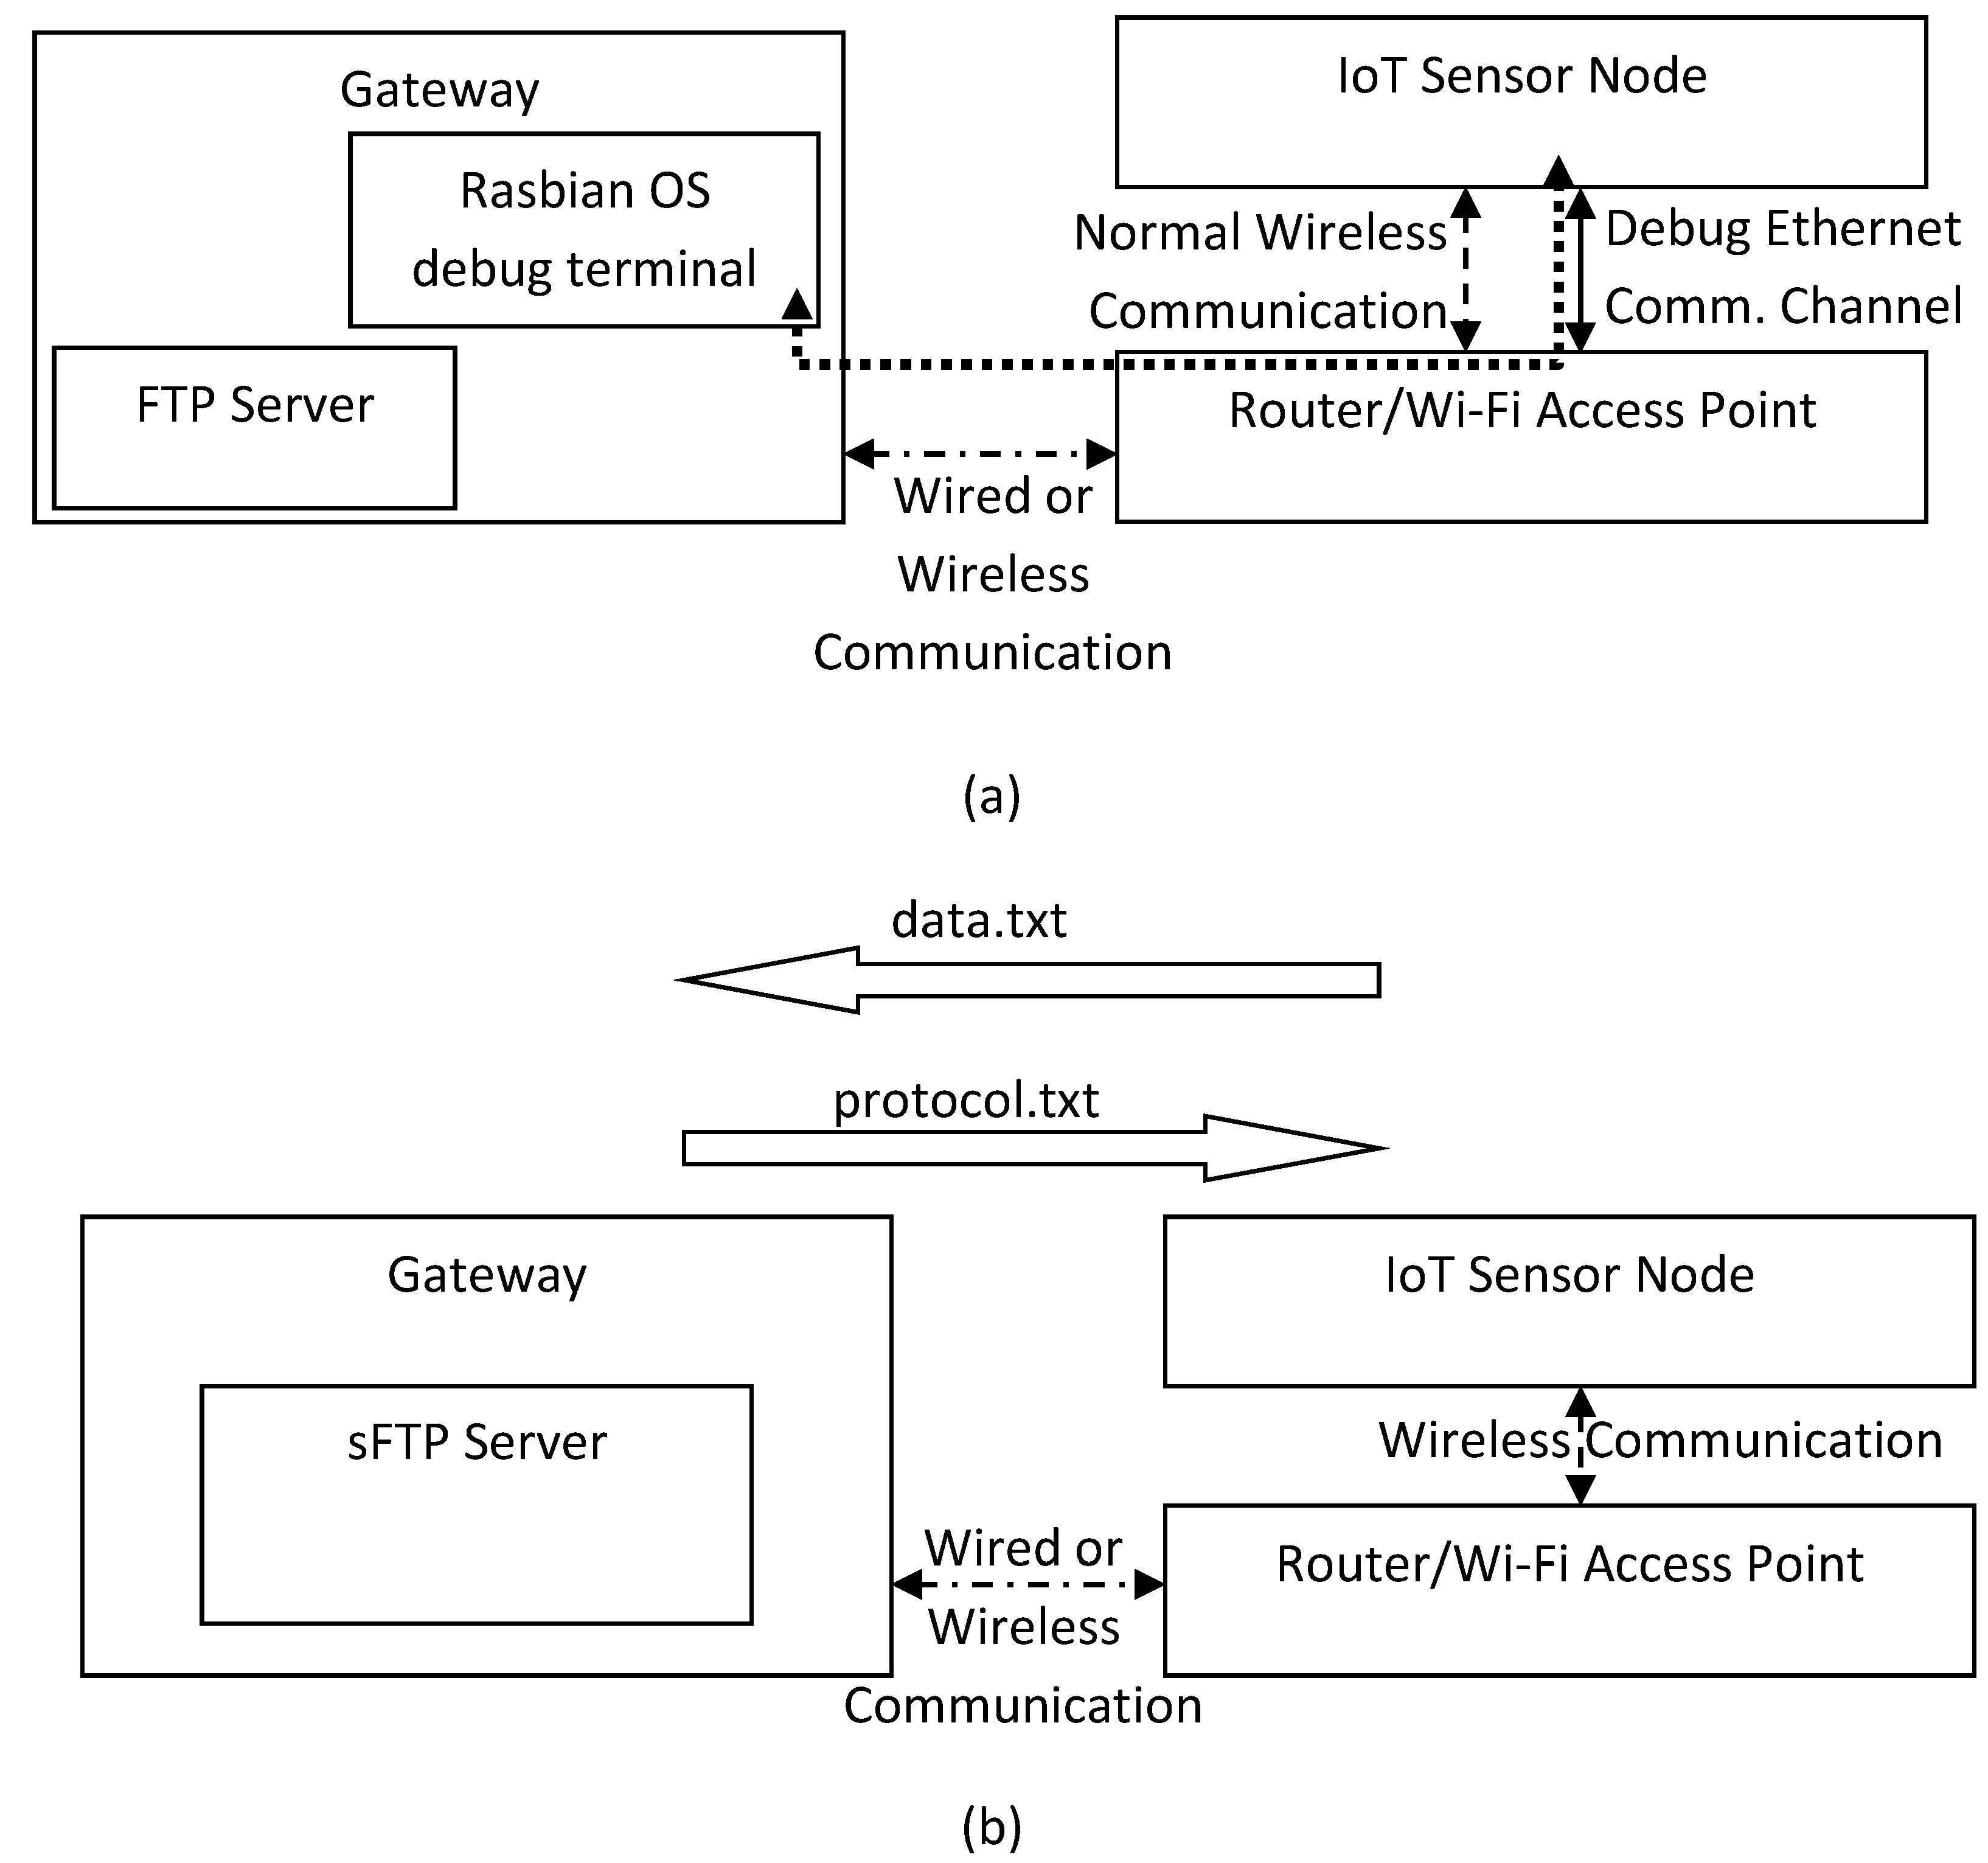
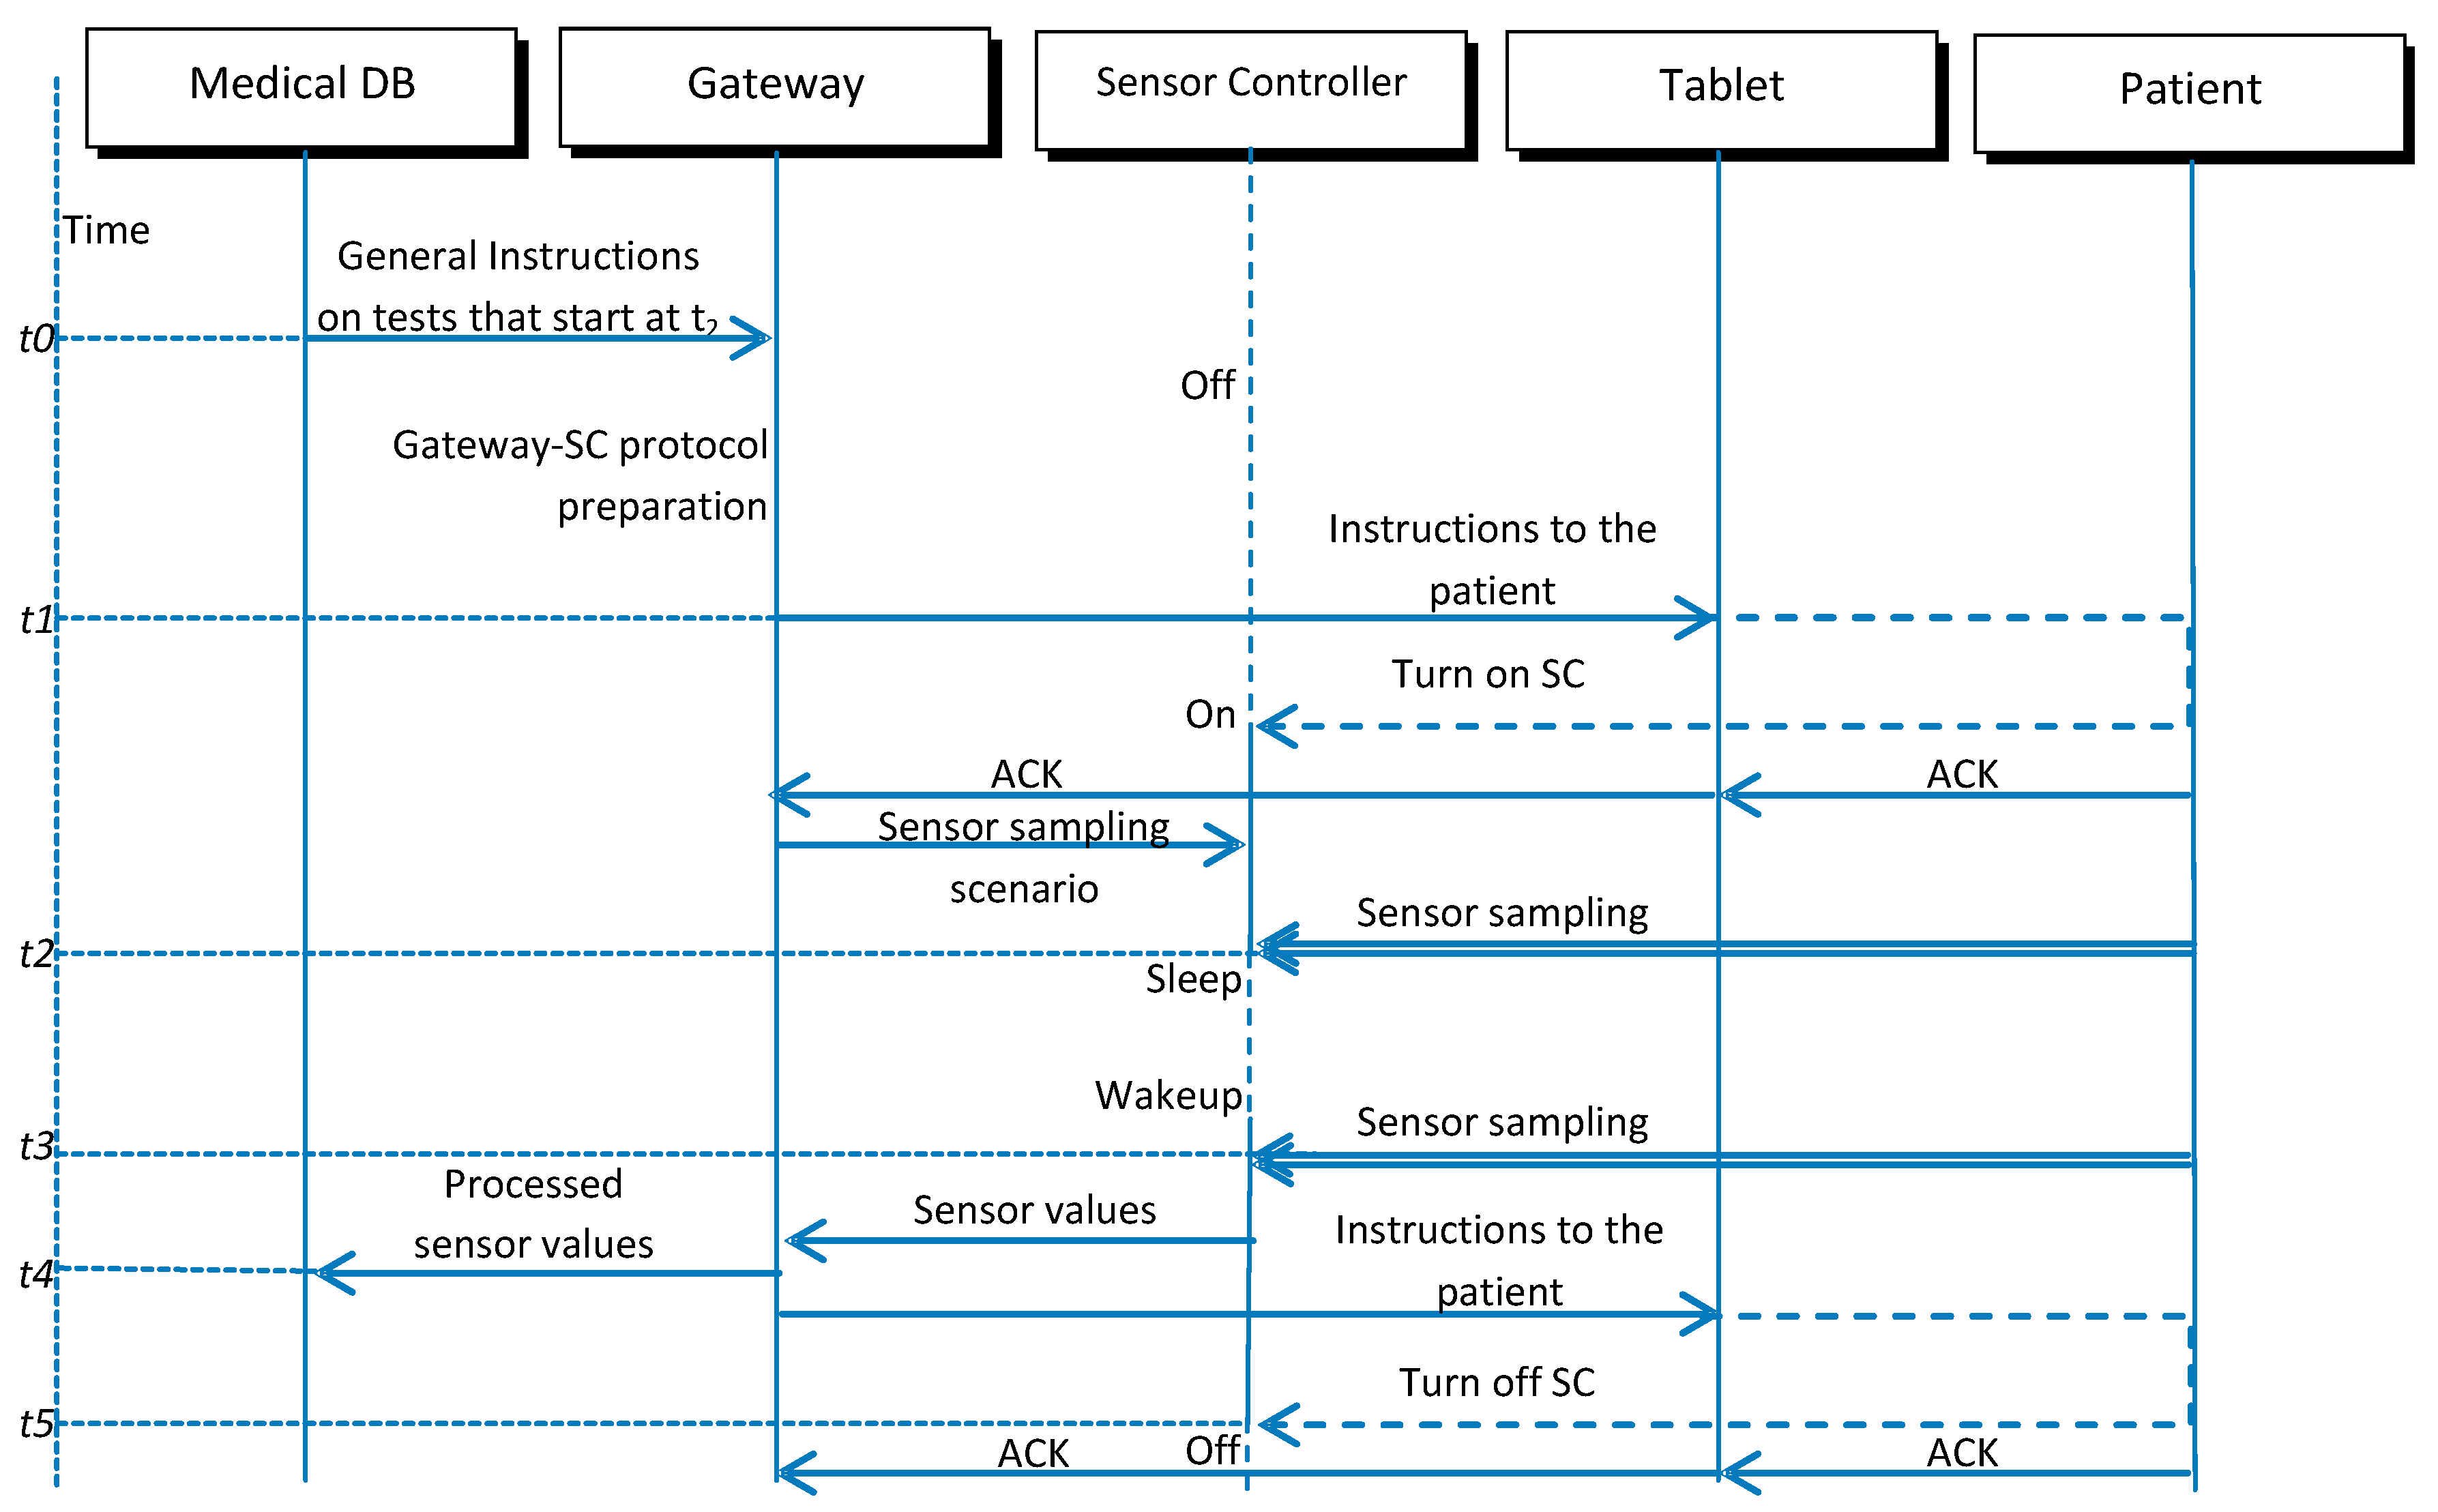
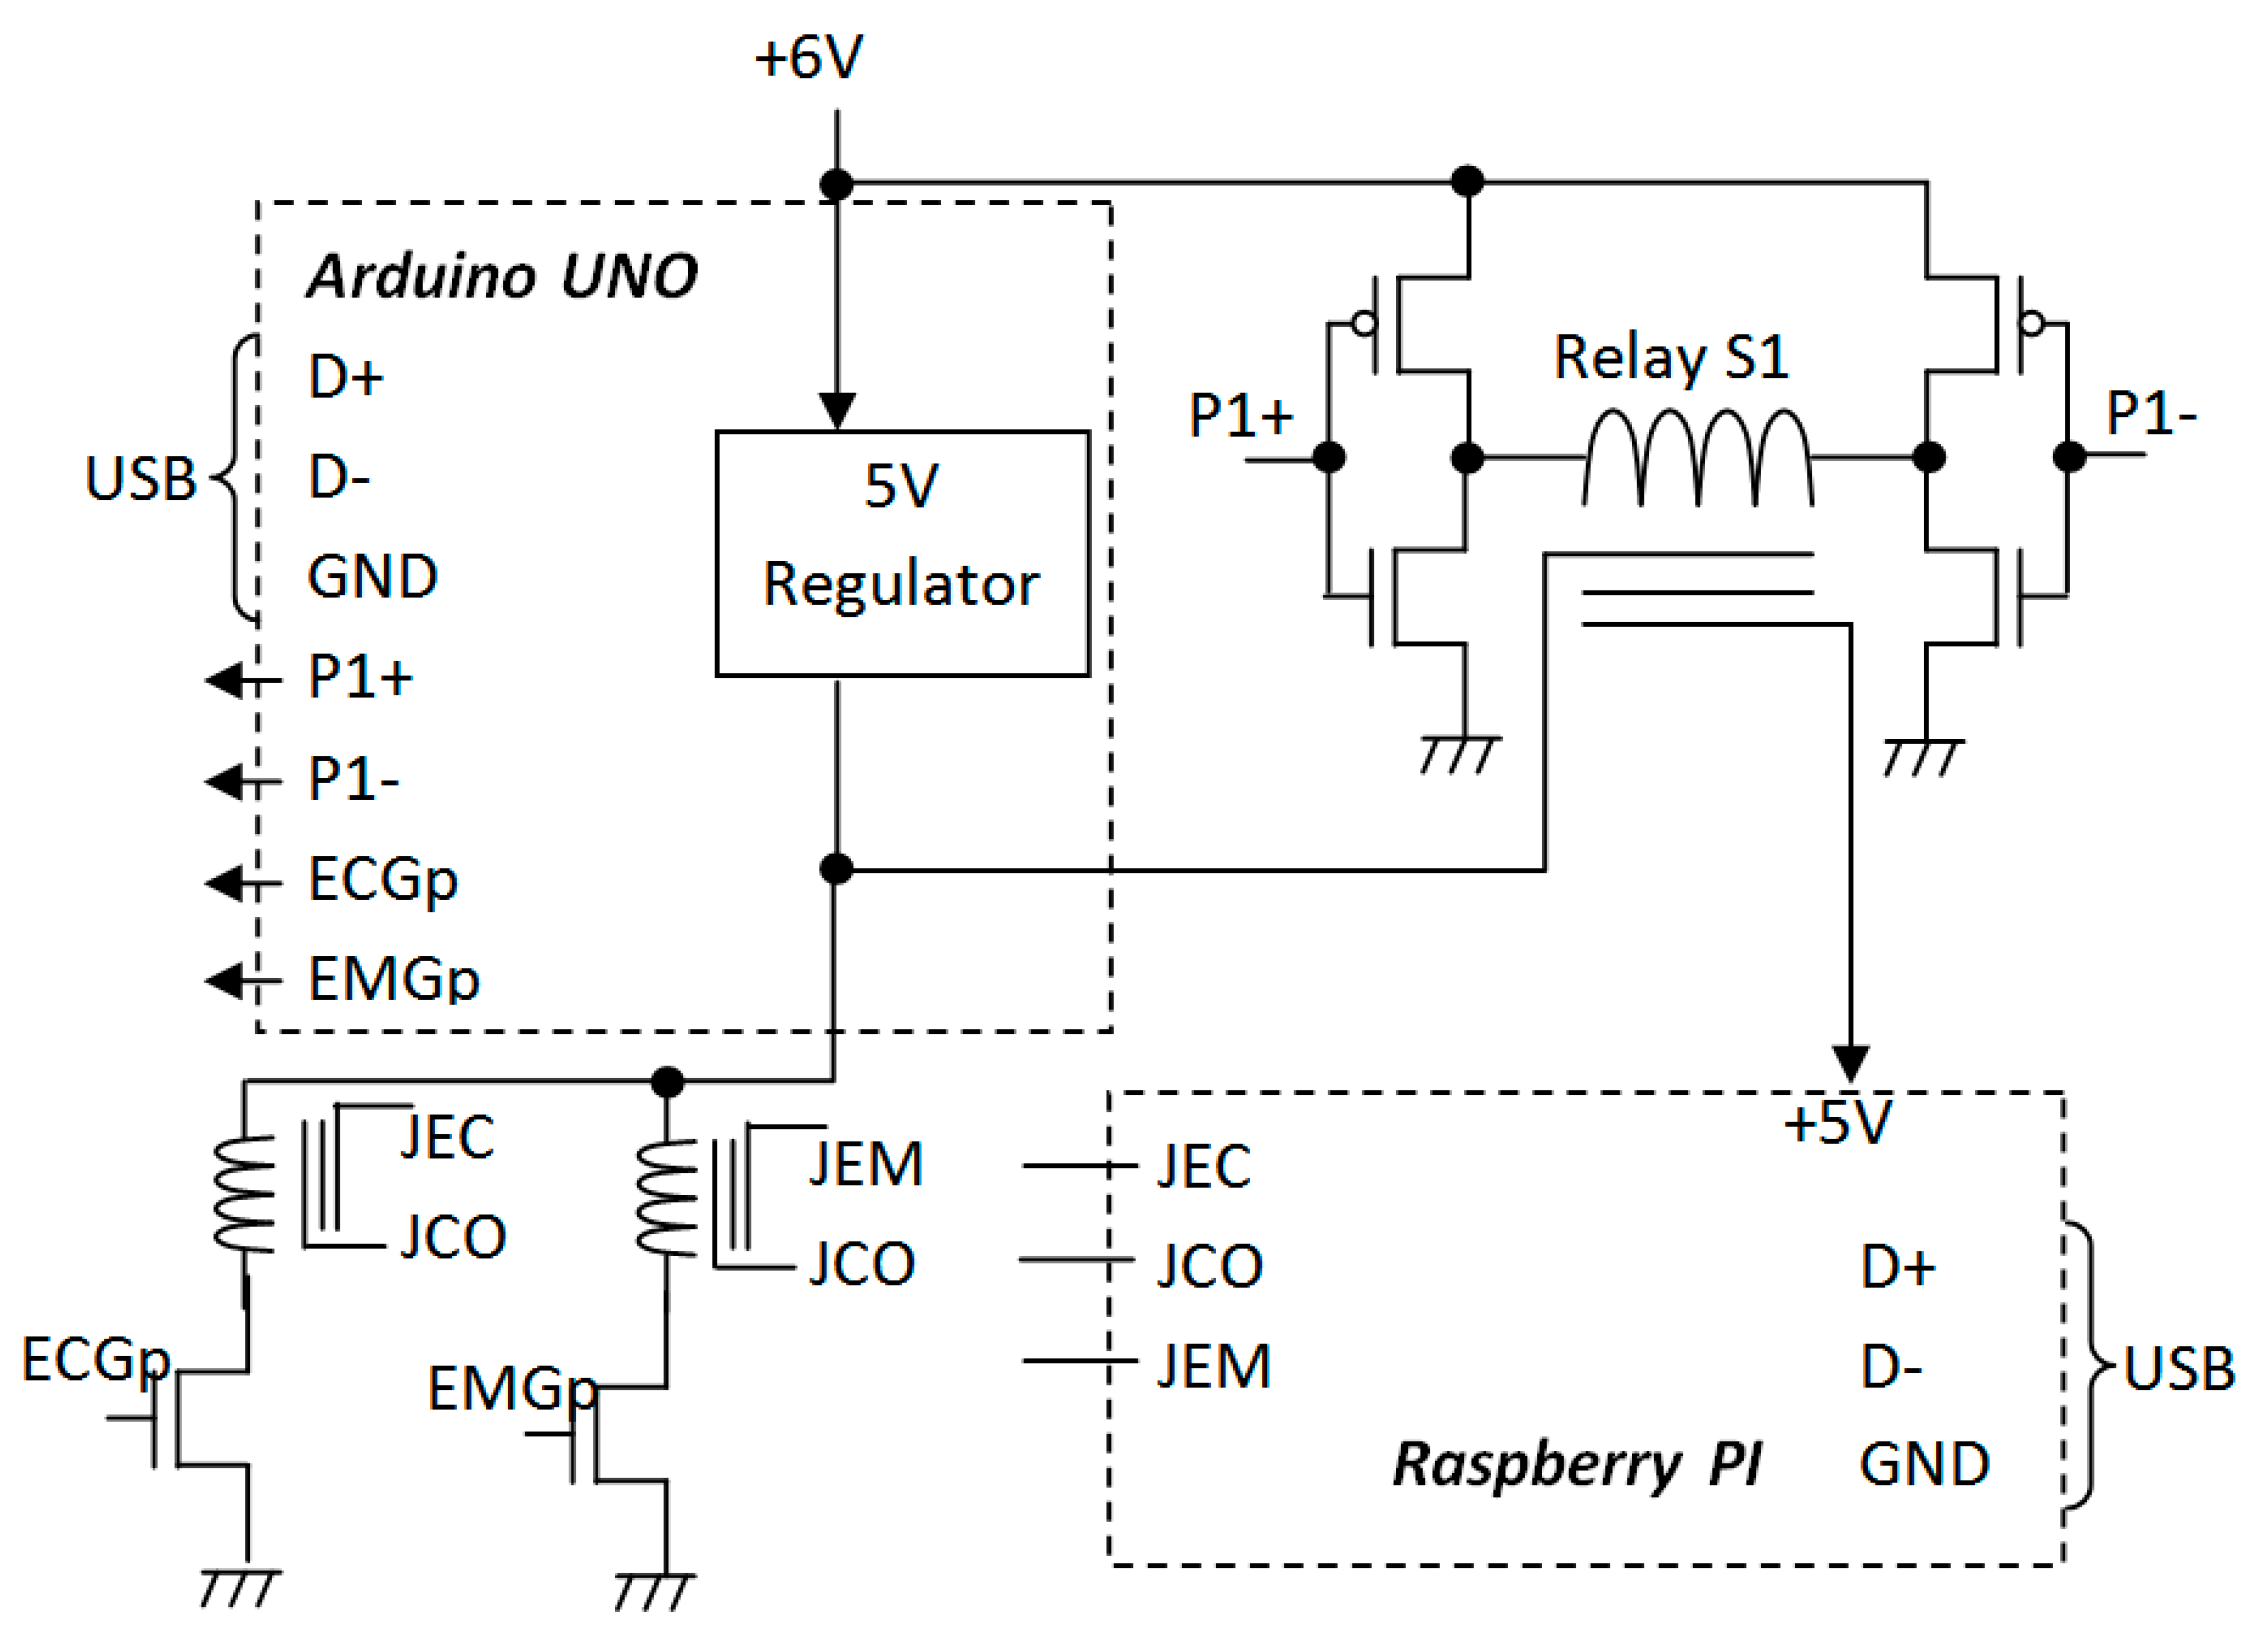
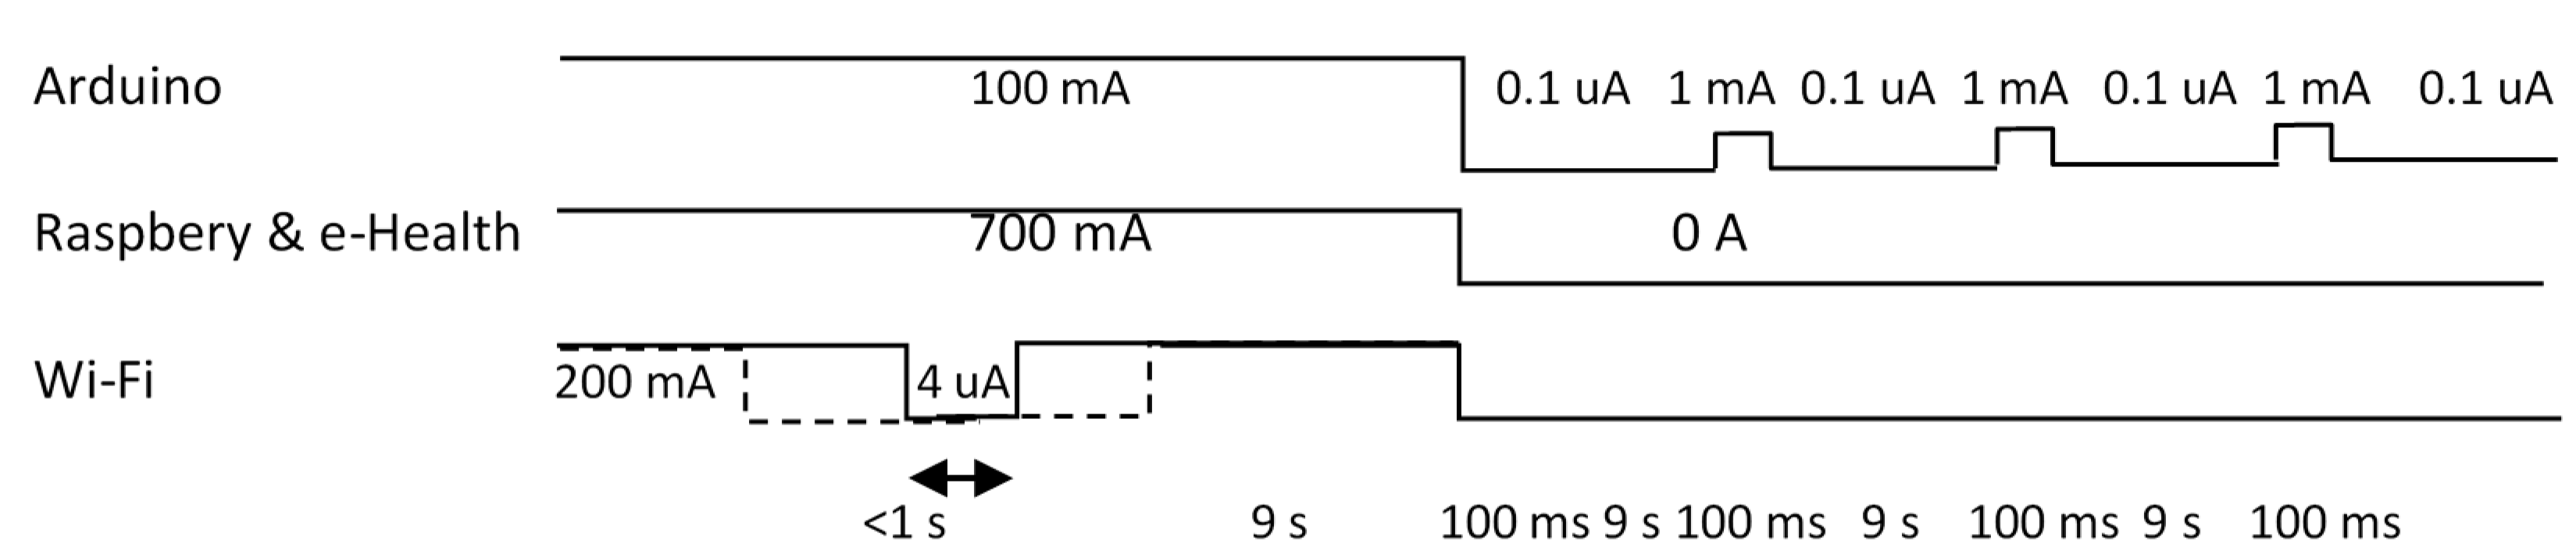
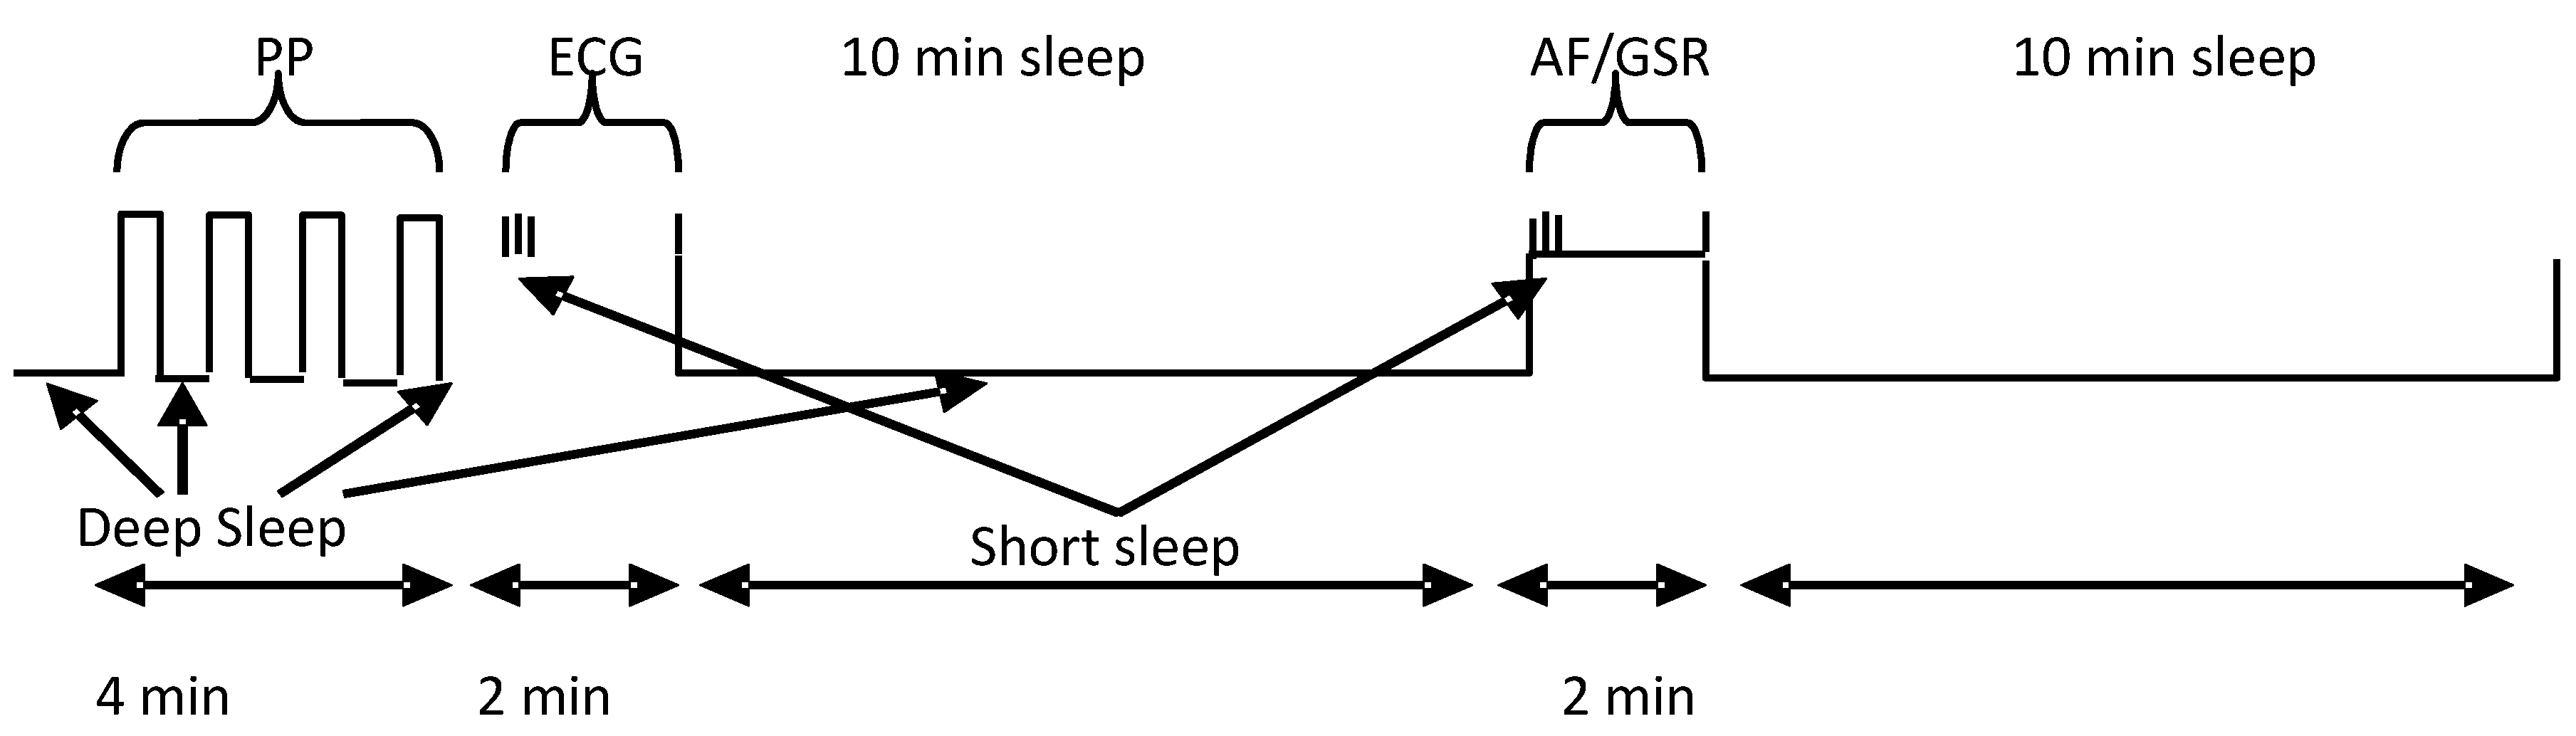
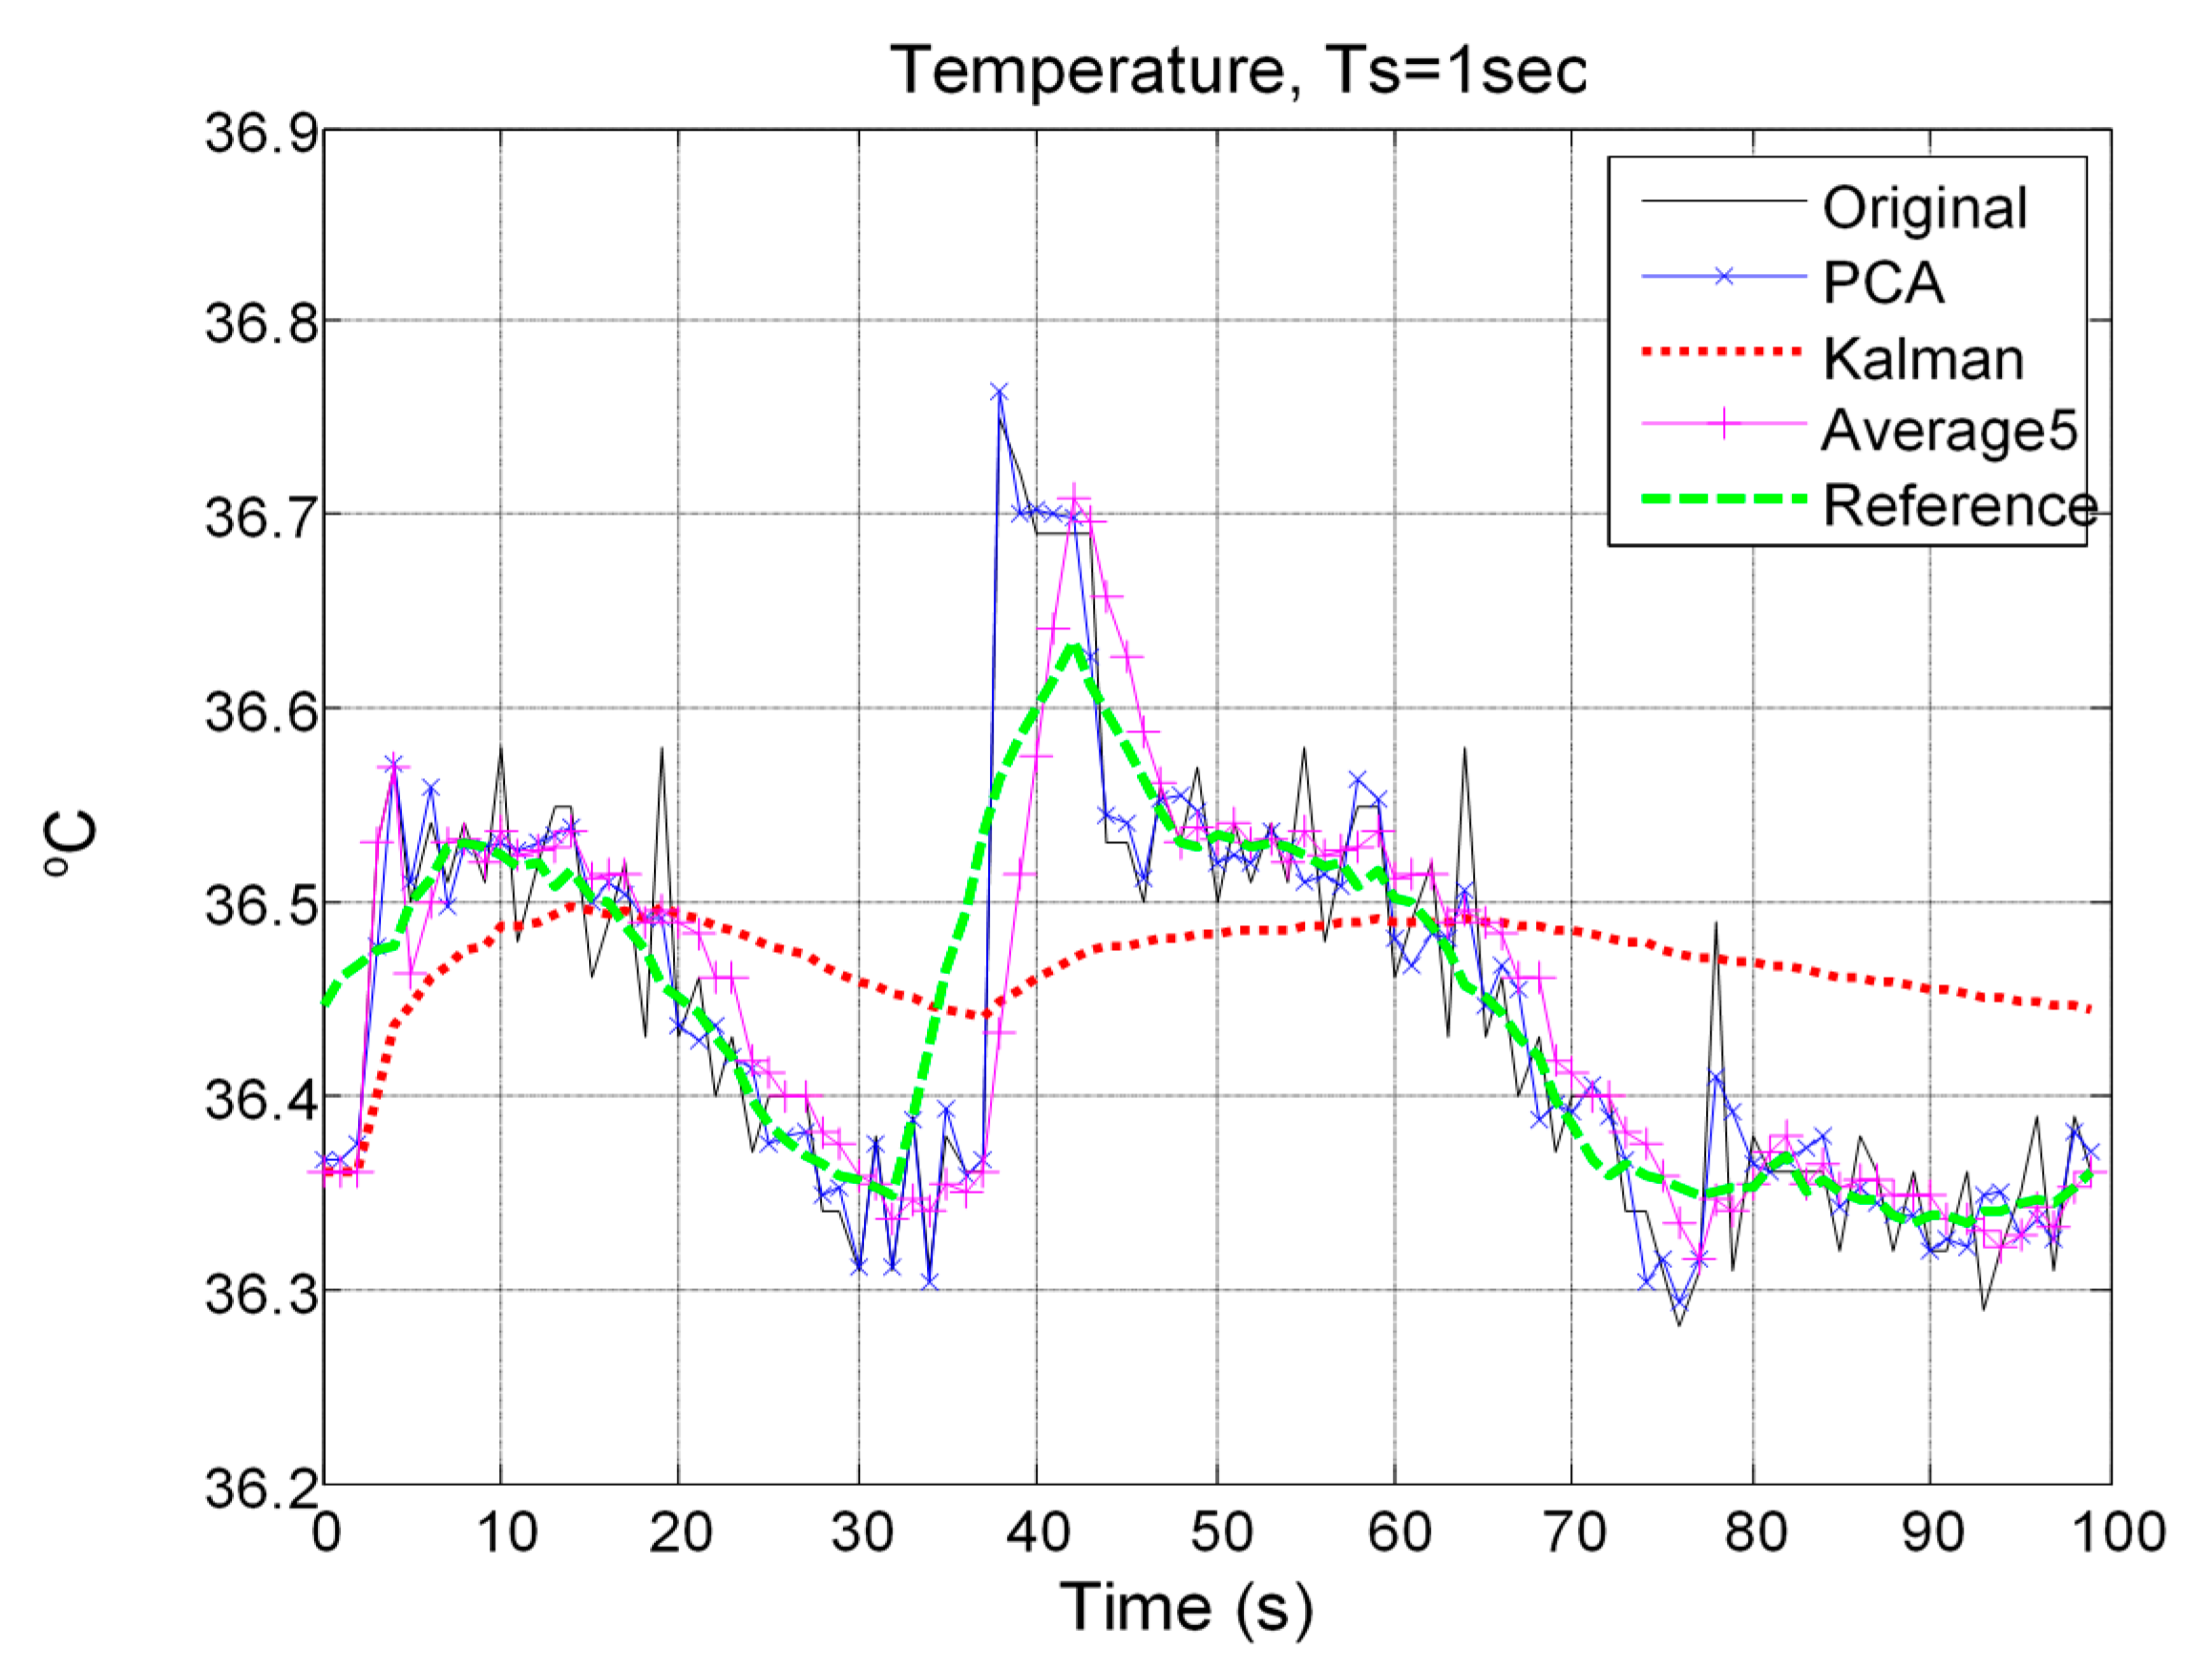
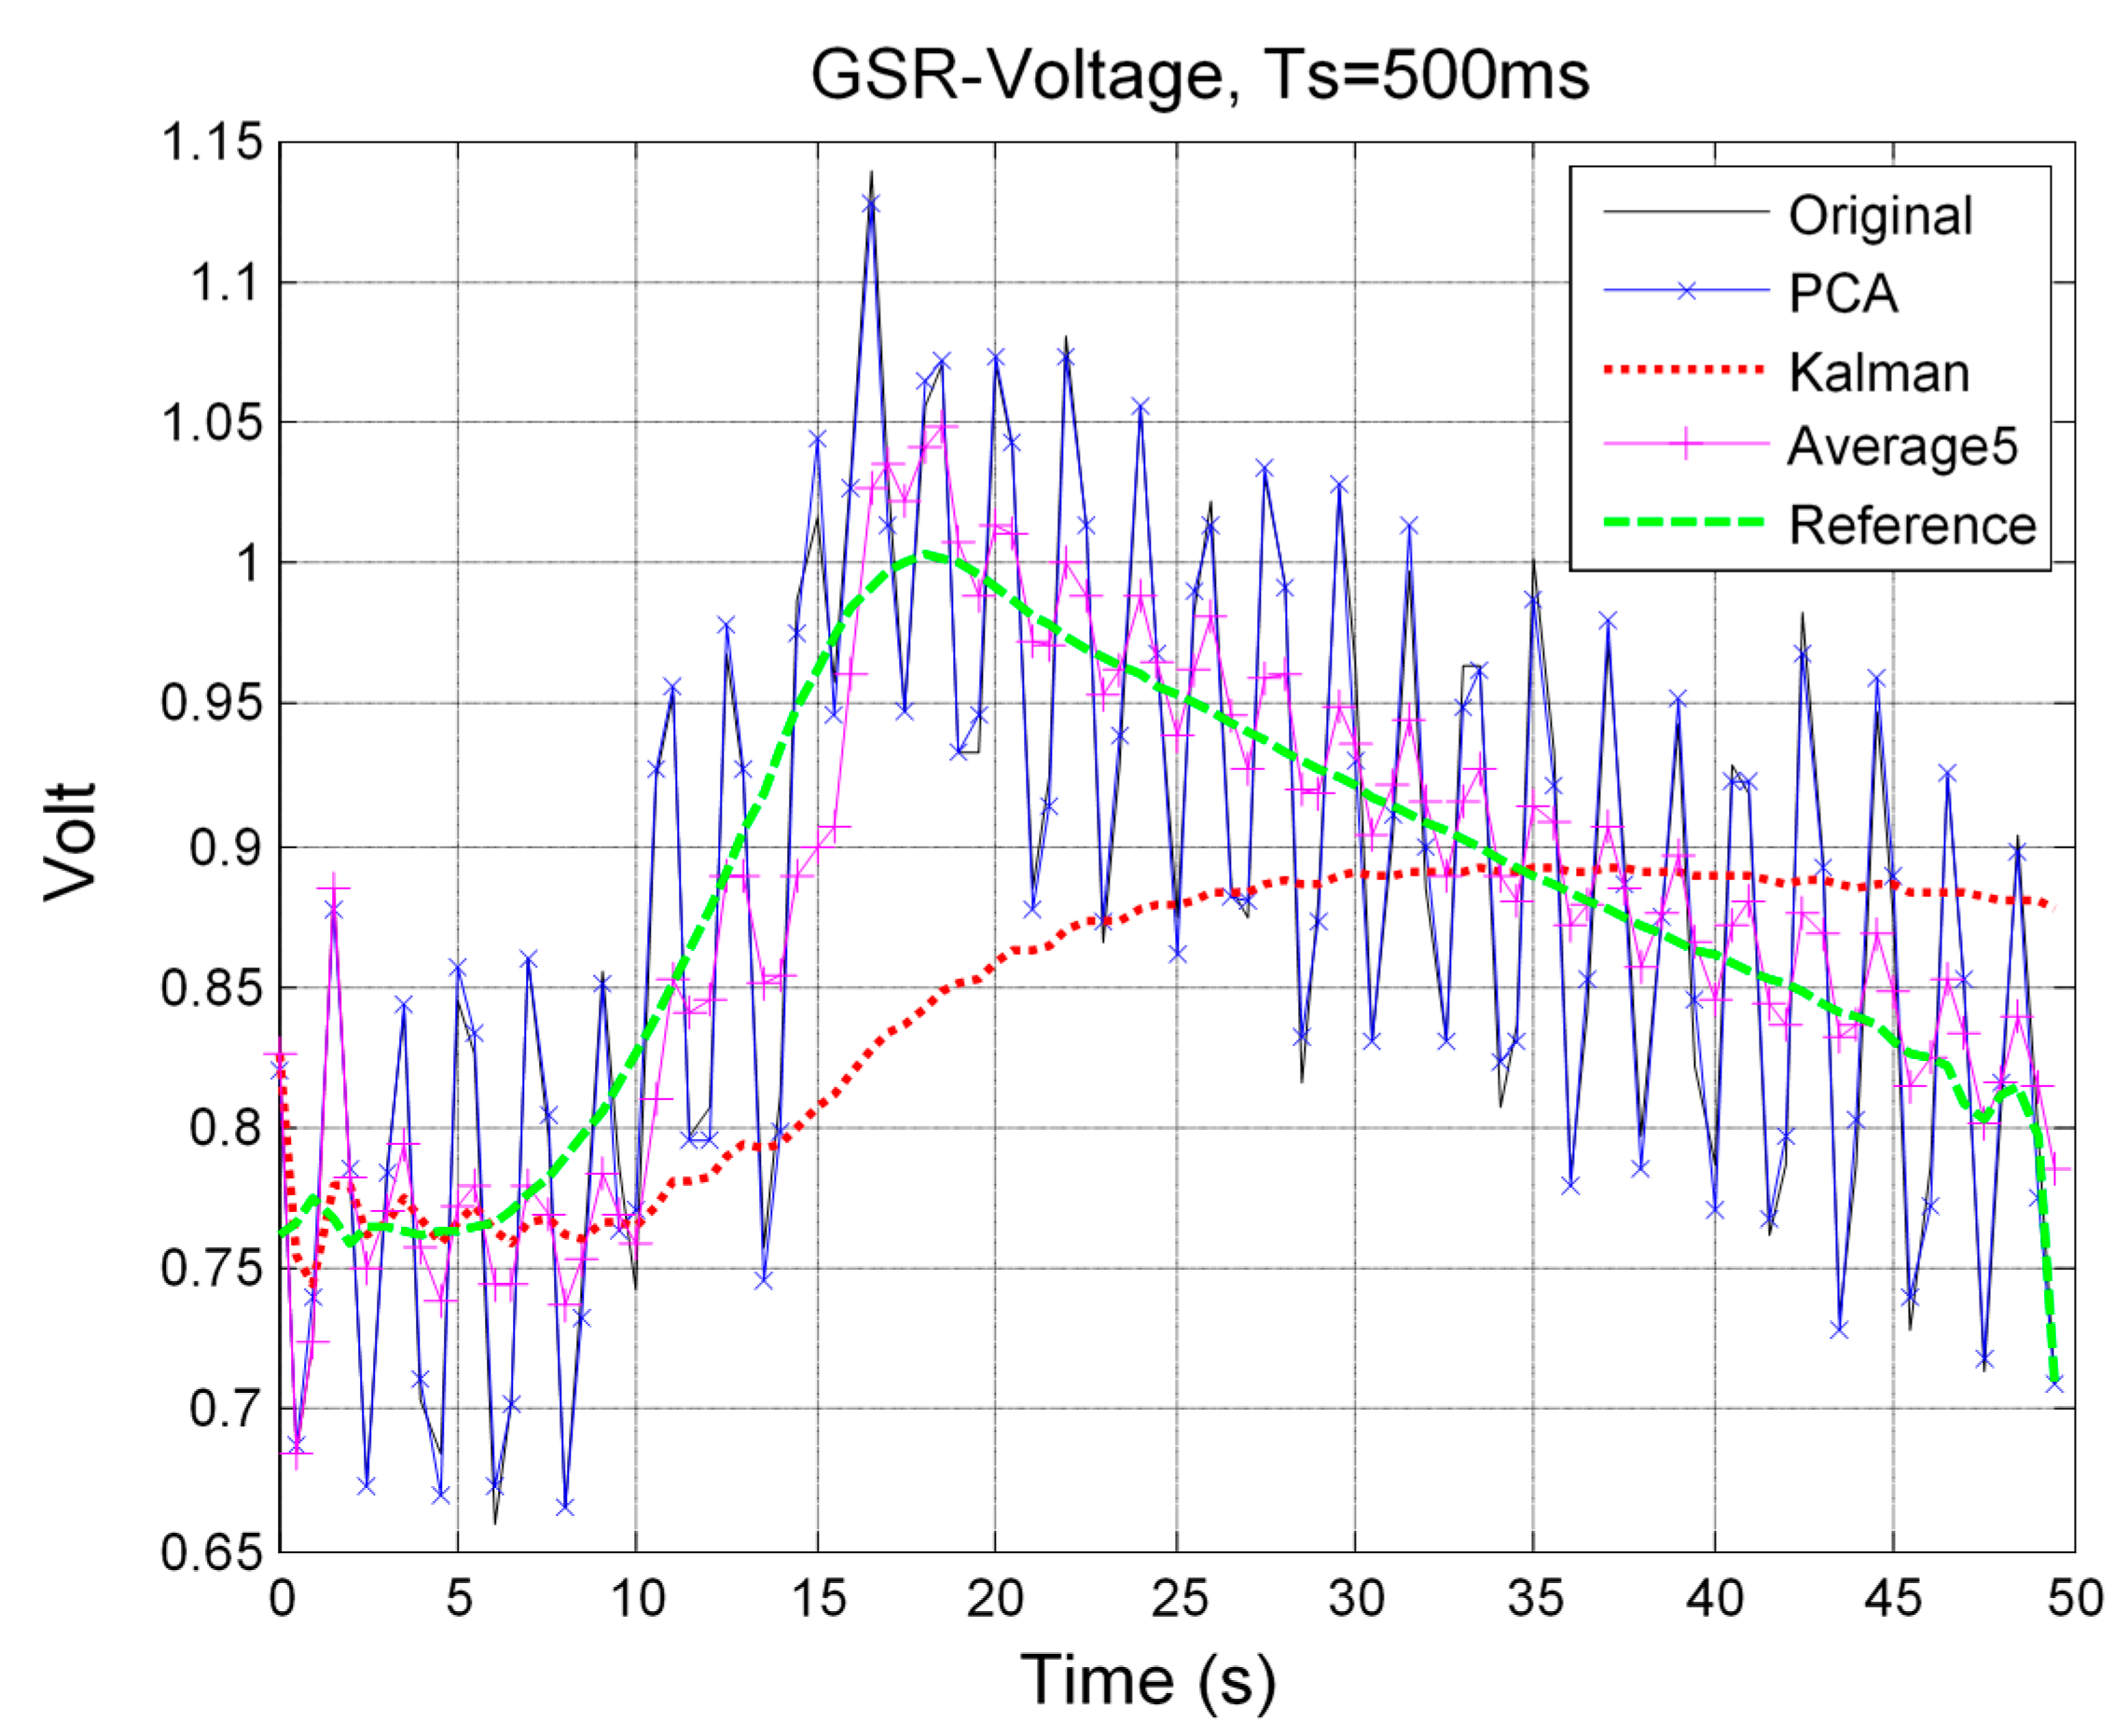
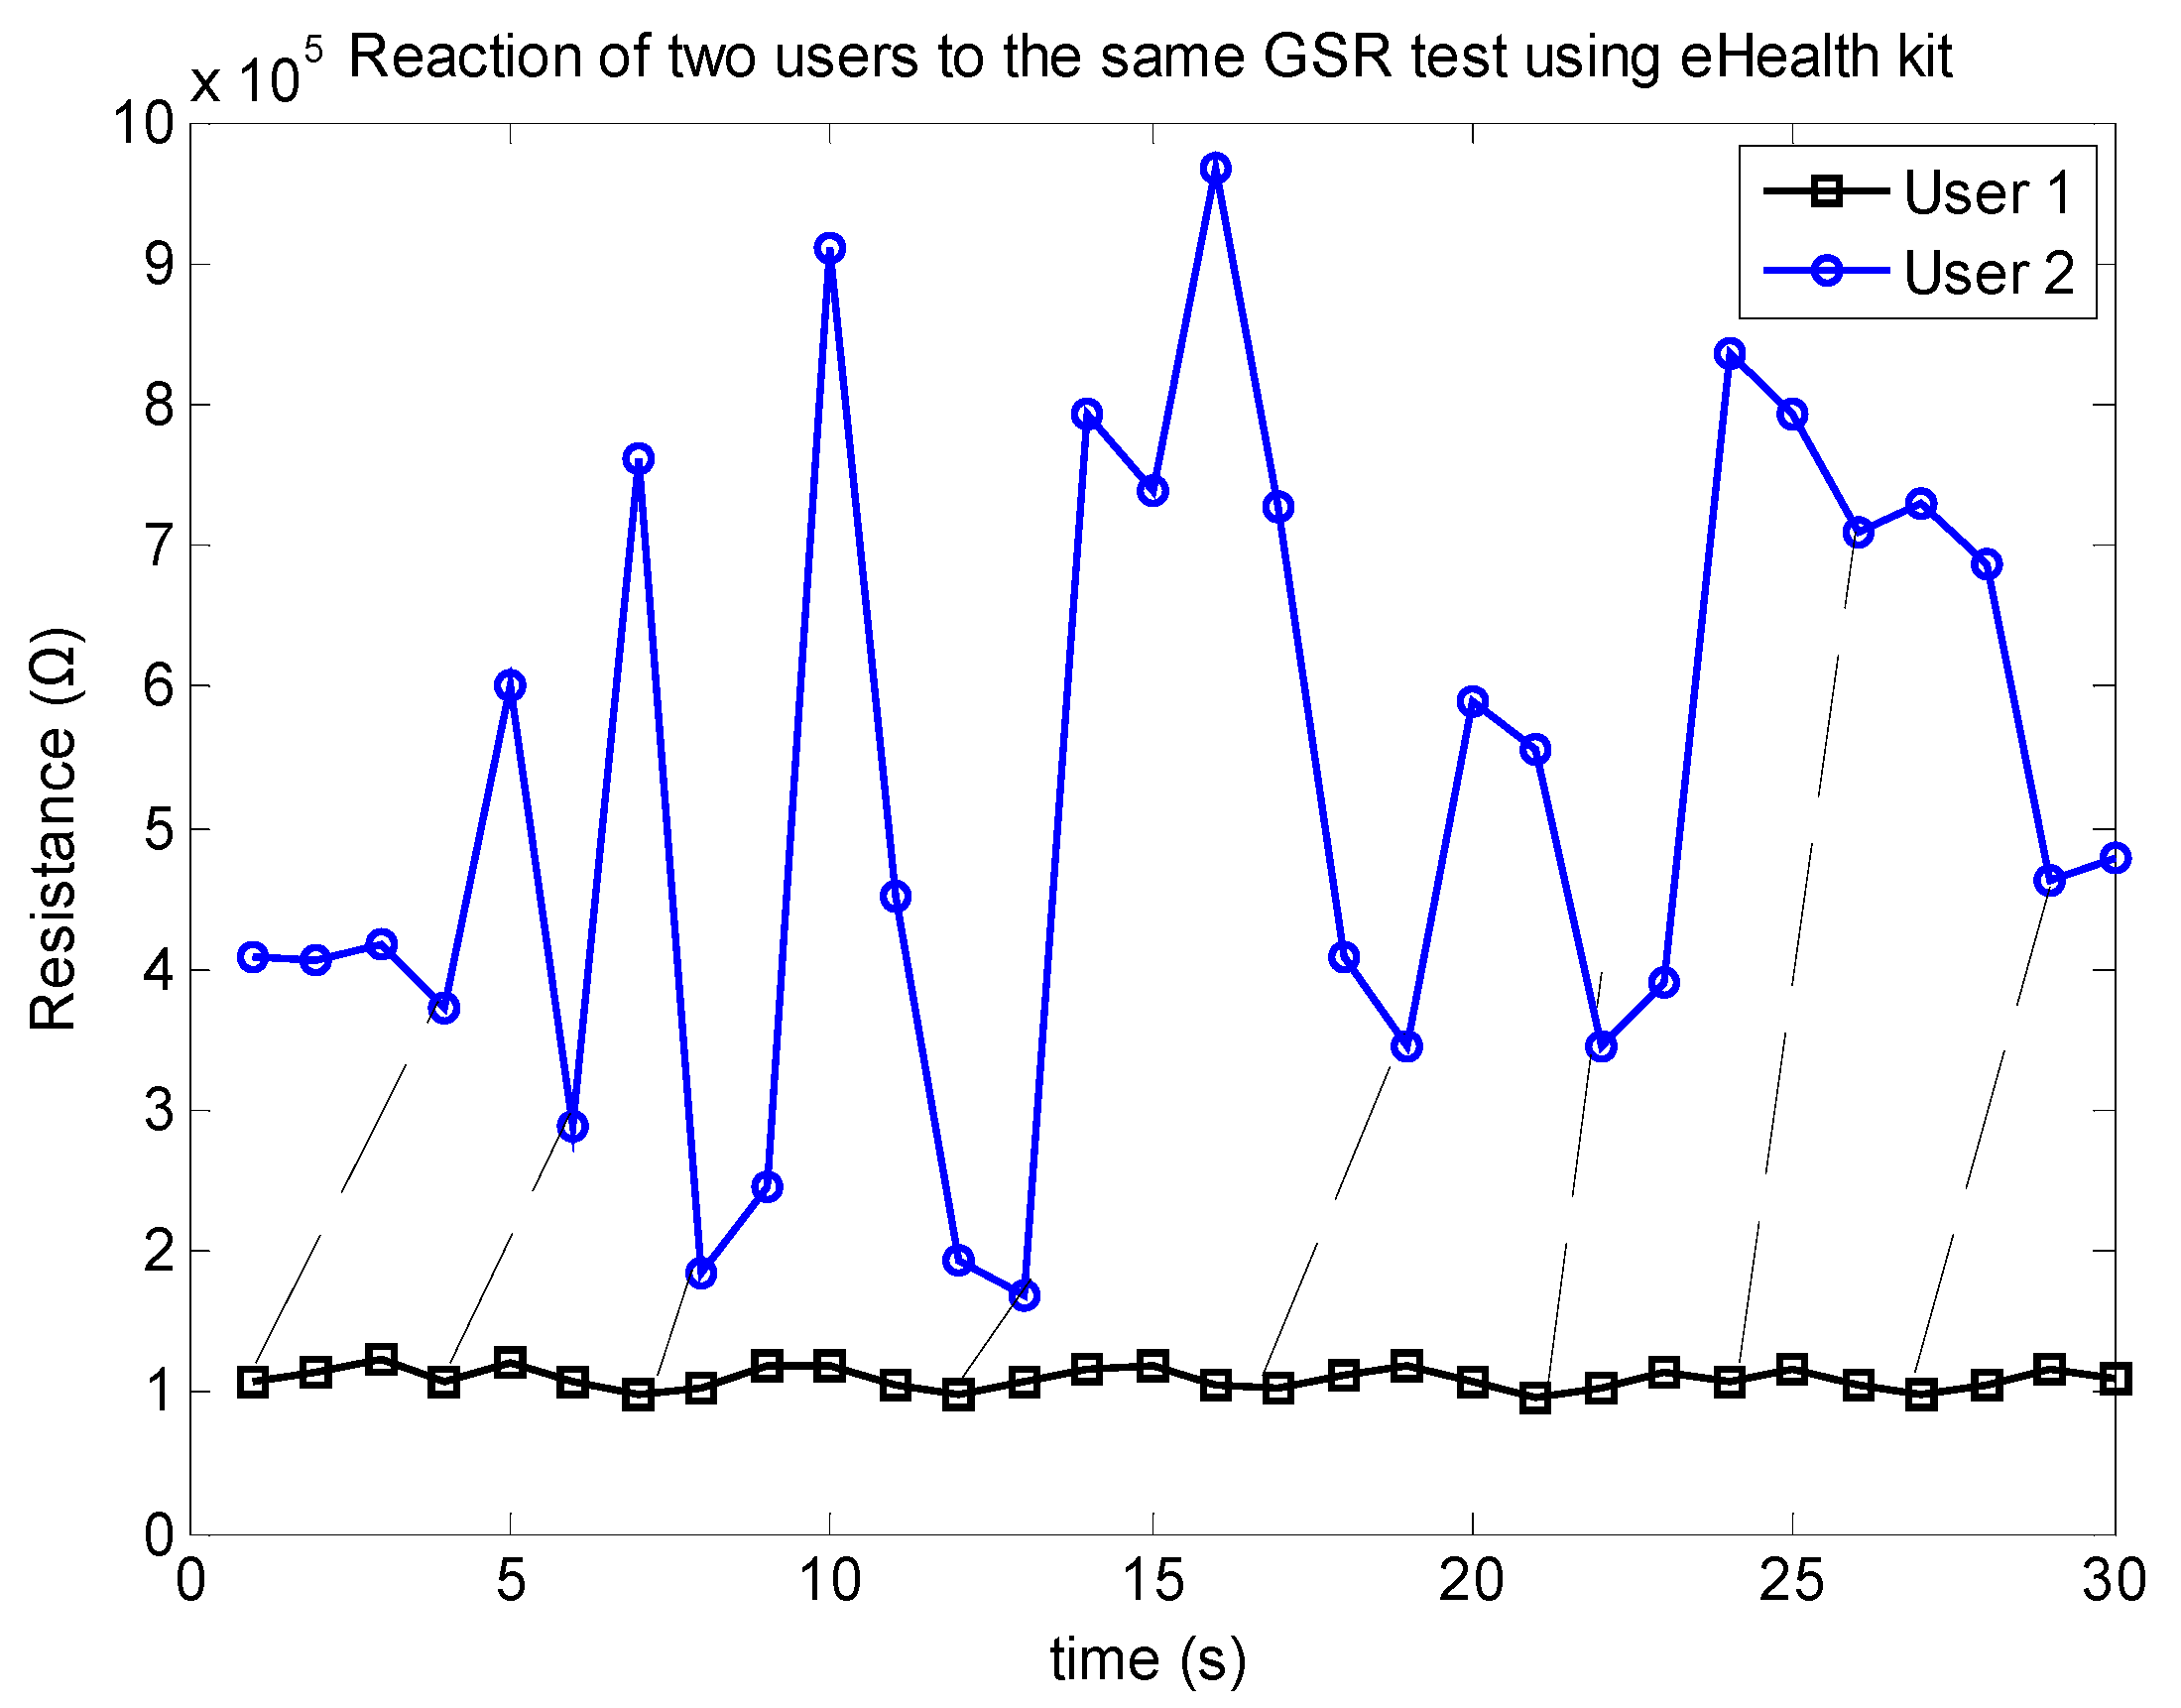
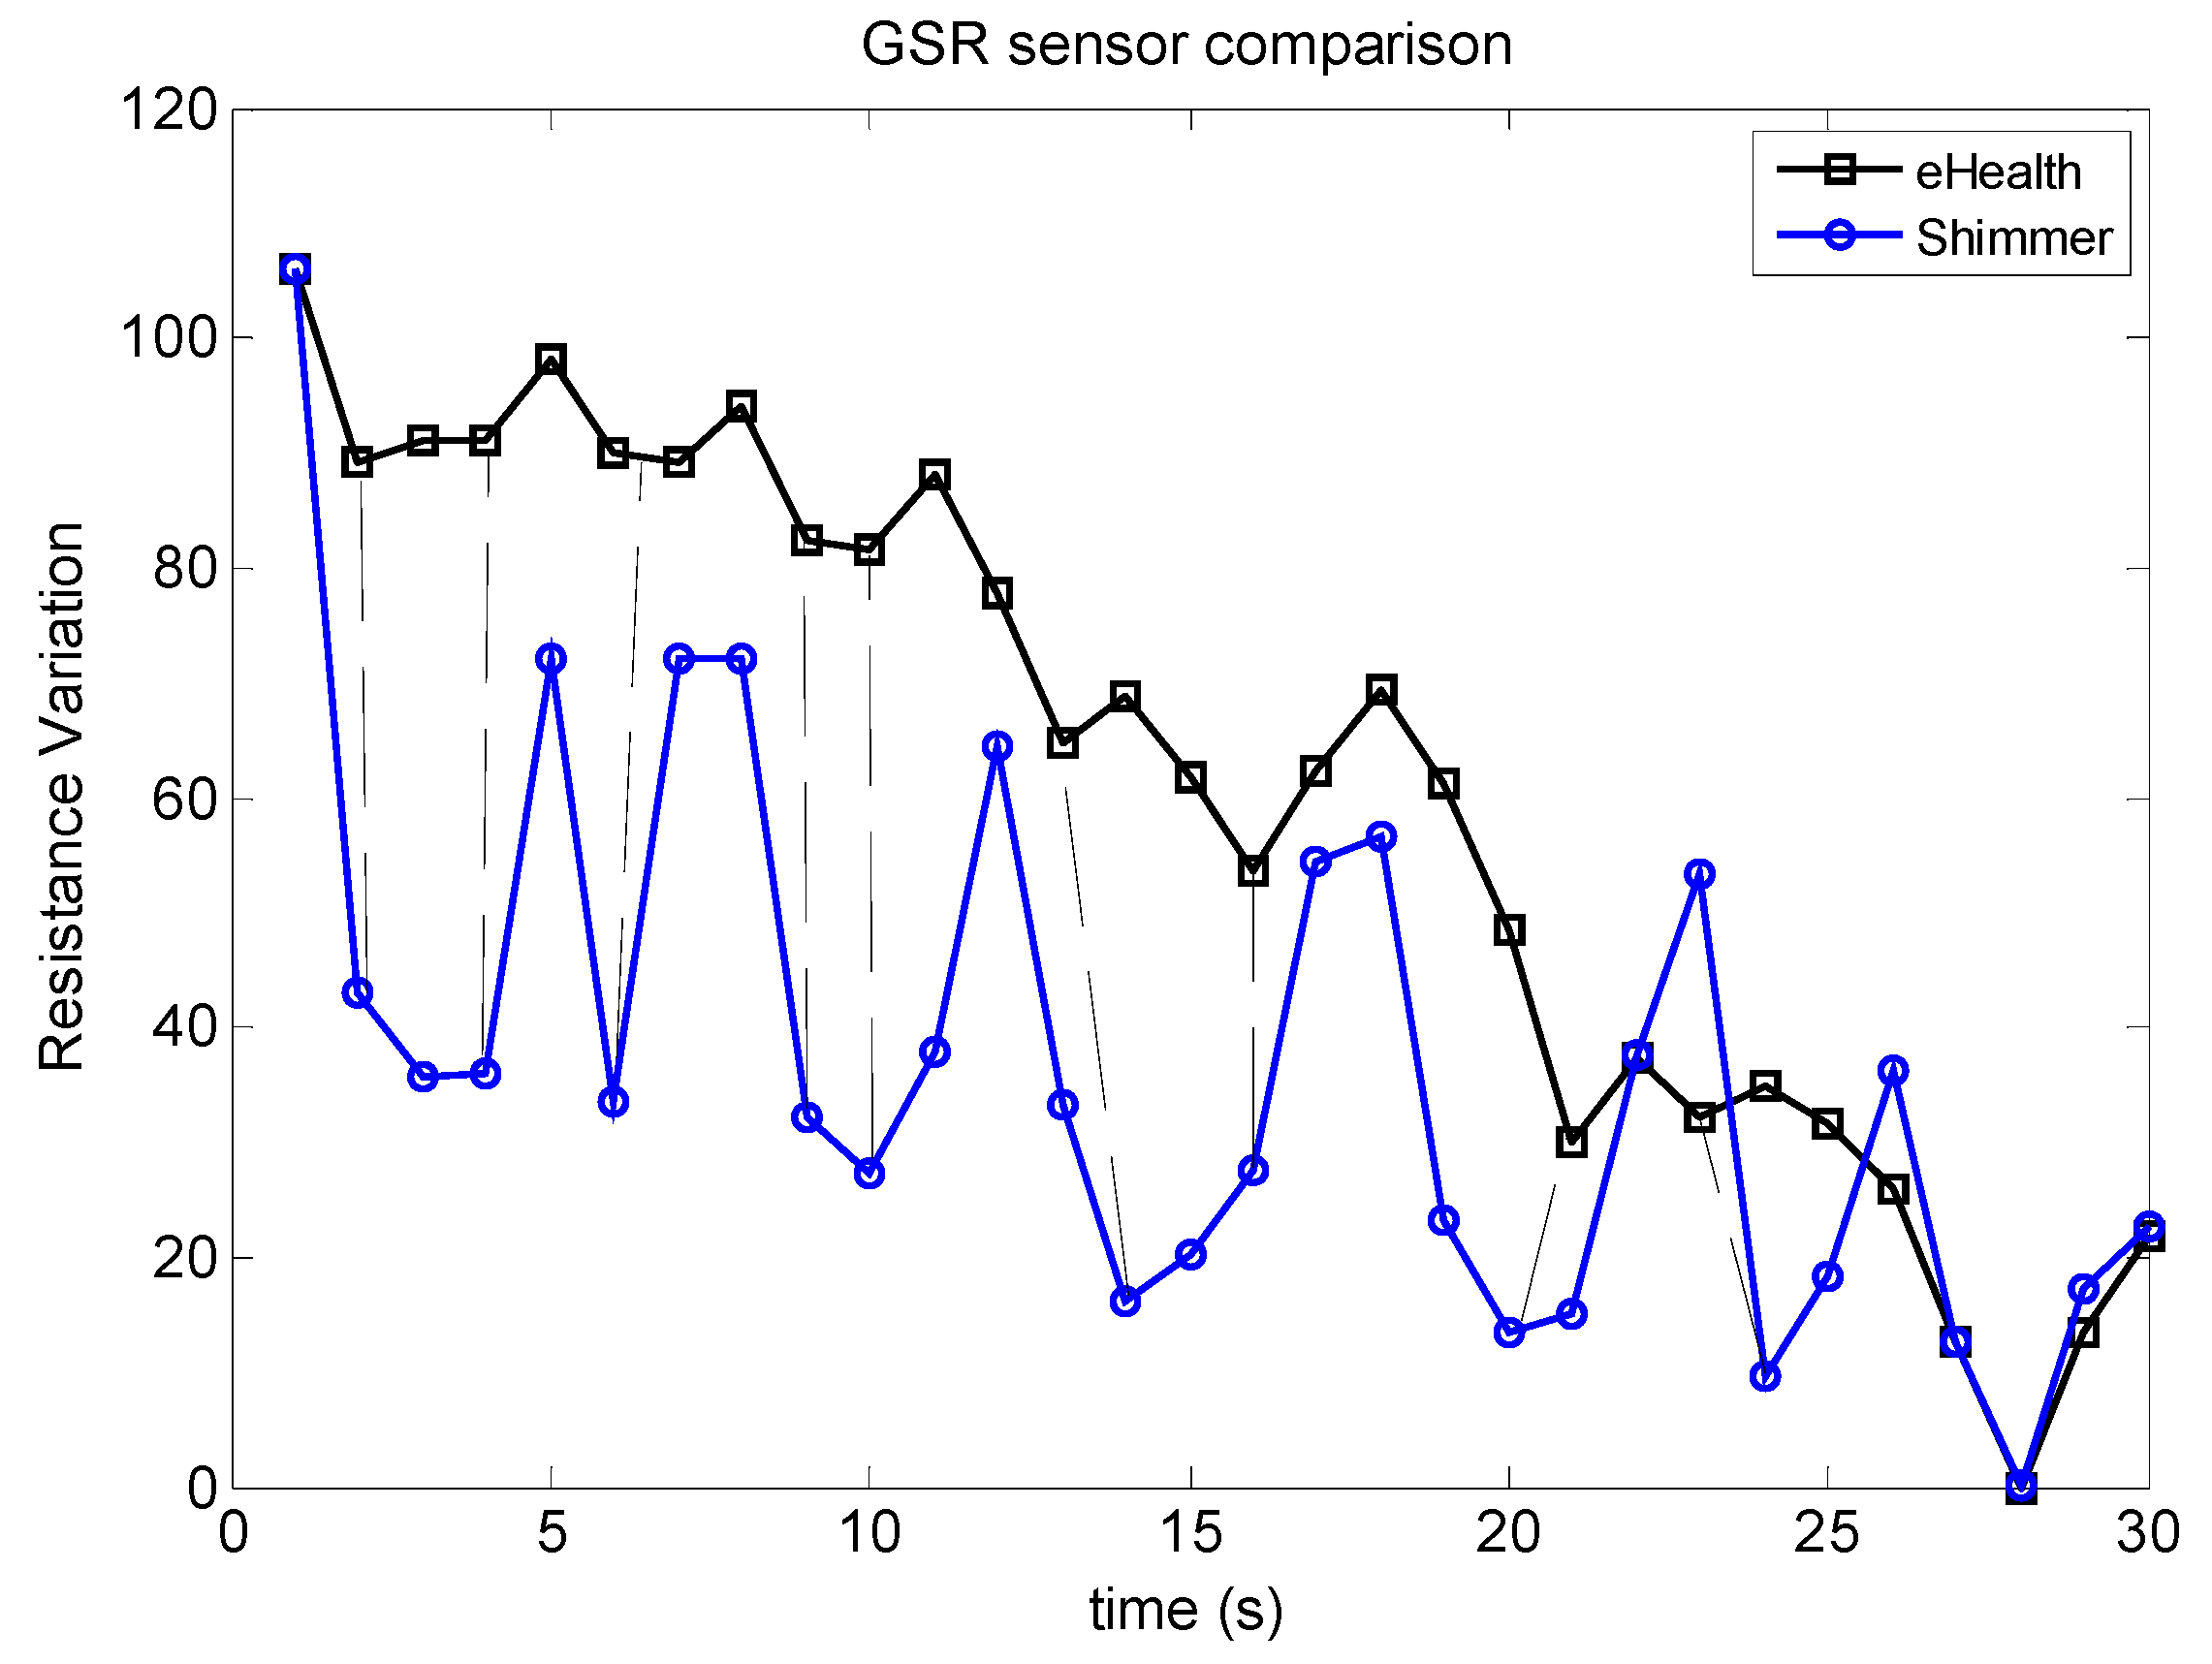
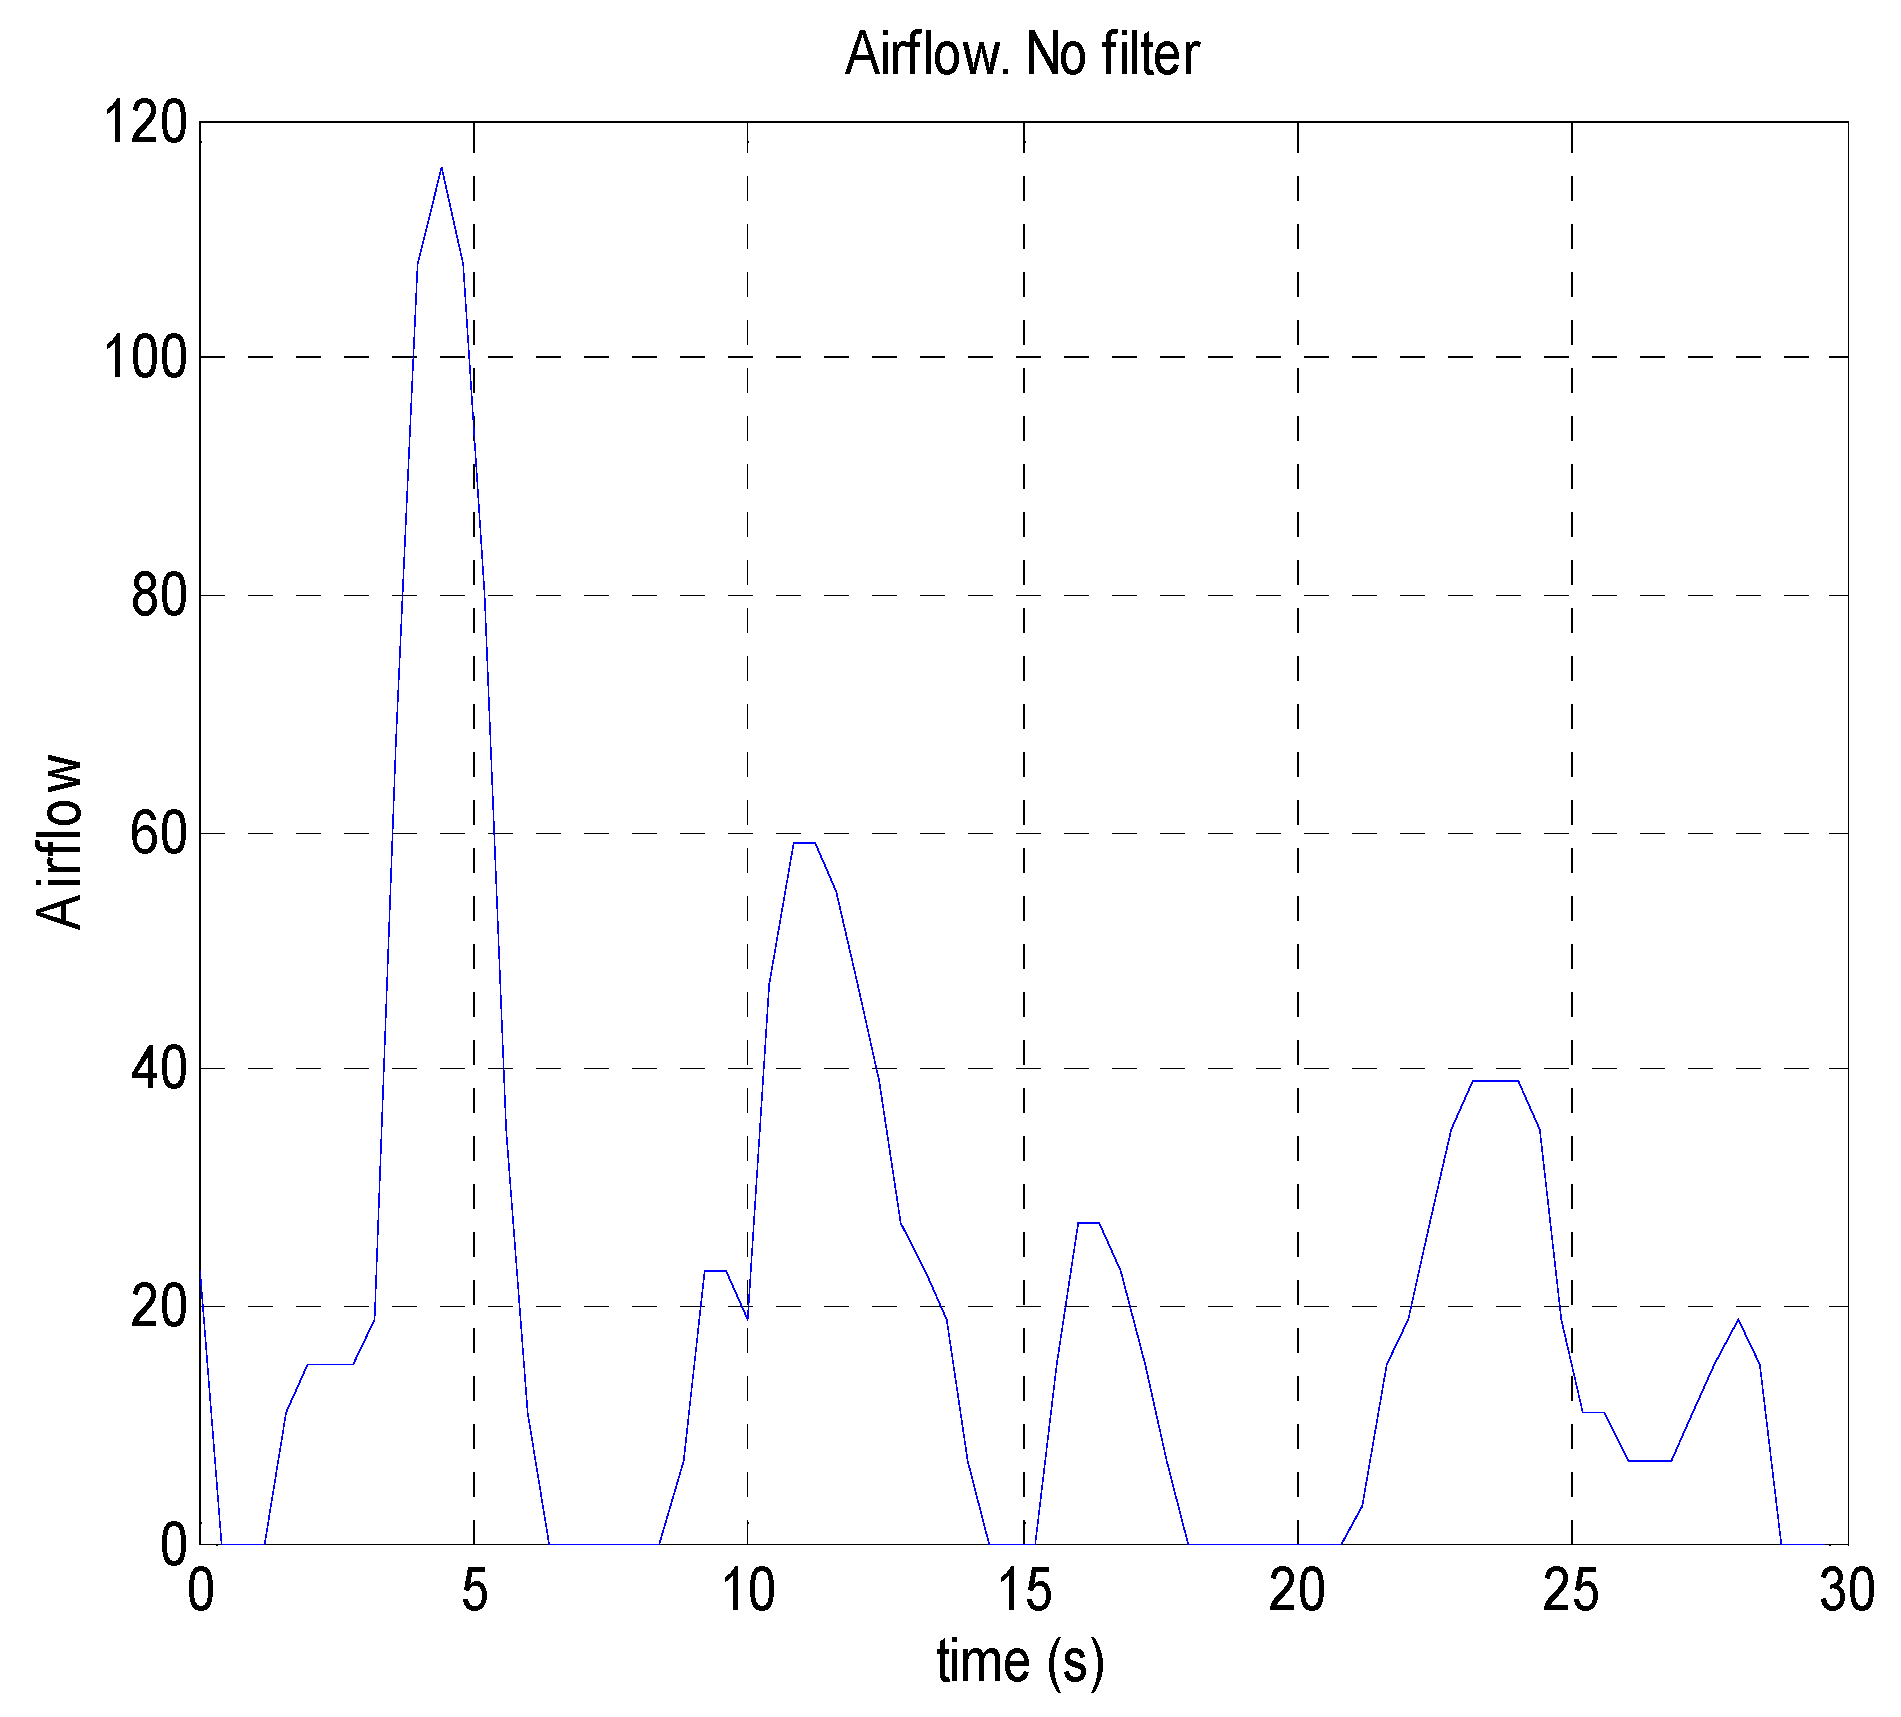
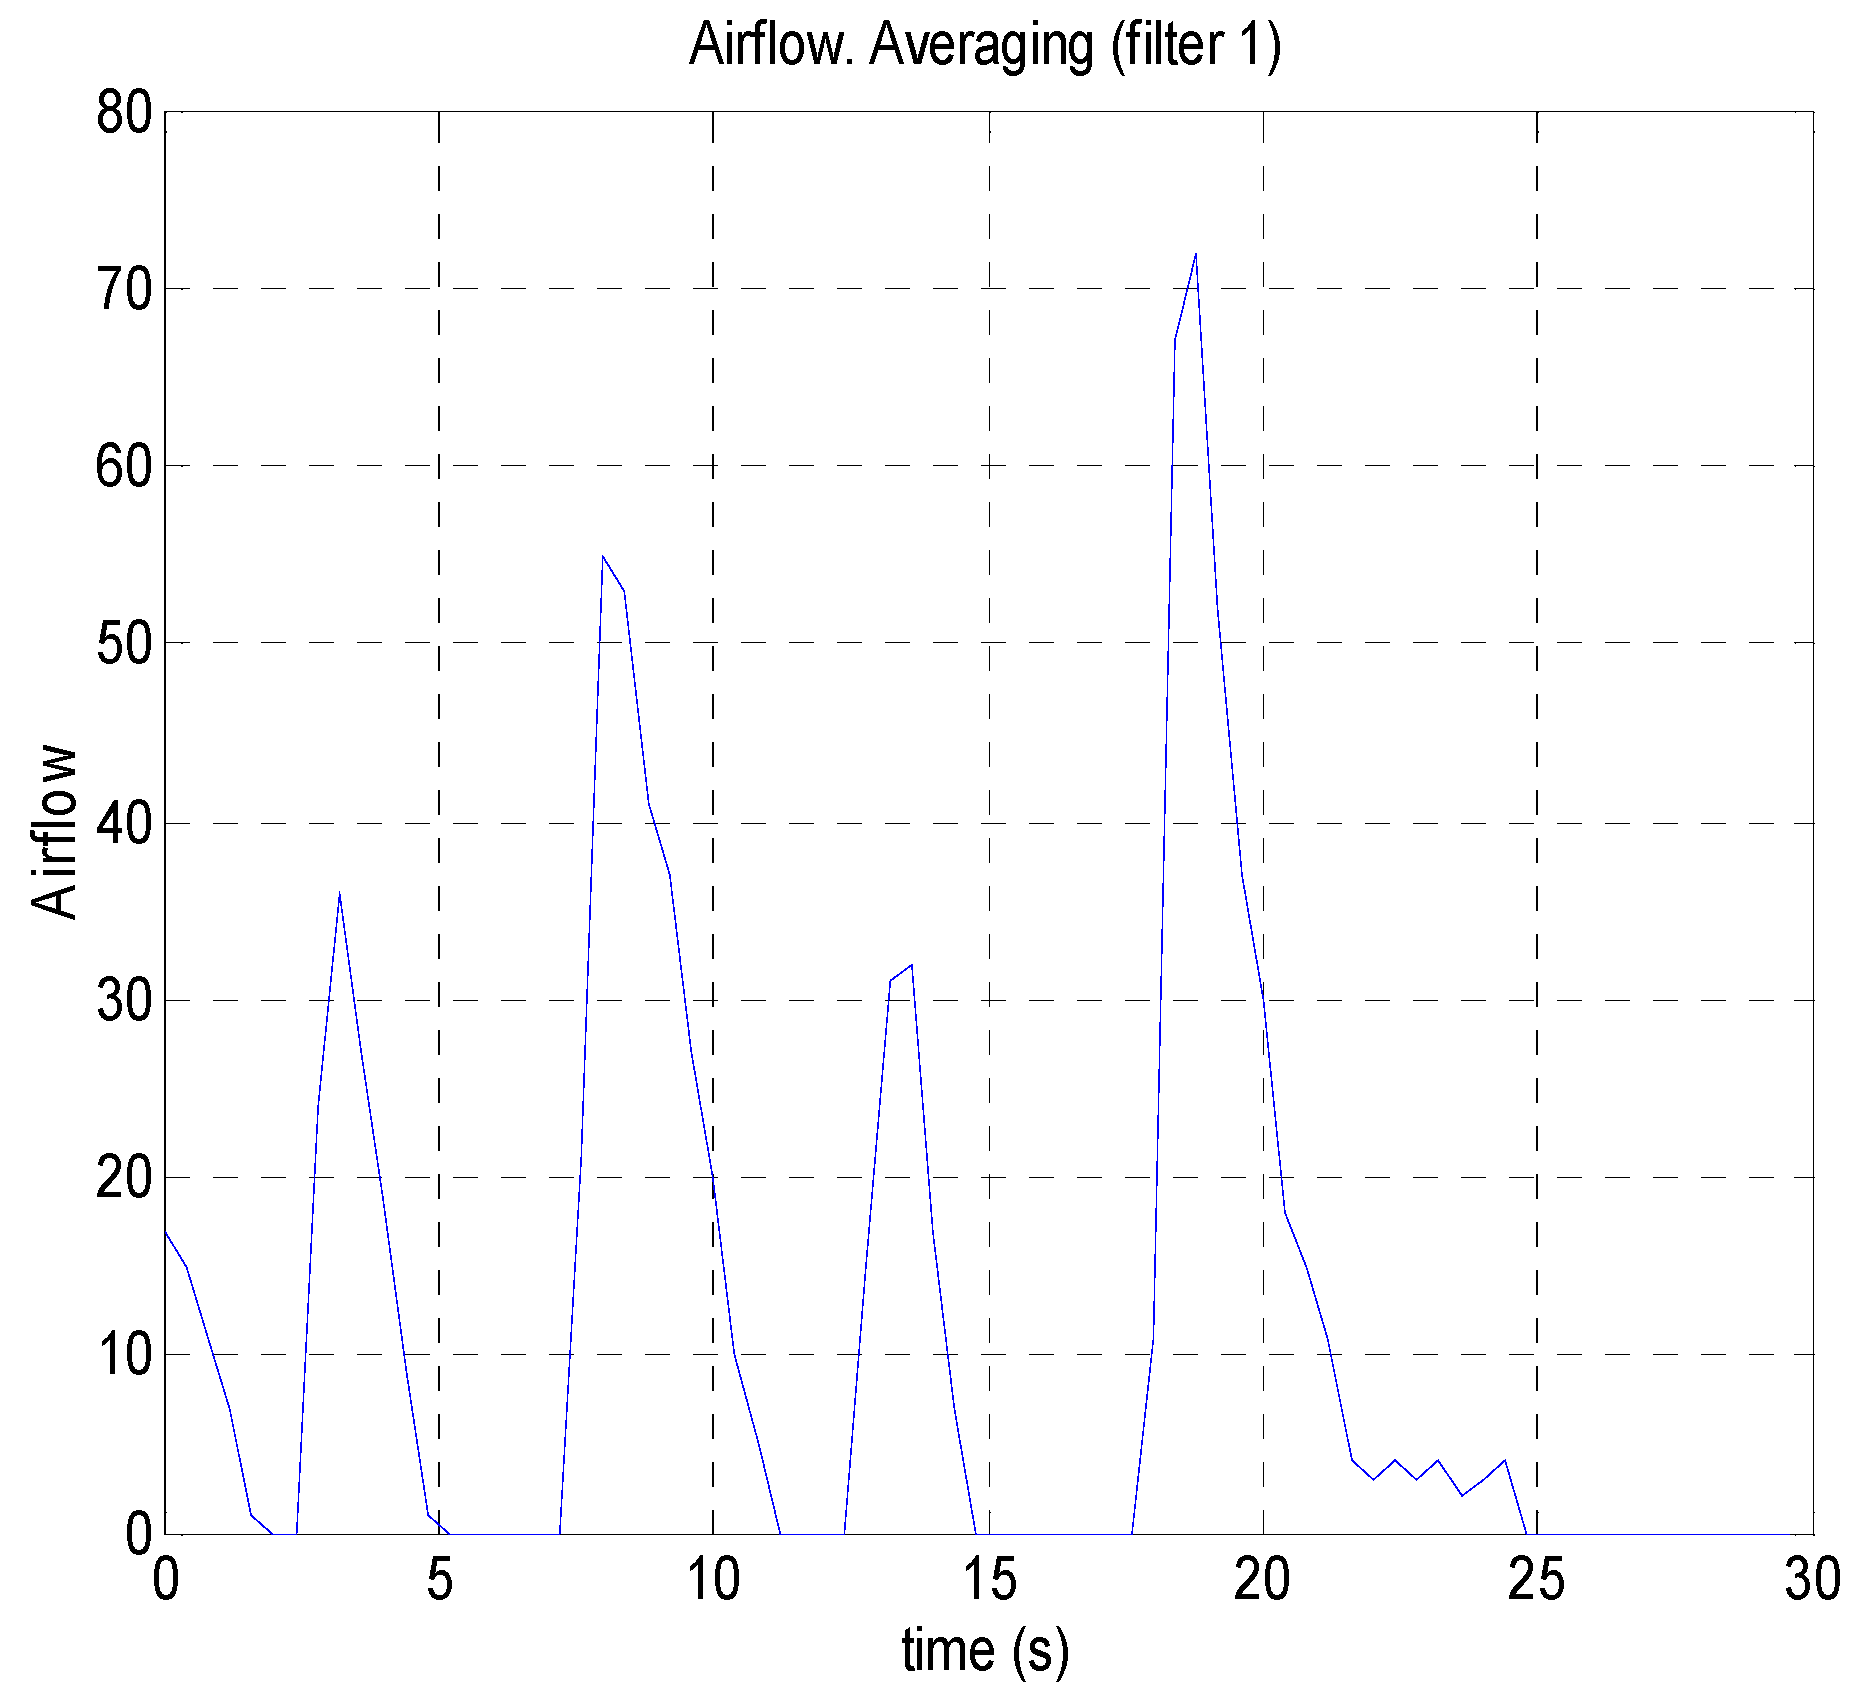
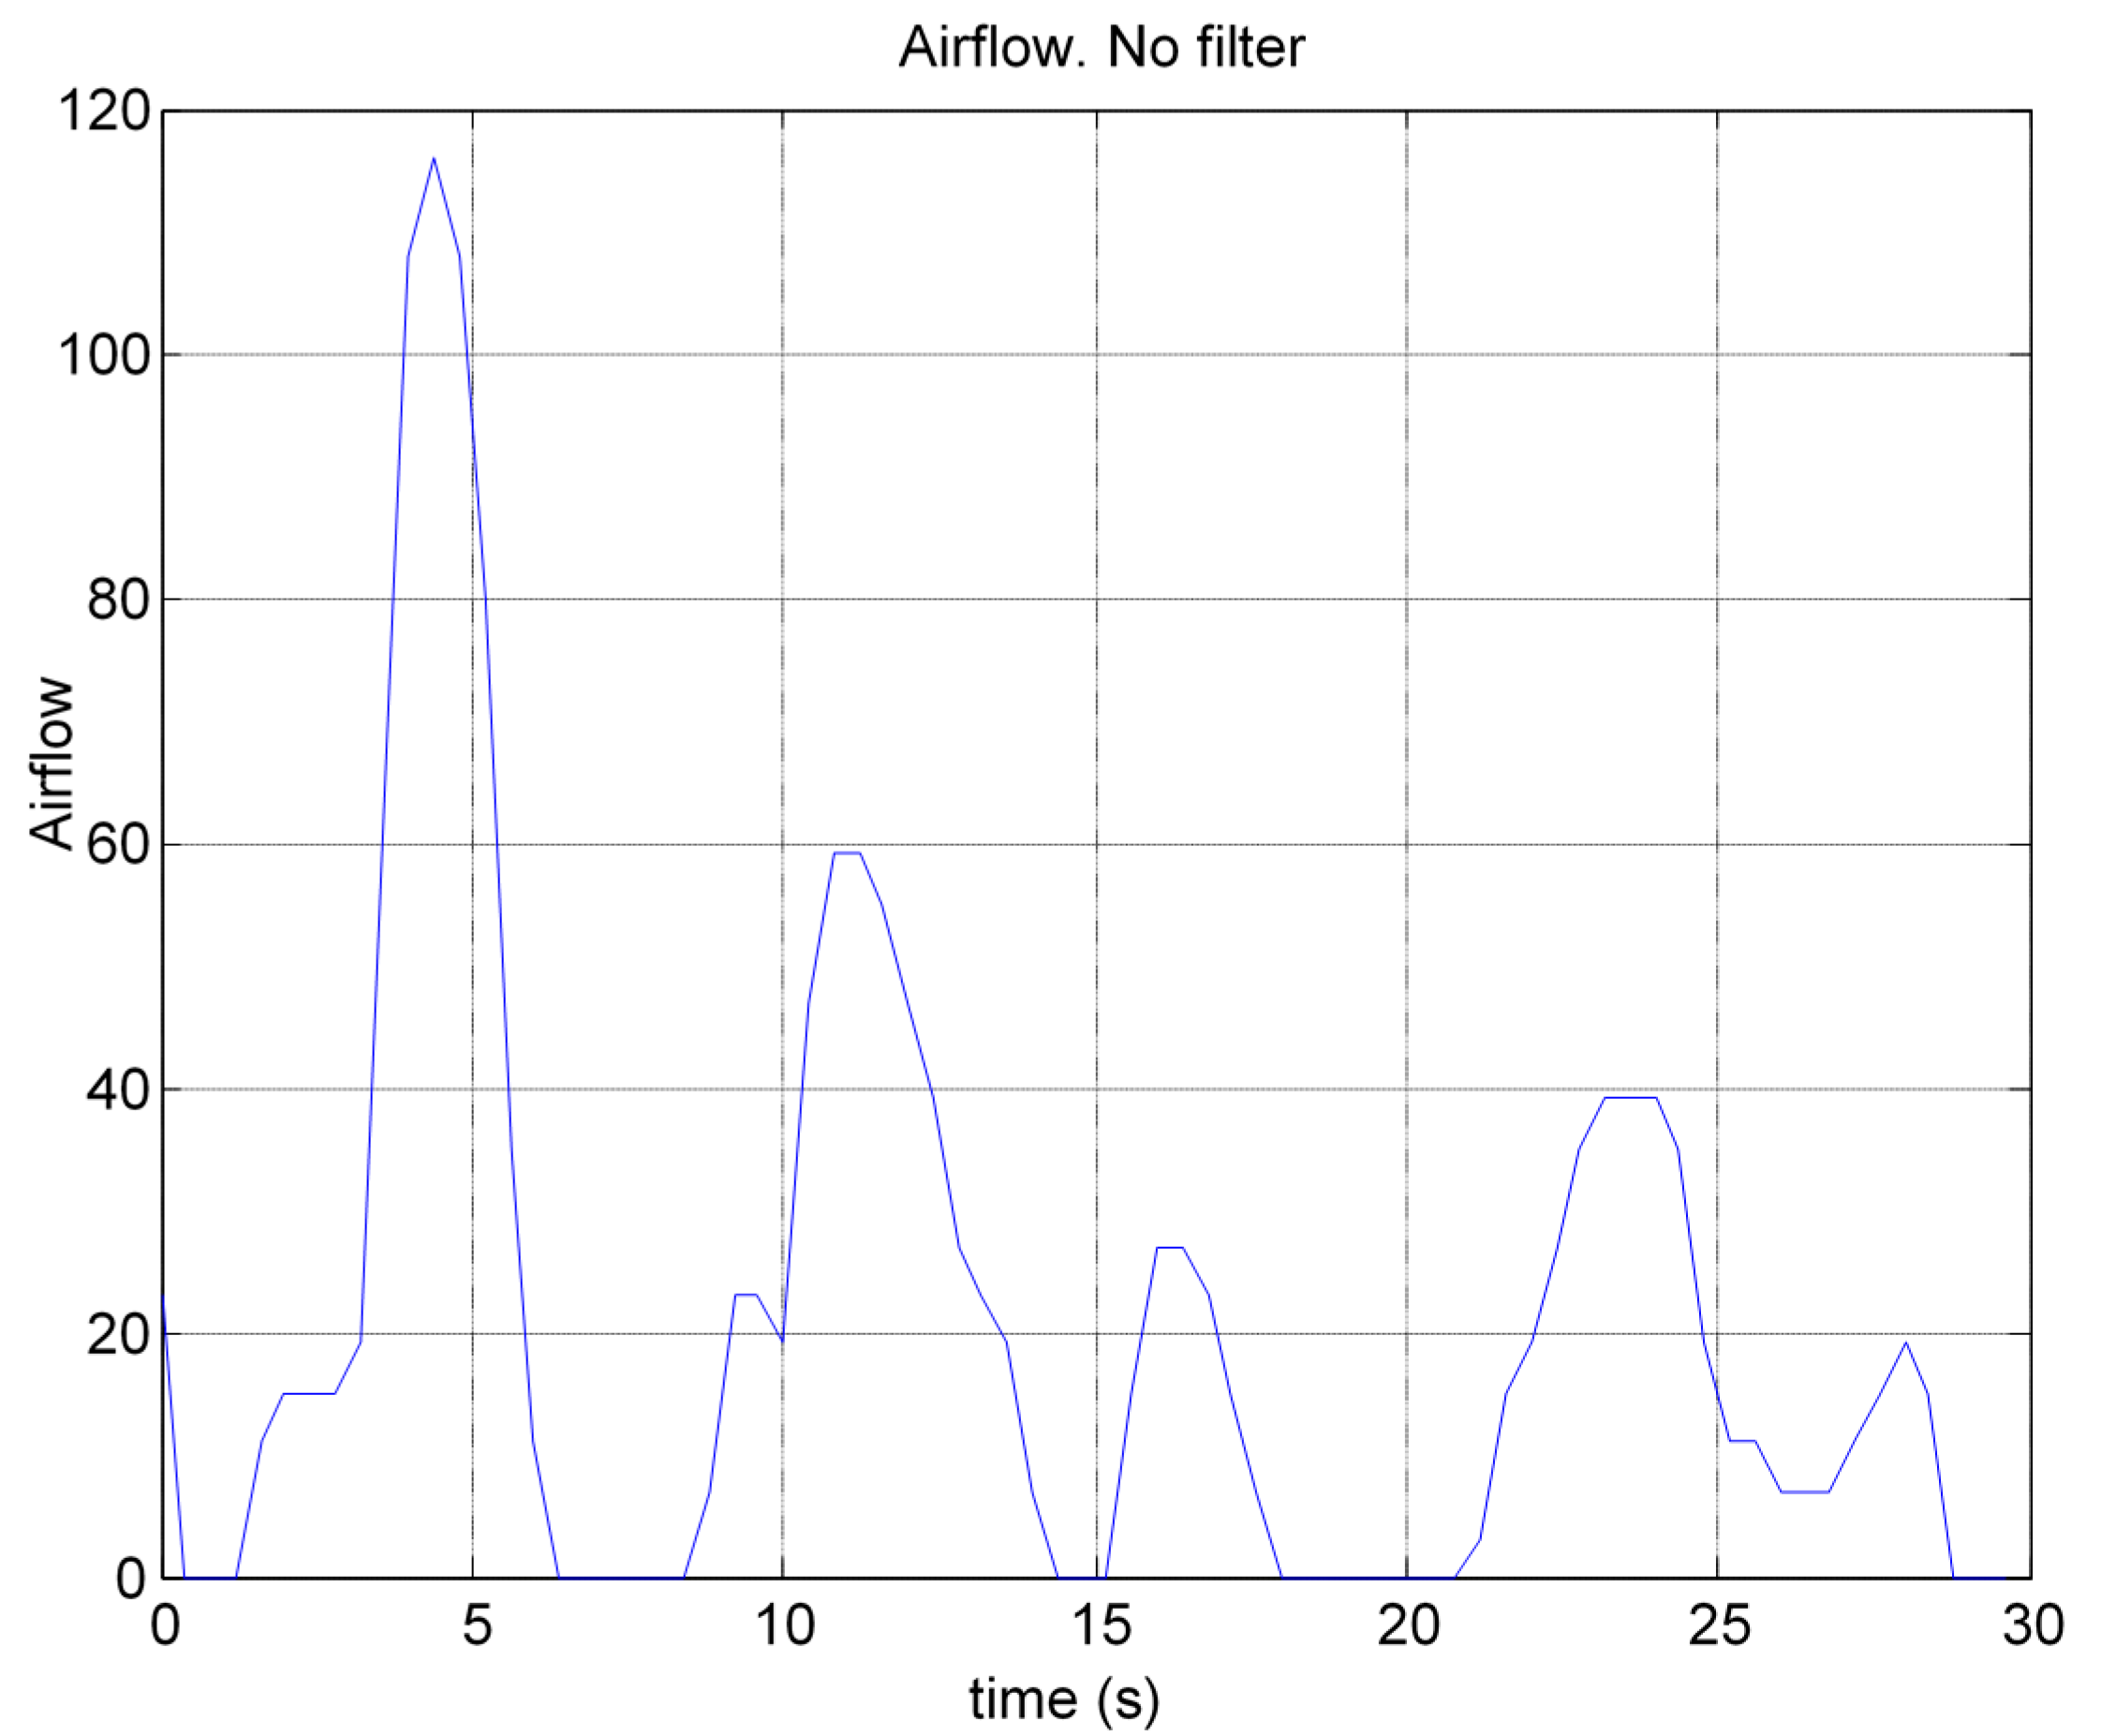
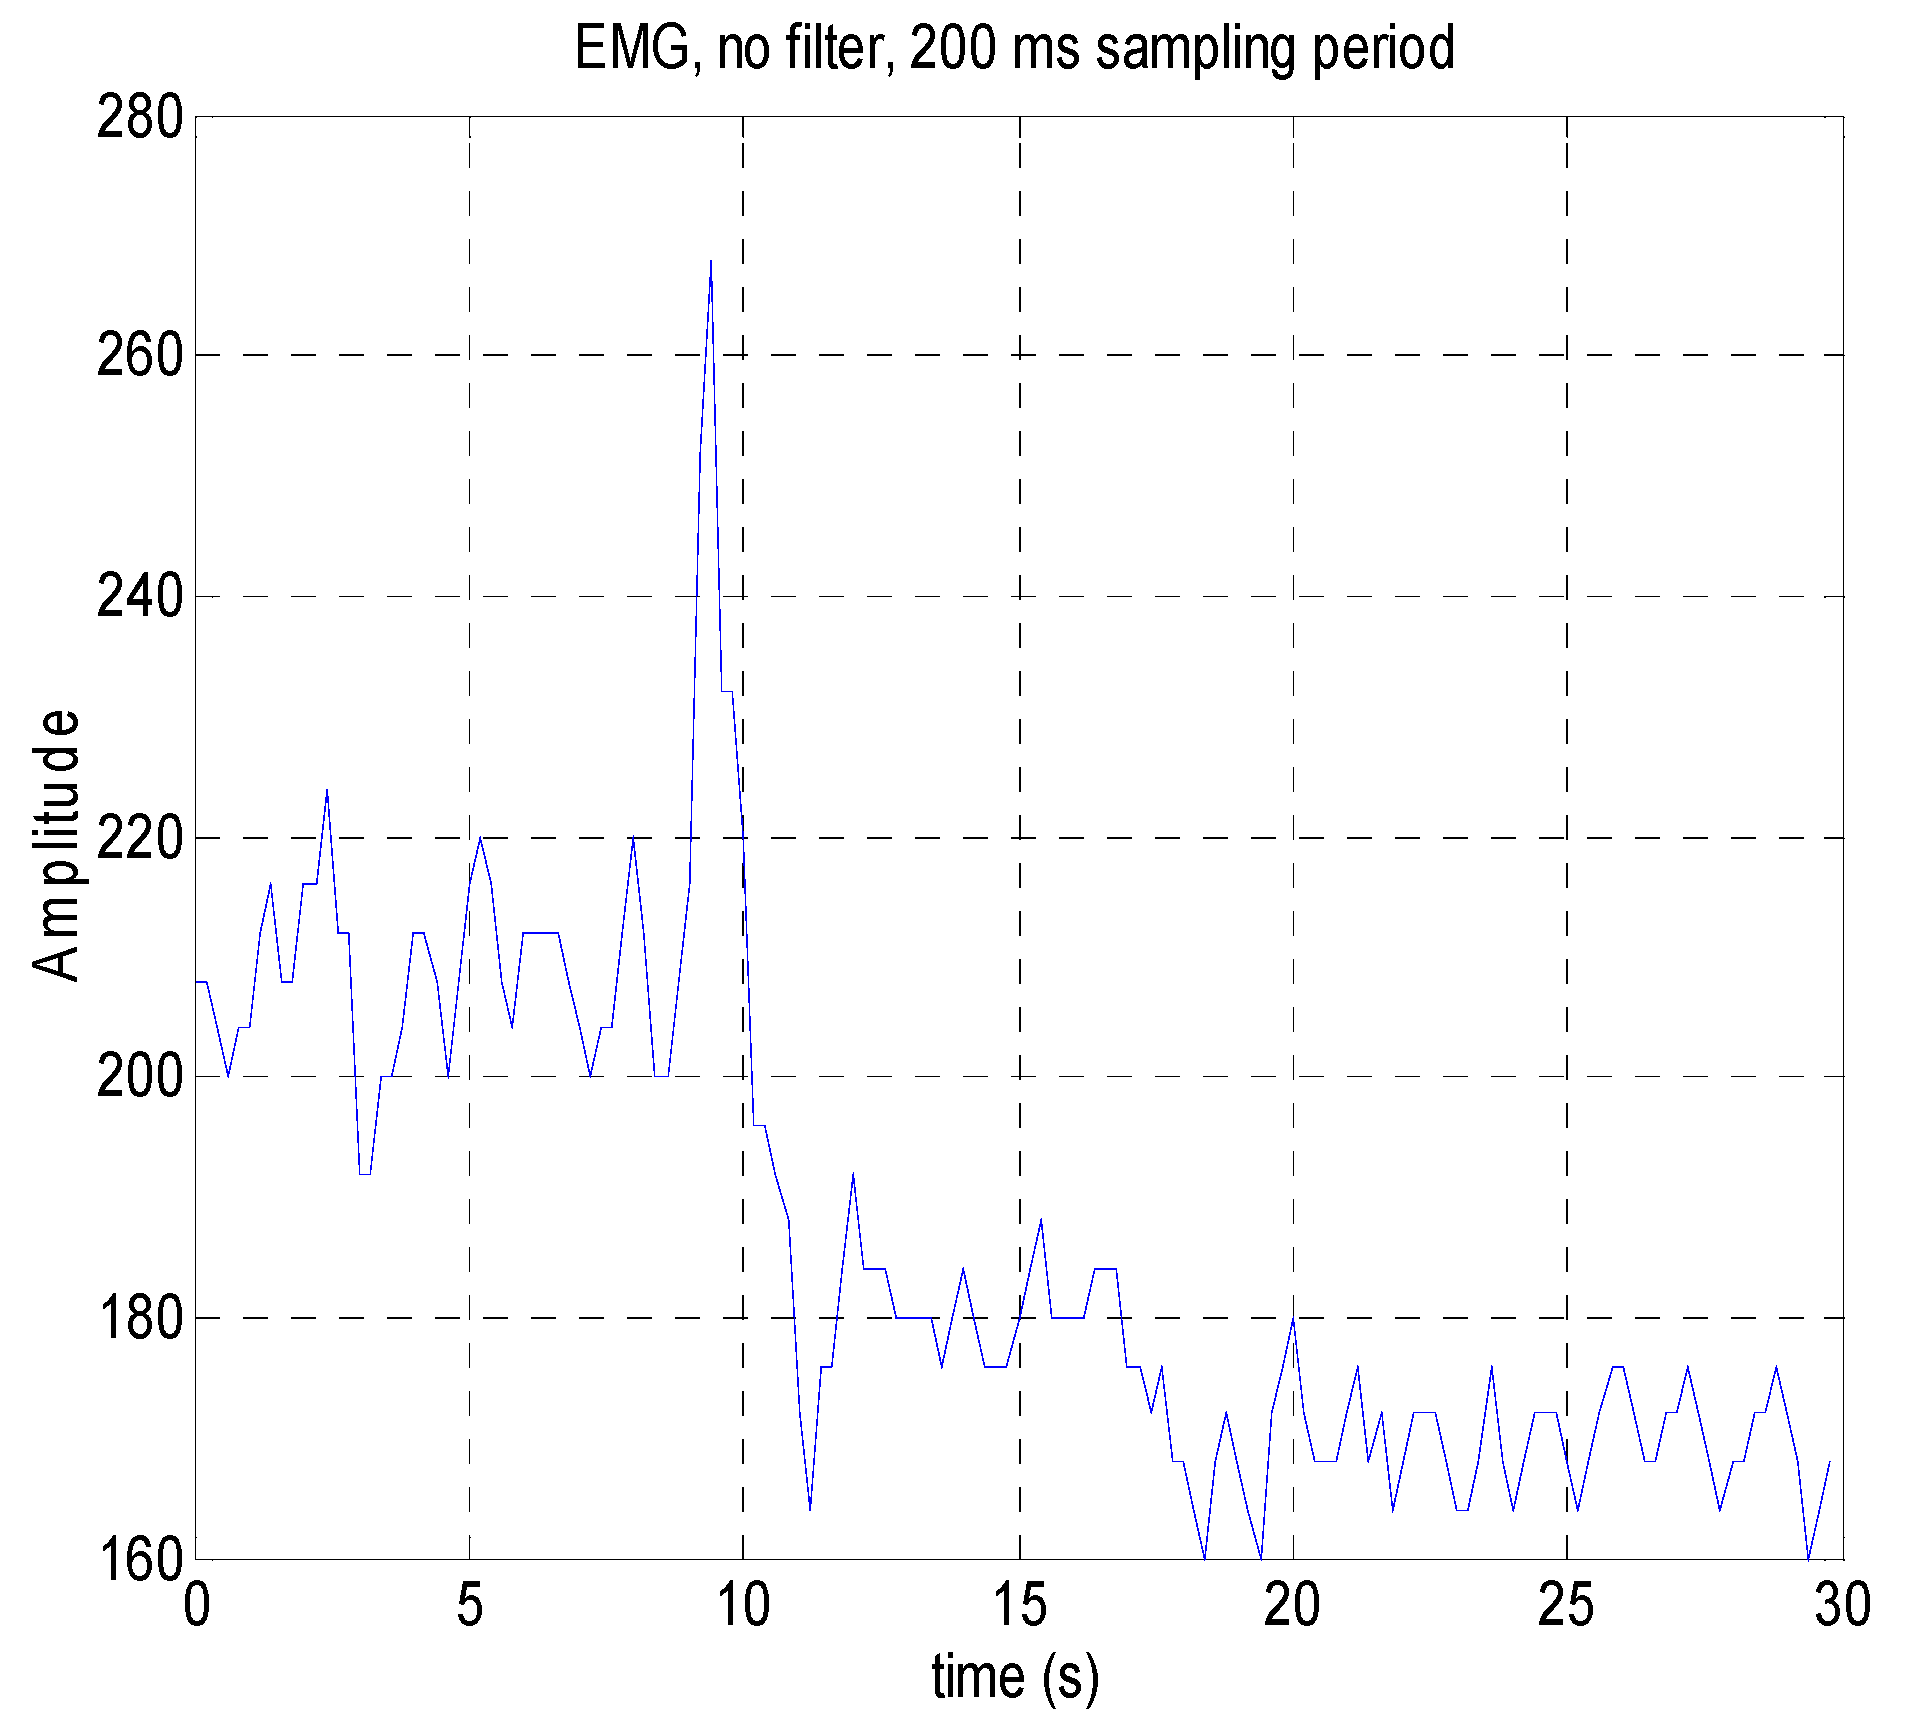
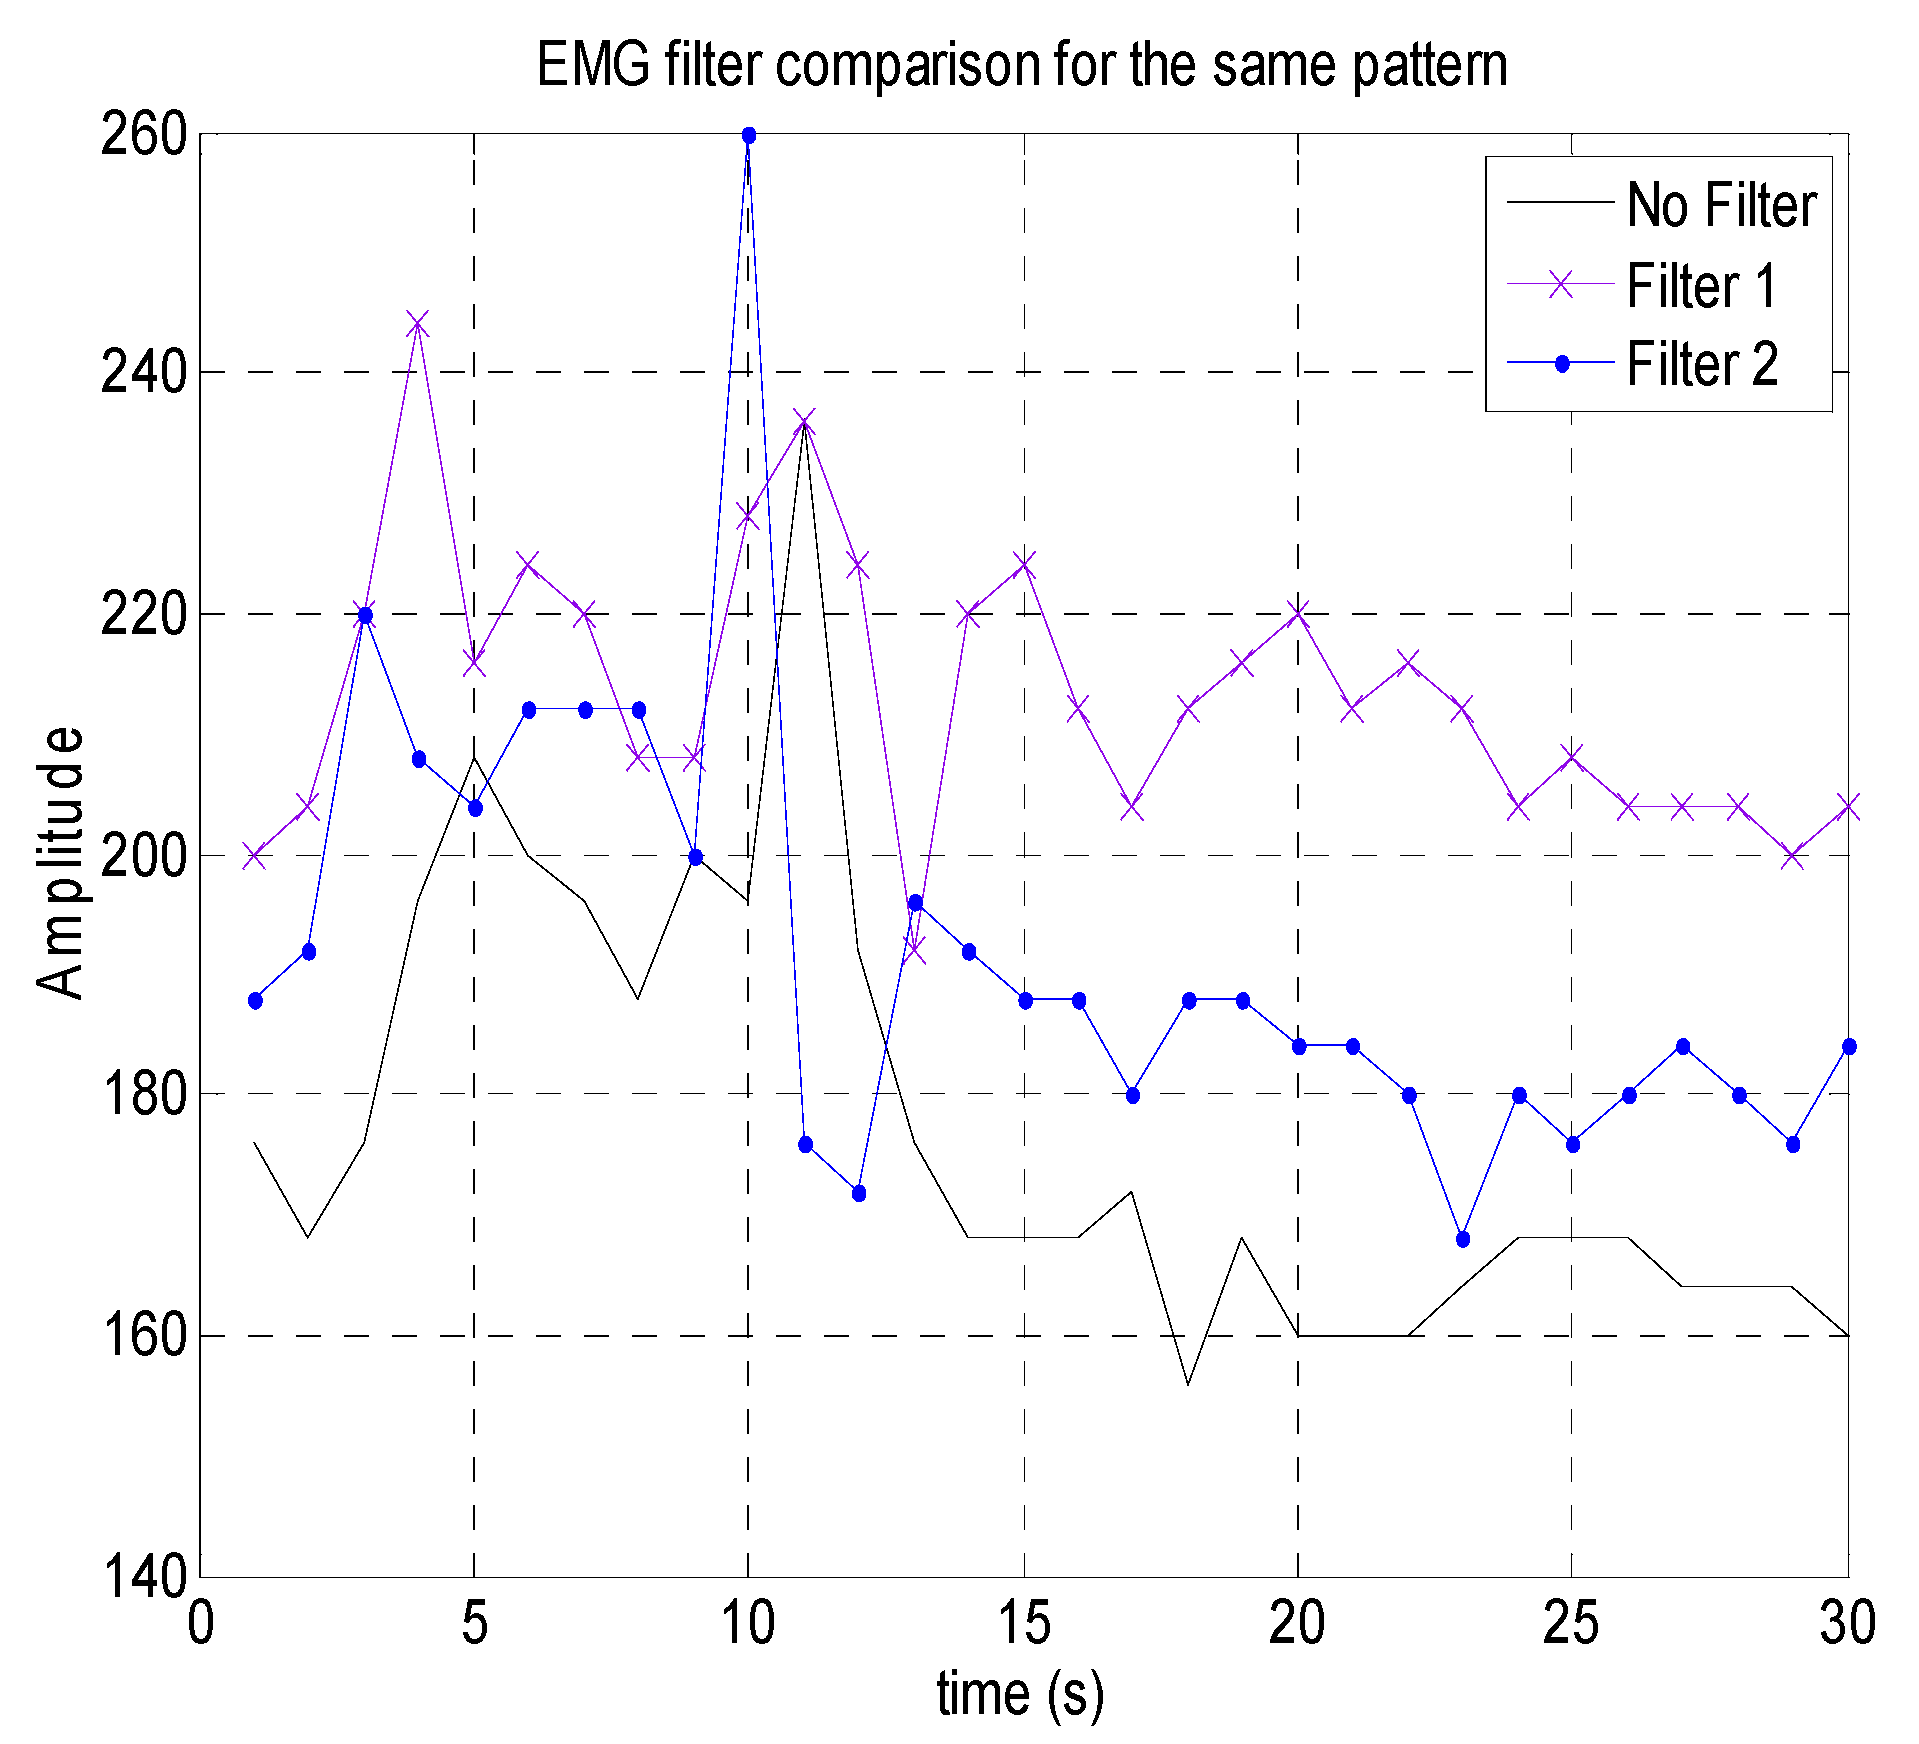
© 2019 by the authors. Licensee MDPI, Basel, Switzerland. This article is an open access article distributed under the terms and conditions of the Creative Commons Attribution (CC BY) license (http://creativecommons.org/licenses/by/4.0/).
Share and Cite
MDPI and ACS Style
Petrellis, N.; Birbas, M.; Gioulekas, F. On the Design of Low-Cost IoT Sensor Node for e-Health Environments. Electronics 2019, 8, 178. https://0-doi-org.brum.beds.ac.uk/10.3390/electronics8020178
AMA Style
Petrellis N, Birbas M, Gioulekas F. On the Design of Low-Cost IoT Sensor Node for e-Health Environments. Electronics. 2019; 8(2):178. https://0-doi-org.brum.beds.ac.uk/10.3390/electronics8020178
Chicago/Turabian StylePetrellis, Nikos, Michael Birbas, and Fotios Gioulekas. 2019. "On the Design of Low-Cost IoT Sensor Node for e-Health Environments" Electronics 8, no. 2: 178. https://0-doi-org.brum.beds.ac.uk/10.3390/electronics8020178
Note that from the first issue of 2016, this journal uses article numbers instead of page numbers. See further details here.