Underwater Robot Detection System Based on Fish’s Lateral Line


1
School of Mechatronic Engineering and Automation, Shanghai University, Shanghai 200444, China
2
CCCC Highway Consultants CO., Ltd., Beijing 100088, China
*
Author to whom correspondence should be addressed.
Electronics 2019, 8(5), 566; https://0-doi-org.brum.beds.ac.uk/10.3390/electronics8050566
Submission received: 16 April 2019
/
Revised: 12 May 2019
/
Accepted: 20 May 2019
/
Published: 22 May 2019
(This article belongs to the Special Issue Underwater Communication and Networking Systems)
Abstract
:This paper introduces the near-field detection system of an underwater robot based on the fish lateral line. Inspired by the perception mechanism of fish’s lateral line, the aim is to add near-field detection functionality to an underwater vehicle. To mimic the fish’s lateral line, an array of pressure sensors is developed and installed on the surface of the underwater vehicle. A vibrating sphere is simulated as an underwater pressure source, and the moving mechanism is built to drive the sphere to vibrate at a certain frequency near the lateral line. The calculation of the near-field pressure generated by the vibrating sphere is derived by linearizing the kinematics and dynamics conditions of the free surface wave equation. Structurally, the geometry shape of the detection system is printed by a 3D printer. The pressure data are sent to the computer and analyzed immediately to obtain information of the pressure source. Through the experiment, the variation law of the pressure is generated when the source vibrates near the body, and is consistent with the simulation results of the derived pressure calculation formula. It is found that the direction of the near-field pressure source can distinguished. The pressure amplitude of the sampled signals are extracted to be prepared for the next step to estimate the vertical distance between the center of the pressure source and the lateral line.
1. Introduction
Recently, a great deal of research about underwater vehicles has been conducted by researchers around the world. Underwater vehicles have been applied in the areas of marine resources exploration, dam exploration, underwater rescue and so on [1]. Great progress has been made in the mechanical design and motion control of underwater vehicles. Additionally, the underwater vehicle’s perception of the environment is also an important focus [2]. Any change under the water will directly determine whether the vehicle can work properly because of the particularity and complexity of the underwater environment. Therefore, underwater vehicles equipped with the sensing system can provide us with flow information and have applications in the detection of incoming current [3] or incoming objects, such as walls and other obstacles [4].
Recently, different sensing systems have been equipped on the underwater vehicles. At present, sonar and vision systems are mostly used to detect underwater targets and locate them. However, blind areas exist in sonar detection, and it is not suitable in close-range operations [5]. Due to the refraction and scattering of light, the underwater images obtained by the visual image method have the disadvantages of distortion and low contrast [6]. Additionally, a Doppler analyzer is too heavy and expensive to use on small underwater vehicles [7]. Due to these limits, how underwater vehicles perceive the changes of water flow at a close range, detect underwater targets, and accomplish underwater tasks more accurately are urgent problems to solve.
Now, researchers are focusing more attention to the movement and perception mechanism of fish. Fish can survive in the complex marine environment for long periods of time, without being affected by the rapidly changing flow. It was found that fish possess a unique organ called lateral line that consists of superficial neuromasts and canal neuromasts [8]. Owing to this, fish can detect prey, steer clear of obstacles, and avoid predators [9].
To imitate perception mechanism of fish’s lateral line, many artificial lateral line sensors have been fabricated. There are two types of structure including a hair-like structure based on a cantilever beam and flat structure [10]. For example, Ahmad Dagamseh et al. designed a hair-based flow sensor to imitate the lateral line sensor in fish and determined flow velocity of dipole fields [11]. Asadnia et al. developed flexible and surface-mountable arrays of MEMS artificial hair cell flow sensors and used them localize an underwater dipole stimulus [12]. Fernandez et al. developed a MEMS pressure sensor array in a flat structure and demonstrated the discrimination between moving cylindrical obstacles of circular and square cross sections [13]. Asadnia et al. presented thin-film piezoelectric pressure sensor arrays to locate underwater objects which are packaged on a flexible liquid crystal polymer substrate [14]. DeVries et al. combined IPMC sensors and embedded pressure sensors to form closed-loop control and tested to estimate flow rates, angles of attack, and the relative position of upstream obstacles [15]. Additionally, many researchers selected off-the-shelf pressure sensors. For example, Venturelli et al. selected the MS5407-AM sensor and determined that a distributed pressure sensing mechanism has the capability to discriminate Karman vortex streets from uniform flows [16]. Wei Wang et al. chose pressure sensors CPS131 and verified that this artificial lateral line can detect its neighboring robot and the distance between the robots [17]. Freescale MPXV7007 pressure sensors were chosen to identify the angle of attack of the underwater vehicle relative to the incoming flow for control feedback [18]. SM5420C-030-A-P-S piezoelectric pressure sensors were selected to realize velocity estimation [19].
In this paper, motivated by the lateral line of fish, a new kind of near-field detection system is proposed. The shape of underwater robot is designed and printed by a 3D printer. To detect water pressure, eight piezoelectric sensors were placed on the side of the underwater robot. The direction of the pressure source can be calculated from the feedback data of the sensor. When compared to commercially available underwater robots, the fish-like robots are mimicking real fish, and have less impact in marine life. Have better maneuverability and generate less acoustic noise than propeller driven underwater robots. The underwater vehicle which is equipped with this fish lateral line sensory system can be applied to detect impending walls, approaching obstacles and other target objects. These objects can be detected by analyzing the pressure distribution obtained from the sensory system. The underwater vehicle with the fish lateral line and the application scenes are shown in Figure 1.
2. Sensing Mechanism of the Fish Lateral Line
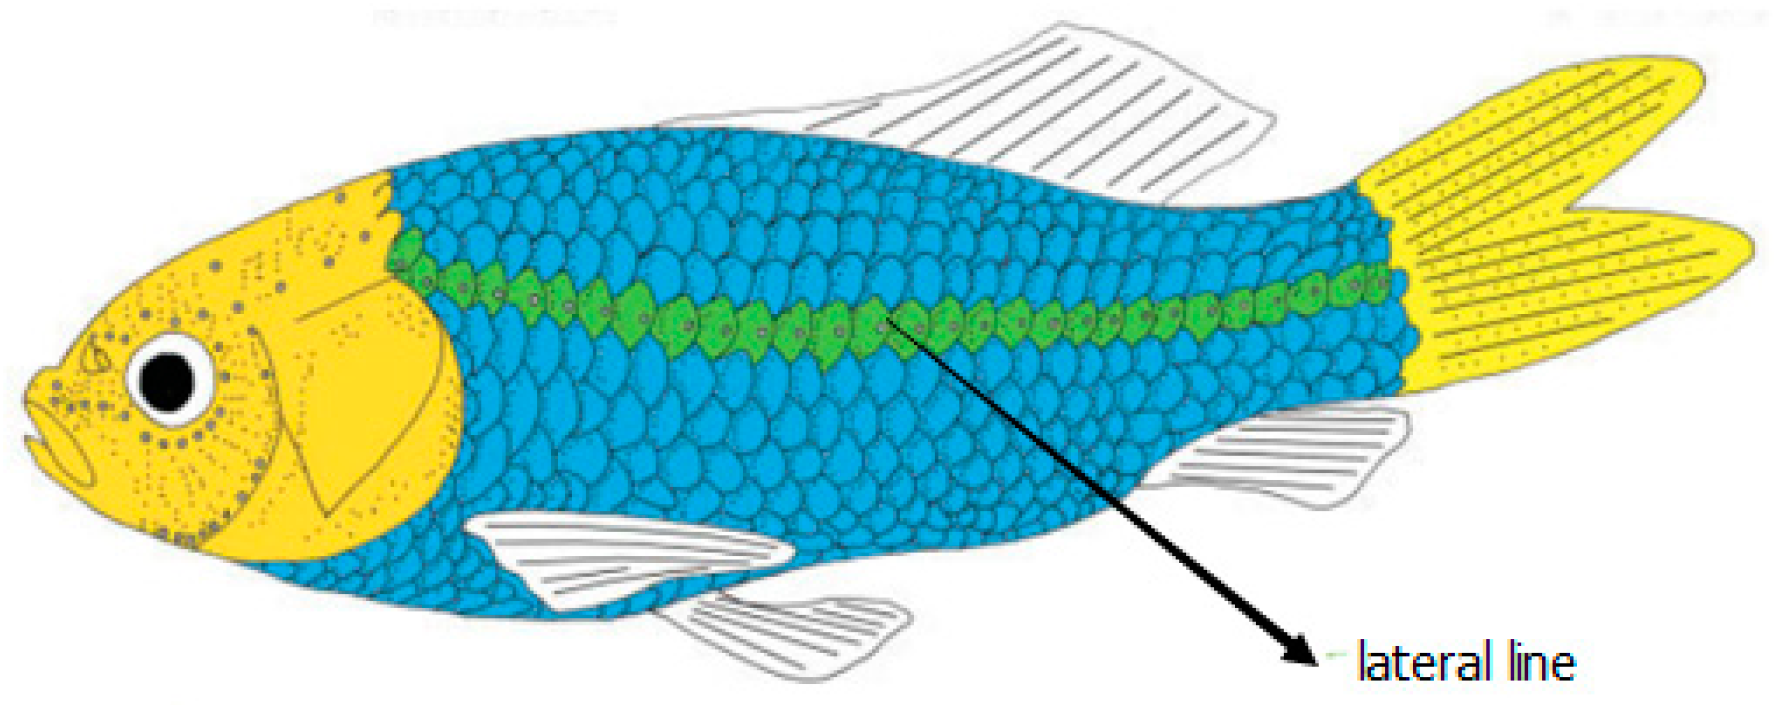
Fish in darkness still show excellent abilities in swimming because they have an incomparable perception system that is the lateral line. The basic sensory unit of the lateral line is the neuromast. The neuromasts are distributed along the fish’s head and body. The neuromasts have two forms: the superficial neuromast and the canal neuromast. Firstly, the superficial neuromast stands on the skin of fish and protrudes directly to the open water. The superficial neuromast respond to flow variations. Secondly, the canal neuromasts are open to the external flow field through a series of pores at a small distance and are enclosed in the fluid filled canals. The flow motion drives a pressure difference between successive pores and stimulates the canal neuromast [20]. This sensing mechanism provides a new perspective for researchers and engineers to build such a sensing system that could be used in the field of underwater environmental sensing for manned or unmanned underwater vehicles. The distribution of fish lateral lines is shown in Figure 2 [21].
According to the unique mechanism of the pressure gradient sensed by the lateral line, an array of commodity piezoelectric pressure sensors is utilized to be the sensing platform on the underwater vehicle to act as the fish’s lateral line. Our aim is to capture the near-field flow feature generated by a source by recording and analyzing the measured pressure data.
3. Prototype and Experimental Block Diagram
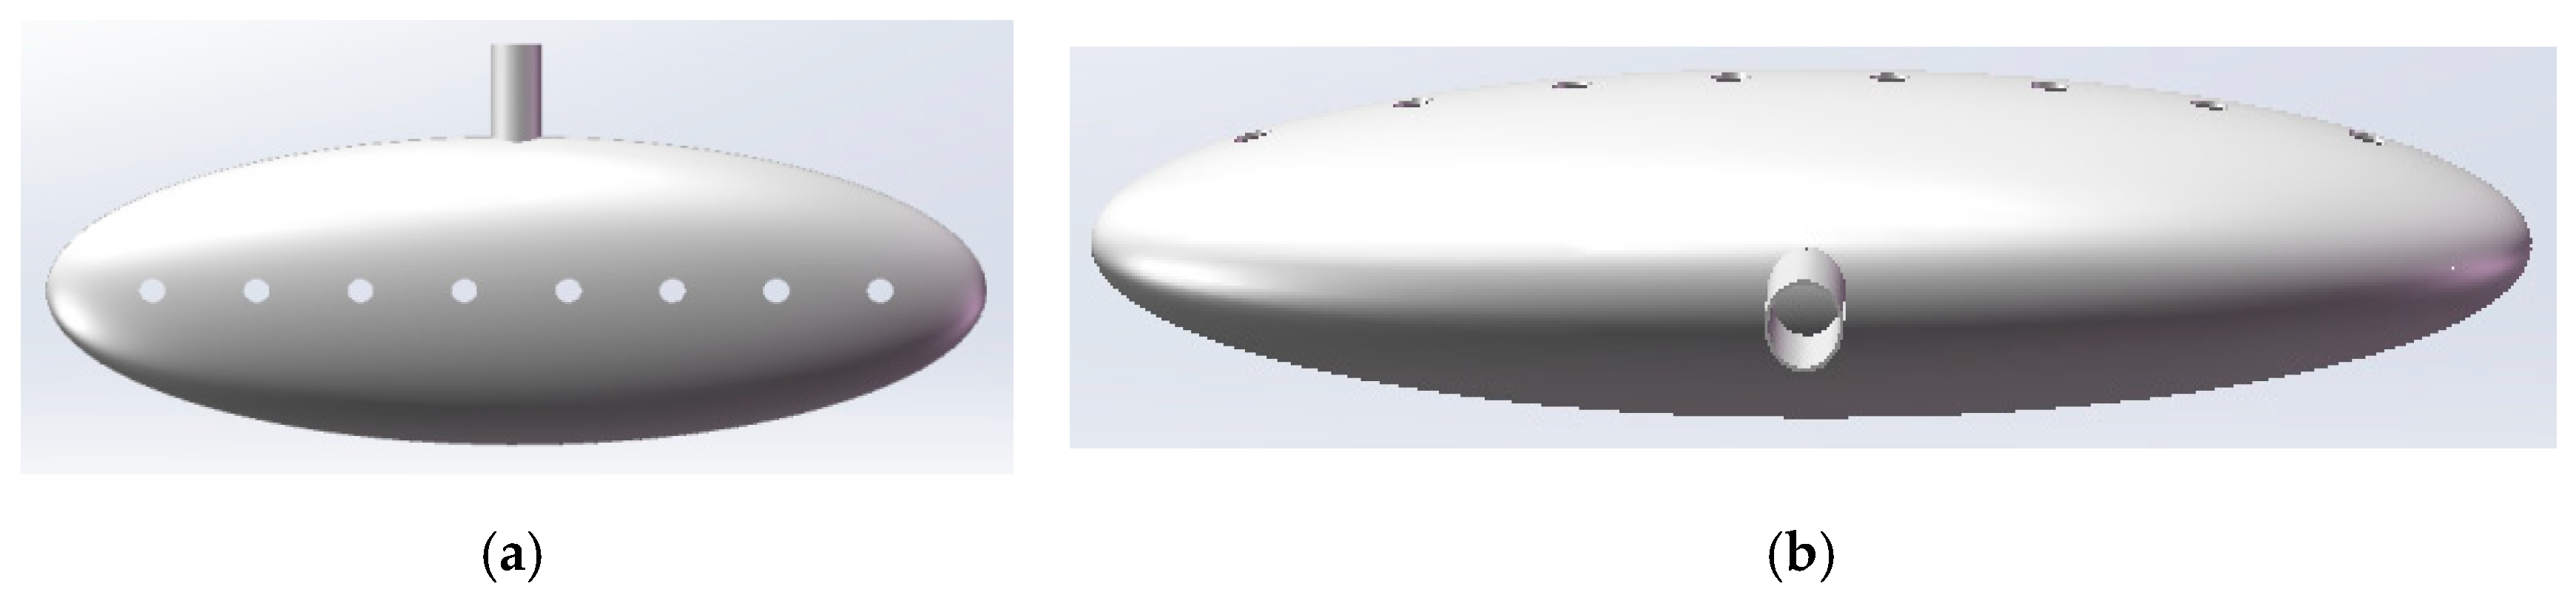
The lateral line detection system in this work consists of a 36 cm long, fish-shaped body with eight piezoelectric pressure sensors. Eight pressure sensor nodes are distributed on the body surface to act as the fish’s lateral line. These pressure sensors are evenly and symmetrically distributed with a horizontal spacing of 40 mm and an aperture of 10 mm. When an object creates disturbing ripple pressure in the water, the each sensor can detect different pressure values. Then, through analysis and calculating the obtained pressure values, a simple mathematical model is built. The pressure source direction and distance can be determined. The detailed specifications of the pressure sensor are discussed in Section 5. Here, the shape is simplified and the caudal and pectoral fins are not considered. The outline drawing of the body designed symmetrically in Solidworks (Solidworks is a solid modeling computer-aided design (CAD) and computer-aided engineering (CAE) computer program that runs on Microsoft Windows. SolidWorks is published by Dassault Systemes. Based in Waltham, MA, United States.) is shown in Figure 3. The cross-section and longitudinal section of this shape are elliptic. It is convenient to import the user-defined shape into a 3D machine to print. The Solidworks model with sensor distribution is shown in Figure 3. The dimension is listed in Table 1.
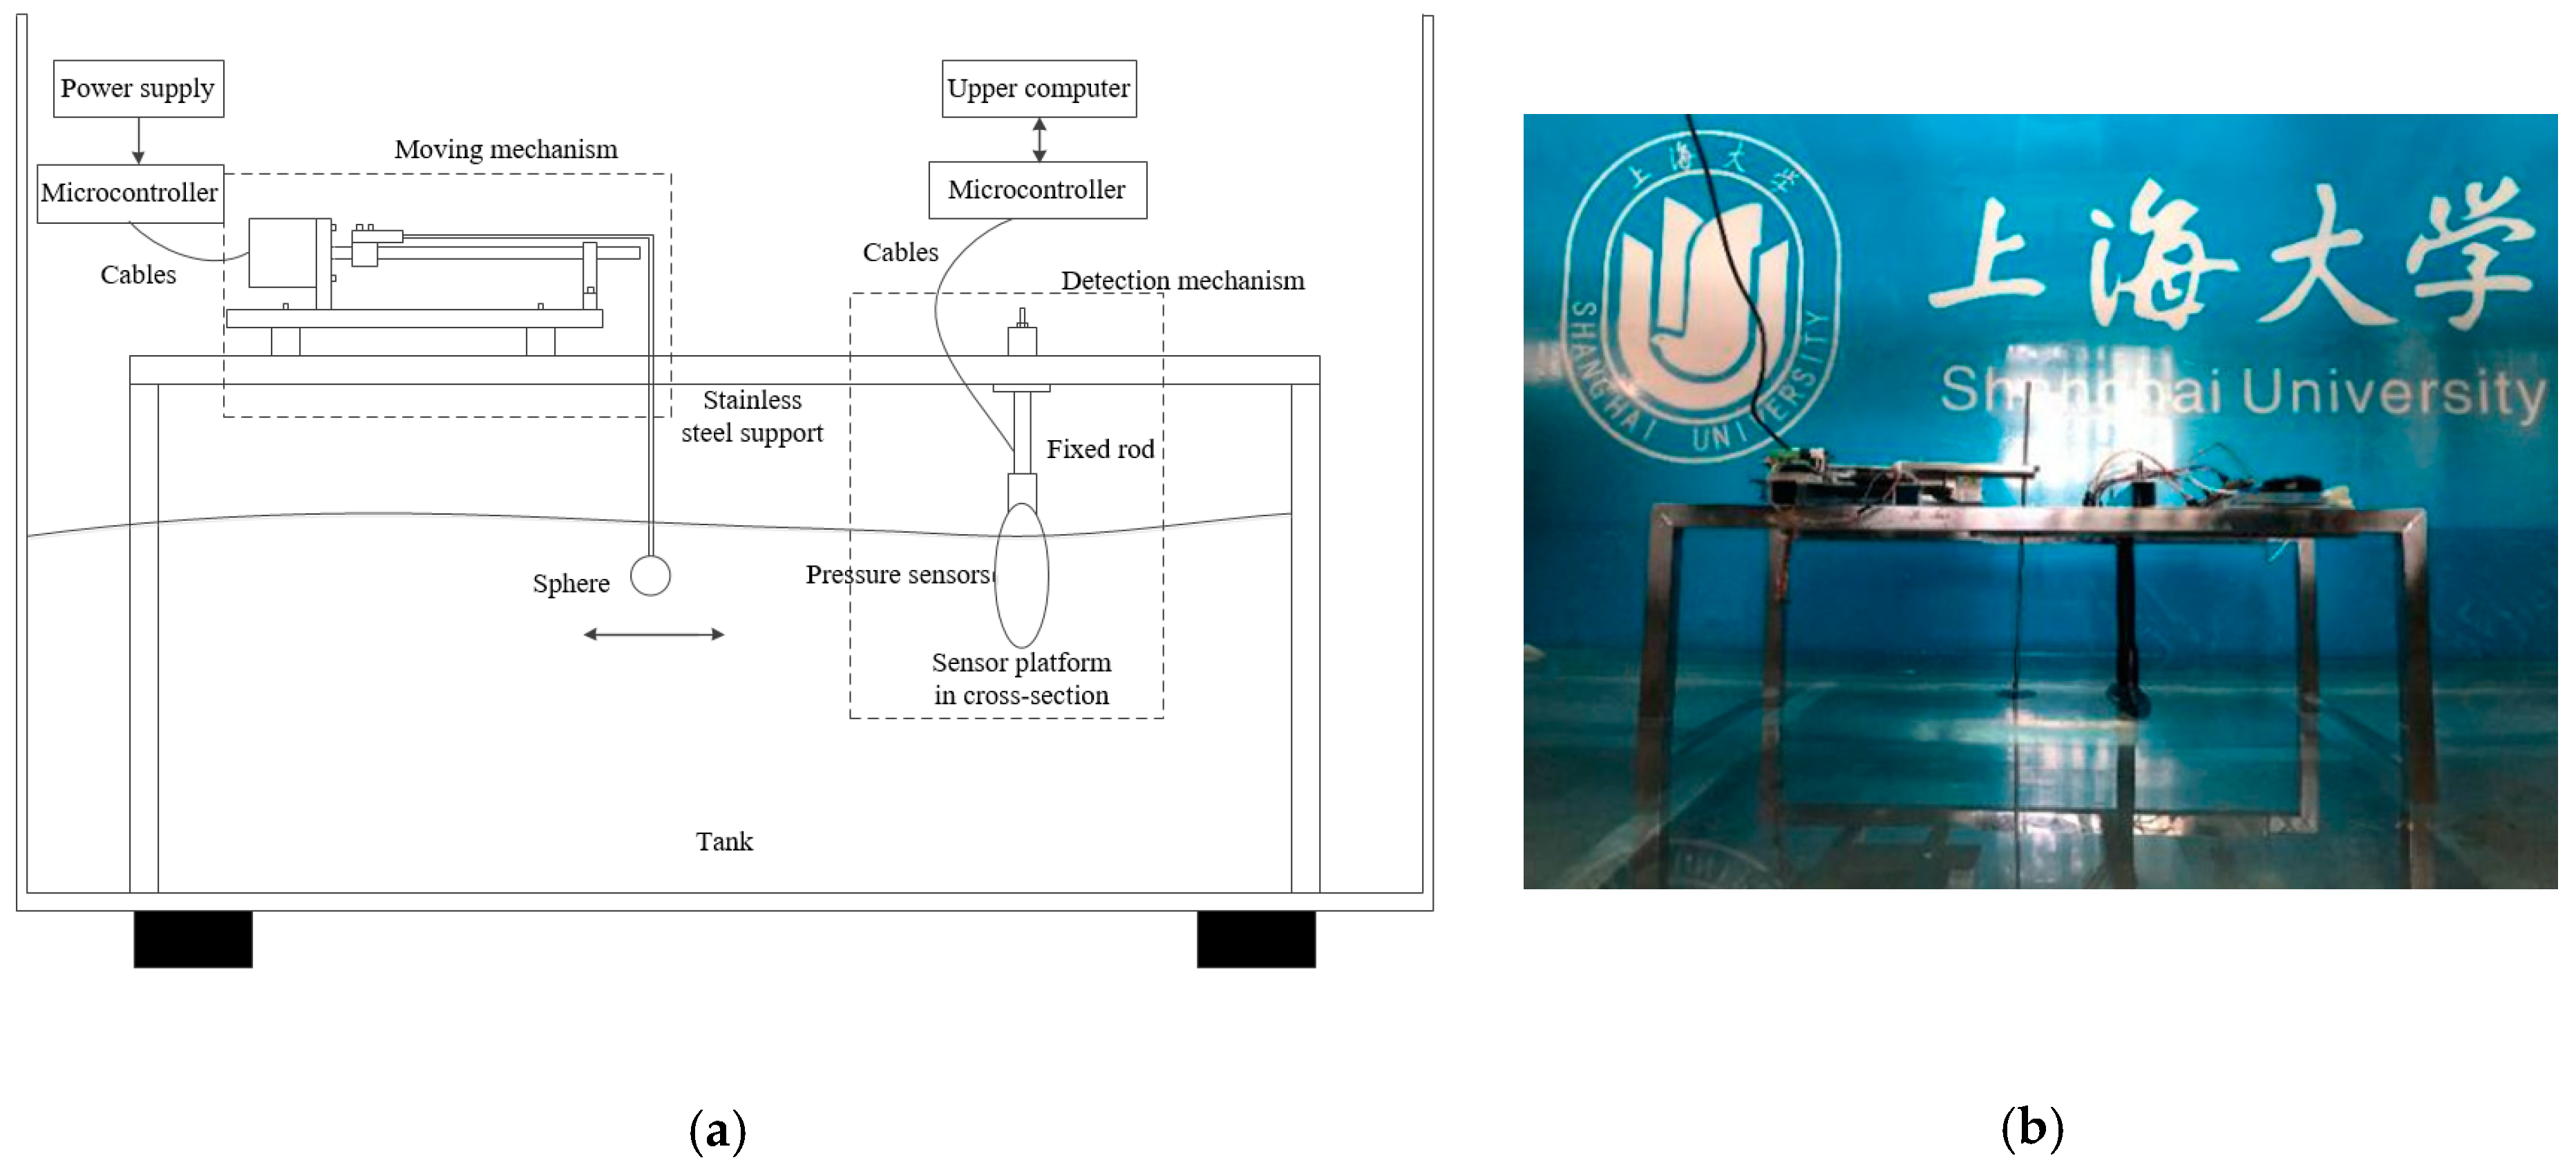
Eight pressure sensors are embedded into the holes one by one and sealed with 703 soft silicone to waterproof. After cooling, sensors are connected and silicone DuPont lines are led out. Then the prototype is fixed on the stainless-steel bracket with a thin rod to ensure that the underwater vehicle does not shake back and forth when it is impacted by water waves. The micro-controller is connected to the pressure sensors and the computer. The stepper motor driving the ball screw is used as a moving mechanism and controlled by a micro-controller via the control port. The stepper motor is powered by the switching power supply. The sphere is driven by the motor back and forth. It is necessary that the strength of the rod is sufficient to ensure no deformation during movement. The block diagram of experimental principle and picture is shown in Figure 4.
4. Problem Formulation
Fish can detect disturbances in the water flow using its lateral line organs. The most commonly used form of disturbance in the research is simulated by vibrating sphere motion [22,23]. In this work, we also consider that a potential flow is generated by a vibrating sphere. The research problem is transformed into the localization of a sphere. It is assumed in this work that the flow is incompressible, inviscid, and irrotational. The nonlinear kinematics and dynamics conditions of the free surface wave equation are linearized [24]. The equations of linear waves include:
Equation (1) is the fundamental equation of incompressible fluid where ϕ denotes velocity potential. Equation (2) is a linear equation of free surface condition. denotes pressure difference between actual pressure and hydrostatic pressure; denotes the water density; denotes gravitational acceleration; denotes the distance to water surface. According to these, we obtain a mathematical solution of the near-field fluid pressure.
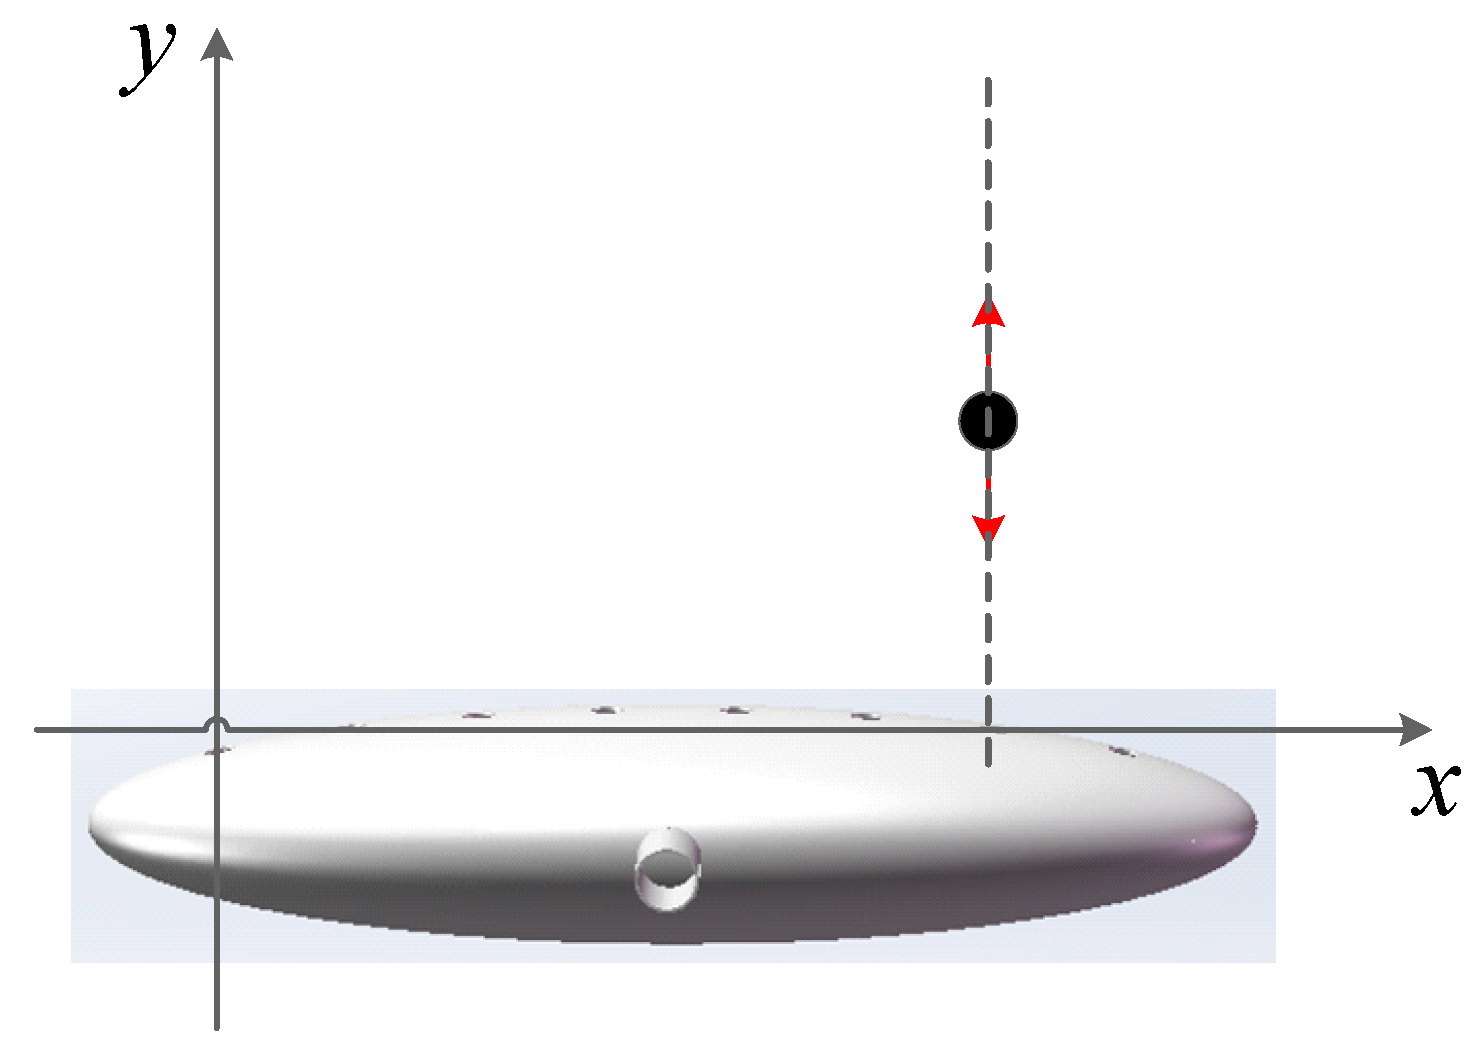
To ease the discussion, we consider the condition that the lateral line sensor and the vibrating sphere are located in the same plane (xoy plane), which is shown in Figure 5. As depicted in Figure 5, the center position of sphere source is . The sphere vibrates at the amplitude of X0 and frequency w, and the displacement from equilibrium is denoted by . The vibration direction is shown by the red double arrow, which is vertical to the lateral line sensors. The position of sensor i is given by . is distance between the sensor i and sphere’s center, which is . is the angle between vibration axis and [25].
The velocity potential ϕ is a scalar function. At a point on the plane, it can be expressed as:
which is widely adopted in [26,27,28]. Substituting the parameters into Equation (3), the velocity potential ϕ is given by:
where a is the radius of vibrating sphere.
Substituting the parameters into Equation (2), we get that:
and:
Thus, the pressure calculation of the near-field generated by the vibrating sphere is obtained by:
When , Equation (7) becomes:
It is noted here that is the pressure difference between actual pressure and hydrostatic pressure.
5. Design of Control System
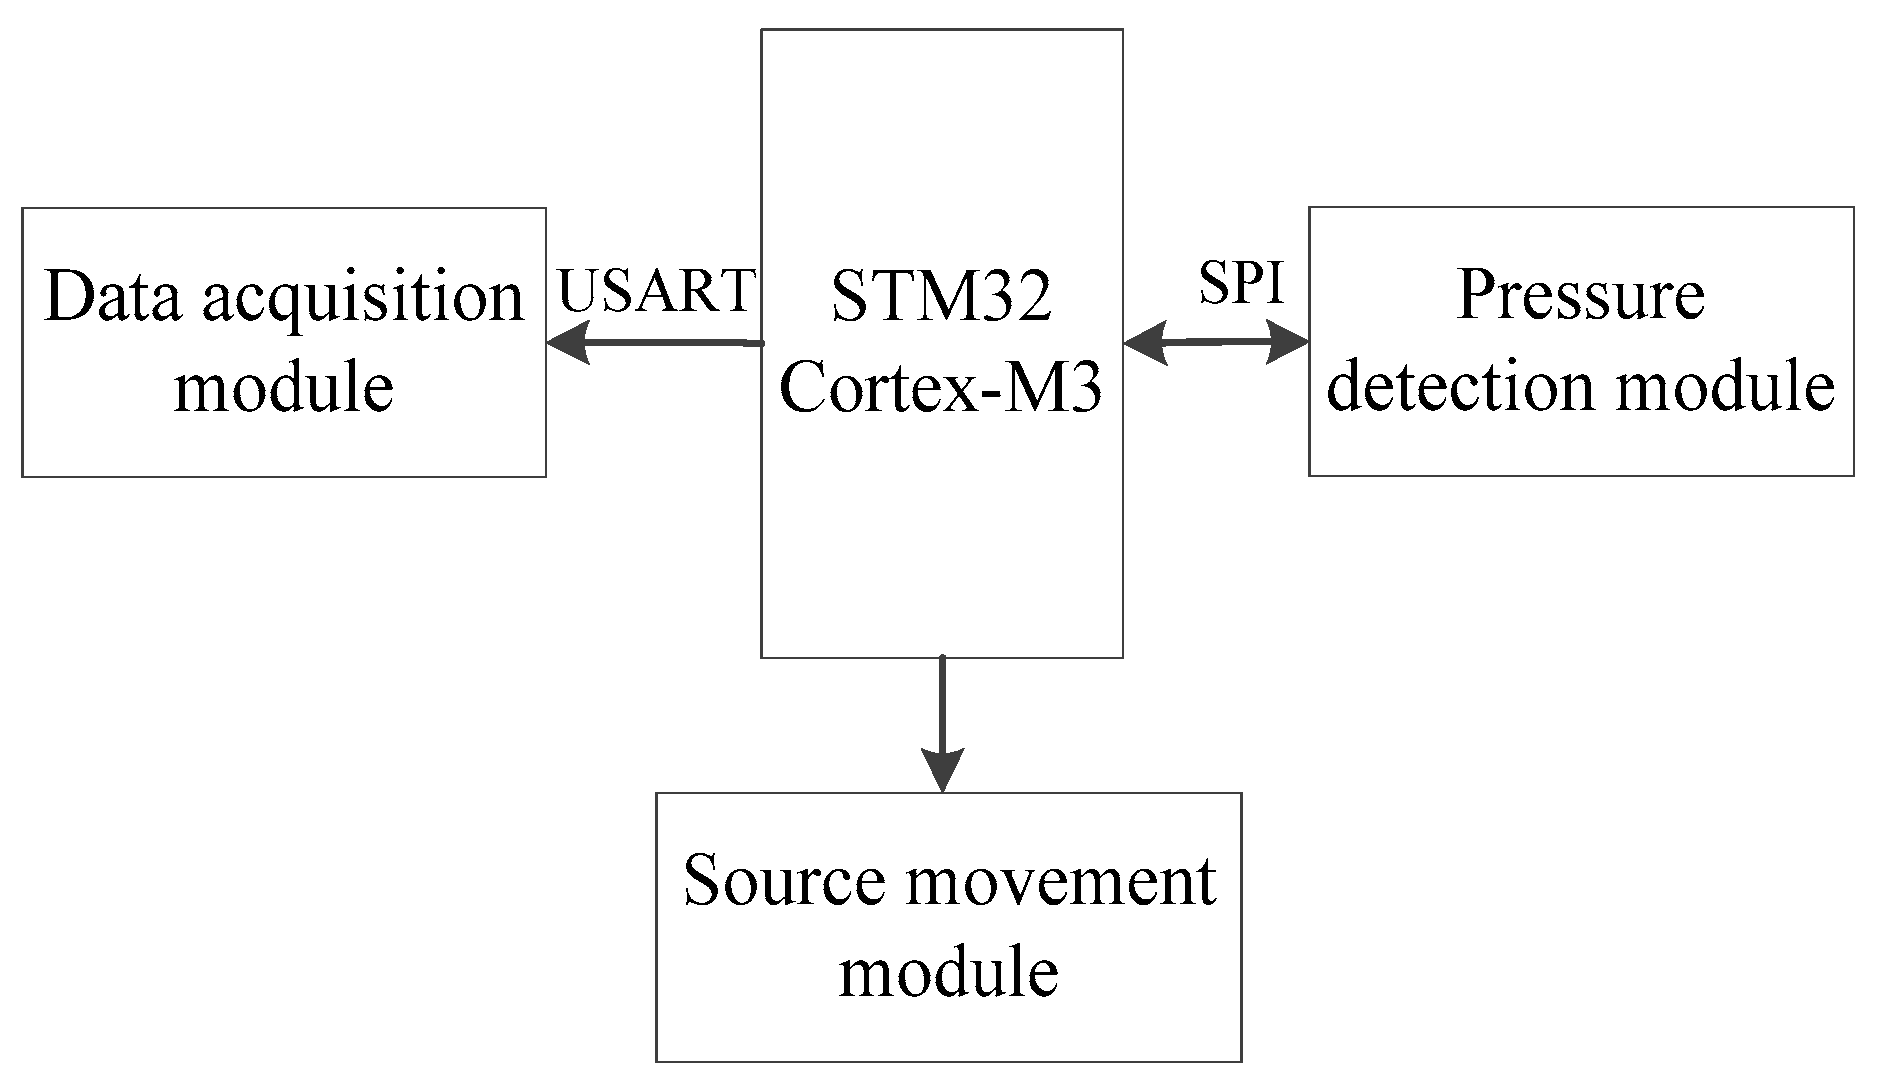
The control system of the near-field detection system of underwater vehicle is composed of a micro-controller, a pressure detection module, a source movement module, and a host computer data acquisition module. After the selection of the micro-controller and the pressure sensor, the circuit construction and PCB design are performed. The software design mainly includes pressure data transmission and the control of the moving mechanism. The pressure data is sent to the computer for processing and analysis. The control system block diagram is shown in Figure 6.
5.1. Hardware Design
This section is mainly to complete the hardware design of the close detection system including the selection of the micro-controller and pressure sensors, and the design of the source movement module.
5.1.1. Micro-Controller
In this paper, we select a STM32F207ZGT6 micro-controller whose core is Cortex-M3. The micro-controller has rich resources. The main frequency satisfies the SPI communication frequency of the pressure sensor. The pressure sensor can be conveniently controlled through the SPI or I2C communication interface. The high-speed DMA function is adopted to quickly transfer the collected pressure data to the upper computer software for data analysis. Therefore, STM32F207ZGT6 fully meets the requirements of the experiment.
5.1.2. Pressure Sensor
As the sensing element underwater, the determination of the sensor is the key to the underwater robot detection system. We choose the piezoelectric pressure sensor MS5803-05ba [29].
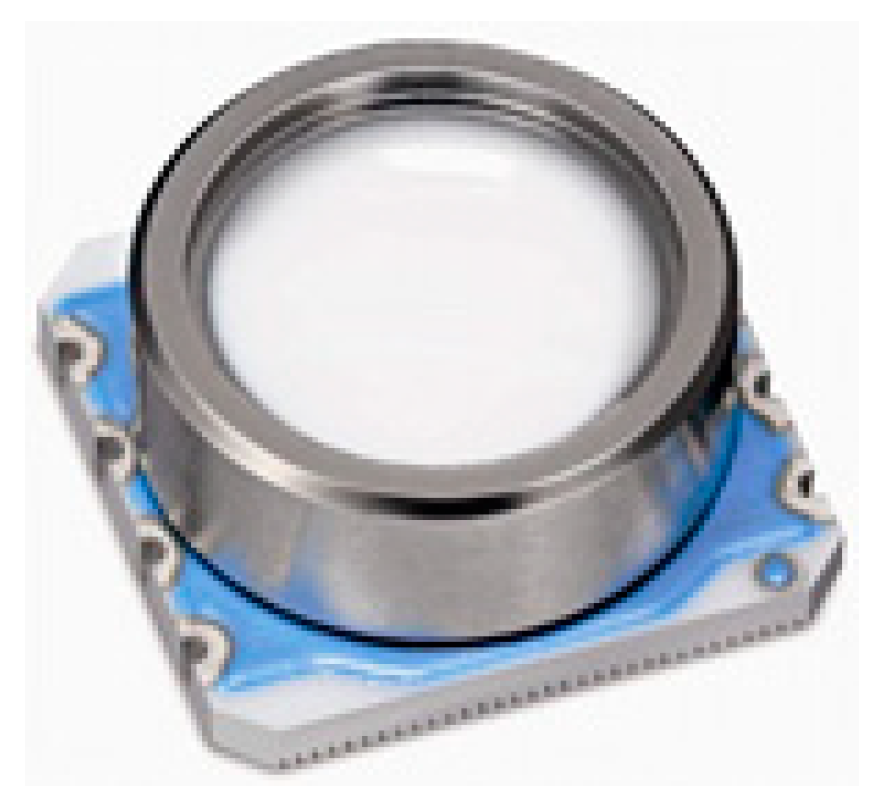
The MS5803-05BA miniature pressure sensor is a new generation of high-resolution pressure sensors from MEAS Switzerland with SPI and I2C interfaces. The size is 6.2 × 6.2 × 2.88 mm, which occupies less space and is easy to install. Waterproof rubber and an anti-magnetic stainless-steel ring guarantee the sensor waterproof performance. The MS5803-05BA provides high-precision 24-bit pressure and temperature digital output. The conversion speed and power consumption can be configured according to the application demand. The specifications of this pressure sensor are listed in Table 2. Figure 7 is a real object of MS5803-05BA.
After temperature compensation and A/D conversion, the sensors and STM32F2 are communicated through the SPI interface. The pressure data is sent to the STM32F2 for processing. The clock of the SPI1 is obtained by dividing the frequency by eight.
5.1.3. Source Movement Module
At present, vibrating spheres are widely used in the study of fish lateral lines. This type of stimulus can imitate underwater small objects. In this paper, we also take the vibrating sphere as the prototype of the pressure source. The movement of the sphere is used in the experiment as the pressure source.
In the moving mechanism, a stepping motor driving the ball screw converts the rotation of the motor into a linear motion. The sphere is connected to the moving mechanism and moves left and right.
5.2. Pressure Data Acquisition
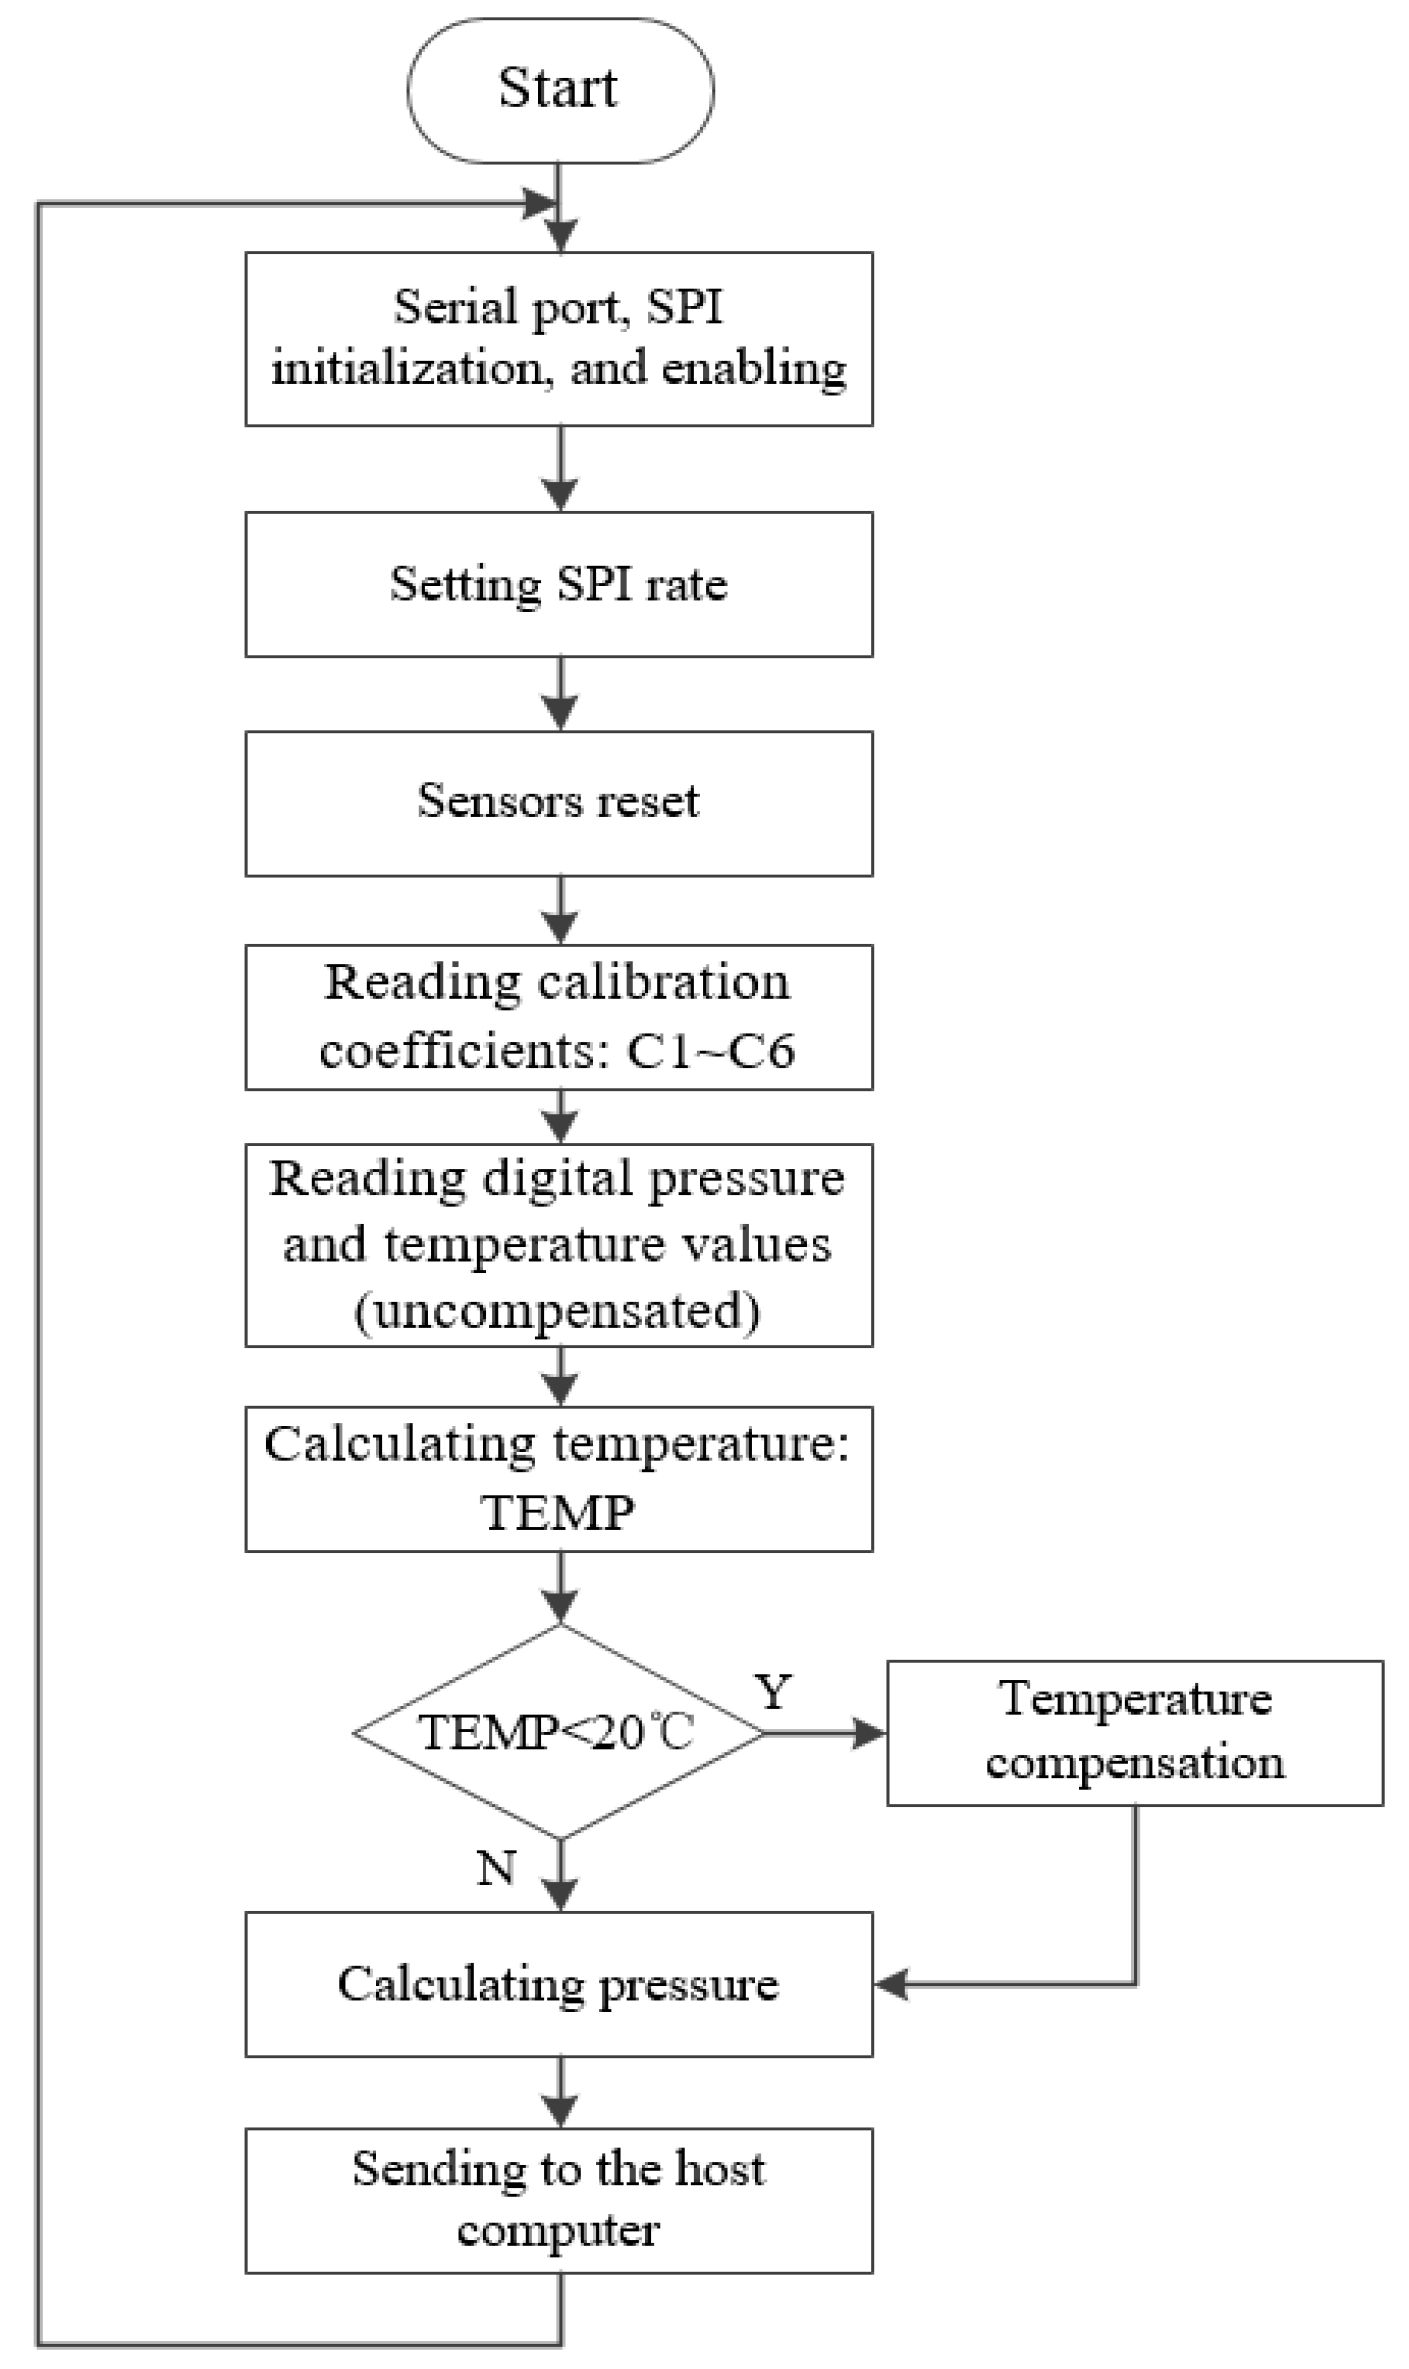
The process of pressure data acquisition contains pressure sensors, the microcontroller and the host computer. STM32 and pressure sensors are communicated through the SPI interface. Then the pressure data are transmitted to the host computer through the serial port communication to observe the change of the pressure data in real-time. The software flow chart for reading pressure data is shown in Figure 8.
6. Comparison between Simulation and Experiment
In the experiment, the fish lateral line prototype is fixed on a custom stainless-steel bracket and placed in a custom pool. The prototype in the water is 20 mm away from the water surface. The vibrating sphere moves back and forth around the lateral line at a certain frequency. The frequency is set to 2 Hz and the amplitude of displacement is 50 mm. The diameter of the vibrating sphere is 50 mm. While the sphere vibrates at a certain frequency, the sensor array equipped on the fish lateral line prototype collects pressure data in real-time. It is noted that the pressure value in the figure is the pressure difference with respect to the hydrostatic pressure. During a period of time, eight sensors measure the corresponding pressure values in the still water respectively. We average the eight values separately, and then subtract the average from the data obtained in the experiment.
The sensor nodes on the lateral line of the fish are assumed to be on the same line (x axis). The experimental diagram is shown in the Figure 9.
When the vibrating sphere moves back and forth near the seventh sensor, the pressure curve measured by the eight sensors respectively is shown in Figure 10a, and the curve after fitting is shown in Figure 10b. The pressure data measured by the eight sensors are in a simple harmonic motion, and the pressure value at the seventh point is the largest.
According to the derivation of the near-field pressure in chapter 4, pressure simulation curve of an individual node on the fish lateral line with time is shown in Figure 11. The pressure curve is a simplified harmonic vibration with frequency of 2 Hz.
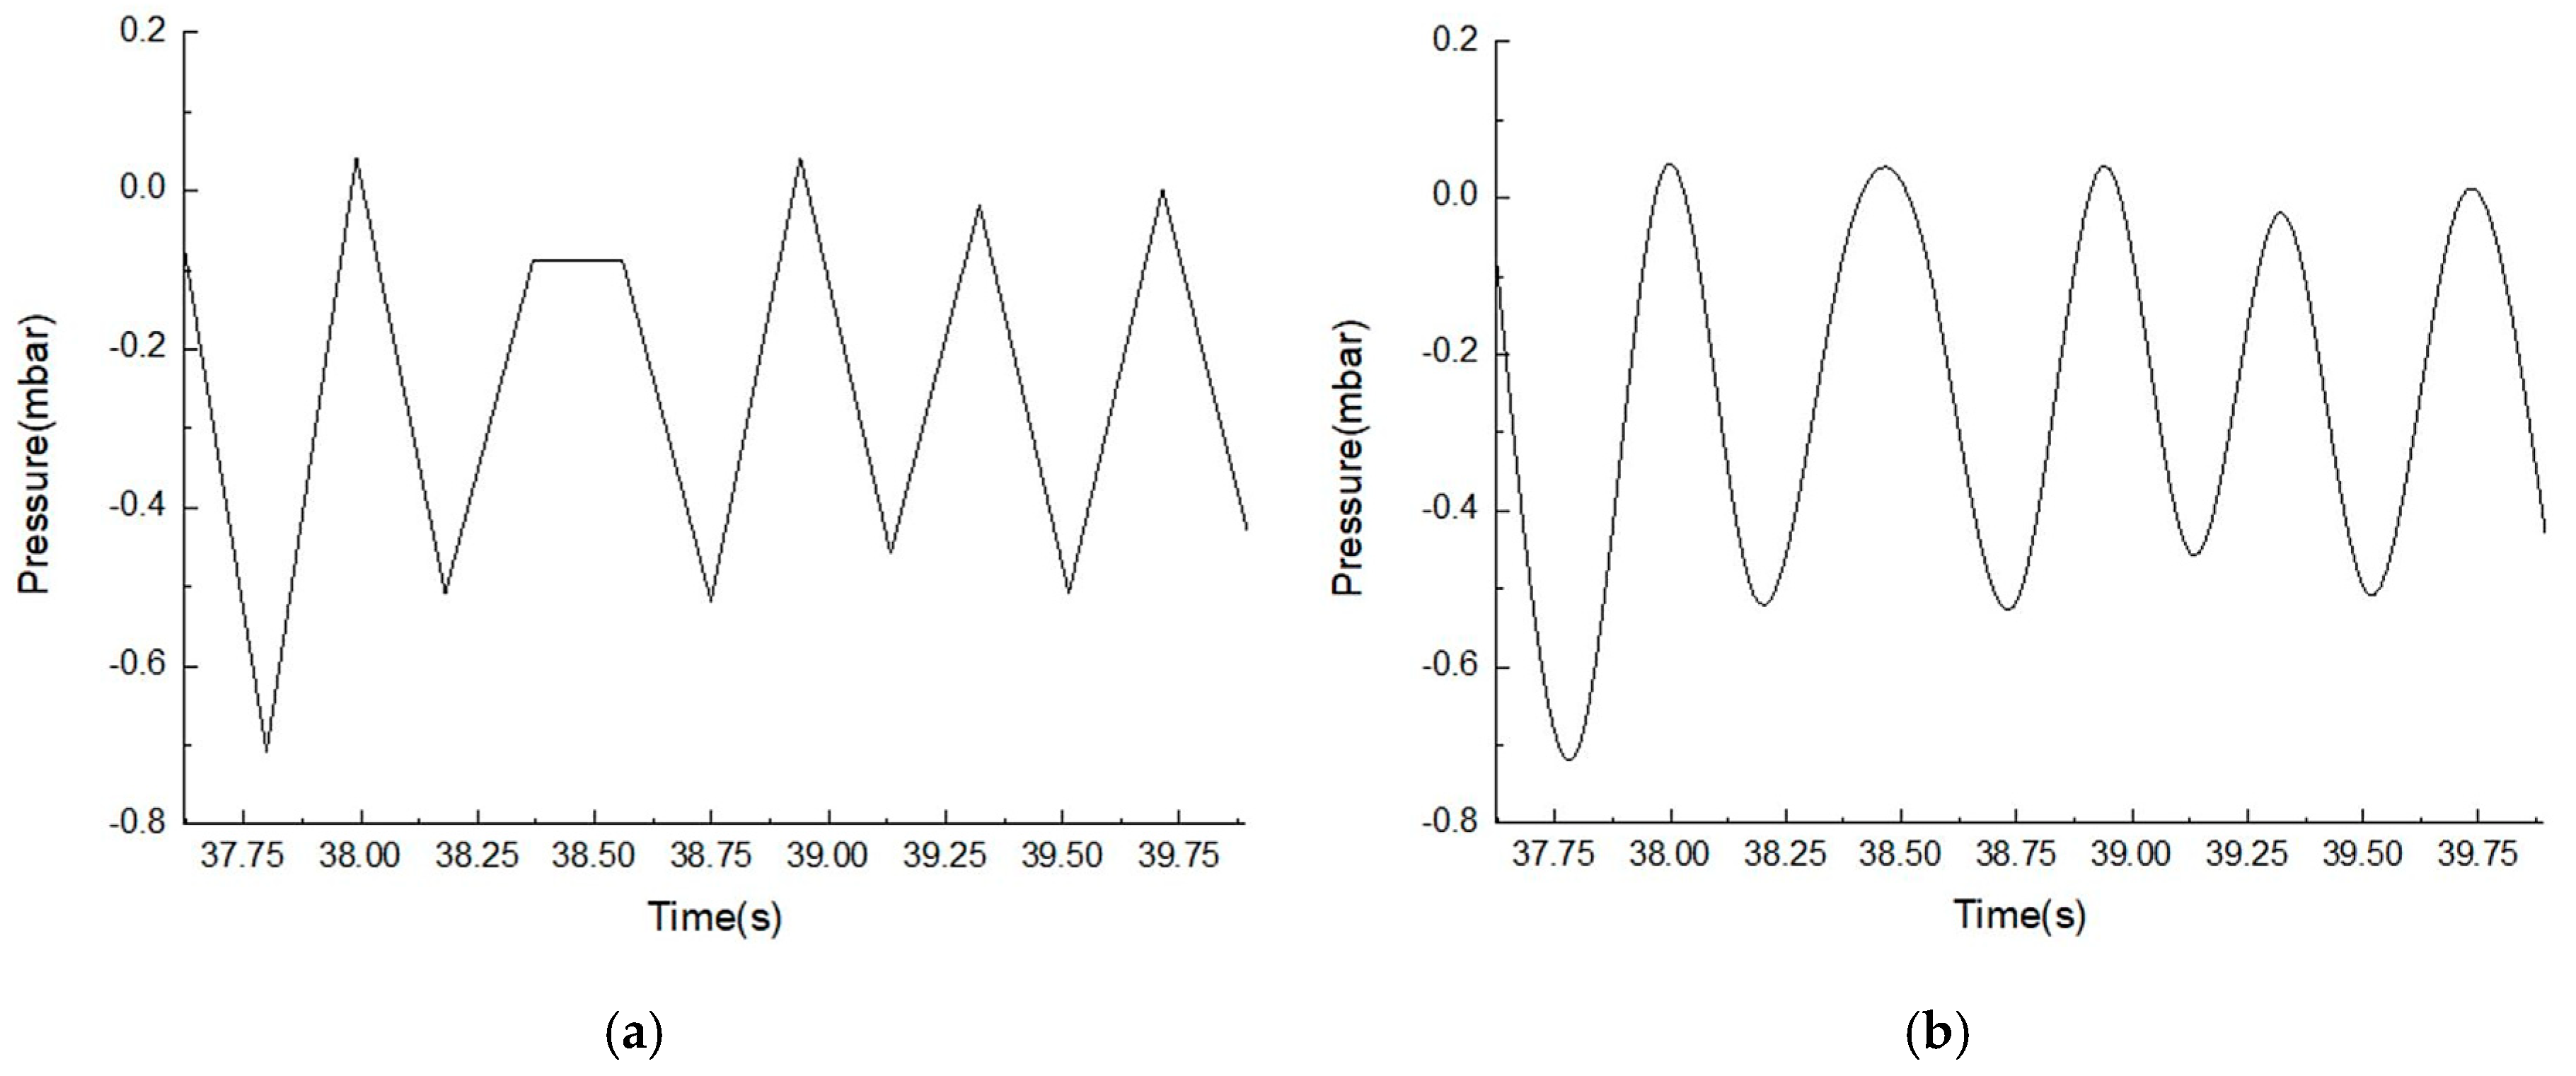
In the experiment, the actual measured pressure curve of a single sensor on the lateral line with time is shown in Figure 12. The spline curve fitting is carried out for the value of the sensor, and the curve (b) is obtained. It is found that the vibration law is consistent with the simulated curve.
When the vibrating sphere moves back and forth near the seventh node, the simulation curve of pressure distribution of nodes on the entire lateral line is shown in Figure 13. We found that the pressure is greatest at the seventh node, with the rest of the points gradually decreasing. It is determined that the vibrating direction of the source is vertical to the seventh sensor.
In the experiment, the pressure distribution curve at a certain time measured by eight sensors on the fish lateral line is shown in Figure 14a. Figure 14b shows a spline fitting curve of eight pressure measurements at a certain time. The pressure distribution curve is consistent with the simulation results.
After analyzing the raw data obtained from the experiment, we process them. Eight-second long signals are selected from sampled original signals which last 30 s as the input of FFT to extract the amplitude of pressure signals. The frequency-amplitude diagram of the seventh pressure measurement is shown in the Figure 15. The pressure amplitude of sampled signals is extracted to prepare for the next step to estimate the vertical distance between the center of the pressure source and the lateral line.
7. Conclusions and Prospects
Fish can survive for a long time in a complex marine environment, relying on the lateral line organ to identify nearby creatures, bypass obstacles, and avoid predators. In order to imitate these advantages of fish lateral lines, a great deal of effort has been made in recent years. It is hoped that the fish lateral line system will be used in underwater sensing and detection of underwater objects, such as impending walls, approaching obstacles, and so on.
Inspired by the lateral line of fish, an underwater near-distance detection system based on fish’s lateral line is proposed in this paper, using a pressure sensor array to mimic the sensing function of the fish lateral line. In structure, the shape of the underwater robot is designed and printed by a 3D printer. The pressure sensor array, comprised of eight pressure sensors, is mounted on the surface of the underwater robot body. When the mechanism is moving, the pressure quantities are measured in real-time to obtain the water wave information. Finally, the experimental results are analyzed and processed. The experimental pressure curve is consistent with the simulation results. The pressure value of a single point is a simple harmonic vibration at a certain frequency. It is found that the direction of the pressure source, that is the sphere, can be easily identified from the pressure distribution curve. The pressure amplitude of sampled signals is extracted to prepare for the next step to estimate the vertical distance between the center of the pressure source and the lateral line.
In this paper, the lateral line detection system was designed based on fish lateral line. The system includes inrush simulation drive system and fish side line detection system. When an object disturbs the water surface, the direction of the object is located by detecting the pressure of each sensor. The experimental results show that the sensing principle and conclusion of the lateral line detection system proposed in this paper are consistent. In the future, the detection of a pressure source in multi-angle motion will be studied. At the same time, the influence of sensor spacing on detection is also a part of the future research.
Author Contributions
Z.T. and Z.W. conceived and designed the experiments; J.L. and G.M. performed the experiments; P.Z. analyzed the data and contributed materials.
Funding
The authors would like to acknowledge National Natural Science Foundation of China (No. 51005142), the Innovation Program of Shanghai Municipal Education Commission (No.14YZ010), and the Natural Science Foundation of Shanghai (No. 14ZR1414900, No.19ZR1419300) for providing financial support for this work.
Conflicts of Interest
The authors declare no conflict of interest.
References
- Lu, X.; Ma, L.; Zhang, L.; Meng, T.; Ma, Z. Research on application of small underwater robots ROV. Ocean Dev. Manag. 2015, 6, 66–70. [Google Scholar]
- Cortés-Pérez, N.; Torres-Méndez, A.L. A Low-Cost Mirror-Based Active Perception System for Effective Collision Free Underwater Robotic Navigation. In Proceedings of the 2016 IEEE Conference on Computer Vision and Pattern Recognition Workshops (CVPRW), Las Vegas, NV, USA, 26 June–1 July 2016; pp. 61–68. [Google Scholar]
- Salumae, T.; Kruusmaa, M. Flow-relative control of an underwater robot. Proc. R. Soc. A 2013, 469, 20120671. [Google Scholar] [CrossRef] [Green Version]
- Xu, Y.; Mohseni, K. A Pressure Sensory System Inspired by the Fish Lateral Line: Hydrodynamic Force Estimation and Wall Detection. IEEE J. Ocean. Eng. 2017, 42, 532–543. [Google Scholar] [CrossRef]
- Zhang, X.; Xiao, Y.; Li, F.-G. Research on Underwater Target Location Based on Ranging Sonar and Optical-Vision. Mar. Eng. 2016, 38, 74–78. [Google Scholar]
- Song, B. Development Analysis of the Underwater Target Recognition Technology. Mar. Electron. Eng. 2014, 34, 168–173. [Google Scholar]
- Medagoda, L.; Williams, S.B.; Pizarro, O.; Jakuba, M.V. Water column current aided localization for significant horizontal trajectories with Autonomous Underwater Vehicles. In Proceedings of the OCEANS’11 MTS/IEEE KONA, Waikoloa, HI, USA, 19–22 September 2011; pp. 1–5. [Google Scholar]
- Wu, N.; Wu, C.; Ge, T.; Wang, T. Flow Recognition of Underwater Vehicle Based on the Perception Mechanism of Lateral Line. J. Mech. Eng. 2016, 52, 54–59. [Google Scholar] [CrossRef]
- Tuhtan, J.A.; Fuentes-Pérez, J.F.; Strokina, N.; Toming, G.; Musall, M.; Noack, M.; Kämäräinen, J.K.; Kruusmaa, M. Design and application of a fish-shaped lateral line probe for flow measurement. Rev. Sci. Instrum. 2016, 87, 045110. [Google Scholar] [CrossRef] [PubMed]
- Liu, G.; Wang, A.; Wang, X.; Liu, P. A review of artificial lateral line in sensor fabrication and bionic applications for robot fish. Appl. Bionics Biomech. 2016. [Google Scholar] [CrossRef] [PubMed]
- Dagamseh, A.; Wiegerink, R.; Lammerink, T.; Krijnen, G. Imaging dipole flow sources using an artificial lateral-line system made of biomimetic hair flow sensors. J. R. Soc. Interface 2013, 10, 20130162. [Google Scholar] [CrossRef]
- Asadnia, M.; Kottapalli, A.G.P.; Miao, J.; Warkiani, M.E.; Triantafyllou, M.S. Artificial fish skin of self-powered microelectromechanical systems hair cells for sensing hydrodynamicflow phenomena. J. R. Soc. Interface 2015, 12, 20150322. [Google Scholar] [CrossRef]
- Fernandez, V.I.; Hou, S.M.; Hover, F.S.; Lang, J.H.; Triantafyllou, M.S. Lateral-Line-Inspired MEMS-Array Pressure Sensing for Passive Underwater Navigation; Sea Grant College Program: Cambridge, MA, USA, 2007.
- Asadnia, M.; Kottapalli, A.G.P.; Shen, Z.; Miao, J.; Triantafyllou, M. Flexible and surface-mountable piezoelectric sensor arrays for underwater sensing in marine vehicles. IEEE Sens. J. 2013, 13, 3918–3925. [Google Scholar] [CrossRef]
- DeVries, L.; Lagor, F.D.; Lei, H.; Tan, X.; Paley, D.A. Distributed flow estimation and closed-loop control of an underwater vehicle with a multi-modal artificial lateral line. Bioinspir. Biomim. 2015, 10, 025002. [Google Scholar] [CrossRef] [PubMed]
- Venturelli, R.; Akanyeti, O.; Visentin, F.; Ježov, J.; Chambers, L.D.; Toming, G.; Brown, J.; Kruusmaa, M.; Megill, W.M.; Fiorini, P. Hydrodynamic pressure sensing with an artificial lateral line in steady and unsteady flows. Bioinspir. Biomim. 2012, 7, 036004. [Google Scholar] [CrossRef]
- Wang, W.; Zhang, X.; Zhao, J.; Xie, G. Sensing the Neighboring Robot by the Artificial Lateral Line of a Bio-inspired Robotic Fish. In Proceedings of the 2015 IEEE/RSJ International Conference on Intelligent Robots and Systems (IROS), Hamburg, Germany, 28 September–2 October 2015; pp. 1565–1570. [Google Scholar]
- Gao, A.; Triantafyllou, M. Bio-Inspired Pressure Sensing for Active Yaw Control of Underwater Vehicles. In Proceedings of the 2012 Oceans, Hampton Roads, VA, USA, 14–19 October 2012; pp. 1–7. [Google Scholar]
- Strokina, N.; Kamarainen, J.-K.; Tuhtan, J.A.; Fuentes-Perez, J.F.; Kruusmaa, M. Joint estimation of bulk flow velocity and angle using a lateral line probe. IEEE Trans. Instrum. Meas. 2016, 65, 601–613. [Google Scholar] [CrossRef]
- Kottapalli, A.G.P.; Asadnia, M.; Miao, J.M.; Barbastathis, G.; Triantafyllou, M.S. A flexible liquid crystal polymer MEMS pressure sensor array for fish-like underwater sensing. Smart Mater. Struct. 2012, 21, 115030. [Google Scholar] [CrossRef]
- Schmitz, A.; Bleckmann, H.; Mogdans, J. Organization of the Superficial Neuromast System in Goldfish, Carassius auratus. J. Morphol. 2008, 269, 751–761. [Google Scholar] [CrossRef]
- Herzog, H.; Mogdans, J.; Bleckmann, H. Smart Mechanical Dipole: A device for the measurement of sphere motion in behavioral and neurophysiological experiments. J. Exp. Biol. 2016, 219, 2823–2827. [Google Scholar] [CrossRef]
- Curcic-Blake, B.; van Netten, S.M. Source location encoding in the fish lateral line canal. J. Exp. Biol. 2006, 209, 1548–1559. [Google Scholar] [CrossRef] [PubMed] [Green Version]
- Van Netten, S.M. Hydrodynamic detection by cupulae in a lateral line canal: Functional relations between physics and physiology. Biol. Cybern. 2006, 94, 67–85. [Google Scholar] [CrossRef]
- Ji, M.; Zhang, Y.; Zheng, X.; Liu, G.; Qiu, J. A Fish-Shaped Minimal Prototype of Lateral Line System Based on Pressure Sensing. In Proceedings of the 2017 IEEE International Conference on Mechatronics and Automation, Takamatsu, Japan, 6–9 August 2017. [Google Scholar]
- Yang, Y.; Liu, C.; Jones, D.L.; Engel, J.; Pandya, S. Multisensor Processing Algorithms for Underwater Dipole Localization and Tracking Using MEMS Artificial Lateral-Line Sensors. EURASIP J. Appl. Signal Process. 2006, 2006, 199. [Google Scholar]
- Abdulsadda, A.T.; Tan, X. Underwater Source Localization Using an IPMC-based Artificial Lateral Line. In Proceedings of the 2011 IEEE International Conference on Robotics and Automation, Shanghai, China, 9–13 May 2011. [Google Scholar]
- Abdulsadda, A.T.; Tan, X. Underwater tracking of a moving dipole source using an artificial lateral line: Algorithm and experimental validation with ionic polymer–metal composite flow sensors. Smart Mater. Struct. 2013, 22, 045010. [Google Scholar] [CrossRef]
- Akanyeti, O.; Chambers, L.D.; Ježov, J.; Brown, J.; Venturelli, R.; Kruusmaa, M.; Megill, W.M.; Fiorini, P. Self-motion effects on hydrodynamic pressure sensing: Part I. Forward–backward motion. Bioinspir. Biomim. 2013, 8, 026001. [Google Scholar] [CrossRef]
Figure 1.
The application scenes of underwater vehicles with lateral sensing systems.

Figure 2.
Fish’s lateral line.

Figure 3.
The fish-shaped prototype inspired by the trout lateral line. (a) Side view of the model; and (b) Top view of the model.
Figure 3.
The fish-shaped prototype inspired by the trout lateral line. (a) Side view of the model; and (b) Top view of the model.

Figure 4.
(a) The block diagram of the whole experimental principle. (b) The picture of the experimental setup.
Figure 4.
(a) The block diagram of the whole experimental principle. (b) The picture of the experimental setup.

Figure 5.
Illustration of the problem formulation.

Figure 6.
The control system block diagram.

Figure 7.
Pressure sensor MS5803-05BA.

Figure 8.
The software flow chart for reading pressure data.

Figure 9.
Experimental diagram.

Figure 10.
Pressure curve measured (a) and after spline fitting (b) of the eight sensors, respectively.
Figure 10.
Pressure curve measured (a) and after spline fitting (b) of the eight sensors, respectively.

Figure 11.
Pressure simulation curve of an individual node.

Figure 12.
The measured pressure curve (a) and spline curve (b) of an individual sensor.

Figure 13.
Simulation curve of pressure distribution of 8 nodes on the lateral line.

Figure 14.
The measured pressure distribution curve (a) and spline curve (b) of lateral line sensor.
Figure 14.
The measured pressure distribution curve (a) and spline curve (b) of lateral line sensor.

Figure 15.
Frequency-amplitude diagram of seventh sensor.


Table 1.
Dimensions of our fish-shaped structure (mm).
| Length | Width | Height | Sensor Interval | Tube Diameter | Tube Height | Thickness |
|---|---|---|---|---|---|---|
| 360 | 70 | 130 | 40 | 5 | 41 | 1 |
Table 2.
Sensor specifications.
| Detail | Specification |
|---|---|
| Pressure sensor type | MS5803-05BA |
| Number of pressure sensors | 8 |
| Range | 0–6 bar |
| Analog to digital converter | 24 bit |
| Resolution | 0.036 mbar |
| Response time | 0.5 ms |
| Data sampling frequency | 40 Hz |
© 2019 by the authors. Licensee MDPI, Basel, Switzerland. This article is an open access article distributed under the terms and conditions of the Creative Commons Attribution (CC BY) license (http://creativecommons.org/licenses/by/4.0/).
Share and Cite
MDPI and ACS Style
Tang, Z.; Wang, Z.; Lu, J.; Ma, G.; Zhang, P. Underwater Robot Detection System Based on Fish’s Lateral Line. Electronics 2019, 8, 566. https://0-doi-org.brum.beds.ac.uk/10.3390/electronics8050566
AMA Style
Tang Z, Wang Z, Lu J, Ma G, Zhang P. Underwater Robot Detection System Based on Fish’s Lateral Line. Electronics. 2019; 8(5):566. https://0-doi-org.brum.beds.ac.uk/10.3390/electronics8050566
Chicago/Turabian StyleTang, Zhijie, Zhen Wang, Jiaqi Lu, Gaoqian Ma, and Pengfei Zhang. 2019. "Underwater Robot Detection System Based on Fish’s Lateral Line" Electronics 8, no. 5: 566. https://0-doi-org.brum.beds.ac.uk/10.3390/electronics8050566
Note that from the first issue of 2016, this journal uses article numbers instead of page numbers. See further details here.