Article

Feasibility of Wireless Horse Monitoring Using a Kinetic Energy Harvester Model

1
IDLab, Department of Information Technology, Ghent University-Imec, 9000 Ghent, Belgium
2
WAVES, Department of Information Technology, Ghent University-Imec, 9000 Ghent, Belgium
*
Author to whom correspondence should be addressed.
Submission received: 14 August 2020 / Revised: 5 October 2020 / Accepted: 13 October 2020 / Published: 20 October 2020
(This article belongs to the Section Bioelectronics)

Abstract

:
To detect behavioral anomalies (disease/injuries), 24 h monitoring of horses each day is increasingly important. To this end, recent advances in machine learning have used accelerometer data to improve the efficiency of practice sessions and for early detection of health problems. However, current devices are limited in operational lifetime due to the need to manually replace batteries. To remedy this, we investigated the possibilities to power the wireless radio with a vibrational piezoelectric energy harvester at the leg (or in the hoof) of the horse, allowing perpetual monitoring devices. This paper reports the average power that can be delivered to the node by energy harvesting for four different natural gaits of the horse: stand, walking, trot and canter, based on an existing model for a velocity-damped resonant generator (VDRG). To this end, 33 accelerometer datasets were collected over 4.5 h from six horses during different activities. Based on these measurements, a vibrational energy harvester model was calculated that can provide up to 64.04 μW during the energetic canter gait, taking an energy conversion rate of 60% into account. Most energy is provided during canter in the forward direction of the horse. The downwards direction is less suitable for power harvesting. Additionally, different wireless technologies are considered to realize perpetual wireless data sensing. During horse training sessions, BLE allows continues data transmissions (one packet every 0.04 s during canter), whereas IEEE 802.15.4 and UWB technologies are better suited for continuous horse monitoring during less energetic states due to their lower sleep current.

1. Introduction

Thoroughbred horses are considered very valuable for the owners, both emotionally and financially, making the growing equine industry very important and innovative. To provide better healthcare for the millions of horses in this industry, anomalies, e.g., colic’s, lameness, etc., in the behavior should be detected as early as possible to enable effective treatment and, thereby reducing the risk for possible expensive surgeries. Many of these symptoms can be detected for example by processing continuously collected accelerometer data using heuristics or machine learning models [1,2]. To this end, a wireless sensor node will be attached at the hoof. The placement of the sensor at the hoof is chosen because it is none-intrusive for the horse. The accelerometer data will be collected, processed and transmitted periodically over the air for analyzing in the backbone.
In literature different definitions of lameness exist but they all include a pathological condition, which makes lameness into a clinical problem [3]. Another important health issue is colic. A study of more than 20.000 horses in 1998–1999 estimated the annual cost of colic in the United States at $115,300,000 [4], making the detection of these anomalies very important for horse owners. Depending on the veterinary practitioner, different diagnostic tests are performed [5].
In addition to these clinical benefits, the accelerometer data can be used for a second important use case: to improve training sessions [6] of competition horses on a scientific basis. Trainers can reuse the available accelerometers to identify the gait pattern followed during previous training sessions, enabling long term evaluation of the horse physical condition. In addition to detecting, e.g., lameness, this information can also be used to calculate per-horse nutrition plans, matching the energy quantity and feeding times to the horse energy consumption [7]. These use cases are described in more detail in, e.g., [1] and motivate the presence of accelerometers in horse wearables. Sensor nodes, in particular for (animal) health applications, are typically limited by physical constraints on the dimensions and therefore the battery capacity is also limited. The health monitoring device requires a robust battery without any exploding risk. To cope with this limited power availability and the difficulty of switching regularly batteries at the horses leg, the energy for the monitoring device could be supplied with a piezoelectric energy harvester. The harvesting of energy from the kinetic movements of humans has gained recent research interest and is studied in several papers. Saha [8] proposed an unobtrusive piezoelectric device integrated in a human shoe-sole for powering small electronic devices. The use of piezo-electricity has also been used to power RFID nodes in sneakers, presented in [9]. Gatto [10] presented four different types of soles with integrated energy harvesters were used to power a GPS module. Experimental results for a low frequency piezoelectric energy harvester were demonstrated by Luo [11]. Optimizing energy harvesters for low frequency by applying non-linear techniques has been done by Mann [12].
We investigated the possibility for designing an energy harvesting node at lateral side of the front leg of a horse based on an extensive set of collected accelerometer data traces from horses. By extension, findings of this study can be used in the tracking of wildlife, mainly focusing on ungulates.
The main contributions for this paper are the following:
  • The authors determine the order of magnitude for the energy that can be harvested at the leg of horses based on a second order mass-spring model of an energy harvester applied on multiple data tracks.
  • A comparison between the available energy during different gaits of the horse is made and the effect for tuning the resonance frequency of the energy harvester is shown.
  • The influence of different environmental parameters (surface, leg, physics of the horse, etc.) on the energy generation is studied and the results are generalized for use in different scenarios.
  • The feasibility to transmit data using 6 different wireless technologies (WiFi, BLE, UWB, LoRa, SigFox and 802.15.4) is evaluated using different duty cycling scenarios.
To the best of our knowledge, this is the first paper that reports on the possible generation of energy at a horse’s leg. The conclusions are based and validated on a large dataset of 33 tracks with at each front leg a 3-axis accelerometer, covering different horses, surfaces, sampling rates, etc.
The remainder of this paper is structured as follows. First, Section 2 provides an overview of existing health trackers for horses and also provides an overview of energy harvested sensor nodes in other papers whether or not applied on horse related data. In Section 3, a description of the acquisition of the data sets is provided and the results are discussed and interpreted, discussing, e.g., different variables (surface, physics of the horse, etc.). Next, the used energy harvester model and the conversion to electrical energy is discussed in Section 4. The results of the analysis are presented in Section 5. An overview and discussion of different wireless technologies that can be used for transmitting the accelerometer data is given in Section 6. Finally, Section 7 concludes the paper.

2. Related Works

In this section, we discuss (i) the state-of-the-art research related to energy harvesting in constrained wireless (sensor) devices, and (ii) research tracks related to continuous monitoring of horses.

2.1. Energy Harvested Wireless Sensor Networks

The emerging Internet-of-Things (IoT) technologies have made rapid progress in smart applications and industry 4.0. As a subcategory of IoT, wireless sensor networks are a hot topic in different research domains as they can collect data for thoroughly interpretation of environmental conditions (weather, animals, traffic, etc.). For this purpose, low power electronic chips are available targeting energy harvester applications and the sensors themselves are smaller and consume less power. Remote nodes are deployed on a large scale for monitoring environmental [13] and physical conditions and send their information to a central node for processing and saving.
One of the largest constraints in these networks is the limited battery capacity and need for costly battery replacement. When tracking wild animals [14,15], the node should stay online as long as possible, to collect the maximum amount of data. One potential solution is the use of a battery-less node that harvests the required energy from his environment [16]. The most common technique is solar energy [17,18,19] for powering the mobile nodes. Other types of energy harvesting include thermal [20,21], RF-based [22,23] and kinetic energy harvesters [24,25].
The final goal of this paper is to assess the feasibility of a monitoring device placed at the horseshoe, hoof or lower leg of the horse, since this location provides the most rich and usable accelerometer data [2] and is the least intrusive for the horse. Solar energy can’t be guaranteed at the hoof and leg of the horse and the energy RF and thermal can currently provide are not sufficient for powering the node [26,27]. To overcome these limitations, we will investigate the feasibility of a kinetic energy harvester at the hoof of the horse.

2.2. Horse Health and Behavior Tracking

Horse owners, biologists and other researchers are interested in tracking animals, in particular horses, for multiple reasons: analyzing their socio-dynamical behavior, automatic and early detection of lameness, colics and other anomalies, health monitoring and gait analysis.
Research interest for horse monitoring includes the collection of spatio-temporal data from 32 horses in the Donana National Park, Andalusia, Spain [28], after which this data is used for mapping dynamical group behavior. The horses were followed with battery-powered wireless nodes. The classification and characterization of horse gaits based on accelerometer data have been studied in [29], exploiting the landing pattern of the limbs, and EquiMoves [2], combining 8 wireless nodes for analyzing a horse gaits and detecting lameness in the horse gait [2]. provides an objective measurement system supporting equine veterinarians in assessing lameness and gait performance. The system captures horse motion from up to eight synchronized wireless inertial measurement units, can be used in various equine gait modes, and analyzes both upper-body and limb movements. Research with heart rate sensors has been done to detect lameness in canter [30]. To monitor the horse’s health, a solution of the dire need of accessible, portable and affordable technology measuring the heartbeat and vital signs is proposed in [31].
Some off-the-shelf commercial systems already exist, providing information about horse or environment to the owners. Commercially available devices for tracking the horse’s behavior include, e.g., [32,33]. By measuring heart rate, temperature or accelerometer data, the owner can evaluate the conditions of his precious horse and his stables. However, most of these devices need battery replacement after a few days, are too big in size or do not provide real time interpretation of the data. One of the possibilities to overcome the battery replacement constraints is the use of an energy harvester as primary power source. To the best of our knowledge, we can state that no such commercial or research system already exists.

3. Kinetic Accelerometer Data: Collection and Interpretation

To determine the available energy during different activities, accelerometer data is collected from multiple horses. All accelerometer data sets are collected using two off-the-shelf 3-axis logging accelerometers (Axivity AX3 [34] devices) attached to both front legs of the horse. The devices include a quart-crystal, temperature sensor, battery and flash memory for storing the data.

3.1. Acquisition of the Data

The data sets are recorded in different conditions: using multiple horses, different sampling rates, different surfaces and both at the left and right front leg. The x-direction is pointing towards the ground, the y-direction is along the horse and the z-direction is inside the horse leg when the hoof is resting on the ground (Figure 1). A sensor is attached to both the left and the right leg. In total 6 horses were available for this study.
During the collection of the datasets, the horses moved with different gaits. We selected the 4 most common natural gaits (stand, walk, trot and canter) to be most representative for generating energy. Their relative occurrence in the datasets is given in Figure 2. The gaits are manually annotated to the given datasets with specialized video annotation software, however the annotation is not limited to this set of 4 gaits. Many annotation categories (change between gaits, cross canter, manual adjusting sensors, etc.) are not available in sufficient datasets for a complete in-depth analysis. They are grouped in “other”. The dataset is collected for 6 different horses, where horse 3 is limping, horse 5 is categorized as a Friesian horse and horse 6 as a pony.
Datasets 30, 32 and 33 are recordings from a rolling move of the horse, 18 is a pawing move and 19 is measured when the horse is watching his flank, therefore these tracks are mostly defined as “other” gait and shorter than the others. The other tracks have recording times between 6.31 and 16.94 minutes containing different gaits. The characteristics of the datasets are listed in Table 1.

3.2. Analysis of the Data

Gravitational forces will give a constant acceleration of ± 9.81   m / s 2 along the x-direction. To filter this and all the other DC components in the signal, a high pass filter with a passband frequency of 0.1 Hz is applied before the data is analyzed.

3.2.1. Motion Frequency

Kinetic energy harvesters are typically optimized for specific operating frequency. As such, we first analyze the data for the most important frequency. The frequency is caused by the repetitive nature of the movements of horse. As a result, the most dominant frequencies are heavily dependent on the gaits that are available in the dataset. In Figure 3 the spectrum of one of the datasets is given. The spectrum of the dataset peaks at 1.39 and 1.7 Hz. Looking to the gaits themselves, one peak can be contributed to canter, another one to the trot gait. The peak in the spectrum for canter is at a higher frequency than the peak in the spectrum for trot.
The original, not filtered signal has a large DC component that was filtered out before the analysis of the signal. The most dominant motion frequency in the dataset will also vary with the gait the horse is moving in. In Figure 4, a spectrogram of the data is visualized, accompanied by the original accelerometer data. The different gaits are annotated and the track is colorized. During the standing phase, almost no power is available in the dataset. For the 3 other gaits some energy can be noticed. For canter the dominant motion frequency is higher than for the other gaits. In canter the highest power can be observed from the spectrogram, during walking the power is much lower and at lower frequencies as well.
The other axes of the accelerometer, the other leg and the other datasets give similar conclusions. Depending on the distribution of the gaits in the dataset, the most dominant motion in the track slightly changes. The highest peak is mostly at 1.27 Hz or 1.76 Hz .

3.2.2. Average Absolute Deviation

An indication of the amount of motion that is present in the data can be useful. This information is provided by the average absolute deviation of the acceleration, D (m/s 2 ), and can be calculated with following equation, with a(t) the accelerometer signal and a ¯ ( t ) , the moving average of the accelerometer data set taken over the 1 s interval before the current time t:
D = 1 T T | a ( t ) a ¯ ( t ) |
In Figure 5 the amount of motion is given for the same data trace as Figure 3 and Figure 4. The moment when the horse is standing is clearly distinguishable. When the horse is moving in canter, the amount of motion is the highest. Figure 6 generalizes the conclusion over all datasets for the different gaits. The amount of motion in canter is about 1.5, 3.5 and 27 times more than during trot, walking and standing respectively. The y-direction has the highest average absolute deviation, both left and right for all different gaits. The average absolute deviation for all movements not labeled as stand, walk, trot or canter have a wide variation with high dependence on the actual movements in the dataset.

4. Energy Harvesters
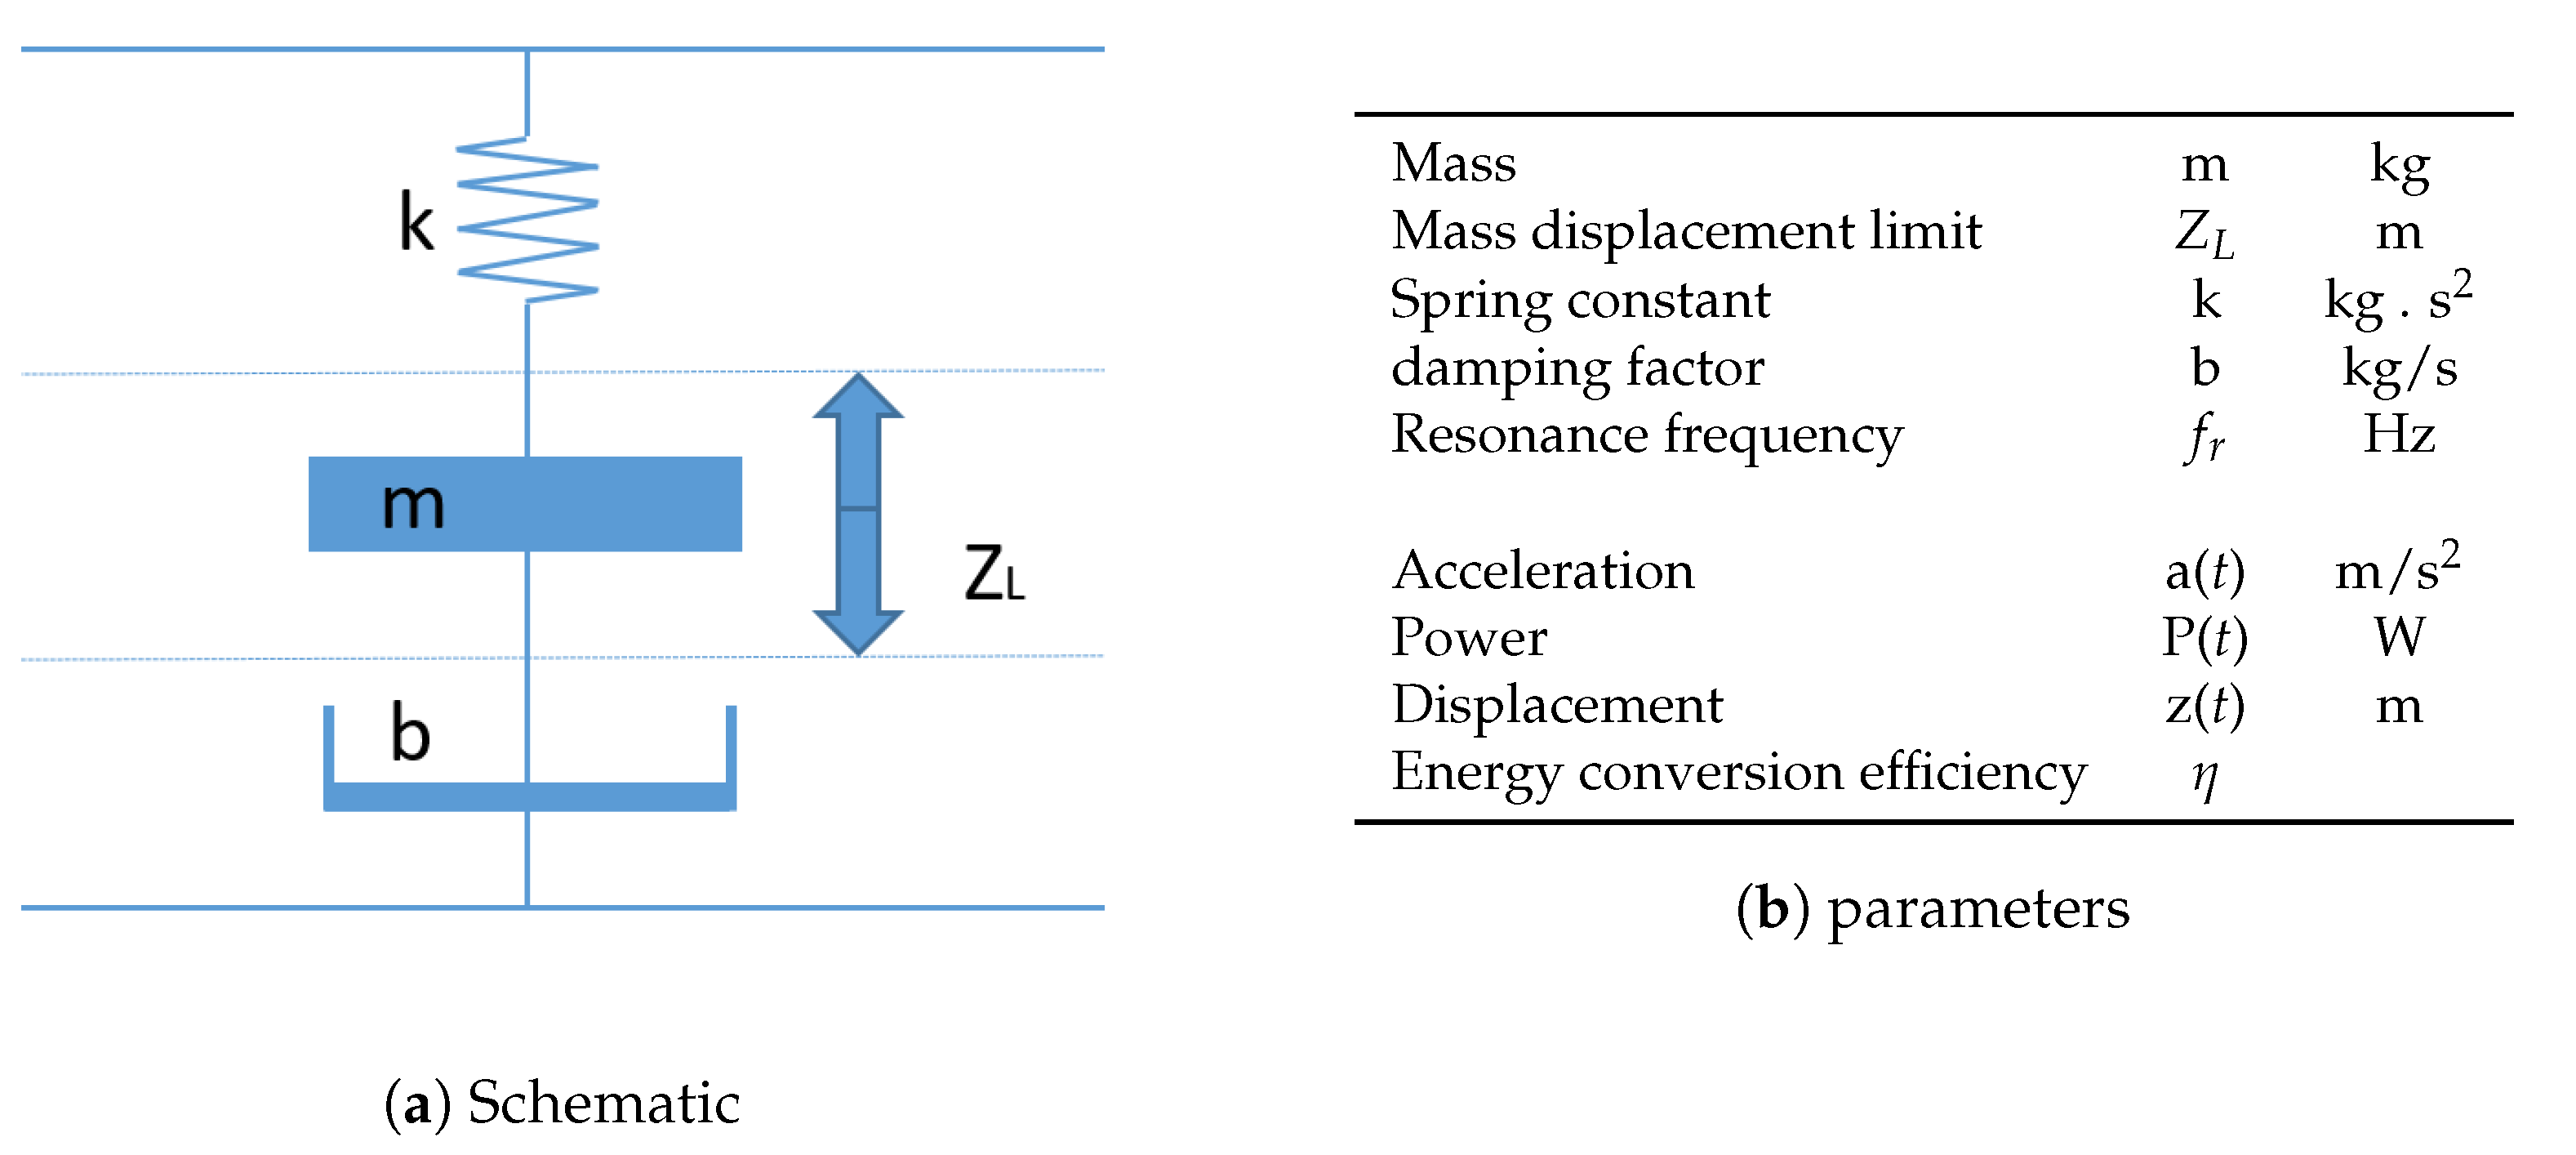
4.1. Model

Next, in this section, we calculate the actual available energy in the above data sets. A velocity-damped resonant generator (VDRG) can be modeled as a second order mass-spring system (Figure 7a) [35,36,37,38] with several different parameters (Figure 7b). The VDRG model has been used before for analyzing accelerometer data in [38,39,40,41,42]. The generated power, P t , will increase when the proof mass of the system is increased or when the constraint on the maximal displacement of the energy harvester is broadened.
The damping in the energy harvester is modeled by two dampers. First, a mechanical damping factor ( b m ) representing mechanical parasitic losses in the system such as air resistance, structural losses, internal friction losses, hysteresis losses, etc., [37,43,44] and a second electromechanical damping, resulting in the usefull conversion of energy ( b e ) in the energy harvester, with the total damping factor [45,46,47]
b = b m + b e .
The harvester quality factor Q determines the spectral width of the energy harvester and is calculated as follows:
Q = k m b
The quality factor of a harvester is dependent on both his mechanical and electromechanical quality factors [48]. The quality factor resulting from the mechanical damper, modeling parasitic damping effects, should be equal or higher than the electromechanical for optimal power harvesting [37,47]. A high quality factor, tuned more precisely around the resonant frequency, permits high harvesting power in resonant operations. On the opposite, a lower Q factor increases the spectral width of the energy harvester with a low peak value [38] but higher bandwidth. With other techniques such as multimodal, frequency-up conversion and nonlinear techniques this spectral width can be tuned even further. For this application on horse energy harvesters at low frequencies and high variability in the frequency, we will use a rather low quality factor to enable the harvesting of energy in non-resonant scenarios and to increase the robustness of the harvester against influences on the quality factor, e.g., temperature. The resonance frequency of the harvester is dependent on k and m:
f r = 1 2 π k m
This second order spring model of the energy harvester is implemented in MATLAB [49] and Simulink. The model can be tuned for specific implementations to maximize the power output. Yet, m and Z L are limited by the physical restrictions on the size and weight of the device. For the analysis of the collected accelerometer data, we will use the m ( 0.001 k g ) and Z L ( 0.01 m ) corresponding to one of the investigated configurations in [40]. Higher displacements are difficult to reach due to material brittleness. Finding the optimal harvester parameters k and b is challenging and therefore done with this analytical model without targeted a specific design. The mechanical damping b m will be kept constant and the electromechanical damping b e will be optimized. The value of k will be used to match the resonance frequency of the harvester with the dominant motion frequency in the captured datasets, providing the maximal power output.

4.2. Energy

The conversion from accelerometer data to generated energy harvester power is based on a widely used analytical model for a VDRG [38]. First, the acceleration a(t) (Figure 8, top) is converted to the displacement of the proof mass z(t) using the Laplace domain transfer function [38]:
z ( t ) = L { z ( s ) } = a ( s ) s 2 + ( 2 π f r Q ) s + ( 2 π f r ) 2
Next, this displacement is saturated at Z L using a Simulink saturation block (Figure 8, middle y-axis). The power generated by the harvester, P(t) (Figure 8, bottom y-axis), is then determined as:
P ( t ) = b e ( d z ( t ) d t ) 2
Nowadays, state-of-the-art energy circuit management ICs for piezoelectric energy harvesters, like the LTC3588-1 [50] typically reach energy conversion efficiencies between 30% and 90%, but in our analysis we will take a more conservative efficiency, η , of 60% which is more realistic for practical applications [38,41].
This factor is applied in the model to be able to approximate the effective available electric power in the device.

5. Energy Availability

The 33 collected datasets are first evaluated with the standard parameters for the energy harvester from Section 4.1, based on the research from [38,45]. The parameters are: m = 0.001 kg; b e = 0.0055 kg/s; b m = 0.02 kg/s; Z L = 0.01 m; η = 0.6; k = 0.17 kg·s 2 ; f r = 2.08 Hz and Q = 0.46. The resonance frequency ( f r = 2.08 Hz) is not matched with the most dominant motions in the dataset. Therefore, it will only be possible to give a general insight on the order of the harvested power, not on the maximal achievable power after tuning.
An optimization for the resonance frequency of the energy harvester will give a total view on the maximal harvested power in the device. The energy conversion rate will stay at 0.6 during the rest of the paper. If this ratio can be improved, the node can be supplied with even a bigger current.

5.1. Average Harvested Power in the Datasets

The horse is generating 24% of his energy during canter and 37 during trot, however it is performing only 8.5% and 26% of the time in canter and trot respectively for the collected data. On the other side, while the horse is standing still for an important part of the time (>20%), only a negligible amount of the total harvested energy is generated. The z-direction is the least interesting direction to harvest energy on, the y-direction (forward direction in movement) is the most favorable (Table 2). During the low-energy movements (stand, walk, trot), the results of the distinct datasets are close together and the average power is quite predictable. For canter, the possible range for average harvested power in the different dataset is larger, resulting in larger standard variations. In general, higher energy harvesting gaits and directions have a higher standard deviation in their datasets.

5.2. Optimization of the Energy Harvester Parameters

The parameters used in the first step of the energy analysis are similar to the ones from [38] but as they have been targeting human applications, they can be further tuned to maximize the generated energy output for horse applications. The parameters that we tune, are k and b e . The spring constant parameter, k, is proportional with the resonance frequency as the mass is kept constant (Equation (3)). The latter damping factor, b e , influences the bandwidth of the energy harvester. It should be taken into account that the optimal set of parameters has to be determined via an exhaustive search algorithm (testing all combinations). However, this algorithm is very time consuming and a more heuristic approach is desirable. To limit the simulation time to an acceptable duration, we will first tune the parameter k, so that the resonance frequency of the energy harvester is mapped with the dominant motion frequency in the dataset. After determining the optimal value for k, we will tune the variable b e and corresponding damping b and Quality factor, Q. The final optimal Q value is still rather low, with values changing from 1 to 5 for the different datasets. When only walking will be the main energy source for a horse, the Q factor can be increased, when canter is targeted, more variation in desired frequency exist and the system can benefit from a smaller Q value.
We will tune the energy harvester for each of the 6 axes in each dataset and try to formulate the ideal parameters set for generating the highest power. This optimization and tuning of the energy harvester for the different datasets and their characteristic distribution of gaits resulted in a total increase of the average power with 150% over the whole dataset. As the resonance frequency of the energy harvester is tuned towards the most energetic frequency available in the dataset and the gaits distribution is not equal in all datasets, different optimizations per dataset are found. The low quality factor defined in Section 4 also enables robustness to environmental influences and a higher frequency bandwidth of the energy harvesting node. The harvested powers for all datasets in the three axes are given in Figure 9 and summarized for the y-axis in Table 3. After optimization, the y-direction is still the most suited for energy harvesting. Further optimization and frequency tuning can be done with wideband and multimodal approaches, nonlinear techniques, frequency up conversion and circuit management [12,37,51]. To obtain more appropriate results for optimizing the vibrational energy harvesters, more comprehensive and multiphysics models also exist in literature that take the previous inaccuracies into account.

5.3. Harvested Energy Per Step

Next, we look at the energy harvested per step, rather than over time. With a general peak detection algorithm, the horse’s steps are counted per gait. In all the datasets combined, 13,159 steps are counted where the most are in the walk and trot gait as these gaits are the most recorded. The average harvested energy during one step of the horse is given in Table 4 for the left y-direction. The length of the steps is different per gait with 0.63 s in canter, 0.8 in trot to 1.3 s when the horse is walking, matching with the previous found frequencies in the accelerometer signals in Section 3. During canter, the energy per step is high and every step can provide enough energy for a packet transmission with the required energy provided in the further Section 6.

5.4. Differences in Datasets

A variety of environmental factors influences the results of the energy that can be harvested. In Table 1, different statistics of the data acquisition were given. To be able to make the system as robust as possible, we study the influence of the leg, horse, surface, etc., on the average power per gait in the datasets.
  • Horse: For the collection of the data, 6 different horses were measured. Horse 3 is limping and the average energy that can be harvested during canter is noticeable higher for this horse than for the others (Figure 10). Moreover, a Friesian horse (5) and pony (6) are measured as their physical conditions completely differ from the other 4 horses. Every horse has a different amount of collected data traces (Table 5). For the pony and Friesian horse only 1 accelerometer trace is available. The limping horse (3) is generating a higher average power than the other horse during canter and trot. For walking and standing almost no differences exist between the horses. The pony generates more energy during canter, trot and ‘other’ than the other 4 horses (1, 2, 4, 5).
  • Surface: The surface of 31 of the experiments was sand mixed with GEOPAT poly flakes. As the surface has a certain damping factor during moving, we measured an extra measurement on a hard (concrete) surface and one track on the field, both performed by horse 2. While we expected to see a clear variation in harvested power between the different surfaces (and damping factors), we could not find a statistically significant difference between the surfaces.
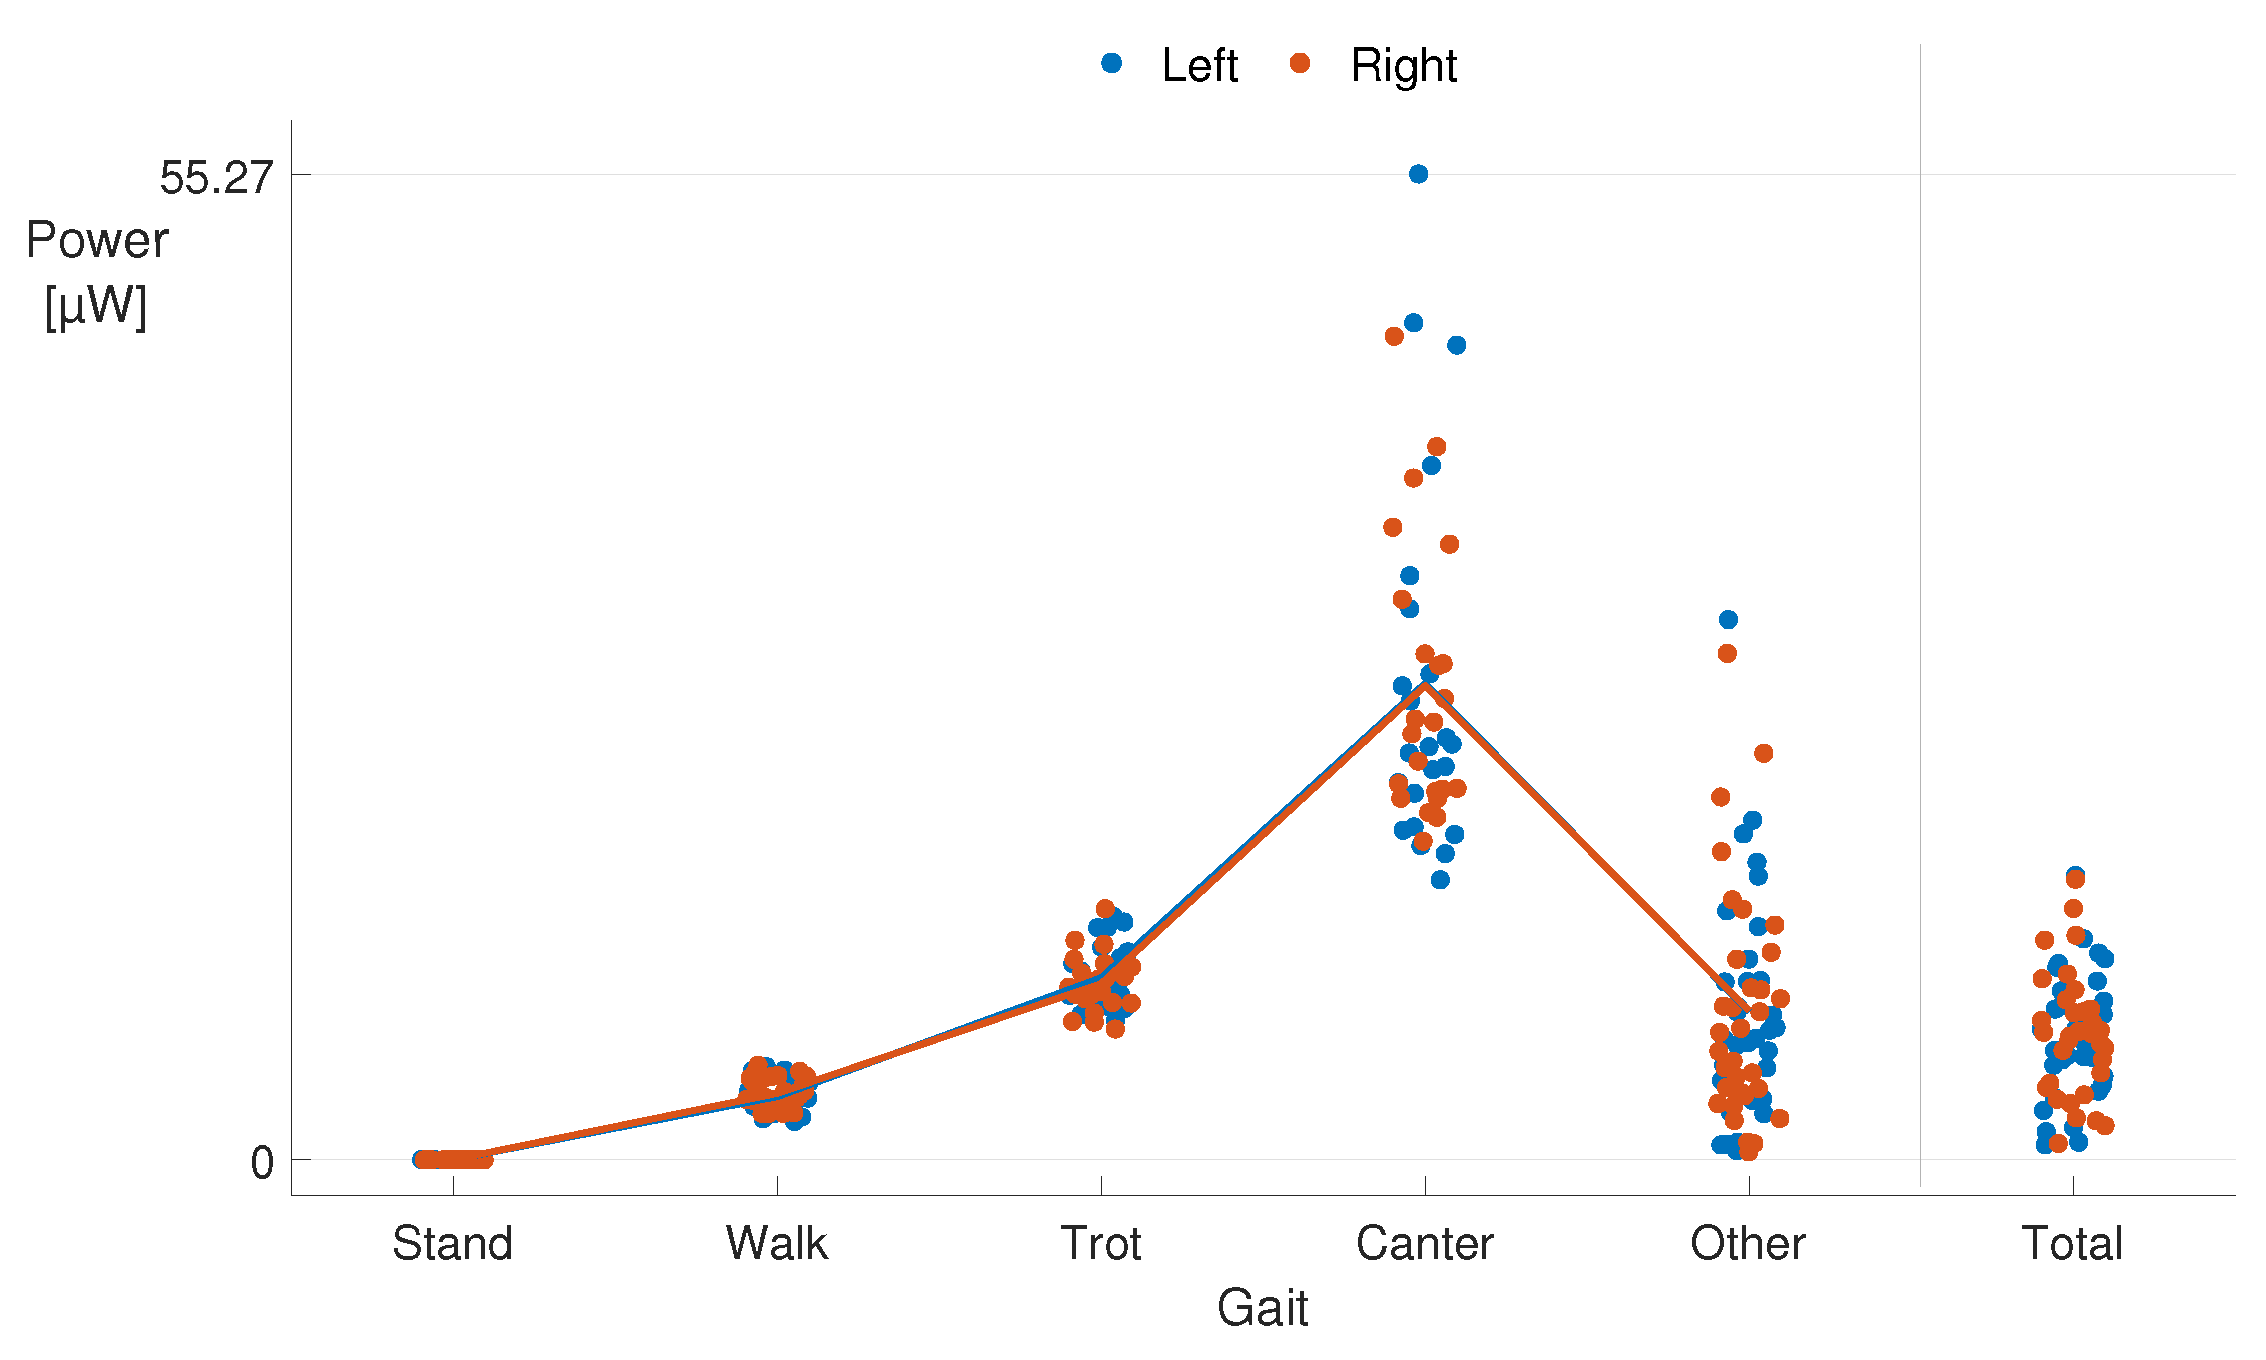
  • Leg: Both front legs were used simultaneously for the data collection. The magnitudes of the harvested power are similar for both legs for the symmetrical gaits (Figure 11).
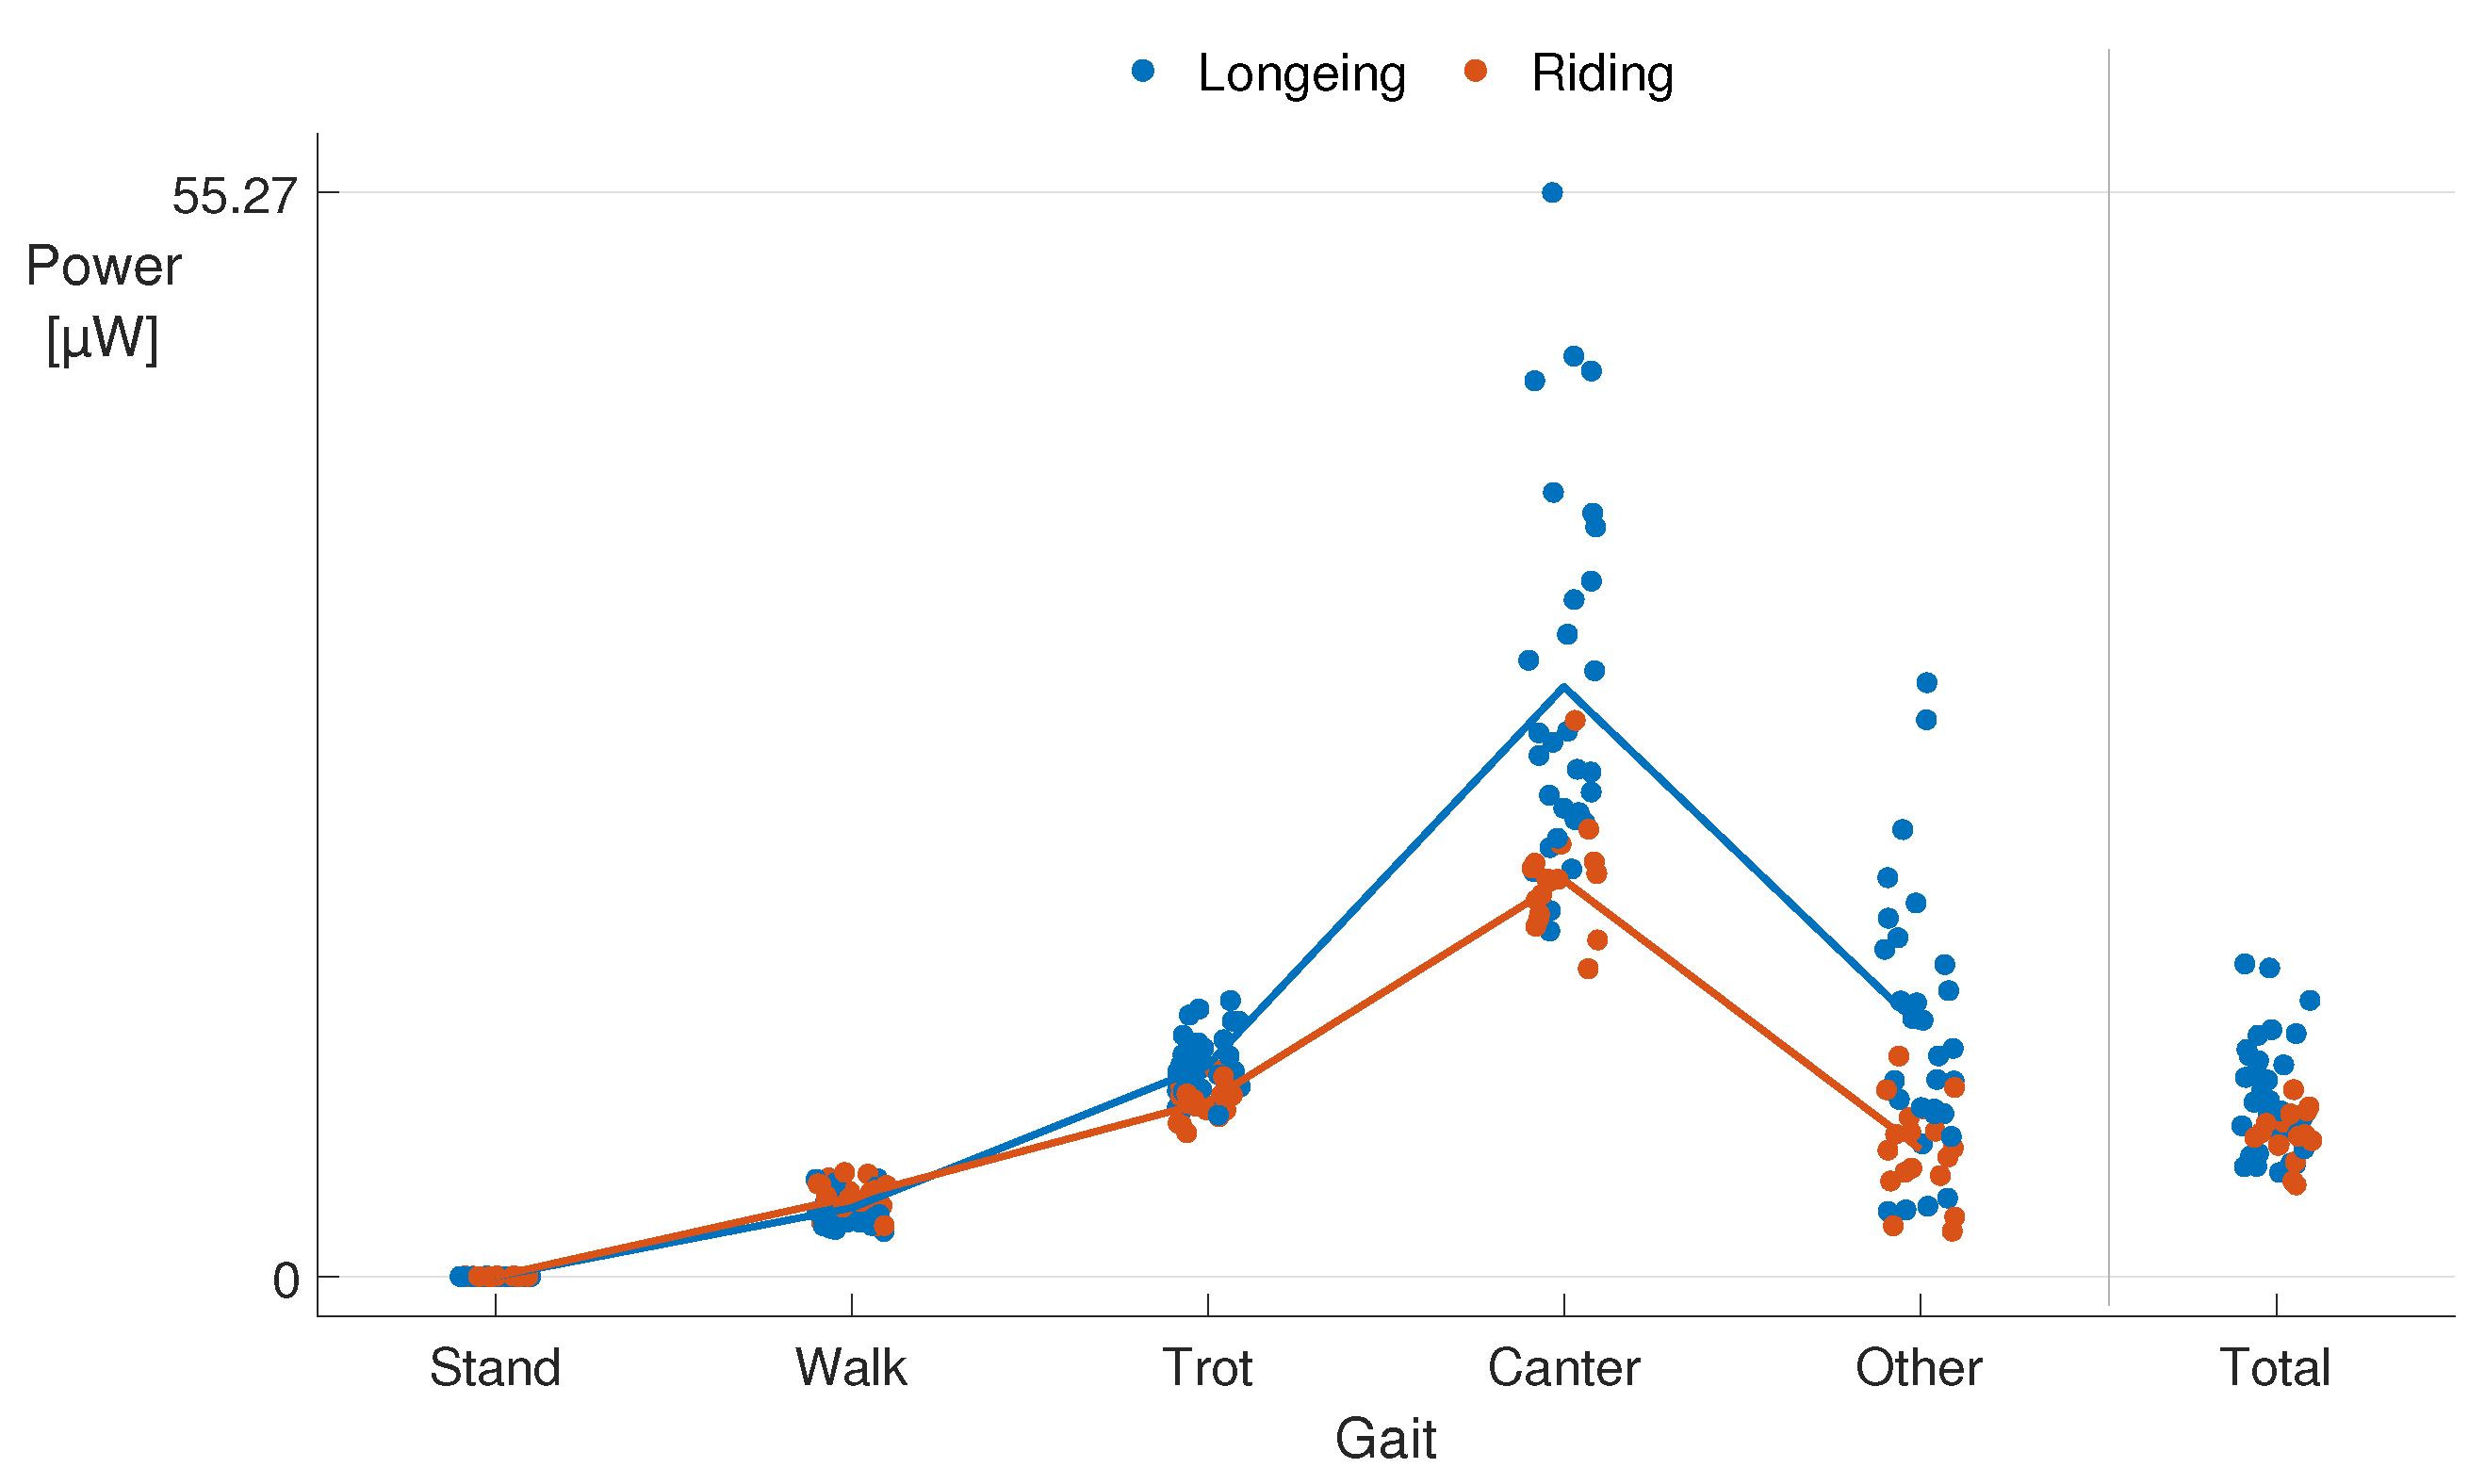
  • Longeing/riding: A significant difference in average power between longeing and riding could be noticed during the canter gait (Figure 12). While during riding, the average power is more stable and less deviations occur, since the movements are more controlled by the rider, the harvested energy during riding is therefore also more predictable.
  • Other movements: In some of the data tracks movements other than the 4 important natural gaits are also available. The data for these movements is rather limited but we can already conclude some trends on movements with possible high energy harvesting. A selection of special movements includes roll, paw, itching, kicking backwards and cross canter. The average power, before and after optimization, the number of samples and the number of datasets where these movements occur, are given in Table 6. Kicking back has good possibilities for the harvesting of energy. Cross canter has the same order of magnitude as canter.
There exist many other possible influences like the environmental conditions, the tempo of the horse gait, the radius of the circle where the horse walks and fatigue of the horse. These factors are influencing the results and challenging to quantify and we did it to the best of our ability to keep them stable throughout the data-acquisition.

5.5. Horse-Human Differences

To assess the amount of generated energy of an energy harvester at a horse, we will compare this analytic results with other papers, using a similar model for velocity-damped resonant generators but without mechanical damping factor and lower conversion rate. The researchers of [38] report energies for human walking around 150–200 μ W. For running this even increase to averages between 612 and 813 μ W. The dominant frequencies at walking (2 Hz) and running (3 Hz) are also double, compared to the corresponding horse gaits. The average absolute deviation D reported is also higher with 8–10 m/s 2 for running and 2–5 m/s 2 for walking, compared to the found maximal value of 3.12 during canter and average of 2.5. For trot and walking the average absolute deviation is only a limited 1.86 and 0.77 respectively. In comparison to human persons, horses are moving with slower movements making it harder to harvest energy.

6. Towards Durable Wireless Monitoring

Finally, in this section we evaluate a possible use case for an energy harvested device. The use case will be evaluated on the potential wireless transmissions, and how these transmissions are behaving in the different gaits. The use case device consists of energy harvester, microcontroller, wireless radio and accelerometer. The accelerometer is included for advanced processing and detection for colics, lameness or other anomalies in the horse’s movement. Sending data statistics will therefore allow the owner of the horse to be signalized for health issues with his horse with limited latency, increasing the chances of survival for the horse. Moreover, the owner can see how active the horse has been during the last minutes, providing useful information about the well being of his horse and adjusting the nutrition of the horse.

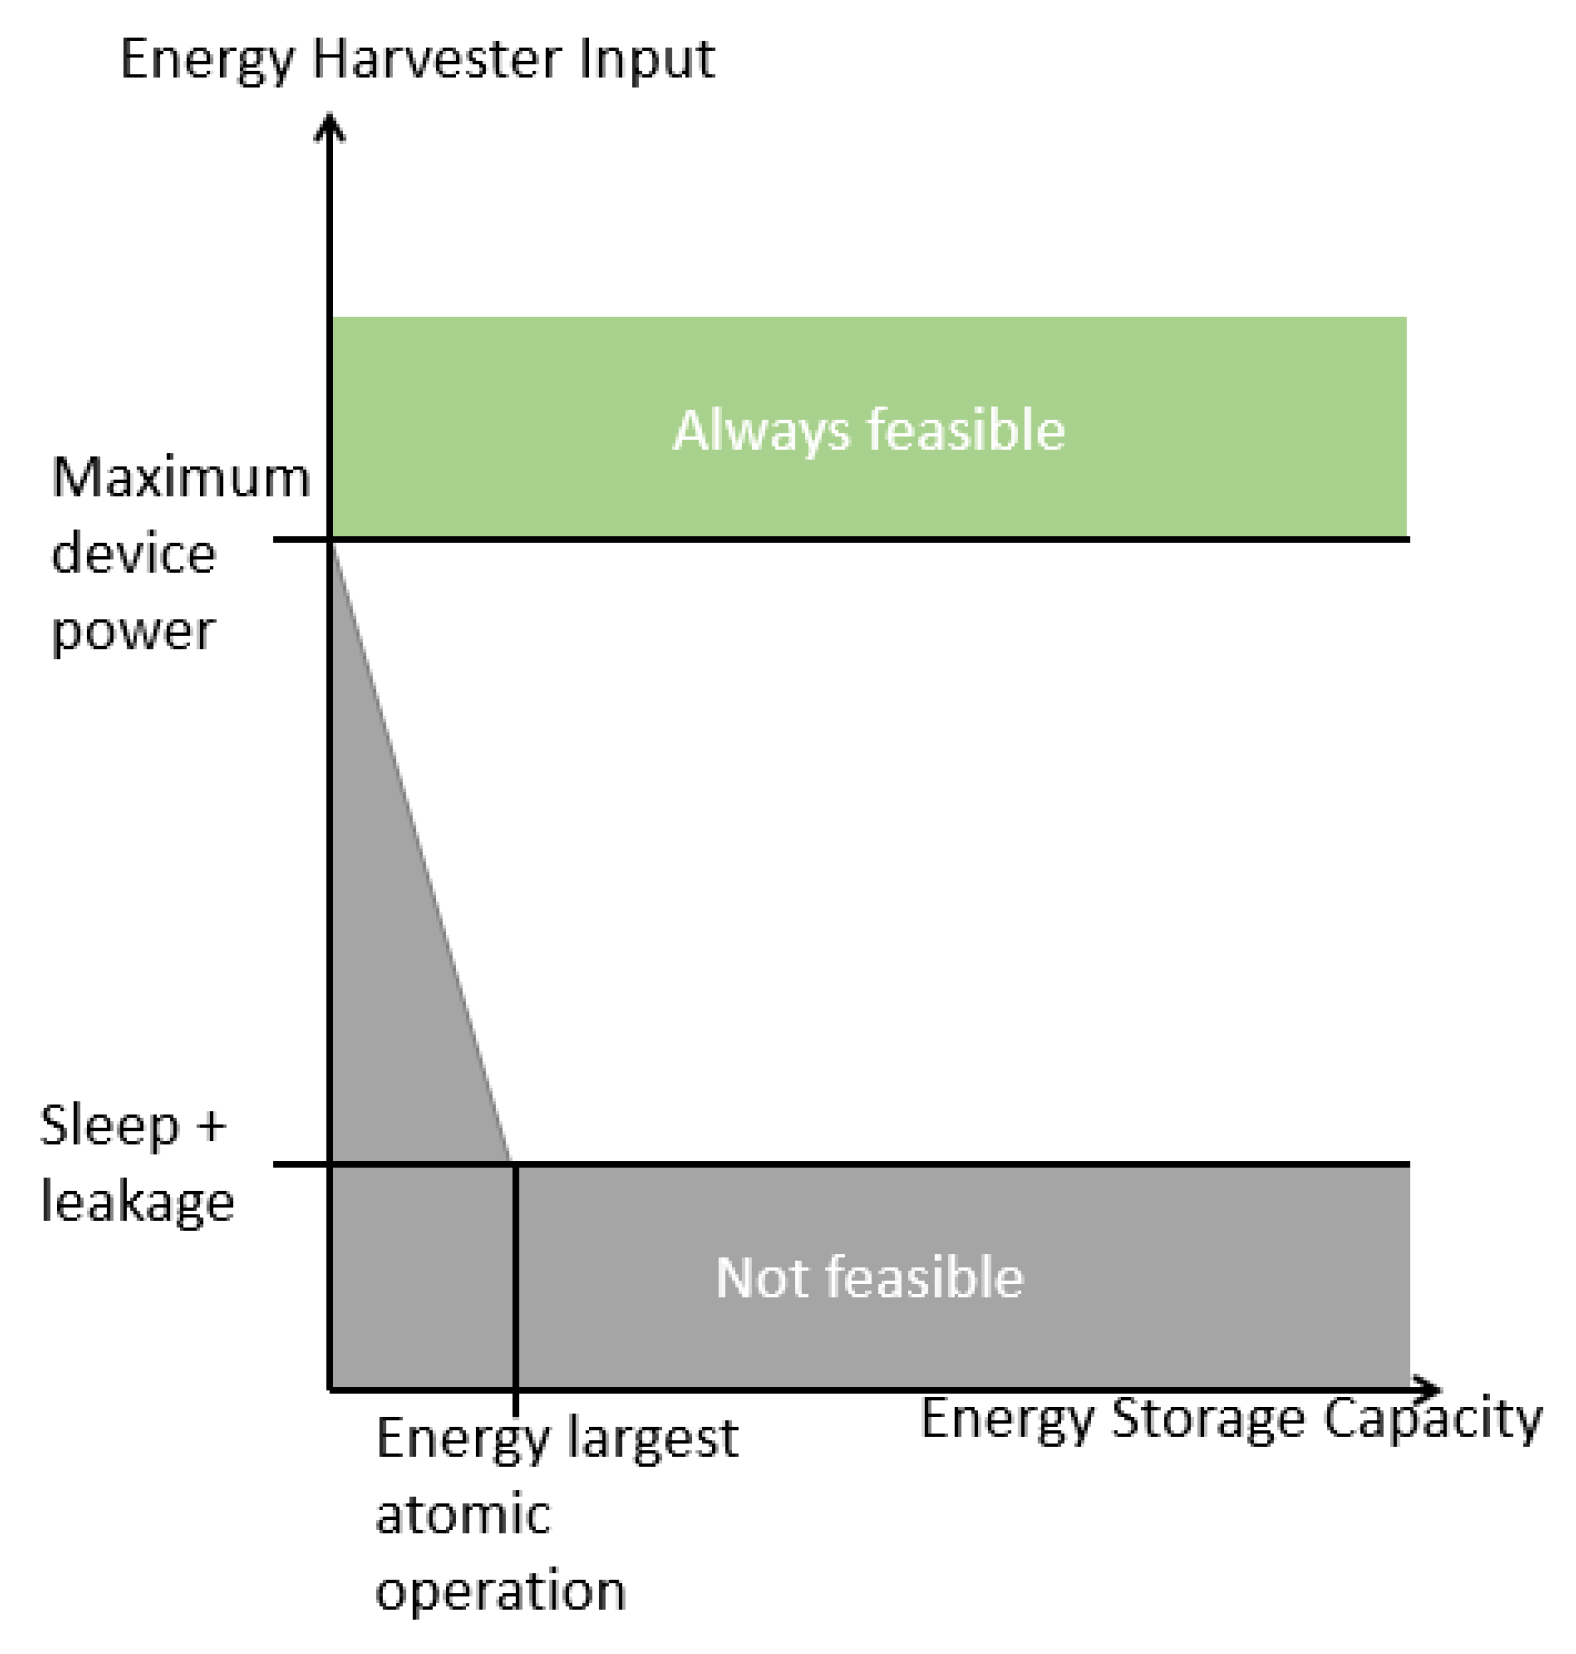
6.1. Feasibility of Sensor Node Based on Kinetic Movement Harvesting

In the wireless node, generally a battery or capacitor will be included for storing limited amounts of energy for reliable performance of the node. Figure 13 shows the feasibility of the energy harvester node which is based on the harvester input and the capacity of the rechargeable battery [52]. Three different operational regions can be distinguished:
  • The system will always be feasible if the harvested power is higher than the maximal power consumption of the device.
  • The system is not feasible if the average input power from the energy harvester is lower than the combined power used for the radio and CPU (deep)sleep mode and the leakage current of the battery. From the results found in the previous sections, the average (deep)sleep power (and leakage of the battery) of the device during standby should be below 0.03 μ W.
  • For systems where the harvested power level falls between these extremes, the designer has to implement (adaptive) energy saving procedures whereby the system is turned on periodically. To this end, the system will periodically turn on the radio, CPU and/or accelerometer. The percentage of time the device is in active mode is also referred to as the duty cycle. A batteryless wireless node can for example make use of the higher energy availability during canter by increasing the duty cycle. In contrast, during standing less energy will be available, and as such lower duty cycles can be used. The relative percentage of different activities of a horse depends strongly on the type of residency (stable versus field), as well as the training schedule. As such, in realistic systems activity recognition can be used for dynamically changing the duty cycle of the sensor node.
In the next section, different duty cycle modes will be calculated for different radios and for the analyzed gaits.

6.2. Feasible Duty Cycle for Wireless Transmissions

To maintain the connection between horse and central node a wireless link is used. Choosing the best suited technology for the use case is a complex trade-off between different parameters. The choice of the technology is based on maximal communication range, energy consumption per byte, throughput, resilience against interference and multipath effects, cost and availability. In Table 7, we give an overview of several potentially suited wireless technologies: LoRa [53], SigFox [54], BLE, WiFi [55,56], UWB [57] and IEEE 802.15.4. In this paper, we will focus on the energy consumption as this parameter has a direct influence on the feasibility of the wireless transmissions. For these six technologies, the current consumption during transmission, the current consumption during the lowest energetic mode (“deep sleep mode”) and the time for sending a 8–12 byte packet are given in Table 7.
Next, we calculate theoretically which of the above technologies are feasible to combine with the leg mounted kinetic energy harvester. We will use a generalized approach and assume a system with constant power consumption levels for a microcontroller unit (MCU) and accelerometer based on off-the-shelf hardware components. For simplicity, we do not take the implementation of the MAC layer into account. We investigate 4 different scenarios, shown in Figure 14:
  • The MCU and accelerometer are continuously in active mode. The radio chip is not put in sleep mode and regularly sends a packet. (Figure 14a).
  • The MCU and accelerometer are continuously in active mode but the radio chip is put in sleep mode and wakes up for transmitting a packet according to a duty cycle. (Figure 14b).
  • The accelerometer is continuously logging and buffering data, but the radio and MCU follows a duty cycle. The MCU will process the data after which the data will be transmitted immediately. (Figure 14c)
  • The MCU and accelerometer are only awake following a duty cycle. After collecting, processing and sending the data, the MCU and accelerometer will go to sleep for some time (Figure 14d).
The duty cycle that can be maintained will be different depending on the considered technology, the gait type and the considered scenario. During the comparison the following assumptions are made:
  • The leakage current of the battery and other irregularities in the hardware circuits are not taken into account.
  • The time for switching between state is assumed negligible together with the accompanying different current consumption.
  • The MCU will always be turned on during the transmission of packets and an extra fixed interval for processing and/or compressing.
The minimal power that is required for a feasible system with an BLE or UWB transceiver for the wireless link is equal to 3.86 μ W and 2.71 μ W , respectively. The major factor here is the power consumption during (deep)sleep. UWB and 802.15.4 have the lowest minimal power and are therefore best suited for low energetic nodes. When only limited amounts of energy are available in the battery-less node, almost all energy will be used for keeping the components in sleep mode and less for transmitting packets. The minimum time between sending packets is shown in Table 8 for the four discussed duty cycling scenarios. As shown in Table 7, the overview of the different technologies, BLE has the smallest required energy per transmitted byte and will be, in terms of power consumption, the best technology for transmitting packets.
Table 8 shows the time between packet transmissions for the most energetic gait (canter). Table 9 gives an overview of the time a horse needs to be in other gaits before one packet can be transmitted, as well as the energy generated from the other axis of the energy harvester. For scenario 3, a practical implementation of a continuous monitoring node will be unfeasible as only canter and trot provide enough power to sleep all the components. For scenario 4, the node will be feasible but during design and implementation it is important to take care of the energy consumption in the node and energy saving/storing for during the stand period is necessary as not enough for power will be generated for sleep mode of the components.

6.3. Decreasing Data Communication Power

The power required of the data communication is highly dependent on the processing and compression of the data in the device. For the envisioned use case device targets analyze the horse health based on accelerometer data, we will compare 2 simplified transmission scenarios on their relative energy budget and therefore their feasibility:
  • This scenario will collect accelerometer data at 25 Hz from the device and transmit this output to a central node.
  • This scenario reduces the amount of transmitted data by local processing of the RAW accelerometer data, sampled at 25 Hz. For example, if we classify the horse’s gait based on the accelerometer output, we only have to transmit the classification to the horse owner.
Scenario 1: If we assume a sampling rate of 25 Hz for the accelerometer data that is collected. For 3 axis of 16 bit data output, this accumulates to 150 bytes per second that needs to be transmitted. For one minute, the total number of bytes that will be transmitted is equal to 60 × 150 = 9000 and a total energy of 2520 μ J will be consumed for transmission.
Scenario 2: The 150 bytes per second that are necessary to transmit for offline processing of the accelerometer data can be further reduced to 1 or even less by embedded processing of this output when classifying the gait with embedded machine learning techniques. Energy measurements for the machine learning model were carried out on a Nvidia Jetson GPU and resulted in 986 μ J for classifying 1 min of accelerometer data. Therefore, the transmitted data is reduced by a factor 150. For one minute the total power consumption for this scenario is 986 μ J + 150 × 0.28 μ J = 1028 μ J.
Removing the accelerometer and use of the available energy for health analysis will further reduce to the total power consumption for one minute by 360 μ J, for both scenarios.
There still exist a gap between predicted power consumption and theoretical predicted power, but by knowing the theoretical calculated values, we can make thought-out decisions and assess the actual feasibility of a horse monitoring wearable for different scenarios.

7. Conclusions and Future Work

The realization of a durable energy harvesting wireless sensor node for horse tracking applications is very challenging. Such a device should contain an accelerometer for data collection, a microcontroller (MCU) for processing and a radio chip for sending (compressed) data in real time. This study investigates if such a device can be powered by a kinetic energy harvester at the leg of the horse, and how often data can be transmitted.
To this end, 33 large scale datasets were collected and analyzed with a model for a velocity-damped resonant generator (VDRG). The energy that is available is dependent on the gait the horse moves in. During canter, the horse energy harvester can generate an average 25.71 μ W, along the forward, y-direction of the movement and an average of 8.56 μ W along the vertical axis of the leg for an non-optimized energy harvester. Optimization and tuning of the resonance frequency increases the average power to 64.04 μ W for the forward direction of the horse movement. Environmental conditions can heavily influence the performance the horse and accompanying the energy harvester. To this end, we studied different possible influences on the performance of the energy harvester. The 33 datasets include measurements from six different horses, where one of them was limping. This limping horse generates a noticeable amount of power more during canter than the others. For all horses, a similar performance of the energy harvester can be recorded in the low power gaits.
We evaluated different technologies for the wireless link from the node to a central system for processing, analyzing and saving the data. The minimal necessary power to hold the MCU, radio transceiver and accelerometer is available during movement (all gaits) but not when the horse is standing still. During the low energetic walking, a high duty cycle, with long sleep periods, has to be maintained before MCU has to be turned on. In this investigation only the PHY layer is taken into account, but we assume different duty cycle scenarios are possible. Only in scenario 4, where radio, MCU and accelerometer are put in sleep mode during the duty cycle, long term monitoring is feasible in most gaits. BLE is the most suited technology as it has a short transmission time and low currents. In every gait, standing excluded, BLE packets can be transmitted with the shortest duty cycle. Depending on the gait, a duty cycle of 0.04 to 0.7 seconds needs to be maintained. However, for low energetic gaits where the duty cycle is low, the sleep current is more important than the transmission energy consumption. For these scenarios, technologies with a lower sleep power, such as UWB and IEEE 802.15.4, are better suited. Giving the application constraints for a small sensor device, signalizing health problems in real time to the horse owner, the accelerometer and MCU will be put in sleep mode according a certain duty cycle and BLE is the technology used for transmission. The number of transmitted packets per minute will be dependent on the activity level of the horse.
Future work: As this work is still in a theoretical phase, the next steps are a strong experimental phase with the in-depth validation of these theoretical results with a non-intrusive prototype performed on a horse and the tuning of the resonance frequency of this harvester based on the theoretical conclusions. Furthermore, the trade-offs between local machine learning processing, compressing and sending less information or sending raw data and processing the data in a remote server environment have to be analyzed. Finally, the influence of the tempo (speed) of the horse during exercises can also be studied in future work for more accurate predicting of the harvested energy and adjustments of the energy management in the wearable.

Author Contributions

Conceptualization: B.V.H. and E.D.P.; Methodology: B.V.H.; Data curation: B.V.H., J.F. and A.E.; Formal analysis: B.V.H.; Funding acquisition: M.D. and E.D.P.; Investigation: B.V.H.; Project administration: M.D. and E.D.P.; Resources: B.V.H. and A.E.; Software: B.V.H.; Supervision: E.D.P.; Validation: B.V.H.; Visualization: B.V.H. and J.F.; Writing—original draft: B.V.H.; Writing—review and editing: B.V.H., J.F., M.D., W.J. and E.D.P. All authors have read and agreed to the published version of the manuscript.

Funding

This research received no external funding.

Acknowledgments

This work was executed within the imec.icon project Hoof-MATE, a research project bringing together academic researchers and industry partners. The Hoof-MATE project was co-financed by imec and received project support from Flanders Innovation & Entrepreneurship (project nr. HBC.2018.0536).

Conflicts of Interest

The authors declare no conflict of interest. The funders had no role in the design of the study; in the collection, analyses, or interpretation of data; in the writing of the manuscript, or in the decision to publish the results.

References

  1. Eerdekens, A.; Deruyck, M.; Fontaine, J.; Martens, L.; Poorter, E.D.; Joseph, W. Automatic equine activity detection by convolutional neural networks using accelerometer data. Comput. Electron. Agric. 2020, 168, 105139. [Google Scholar] [CrossRef]
  2. Bosch, S.; Serra Bragança, F.; Marin-Perianu, M.; Marin-Perianu, R.; Van der Zwaag, B.J.; Voskamp, J.; Back, W.; Van Weeren, R.; Havinga, P. EquiMoves: A Wireless Networked Inertial Measurement System for Objective Examination of Horse Gait. Sensors 2018, 18, 850. [Google Scholar] [CrossRef] [PubMed] [Green Version]
  3. Van Weeren, P.R.; Pfau, T.; Rhodin, M.; Roepstorff, L.; Serra Bragança, F.; Weishaupt, M.A. Do we have to redefine lameness in the era of quantitative gait analysis? Equine Vet. J. 2017, 49, 567–569. [Google Scholar] [CrossRef] [PubMed] [Green Version]
  4. Traub-Dargatz, J.L.; Kopral, C.A.; Seitzinger, A.H.; Garber, L.P.; Forde, K.; White, N.A. Estimate of the national incidence of and operation-level risk factors for colic among horses in the United States, spring 1998 to spring 1999. J. Am. Vet. Med. Assoc. 2001, 219, 67–71. [Google Scholar] [CrossRef] [PubMed] [Green Version]
  5. Curtis, L.; Trewin, I.; England, G.; Burford, J.; Freeman, S. Veterinary practitioners’ selection of diagnostic tests for the primary evaluation of colic in the horse. Vet. Rec. Open 2015, 2, e000145. [Google Scholar] [CrossRef] [Green Version]
  6. Walters, J.M.; Parkin, T.D.; Snart, H.; Murray, R.C. Current Management and Training Practices for UK Dressage Horses. Comp. Exerc. Physiol. 2008, 5, 73–83. [Google Scholar] [CrossRef] [Green Version]
  7. Harris, P.A. Developments in Equine Nutrition: Comparing the Beginning and End of This Century. J. Nutr. 1998, 128, 2698S–2703S. [Google Scholar] [CrossRef] [Green Version]
  8. Saha, P.; Goswami, S.; Chakrabarty, S.; Sarkar, S. Simulation and model verification of shoe embedded piezoelectric energy harvester. In Proceedings of the 2014 6th IEEE Power India International Conference (PIICON), Delhi, India, 5–7 December 2014; pp. 1–6. [Google Scholar] [CrossRef]
  9. Kymissis, J.; Kendall, C.; Paradiso, J.; Gershenfeld, N. Parasitic power harvesting in shoes. In Proceedings of the Digest of Papers, Second International Symposium on Wearable Computers (Cat. No.98EX215), Pittsburgh, PA, USA, 19–20 October 1998; pp. 132–139. [Google Scholar] [CrossRef]
  10. Gatto, A.; Frontoni, E. Energy Harvesting system for smart shoes. In Proceedings of the 2014 IEEE/ASME 10th International Conference on Mechatronic and Embedded Systems and Applications (MESA), Senigallia, Italy, 10–12 September 2014; pp. 1–6. [Google Scholar] [CrossRef]
  11. Luo, J.; Cao, Z.; Yuan, M.; Liang, Y.; Xu, X.; Li, M. Fabrication and characterization of miniature nonlinear piezoelectric harvester applied for low frequency and weak vibration. Results Phys. 2018, 11, 237–242. [Google Scholar] [CrossRef]
  12. Mann, B.; Sims, N. Energy harvesting from the nonlinear oscillations of magnetic levitation. J. Sound Vib. 2009, 319, 515–530. [Google Scholar] [CrossRef] [Green Version]
  13. Ullo, S.; Gallo, M.; Palmieri, G.; Amenta, P.; Russo, M.; Romano, G.; Ferrucci, M.; Ferrara, A.; De Angelis, M. Application of wireless sensor networks to environmental monitoring for sustainable mobility. In Proceedings of the 2018 IEEE International Conference on Environmental Engineering (EE), Milan, Italy, 12–14 March 2018; pp. 1–7. [Google Scholar] [CrossRef]
  14. Dominguez-Morales, J.P.; Rios-Navarro, A.; Dominguez-Morales, M.; Tapiador-Morales, R.; Gutierrez-Galan, D.; Cascado-Caballero, D.; Jimenez-Fernandez, A.; Linares-Barranco, A. Wireless Sensor Network for Wildlife Tracking and Behavior Classification of Animals in Doñana. IEEE Commun. Lett. 2016, 20, 2534–2537. [Google Scholar] [CrossRef]
  15. Zhang, J.; Luo, X.; Chen, C.; Liu, Z.; Cao, S. A Wildlife Monitoring System Based on Wireless Image Sensor Networks. Sens. Transducers J. 2014, 180, 104–109. [Google Scholar]
  16. Omairi, A.; Ismail, Z.H.; Danapalasingam, K.A.; Ibrahim, M. Power Harvesting in Wireless Sensor Networks and Its Adaptation With Maximum Power Point Tracking: Current Technology and Future Directions. IEEE Int. Things J. 2017, 4, 2104–2115. [Google Scholar] [CrossRef]
  17. Bhuvaneswari, P.T.V.; Balakumar, R.; Vaidehi, V.; Balamuralidhar, P. Solar Energy Harvesting for Wireless Sensor Networks. In Proceedings of the 2009 First International Conference on Computational Intelligence, Communication Systems and Networks, Indore, India, 23–25 July 2009; pp. 57–61. [Google Scholar] [CrossRef]
  18. Panatik, K.Z.; Kamardin, K.; Shariff, S.A.; Yuhaniz, S.S.; Ahmad, N.A.; Yusop, O.M.; Ismail, S. Energy harvesting in wireless sensor networks: A survey. In Proceedings of the 2016 IEEE 3rd International Symposium on Telecommunication Technologies (ISTT), Kuala Lumpur, Malaysia, 28–30 November 2016; pp. 53–58. [Google Scholar] [CrossRef]
  19. Voigt, T.; Ritter, H.; Schiller, J. Utilizing solar power in wireless sensor networks. In Proceedings of the 28th Annual IEEE International Conference on Local Computer Networks, LCN ’03, Bonn/Konigswinter, Germany, 20–24 October 2003; pp. 416–422. [Google Scholar] [CrossRef]
  20. Kishore, R.A.; Priya, S. A Review on Low-Grade Thermal Energy Harvesting: Materials, Methods and Devices. Materials 2018, 11, 1433. [Google Scholar] [CrossRef] [PubMed] [Green Version]
  21. Xin, L.; Yang, S.-H. Thermal energy harvesting for WSNs. In Proceedings of the 2010 IEEE International Conference on Systems, Man and Cybernetics, Istanbul, Turkey, 10–13 October 2010; pp. 3045–3052. [Google Scholar] [CrossRef]
  22. Kumari, P.; Sahay, J. Investigation on RF energy harvesting. In Proceedings of the 2017 Innovations in Power and Advanced Computing Technologies (i-PACT), Vellore, India, 21–22 April 2017; pp. 1–5. [Google Scholar] [CrossRef]
  23. Lu, X.; Wang, P.; Niyato, D.; Kim, D.I.; Han, Z. Wireless Networks With RF Energy Harvesting: A Contemporary Survey. IEEE Commun. Surv. Tutor. 2015, 17, 757–789. [Google Scholar] [CrossRef] [Green Version]
  24. Li, K.; He, Q.; Wang, J.; Zhou, Z.; Li, X. Wearable energy harvesters generating electricity from low-frequency human limb movement. Microsyst. Nanoeng. 2018, 4, 1–13. [Google Scholar] [CrossRef] [PubMed]
  25. Zhao, J.; You, Z. A Shoe-Embedded Piezoelectric Energy Harvester for Wearable Sensors. Sensors 2014, 14, 12497–12510. [Google Scholar] [CrossRef] [PubMed]
  26. Sravanthi, C.; Conrad, J.M. A survey of energy harvesting sources for embedded systems. In Proceedings of the IEEE SoutheastCon 2008, Huntsville, AL, USA, 3–6 April 2008; pp. 442–447. [Google Scholar] [CrossRef]
  27. Aminov, P.; Agrawal, J.P. RF Energy Harvesting. In Proceedings of the 2014 IEEE 64th Electronic Components and Technology Conference (ECTC), Orlando, FL, USA, 27–30 May 2014; pp. 1838–1841. [Google Scholar] [CrossRef]
  28. Radoi, I.E.; Mann, J.; Arvind, D.K. Tracking and monitoring horses in the wild using wireless sensor networks. In Proceedings of the 2015 IEEE 11th International Conference on Wireless and Mobile Computing, Networking and Communications (WiMob), Abu Dhabi, UAE, 19–21 October 2015; pp. 732–739. [Google Scholar] [CrossRef] [Green Version]
  29. Robilliard, J.J.; Pfau, T.; Wilson, A.M. Gait characterisation and classification in horses. J. Exp. Biol. 2007, 210, 187–197. [Google Scholar] [CrossRef] [Green Version]
  30. Lopes, M.; Dearo, A.; Lee, A.; Reed, S.K.; Kramer, J.; Pai, P.; Yonezawa, Y.; Maki, H.; Morgan, T.L.; Wilson, D.A.; et al. An attempt to detect lameness in galloping horses by use of body-mounted inertial sensors. Am. J. Vet. Res. 2016, 77, 1121–1131. [Google Scholar] [CrossRef]
  31. Khelifi, A.; Hamli, R.A.; Tamimi, S.A.; Ali, R.A. An Automated System for Monitoring Horses Vital Signs Using Heart Beat Sensors. In Proceedings of the 2017 Palestinian International Conference on Information and Communication Technology (PICICT), Gaza City, Palestina, 8–9 May 2017; pp. 53–59. [Google Scholar] [CrossRef]
  32. Equicty. Equicty Stable Managment Software. Available online: https://www.equicty.com/ (accessed on 17 May 2019).
  33. Trackener: 24/7 Horse Monitoring Device and App. Available online: https://www.trackener.com/product (accessed on 12 May 2019).
  34. Axivity. AX3 Data Sheet Version 1.3. 2015. Available online: https://axivity.com/files/resources/AX3DataSheet.pdf (accessed on 12 May 2019).
  35. Beeby, S.P.; Tudor, M.J.; White, N.M. Energy harvesting vibration sources for microsystems applications. Meas. Sci. Technol. 2006, 17, R175–R195. [Google Scholar] [CrossRef]
  36. Cook-Chennault, K.A.; Thambi, N.; Sastry, A.M. Powering MEMS portable devices—A review of non-regenerative and regenerative power supply systems with special emphasis on piezoelectric energy harvesting systems. Smart Mater. Struct. 2008, 17, 043001. [Google Scholar] [CrossRef] [Green Version]
  37. Sari, I.; Balkan, T.; Kulah, H. An electromagnetic micro power generator for wideband environmental vibrations. Sens. Actuators Phys. 2008, 145–146, 405–413. [Google Scholar] [CrossRef]
  38. Gorlatova, M.; Sarik, J.; Grebla, G.; Cong, M.; Kymissis, I.; Zussman, G. Movers and Shakers: Kinetic Energy Harvesting for the Internet of Things. IEEE J. Sel. Areas Commun. 2015, 33, 1624–1639. [Google Scholar] [CrossRef] [Green Version]
  39. Yun, J.; Patel, S.; Reynolds, M.; Abowd, G. A Quantitative Investigation of Inertial Power Harvesting for Human-Powered Devices. In Proceedings of the 10th International Conference on Ubiquitous Computing (UbiComp ’08), Seoul, Korea, 21–24 September 2008; pp. 74–83. [Google Scholar] [CrossRef] [Green Version]
  40. Von Buren, T.; Mitcheson, P.D.; Green, T.C.; Yeatman, E.M.; Holmes, A.S.; Troster, G. Optimization of inertial micropower Generators for human walking motion. IEEE Sens. J. 2006, 6, 28–38. [Google Scholar] [CrossRef]
  41. Yun, J.; Patel, S.N.; Reynolds, M.S.; Abowd, G.D. Design and Performance of an Optimal Inertial Power Harvester for Human-Powered Devices. IEEE Trans. Mob. Comput. 2011, 10, 669–683. [Google Scholar] [CrossRef]
  42. Ju, Q.; Li, H.; Zhang, Y. Power Management for Kinetic Energy Harvesting IoT. IEEE Sens. J. 2018, 18, 4336–4345. [Google Scholar] [CrossRef]
  43. Mitcheson, P.D.; Green, T.C.; Yeatman, E.M.; Holmes, A.S. Architectures for vibration-driven micropower generators. J. Microelectromech. Syst. 2004, 13, 429–440. [Google Scholar] [CrossRef] [Green Version]
  44. Ashraf, K.; Khir, M.H.M.; Dennis, J.O.; Baharudin, Z. Frequency dependence of quality factor in vibration energy harvesting. In Proceedings of the RSM 2013 IEEE Regional Symposium on Micro and Nanoelectronics, Langkawi, Malaysia, 25–27 September 2013; pp. 151–154. [Google Scholar]
  45. Rantz, R.; Roundy, S. Characterization of Real-world Vibration Sources and Application to Nonlinear Vibration Energy Harvesters. Energy Harvest. Syst. 2017, 4, 67–76. [Google Scholar] [CrossRef]
  46. Toshiyoshi, H.; Ju, S.; Honma, H.; Ji, C.H.; Fujita, H. MEMS vibrational energy harvesters. Sci. Technol. Adv. Mater. 2019, 20, 124–143. [Google Scholar] [CrossRef] [Green Version]
  47. Roundy, S.; Wright, P.K.; Rabaey, J. A study of low level vibrations as a power source for wireless sensor nodes. Comput. Commun. 2003, 26, 1131–1144. [Google Scholar] [CrossRef]
  48. Mitcheson, P.D.; Yeatman, E.M.; Rao, G.K.; Holmes, A.S.; Green, T.C. Energy Harvesting From Human and Machine Motion for Wireless Electronic Devices. Proc. IEEE 2008, 96, 1457–1486. [Google Scholar] [CrossRef] [Green Version]
  49. The Mathworks, Inc. MATLAB Version 9.5.0.944444 (R2018b); The Mathworks, Inc.: Natick, MA, USA, 2015. [Google Scholar]
  50. Analog Devices. LTC3588-1 Datasheet. Rev C. 2010. Available online: https://www.analog.com/media/en/technical-documentation/data-sheets/35881fc.pdf (accessed on 23 April 2020).
  51. Ashraf, K.; Khir, M.H.M.; Dennis, J.O.; Baharudin, Z. A wideband, frequency up-converting bounded vibration energy harvester for a low-frequency environment. Smart Mater. Struct. 2013, 22, 025018. [Google Scholar] [CrossRef]
  52. Jackson, N.; Adkins, J.; Dutta, P. Capacity over Capacitance for Reliable Energy Harvesting Sensors. In Proceedings of the 18th International Conference on Information Processing in Sensor Networks, Montreal, QC, Canada, 16–18 April 2019; ACM: New York, NY, USA, 2019; pp. 193–204. [Google Scholar] [CrossRef] [Green Version]
  53. Bouguera, T.; Diouris, J.F.; Chaillout, J.J.; Jaouadi, R.; Andrieux, G. Energy Consumption Model for Sensor Nodes Based on LoRa and LoRaWAN. Sensors 2018, 18, 2104. [Google Scholar] [CrossRef] [PubMed] [Green Version]
  54. Gomez, C.; Veras, J.C.; Vidal, R.; Casals, L.; Paradells, J. A Sigfox Energy Consumption Model. Sensors 2019, 19, 681. [Google Scholar] [CrossRef] [PubMed] [Green Version]
  55. Tozlu, S. Feasibility of Wi-Fi enabled sensors for Internet of Things. In Proceedings of the 2011 7th International Wireless Communications and Mobile Computing Conference, Istanbul, Turkey, 4–8 July 2011; pp. 291–296. [Google Scholar] [CrossRef]
  56. Texas Instruments Incorporated. CC3100 SimpleLink™ Wi-Fi® Network Processor, Internet-of-Things Solution for MCU Applications. Revision 2015 ed. 2015. Available online: https://www.ti.com/lit/ds/swas031d/swas031d.pdf (accessed on 2 March 2020).
  57. Decawave Ltd. DW1000 Datasheet. Revision 2.09. 2015. Available online: https://www.decawave.com/sites/default/files/resources/dw1000-datasheet-v2.09.pdf (accessed on 2 March 2020).
  58. Semtech Corporation. SX1272/73-860 MHz to 1020 MHz Low Power Long Range Transceiver. 2019. Available online: https://semtech.my.salesforce.com/sfc/p/#E0000000JelG/a/440000001NCE/v_VBhk1IolDgxwwnOpcS_vTFxPfSEPQbuneK3mWsXlU (accessed on 2 March 2020).
  59. Atmel Corporation. ATA8520 Single-Chip SIGFOX RF Transmitter—Datasheet. 2015. Available online: http://ww1.microchip.com/downloads/en/DeviceDoc/Atmel-9372-Smart-RF-ATA8520_Datasheet.pdf (accessed on 2 March 2020).
  60. Nordic Semiconductor Ltd. Nordic Semiconductor Devzone. Available online: https://devzone.nordicsemi.com/nordic/power/w/opp/2/online-power-profiler-for-ble (accessed on 2 March 2020).
  61. Texas Instruments Incorporated. 2.4 GHz IEEE 802.15.4 / ZigBee-Ready RF Transceiver. Revision 2015 ed.. 2019. Available online: https://www.ti.com/lit/ds/symlink/cc2420.pdf (accessed on 2 March 2020).
Figure 1. The accelerometer logging sensors are attached at the lateral side of both front legs. The x-direction is pointing downwards, the y-direction backwards and the z-direction sidewards of the horse.
Electronics 09 01730 g001
Figure 2. The collected datasets have different relative distributions for the different gaits. The majority of the datasets contains data for the horse in the four different natural gaits (Stand, Walk, Trot and Canter). Some of the datasets capture other types of movement (rolling: datasets 30, 32 and 33; pawing: dataset 18 and flank-watching: dataset 24).
Electronics 09 01730 g002
Figure 3. The total power spectrum is the sum of the separate spectra for dataset 19. For canter the maximum lies at a higher frequency as for trot. Both gaits contribute to the general spectrum of the dataset.
Electronics 09 01730 g003
Figure 4. The different dominant frequencies in the x-axis for multiple gaits (top the spectrogram) is shown for frequencies between 0 and 5 Hz. The bottom graph shows the accelerometer data on the same time scale. In the dataset, the different gaits alternate each other and the transition between the different gaits is labeled as ‘other’. In the gaits themselves, small variations between most energetic frequencies and energy levels can be seen.
Electronics 09 01730 g004
Figure 5. The top y-axis shows the accelerometer data track, where higher accelerations can be seen during canter (purple) than during walking (orange) and trot (yellow). The bottom uses the same time scale, shows the amount of motion (colorized for the different gaits) and the general trend (black line) for the amount of motion. The amount of motion during canter is higher than during trot, walking and stand.
Electronics 09 01730 g005
Figure 6. Average absolute deviation D (m/s 2 ) for different gaits for all datasets, the y-direction (orange) has the highest average absolute deviation compared to x (blue) and z (yellow) directions. For the higher energetic gaits, the spread over the different datasets is larger.
Electronics 09 01730 g006
Figure 7. Second-order mass-spring model and associated parameters of a velocity-damped resonant generator.
Electronics 09 01730 g007
Figure 8. Movements of high accelerometer signals (top) axis corresponds to large displacements (middle axis) and higher resulted powers (bottom). Only when movement is present in the accelerometer signal, power can be generated according to the analytical model.
Electronics 09 01730 g008
Figure 9. The harvested power with optimal parameters ( μ W), for the x (blue), y (orange) and z (yellow) axis. Canter is the most profitable gait, the y-direction is the best suited orientation with most possibilities. The best dataset could reach an average of 85.61 μ W during canter, although a lot of difference between the energy levels of canter in the different datasets has to be noticed.
Electronics 09 01730 g009
Figure 10. Harvested power for the four different horses. The limping horse (3) has a significant higher power generation during canter than the other ones.
Electronics 09 01730 g010
Figure 11. The average generated power in both legs is similar for stand, walk and trot. In canter, the right front leg generates a higher average power.
Electronics 09 01730 g011
Figure 12. The average (line) of the longeing (blue) datasets is remarkably higher than the average of the riding red datasets in canter gait, although no clustering or clear separation can be seen for both techniques. The longeing datasets clearly have more energetic “other” movements.
Electronics 09 01730 g012
Figure 13. An energy harvesting node can never be feasible when its input is lower than the lowest current consumption of the device and the leakage in the device. In contrary, it will always be feasible when the harvested power exceeds the device maximum energy consumption.
Electronics 09 01730 g013
Figure 14. Putting the radio (dark blue), microcontroller unit (MCU) (blue) and accelerometer (ACC) (light blue) in sleep mode can have an extensive current consumption reduction. Increasing the duty cycle will increase the reduction even more. The current when all three components are in sleep mode will be the lowest possible current and determines the feasibility of the node. The radio has three states (TX-idle-sleep), MCU en ACC has two states (idle-sleep).
Electronics 09 01730 g014
Table 1. For this study, 33 datasets have been collected. The different properties of the datasets allow to study the impact of different environmental conditions.
number of datasets33
number of horses6
horse age7–19
Sampling rate25–1600 Hz
sand mixed
Surfacewith GEOPAT polyflakes (31 datasets)
hard (1 dataset)/ field (1 dataset)
length datasets1.93 × 106 samples
total dataset time5.36 h
datasets with standing27
datasets with walking30
datasets with trot25
datasets with canter23
Table 2. The average values for the harvested energy are the highest in the y-direction and reaches up to 25.71 μ W of average harvested power during canter. The total datasets averages at 6.23 μ W for the y-direction of the sensor.
xyz
( μ W)( μ W)( μ W)
stand0.0100
walk1.763.070.43
trot4.2811.821.56
canter8.5625.714.23
other2.256.491.39
total2.416.230.99
Table 3. Energy available in the sensor node when the horse is in different gaits. Canter has the highest average power, during stand almost no power is generated. Optimization of the resonance frequency can give high improvements, in particular for the higher energetic gaits.
Before Optimization
( μ W)
After Optimization
( μ W)
Total Number of Samples
stand00.01 3.17 × 10 4
walk3.077.39 1.46 × 10 5
trot11.8230.19 1.02 × 10 5
canter25.7164.04 3.36 × 10 4
other6.4916.12 8.34 × 10 4
total6.2315.52 3.96 × 10 5
Table 4. Number of total recorded steps and their average energy in the gaits.
StandWalkTrotCanterOtherTotal
Energy ( μ J)0.239.4721.0035.3717.3914.34
steps30431747131939206713,159
Length step (s)1.30.80.63
Table 5. The majority of the datasets is collected for horses 2 and 4. Only 1 dataset is measured for the Friesian horse (5) and pony (6).
Horse123456
nr datasts51251111
Table 6. Different movements will generate different amounts of power with an energy harvester. Kicking backwards can generate a high average power but this movement is rarely performed by the horse.
Optimized
Average Power
( μ W)
Average Power
( μ W)
Nr of SamplesNr of Data-Sets
roll3.626.8427316
paw0.110.2815132
itching0.140.253233
cross canter9.5533.42696511
kicking back5.6541.02571
Table 7. Overview of the energy consumption of multiple potential suitable technologies for collecting the data. The lowest current state is important to calculate the “not feasible” region of Figure 13. The number of payload bytes is chosen the same across the technologies to be able to compare, although some technologies (WiFi, UWB, etc.) are more efficient for high throughputs.
TechnologyChipTransmit Current
mA
Lowest Current
( μ A)
Bytes Per Packet
 
Time Per Packet
(ms)
Energy Per Byte
( μ J)
LoRaSX1272 [58]180.1103.7422.22
SigFoxATA8520 [59]27.21612208015,558.00
BLEnRF52840 [60]40.4100.2080.28
802.15.4CC2420 [61]8.50.028621.04
WiFiCC3100 [56]1604811.3745.80
UWBDW1000 [57]1600.05100.178.98
Table 8. Time a device has to spend in the most energetic gait (canter) before a packet of 8-12 bytes can be send. BLE is the best suited for efficient transmissions between sender and receiver. However, even for BLE if the transceiver and/or MCU are not put in to sleep after processing and transmission of the data, the node will never be feasible.
1234
LoRa10.14 s6.99 s
SigFox33,271 s
BLE0.06 s0.04 s
WiFi449 s270 s
UWB2.42 s1.67 s
802.15.44.69 s3.24 s
Table 9. Time (in seconds) a device has to harvest energy before one BLE packet of 10 bytes can be transmitted. An overview is given for different gaits and axis of the energy harvester.
Scenario 3Scenario 4
xyzxyz
stand
walk0.69 s
trot0.32 s0.32 s0.09 s
canter0.28 s0.06 s0.09 s0.04 s0.52 s
other0.60 s0.19 s
all0.82 s0.21 s
Publisher’s Note: MDPI stays neutral with regard to jurisdictional claims in published maps and institutional affiliations.

