
Multi-Modal Clustering Events Observed by Horizon-10T and Axion Quark Nuggets


Physics and Astronomy Department, University of British Columbia, Vancouver, BC V6T 1Z1, Canada
Universe 2021, 7(10), 384; https://0-doi-org.brum.beds.ac.uk/10.3390/universe7100384
Submission received: 18 August 2021
/
Revised: 8 October 2021
/
Accepted: 12 October 2021
/
Published: 15 October 2021
(This article belongs to the Special Issue Origins and Natures of Inflation, Dark Matter and Dark Energy)
Abstract
:The Horizon-10T collaboration have reported observation of Multi-Modal Events (MME) containing multiple peaks suggesting their clustering origin. These events are proven to be hard to explain in terms of conventional cosmic rays (CR). We propose that these MMEs might be result of the dark matter annihilation events within the so-called axion quark nugget (AQN) dark matter model, which was originally invented for completely different purpose to explain the observed similarity between the dark and the visible components in the Universe, i.e., without any fitting parameters. We support this proposal by demonstrating that the observations, including the frequency of appearance, intensity, the spatial distribution, the time duration, the clustering features, and many other properties nicely match the emission characteristics of the AQN annihilation events in atmosphere. We list a number of features of the AQN events which are very distinct from conventional CR air showers. The observation (non-observation) of these features may substantiate (refute) our proposal.
1. Introduction
In this work we discuss two naively unrelated stories. The first one deals with the recent puzzling observations [1,2,3,4,5] by the Horizon-10T (H10T) collaboration of the Multi-Modal Events (MME).
The second one is the study of a specific dark matter (DM) model, the so-called axion quark nugget (AQN) model [6], see a brief overview of this model below. We overview the corresponding events below in details. We also highlight some difficulties in interpretation of these events in terms of the standard CR air showers. The unusual features of MME include:
- 1.
- “clustering puzzle”: Two or more peaks separated by ∼ ns are present in several detection points, while entire event may last ∼ ns. It can be viewed as many fronts separated by ∼(–) ns, instead of a single front;
- 2.
- “particle density puzzle”: The number density of particles recorded at different detection points apparently weakly dependent on distance from Extensive Air Showers (EAS) axis;
- 3.
- “pulse width puzzle”: The width of each individual pulse is around (20–35) ns and apparently does not depend on distance from EAS axis;
- 4.
- “intensity puzzle”: The observed intensity of the events (measured in units of a number of particles per unit area) is of order (100–300)
When measured at distances (300–800) m from EAS axis. Such intensity would correspond to the CR energy of the primary particle on the level eV which would have dramatically different event rate in comparison with observed rate recorded by H10T.
Before we proceed with our explanation of the proposal to view the MMEs as the AQN events one should mention that similar unusual features of the CR air showers have been noticed long ago for the first time by Jelley and Whitehouse [7] in 1953. Later, EAS exhibiting the unusual time structures were studied by several independent experiments, see e.g., [8]. We refer to ref. [2] for overview and references of the older observations and studies of such unusual events.
The considerable recent advances in rising the resolution (on the level of a few ns) has allowed the H10T collaboration dramatically improve the collection and analysis of the MMEs. In particular, during ∼3500 h of operation the H10T collaboration collected more than MMEs.
In what follows we overview the observation [1,2,3,4,5] by emphasizing the puzzling nature of these events if interpreted as conventional EAS events. At the same time the same observations can be explained in very natural way if interpreted in terms of the AQN annihilation events as we shall argue in this work. One should mention here that a similar conclusion has been also reached for a different type of unusual CR-like events. First, it has been argued in [9,10] that the Telescope Array (TA) “mysterious bursts” [11,12] can be naturally interpreted as the AQN events. Secondly, it has been also argued in [13] that the Antarctic Impulse Transient Antenna (ANITA) observation [14,15,16] of two anomalous events with noninverted polarity might be also a consequence of the AQN annihilation events. Important comment here that in all those cases the basic parameters of the AQN model remain the same as they have been fixed long ago from dramatically different observations in a very different context.
Our presentation is organized as follows. In next Section 2 we explain why the observation [1,2,3,4,5] listed as 1–4 puzzles are very mysterious events if interpreted as conventional EAS events. In Section 3 we give a brief overview of the AQN framework with emphasize on the key elements relevant for the present studies. In Section 4 we formulate our proposal on identification of the unusual Multi-Modal Events with the upward moving AQN events. In Section 5 we estimate the event rate. Our main section is Section 6 where we estimate a variety of relevant time scales and the intensity of the events. In the same section we also confront our proposal with observations and argue that puzzles 1–4 can be naturally understood within the AQN framework. Section 7 is our conclusion where we suggest several tests which may substantiate or refute our proposal on identification of the Multi-Modal Cluster Events with the upward moving AQNs.
2. Conventional CR Picture Confronts the MME Observations
This section is devoted to the first part of our story where we describe the MME observations [1,2,3,4,5] and argue why the observed events are inconsistent with conventional CR interpretation, while the next Section 3 is devoted to the second part of our story, the AQN dark matter model.
We start by reviewing the conventional picture of the EAS. It is normally assumed that EAS can be thought as a disk -pancake with well defined EAS axis. It is also assumed that EAS represents an uniform, without any breaks structure. The standard picture also assumes that the particle density drops smoothly with distance when moving away from the core, while the thickness of the EAS pancake increases with the distance from the core. Now we want to see why this conventional picture is in dramatic contradiction with observations of the MME events.
- 1.
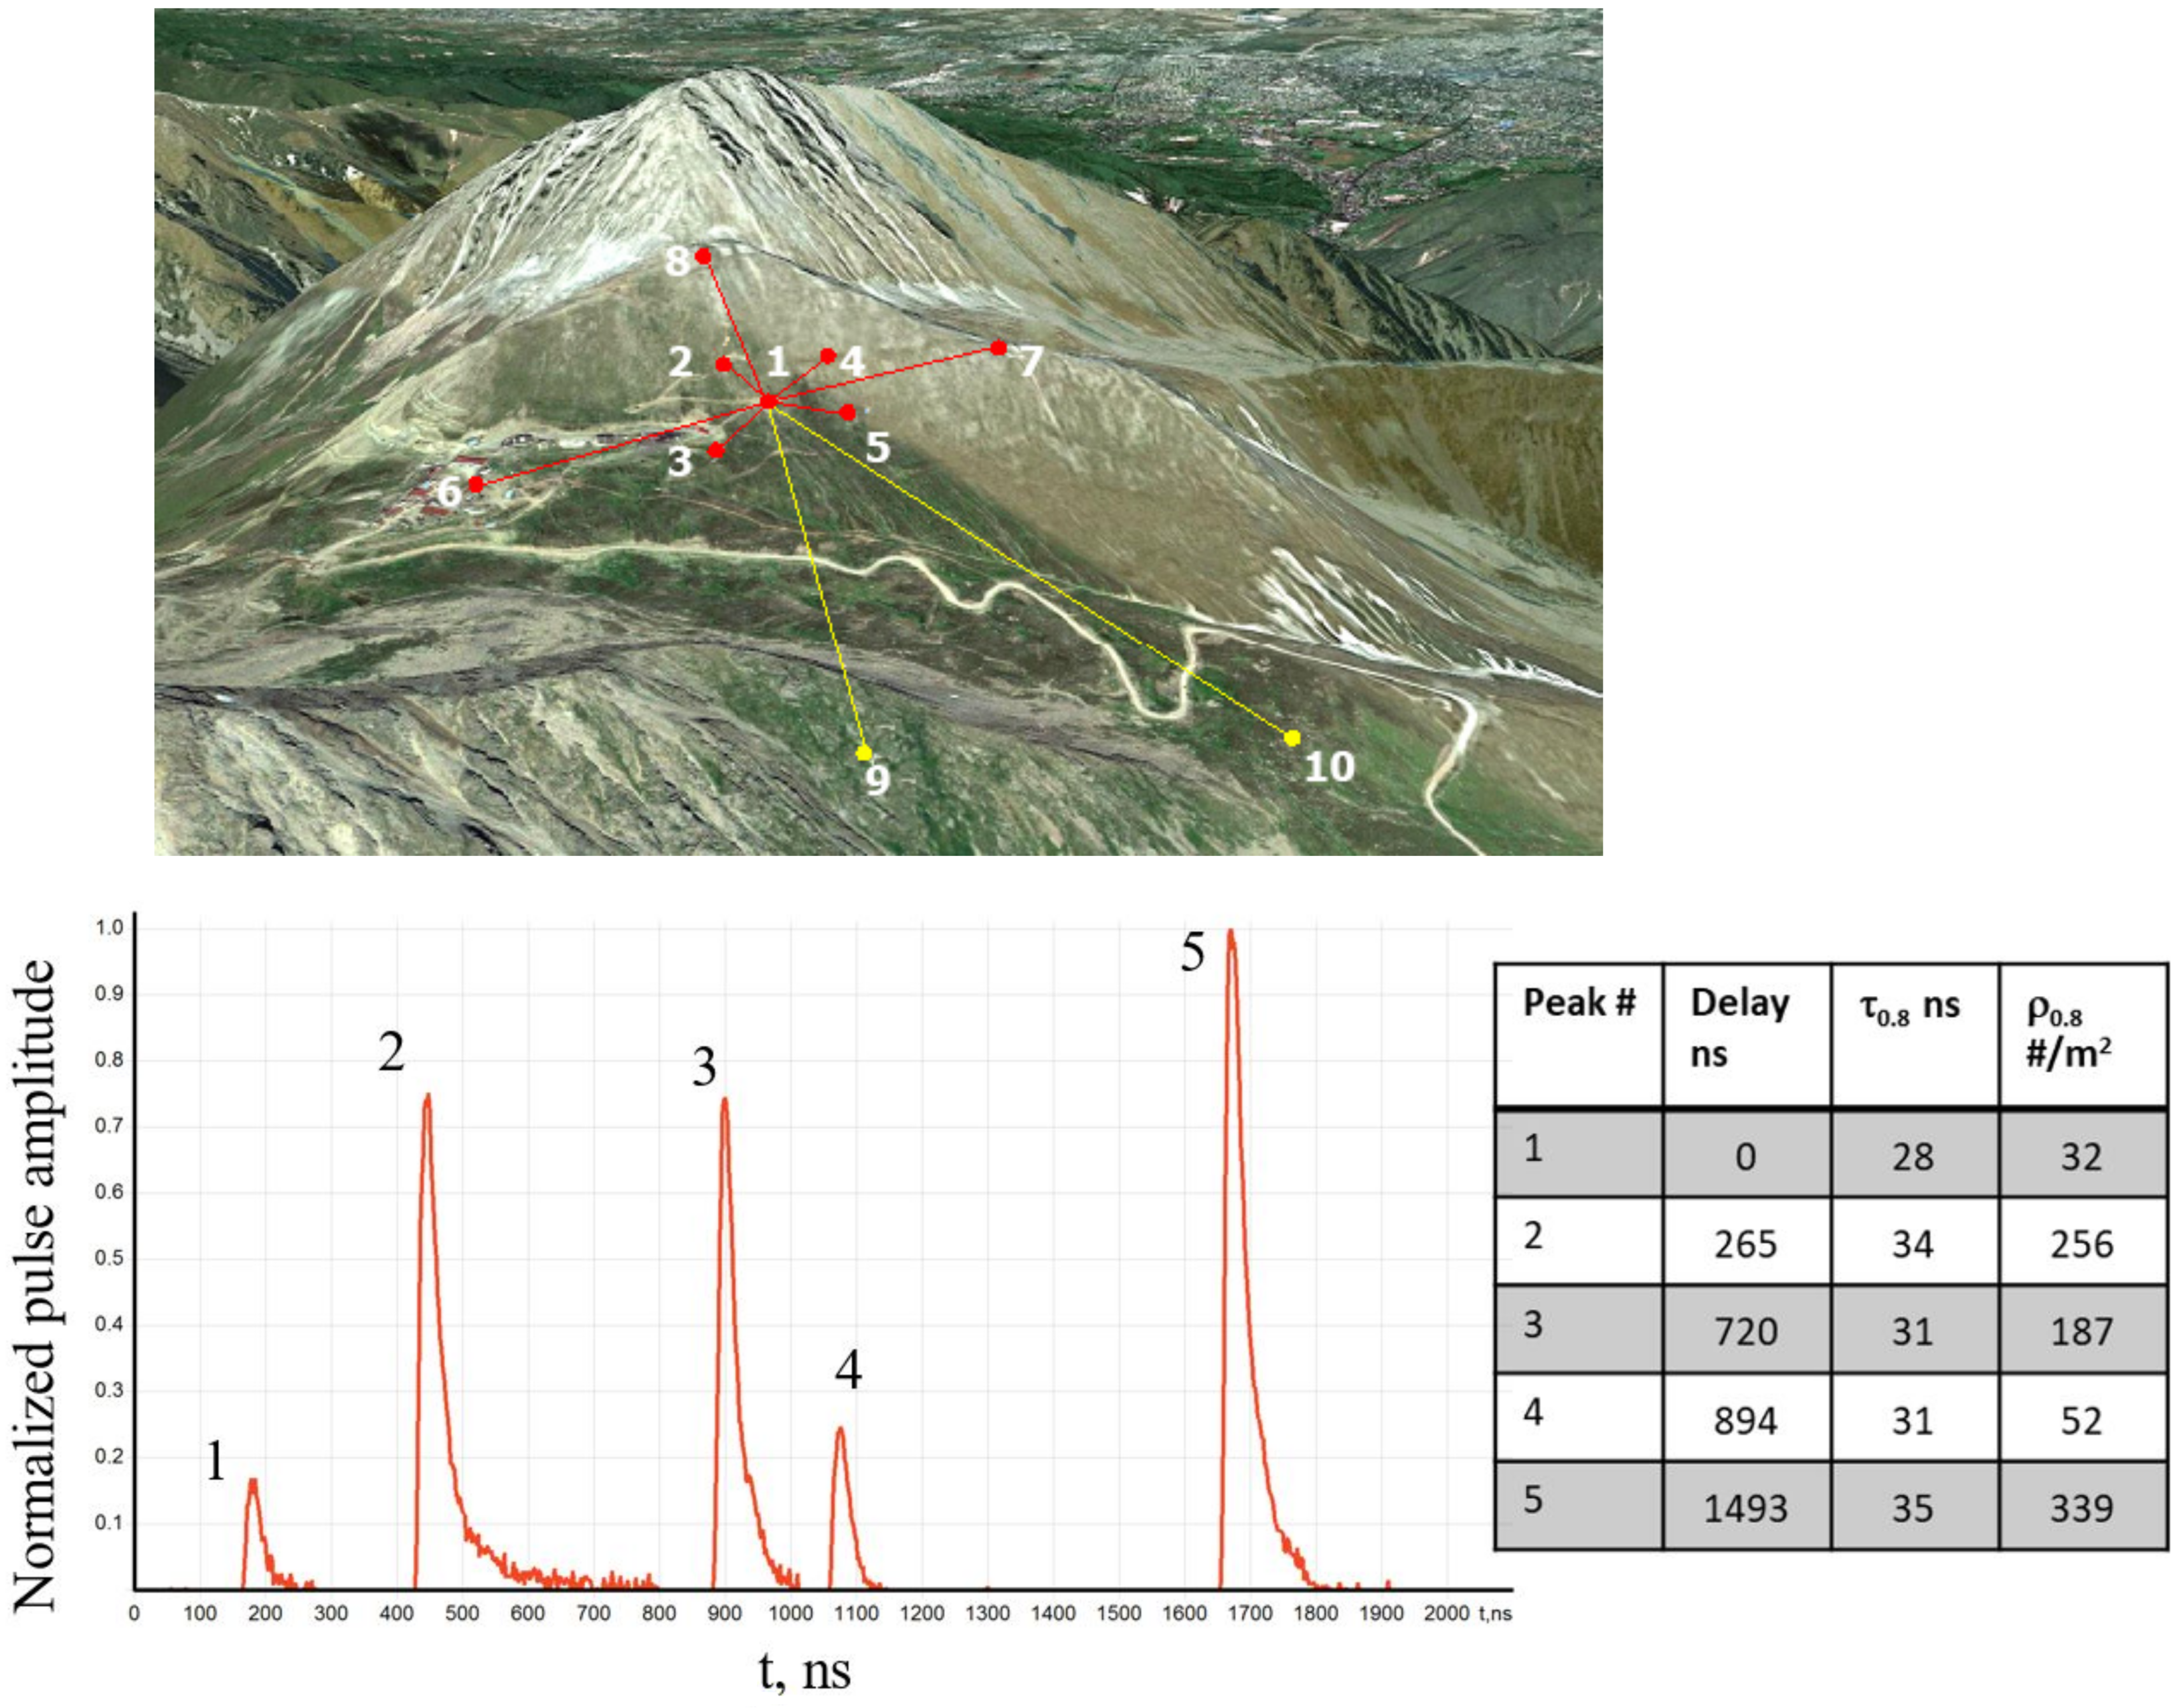
- Indeed, a typical MME is shown on Figure 1 where a complicated temporal features are explicitly seen. Several peaks separated by ∼ ns in a single detector represent the “clustering puzzle”, listed above. In conventional EAS picture one should see a single pulse in each given detector with the amplitude which depends on the distance from the EAS axis. It is not what actually observed by H10T.
- 2.
- The manifestation of the “particle density puzzle” is as follows. On Figure 2 we show the particle density distribution in simulated EAS disk versus distance from axis for different energies shown by solid lines with different colours, depending on energy of the CR. In particular, for energy of the primary particle on the level of eV one should expect a strong suppression ∼ when distance R to the EAS axis changes from m to m. It is not what actually observed by H10T: the density of the particles is not very sensitive to the distance to the EAS axis, and remains essentially flat for the entire region of observations. Furthermore, the magnitude of the density is much higher than it is normally expected for CR energies ∼(–) eV.
- 3.
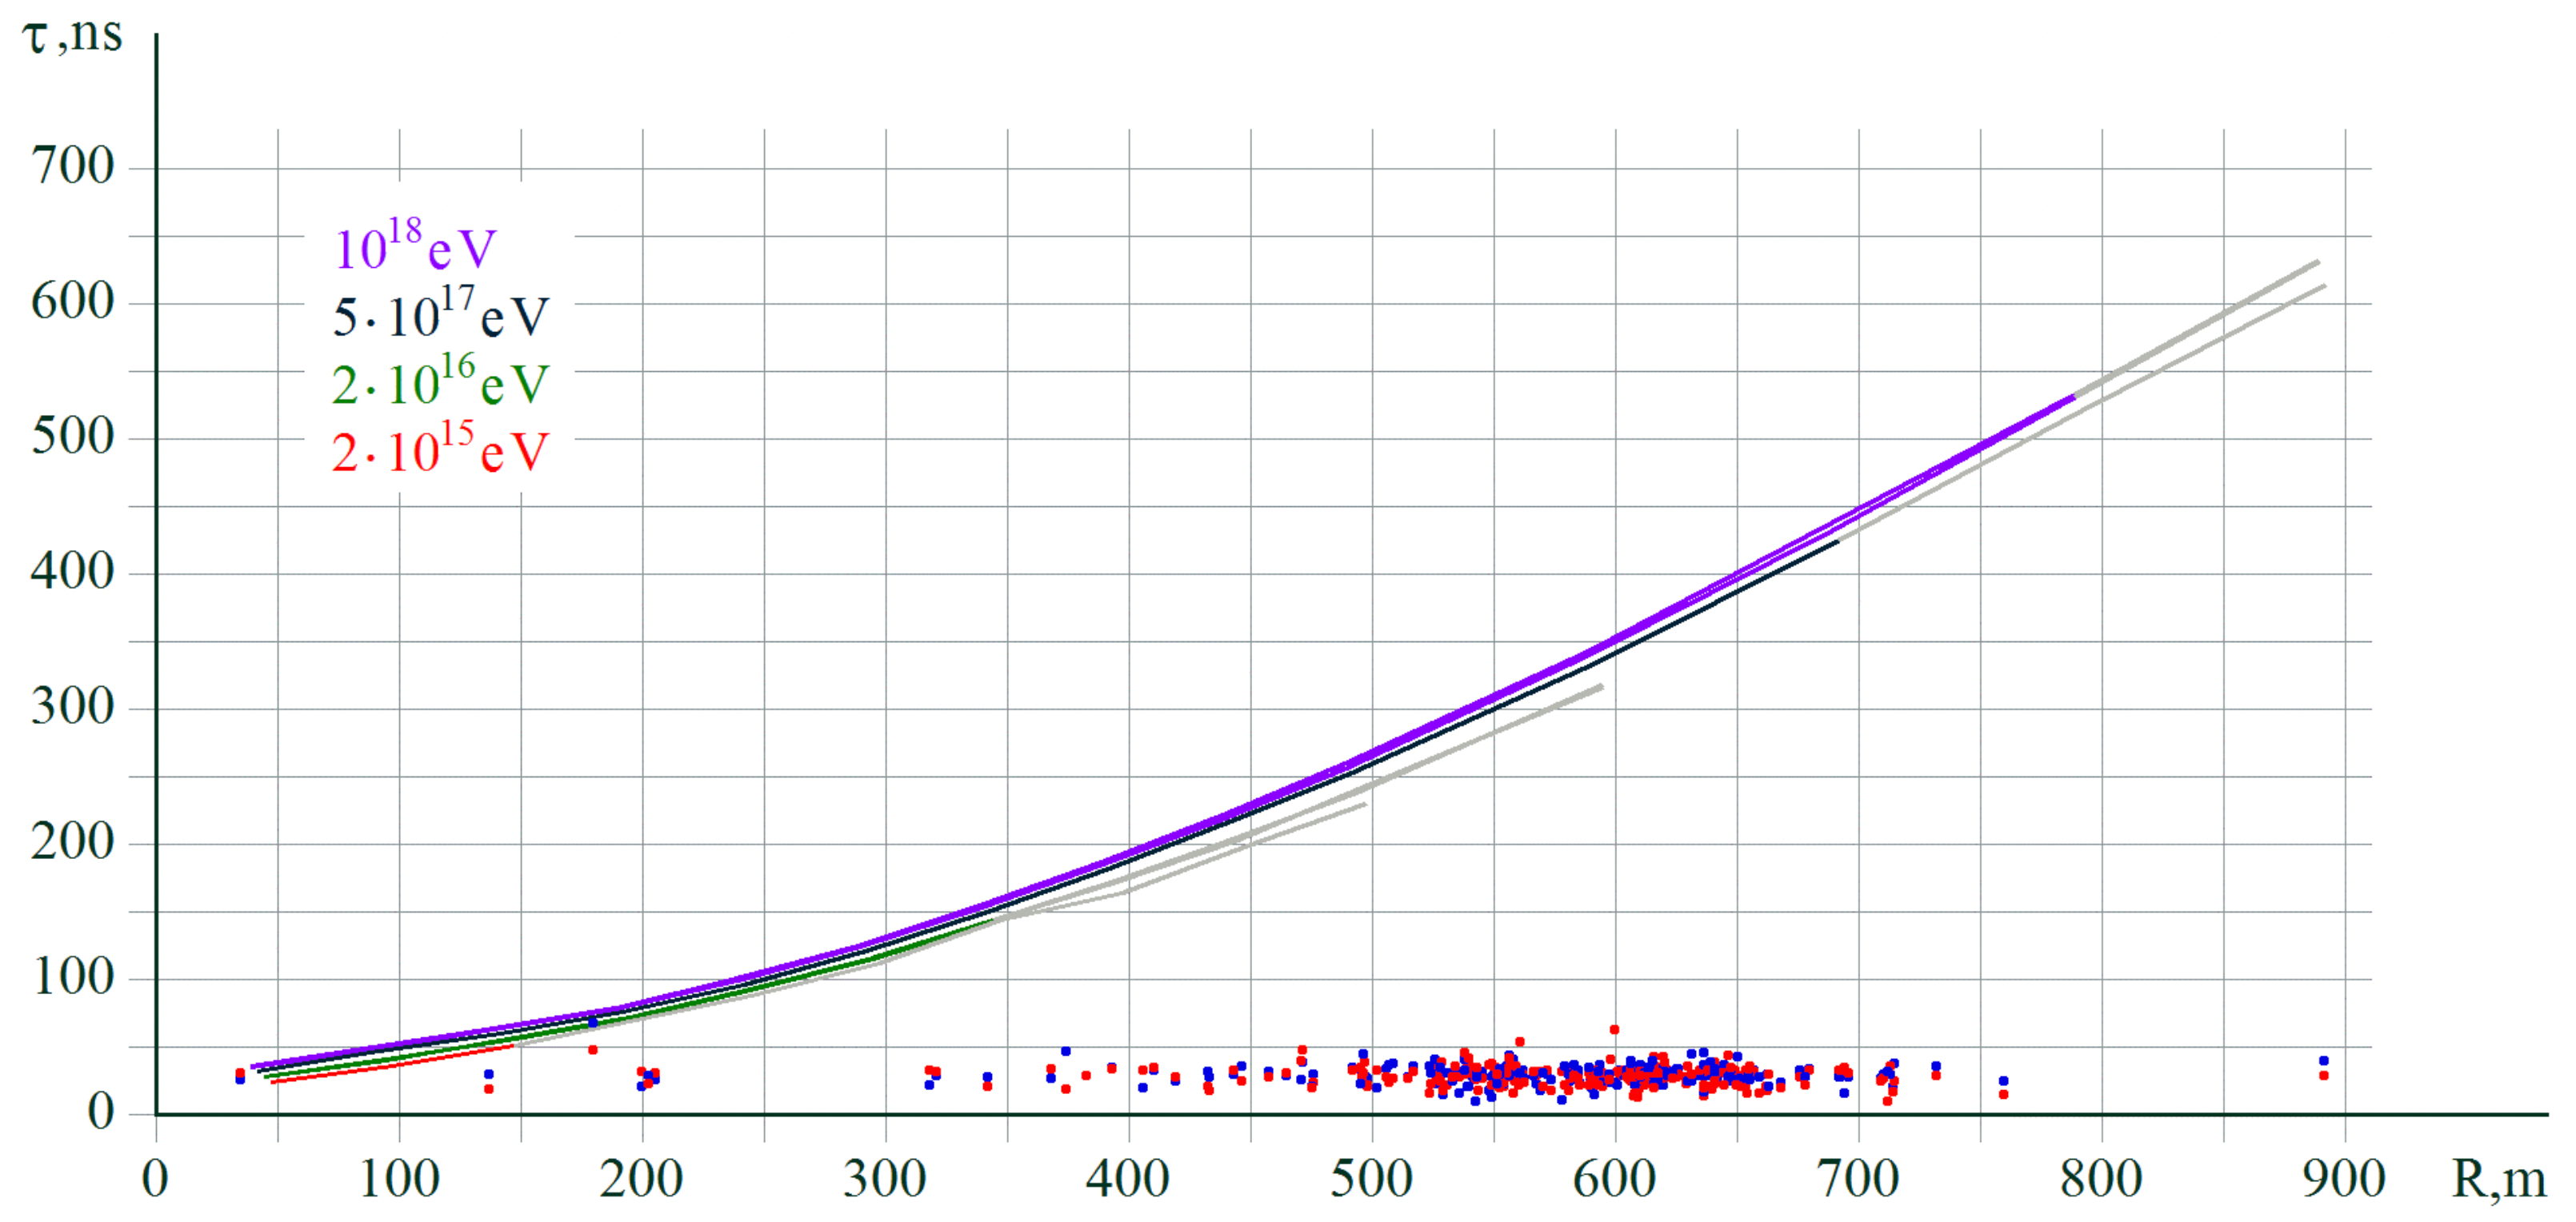
- The manifestation of the “pulse width puzzle” is as follows. On Figure 3 we show the simulated EAS disk width versus distance from axis for different energies shown by solid lines in different colours. As explained above the thickness of the EAS pancake increases with the distance from the core. Therefore, the pulse width must also increase correspondingly as shown by sold lines on Figure 3 for different energies. It is not what actually observed by H10T: all MME events show similar duration of the pulse width on the level of (20–35) ns irrespective to the distance to the AES axis. This observation is in dramatic conflict with conventional picture as outlined above.
- 4.
- The manifestation of the “intensity puzzle” is as follows. The Figure 2 suggests that the charged particle density varies between (30–300) particles per m at the distances (500–700) m from the EAS axis. This is at least factor above the expected for the primary particle with energy in the interval (–) eV. Only the particles with energies well above eV could generate such enormous particle density as shown on Figure 2. However the frequency of appearance for such highly energetic particles is only once every few years. This represents the “intensity puzzle” when the intensity of the events estimated from for MME is several orders of magnitude higher than the energy estimated by the event rate. This shows a dramatic inconsistency between the measured intensity and observed event rate carried out by one and the same detector.
We conclude this section with the following comment. From the puzzles listed above it must be obvious that the events detected by H10T are not the conventional CR air showers as they demonstrate enormous inconsistency with standard CR interpretation. What it could be? Before we put forward our proposal we would like to briefly overview in next Section 3 the second part of our story- the AQN dark matter model.
3. The AQN Dark Matter Model
We start with few historical remarks and motivation of the AQN model in Section 3.1, while in Section 3.2 we overview recent observations of CR-like events (such as puzzling bursts observed by the TA experiment and ANITA’s two anomalous events with non-inverted polarity) of some mysterious events which could be explained by the AQN events hitting the Earth. Finally, in Section 3.3 we briefly overview some specific features of the AQNs traversing the Earth (such as internal temperature, level of ionization, etc.). These characteristics will be important for the present study interpreting the MMEs as the AQN events.
3.1. The Basics
The AQN dark matter model [6] was invented long ago with a single motivation to explain in natural way the observed similarity between the dark matter and the visible densities in the Universe, i.e., without any fitting parameters. We refer to recent brief review [17] on the AQN model. Here we want to mention few key elements which are important for this work.
The AQN construction in many respects is similar to the Witten’s quark nuggets, see [18,19,20], and review [21]. This type of DM is “cosmologically dark” not because of the weakness of the AQN interactions, but due to their small cross-section-to-mass ratio, which scales down many observable consequences of an otherwise strongly-interacting DM candidate.
(a). First new element is the presence of the axion domain walls which are copiously produced during the QCD transition. The axion field plays a dual role in this framework: it serves as an additional stabilization factor for the nuggets, which helps to alleviate a number of problems with the original nugget construction [18,19,20,21]. Furthermore, the same axion field generates the strong and coherent violation in the entire visible Universe. This is because the axion field before the QCD epoch could be thought as classical violating field correlated on the scale of the entire Universe.
One should comment here that the axion field had been introduced into the theory to resolve the so-called the strong problem which is related to the fundamental initial parameter . The axion remains the most compelling resolution of the strong problem and it also represents a DM candidate, see original papers on the axion [22,23,24,25,26,27,28], and recent reviews [29,30,31,32,33,34,35,36,37]. The most recent constraints on the axion mass for entire broad classical window (–) is set by the CAST collaboration [38], while the world best constraints in specific narrow bands around eV are imposed by different cavity type detectors, see review articles mentioned above for references and details.
One should also comment here that in recent years many researchers consider the so-called axion-like models when the axion coupling constant and its mass are completely decoupled, in contrast with the original models [22,23,24,25,26,27,28] when these parameters are linked: . In axion-like models the strong problem is not resolved. However, the axion itself remains a feasible DM candidate. It may produce a number of interesting observable effects. In particular, ultra light axion DM may significantly affect structure formation at small scales [39].
We should emphasize that in this work we assume a classical window for the axion mass (–) . Furthermore, the axions which are produced from the AQNs have dramatically different spectral features, and therefore, the corresponding axion searches should have very different strategies, see recent brief review [17] covering this topic. In the present work we do not study the axions and their possible detections. Instead, this work is devoted to very different observables, other than the axions, which emerge as a result of the AQN annihilation events as discussed in Section 3.2.
(b). Another feature of the AQN model which plays absolutely crucial role for the present work is that nuggets can be made of matter as well as antimatter during the QCD transition. Precisely the coherence of the violating field on large scale mentioned above provides a preferential production of one species of nuggets made of antimatter over another species made of matter. The preference is determined by the initial sign of the field when the formation of the AQN nuggets starts. The direct consequence of this feature along with coherent violation in entire Universe is that the DM density, , and the visible density, , will automatically assume the same order of magnitude densities without any fine tuning as they both proportional to one and the same dimensional parameter . We refer to the brief review [17] devoted to the specific questions related to the nugget’s formation, generation of the baryon asymmetry, and survival pattern of the nuggets during the evolution in early Universe with its unfriendly environment.
One should emphasize that AQNs are absolutely stable configurations on cosmological scales. Furthermore, the antimatter which is hidden in form of the very dense nuggets is unavailable for annihilation unless the AQNs hit the stars or the planets.
However, when the AQNs hit the stars or the planets it may lead to observable phenomena. The strongest direct detection limit1 is set by the IceCube Observatory’s, see brief review [17] for the details:
where we formulated the constraints in term of the AQN’s baryon charge B rather than in terms of its mass . Similar limits are also obtainable from the ANITA and from geothermal constraints which are also consistent with (1) as estimated in [41].
While ground based direct searches offer the most unambiguous channel for the detection of quark nuggets the flux of nuggets is inversely proportional to the nugget’s mass and consequently even the largest available conventional dark matter detectors are incapable to exclude the entire potential mass range of the nuggets. Instead, the large area detectors which are normally designed for analyzing the high energy CR are much better suited for our studies of the AQNs as we discuss in next Section 3.2.
3.2. When the AQNs Hit the Earth…
For our present work, however, the most relevant studies are related to the effects which may occur when the AQNs made of antimatter hit the Earth and continue to propagate in deep underground in very dense environment. In this case the most of the energy deposition will occur in the Earth’s interior. The corresponding signals are very hard to detect as the photons, electrons and positrons will be quickly absorbed by surrounding dense material deep underground, while the emissions of the very weakly interacting neutrinos and axions are hard to recover. In this short subsection we want to mention several observed phenomena which could be related to the AQN annihilation events when the nuggets propagate in the Earth’s atmosphere.
We start with the Telescope Array (TA) experiment which has recorded [11,12] several short time bursts of air shower like events. These events are very unusual and cannot be interpreted in terms of conventional CR single showers. In particular, if one tries to fit the observed bursts (cluster events) with conventional code, the energy for CR events should be in eV energy range to match the frequency of appearance, while the observed bursts correspond to (–) eV energy range as estimated by signal amplitude and distribution. Therefore, the estimated energy from individual events within the bursts is five to six orders of magnitude higher than the energy estimated by event rate [11,12]. It has been argued in [9,10] that these bursts represent the direct manifestation of the AQN annihilation events.
This feature, in many aspects, is very similar to the intensity puzzle listed in previous Section 2, where analogous dramatic inconsistency (between the observed intensity and measured event rate) is recorded by H10T instrument.
Our next example is the observed seasonal variations of the X ray background in the near-Earth environment. To be more precise, the XMM-Newton at confidence level [42] had recorded the seasonal variations in the 2–6 keV energy range at distances where the measurements are effectively had been performed. The authors [42] argue that conventional astrophysical sources have been ruled out. Furthermore, the XMM-Newton’s operations exclude pointing at the Sun and at the Earth directly, diminishing a possible direct X ray background from the Earth and the Sun. It has been argued in [43] that this seasonal variation may be naturally explained by the AQNs exiting the Earth. The AQNs continue the emission of the X rays at , long after the nuggets exit the Earth’s atmosphere. It has been also shown that the spectrum and the intensity computed in [43] almost identically match the observed spectrum [42].
The final example we want to mention here is the observation by ANITA [14,15,16] of two anomalous events with noninverted polarity. These two events had been identified as the Earth emergent upward going CR-like events with exit angles of and relative to the horizon. These anomalous events are in dramatic tension with the standard model because neutrinos are exceedingly unlikely to traverse through Earth at a distance of ≳km with such ultrahigh energy, even accounting for the regeneration [14]. The analysis [44] reviewed the high-energy neutrino events from the IceCube Neutrino Observatory and inferred that the interpretation is excluded by at least confidence level. We advocated in [13] that these two anomalous events with noninverted polarity observed by ANITA could be interpreted as the upward going AQNs.
The applications [43] to the X ray emission in the near-Earth environment and the ANITA anomalous events [13] are especially relevant for the present work because both these phenomena are originated from the AQN upward going (Earth emergent) events when the AQNs traversed through the Earth interior and exit the Earth surface. As we shall argue in this work the MME events could be also the consequence of the same upward moving AQNs.
However, there is an additional technical challenging problem to be addressed for the application to MME analysis. The point is that the ANITA anomalous events are generated by AQNs which just crossed the surface and entered the Earth’s atmosphere (upward-going events). Exactly at this instant large number of electrons instantaneously released into atmosphere and generated the radio pulse measured by ANITA. In contrast, the X rays are observed by XMM-Newton at very large distances from Earth. In this case the impact of the atmospheric material at km can be ignored, and the cooling of the AQN is dominated by nugget’s propagation in an empty space. The application to MME, which is the topic of the present work, deals with an intermediate stage between these two cases: it is not the first instant when the AQN enters the atmosphere emerging from the interior, and it is not the asymptotically far away when the AQN propagates in empty space. In other words, we need to know the emission pattern and the energy deposition rate for the AQNs when they propagate in the atmosphere, and the impact of the atmospheric surrounding material cannot be ignored. We formulate our proposal in Section 4 where we argue that emission of the electrons by the AQN in form of the well-separated “bunches” may explain the unusual features of the MME observations.
However, before we present our arguments supporting this interpretation of the MME unusual events (as highlighted in Section 2) we should overview the basic characteristics of the AQNs traversing the Earth, which represents the topic of the next Section 3.3.
3.3. Internal Structure of the AQN
The goal here is to explain the basic features of the AQNs when they enter the dense regions of the surrounding material and annihilation processes start. The related computations originally have been carried out in [45] in application to the galactic environment with a typical density of surrounding visible baryons of order in the galactic center, in dramatic contrast with dense region in the Earth’s interior when and atmosphere with . We review these computations with few additional elements which must be implemented in case of propagation in the Earth’s atmosphere and interior when the density of the environment is much greater than in the galactic environment.
The total surface emissivity from electrosphere has been computed in [45] and it is given by
where is the fine structure constant, is the mass of electron, and T is the internal temperature of the AQN. One should emphasize that the emission from the electrosphere is not thermal, and the spectrum is dramatically different from black body radiation, see [45], see also Appendix A with more details.
A typical internal temperature of the AQNs for very dilute galactic environment can be estimated from the condition that the radiative output of Equation (2) must balance the flux of energy onto the nugget
where n represents the number density of the environment. The left hand side accounts for the total energy radiation from the AQN’s surface per unit time as given by (2) while the right hand side accounts for the rate of annihilation events when each successful annihilation event of a single baryon charge produces ∼ energy. In Equation (3) we assume that the nugget is characterized by the geometrical cross section when it propagates in environment with local density n with velocity .
The factor is introduced to account for the fact that not all matter striking the AQN will annihilate and not all of the energy released by an annihilation will be thermalized in the AQNs by changing the internal temperature T. In particular, some portion of the energy will be released in form of the axions, neutrinos2. The high probability of reflection at the sharp quark matter surface lowers the value of . The propagation of an ionized (negatively charged) nugget in a highly ionized plasma (such as solar corona) will increase the effective cross section. As a consequence, the value of could be very large as reviewed in [17] in application to the solar corona heating problem.
The internal AQN temperature had been estimated previously for a number of cases. It may assume dramatically different values, mostly due to the huge difference in number density n entering (3). In particular, for the galactic environment eV, while in deep Earth’s interior it could be as high as (100–200) keV. Precisely this value of T had been used as initial temperature of the nuggets in the proposal [43] explaining the seasonal variations of the X rays observed the XMM-Newton at confidence level [42] at distances (6–10) from the Earth surface.
The crucial element for the study [43] was the emission rate by AQNs at very high temperatures (100–200) keV. In this case the emission is not determined by simple Bremsstrahlung radiation given by (2) which is only valid for relatively low temperatures. In the high temperature regime a number of many-body effects in the electrosphere, that were previously ignored, become important. In particular, it includes: the generation of the plasma frequency in electrosphere, which suppresses the low frequency emission. Also, the the AQNs get ionized which dramatically decreases the density of positrons in electrosphere, and consequently suppresses the emission, among many others effects. All these complications have been carefully considered in [43] in applications to the seasonal variations of the X rays as observed the XMM-Newton, and we refer to that paper for the details. Here we quote the result of these studies. The rate of emission can be effectively represented as follows:
where factor is a result of strong ionization of the electrosphere, which leads to the corresponding suppression of the emission. The details of this suppression are explained in Appendix A and given by (A12). This suppression is a direct consequence of high internal temperature T when a large number of weakly bound positrons are expanded over much larger distances order of R rather than distributed over much shorter distances of order around the nugget’s core. This basically determines the suppression factor .
In both previously considered applications (to ANITA [13] and to XMM-Newton [43] experiments) when the upward moving AQNs with high (100–200) keV play the key role in the explanations of the observations, we ignored an additional3 annihilation events with atmospheric material as we already mentioned at the end of the previous Section 3.2. Now we want to include the corresponding physics in our analysis.
First of all we want to estimate the number of direct head-on collisions of the atmospheric molecules with AQN per unit time. It can be estimated as follows:
where is the molecular density in atmosphere when each molecule contains approximately 30 baryons such that the typical density of surrounding baryons in air is . The dominant portion of these collisions are the elastic scattering processes rather than successful annihilation events suppressed by parameters as discussed above. The energy being deposited to the AQN per unit time as a result of annihilating processes can be estimated as follows
One should emphasize that this energy is being deposited into the AQN which is already at full capacity with very high temperature (100–200) keV accumulated during a long journey in much denser Earth’s interior.
What is the mechanism to release this extra energy? In other words: In what form the energy (6) could be emitted into the surrounding atmosphere as it cannot be easily transferred to the AQN’s quark core (as it is already saturated, see footnote 3)?
There are two qualitatively different regimes which can be normally realized in such circumstances. If a typical time scale to deposit a specific amount of energy (let us say, 1 GeV) determined by (6) is longer than the time scale to release the same amount of energy, i.e., than a continuous cooling process takes place and the temperature slowly decreases. This is a thermodynamically equilibrium behaviour which can be analyzed using conventional technical tools4.
The second option is realized when the time scale to deposit the energy is much shorter than the time scale of cooling processes, i.e., , in which case the burst-like (explosion like, eruption-like blasts) non- equilibrium processes must occur. These eruption-like events will release the extra accumulated energy in form of very short pulses, which cannot be described as conventional cooling equilibrium processes. These short pulses must alternate with much longer periods of accumulation energy which inevitably end with subsequent eruption-like events. In other words, in this case, the non-equilibrium fast equilibration process can be thought as the eruption-like event5.
Now we give a numerical estimation for the cooling rate determined by (4) to find out what regime is realized in given circumstances. The order of magnitude estimate can be expressed as follows:
Comparing this estimate for cooling rate with estimate for the deposition rate (6) one concludes that the rate of energy deposition is much shorter than the rate at which the system is capable to release the same amount of energy in form of the photon’s emission. As a result, we arrive to the conclusion that second option when is realized. This conclusion inevitably implies the eruption like events must occur, and these very short explosions must be alternated with much longer periods of time when the energy is being accumulated by the AQNs. These longer periods of the energy accumulations also must end with consequent eruption-like blasts. This alternating pattern continues as long as following condition holds:
With these preliminary comments with estimates from the previous studies on the AQN features we are now in position to formulate the proposal interpreting the MME events observed by X10T collaboration in terms of the upward moving AQNs, which is the topic of the next Section 4.
4. MME as the AQN Event
In this Section we formulate the basic idea of our proposal on identification of the unusual Multi-Modal Events with the upward moving AQN events, while supporting estimates on the event rate, the intensity, and the variety of time scales will be presented in following Section 5 and Section 6.
The AQNs which propagate in the Earth’s interior are very hot. Their temperature could be as hot as (100–200) keV at the moment of exit on the Earth’s surface as we discussed in [43] in the application to studies of the seasonal variations of the X rays observed by XMM-Newton at very large distances (6–10) from the Earth. At such large distances the AQN’s cooling can be described by conventional thermodynamically equilibrium processes with well defined spectrum, see footnote 4. It should be contrasted with our application to ANITA anomalous events [13] when the same upward moving AQNs just crossed the surface and entered the Earth’s atmosphere. In this case the dominant cooling mechanism is realized in form of short burst-like events according to (8). The outcome of these short burst-like events is emission of numerous bunches (clumps) of relativistic electrons. These eruption like events are analogous to lightning flashes from footnote 5.
In our studies [13] we focused on an estimation of the number of emitted electrons N and their energy which, according to the proposal [13], essentially determine the intensity and the spectral features of the ANITA anomalous events. These electrons will be always accompanied by the emission of much more numerous number of photons with typical energy of order (100–200) keV, which in fact represent the dominant fast non- equilibrium mechanism of cooling of the system in these circumstances (8).
Precisely these multiple explosion-like emissions of photons and electrons will be identified with Multi-Modal Events with their unusual features reviewed in Section 2. The mean free path of the photons with is relatively short, measured in meters. Therefore, they cannot be directly observed. In contrast, the mean free path of the energetic electrons at sea level with is around several kilometres in atmosphere (and even longer at the elevation of 3346 m where H10T is located). The propagation of these ultra-relativistic electrons takes place in the background of the geomagnetic field which determines the instantaneous curvature km of the electron’s trajectories with such energies, see Section 5 with relevant estimates. Due to the large component of magnetic field parallel to the Earth’s surface the electrons may move in downward direction even if they are initially emitted in upward direction. Our proposal is that precisely these downward moving energetic electrons could mimic the CR and could be responsible for the Multi-Modal pulses as detected by H10T instrument.
Any precise computation during a short period of time of emission is very hard problem of non-equilibrium dynamics, which is beyond the scope of the present work. Fortunately, the observable intensity, the event rate, the time delays between the pulses are determined in the AQN framework by the basic characteristics of the model and are not very sensitive to the details of this non-equilibrium mechanism of production and its corresponding time scales. This is because all these observables depend on several parameters such as typical energy of the emitted electrons, typical number of emitted electrons N, the deposition rate (6) and the cooling rate (7) which had been previously estimated for very different purposes in different circumstances. We shall use the same parameters in the present work.
In particular, the number of electrons (–) emitted by AQNs is very hard to compute from the first principles. However it can be fixed by the observed intensity and spectral features of the anomalous ANITA radio pulses assuming, of course, that these observed radio pulses with inverted polarities are due to the upward moving AQNs [13]. The typical energy of these electrons is also consistent with duration of the observed pulses [13]. The next Section 5 is devoted to the estimation of the event rate of MME, while Section 6 is devoted to explanations of the puzzles which demonstrate a dramatic deviation from conventional CR picture as formulated in Section 2. We shall argue that the observed MME features are consistent with our AQN-based interpretation.
5. Event Rate of MME
This section is devoted to estimate of the event rate of MMEs within the AQN framework. We anticipate that this evaluation is expected to be very qualitative estimation due to large uncertainties in parameters and rare occurrence of the observed MMEs. In particular, it is known that key parameter, the DM density locally may dramatically deviate from the well established average global value . Nevertheless we would like to present such estimate to demonstrate that our interpretation of MMEs as an outcome of upward-going AQNs is at least a self-consistent proposal. In what follows we use the same formulae we used for the estimates of the frequency of appearance of the ANITA Anomalous Events [13] such that the numerous uncertainties related to the local DM density or/and the AQN size distribution would not dramatically affect our estimates below if they are normalized to the ANITA event rate.
We start with the same formula from [13] for the expected number of the MMEs assuming that they are induced by the AQNs:
where for the isotropic AQN flux, and the expression for the local rate of upward-going AQNs per unit area is given by:
where is the local density of DM and km is the radius of the Earth and is the total hit rate of AQNs on Earth [48]. In Formula (9) the is the time of operation while is the effective area to be estimated below.
The estimation of the effective area is a complicated task as it is not simply determined by the area of the detectors similar to standard CR analysis. Instead, it is determined by the area along the AQN’s path where it can emit the bunches of electrons in form of short pulses which can mimic the CR as outlined in previous Section 4. The area can be thought as a strip of length and width .
To estimate these parameters let us consider an AQN moving in upward direction with angle with respect to the Earth’s surface such that upward velocity component is . This vertical velocity component determines the maximal height h of the atmosphere where the atmospheric density is still sufficiently high such that condition (8) holds. We estimate (30–50) km where the atmospheric density falls by two order of magnitude such that conventional X-ray emission (which had been used in computations [43] to explain the seasonal variations observed by XMM Newton) becomes the dominant cooling process at higher altitudes. This condition determines the maximal length and time scale when the AQNs can emit the bunches of electrons in form of pulses which we identify with MMEs and which can mimic the CR air showers as outlined in previous Section 4. Numerically these parameters are estimated as follows:
where we used for an order of magnitude numerical estimates.
To estimate the width of the strip we recall that the geomagnetic field in location of the H10T instrument can be characterized by two numbers: it has strong component in up to down direction G, and strong component from south to north direction G, see e.g., [49].
Assuming that the energetic electrons with will be emitted along the -direction one can estimate instantaneous radius of curvature , see e.g., Jackson [50]:
where G is the local magnetic field strength, which changes the direction of the electrons from upward to downward moving such that they can mimic the CR air showers. The angle is the angle between the particle electron velocity and magnetic direction. We choose in (12) for the numerical estimates.
Now we estimate the relevant scale which determines the survival pattern of the electron’s bunches. It is mostly determined by the Coulomb elastic scattering with cross section
The electrons with may strongly deviate from their main paths and cease to stay with majority of particles forming the bunch (which eventually becomes the pulse being interpreted as MME). The corresponding length scale at altitude h (accounting for the air-density variation) is estimated as follows
The physical meaning of is the length distance particles propagate at which the majority of the particles in the bunch remain within the bunch before the dispersing to much larger distances when they cease to be a part of the pulse (burst). Important comment here is that such that the majority of electrons within the bunch do not strongly re-scatter, and therefore survive the change in orientation due to the geomagnetic field (from upward to downward direction).
The width of the strip now can be roughly estimated as follows:
Combining all the estimates above one arrives to the following order of magnitude estimation for the expected number of MME events:
This estimate carries enormous internal uncertainty due to a number of reasons. First, as we already mentioned the parameters entering (10) for the basic normalization, the flux , are in fact not precisely known. Indeed, the fundamental parameter such as may dramatically deviate locally (by factor 2 or even 3) from the well established average global value . Furthermore, the size distribution factor entering (10) in form had been fixed from dramatically different physics (including solar corona heating puzzle) and can easily deviate by similar factor 2 or 3. Furthermore, the effective area could also deviate by factor 2 or 3 in comparison with expression (16) because the important parameter h which essentially determines the effective area cannot be precisely evaluated as it depends on condition (8) which itself is determined by complex internal dynamics of the nuggets. As a result we consider the Formula (16) as an order of magnitude estimate at the very best. However, our main arguments of the identification of the MMEs with the AQN events are not based on the estimate (16). We present this estimate here exclusively for illustrative purposes. Our main arguments are based on specific qualitative features (formulated as puzzles) which have been listed in Section 1, and which cannot be explained in terms of the conventional CR air showers as highlighted in Section 2.
This order of magnitude estimate should be compared with observed frequency of appearance of the MMEs. According to [2] the observations from start until August 2016 during of operation the H10T instrument had detected MMEs. According to [4] the observations from 15 February 2018 to 12 May 2018 (which corresponds to ) the H10T instrument had detected MMEs.
The AQN based estimations (16), if literally taken, suggest that number of events is almost one order of magnitude lower than events observed by H10T. Nevertheless, we consider this order of magnitude estimation (16) being consistent with our proposal due to many uncertainties mentioned above.
It is interesting to note that the numerical suppression factor ∼ (between computed and observed values) which appears in our order of magnitude estimates (16) is very similar to suppression factor ∼ which occurred in analogous estimates for the mysterious TA bursts [9] and the ANITA anomalous events [13]. This similarity hints on a common origin for all these phenomena. Therefore, if one normalize to the observed ANITA anomalous events (assuming that all three phenomena originated from the same AQN based physics) one arrives to correct order of magnitude estimate as the suppression factor ∼ is approximately the same for all three phenomena estimated for the mysterious TA bursts in [9], the ANITA anomalous events in [13], and Multi-Modal Events estimated in (16). The main uncertainty related to the basic normalization of the flux cancels out if such relative ratios are considered.
As we mentioned above, our main arguments leading to the identification of the MMEs with the AQN events are not based on an order of magnitude estimate of the frequency of appearance (16). Rather, our main arguments are based on specific qualitative features (formulated as puzzles) and which cannot be explained in terms of the conventional CR air showers. We consider a qualitative agreement between the observations and our theoretical estimates (to be discussed in next Section 6) as the strong arguments supporting our identification.
6. AQN Proposal Confronts the MME Observations
We start this section by estimating the particle number density which appears in formulation of the puzzles in Section 2 describing the observations [1,2,3,4,5]. The particle number density in the AQN framework is determined by the number of particles which could be observed at the detector site. Assuming that the total number of electrons being emitted in form of a pulse (as a result of erupted burst) is similar to the number of particles which was used in our analysis [13] of the ANITA anomalous events (–) we arrive to the following estimate for :
where the area which is hit by the bunch of particles from a single burst is estimated as with given by (14) at the detector site with km. It is assumed that the particles are propagating within the cone with angle .
Our next task is the estimation of the time delay between the pulses within the same cluster. The corresponding time delay can be estimated from the condition that the energy deposited into the AQN during time must be released in form of the eruption when (–) electrons being emitted in form of a single pulse. As we mentioned previously, the dominant portion of the energy in such eruption is released in form of the photons with energy which always accompany the electron’s emission as a result of these bursts. The relative ratio r between these two components is estimated in Appendix B, see Equation (A14). Numerically, the estimate can be presented as follows:
where for numerical estimates we use keV. We must emphasize that (18) is really an order of magnitude estimate as mechanism of emission is determined by a very complex physics as highlighted in Appendix B. Furthermore, the corresponding eruption event is not a thermodynamically equilibrium process as we already mentioned previously. The dominant contribution in form of the photon’s emission during a single pulse can be estimated in terms of these parameters as follows
where we use the numerical value for extracted from analysis of the ANITA anomalous events [13] and parameter r is given by (18). In this estimate we assumed that the energy of the pair computed at the moment of the pair creation. The released energy during a single pulse (19) determines the time delay between the pulses within the same cluster:
where we used numerical value for from (6) with density of atmosphere at km where the detector H10T is located. Our final, the order of magnitude estimate for the time delay between the pulses can be represented as follows
where we use in (21) for numerical estimates which was previously extracted from studies of the emission in the dilute galactic environment, see footnote 2.
We would like to make few comments on uncertainties related to the estimate (21). The main uncertainties are related to the parameters r and N entering (19). The parameter r as defined by (18) is very hard to estimate as discussed in Appendix B where we mentioned that the related question for much simpler problem on emission from the bare quark stars remains to be a matter of debates. Our system is much more complex than the bare quark star because of the small size of the nuggets when the thermal equilibrium cannot be established, in contrast with quark stars. This is precisely the reason why we use parameter N from analysis of the ANITA anomalous events [13], rather than from theoretical estimates. Another source of uncertainty is parameter entering (21). This parameter was defined in Equation (3) with explanation of many uncertainties related to its numerical value6. Therefore, the time delay as given by (21) should be considered as an order of magnitude estimate at the very best. It obviously cannot be computed from the first principles similar to any other parameters when one deals with any complex systems, see also footnote 6.
However, the important point here is that the time scale may dramatically vary from event to event as it strongly depends on many parameters entering the problem as mentioned above. In particular, it obviously strongly depends on intensity (number of emitted particles N) of a previous pulse. Essentially the parameter (21) should be interpreted as a preparation time the system requires for the next eruption.
The strong variation of the should be contrasted with another parameter which is the time duration of a single pulse . In the AQN framework this parameter must not vary much from one event to another as it is entirely determined by internal dynamics of the AQN during the eruption irrespective to the intensity of the previous events, and irrespective to the prehistory of the AQN propagation as long as condition (8) is met7. In different words, our proposal suggests that
where the constant cannot be computed from first principles as it is entirely determined by the non-equilibrium dynamics of the AQN at the instant of eruption8.
Now we are prepared to confront the basic consequences of our proposal (identifying the MMEs with the AQN annihilation events) with observations.
1. “clustering puzzle”: The multiple number of events is a very generic feature of the system as explained at the very end of Section 3.3 as long as condition (8) is met. The time delays between the pulses dramatically fluctuate between different events. The window for these variations is huge according to (21). In fact, it could be even well outside of this window. The time delays may considerably vary even for different events within the same cluster at the same detection point, which is consistent with observed cluster shown on Figure 1. Furthermore, the AQN itself remains almost at the same location as the displacement during entire cluster of events is very tiny
which implies that all individual bunches making the cluster are likely to be emitted by the AQN along the same direction, and can be recorded and classified as MME by H10T. Each event can be viewed as an approximately uniform front as mere notion of the “EAS axis” does not exist in this framework, see also next item. However, each individual event may appear to arrive from slightly different direction due to the inherent spread of the emitted electrons at the moment of eruption.
2. “particle density puzzle”: Particle density distribution in the AQN framework is estimated by (17) and it shows strong fluctuation from one event to another event. These variations are mostly related to the intensity of the individual bursts being expressed by the number of electrons in the bunch N. However, the distinct feature of the distribution in the AQN framework is that it does not depend on R, as the notion of the “EAS axis” does not exist in this framework as we already mentioned. All these generic features of the AQN framework are perfectly consistent with H10T observations as presented on Figure 2. However, these observed features are in dramatic contradiction with conventional EAS prediction shown by solid lines on Figure 2 with different colours, depending on energy of the CR.
Furthermore, the magnitude of the density in the AQN framework (which is mostly determined by parameter N) is much higher than one normally expects for CR energies ∼ eV. The corresponding parameter N representing the number of electrons in the bunch was not fitted for the present studies to match the observations. Instead, it was extracted from different experiment in dramatically different circumstances (in proposal [13] to explain the ANITA anomalous events as the AQN events).
3. “pulse width puzzle”: In the AQN framework the width of the pulse (22) cannot vary much from one event to another. It is a fundamental feature of the framework because the duration of the pulse is entirely determined by internal dynamics of the AQN during the blast as long as condition (8) is met, see footnote 7 with a comment. This feature is in perfect agreement with observations [4]
for all recorded MMEs. At the same time, this feature is in dramatic conflict with conventional picture when the duration of the pulse must depend on the distance to the EAS axis as shown by sold lines on Figure 3. This basic prediction of the conventional CR analysis is due to increase of the thickness of the EAS pancake with the distance from the EAS axis. As we already mentioned the mere notions such as the “EAS axis” and the “thickness of the EAS pancake” do not exist in the AQN framework.
4. “intensity puzzle”: Particle density distribution in the AQN framework is estimated by (17). The corresponding event to event fluctuations do not depend on the distance to the EAS axis as we already mentioned. Such intensity of the events as given by (17) in the AQN framework is consistent with observations shown on Figure 2. However, the observations are in dramatic conflict with conventional CR analysis when such huge intensity could be generated by a primary particle with energy well above eV with dramatically lower event rate on the level of once every few years. The frequency of appearance in the AQN framework is estimated in Section 5, and it is consistent with observed event rate.
We conclude this section with the following comment. All our formulae presented in this section are the order of magnitude estimations at the very best, as they include many inherent uncertainties which are inevitable features of any composite system (such as AQN) propagating in a complex environment (such as Earth atmosphere) with very large Mach number M, see footnote 6.
Nevertheless, the emergent picture suggests that all the puzzles formulated in Section 1 and Section 2 can be naturally understood within the AQN framework as explained above in items 1–4. Needless to say that the crucial phenomenological parameters used in the estimates had been fixed long ago for dramatically different observations in different circumstances for different environments as overviewed in Section 3.
7. Conclusions and Future Development
Our basic results can be summarized as follows. We have argued that all the puzzles formulated in Section 1 and Section 2 can be naturally understood within the AQN framework as explained in items 1–4 in previous Section, and we do not need to repeat these arguments again in this Conclusion. Instead, we want to discuss the drastic differences between the events induced by conventional CR showers and the AQNs. These dramatic distinct features can be tested by the future experiments, such that our proposal can be discriminated from any other proposals and suggestions. We list below the following typical features of the AQN events and contrast them with any other possible mechanisms which could be responsible for MMEs.
- The events which are generated by the bunches of electrons as a result of eruption of the propagating AQN in the Earth atmosphere suggests an enormous number of possibilities to generate different clusters when each event within a given cluster may have very different intensity from a previous and consequent events with very different time delays between the events. In other words, the AQN proposal suggests that there should be large variety of shapes and delays between the events with very different patterns due to the complexity of the AQN system. It should be contrasted, for example, with hypothesis of “delayed particles” (which was originally suggested to explain the MMEs) in which case all clusters must be the same as they should be determined by a specific pattern of decaying fundamental particle of unknown nature.
- A “rule of thumb” suggests that a typical number of charged particles (mostly electrons and positrons) in CR air shower is , which implies that for the energy of the primary particle eV. This estimate suggests that any detector which is designed to study the EAS with energies eV are, in principle, capable to study MMEs if the resolution of the detectors is in ∼10-ns level, similar to H10T, see also item 4 below as an alternative option to properly select and discriminate the MMEs.
- In particular, we expect that the extension of the H10T detector would produce more multiple pulses (at each given detector) instead of simple bimodal pulses. We also expect that more detectors in the area will be recording MMEs because the area covered by each individual pulse is relatively large (few kilometres) according to (17), which is well above the present size of H10T instrument.
The main reason for the dramatic differences between these two radio pulses is that the AQN event could be viewed as an (approximately) uniform front of size km with a constant width, while EAS is characterized by central axis. In different words, the number of particles per unit area in the AQN case does not depend on the distance from the central axis, in huge contrast with conventional CR air showers when strongly depends the distance from the central axis. The width of the “pancake” in CR air shower also strongly depends on R. As a result, the effective number of coherent particles contributing to the radio pulse is highly sensitive to the width of the “pancake” when it becomes close to the wavelength of the radio pulse. These distinct features lead to very different spectral properties of the radio pulses in these two cases, which can be viewed as an independent characteristic of MMEs. In fact, this unique feature can be used in future studies for purpose of discrimination and proper selection of the Multi-Modal Clustering Events.
If future studies and tests (including the detecting of the synchronized radio pulses with MMEs as suggested above) indeed substantiate our proposal it would be a strong argument supporting the AQN nature of the MMEs.
We conclude this work with the following comment. We estimated the event rates for three dramatically different puzzling CR-like events: for mysterious TA bursts [9], for the ANITA anomalous events [13], and finally for the Multi-Modal Events in this work as estimated in (16). All three puzzling phenomena are proportional to one and the same AQN flux (10). The self-consistency between all three estimates hints on a common nature for these puzzling CR-like events. We interpret this self-consistency in the event rates as an additional indirect argument supporting the AQN nature for all three mysterious phenomena, while our direct arguments are presented in Section 6 and listed as item 1–4. We finish on this optimistic note.
Funding
The APC was funded by the Natural Sciences and Engineering Research Council of Canada.
Acknowledgments
Conflicts of Interest
The author declares no conflict of interest.
Appendix A. On Suppression of Emissivity Due to the Ionization
The main goal of this section is to produce simple estimates of the suppression parameter which enters the cooling rate (4) in case of high temperature and large ionization. It was introduced in [43] as a suppression parameter accounting for the ionization of the AQN after it travelled through the Earth. It was also shown that produces very reasonable results consistent with intensity of the radiation observed by XMM-Newton [42].
The original computations of the Bremsstrahlung radiation were performed in [45] in case of low temperature and low ionization as given by (2). The key element of the computations was the electrosphere density
with
where is the positron number density of the electrosphere, corresponds to the surface of the nuggets, and reproduces an approximate formula for the plasma density in the Boltzmann regime at the temperature T as computed in [45]. The 1d approximation formulated in terms of distance z from the surface was more than sufficient sufficient to study the low temperature behaviour.
However, after an AQN crosses the Earth, it acquires a very high internal temperature of the order keV, and approximation (A1) is not sufficient. This is because temperature’s rise will cause the electrosphere to expand well beyond the thin layer ∼ surrounding the nugget surface. Some positrons will leave the system but the majority will stay in close vicinity of the moving, negatively charged nugget core. Consequently, the nugget will acquire a negative charge of approximately with the number of positrons Q estimated as:
The distance at which the positrons remain attached to the nugget is given by the capture radius , determined by the Coulomb attraction:
In order to estimate entering (4) we start our analysis with an estimation of the positron density when the AQNs enter the Earth atmosphere moving in upward direction. Formula (A3) shows that the capture radius could be much larger than R, i.e., we have . The expression (A1), which is valid when , in close vicinity to the core, breaks down for . In that case the curvature of the nugget surface cannot be neglected and one should use a truly 3-dimensional formula for instead of the 1-dimensional approximation (A1). We will assume that the density behaves as a power law for with exponent p:
where is a normalization factor and p a free parameter. Equation (A4) is consistent with our previous numerical studies [53] of the electrosphere with . It is also consistent with the conventional Thomas-Fermi model9 at [54]. While keeping p as a free parameter, we will show below that our main claim is not very sensitive to the precise value of p. The normalization can be estimated from the condition that the finite portion of the positrons satisfying Equation (A3) is such that the total number of positrons surrounding the nugget is approximately equal to the ionization charge Q determined by (A2). Therefore, we arrive to the following expression for the normalization factor :
Note that the integrant is mostly dominated by the inner shells such that the intgration can be extended to infinity with very high accuracy, instead of cutting off at . The resulting estimate for assumes the form:
which, as expected, is smaller than because the positrons now are distributed over a distance of order R from the nugget core surface, rather than over a distance of order . This suppression is convenient to represent in terms of the dimensionless ratio:
The next step is the calculation of the Bremsstrahlung emissivity by the nuggets due to the strong suppression of the plasma density (A7) as a result of the electrosphere’s expansion. The spectral surface emissivity is denoted as , representing the energy emitted by a single nugget per unit time, per unit area of nugget surface and per unit frequency. For low temperature, when approximation (A1) for the flat geometry is justified, the corresponding expression assumes the form [45]:
where is the local density of positrons at distance z from quark nugget surface and function does not depend on z and describes the spectral dependence of the system:
The dimensionless function in (A9) is a slowly varying logarithmic function of which was explicitly computed in [45]. In order to calculate the emissivity with the positron density (A4), when the nugget core is ionized, we have to replace the integral in (A8) by the spherical integration over :
where the normalization is determined by (A6). Using the positrons distributed according to Equation (A4) the nugget surface emissivity can be calculated as follows:
The key result here is the strong suppression factor which was not present in the no-ionization case (A8) when the positrons are localized in a thin layer. It is instructive to compare the emissivity given by Equation (A11) accounting for ionization of the nugget core with the original Formula (A8). The dimensionless ratio is given by
The total emissivity integrated over all frequencies in case of low temperature without ionization has been computed in [45] and it is given by (2). In case of strong ionization, Equation (A12) implies:
The critical element leading to the suppression factor (A12) is the very small quantity . It is a direct result of the expanding electrosphere and high level of ionization at very high temperature T.
Appendix B. On e+ e− Emission at High Temperature in High Density QCD Phases
The main goal of this Appendix is to overview the photon emission and the production at high temperature keV from high density QCD phases. The corresponding studies [55,56,57,58,59,60,61] have been carried out in the past in context of the quark stars. In context of the present work all the key ingredients relevant for production are also present in the system. Indeed, the AQN is characterized by very high temperature keV, the quark core is assumed to be in CS dense phase, and a strong internal electric field is also present in the system. However, we cannot literally use the results from the previous studies obtained in context of the quark stars because the size of the AQN is much smaller than the relevant mean free paths for all elementary processes as discussed in details in [13]. As a result the thermal equilibration cannot be achieved in the AQN system, and entire physics is determined by non-equilibrium dynamics in high temperature regime. It should be contrasted with large size quark stars where the thermal equilibrium is maintained.
Nevertheless, it is very instructive to review the relevant results from the previous studies [55,56,57,58,59,60,61] on quark stars due to the following reasons. First, it explicitly shows the role of the main ingredients of the system, such as temperature and the large electric field. Secondly, it demonstrates the complexity of the problem when even a much simpler case of the bare quark star remains to be a matter of debates.
The idea on possibility of the emission at high temperature from quark stars was originally suggested in [55,56]. The temperature range considered in [55,56] includes the typical temperatures keV which is expected to occur in our case when the AQN exits the Earth’s surface as mentioned in Section 3.3. In refs. [57,58] the authors argue that bremsstrahlung radiation from the electrosphere could be much more important than emission. It has been also argued that a number of effects such as the boundary effects, inhomogeneity of the electric field, and the Landau-Pomeranchuk-Migdal (LPM) suppression may dramatically modify the emission rate. In [59] it has been argued that the Pauli blocking will strongly suppress the bremsstrahlung emission. Finally, in refs. [60,61] it has been argued that the so-called mean field bremsstrahlung could be the dominant mechanism.
It is not the goal of the present work to critically analyze all these suggested mechanisms of the emission. Rather, our goal is to demonstrate that even a relatively simple system of the bare quark star remains to be a matter of debates. Our case of the emission from AQN at high temperature is even more complicated as it is determined by non-equilibrium dynamics.
In the present work we do not even attempt to solve this very ambitious problem of estimating the absolute intensity rate of the and emissions. Rather, the absolute number of the pairs in a single pulse was extracted from ANITA anomalous events as explained in Section 6. In particular, this number N enters the estimate (17) for the density of the observed particles by H10T experiment [1,2,3,4]. Our goal here is much less ambitious as we try to estimate the relative ratio r between the pair production and the radiation assuming that the emission of both components is mostly originated from the region in electrosphere where the Boltzmann regime is justified, and the Pauli blocking suppression is not very dramatic and can be ignored.
In this case, the relative ratio r between these two components contributing to the emission can be estimated as follows. It is assumed that the dominant contribution to the emission comes from the Bremsstrahlung radiation () resembling the low temperature case considered in [45]. The pair is produced by a similar mechanism through the virtual photon () which consequently decays to the pair: . If this is the dominant mechanism of radiation the pair production is expected to be suppressed by a factor as a result of conversion of the virtual photon to pair10. It must be also suppressed by a factor describing the suppression in the density distribution because the virtual photons must have sufficient energy to produce pair. This oversimplified estimate leads to the following expression
where for numerical estimates we use keV, and ignored a possible complicated function which could depend on parameter , which is order of unity for our case. We must emphasize that (A14) is really an order of magnitude estimate as mechanism of emission is not a thermodynamically equilibrium process as we already previously mentioned. Formula (A14) is used in the main body of the text in (18) for our estimate (21) for which is measured by H10T experiment [1,2,3,4,5] as it describes a typical time delay between subsequent pulses representing the Multi-Modal Clustering Events.
| 1 | Non-detection of etching tracks in ancient mica gives another indirect constraint on the flux of dark matter nuggets with mass g [40]. This constraint is based on assumption that all nuggets have the same mass, which is not the case as we discuss below. The nuggets with small masses represent a tiny portion of all nuggets in this model, such that this constraint is easily satisfied with any reasonable nugget’s size distribution. |
| 2 | In a neutral dilute galactic environment considered previously [45] the value of was estimated as . |
| 3 | We use the term“additional” to emphasize that the AQN had accumulated a huge amount of energy during the transpassing the Earth interior as the capacity of the quark core nugget is very large [43]. Precisely this accumulated energy will be emitted in form of the X rays when the AQN propagates in empty space at distances from the Earth surface. |
| 4 | For example, the AQNs moving in empty space and slowly cooling by emitting the X rays as computed in [43] belongs to this class. |
| 5 | An analogy for such eruption-like event is the lightning flash under thunderclouds. The clouds accumulate the electric charge in form of the ionized molecule very efficiently. The corresponding time scales plays the role of in our system. The neutralization of these ions is less efficient process, which is analogous to our . If some conditions are met (the so-called runaway breakdown conditions are satisfied, see [46,47] for review) the discharge occurs in form of the eruption which is the lightning strike in our analogy. The system is getting neutralized in form of the non- equilibrium lightning event (eruption) on the time scales which are much shorter than any time scales of the problem. This analogy is in fact, quite deep, and will be used in Section 6 when we discuss different time scales of MMEs as observed by H10T detector. |
| 6 | One should keep in mind that the AQN propagates in atmosphere with very large velocity, much larger than the speed of sound such that the Mach number . This obviously implies the presence of the turbulence with accompanying shock waves. The corresponding effects which are hard to compute from first principles obviously modify the value of and, as a consequence, the corresponding estimate for the time delay . |
| 7 | This approximately constant parameter can be understood using the analogy with lightnings mentioned in footnote 5. Indeed, the time scale between lightning flashes may dramatically vary (measured in minutes) during the same thunderstorm while the lightning strikes themselves are much shorter and characterized approximately by the same duration (measured in ms). |
| 8 | The analogy with lightnings mentioned in footnotes 5 and 7 can be useful here: the instability in form of the runaway breakdown mechanism in lightnings which is responsible for the flashes is similar to non-equilibrium dynamics of the AQN at the instant of eruption. Furthermore, in both cases there must be some trigger which initiates the eruption. In case of lightning events the trigger is thought to be related to the cosmic rays, though this element remains a part of controversy, see [46,47] for review. In case of the AQN eruption events such triggers could be several consequent successful annihilation events with atmospheric material. |
| 9 | In [54], the dimensionless function behaves as at large x. The potential behaves as . The density of electrons in Thomas-Fermi model scales as at large x. |
| 10 |
References
- Beznosko, D.; Beisembaev, R.U.; Baigarin, K.A.; Batyrkhanov, A.; Beisembaeva, E.A.; Beremkulov, T.; Dalkarov, O.D.; Iakovlev, A.; Ryabov, V.A.; Suleimenov, N.S.; et al. Horizon-T experiment and detection of Extensive air showers with unusual structure. J. Phys. Conf. Ser. 2020, 1342, 012007. [Google Scholar] [CrossRef]
- Beznosko, D.; Beisembaev, R.; Baigarin, K.; Beisembaeva, E.; Dalkarov, O.; Ryabov, V.; Sadykov, T.; Shaulov, S.; Stepanov, A.; Vildanova, M.; et al. Extensive Air Showers with unusual structure. Eur. Phys. J. Web Conf. 2017, 145, 14001. [Google Scholar] [CrossRef]
- Beisembaev, R.; Beznosko, D.; Baigarin, K.; Batyrkhanov, A.; Beisembaeva, E.; Dalkarov, O.; Iakovlev, A.; Ryabov, V.; Sadykov, T.; Shaulov, S.; et al. Extensive Air Showers with Unusual Spatial and Temporal Structure. Eur. Phys. J. Web Conf. 2019, 208, 06002. [Google Scholar] [CrossRef]
- Beznosko, D.; Beisembaev, R.; Beisembaeva, E.; Dalkarov, O.D.; Mossunov, V.; Ryabov, V.; Shaulov, S.; Vildanova, M.; Zhukov, V.; Baigarin, K.; et al. Spatial and Temporal Characteristics of EAS with Delayed Particles. In Proceedings of the ICRC 2019, Madison, WI, USA, 24 July–1 August 2019; p. 195. [Google Scholar] [CrossRef]
- Beisembaev, R.U.; Beisembaeva, E.A.; Dalkarov, O.D.; Mosunov, V.D.; Ryabov, V.A.; Shaulov, S.B.; Vildanova, M.I.; Zhukov, V.V.; Baigarin, K.A.; Beznosko, D.; et al. Unusual Time Structure of Extensive Air Showers at Energies Exceeding 1017 eV. Phys. Atom. Nucl. 2019, 82, 330–333. [Google Scholar] [CrossRef]
- Zhitnitsky, A.R. ‘Nonbaryonic’ dark matter as baryonic colour superconductor. JCAP 2003, 10, 010. [Google Scholar] [CrossRef] [Green Version]
- Jelley, J.V.; Whitehouse, W.J. The Time Distribution of Delayed Particles in Extensive Air Showers using a Liquid Scintillation Counter of Large Area. Proc. Phys. Soc. Sect. A 1953, 66, 454–466. [Google Scholar] [CrossRef]
- Linsley, J.; Scarsi, L. Arrival Times of Air Shower Particles at Large Distances from the Axis. Phys. Rev. 1962, 128, 2384–2392. [Google Scholar] [CrossRef]
- Zhitnitsky, A. The Mysterious Bursts observed by Telescope Array and Axion Quark Nuggets. J. Phys. G Nucl. Part. Phys. 2020, 48, 065201. [Google Scholar] [CrossRef]
- Liang, X.; Zhitnitsky, A. Telescope Array Bursts, Radio Pulses and Axion Quark Nuggets. arXiv 2021, arXiv:2101.01722. [Google Scholar]
- Abbasi, R.U.; Abe, M.; Abu-Zayyad, T.; Allen, M.; Anderson, R.; Azuma, R.; Barcikowski, E.; Belz, J.W.; Bergman, D.R.; Blake, S.A.; et al. The bursts of high energy events observed by the telescope array surface detector. Phys. Lett. A 2017, 381, 2565–2572. [Google Scholar] [CrossRef]
- Okuda, T. Telescope Array observatory for the high energy radiation induced by lightning. J. Phys. Conf. Ser. 2019, 1181, 012067. [Google Scholar] [CrossRef]
- Liang, X.; Zhitnitsky, A. The ANITA Anomalous Events and Axion Quark Nuggets. arXiv 2021, arXiv:2105.01668. [Google Scholar]
- Gorham, P.W.; Nam, J.; Romero-Wolf, A.; Hoover, S.; Allison, P.; Banerjee, O.; Beatty, J.J.; Belov, K.; Besson, D.Z.; Binns, W.R.; et al. Characteristics of Four Upward-pointing Cosmic-ray-like Events Observed with ANITA. Phys. Rev. Lett. 2016, 117, 071101. [Google Scholar] [CrossRef] [PubMed] [Green Version]
- Gorham, P.W.; Rotter, B.; Allison, P.; Banerjee, O.; Batten, L.; Beatty, J.J.; Bechtol, K.; Belov, K.; Besson, D.Z.; Binns, W.R.; et al. Observation of an Unusual Upward-going Cosmic-ray-like Event in the Third Flight of ANITA. Phys. Rev. Lett. 2018, 121, 161102. [Google Scholar] [CrossRef] [PubMed] [Green Version]
- Gorham, P.W.; Ludwig, A.; Deaconu, C.; Cao, P.; Allison, P.; Banerjee, O.; Batten, L.; Bhattacharya, D.; Beatty, J.J.; Belov, K.; et al. Unusual Near-Horizon Cosmic-Ray-like Events Observed by ANITA-IV. Phys. Rev. Lett. 2021, 126, 071103. [Google Scholar] [CrossRef]
- Zhitnitsky, A. Axion quark nuggets. Dark matter and matter–antimatter asymmetry: Theory, observations and future experiments. Mod. Phys. Lett. A 2021, 36, 2130017. [Google Scholar] [CrossRef]
- Witten, E. Cosmic separation of phases. Phys. Rev. D 1984, 30, 272–285. [Google Scholar] [CrossRef]
- Farhi, E.; Jaffe, R.L. Strange matter. Phys. Rev. D 1984, 30, 2379–2390. [Google Scholar] [CrossRef]
- De Rujula, A.; Glashow, S.L. Nuclearites—A novel form of cosmic radiation. Nature 1984, 312, 734–737. [Google Scholar] [CrossRef] [Green Version]
- Madsen, J. Physics and Astrophysics of Strange Quark Matter. In Hadrons in Dense Matter and Hadrosynthesis; Cleymans, J., Geyer, H.B., Scholtz, F.G., Eds.; Lecture Notes in Physics; Springer: Berlin, Germany, 1999; Volume 516, p. 162. [Google Scholar] [CrossRef] [Green Version]
- Peccei, R.D.; Quinn, H.R. Constraints imposed by CP conservation in the presence of pseudoparticles. Phys. Rev. D 1977, 16, 1791–1797. [Google Scholar] [CrossRef]
- Weinberg, S. A new light boson? Phys. Rev. Lett. 1978, 40, 223–226. [Google Scholar] [CrossRef]
- Wilczek, F. Problem of strong P and T invariance in the presence of instantons. Phys. Rev. Lett. 1978, 40, 279–282. [Google Scholar] [CrossRef]
- Kim, J.E. Weak-interaction singlet and strong CP invariance. Phys. Rev. Lett. 1979, 43, 103–107. [Google Scholar] [CrossRef]
- Shifman, M.A.; Vainshtein, A.I.; Zakharov, V.I. Can confinement ensure natural CP invariance of strong interactions? Nucl. Phys. B 1980, 166, 493–506. [Google Scholar] [CrossRef]
- Dine, M.; Fischler, W.; Srednicki, M. A simple solution to the strong CP problem with a harmless axion. Phys. Lett. B 1981, 104, 199–202. [Google Scholar] [CrossRef]
- Zhitnitsky, A.R. On Possible Suppression of the Axion Hadron Interactions. Sov. J. Nucl. Phys. 1980, 31, 260. (In Russian) [Google Scholar]
- Van Bibber, K.; Rosenberg, L.J. Ultrasensitive Searches for the Axion. Phys. Today 2006, 59, 30. [Google Scholar] [CrossRef]
- Asztalos, S.J.; Rosenberg, L.J.; van Bibber, K.; Sikivie, P.; Zioutas, K. Searches for Astrophysical and Cosmological Axions. Annu. Rev. Nucl. Part. Sci. 2006, 56, 293–326. [Google Scholar] [CrossRef] [Green Version]
- Sikivie, P. Axion Cosmology. In Axions; Kuster, M., Raffelt, G., Beltrán, B., Eds.; Lecture Notes in Physics; Springer: Berlin, Germany, 2008; Volume 741, p. 19. [Google Scholar]
- Raffelt, G.G. Astrophysical Axion Bounds. In Axions; Kuster, M., Raffelt, G., Beltrán, B., Eds.; Lecture Notes in Physics; Springer: Berlin, Germany, 2008; Volume 741, p. 51. [Google Scholar]
- Sikivie, P. Dark Matter Axions. Int. J. Mod. Phys. A 2010, 25, 554–563. [Google Scholar] [CrossRef]
- Rosenberg, L.J. Dark-matter QCD-axion searches. Proc. Natl. Acad. Sci. USA 2015, 112, 12278–12281. [Google Scholar] [CrossRef] [Green Version]
- Marsh, D.J.E. Axion cosmology. Phys. Rep. 2016, 643, 1–79. [Google Scholar] [CrossRef] [Green Version]
- Graham, P.W.; Irastorza, I.G.; Lamoreaux, S.K.; Lindner, A.; van Bibber, K.A. Experimental Searches for the Axion and Axion-Like Particles. Annu. Rev. Nucl. Part. Sci. 2015, 65, 485–514. [Google Scholar] [CrossRef] [Green Version]
- Irastorza, I.G.; Redondo, J. New experimental approaches in the search for axion-like particles. Prog. Part. Nucl. Phys. 2018, 102, 89–159. [Google Scholar] [CrossRef] [Green Version]
- Anastassopoulos, V.; Aune, S.; Barth, K.; Belov, A.; Cantatore, G.; Carmona, J.M.; Castel, J.F.; Cetin, S.A.; Christensen, F.; Collar, J.I.; et al. New CAST Limit on the Axion-Photon Interaction. Nat. Phys. 2017, 13, 584–590. [Google Scholar] [CrossRef]
- Zhang, J.; Tsai, Y.L.S.; Kuo, J.L.; Cheung, K.; Chu, M.C. Ultralight Axion Dark Matter and Its Impact on Dark Halo Structure in N-body Simulations. Astrophys. J. 2018, 853, 51. [Google Scholar] [CrossRef] [Green Version]
- Jacobs, D.M.; Starkman, G.D.; Lynn, B.W. Macro Dark Matter. Mon. Not. R. Astron. Soc. 2015, 450, 3418–3430. [Google Scholar] [CrossRef] [Green Version]
- Gorham, P.W. Antiquark nuggets as dark matter: New constraints and detection prospects. Phys. Rev. D 2012, 86, 123005. [Google Scholar] [CrossRef] [Green Version]
- Fraser, G.W.; Read, A.M.; Sembay, S.; Carter, J.A.; Schyns, E. Potential solar axion signatures in X-ray observations with the XMM?Newton observatory. Mon. Not. R. Astron. Soc. 2014, 445, 2146–2168. [Google Scholar] [CrossRef] [Green Version]
- Ge, S.; Rachmat, H.; Siddiqui, M.S.R.; Van Waerbeke, L.; Zhitnitsky, A. X-ray annual modulation observed by XMM-Newton and Axion Quark Nugget Dark Matter. arXiv 2020, arXiv:2004.00632. [Google Scholar]
- Fox, D.B.; Sigurdsson, S.; Shandera, S.; Mészáros, P.; Murase, K.; Mostafá, M.; Coutu, S. The ANITA Anomalous Events as Signatures of a Beyond Standard Model Particle, and Supporting Observations from IceCube. arXiv 2018, arXiv:1809.09615. [Google Scholar]
- Forbes, M.M.; Zhitnitsky, A.R. WMAP haze: Directly observing dark matter? Phys. Rev. D 2008, 78, 083505. [Google Scholar] [CrossRef] [Green Version]
- Gurevich, A.V.; Zybin, K.P. Runaway breakdown and electric discharges in thunderstorms. Physics-Uspekhi 2001, 44, 1119–1140. [Google Scholar] [CrossRef]
- Dwyer, J.R.; Uman, M.A. The physics of lightning. Phys. Rep. 2014, 534, 147–241. [Google Scholar] [CrossRef]
- Lawson, K.; Liang, X.; Mead, A.; Siddiqui, M.S.R.; Van Waerbeke, L.; Zhitnitsky, A. Gravitationally trapped axions on the Earth. Phys. Rev. D 2019, 100, 043531. [Google Scholar] [CrossRef] [Green Version]
- NOAA, National Centers for Environmental Information. Available online: https://www.ngdc.noaa.gov/geomag/calculators/magcalc.shtml#igrfgrid (accessed on 15 October 2021).
- Jackson, J.D. Classical Electrodynamics, 3rd ed.; Wiley: New York, NY, USA, 1999. [Google Scholar]
- Huege, T.; Falcke, H. Radio emission from cosmic ray air showers: Coherent geosynchrotron radiation. Astron. Astrophys. 2003, 412, 19–34. [Google Scholar] [CrossRef] [Green Version]
- Huege, T.; Falcke, H. Radio emission from cosmic ray air showers: Simulation results and parametrization. Astropart. Phys. 2005, 24, 116–136. [Google Scholar] [CrossRef] [Green Version]
- Forbes, M.M.; Lawson, K.; Zhitnitsky, A.R. Electrosphere of macroscopic “quark nuclei”: A source for diffuse MeV emissions from dark matter. Phys. Rev. D 2010, 82, 083510. [Google Scholar] [CrossRef] [Green Version]
- Landau, L.D.; Lifshitz, E.M. Course of Theoretical Physics; Butterworth-Heinemann: Oxford, UK, 1975. [Google Scholar]
- Usov, V.V. Bare quark matter surfaces of strange stars and e+e− emission. Phys. Rev. Lett. 1998, 80, 230–233. [Google Scholar] [CrossRef] [Green Version]
- Usov, V.V. Thermal emission from bare quark matter surfaces of hot strange stars. Astrophys. J. Lett. 2001, 550, L179. [Google Scholar] [CrossRef]
- Jaikumar, P.; Gale, C.; Page, D.; Prakash, M. Bremsstrahlung photons from the bare surface of a strange quark star. Phys. Rev. D 2004, 70, 023004. [Google Scholar] [CrossRef]
- Harko, T.; Cheng, K.S. Photon Emissivity of the Electrosphere of Bare Strange Stars. Astrophys. J. 2005, 622, 1033–1043. [Google Scholar] [CrossRef] [Green Version]
- Caron, J.F.; Zhitnitsky, A.R. Bremsstrahlung emission from quark stars. Phys. Rev. D 2009, 80, 123006. [Google Scholar] [CrossRef] [Green Version]
- Zakharov, B.G. Photon emission from bare quark stars. J. Exp. Theor. Phys. 2011, 112, 63–76. [Google Scholar] [CrossRef] [Green Version]
- Zakharov, B.G. Effect of electric field of the electrosphere on photon emission from quark stars. Phys. Lett. B 2010, 690, 250–254. [Google Scholar] [CrossRef] [Green Version]
- Berestetskii, V.B.; Pitaevskii, L.P.; Lifshitz, E.M. Course of Theoretical Physics; Butterworth-Heinemann: Oxford, UK, 1982. [Google Scholar]
Figure 1.
(top): Aerial view and geometry of H10T instrument with location of 10 detectors, adapted from Beznosko et al., 2019 [4]; (bottom): A typical MME event recorded on 6 April 2018 by H10T instrument at point , adapted from Beznosko et al., 2019 [4]. All pulses are recorded at a single detection point. Delay times, the width of each peak in ns, and the particle density per within are also shown in the table.

Figure 2.
Solid lines: the particle density distribution in simulated EAS disk versus distance from axis for different energies shown by different colours, depending on energy of the CR. Blue dots: cumulative particle density for each bimodal pulse vs. distance to EAS axis, adapted from Beznosko et al., 2019 [4].

Figure 3.
Solid lines: simulated EAS disk width versus distance from axis for different energies shown by different colours. Pulse width in ns for the first pulse (in blue) and second pulse (in red) for the bimodal pulses versus distance to the EAS axis, adapted from Beznosko et al., 2019 [4].
Figure 3.
Solid lines: simulated EAS disk width versus distance from axis for different energies shown by different colours. Pulse width in ns for the first pulse (in blue) and second pulse (in red) for the bimodal pulses versus distance to the EAS axis, adapted from Beznosko et al., 2019 [4].

Publisher’s Note: MDPI stays neutral with regard to jurisdictional claims in published maps and institutional affiliations. |
© 2021 by the author. Licensee MDPI, Basel, Switzerland. This article is an open access article distributed under the terms and conditions of the Creative Commons Attribution (CC BY) license (https://creativecommons.org/licenses/by/4.0/).
Share and Cite
MDPI and ACS Style
Zhitnitsky, A. Multi-Modal Clustering Events Observed by Horizon-10T and Axion Quark Nuggets. Universe 2021, 7, 384. https://0-doi-org.brum.beds.ac.uk/10.3390/universe7100384
AMA Style
Zhitnitsky A. Multi-Modal Clustering Events Observed by Horizon-10T and Axion Quark Nuggets. Universe. 2021; 7(10):384. https://0-doi-org.brum.beds.ac.uk/10.3390/universe7100384
Chicago/Turabian StyleZhitnitsky, Ariel. 2021. "Multi-Modal Clustering Events Observed by Horizon-10T and Axion Quark Nuggets" Universe 7, no. 10: 384. https://0-doi-org.brum.beds.ac.uk/10.3390/universe7100384
Note that from the first issue of 2016, this journal uses article numbers instead of page numbers. See further details here.