
M-Class Solar Flares in Solar Cycles 23 and 24: Properties and Space Weather Relevance


1
Institute of Astronomy and National Astronomical Observatory (IANAO), Bulgarian Academy of Sciences, BG-1784 Sofia, Bulgaria
2
National Research Institute of Astronomy and Geophysics (NRIAG), Helwan EG-11421, Egypt
*
Author to whom correspondence should be addressed.
Universe 2022, 8(1), 39; https://0-doi-org.brum.beds.ac.uk/10.3390/universe8010039
Submission received: 25 November 2021
/
Revised: 4 January 2022
/
Accepted: 5 January 2022
/
Published: 10 January 2022
(This article belongs to the Special Issue Space Weather and Space Climate of Our Solar System)
Abstract
:A comprehensive statistical analysis on the properties and accompanied phenomena of all M-class solar flares (as measured in soft X-rays) in the last two solar cycles (1996–2019) is presented here with a focus on their space weather potential. The information about the parent active region and the underlying sunspot (Hale) type is collected for each case, where possible, in order to identify photospheric precondition as precursors for the solar flare eruption or confinement. Associations with coronal mass ejections, solar energetic particles, and interplanetary radio emissions are also evaluated and discussed as possible proxies for flare eruption and subsequent space weather relevance. The results show that the majority (∼80%) of the analyzed M-class flares are of , -, and -- magnetic field configuration. The M-class population of flares is accompanied by CMEs in 41% of the cases and about half of the flare sample has been associated with radio emission from electron beams. A much lower association (≲10%) is obtained with shock wave radio signatures and energetic particles. Furthermore, a parametric scheme is proposed in terms of occurrence rates between M-class flares and a variety of accompanied solar phenomena as a function of flare sub-classes or magnetic type. This study confirms the well-known reduced but inevitable space weather importance of M-class flares.
1. Introduction
The electromagnetic (EM) waves emitted during solar eruptions, together with a major reconfiguration of magnetic field lines, acceleration of particles, and mass motion are commonly referred to as solar flare (SF [1,2]). These are the most energetic processes that occur in our solar system as the released energy in 10s min can reach 10 Joules in the extreme cases [3,4]. The emission can cover from the -ray to the radio domain in the EM spectrum. It is the observed brightening in solar images that is commonly regarded as a SF, usually in soft X-ray (SXR) and extreme ultraviolet (EUV) wavelengths.
The availability of GOES (Geostationary Operational Environmental Satellite-GOES, https://www.goes.noaa.gov/ (accessed on 15 November 2021)) SXR data (1–8Å) since the mid-1970s is what shaped the still used today SF classification, with X-class at the upper limit, where the observed solar SXR flux is exceeding 10 Wm, and A-class, < Wm, at the lower. The intermediate letter representations (M, C, B) are a factor of 10 lower in SXR intensity from the preceding. Alternative observations in the H spectral line proposed their own qualitative SF classification into faint (f), normal (n) or brilliant (b) or quantitative one, as a measure of millionths of the hemisphere (corrected area in km) from S (small, <100) to a range of values, 1 (100–250), 2 (250–600), 3 (600–1200) and 4 (>1200). EUV measurements in a variety of wavelengths from a space mission, such as SOHO (SOlar and Heliospheric Observatory-SOHO, a joint ESA−NASA mission, https://www.esa.int/Science_Exploration/Space_Science/SOHO_overview2,https://soho.nascom.nasa.gov/ (accessed on 15 November 2021)), TRACE (Transition Region And Coronal Explorer, https://sdowww.lmsal.com/TRACE/ (accessed on 15 November 2021)), STEREO (https://stereo.gsfc.nasa.gov/ (accessed on 15 November 2021)), SDO (Solar Dynamics Observatory-SDO, https://sdo.gsfc.nasa.gov/ (accessed on 15 November 2021)), is usually used for kinematic studies and detailed investigations of dynamic processes by means of multi-wavelength analyses. EUV to SXR conversion was proposed by [5] as a backup scenario of GOES failure. Whereas the -ray emission from SFs is not a common occurrence (as shown by, e.g., RHESSI (Reuven Ramaty High Energy Solar Spectroscopic Imager-RHESSI, https://hesperia.gsfc.nasa.gov/rhessi3/ (accessed on 15 November 2021)), [6]; CORONAS-F [7,8]; Fermi (Fermi Large Area Telescope-Fermi LAT, https://fermi.gsfc.nasa.gov/ (accessed on 15 November 2021)), [9]), the opposite end of the spectrum offers a diversity of radio emission signatures, identified already in the 1960s (see [10,11] for a review). Radio emission bursts are historically classified as: I (noise storms); II (shock waves); III (electron beams); IV (trapped electrons) to V (post-type III continuum), [12,13] and references therein. A range of fine structures is now possible to observe not only in relation to type IVs, but also type IIIs, once improved radio instruments became available (e.g., LOFAR (LOw-Frequency ARray-LOFAR, https://www.astron.nl/telescopes/lofar/ (accessed on 15 November 2021)) [14]).
SFs are closely associated with other solar activity phenomena: active regions (ARs), sunspots, coronal mass ejections (CMEs, [15]), solar energetic particles [16] (both protons, SEPs, and electrons, SEEs), all generated by the magnetically-govern solar activity. ARs are area complexes around sunspots and their flare productively has been explored previously [17]. We use the AR location in order to associate the investigated solar eruptive phenomena to a common origin.
Sunspots have an old record of observations and the collective efforts for their monitoring still continues (https://wwwbis.sidc.be/silso/ (accessed on 15 November 2021)). Several sunspot classifications are known, [18]: Cortie (a combination of Roman, I to V, and Latin letters, a to d) [19]; Waldmeier or Zurich (from A to J-classes) [20]; modified Zurich or McIntosh (a three-letter classification, with the first one based on the Waldmeier class (without G and J) with two additional letters describing the penumbra structure and the sunspot distribution inside the group) [21] and Mount Wilson or Hale-type (from to with some combinations thereof) [22,23]. In this study we will use the Hale classification in order to include the magnetic field complexity in the analysis and to use it as an approximation of the pre-eruptive condition in the photosphere.
The link between X-class SFs and the ejecta of plasma and magnetic field has also been known [24], whereas the quantitative assessment of the relationship between CMEs and weaker SFs (e.g., M-class SFs) is the subject of the current work. The space weather relevance and the geomagnetic effectiveness of CMEs, their interplanetary (IP) counterparts, and driven shocks are already well established, e.g., [25], and will not be discussed here. In contrast, the aim of our study is to start with a comprehensive list of M-class flares and focus on their eruptive properties.
The space weather relevance of SF eruptions (in radiated EM waves and released energetic particles) has already been confirmed in terms of ionospheric disturbances [26] or radio inferences/blackouts [27]. Space weather in general [25,28] is referred to the heliospheric, magnetospheric, atmospheric, and ground-based effects of the solar activity, both as physical processes, technological and societal consequences, and human health-related risks. Thus, together with the CMEs and energetic particles, SFs are subject to constant monitoring and are intrinsic part in many space weather forecasting efforts [29,30,31,32,33].
The occurrence of SFs, eruptive vs. confined, is a subject to ongoing research [34,35,36], including novel approaches using deep/machine learning and neural network methods. A representative description, however, goes beyond the scope of this study. The operational preparedness and success of the different models is tracked by https://ccmc.gsfc.nasa.gov/challenges/flare.php (accessed on 15 November 2021).
Large SFs (175 X-class flares) have been the topic of a recent study [37], where it has been found that the lack of CMEs and IP type III radio bursts imply coronal confinement, whereas the information about the AR-type and the occurrence or not of other accompanying phenomena, among them energetic particles, could not discriminate well between confined and eruptive cases. In order to prepare a successful forecasting/nowcasting scheme, one needs to explore the occurrence rate, properties, and inter-relationships of the remaining SF sub-classes with other solar activity phenomena.
A logical continuation of this study is to focus on the next in SXR intensity flare class, namely on M-class SFs. M-class flares have been investigated previously as a part of an extensive statistical study of over 50,000 SFs, [38]. The analysis covers an earlier time period (1976–2000) with some small overlap with the present work. M-class flares were found to have 10-minute rise and 12 min decay times. A recent study by [39] considered the same time period as the present study (last two solar cycles, SCs) and flares with X, M, and C-classes, however, the focus of their study was on temporal and periodic variations of the maximum CME speed index.
Following the exploration of the X-class SFs as a working example [37], we focus now on M-class and perform similar association analysis. This is the aim of the current analysis, namely, to identify eruptive vs. confined M-class flares as recorded in the last two SCs using a statistical approach on the association between SFs and other solar eruptive phenomena. In addition, we regard SF confinement as the absence of a CME counterpart and/or the lack of radio emission signatures in the IP space. Thus, we offer an alternative definition for eruption, compared to the pre-existing ones based on the configuration of magnetic field lines in the corona and their evolution.
2. Data and Methods
We used information from several already prepared catalogs, separately for SFs, CMEs, and energetic particles. The analysis started by collecting the yearly reports in SCs 23 and 24 (1996–2019) from ftp://ftp.swpc.noaa.gov/pub/warehouse and ftp://ftp.ngdc.noaa.gov/STP/space-weather/solar-data/solar-features/solar-flares/x-rays/goes/ (accessed on 15 November 2021) and filtering out the M-class flares. The last M-class flare in SC24 occurred on 20 October 2017, however for consistency throughout the text we will quote the entire period of SC24 as ending in 2019. The final event list comprises 2177 M-class flare events. Each flare is collected with its reported timing (start, peak, end), class, and AR (if any). If no information on the AR number is present, we use the listings in https://solarmonitor.org/ (accessed on 15 November 2021) [40] or perform a visual inspection and identification of the location of the EUV brightenings using the movies provided in https://cdaw.gsfc.nasa.gov/CME_list/ (accessed on 15 November 2021) [41]. Based on the AR location, we collect the provided information of the underlying sunspots. The information about the sunspot magnetic configuration (Hale-type classification [22]) is adopted exclusively from the reports listed here: ftp://ftp.swpc.noaa.gov/pub/warehouse/ (accessed on 15 November 2021).
The association between the SFs and CMEs was done by us following the standard procedure adopted in the space weather research [42,43]. Namely, we regard a given CME to be caused by the same solar activity process that led also to the M-class when the CME follows the SF by about one hour and its direction of propagation is within 90 degrees centered at the SF location. The strongest and widest CME is preferred in case of multiple eruptions. The information on the properties of the CMEs is taken from the well-known database: https://cdaw.gsfc.nasa.gov/CME_list/ (accessed on 15 November 2021) [41]. For the need of this work we collected the time of the first occurrence of the CME above the SOHO/LASCO C2 occulting disk, the projected on the plane of sky linear speed and the angular width (AW).
The energetic particles are associated with their solar origin (SF and CME) in terms of timing and strength of the activity, following the standard procedure in particle studies [42,43,44]. In our case we benefit from the availability of online catalogs. For the particle association, we compare the reported in the particle catalog solar origin (SF and CME) with the M-class flare and CME in our listing. For the case of the protons (SEPs), we used the reports in a dedicated proton catalogue [43], http://newserver.stil.bas.bg/SEPcatalog/index.html (accessed on 15 November 2021) as detected by Wind/EPACT (Energetic Particle Acceleration, Composition and Transport-EPACT, https://epact2.gsfc.nasa.gov/, https://cdaweb.gsfc.nasa.gov/index.html/ (accessed on 15 November 2021)) instrument, while for the electrons (SEEs), we adopted the results from the only available electron catalog to date [44] https://www.nriag.sci.eg/ace_electron_catalog/ (accessed on 15 November 2021) based on the deflected electron data from ACE/EPAM (Advanced Composition Explorer-ACE; Electron, Proton, and Alpha Monitor-EPAM, http://sd-www.jhuapl.edu/ACE/EPAM/, https://cdaweb.gsfc.nasa.gov/index.html/ (accessed on 15 November 2021)).
Erroneous associations between SFs and CMEs or SEPs and SF−CME pairs are possible. As the final choice is made by an observer, the subjectivity is intrinsic for this process. Here, we rely on the logical supposition that larger phenomena (in speed or intensity) have a larger weight among the competitive contributions. A comparison between alternative solar origin identifications of SEP events, as proposed by various studies, showed statistically different results when performing a correlation analysis [45].
In addition, we visually identified type II and III radio burst signatures accompanying each SF/CME using the Wind/WAVES (Radio and Plasma Wave Investigation-WAVES, https://solar-radio.gsfc.nasa.gov/wind/data_products.html (accessed on 15 November 2021)) dynamic spectra as provided by SOHO/LASCO (Large Angle and Spectrometric Coronagraph Experiment-LASCO, https://lasco-www.nrl.navy.mil/ (accessed on 15 November 2021)) catalog (https://cdaw.gsfc.nasa.gov/CME_list/ (accessed on 15 November 2021)). Due to the known data gaps there (close to 9% or 186/2177), the identified radio bursts can be considered as a conservative limit.
A link to the text version of the event list used for the calculations in this work can be found in the Supplementary Materials.
3. Results
3.1. Overall Properties of M-Class Flares and Associated Phenomena in SCs 23 and 24
3.1.1. Properties of M-Class Flares
The distribution of M-class flares in the last two SCs is shown in Figure 1. The same color code is used in all figures, namely with black color are denoted the events occurring in SC23 (1428 events in total), whereas red color is used for SC24 (749 events). In the majority of cases, stacked histogram representation is preferred. There, the length of the bin is split into black and red portions reflecting the weight of the SC and the sum of the two-color parts represents the total number of events (SFs, CMEs, particles) in the considered range of properties.
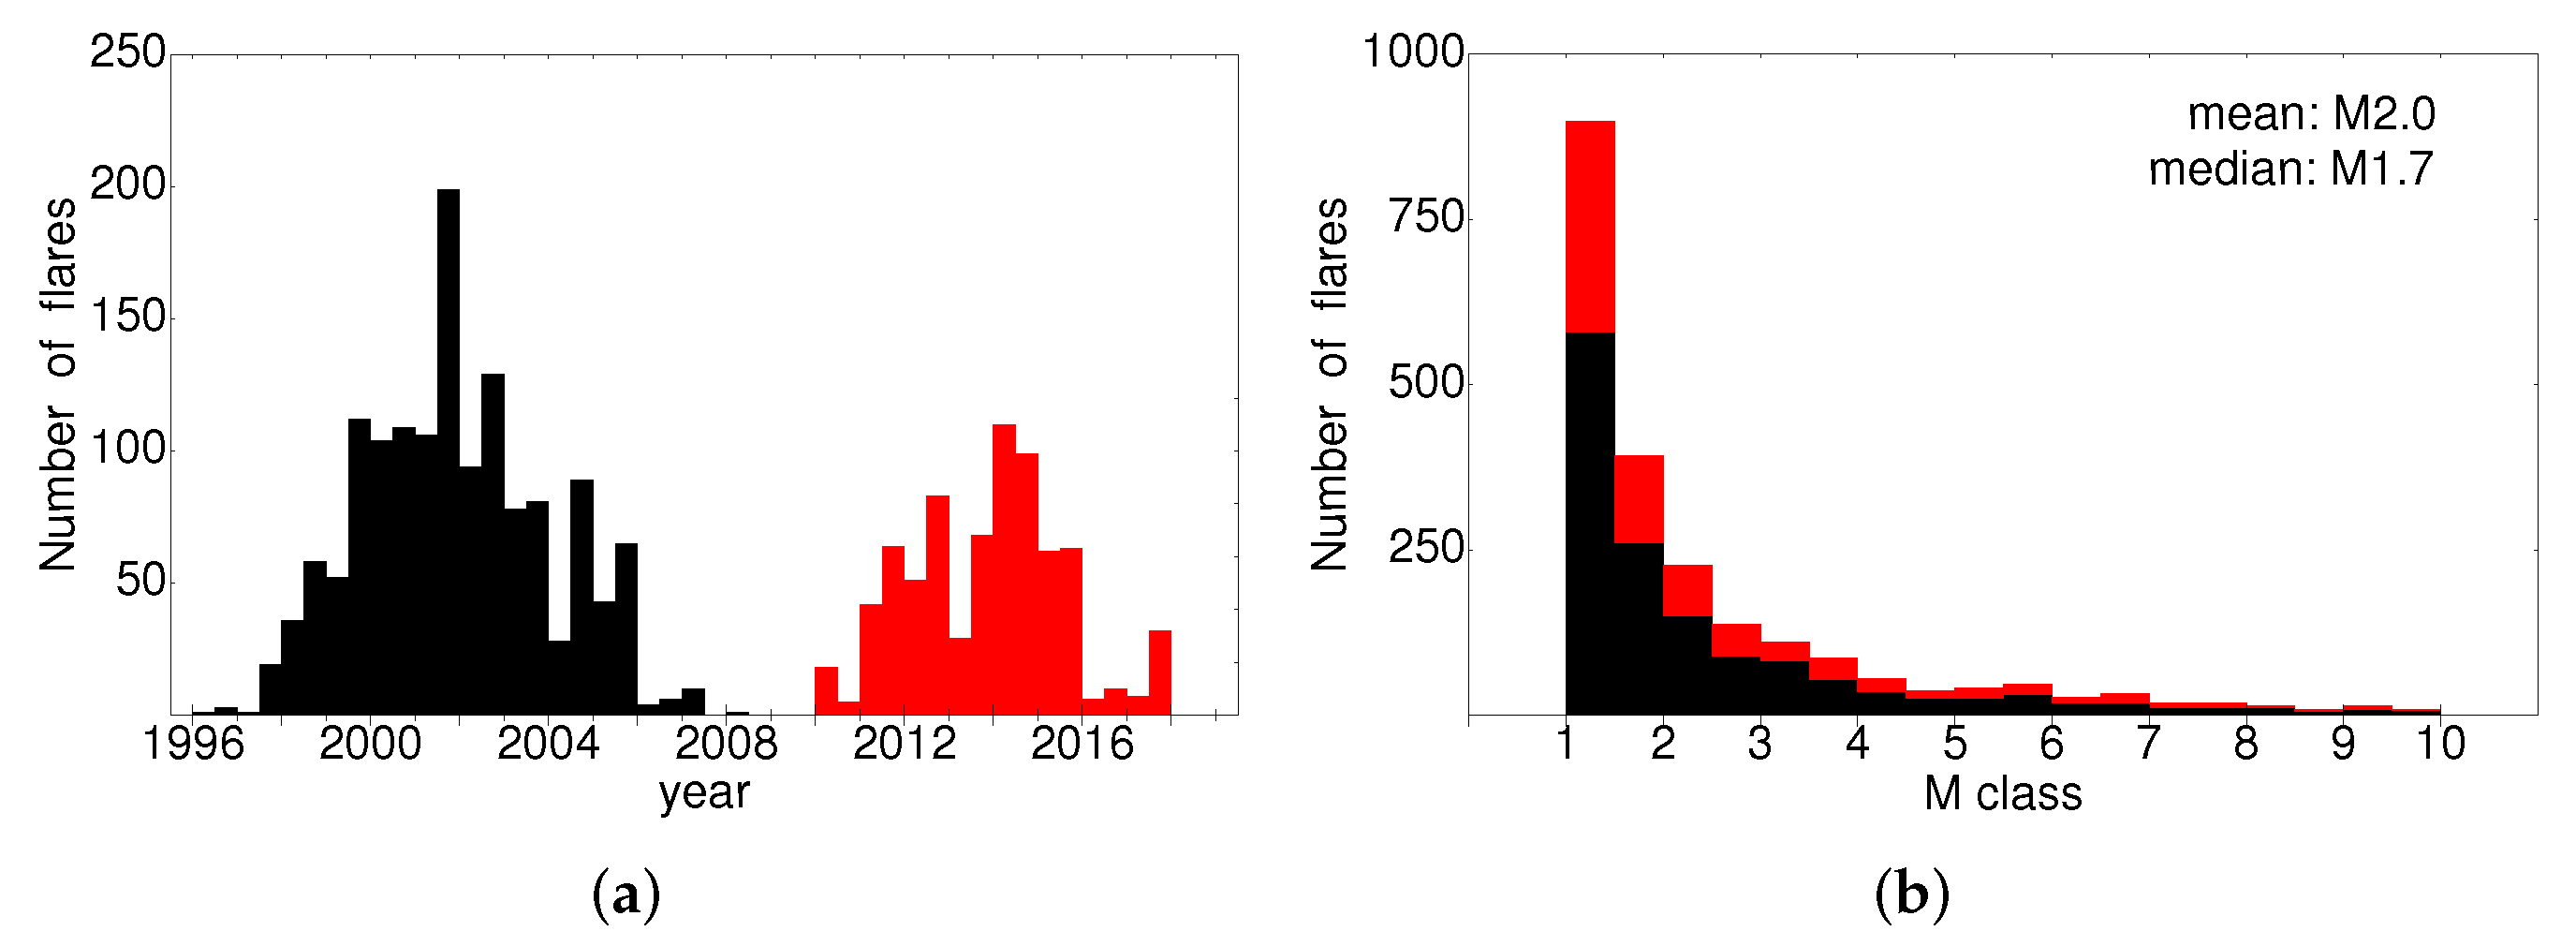
The results in Figure 1a shows the well-known decrease of solar activity during SC24 obtained from previous studies, see [46] and the references therein. The percentage change of M-class flares in SC24 is , compared to SC23. From the right histogram one can see the steep declining trend of the number of SFs (with a long tail of the distribution) with the increase of the flare class, from 898 M1.0−1.4-class SFs to only eight M9.5−M9.9-class SFs over the entire period of interest. The mean and median values are close, M2.0 and M1.7, respectively. Similar behavior is seen in either SCs.
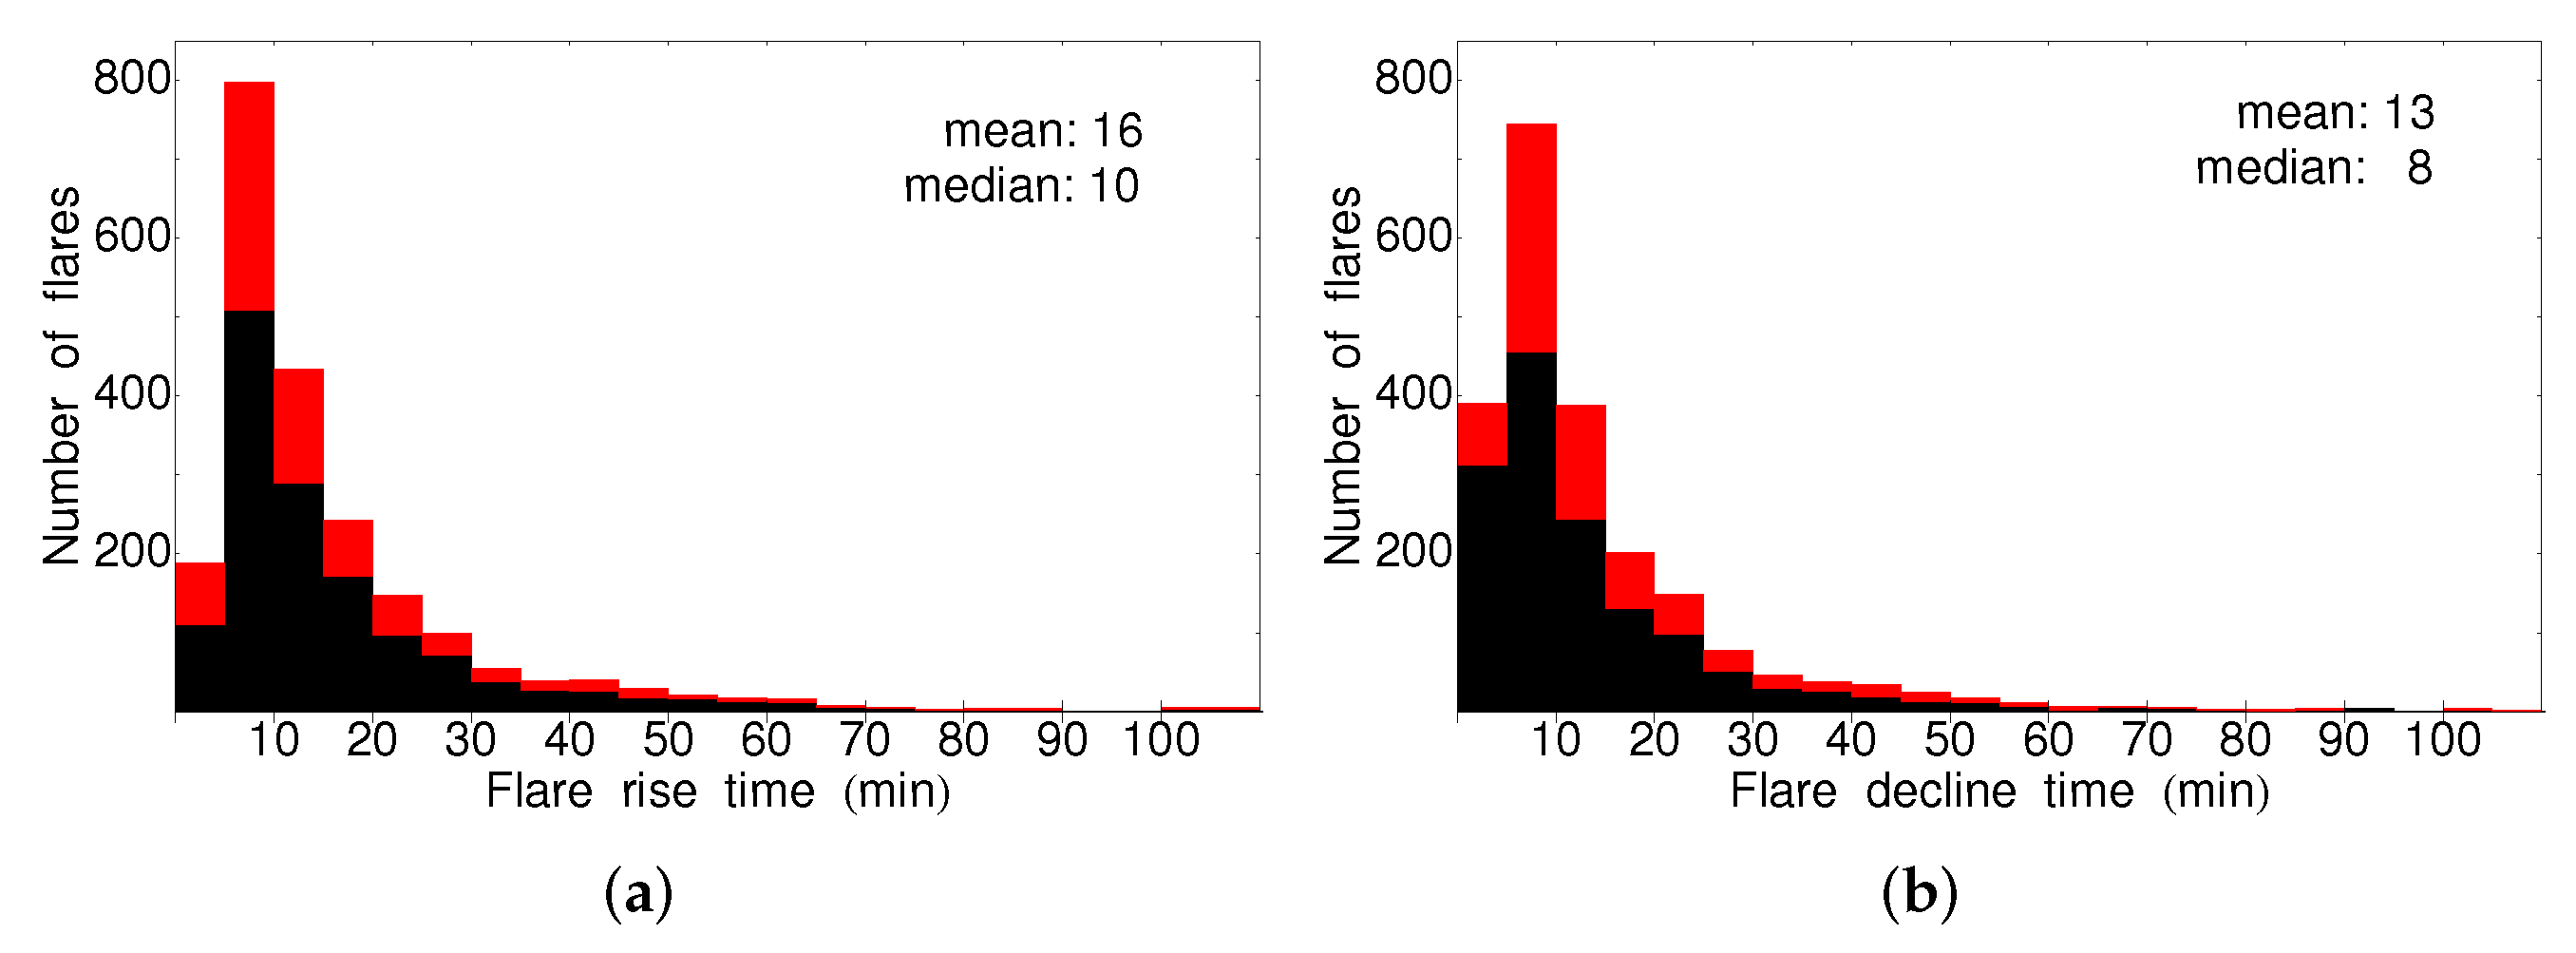
Figure 2 shows the distributions of the flare rise (onset-to-peak) and decline (peak-to-end) duration. The mean (median) value for the rise time, 16 (10) min, is larger compared to the decline time, which is 13 (8) min. The results are consistent in either SCs.
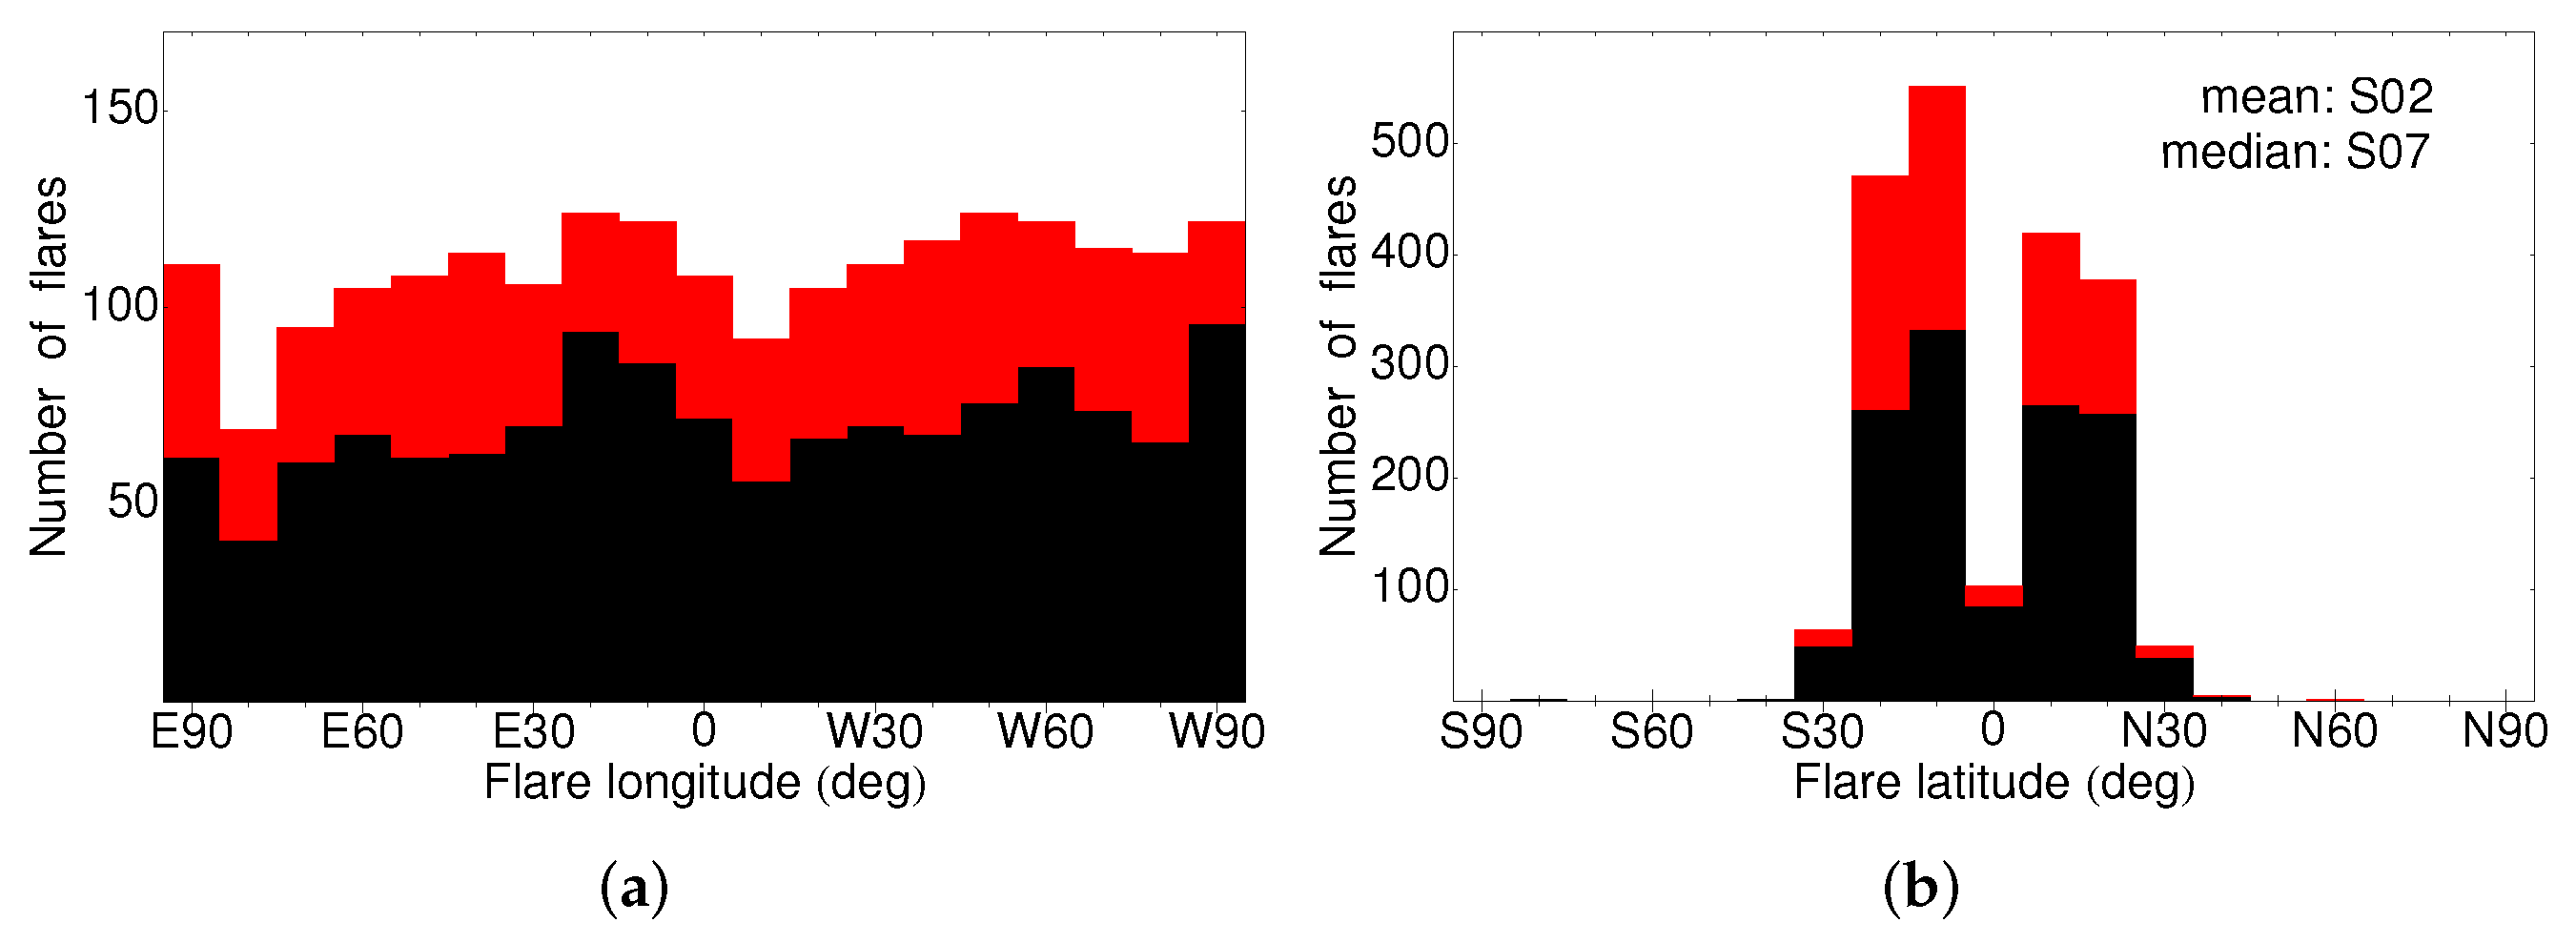
Figure 3 completes the overall description of the SFs. No definite trends are evident in the longitude histogram, where the distribution is rather flat. The latitudinal trends show a slight prevalence to Southern location, 2 degrees (S02) for the mean values and 7 degrees (S07) for the median. Again, no conspicuous SC differences can be noticed.
3.1.2. Properties of the M-Class Related CMEs
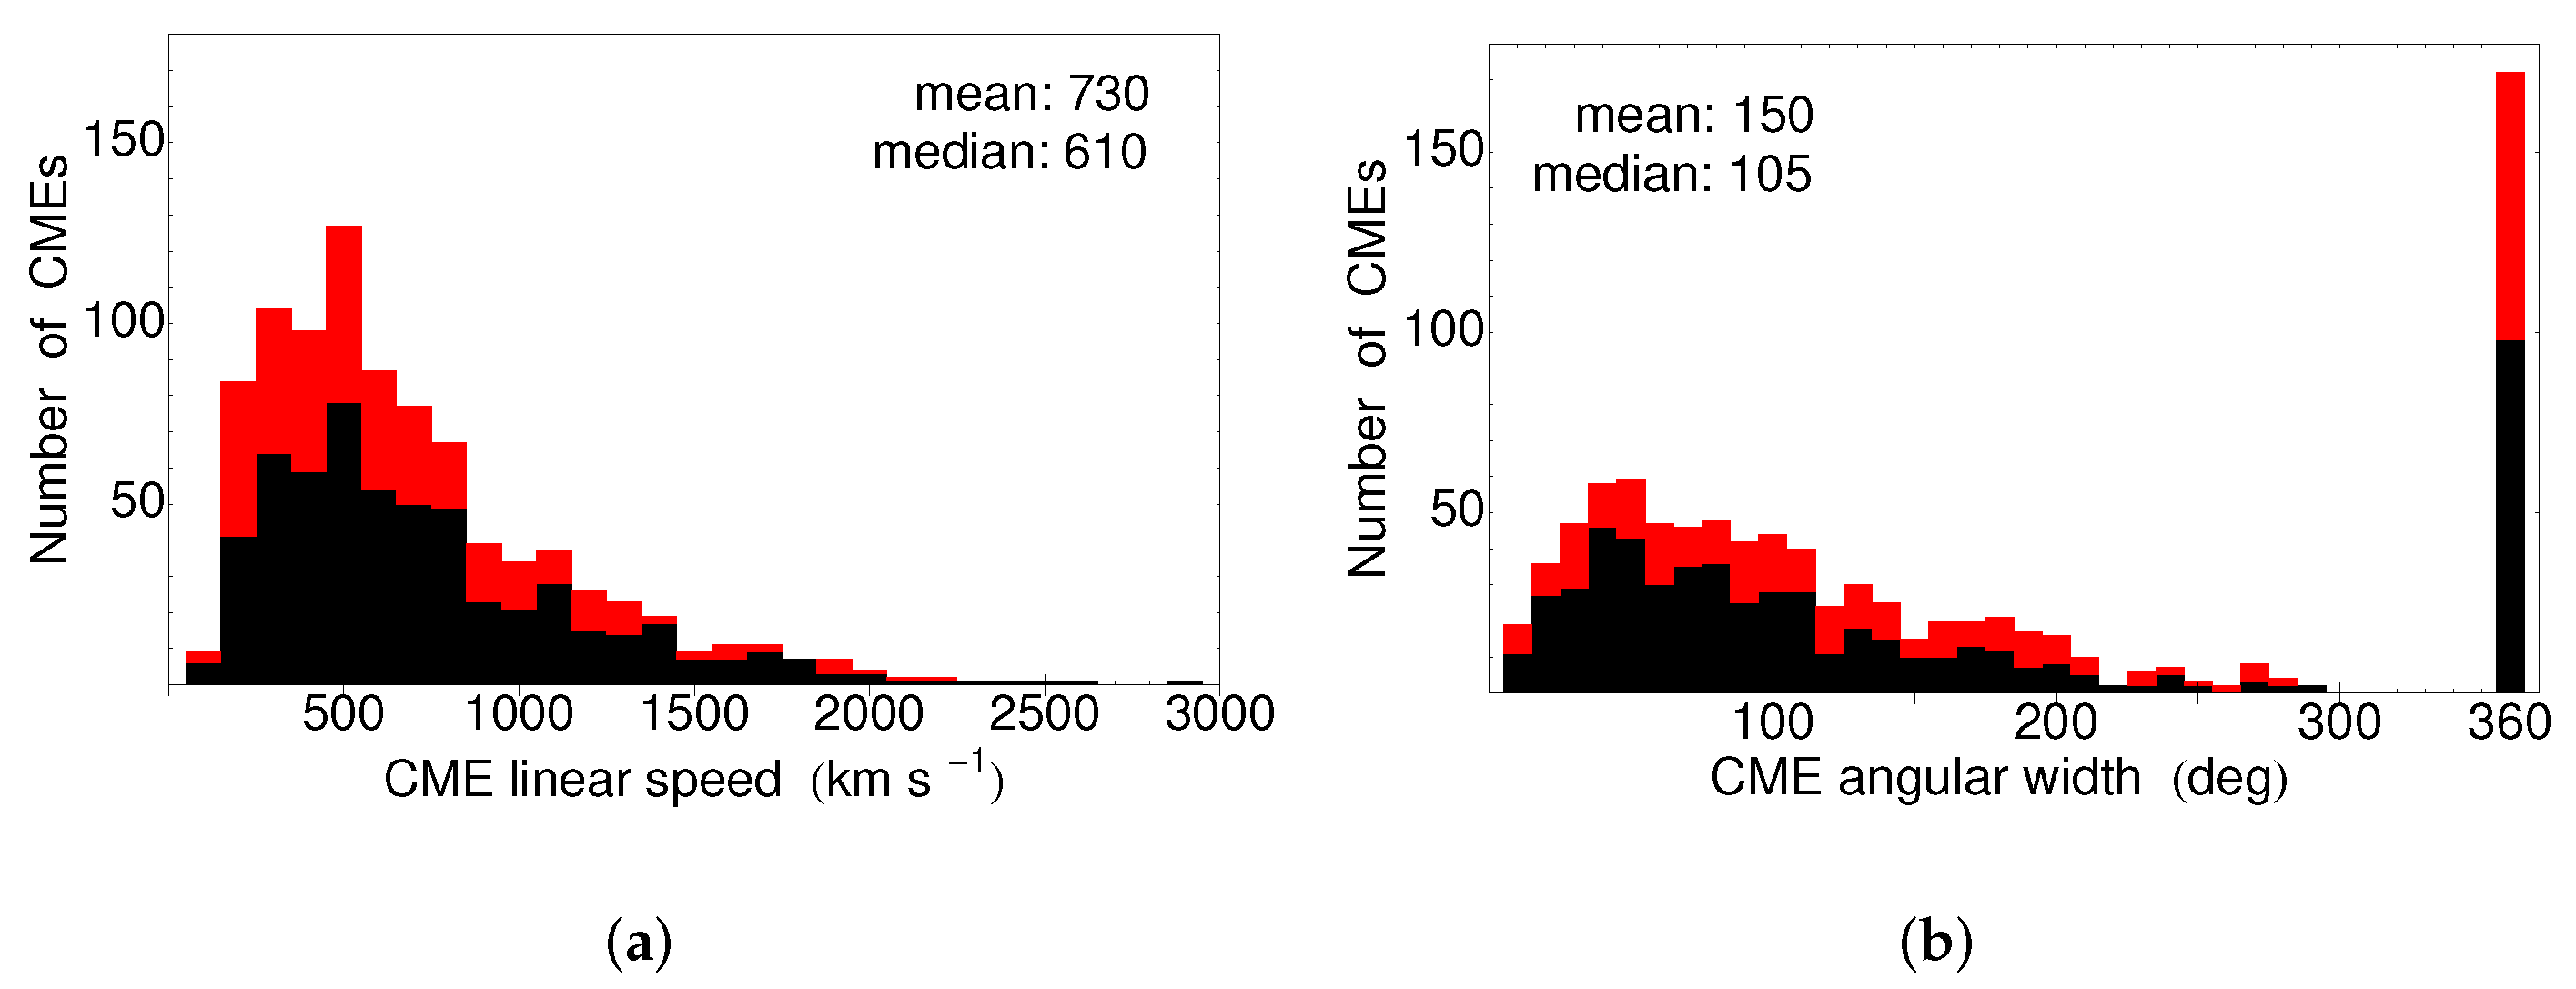
Only 889 M-class SFs (41% of the sample size) have been associated with CME counterparts. The distribution of these CMEs in the last two SCs is shown in Figure 4 in terms of linear speed on the left and AW on the right. The mean and median values are 730 and 610 km s and 150 and 105 degrees, respectively. The number of halo CMEs (360 degrees) is 172 (19%) compared to the remaining 718 cases with a much narrow CME cone opening. The SC-trends are synchronous; with 17% halo CMEs in SC23 and 23% in SC24. The overall number of CMEs in SC24 is decreased by .
In comparison with the entire M-class flare sample (2177 cases), the CME-associated M-class flare sample (889 cases) has a slightly larger mean (median) class M2.2 (M1.9), longer rise time, 20 (13) min and decline time, 17 (10) min, but similar value for the latitude, S01 (S04), respectively. For completeness, we explore the underlying sunspot configuration (as described in the next subsection) and found 309 of the CMEs to be related with , 187 with - and 224 with -- sunspot type.
3.1.3. Properties of the M-Class Related Sunspots
For the classification of the magnetic field configuration of the M-class related sunspots we adopted the Hale-type, described by https://www.spaceweather.com/glossary/magneticclasses.html (accessed on 15 November 2021) as:
- : A unipolar sunspot group.
- : A sunspot group having both positive and negative magnetic polarities (bipolar), with a simple and distinct division between the polarities.
- : A complex active region in which the positive and negative polarities are so irregularly distributed as to prevent classification as a bipolar group.
- -: A sunspot group that is bipolar but which is sufficiently complex that no single, continuous line can be drawn between spots of opposite polarities.
- : A qualifier to magnetic classes indicating that umbrae separated by less than 2 degrees within one penumbra have opposite polarity.
- -: A sunspot group of general magnetic classification but containing one (or more) spot(s).
- --: A sunspot group of - magnetic classification but containing one (or more) spot(s).
- -: A sunspot group of magnetic classification but containing one (or more) spot(s).
based on magnetic complexity of sunspots as deduced from solar magnetogram data [22].
The number of the identified sunspots in terms of their Hale-type magnetic field classification are summarized in Table 1 below (and in parentheses is given the percentage, calculated as the ratio to the entire event sample). The largest fraction among the sunspots are those with the most complex configuration -- (30%), followed by (25%) and - (21%). The uncertain/visual identifications are a small portion of the entire sample, contributing up to an additional 5% to the -sample and about 1% to the - group (see Table 1).
We obtained nearly identical characteristics of the M-class flares in the three most numerous sunspot configurations. Namely, the M-class flares related with -type have the following properties in mean (median) values: M1.9 (M1.6), rise 16 (11) min, and decline times, 14 (8) min, latitude, S02 (S07), respectively. Those that accompanied - have M1.9 (M1.6), rise 16 (10) mins and decline times, 12 (8) mins, latitude, S02 (S07), respectively. Finally, M-class flares associated with ---configurations are characterized as: M2.1 (M1.8), rise 15 (10) mins, and decline times, 12 (8) mins, latitude, S03 (S10), in terms of their mean (median) values, respectively.
For completeness, we calculated the CME speed and AW in the above sub-samples. Namely, -type group has mean (median) values of its CME distribution of 683 (596) km s and 149 (112) degrees; -: 646 (527) km s and 155 (109) degrees; whereas -- group: 678 (549) km s and 144 (93) degrees, respectively.
3.1.4. Properties of the M-Class Related Energetic Particles
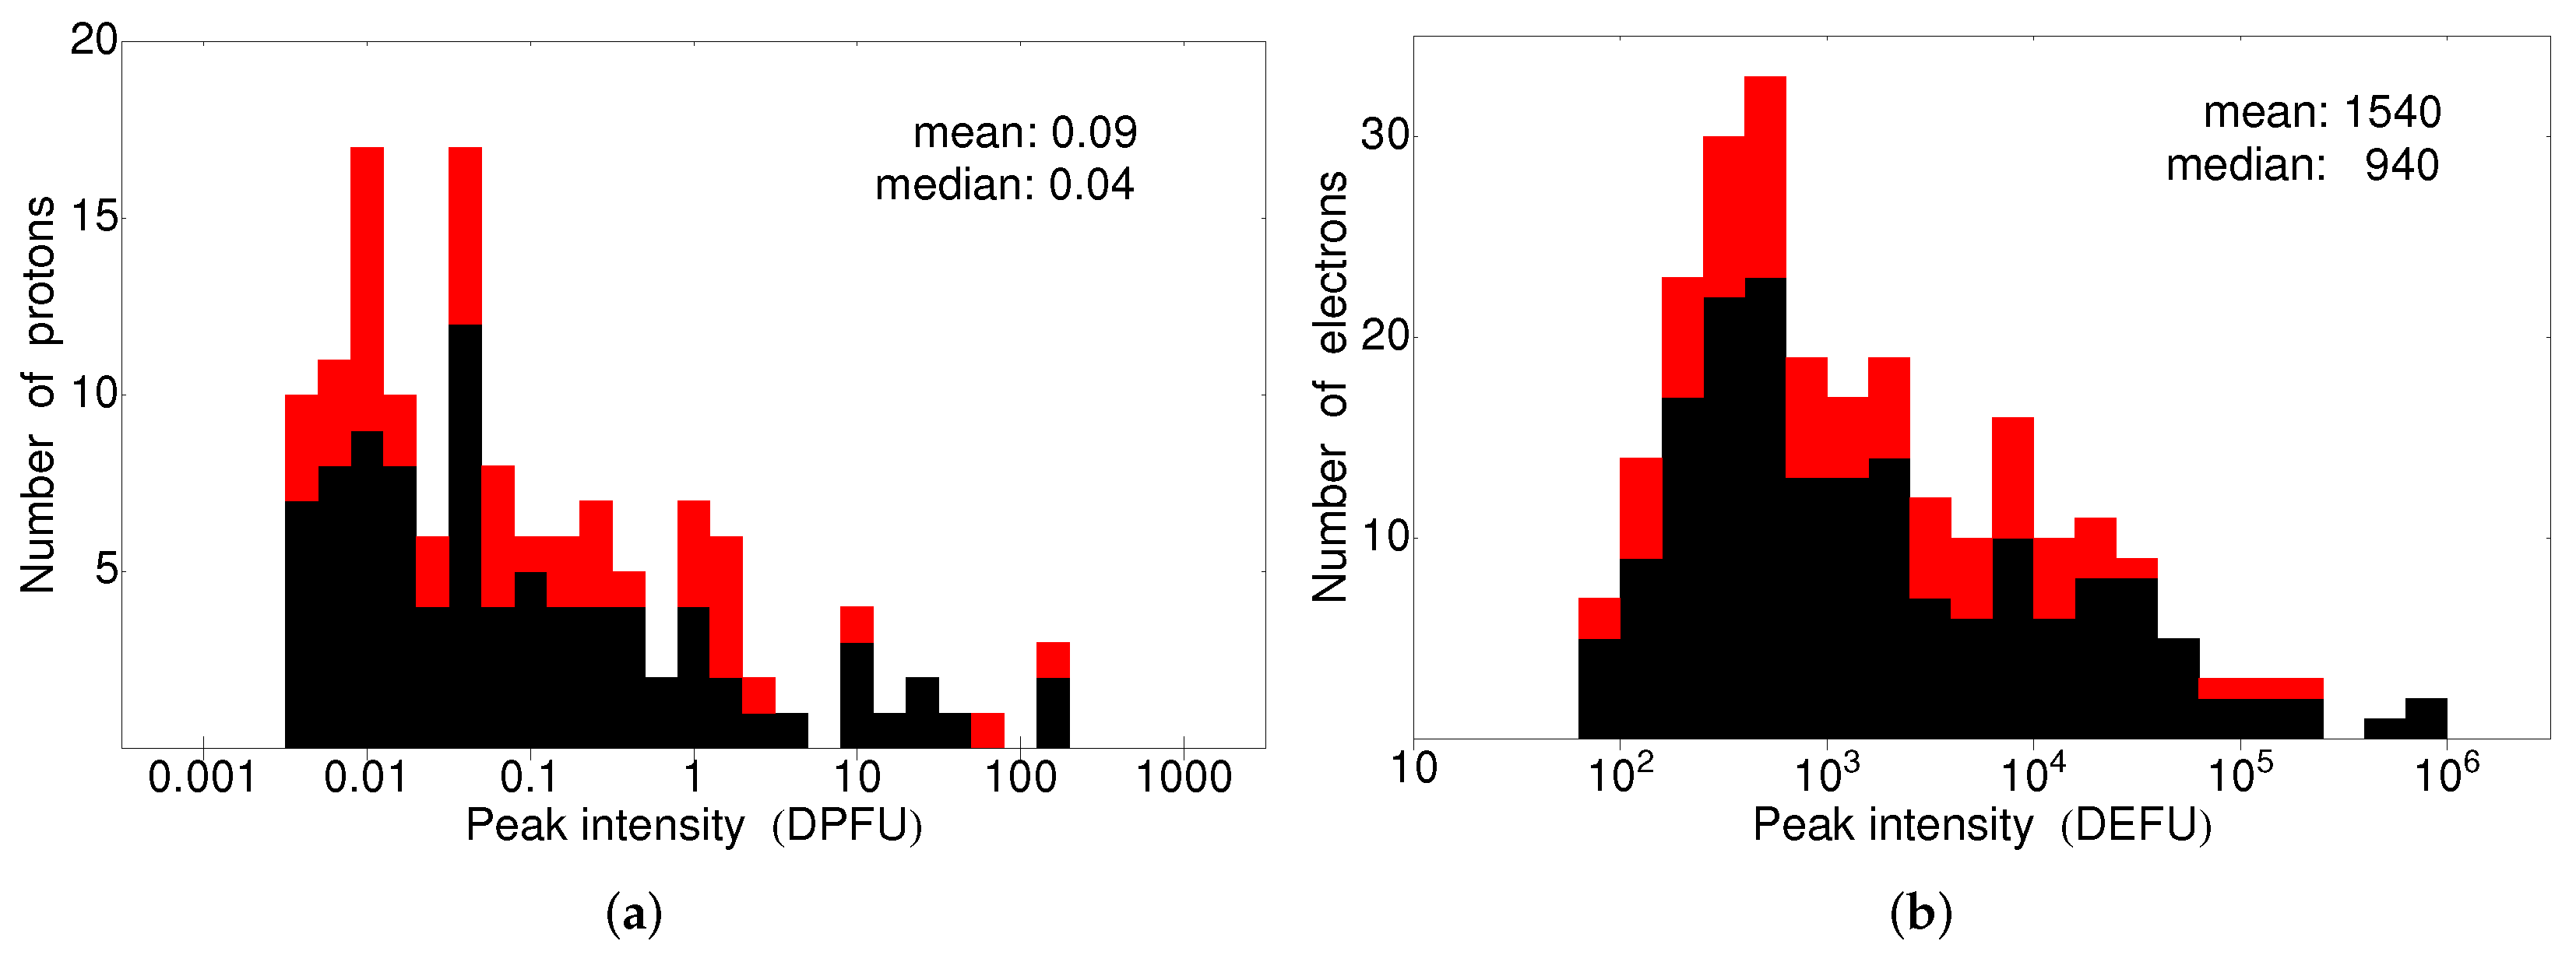
The distributions of 133 protons and 247 electrons related to the M-class flares in the last two SCs are shown in Figure 5 with mean and median values given in each plot. SEPs are measured in differential proton flux units (DPFU, protons/(cm s sr MeV)) and SEEs in differential electron flux units (DEFU, electrons/(cm s sr keV)). The number of SEPs in SC24 is decreased by , whereas the number of SEEs has dropped by compared to SC23.
The sub-sample of M-class flares that is related to SEPs has mean (median) values of M3.1 (M3.2) with a rise time of 31 (23) min and decline time of 29 (20) min, respectively. The CMEs, related to these SEPs have mean (median) values of 1153 (1107) km s and AW of 278 (360) degrees, respectively. Similarly to protons, for the association with SEEs, we obtained in mean (median) values: M2.8 (M2.8); rise time of 25 (18) min; decline time of 22 (14) min, 1017 (980) km s for the CME speed and 233 (234) degrees for the AW, respectively. For either particle species, the properties of the accompanied solar phenomena are larger compared to those related to the entire M-class sample.
3.1.5. Properties of the M-Class Related IP Radio Emissions
IP signatures of type III radio bursts are identified in 1078 cases (50% of the total SF sample), where 859 (40%) are during the rise time of the flare, and 219 (10%) are identified during the declining phase of the flare. The percentage change in SC24 is . The IP III-related sample can be characterized with the following mean (median) values: M2.1 (M1.8) flare class; 19 (13) mins rise and 16 (10) mins decline times; 758 (656) km s CME speed; 164 (119) degrees CME AW; 373 cases with (or 34% of all 1078 IP IIIs); 240 with - (or 22%); and 280 with -- configuration (or 26%).
In contrast to the type IIIs, only 148 signatures (less than 7% of the entire SF list) of IP type II bursts have been identified. The percentage change in SC24 is . The respective mean (median) values of the IP II-related sample are larger than those for the IP IIIs, namely: M2.9 (M2.7) flare class; 33 (26) min rise and 31 (23) min decline times; 1236 (1213) km s CME speed; 299 (360) degrees CME AW; however, there are similar percentages for the sunspot configurations, namely 44 cases with (or 30% of all 148 IP IIs); 33 with - (or 22%); and 42 with -- configuration (or 28%).
3.1.6. Summary on the SC Trends
Table 2 presents the summary of the total number of each type of solar event, their fraction in either of the SCs, and the percentage change. The uncertainty is calculated as the propagation of error on the ratio. The sunspot types include also uncertain or visual identification.
3.2. Occurrence of SF-Associated Phenomena as Function of M-Class and Sunspot Type
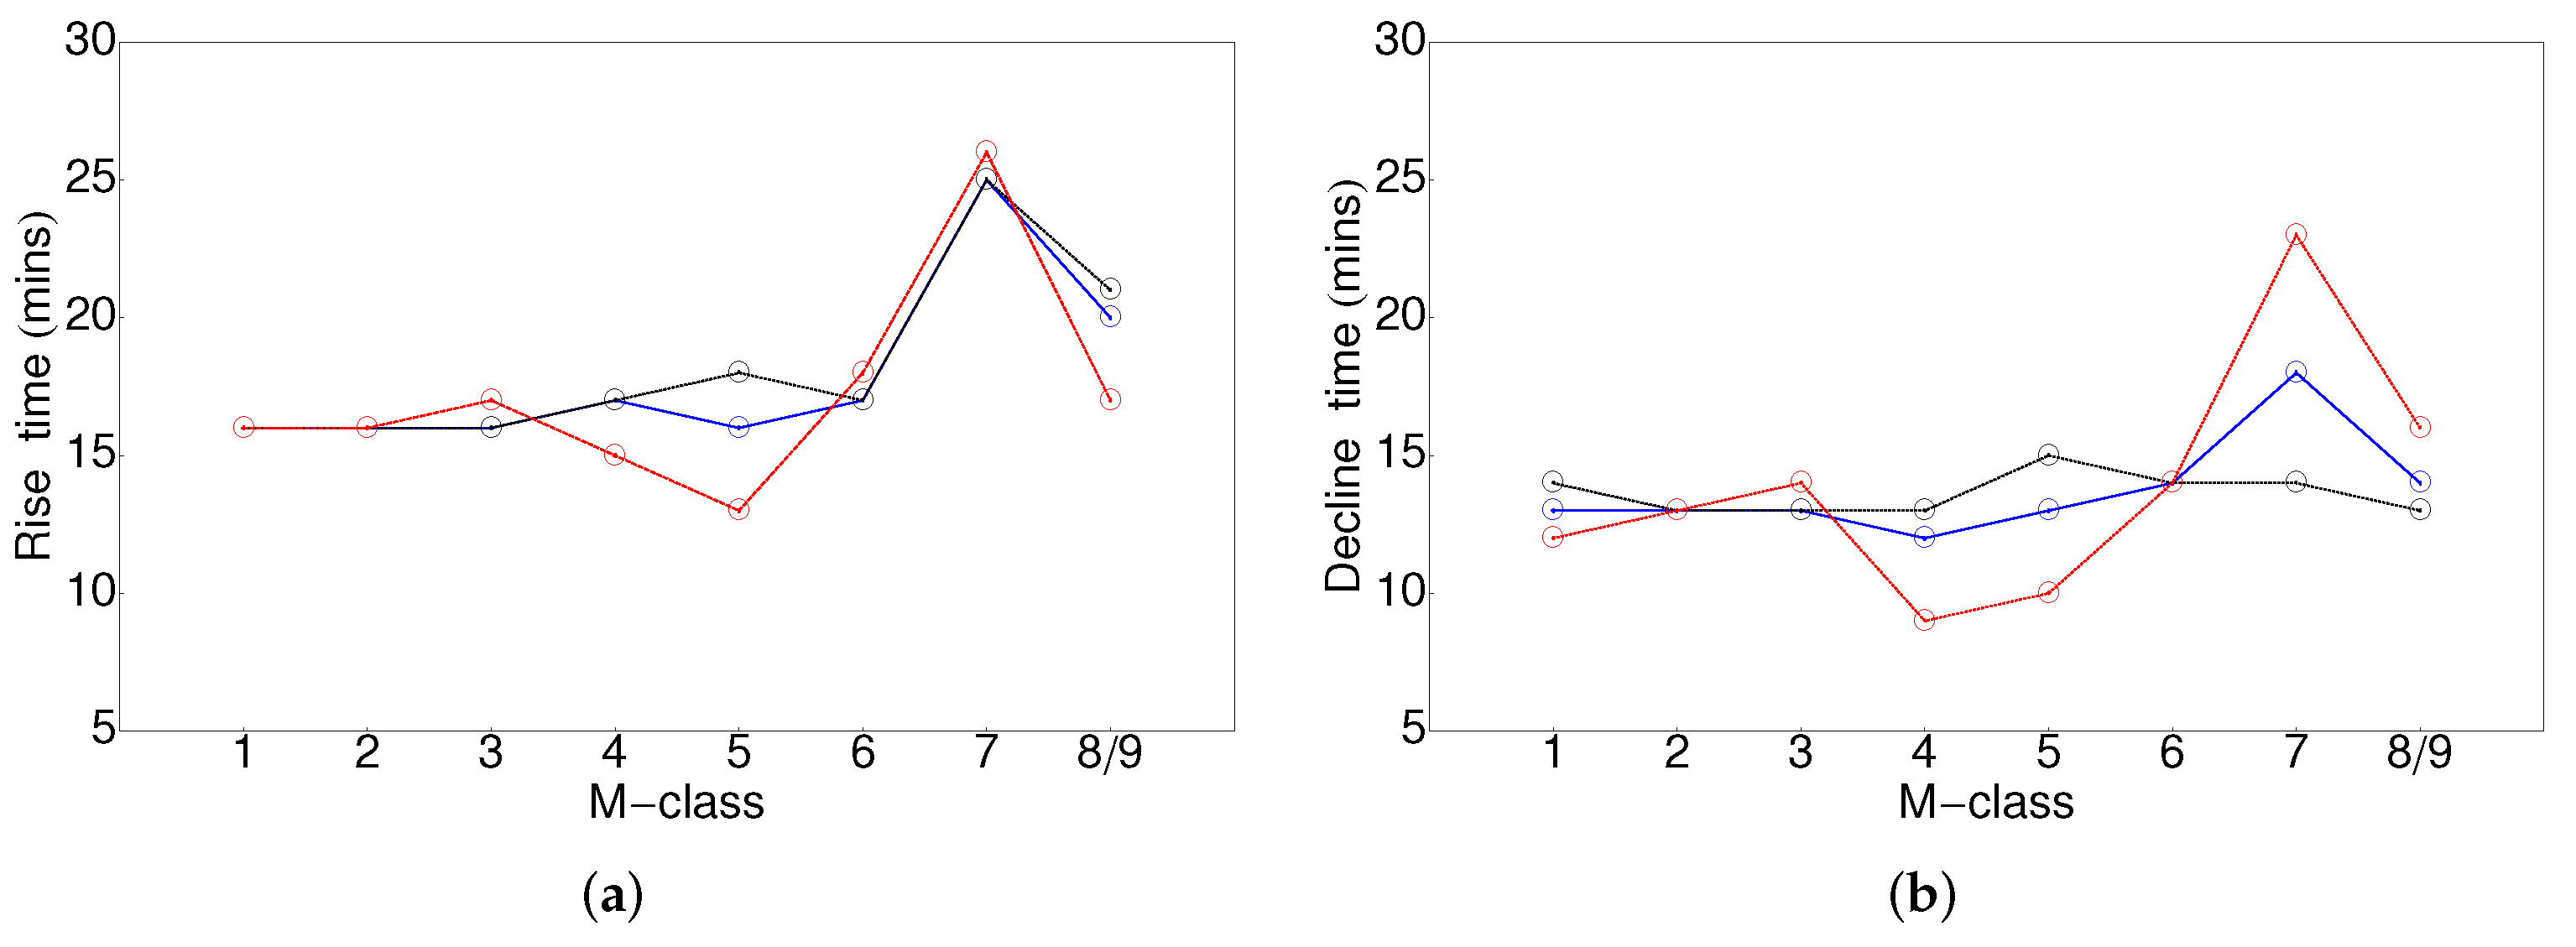
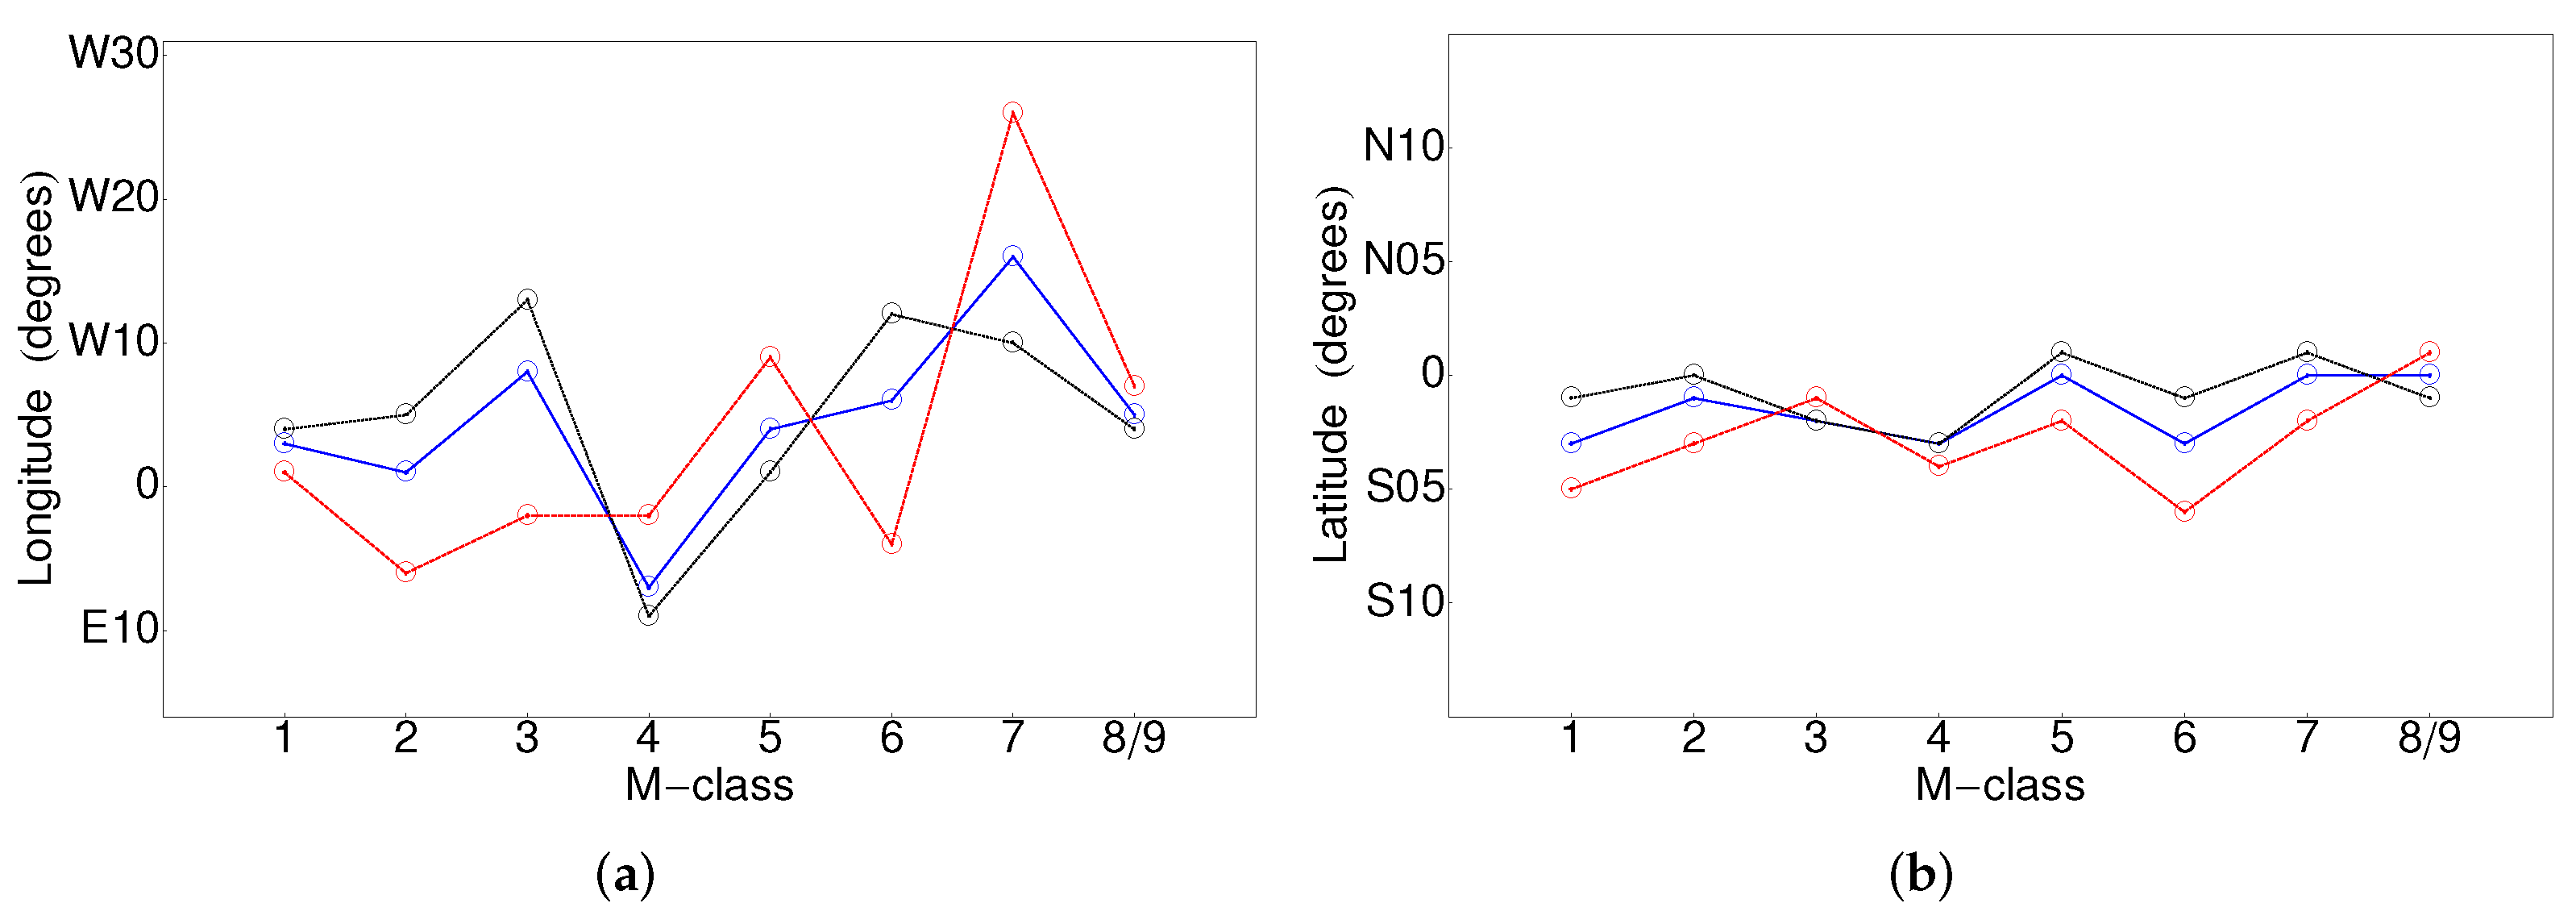
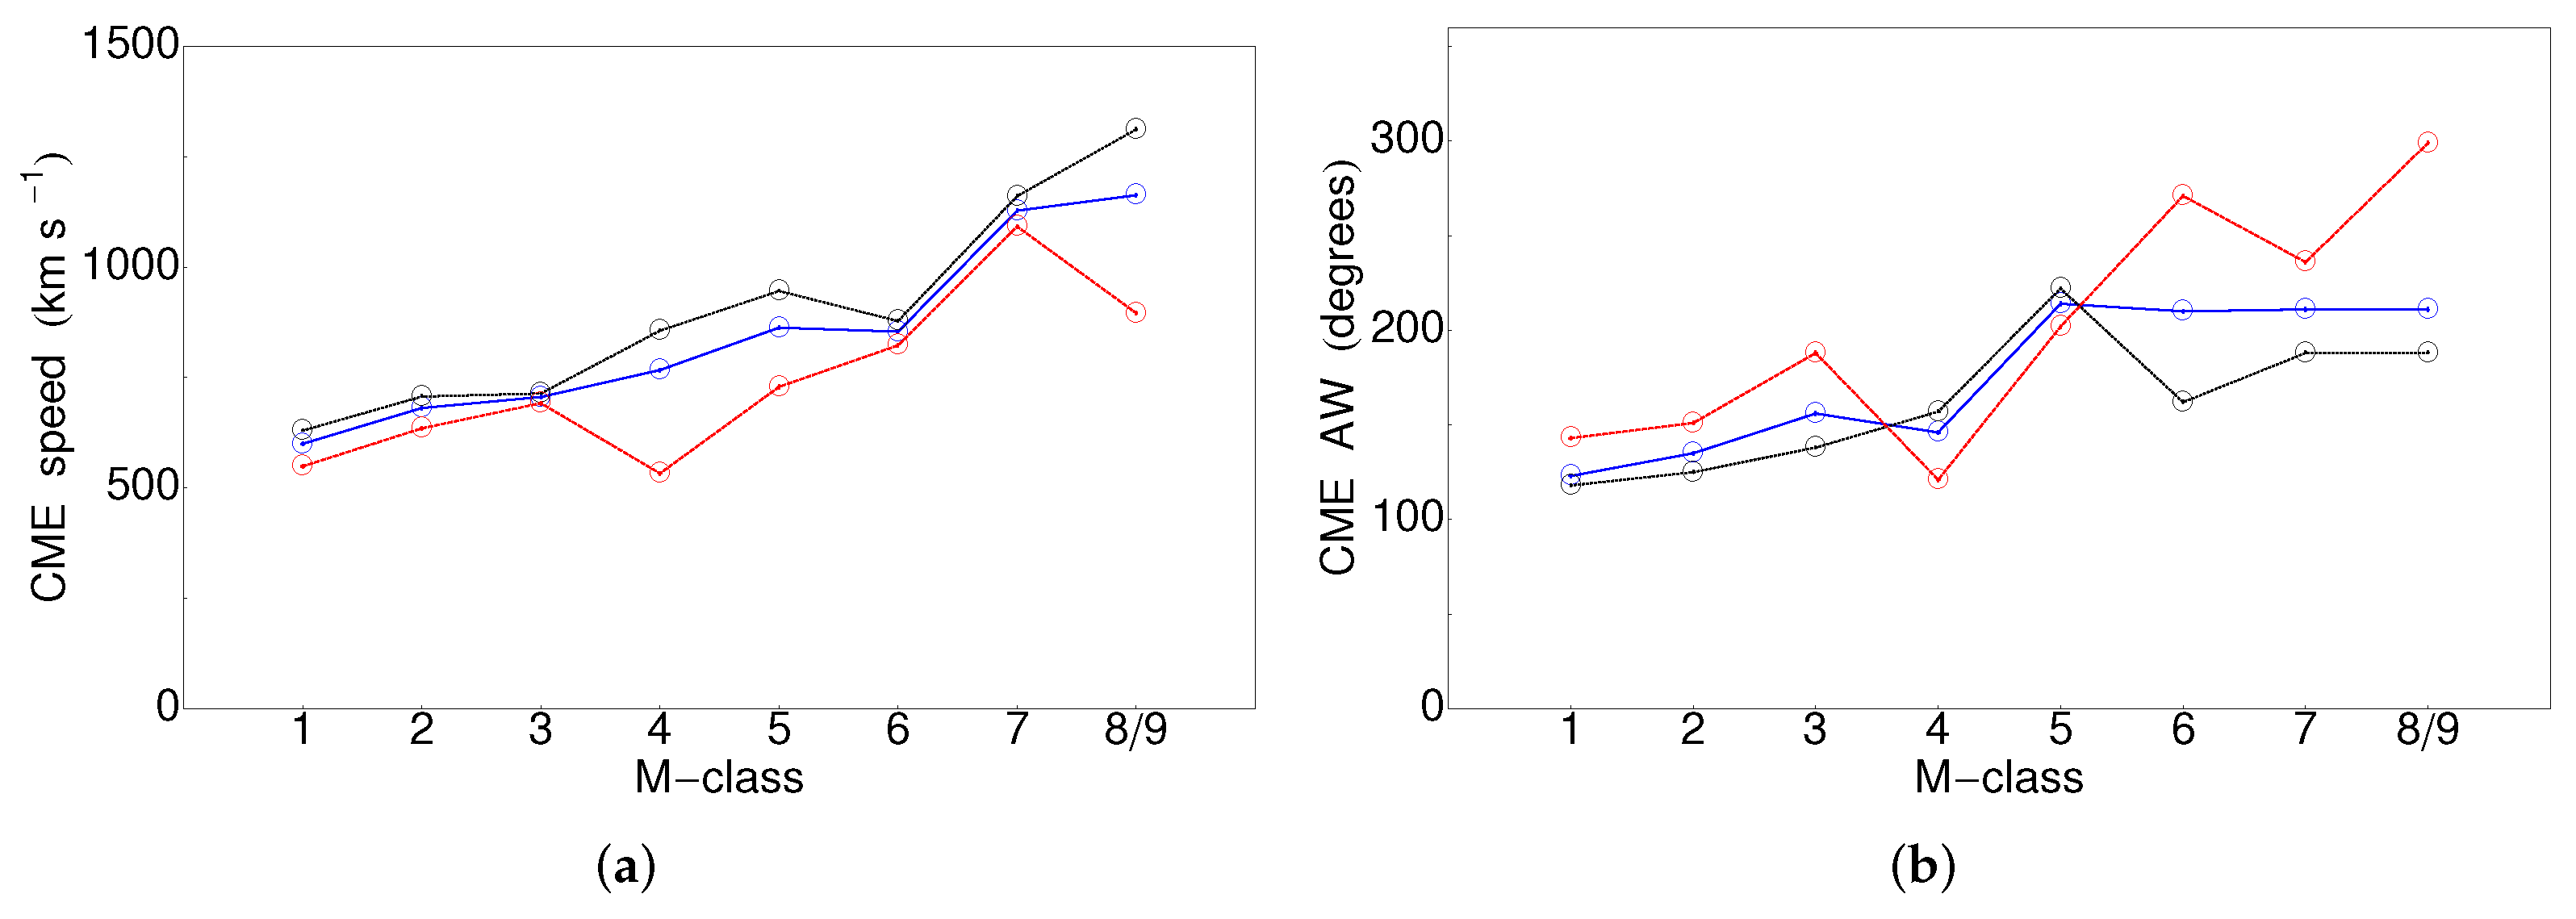
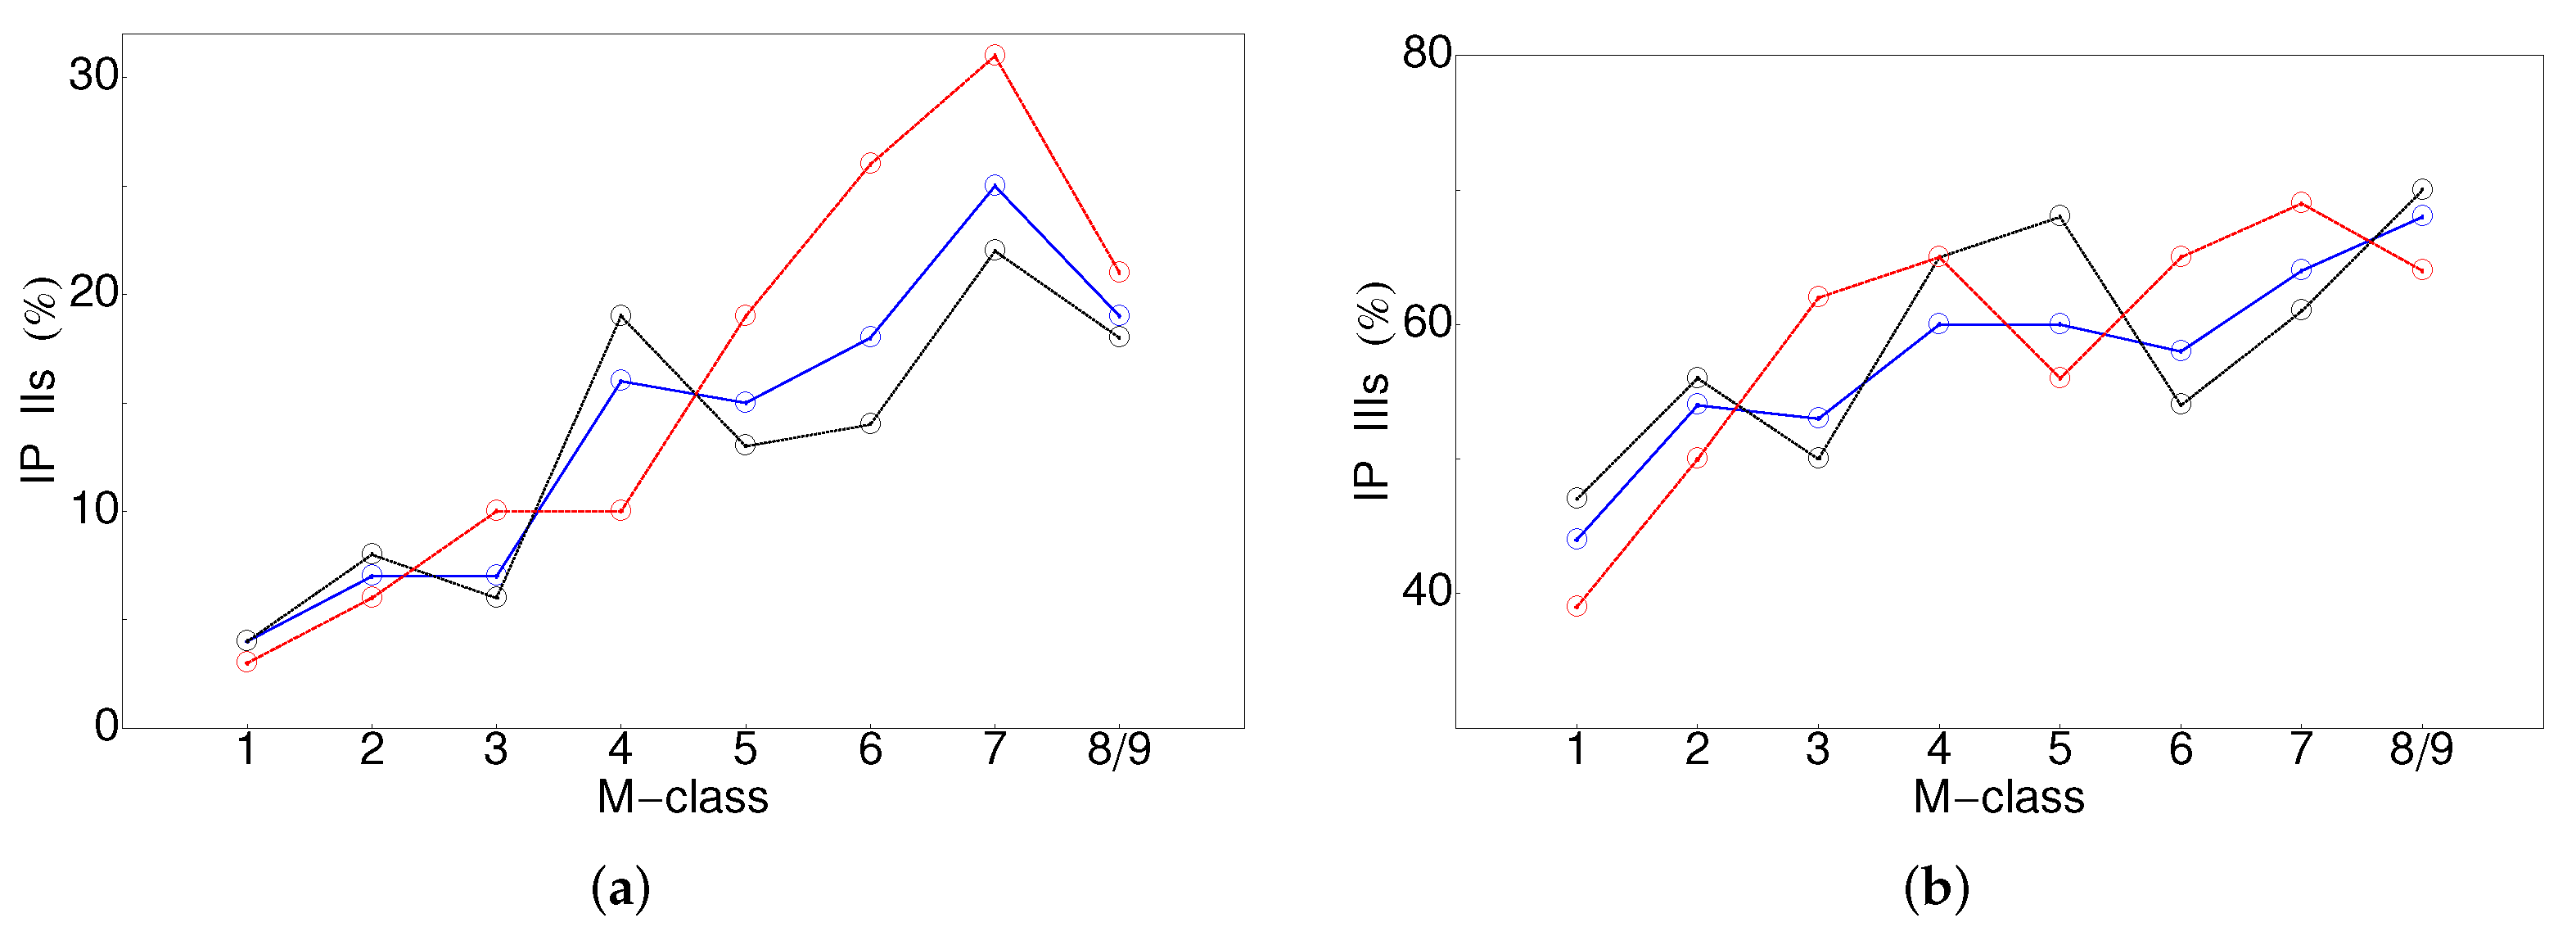
The SF-associated phenomena over the three periods of interest and as a function of the flare class are given in Figure 6 for the rise and decline times; in Figure 7 for the flare location; in Figure 8 for the CME properties and in Figure 9 for the occurrence of radio bursts. The median values give, in general, lower numbers, but follow the tendency depicted by the mean values, thus only mean values will be shown in the plots below.
M1 denotes SFs binned from M1.0 to M1.9 and similar bin width is used for the rest. Due to the low number of events with M8 and M9 classes they are binned together. The numerical values from the above plots are listed in Table 3 for the three periods of interest, SCs23 + 24, SC23, and SC24. The overall trends, as a function of the SF class and for all three considered time periods, can be summarized as:
- The SF rise and decline times start with flat trends and show short-lived increases at the M7 class (with clear drops at M4–5 bins only in SC24).
- No clear trends of the parent AR location can be stated as they tend to vary around the solar disk center.
- Faster and wider CMEs, in terms of linear speed and AW, are obtained (even though AW growth in SC23 is less pronounced).
- A clear increasing trend of the occurrence of radio bursts is noticed: Over the three time periods, IP IIs range from 3% to 31%, whereas IP IIIs range from 39% to 70%.
The properties of SFs and their associated phenomena as a function of sunspot type are shown in Table 4 for the three most abundant magnetic field configurations. Their trends can be summarized as follows:
- In either sunspot type under consideration, the mean and median values of the SF class are close to the M2 class.
- The mean (median) SF rise 15–17 (9–11) and decline times 12–13 (7–8) mins are closer to the values obtained for the weak SFs (M1–M5) in the M-class population.
- The considered sunspot configurations tend to occur at Western longitudes.
- From to -- sample, the values for the CME AW are decreasing in all three considered periods, however, no clear trend could be noticed for the CME speed.
- The occurrence of IP type II bursts has no preference to the underlying sunspots type and the association rate is very low.
- IP type III bursts show a decreasing trend of occurrence from (usually ∼50–60%) to -- type (down to ∼40%).
Due to the low number and limited (e.g., location-specific) space weather relevance, the distributions of energetic particles in the SF or all sunspots sub-groups are not explicitly shown in the above two tables. We present their occurrence rates only at the two extremes here: M1-class is accompanied by 38 SEPs (or 3% of the respective sample as in Table 3) and 89 (7%) SEEs, whereas the M8/9-class SFs are related to nine (19%) SEPs and 14 (30%) SEEs, respectively. For the -type we obtained 43 (7%) SEPs and 73 (11%) SEEs, whereas 26 (4%) SEPs and 68 (10%) SEEs for -- (see Table 2 for the normalization).
4. Discussion
We presented a comprehensive analysis of 2177 M-class flares over SCs 23 and 24. The overall properties of the M-class SFs–increasing association with CMEs and IP radio bursts and relationship to faster and wider CMEs with an increase of their SXR class–are consistent with the Big Flare Syndrome (BFS) proposed by [47]. Namely, a larger energy output during the eruption is accompanied by stronger in intensity and a wide variety of solar phenomena. This was known notably for X-class flares, e.g., by [37] on the high association with CMEs (76%, 133/175), type III radio bursts (75%, 131/175), and in situ protons (38%, 66/175). [24] also confirmed the improved correlation between strong M-class flares and CMEs. Furthermore, the M-class sample, which is more than an order of magnitude (12.44) more abundant compared to the 175 X-class flares in the same time period, could provide statistically significant tendencies. We confirm that the association rates for the entire M-class sample with CMEs (41%) is less than for the X-class flares but the sub-sample of M5–9 class are related to faster CMEs compared to the mean/median value for the M-class sample. Similar trends were found for the radio bursts and in situ particles which is consistent with the BFS.
As stated in the beginning, the other objective of this work is to investigate the space weather relevance of M-class flares in terms of co-occurrence with CMEs, radio emission and to a lesser extend also to energetic particles. For comparative purposes, we use the results on X-class SFs as recently reported by [37].
The current study reports on the association between M-class SFs and eruptive phenomena. Namely, we start with a list of M-class flares that is compared with CMEs, IP radio bursts, in situ observed energetic particles, and magnetic complexity of the related sunspots. For the reverse association we could find only partial reports, as outlined below.
In only 41% of all M-class SFs, a clear CME candidate could be identified, compared to the 76% association rate with X-class flares [37]. The M-class accompanied CMEs are also slower (with median values of 610 compared to >1100 km s) and narrower (∼100 degrees which are well below the halo case), at least in a statistical sense. Studies on the reverse association, e.g., between over 30,000 CMEs (e.g., in the last two SCs with routine observations) and SFs are not known to us and the large event number implies using some automatic procedures.
In contrast to X-class SFs [37], where 78% are related to IP type III bursts, for the case of M-class SFs the occurrence is 50% for the entire sample, ranging from below 40% for M1 to 70% for M9-class. The new result here is the calculated association rate to IP type IIs, which is unexpectedly low, 10% for the entire M-class population (which improves to about double this value for M7−9 SFs). The latter percentages could increase with a maximum of 9% if all cases with data gaps turned out to have radio bursts. The reverse association from IP IIs to SFs is investigated in [48] and it was shown that 82% of IP type IIs are associated with SFs in SC23, whereas the association is only slightly reduced to 71% for SC24. As type III bursts are much more frequent compared to type IIs, any investigation over the last two SCs on the link between IP IIIs and solar activity phenomena would require substantial efforts. This could be a suitable task for applying machine learning and automatic recognition techniques.
It was found in this study (Table 4) that ≳M2, impulsive flares (with short rise and decline times), in terms of mean values, are linked to the most complex sunspot groups, , -, and --. The magnetic complexity, however, seems to preclude the particle escape in general, as the radio emission signatures in the IP space tend to become infrequent (a drop of ∼20% in IP IIIs is obtained from to -- configuration). The reverse association, between sunspot classes and SFs is recently been used in the development of forecasting models [49,50].
The sunspot configuration and complexity, as given by the Hale classification, proved to have a limited potential for space weather forecasting, as different magnetic field configurations have similar mean/median values and occurrence rates for CMEs and radio bursts. We point out that the present finding does not contradict the well known previous results for example [51,52,53,54], but merely suggests that novel proxies for sunspot classifications are to be sought, in order to be more relevant to space weather.
From earlier statistical studies, e.g., [55] covering the period 1975–2003, it has been known that >M5 flares are highly correlated with SEPs. With respect to protons, the distribution and mean/median values of the proton fluxes associated with M-class (Figure 5) are completely different from those of the X-class flares. Although the proton data comes from different instruments, it is evident that the histogram of X-class related SEPs (17–22 MeV energy protons from the SOHO/ERNE instrument) have an increasing trend (see Figure 5 in [37]) with the increase of the proton flux. In contrast, the SEPs (25 MeV energy protons from the Wind/EPACT) related to M-class flares show a decreasing trend in total number at larger SEP intensity. A similar decreasing trend is observed for the distribution of the energetic electrons. In terms of association rate, about 6% of all M-class flares are related to protons and 11% to electrons. Both values have limited forecasting capacity, as they reflect a minority within the M-class population and cannot represent any general trends. Nevertheless, M-class flares have been shown to affect the ionosphere during solar storms [56,57], thus supporting their space weather relevance. The reverse association–from SEPs to M-class SFs–is reported to be 51%, e.g., in the comparative analysis of 292 SFs by [43] (1996–2016), whereas to X and C-class flares the values drop in half, to 23% and 26%, respectively. The same conclusion, 49%, was reported by [58] on the association between SEP events and M-class flares, whereas a larger percentage, 43%, was given with X-class and much lower, 8%, with C-class SFs, based on a study covering the much longer time period, SCs 21–24. Although the former two studies use different SEP instruments and time coverage, it is unclear why the association rates with X-class and C-class flares differ compared to those with the M-class flares.
The newly proposed definition for flare eruptive properties confirms the space weather relevance of M-class flares, ranging from a maximum of 50% of the flare sample (if association with IP IIIs is considered) to 41% (association with CMEs alone). There are numerous efforts to develop forecasting models of SFs (see also results from http://flarecast.eu/ (accessed on 15 November 2021)), e.g., a review by [35] and the references therein. The importance of SF eruptions is also demonstrated by the fact that the majority of the SEP forecasting models rely on the properties of SFs, mostly in SXRs [29] but also in other EM ranges [30,33,59], with the inclusion of radio burst emission as an additional parameter, e.g., [60,61,62,63]. Others, [64,65], add or rely entirely on the in situ particle flux for their proton forecasts [66]. Interestingly, the inclusion of smaller than M-class flares were shown to worsen the performance of the issued forecasts [60]. Note that providing a representative list of space weather forecasting models goes beyond the scope of this work, since the number of new or recycled tools and models continues to increase, both in a conceptual or operational stage.
With respect to SF eruption, it has been shown in this study that in situ particles (both protons and electrons), IP IIs and the underlying sunspot configuration have limited potential as proxies for eruptive M-class SFs at least from a statistical point of view. The results in the present study provide the updated (for SC23 and 24) relationships between SFs and space weather-relevant phenomena (CMEs, SEPs, SEEs, type II and III radio bursts, sunspot magnetic configurations) which could be implemented in empirical forecasting tools.
In summary, these results confirm that the space weather potential of M-class is reduced compared to X-class ones, however, weaker flares cannot be easily discarded from the forecasting efforts of other space weather phenomena, e.g., energetic particles and ionospheric disturbances, but also indirectly of CMEs and geomagnetic storms.
Supplementary Materials
The M-class flares and their associated phenomena are available at https://0-www-mdpi-com.brum.beds.ac.uk/article/10.3390/universe1010000/s1, Table S1: M-class flares in SCs 23 and 24. The extended version of the table will be released at: https://catalogs.astro.bas.bg/ (accessed on 15 November 2021).
Author Contributions
R.M. and S.W.S. contributed equally to this work. All authors have read and agreed to the published version of the manuscript.
Funding
This research was funded by SCOSTEP/PRESTO 2020 grant ‘On the relationship between major space weather phenomena in solar cycles 23 and 24’.
Data Availability Statement
We acknowledge the use of numerous freely available catalogs, as provided below: solar flare catalogs and information: ftp://ftp.ngdc.noaa.gov/STP/space-weather/solar-data/solar-features/solar-flares/x-rays/goes/ (accessed on 15 November 2021), https://ftp.swpc.noaa.gov/pub/warehouse/ (accessed on 15 November 2021), https://solarmonitor.org/ (accessed on 15 November 2021); SOHO/LASCO CME catalog: https://cdaw.gsfc.nasa.gov/CME_list/ (accessed on 15 November 2021); Wind/EPACT proton catalog: http://newserver.stil.bas.bg/SEPcatalog/ (accessed on 15 November 2021); ACE/ EPAM electron catalog: https://www.nriag.sci.eg/ace_electron_catalog/ (accessed on 15 November 2021); Wind/WAVES radio emission from prepared videos: https://cdaw.gsfc.nasa.gov/CME_list/ (accessed on 15 November 2021).
Conflicts of Interest
The authors declare no conflict of interest.
Abbreviations
The following abbreviations are used in this manuscript:
| AR | Active Region |
| AW | Angular Width |
| BFS | Big Flare Syndrome |
| CME | Coronal Mass Ejection |
| EM | Electromagnetic |
| EUV | Extreme Ultraviolet |
| IP | Interplanetary |
| SC | Solar Cycle |
| SEE | Solar Energetic Electron |
| SEP | Solar Energetic Proton/Particle |
| SF | Solar Flare |
| SXR | Soft X-ray |
References
- Fletcher, L.; Dennis, B.R.; Hudson, H.S.; Krucker, S.; Phillips, K.; Veronig, A.; Battaglia, M.; Bone, L.; Caspi, A.; Chen, Q.; et al. An Observational Overview of Solar Flares. Space Sci. Rev. 2011, 159, 19–106. [Google Scholar] [CrossRef]
- Benz, A.O. Flare Observations. Living Rev. Sol. Phys. 2017, 14, 2. [Google Scholar] [CrossRef] [Green Version]
- Cliver, E.W.; Dietrich, W.F. The 1859 space weather event revisited: Limits of extreme activity. J. Space Weather Space Clim. 2013, 3, A31. [Google Scholar] [CrossRef] [Green Version]
- Riley, P.; Baker, D.; Liu, Y.D.; Verronen, P.; Singer, H.; Güdel, M. Extreme Space Weather Events: From Cradle to Grave. Space Sci. Rev. 2018, 214, 21. [Google Scholar] [CrossRef]
- Nitta, N.V.; Aschwanden, M.J.; Boerner, P.F.; Freeland, S.L.; Lemen, J.R.; Wuelser, J.P. Soft X-ray Fluxes of Major Flares Far Behind the Limb as Estimated Using STEREO EUV Images. Sol. Phys. 2013, 288, 241–254. [Google Scholar] [CrossRef] [Green Version]
- Lin, R.P.; Krucker, S.; Hurford, G.J.; Smith, D.M.; Hudson, H.S.; Holman, G.D.; Schwartz, R.A.; Dennis, B.R.; Share, G.H.; Murphy, R.J.; et al. RHESSI Observations of Particle Acceleration and Energy Release in an Intense Solar Gamma-Ray Line Flare. ApJ 2003, 595, L69–L76. [Google Scholar] [CrossRef] [Green Version]
- Kuznetsov, S.N.; Kudela, K.; Ryumin, S.P.; Gotselyuk, Y.V. CORONAS-F satellite: Tasks for study of particle acceleration. Adv. Space Res. 2002, 30, 1857–1863. [Google Scholar] [CrossRef]
- Kurt, V.G.; Yushkov, B.Y.; Kudela, K.; Galkin, V.I.; Kashapova, L.K. CORONAS-F observation of HXR and gamma-ray emissions from the solar flare X10 on 29 October 2003 as a probe of accelerated proton spectrum. Contrib. Astron. Obs. Skaln. Pleso 2015, 45, 42–59. [Google Scholar]
- Ackermann, M.; Ajello, M.; Albert, A.; Allafort, A.; Baldini, L.; Barbiellini, G.; Bastieri, D.; Bechtol, K.; Bellazzini, R.; Bissaldi, E.; et al. High-energy Gamma-Ray Emission from Solar Flares: Summary of Fermi Large Area Telescope Detections and Analysis of Two M-class Flares. Astrophys. J. Lett. 2014, 787, 15. [Google Scholar] [CrossRef] [Green Version]
- Nindos, A.; Aurass, H.; Klein, K.L.; Trottet, G. Radio Emission of Flares and Coronal Mass Ejections. Invited Review. Sol. Phys. 2008, 253, 3–41. [Google Scholar] [CrossRef]
- Pick, M.; Vilmer, N. Sixty-five years of solar radioastronomy: Flares, coronal mass ejections and Sun Earth connection. Astron. Astrophys. Rev. 2008, 16, 1–153. [Google Scholar] [CrossRef]
- Wild, J.P.; Smerd, S.F.; Weiss, A.A. Solar Bursts. ARA&A 1963, 1, 291. [Google Scholar] [CrossRef]
- Miteva, R.; Samwel, S.W.; Krupar, V. Solar energetic particles and radio burst emission. J. Space Weather Space Clim. 2017, 7, A37. [Google Scholar] [CrossRef]
- Zhang, P.; Zucca, P.; Sridhar, S.S.; Wang, C.; Bisi, M.M.; Dabrowski, B.; Krankowski, A.; Mann, G.; Magdalenic, J.; Morosan, D.E.; et al. Interferometric imaging with LOFAR remote baselines of the fine structures of a solar type-IIIb radio burst. Astron. Astrophys. 2020, 639, A115. [Google Scholar] [CrossRef]
- Webb, D.F.; Howard, T.A. Coronal Mass Ejections: Observations. Living Rev. Sol. Phys. 2012, 9, 3. [Google Scholar] [CrossRef] [Green Version]
- Desai, M.; Giacalone, J. Large gradual solar energetic particle events. Living Rev. Sol. Phys. 2016, 13, 3. [Google Scholar] [CrossRef] [PubMed] [Green Version]
- Eren, S.; Kilcik, A.; Atay, T.; Miteva, R.; Yurchyshyn, V.; Rozelot, J.P.; Ozguc, A. Flare-production potential associated with different sunspot groups. Mon. Not. R. Astron. Soc. 2017, 465, 68–75. [Google Scholar] [CrossRef]
- Carrasco, V.M.S.; Lefèvre, L.; Vaquero, J.M.; Gallego, M.C. Equivalence Relations Between the Cortie and Zürich Sunspot Group Morphological Classifications. Sol. Phys. 2015, 290, 1445–1455. [Google Scholar] [CrossRef] [Green Version]
- Cortie, A.L. On the Types of Sun-Spot Disturbances. Astrophys. J. Lett. 1901, 13, 260. [Google Scholar] [CrossRef]
- Waldmeier, M. Chromosphärische Eruptionen. I. Mit 6 Abbildungen. Z. Astrophys. 1938, 16, 276. [Google Scholar]
- McIntosh, P.S. The Classification of Sunspot Groups. Sol. Phys. 1990, 125, 251–267. [Google Scholar] [CrossRef]
- Hale, G.E.; Ellerman, F.; Nicholson, S.B.; Joy, A.H. The Magnetic Polarity of Sun-Spots. Astrophys. J. Lett. 1919, 49, 153. [Google Scholar] [CrossRef]
- Hale, G.E.; Nicholson, S.B. Magnetic observations of sunspots, 1917–1924. Nature 1938, 144, 266–267. [Google Scholar]
- Yashiro, S.; Gopalswamy, N. Statistical relationship between solar flares and coronal mass ejections. Univers. Heliophys. Process. 2009, 257, 233–243. [Google Scholar] [CrossRef] [Green Version]
- Pulkkinen, T. Space Weather: Terrestrial Perspective. Living Rev. Sol. Phys. 2007, 4, 1. [Google Scholar] [CrossRef] [Green Version]
- Thomson, N.R.; Rodger, C.J.; Clilverd, M.A. Large solar flares and their ionospheric D region enhancements. J. Geophys. Res. (Space Phys.) 2005, 110, A06306. [Google Scholar] [CrossRef] [Green Version]
- Tao, C.; Nishioka, M.; Saito, S.; Shiota, D.; Watanabe, K.; Nishizuka, N.; Tsugawa, T.; Ishii, M. Statistical analysis of short-wave fadeout for extreme space weather event estimation. Earth, Planets Space 2020, 72, 173. [Google Scholar] [CrossRef]
- Schwenn, R. Space Weather: The Solar Perspective. Living Rev. Sol. Phys. 2006, 3. [Google Scholar] [CrossRef]
- Garcia, H.A. Forecasting methods for occurrence and magnitude of proton storms with solar soft X-rays. Space Weather 2004, 2, S02002. [Google Scholar] [CrossRef]
- Garcia, H.A. Forecasting methods for occurrence and magnitude of proton storms with solar hard X-rays. Space Weather 2004, 2, 6003. [Google Scholar] [CrossRef]
- Belov, A. Properties of solar X-ray flares and proton event forecasting. Adv. Space Res. 2009, 43, 467–473. [Google Scholar] [CrossRef]
- Kahler, S.W.; Ling, A.G. Forecasting Solar Energetic Particle (SEP) events with Flare X-ray peak ratios. J. Space Weather Space Clim. 2018, 8, A47. [Google Scholar] [CrossRef] [Green Version]
- Núñez, M.; Nieves-Chinchilla, T.; Pulkkinen, A. Predicting well-connected SEP events from observations of solar EUVs and energetic protons. J. Space Weather Space Clim. 2019, 9, A27. [Google Scholar] [CrossRef]
- Barnes, G.; Leka, K.D.; Schumer, E.A.; Della-Rose, D.J. Probabilistic forecasting of solar flares from vector magnetogram data. Space Weather 2007, 5, S09002. [Google Scholar] [CrossRef]
- Leka, K.D.; Park, S.H.; Kusano, K.; Andries, J.; Barnes, G.; Bingham, S.; Bloomfield, D.S.; McCloskey, A.E.; Delouille, V.; Falconer, D.; et al. A Comparison of Flare Forecasting Methods. II. Benchmarks, Metrics, and Performance Results for Operational Solar Flare Forecasting Systems. Astrophys. J. Lett. Suppl. Ser. 2019, 243, 36. [Google Scholar] [CrossRef] [Green Version]
- Falco, M.; Costa, P.; Romano, P. Solar flare forecasting using photospheric active region properties. Nuovo Cimento C Geophys. Space Phys. C 2019, 42, 14. [Google Scholar] [CrossRef]
- Miteva, R. Eruptive versus confined X-class flares in solar cycles 23 and 24. Bulg. Astron. J. 2021, 35, 87. [Google Scholar]
- Veronig, A.; Temmer, M.; Hanslmeier, A.; Otruba, W.; Messerotti, M. Temporal aspects and frequency distributions of solar soft X-ray flares. Astron. Astrophys. 2002, 382, 1070–1080. [Google Scholar] [CrossRef] [Green Version]
- Kilcik, A.; Chowdhury, P.; Sarp, V.; Yurchyshyn, V.; Donmez, B.; Rozelot, J.P.; Ozguc, A. Temporal and Periodic Variation of the MCMESI for the Last Two Solar Cycles; Comparison with the Number of Different Class X-ray Solar Flares. Sol. Phys. 2020, 295, 159. [Google Scholar] [CrossRef]
- Gallagher, P.T.; Moon, Y.J.; Wang, H. Active-Region Monitoring and Flare Forecasting I. Data Processing and First Results. Sol. Phys. 2002, 209, 171–183. [Google Scholar] [CrossRef]
- Yashiro, S.; Gopalswamy, N.; Michalek, G.; St. Cyr, O.C.; Plunkett, S.P.; Rich, N.B.; Howard, R.A. A catalog of white light coronal mass ejections observed by the SOHO spacecraft. J. Geophys. Res. (Space Phys.) 2004, 109, A07105. [Google Scholar] [CrossRef]
- Cane, H.V.; Richardson, I.G.; von Rosenvinge, T.T. A study of solar energetic particle events of 1997-2006: Their composition and associations. J. Geophys. Res. (Space Phys.) 2010, 115, A08101. [Google Scholar] [CrossRef]
- Miteva, R.; Samwel, S.W.; Costa-Duarte, M.V. The Wind/EPACT Proton Event Catalog (1996–2016). Sol. Phys. 2018, 293, 27. [Google Scholar] [CrossRef] [Green Version]
- Samwel, S.W.; Miteva, R. Catalogue of in situ observed solar energetic electrons from ACE/EPAM instrument. Mon. Not. R. Astron. Soc. 2021, 505, 5212–5227. [Google Scholar] [CrossRef]
- Miteva, R. On the solar origin of in situ observed energetic protons. Bulg. Astron. J. 2019, 31, 51. [Google Scholar]
- Miteva, R.; Samwel, S.W.; Costa-Duarte, M.V.; Malandraki, O.E. Solar cycle dependence of Wind/EPACT protons, solar flares and coronal mass ejections. Sun Geosph. 2017, 12, 11–19. [Google Scholar]
- Kahler, S.W. The role of the big flare syndrome in correlations of solar energetic proton fluxes and associated microwave burst parameters. J. Geophys. Res. 1982, 87, 3439–3448. [Google Scholar] [CrossRef]
- Patel, B.D.; Joshi, B.; Cho, K.S.; Kim, R.S. DH Type II Radio Bursts During Solar Cycles 23 and 24: Frequency-Dependent Classification and Their Flare-CME Associations. Sol. Phys. 2021, 296, 142. [Google Scholar] [CrossRef]
- McCloskey, A.E.; Gallagher, P.T.; Bloomfield, D.S. Flare forecasting using the evolution of McIntosh sunspot classifications. J. Space Weather Space Clim. 2018, 8, A34. [Google Scholar] [CrossRef] [Green Version]
- Falco, M.; Costa, P.; Romano, P. Solar flare forecasting using morphological properties of sunspot groups. J. Space Weather Space Clim. 2019, 9, A22. [Google Scholar] [CrossRef]
- Wang, Y.; Zhang, J. A Comparative Study between Eruptive X-Class Flares Associated with Coronal Mass Ejections and Confined X-Class Flares. Astrophys. J. Lett. 2007, 665, 1428–1438. [Google Scholar] [CrossRef] [Green Version]
- Cheng, X.; Zhang, J.; Ding, M.D.; Guo, Y.; Su, J.T. A Comparative Study of Confined and Eruptive Flares in NOAA AR 10720. Astrophys. J. Lett. 2011, 732, 87. [Google Scholar] [CrossRef] [Green Version]
- Tschernitz, J.; Veronig, A.M.; Thalmann, J.K.; Hinterreiter, J.; Pötzi, W. Reconnection Fluxes in Eruptive and Confined Flares and Implications for Superflares on the Sun. Astrophys. J. Lett. 2018, 853, 41. [Google Scholar] [CrossRef] [Green Version]
- Baumgartner, C.; Thalmann, J.K.; Veronig, A.M. On the Factors Determining the Eruptive Character of Solar Flares. Astrophys. J. Lett. 2018, 853, 105. [Google Scholar] [CrossRef]
- Belov, A.; Garcia, H.; Kurt, V.; Mavromichalaki, H.; Gerontidou, M. Proton Enhancements and Their Relation to the X-Ray Flares During the Three Last Solar Cycles. Sol. Phys. 2005, 229, 135–159. [Google Scholar] [CrossRef]
- Helmboldt, J.F.; Kassim, N.E.; Teare, S.W. Observations of the ionospheric impact of M-class solar flares on local and hemispheric scales. Earth Space Sci. 2015, 2, 387–402. [Google Scholar] [CrossRef]
- Yasyukevich, Y.V.; Voeykov, S.V.; Zhivetiev, I.V.; Kosogorov, E.A. Ionospheric response to solar flares of C and M classes in January-February 2010. Cosm. Res. 2013, 51, 114–123. [Google Scholar] [CrossRef]
- Kumar, R.; Chandra, R.; Pande, B.; Pande, S. Characteristics of SEPs during solar cycles 21-24. J. Astrophys. Astron. 2020, 41, 7. [Google Scholar] [CrossRef]
- Kiplinger, A.L. Comparative Studies of Hard X-Ray Spectral Evolution in Solar Flares with High-Energy Proton Events Observed at Earth. Astrophys. J. Lett. 1995, 453, 973. [Google Scholar] [CrossRef]
- Laurenza, M.; Cliver, E.W.; Hewitt, J.; Storini, M.; Ling, A.G.; Balch, C.C.; Kaiser, M.L. A technique for short-term warning of solar energetic particle events based on flare location, flare size, and evidence of particle escape. Space Weather 2009, 7, S04008. [Google Scholar] [CrossRef] [Green Version]
- Zucca, P.; Núñez, M.; Klein, K. Exploring the potential of microwave diagnostics in SEP forecasting: The occurrence of SEP events. J. Space Weather Space Clim. 2017, 7, A13. [Google Scholar] [CrossRef]
- Núñez, M.; Paul-Pena, D. Predicting >10 MeV SEP Events from Solar Flare and Radio Burst Data. Universe 2020, 6, 161. [Google Scholar] [CrossRef]
- Bain, H.M.; Steenburgh, R.A.; Onsager, T.G.; Stitely, E.M. A Summary of National Oceanic and Atmospheric Administration Space Weather Prediction Center Proton Event Forecast Performance and Skill. Space Weather 2021, 19, e2020SW002670. [Google Scholar] [CrossRef]
- Kahler, S.W.; Cliver, E.W.; Ling, A.G. Validating the proton prediction system (PPS). J. Atmos. Sol.-Terr. Phys. 2007, 69, 43–49. [Google Scholar] [CrossRef]
- Núñez, M. Predicting solar energetic proton events (E > 10 MeV). Space Weather 2011, 9. [Google Scholar] [CrossRef]
- Posner, A. Up to 1-hour forecasting of radiation hazards from solar energetic ion events with relativistic electrons. Space Weather 2007, 5, S05001. [Google Scholar] [CrossRef] [Green Version]
Figure 1.
(a) Distribution of the M-class flares in time using 6-month binning. (b) Distribution of the M-class flares in SXR class using 0.5 class binning. The bin length denotes the number of events in the respective bin, whereas the color denotes the SC: black for SC23 and red for SC24.
Figure 1.
(a) Distribution of the M-class flares in time using 6-month binning. (b) Distribution of the M-class flares in SXR class using 0.5 class binning. The bin length denotes the number of events in the respective bin, whereas the color denotes the SC: black for SC23 and red for SC24.

Figure 2.
Distribution of the M-class flares in flare time (a) rise (onset-to-peak), (b) decline (peak-to-end). Notations as in Figure 1.
Figure 2.
Distribution of the M-class flares in flare time (a) rise (onset-to-peak), (b) decline (peak-to-end). Notations as in Figure 1.

Figure 3.
Distribution of the M-class flares on the solar disk in: (a) longitude (E−W), (b) latitude (S−N). Notations as in Figure 1.
Figure 3.
Distribution of the M-class flares on the solar disk in: (a) longitude (E−W), (b) latitude (S−N). Notations as in Figure 1.

Figure 4.
Distribution of M-class related CMEs: (a) in linear speed, (b) in AW.

Figure 5.
Distribution of the M-class related solar energetic particles in peak intensity: (a) protons, (b) electrons.
Figure 5.
Distribution of the M-class related solar energetic particles in peak intensity: (a) protons, (b) electrons.

Figure 6.
Plot of (a) rise time, (b) decline time, both as a function of the M-class of the flares. Color code: blue for SCs23 + 24; black for SC23 and red for SC24.
Figure 6.
Plot of (a) rise time, (b) decline time, both as a function of the M-class of the flares. Color code: blue for SCs23 + 24; black for SC23 and red for SC24.

Figure 7.
Plot of (a) longitude, (b) latitude, both as a function of the M-class of the flares. Color code as in Figure 6.
Figure 7.
Plot of (a) longitude, (b) latitude, both as a function of the M-class of the flares. Color code as in Figure 6.

Figure 8.
Plot of (a) CME speed, (b) CME AW, both as a function of the M-class of the flares. Color code as in Figure 6.
Figure 8.
Plot of (a) CME speed, (b) CME AW, both as a function of the M-class of the flares. Color code as in Figure 6.

Figure 9.
Plot of (a) IP IIs, (b) IP IIIs, both as a function of the M-class of the flares. Color code as in Figure 6.
Figure 9.
Plot of (a) IP IIs, (b) IP IIIs, both as a function of the M-class of the flares. Color code as in Figure 6.


Table 1.
Number of M-class-related sunspots according to their Hale type. That same number divided to the total SF sample (2177) is given in percentage in parentheses, after rounding.
Table 1.
Number of M-class-related sunspots according to their Hale type. That same number divided to the total SF sample (2177) is given in percentage in parentheses, after rounding.
| Hale Type | Reported | Uncertain/Visual/on Next Day |
|---|---|---|
| 76 (3%) | 50 (2%) | |
| 546 (25%) | 109 (5%) | |
| 6 | − | |
| - | 459 (21%) | 22 (1%) |
| – | − | |
| - | 48 (2%) | – |
| -- | 661 (30%) | 2 |
| - | 4 | – |
| no sunspots | 51 (2%) | − |
| uncertain | 135 (6%) | − |
Table 2.
Number of events (and occurrence rates) of SFs, CMEs, three selected sunspot types, two species of energetic particles and two types of radio bursts (in the second column the values are normalized to the total number of events, 2177; in the third and fourth columns the normalization is to the respective number in the second column). Negative percentage changes in the last column denote a decrease of the solar phenomena in SC24.
| Solar Event | SCs23 + 24 | SC23 | SC24 | % Change |
|---|---|---|---|---|
| SFs | 2177 (100%) | 1428 (66%) | 749 (34%) | |
| CMEs | 889 (41%) | 562 (63%) | 327 (37%) | |
| 655 (30%) | 467 (71%) | 188 (29%) | ||
| - | 481 (22%) | 298 (62%) | 183 (38%) | |
| -- | 663 (30%) | 385 (58%) | 278 (42%) | |
| SEPs | 133 (6%) | 88 (66%) | 45 (34%) | |
| SEEs | 247 (11%) | 175 (71%) | 72 (29%) | |
| IP-III | 1078 (50%) | 734 (68%) | 344 (32%) | |
| IP-II | 148 (7%) | 98 (66%) | 50 (34%) |
Table 3.
Mean/median values of flare and CME properties as a function of M-class. The values for the observed radio bursts (in the last two columns) are given as a ratio to the total number of SFs (the latter shown in the second column for each row). The sample size in each sub-class is given in parentheses.
| M- | Rise&Decline | Longitude | Latitude | CME Speed | CME AW | IP IIs | IP IIIs |
|---|---|---|---|---|---|---|---|
| Class | [min] | [Degrees] | [Degrees] | [km s] | [Degrees] | % | % |
| SCs23 + 24 | |||||||
| M1 | 16/10 & 13/9 (1291) | W03/W04 (1224) | S03/S08 (1193) | 600/522 (447) | 128/93 (448) | 4% (50) | 44% (575) |
| M2 | 16/11 & 13/8 (365) | W01/W01 (357) | S01/S07 (351) | 681/555 (169) | 135/97 (169) | 7% (27) | 54% (196) |
| M3 | 16/12 & 13/9 (197) | W08/W06 (186) | S02/S08 (185) | 706/599 (86) | 156/108 (87) | 7% (14) | 53% (105) |
| M4 | 17/11 & 12/7 (93) | E07/E15 (90) | S03/S08 (89) | 757/658 (49) | 146/96 (49) | 16% (15) | 60% (56) |
| M5 | 16/12 & 13/8 (88) | W04/W07 (87) | 0/N06 (87) | 863/776 (50) | 214/210 (49) | 15% (13) | 60% (56) |
| M6 | 17/13 & 14/9 (60) | W06/E03 (60) | S03/S10 (58) | 854/790 (39) | 210/170 (39) | 18% (11) | 58% (35) |
| M7 | 25/16 & 18/12 (26) | W16/W30 (36) | 0/N01 (35) | 1128/1109 (21) | 211/178 (21) | 25% (9) | 64% (23) |
| M8/9 | 20/12 & 14/9 (47) | W05/E02 (46) | 0/0 (46) | 1163/1102 (28) | 211/178 (28) | 19% (9) | 68% (32) |
| SC23 | |||||||
| M1 | 16/10 & 14/9 (840) | W04/W03 (773) | S01/S06 (743) | 630/531 (284) | 118/93 (285) | 4% (36) | 47% (397) |
| M2 | 16/11 & 13/8 (240) | W05/W03 (233) | 0/N03 (227) | 707/617 (108) | 125/97 (108) | 8% (19) | 56% (134) |
| M3 | 16/12 & 13/9 (137) | W13/W11 (126) | S02/S09 (125) | 714/600 (54) | 138/108 (55) | 6% (8) | 50% (68) |
| M4 | 17/11 & 13/8 (62) | E09/E16 (59) | S03/S05 (58) | 856/733 (34) | 157/96 (34) | 19% (12) | 65% (40) |
| M5 | 18/14 & 15/9 (56) | W01/E08 (55) | N01/N09 (55) | 946/952 (31) | 222/210 (30) | 13% (7) | 68% (38) |
| M6 | 17/11 & 14/8 (37) | W12/W13 (37) | S01/S06 (35) | 878/738 (22) | 162/170 (22) | 14% (5) | 54% (20) |
| M7 | 25/14 & 14/10 (23) | W10/W04 (23) | N01/N05 (22) | 1161/1109 (11) | 188/178 (11) | 22% (5) | 61% (14) |
| M8/9 | 21/12 & 13/9 (33) | W04/E02 (32) | S01/N02 (32) | 1312/1262 (18) | 188/178 (18) | 18% (6) | 70% (23) |
| SC24 | |||||||
| M1 | 16/9 & 12/8 (451) | W01/W06 (451) | S05/S11 (450) | 549/510 (163) | 143/109 (163) | 3% (14) | 39% (178) |
| M2 | 16/11 & 13/8 (125) | E06/E14 (124) | S03/S09 (124) | 635/487 (61) | 151/114 (61) | 6% (8) | 50% (62) |
| M3 | 17/11 & 14/8 (60) | E02/E03 (60) | S01/S08 (60) | 692/952 (32) | 188/176 (32) | 10% (6) | 62% (37) |
| M4 | 15/10 & 9/5 (31) | E02/E06 (31) | S04/S11 (31) | 533/516 (15) | 121/82 (15) | 10% (3) | 65% (20) |
| M5 | 13/9 & 10/8 (32) | W09/W12 (32) | S02/S03 (32) | 729/641 (19) | 202/150 (19) | 19% (6) | 56% (18) |
| M6 | 18/14 & 14/10 (23) | E04/E04 (23) | S06/S13 (23) | 823/851 (17) | 271/360 (17) | 26% (6) | 65% (15) |
| M7 | 26/19 & 23/15 (13) | W26/W42 (13) | S02/S09 (13) | 1092/1019 (10) | 236/271 (10) | 31% (4) | 69% (9) |
| M8/9 | 17/11 & 16/8 (14) | W07/W07 (14) | N01/S10 (14) | 896/676 (10) | 299/360 (10) | 21% (3) | 64% (9) |
Table 4.
Mean/median values of SF and CME properties as a function of sunspot type. The values for the observed radio bursts (in the last two columns) are given as a ratio to the total number of SFs (the latter shown in the second column for each row). The sample size in each sub-class is given in parentheses (rise and decline times have the same sample sizes as the M-class and are dropped). Uncertain/visual identifications of the sunspot type are not considered.
| Hale | M- | Rise & Decline | Longitude | Latitude | CME Speed | CME AW | IP IIs | IP IIIs |
|---|---|---|---|---|---|---|---|---|
| Type | Class | [min] | [Degrees] | [Degrees] | [km s] | [Degrees] | % | % |
| SCs23 + 24 | ||||||||
| M1.9/M1.6 (655) | 15/11 & 13/8 | W03/E07 (546) | S02/S07 (543) | 677/588 (253) | 153/113 (254) | 7% (39) | 58% (317) | |
| - | M1.9/M1.6 (481) | 16/10 & 12/8 | W11/W07 (459) | S02/S07 (458) | 638/522 (177) | 154/109 (177) | 7% (31) | 49% (225) |
| -- | M2.1/M1.8 (663) | 15/10 & 12/8 | W20/W25 (660) | S03/S10 (660) | 678/549 (224) | 144/93 (224) | 6% (42) | 42% (280) |
| SC23 | ||||||||
| M1.9/M1.6 (467) | 15/11 & 13/8 | W02/E09 (397) | S01/S07 (394) | 698/603 (183) | 144/113 (184) | 7% (27) | 62% (245) | |
| - | M2.4/M1.7 (298) | 15/10 & 12/9 | W14/W09 (289) | S02/S07 (288) | 644/525 (100) | 142/109 (100) | 5% (14) | 47% (137) |
| -- | M2.1/M1.8 (385) | 15/10 & 12/8 | W22/W26 (385) | 0/0 (385) | 727/628 (131) | 134/93 (131) | 8% (29) | 44% (170) |
| SC24 | ||||||||
| M1.9/M1.6 (188) | 16/11 & 13/8 | W05/W19 (149) | S03/S08 (149) | 622/512 (70) | 177/130 (70) | 8% (12) | 48% (72) | |
| - | M2.3/M1.6 (183) | 17/10 & 12/7 | W07/W04 (170) | S02/S09 (170) | 629/522 (77) | 169/132 (77) | 10% (17) | 52% (88) |
| -- | M2.1/M1.8 (278) | 15/9 & 12/7 | W16/W24 (275) | S07/S13 (275) | 608/510 (93) | 159/101 (93) | 5% (13) | 40% (110) |
Publisher’s Note: MDPI stays neutral with regard to jurisdictional claims in published maps and institutional affiliations. |
© 2022 by the authors. Licensee MDPI, Basel, Switzerland. This article is an open access article distributed under the terms and conditions of the Creative Commons Attribution (CC BY) license (https://creativecommons.org/licenses/by/4.0/).
Share and Cite
MDPI and ACS Style
Miteva, R.; Samwel, S.W. M-Class Solar Flares in Solar Cycles 23 and 24: Properties and Space Weather Relevance. Universe 2022, 8, 39. https://0-doi-org.brum.beds.ac.uk/10.3390/universe8010039
AMA Style
Miteva R, Samwel SW. M-Class Solar Flares in Solar Cycles 23 and 24: Properties and Space Weather Relevance. Universe. 2022; 8(1):39. https://0-doi-org.brum.beds.ac.uk/10.3390/universe8010039
Chicago/Turabian StyleMiteva, Rositsa, and Susan W. Samwel. 2022. "M-Class Solar Flares in Solar Cycles 23 and 24: Properties and Space Weather Relevance" Universe 8, no. 1: 39. https://0-doi-org.brum.beds.ac.uk/10.3390/universe8010039
Note that from the first issue of 2016, this journal uses article numbers instead of page numbers. See further details here.