
Statistical Thermal Model for Particle Production in pp Collisions at RHIC and LHC Energies


1
State Key Laboratory of Quantum Optics and Quantum Optics Devices, College of Physics and Electronics Engineering, Shanxi University, Taiyuan 030006, China
2
Collaborative Innovation Center of Extreme Optics, Shanxi University, Taiyuan 030006, China
*
Author to whom correspondence should be addressed.
Universe 2022, 8(2), 124; https://0-doi-org.brum.beds.ac.uk/10.3390/universe8020124
Submission received: 17 December 2021
/
Revised: 25 January 2022
/
Accepted: 8 February 2022
/
Published: 13 February 2022
(This article belongs to the Special Issue Hydrodynamics and Thermodynamics in High Energy Physics)
Abstract
:In this paper, an improved multi-source thermal model is used to analyze the transverse momentum spectra in collisions at high energies, ranging from = 62.4 GeV to 7 TeV. Via a detailed comparison between the model results and experimental data at RHIC and LHC energies, the thermodynamic properties of particle production are decided. It is shown that the excitation factors of emission sources depend linearly on ln in the framework. Based on the variation regularity of the source excitation factors, transverse momentum spectra are predicted in collisions at higher energies; potential future colliders operating at = 33 and 100 TeV.
PACS:
13.85.-t; 14.40.-n; 12.40.Ee1. Introduction
Inclusive measurements of produced particle spectra in high-energy collisions can provide an insight into thermodynamic properties and the strong interaction in low-energy, non-perturbative region of quantum chromodynamics (QCD) [1,2]. The study of the particle distribution, which reflects quantitatively the mutiparticle production, can refine the understanding of global properties of collisions at high energies. With increasing the center-of-mass energy at LHC and a performance of the beam energy scan (BES) program at RHIC, the discussion of the thermal QCD matter will be much broader and deeper. It contributes significantly to the extension of the kinematic range in the longitudinal rapidity and transverse momentum. Moreover, the particle distribution helps us to understand the basic production mechanism of hadrons in nucleon–nucleon () and nucleus–nucleus () collision experiments. The well-known transverse momentum distribution of particles plays an important role in the observation of high-energy collisions. The spectra can bring some more information about particle properties as well as matter evolution in or collisions at RHIC and LHC energies [3,4].
At the later stages, the reaction system is dominated by hadronic resonances, and the interacting system at the kinetic freeze-out stays at a thermodynamic equilibrium state or a local equilibrium state. In the high-energy collision, the final-state particle production and emission are influenced by not only the collective flow, but also the thermal motion of particle sources. Considering the creation and subsequent decay of hadronic resonances produced in chemical equilibrium at a certain temperature and baryon chemical potential, statistical thermal models have obtained some valuable thermodynamic information of the mutiparticle system in high- energy collisions in the past few years. It is an identifying feature of the thermal models that these resonances listed by the Particle Data Group (PDG) are considered to be in a thermal and chemical equilibrium [5]. Statistical thermal models have successfully described the particle abundances at low transverse momentum [6,7,8,9,10]. In recent years, some phenomenological models or (semi-) empirical formalisms of particle distributions have been reported to quantitatively explain the experimental results of the (or transverse mass ) spectra in and collisions, up to LHC energies. In the study of particle distributions, different exponential functions were applied in these statistical thermal models, for distribution, such as exponential distribution function , exponential distribution function or Gaussian distribution function , and exponential distribution function . There are similar functions for distribution, such as exponential distribution function , Boltzmann distribution function , and Bose–Einstein distribution function .
In this work, considering these exponential functions, we add the rapidity shift contribution of the longitudinal thermal source along the rapidity axis in the multi-source thermal model. Then, the improved model is used to analyse the transverse momentum spectra in collisions at RHIC and LHC energies.
2. The Statistical Thermal Model
In order to interpret the identified particle spectra produced in multiparticle production processes, Hagedorn suggested a statistical model [11]; the transverse momentum spectrum obeys a thermalised Boltzmann distribution.
where the is a mean transverse momentum averaged over all events in the event sample. It is an exponential function and can only describe the transverse momentum spectrum in the transverse mass range GeV [12]. In the model, a rapidity distribution (or pseudorapidity distribution) width of the corresponding source is not taken into account for the distribution function. In order to be consistent with the range of the experimental observations, the pseudorapidity interval integral has been included in the particle distribution,
where
Moreover, we compute the rapidity y as a function in terms of and
Then, the issue can be resolved by the multisource thermal model. According to the geometrical picture of nucleons in high-energy collisions, the thermalized cylinder model and the relativistic diffusion model [13] are developed. Final-state particles are emitted from thermalized sources, which are located in a projectile cylinder, and a target cylinder is created in collisions. For intermediate energy collisions, the two cylinders overlap completely and can be treated as one cylinder. For high-energy collisions, the two cylinders overlap partly. For ultra-high energy collisions, the two cylinders move apart. In the rapidity y space in collisions, the y range of the projectile cylinder (Pc) is in and the y range of the target cylinder (Tc) is in . The present the rapidity center of the collision system. Then, the y spectrum of final-state particles measured in collisions is defined as
The is a rapidity distribution function of particles, which come from the same thermalized source at the sole rapidity location. The and are the contributions of Tc and Pc, respectively. The denotes the locations of the emission sources at y space.
For the investigation of the transverse momentum and transverse mass distributions, the rapidity shifts of the emission source in the two cylinders cannot be ignored. In the rapidity space, these sources have different rapidity shifts and distribute nonuniformly in the rapidity region. In order to clarify the relation between the sources and the particles, the sources are grouped into n sections according to their longitudinal locations. The source number of every group is not the same because of different interaction mechanisms or event samples. The produced fragments or particles emit isotropically from different emission sources created in the high-energy collisions. The source number of the ith group is presented by . The transverse momentum spectrum contributed by the jth source of the ith group can be described by an exponential distribution
The source-excitation factor is defined as
It is the mean transverse momentum of the particles, which come from the same considered source. In the same group, we have
By computing the convolution of the exponential function Equation (6), the transverse momentum distribution contributed by the ith group, given by
which is known as an Erlang distribution. For all the sources, the transverse momentum distribution is
It is a multi-component Erlang distribution. The parameter is a share of the ith group. In the improved model, the particle rapidity cut is naturally and consistently taken into account. The Monte Carlo method can simplify the transverse-momentum distribution calculation. By Equation (6), the transverse momentum is given by
where is a random number distributed in [0, 1].
3. Discussion and Conclusions
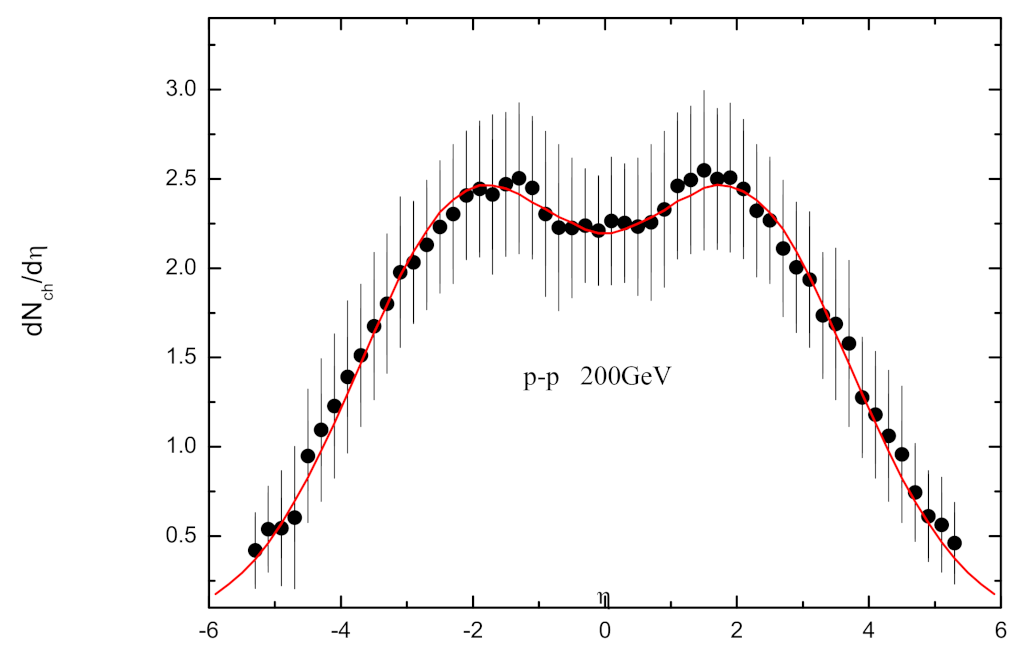
In order to identify the validity of the updated model, the pseudorapidity spectrum of produced particles is obtained by Equation (5) and Figure 1 presents the pseudorapidity distributions of charged particles produced in collisions at = 200 GeV. Black circles stand for experimental data taken from the PHOBOS collaboration [14]. Solid lines stand for our model results. In the symmetric collision system, the pseudorapidity spectrum is symmetric. In the calculation, the per number of degrees of freedom (/ndf) testing provides a statistical indication of the most probable value of corresponding model parameters. It is seen that the model results agree well with the experimental data. In the framework of the multi-source thermal model, some emission sources are created in the collision system. The final-state particles emit from the thermal sources. By the characteristic of the particle spectra, we can discuss the thermodynamic properties. It is of great significance to better understand the production mechanism in high-energy collisions.
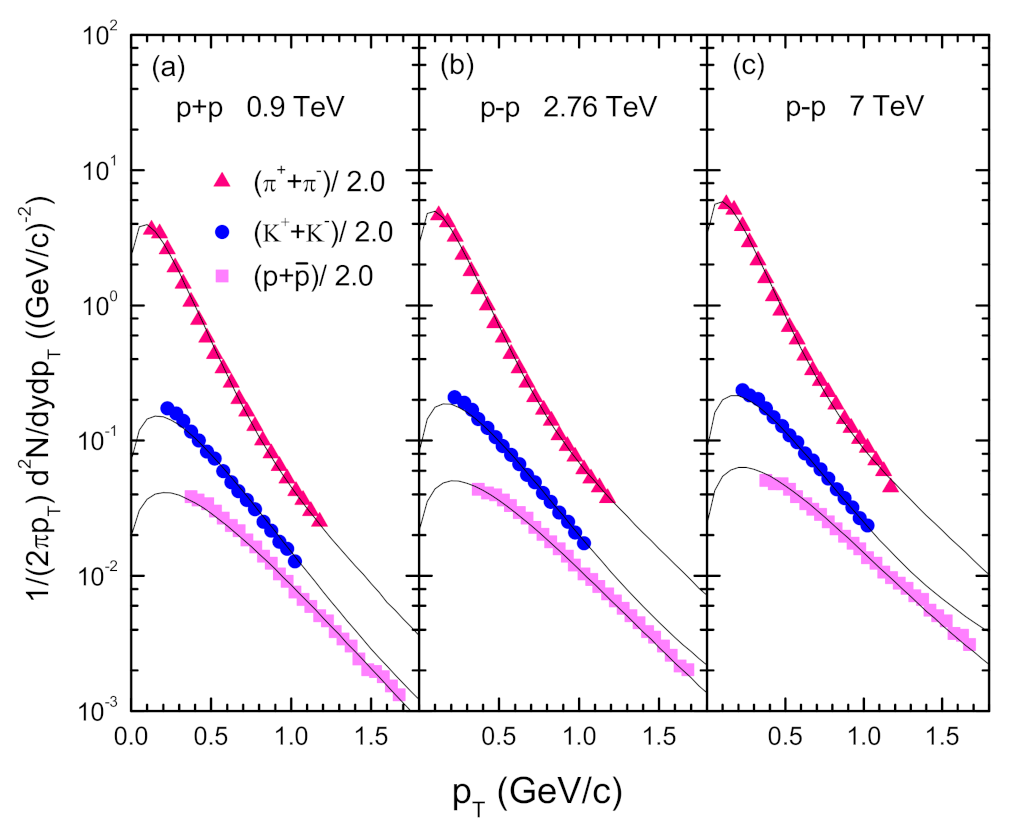
Figure 2 presents the transverse momentum spectra of produced charged hadrons (pion, kaon, proton) in collisions at = 62.4 GeV and at = 200 GeV. The scattered symbols stand for the experimental data from the PHENIX Collaboration [15,16,17] and the STAR Collaboration [18,19]. The solid lines stand for the model results. The maximum value of /ndf is 1.15 and the minimum value of /ndf is 0.08. Figure 3 presents the transverse momentum spectra of produced charged hadrons (pion, kaon, proton) in collisions in the range at = 0.9, 2.76 and 7 TeV. The scattered symbols stand for the experimental data from the CMS Collaboration [20]. The solid lines stand for the model results, which are in good agreement with the experimental data. The maximum value of /ndf is 1.04 and the minimum value is 0.10. The spectra from the the improved model are in good agreement with the experimental data.
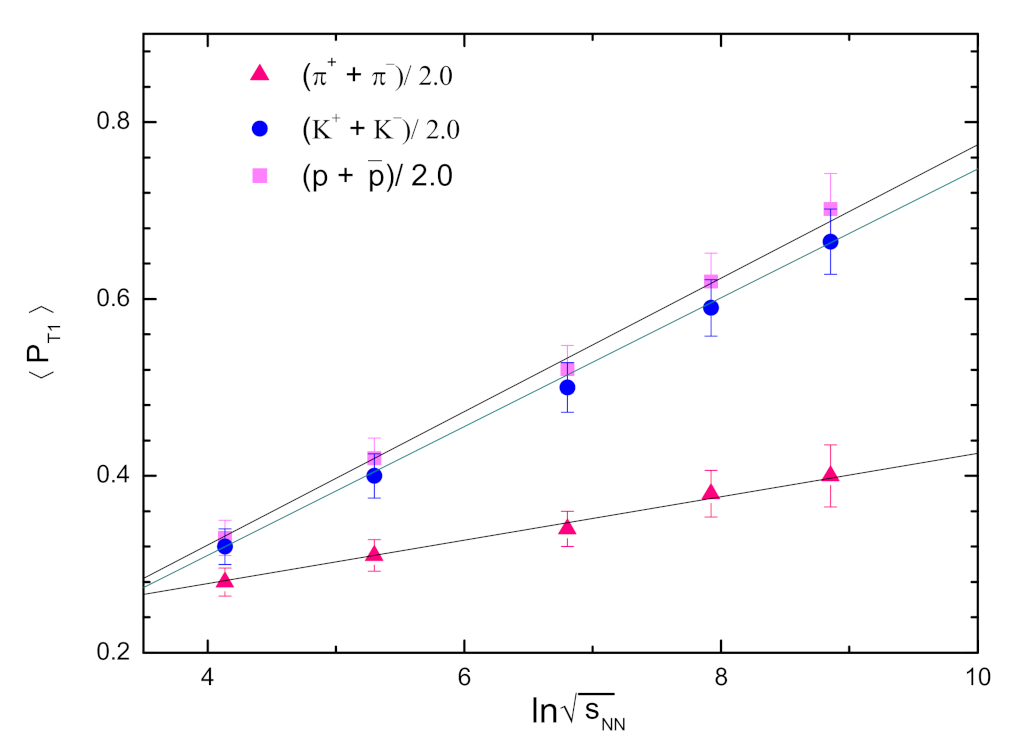
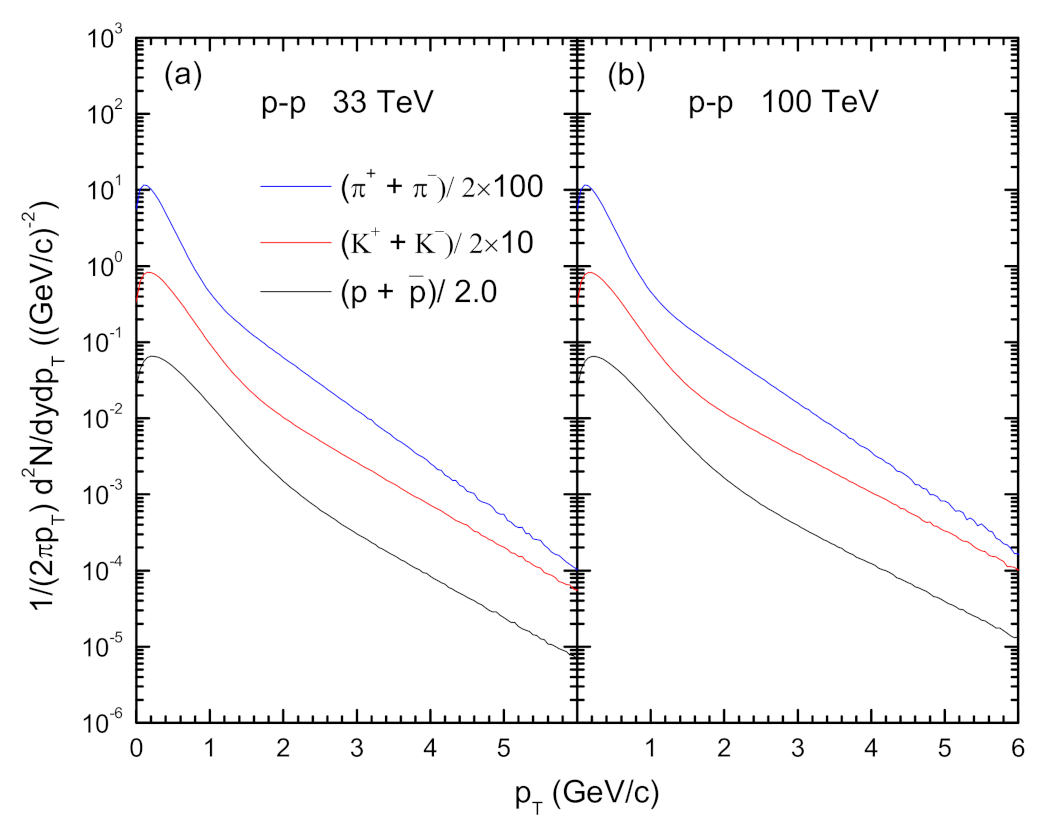
According to the pseudorapidity distributions, the sources may be divided into two groups. The target cylinder and the projectile cylinder correspond to one group, respectively. The source number of every group is not the same, because of different interaction mechanisms or event samples. The parameter values are obtained by fitting the experimental data. In the calculations, we take one source in the first group and take two sources in the second group . For pions, kaons, and protons, the mean in the second group is fixed, i.e., 0.11 GeV/c, 0.20 GeV/c, and 0.26 GeV/c, respectively. As can be seen in Figure 4, the mean of the first group increases regularly with ln. The fitting functions are ln. The values of a and b are given for pion, kaon, and proton in Table 1. Based on the linear functions, we can predict the taken in the model for collisions at higher energies. When is increased to 33 and 100 TeV, the values for pions, kaons, and protons are taken to be 0.4354 and 0.4626, 0.7766 and 0.8574, 0.8051 and 0.8887, respectively. The prediction of the transverse momentum spectra for pions, kaons and protons is given in Figure 5.
The thermodynamic properties of particles produced in high-energy collisions have attracted much attention, since attempts have been made to understand the strongly coupled QGP by studying the possible production mechanisms. Many exponential distributions in the thermodynamics and statistical physics are reported in the description of the particle spectra. Statistical thermal models have been successful in describing particle production in various systems at different energies [21,22,23,24]. In our previous work [25], to obtain the chemical potentials of quarks by ratios of negatively/positively charged particles, we have investigated the transverse momentum spectra of the CMS and ALICE Collaborations by using the Tsallis distribution. The results at low region in the present work are better than those in the previous work [26], where an emission source location dependence of the exciting degree has been studied specifically. In this work, we embed the exponential distribution into the geometrical picture of the high-energy collision in the multisource thermal model, and the sources are classified according to their longitudinal locations. Using the collision-energy dependence of the transverse momentum spectra, the collision-energy dependence of the source-excitation factors is discussed. By adopting the different formula of the transverse momentum spectrum in the model, the elliptic flow dependences of the transverse momentum, centrality, and participant nucleon number in GeV and TeV energy regions have been studied in the previous works [27,28]. It helps to understand particle production mechanisms from different angles. In the non-equilibrium statistical relativistic diffusion model with three sources, a central source and two fragmentation sources [13,29] are included. The multisource thermal model can use two cylindrical sources to describe the rapidity or pseudorapidity distributions. In this work, we embed the exponential distribution into the geometrical picture of the high-energy collision in the multisource thermal model and give the transverse momentum spectra in collisions at RHIC and LHC energies. In the rapidity space, particles emit from the thermal sources, which are at different locations due to stronger longitudinal flow [30,31,32]. The improved multisource thermal model can reproduce the experimental data of pions, kaons, and protons. The rapidity width is naturally taken into account by the location differences of these sources. The model parameter reflects the source excitation and is related to the temperature. It can probe the thermodynamic properties of the collision system, carrying information about the system evolution and the equation of state (EoS). The model provides the researcher with another tool to parametrize the experimental data. Admittedly, it is simplistic to provide a geometrical picture of high-energy collisions. However, it proves to be helpful to understand the particle distribution. We use the statistical approach to extract the information on the particle production mechanism. The present work is a successful attempt. By fitting more data, we can obtain empirical regularities of the particle distribution, in order to extract the information of particles created at the collisions. By analyzing the corresponding pseudorapidity distributions and describing systematically the transverse momentum spectra, the model parameters are extracted. It is found that the excitation factors of emission sources used in the calculations exhibit linear dependences on ln. The other parameters do not change obviously and can be regarded as constant values.
In summary, the particle spectra of pions, kaons and protons produced in collisions at RHIC and LHC energies have been studied systematically in the improved multisource thermal model. The investigation indicates that the improved model is successful in the description of hadron production. At the same time, the changing law of the model parameters is obtained from the transverse momentum spectra. According to the parameter change pattern, we give model predictions of the transverse momentum spectra of pions, kaons, and protons produced at potential future colliders operating at = 33 and 100 TeV. With more accumulated data or higher collision energy, the LHC and the next-generation colliders offer more opportunities to look for new physics up to and beyond the TeV scale.
Author Contributions
Conceptualization, B.L.; formal analysis, J.C. and B.L.; methodology, B.L., X.W. and H.D.; investigation, B.L. and H.D.; writing-original draft, J.C. and B.L.; writing—review and editing, B.L. and X.W. All authors have read and agreed to the published version of the manuscript.
Funding
This work is supported by the National Natural Science Foundation of China under Grant Nos 12047571, 11575103 and 11947418, Shanxi Provincial Natural Science Foundation under Grant No. 201701D121005, and Scientific and Technological Innovation Programs of Higher Education Institutions in Shanxi (STIP) Grant No. 201802017.
Institutional Review Board Statement
Not applicable.
Informed Consent Statement
Not applicable.
Data Availability Statement
The work is a theoretical study, the article do not report any data.
Acknowledgments
This work is supported by the National Natural Science Foundation of China under Grant Nos 12047571, 11575103 and 11947418, Shanxi Provincial Natural Science Foundation under Grant No. 201701D121005, and Scientific and Technological Innovation Programs of Higher Education Institutions in Shanxi (STIP) Grant No. 201802017.
Conflicts of Interest
The authors declare no conflict of interest.
References
- Aad, G.; Abbott, B.; Abdallah, J.; Abdinov, O.; Abeloos, B.; Aben, R.; Abolins, M.; AbouZeid, O.; Abraham, N.; Abramowicz, H.; et al. [ATLAS Collaboration] Charged-particle distributions in = 13 TeV pp interactions measured with the ATLAS detector at the LHC. Phys. Lett. B 2016, 758, 67. [Google Scholar] [CrossRef] [Green Version]
- Gao, F.; Pawlowski, J.M. QCD phase structure from functional methods. Phys. Rev. D 2020, 102, 034027. [Google Scholar] [CrossRef]
- Mishra, A.N.; Sahoo, R.; Sahoo, P.; Pareek, P.; Behera, N.K.; Nandi, B.K. Energy and Centrality dependence of dNch/dη and dET/dη in Heavy-Ion Collisions from = 7.7 GeV to 5.02 TeV. Eur. Phys. J. A 2016, 52, 319. [Google Scholar] [CrossRef] [Green Version]
- Bashir, I.U.; Parra, R.A.; Bhat, R.A.; Uddin, S. Particle Transverse Momentum Distributions in p-p Collisions at = 0.9 TeV. Adv. High Energy Phys. 2019, 2019, 8219567. [Google Scholar] [CrossRef] [Green Version]
- Oeschler, H.; Cleymans, J.; Hippolyte, B.; Redlich, K.; Sharma, N. Thermal Model Description of Collisions of Small Nuclei. arXiv 2016, arXiv:1603.09553. [Google Scholar]
- Broniowski, W.; Baran, A.; Florkowski, W. Thermal approach to RHIC. Acta Phys. Polon. B 2002, 33, 4235. [Google Scholar]
- Abelev, B.I.; Aggarwal, M.M.; Ahammed, Z.; Anderson, B.D.; Arkhipkin, D.; Averichev, G.S.; Bai, Y.; Balewski, J.; Barannikova, O.; Barnby, L.S.; et al. [STAR Collaboration] [STAR Collaboration]. Systematic Measurements of Identified Particle Spectra in pp,d+ Au and Au+Au Collisions from STAR. Phys. Rev. C 2009, 79, 034909. [Google Scholar] [CrossRef]
- Sharma, N.; Cleymans, J.; Hippolyte, B.; Paradza, M. A Comparison of p-p, p-Pb, Pb-Pb Collisions in the Thermal Model: Multiplicity Dependence of Thermal Parameters. Phys. Rev. C 2019, 99, 044914. [Google Scholar] [CrossRef] [Green Version]
- Patra, R.N.; Mohanty, B.; Nayak, T.K. Centrality, transverse momentum and collision energy dependence of the Tsallis parameters in relativistic heavy-ion collisions. Eur. Phys. J. Plus 2021, 136, 702. [Google Scholar] [CrossRef]
- Gupta, R.; Katariya, A.S.; Jena, S. A unified formalism to study the pseudorapidity spectra in heavy-ion collision. Eur. Phys. J. A 2021, 57, 224. [Google Scholar] [CrossRef]
- Deppman, A. Thermodynamics with fractal structure, Tsallis statistics and hadrons. Phys. Rev. D 2016, 93, 054001. [Google Scholar] [CrossRef] [Green Version]
- Abgrall, N.; Aduszkiewicz, A.; Ali, Y.; Anticic, T.; Antoniou, N.; Baatar, B.; Bay, F.; Blondel, A.; Blumer, J.; Bogomilov, M.; et al. [NA61/SHINE Collaboration] Measurement of negatively charged pion spectra in inelastic p+p interactions at = 20, 31, 40, 80 and 158 GeV/c. Eur. Phys. J. C 2014, 74, 2794. [Google Scholar] [CrossRef] [Green Version]
- Wolschin, G. Pseudorapidity distributions of produced charged hadrons in pp collisions at RHIC and LHC energies. Europhys. Lett. 2011, 95, 61001. [Google Scholar] [CrossRef]
- Alver, B.; Back, B.B.; Baker, M.D.; Ballintijn, M.; Barton, D.S.; Betts, R.R.; Bickley, A.A.; Bindel, R.; Budzanowski, A.; Busza,W.; et al. [PHOBOS Collaboration] Phobos results on charged particle multiplicity and pseudorapidity distributions in Au+Au, Cu+Cu, d+Au, and p+p collisions at ultra-relativistic energies. Phys. Rev. C 2011, 83, 024913. [Google Scholar] [CrossRef] [Green Version]
- Adare, A.; Afanasiev, S.; Aidala, C.; Ajitanand, N.N.; Akiba, Y.; Al-Bataineh, H.; Alexander, J.; Aoki, K.; Aphecetche, L.; Armendariz, R.; et al. [PHENIX Collaboration]. Identified charged hadron production in p+p collisions at = 200 and 62.4 GeV. Phys. Rev. C 2011, 83, 064903. [Google Scholar] [CrossRef] [Green Version]
- Adare, A.; Afanasiev, S.; Aidala, C.; Ajitanand, N.N.; Akiba, Y.; Al-Bataineh, H.; Alexander, J.; Aoki, K.; Aphecetche, L.; Asai, J.; Atomssa, E.T.; et al. [PHENIX Collaboration] Inclusive cross section and double helicity asymmetry for pi⌃0 production in p+p collisions at = 62.4 GeV. Phys. Rev. D 2009, 79, 012003. [Google Scholar] [CrossRef] [Green Version]
- Adare, A.; Afanasiev, S.; Aidala, C.; Ajitanand, N.N.; Akiba, Y.; Al-Bataineh, H.; Alexander, J.; Aoki, K.; Aphecetche, L.; Armendariz, R.; et al. [PHENIX Collaboration] [PHENIX Collaboration]. Measurement of neutral mesons in p+p collisions at = 200 GeV and scaling properties of hadron production. Phys. Rev. D 2011, 83, 052004. [Google Scholar] [CrossRef] [Green Version]
- Abelev, B.I.; Adams, J.; Aggarwal, M.M.; Ahammed, Z.; Amonett, J.; Anderson, B.D.; Anderson, M.; Arkhipkin, D.; Averichev, G.S.; Bai, Y.; et al. [STAR Collaboration] Phys. Rev. C 2007, 75, 064901. [CrossRef] [Green Version]
- Adams, J.; Aggarwal, M.M.; Ahammed, Z.; Amonett, J.; Anderson, B.D.; Anderson, M.; Arkhipkin, D.; Averichev, G.S.; Badyal, S.K.; Bai, Y.; et al. [STAR Collaboration] Identified hadron spectra at large transverse momentum in p+p and d+Au collisions at s(NN)**(1/2) = 200-GeV. Phys. Lett. B 2006, 637, 161. [Google Scholar] [CrossRef] [Green Version]
- Chatrchyan, S.; Khachatryan, V.; Sirunyan, A.M.; Tumasyan, A.; Adam, W.; Aguilo, E.; Bergauer, T.; Dragicevic, M.; Erö, J.; Fabjan, C.; et al. [CMS Collaboration] Study of the inclusive production of charged pions, kaons, and protons in pp collisions at = 0.9, 2.76, and 7 TeV. Eur. Phys. J. C 2012, 72, 2164. [Google Scholar] [CrossRef] [Green Version]
- Tiwari, S.K.; Singh, C.P. Particle production in Ultra-relativistic Heavy-Ion Collisions: A Statistical-Thermal Model Review. Adv. High Energy Phys. 2013, 2013, 805413. [Google Scholar] [CrossRef]
- Uysal, A.K.; Vardar, N. Statistical thermal model analysis of particle production at LHC. J. Phys. Conf. Ser. 2016, 707, 012031. [Google Scholar] [CrossRef] [Green Version]
- Matulewicz, T.; Piasecki, K. Particle yields in pp interactions at GeV interpreted in the statistical hadronization model. J. Phys. G 2021, 48, 085004. [Google Scholar] [CrossRef]
- Balassa, G.; Wolf, G. Charmed and bottomed hadronic cross sections from a statistical model. Eur. Phys. J. A 2020, 56, 237. [Google Scholar] [CrossRef]
- Liu, F.H.; Tian, T.; Zhao, H.; Li, B.C. Extracting chemical potentials of quarks from ratios of negatively/positively charged particles in high-energy collisions. Eur. Phys. J. A 2014, 50, 62. [Google Scholar] [CrossRef]
- Li, B.C.; Fu, Y.Y.; Wang, L.L.; Wang, E.Q.; Liu, F.H. Transverse momentum distributions of strange hadrons produced in nucleus-nucleus collisions at s(NN)**(1/2) = 62.4-GeV and 200-GeV. J. Phys. G 2012, 39, 025009. [Google Scholar] [CrossRef]
- Wang, E.Q.; Wei, H.R.; Li, B.C.; Liu, F.H. Dependence of elliptic flow on participant nucleon number in Au + Au collisions at sNN = 200 GeV. Phys. Rev. C 2011, 83, 034906. [Google Scholar] [CrossRef]
- Li, B.C.; Fu, Y.Y.; Wang, L.L.; Liu, F.H. Transverse Momentum, Centrality, and Participant Nucleon Number Dependence of Elliptic Flow. Adv. High Energy Phys. 2013, 2013, 908046. [Google Scholar] [CrossRef]
- Wolschin, G. Particle production sources at LHC energies. J. Phys. G 2013, 40, 045104. [Google Scholar] [CrossRef]
- Braun-Munzinger, P.; Stachel, J.; Wessels, J.P.; Xu, N. Thermal equilibration and expansion in nucleus-nucleus collisions at the AGS. Phys. Lett. B 1995, 344, 43. [Google Scholar] [CrossRef] [Green Version]
- Braun-Munzinger, P.; Stachel, J.; Wessels, J.P.; Xu, N. Thermal and hadrochemical equilibration in nucleus-nucleus collisions at the SPS. Phys. Lett. B 1996, 365, 1. [Google Scholar] [CrossRef] [Green Version]
- Feng, S.Q.; Zhong, Y. Baryon production and collective flow in relativistic heavy-ion collisions in the AGS, SPS, RHIC, and LHC energy regions ( ≤ 5 GeV to 5.5 TeV). Phys. Rev. C 2011, 83, 034908. [Google Scholar] [CrossRef] [Green Version]
Figure 1.
(Color online) Pseudorapidity distribution of charged particles produced in collisions at = 200 GeV. Filled circles represent experimental data measured by the PHOBOS Collaboration [14]. The theoretical result is presented by a curve.
Figure 1.
(Color online) Pseudorapidity distribution of charged particles produced in collisions at = 200 GeV. Filled circles represent experimental data measured by the PHOBOS Collaboration [14]. The theoretical result is presented by a curve.

Figure 2.
(Color online) Transverse momentum spectra of identified charged hadrons (pions, kaons, protons) in collisions at = 62.4 and 200 GeV. Experimental data from the PHENIX Collaboration [15,16,17] and the STAR Collaboration [18,19] are shown by the scattered symbols. The model results are shown by the solid line.

Figure 3.
(Color online) Transverse momentum spectra of identified charged hadrons (pions, kaons, protons) in collisions in the range , at = 0.9, 2.76 and 7 TeV. Experimental data measured by the CMS Collaboration [20] are shown by the scattered symbols. The model results are shown by the solid line.

Figure 4.
(Color online) The dependence of the different parameters on . The symbols represent the parameter values used in the calculations for different experimental collaborations. The solid lines denote the fitted results.
Figure 4.
(Color online) The dependence of the different parameters on . The symbols represent the parameter values used in the calculations for different experimental collaborations. The solid lines denote the fitted results.

Figure 5.
(Color online) The the transverse momentum spectra of pions, kaons and protons in (or ) collisions at = 33 TeV and 100 TeV.
Figure 5.
(Color online) The the transverse momentum spectra of pions, kaons and protons in (or ) collisions at = 33 TeV and 100 TeV.


Table 1.
Values of a and b for pion, kaon and proton.
| Particle | a | b |
|---|---|---|
| pion | ||
| kaon | ||
| proton |
Publisher’s Note: MDPI stays neutral with regard to jurisdictional claims in published maps and institutional affiliations. |
© 2022 by the authors. Licensee MDPI, Basel, Switzerland. This article is an open access article distributed under the terms and conditions of the Creative Commons Attribution (CC BY) license (https://creativecommons.org/licenses/by/4.0/).
Share and Cite
MDPI and ACS Style
Chen, J.; Li, B.; Wen, X.; Dong, H. Statistical Thermal Model for Particle Production in pp Collisions at RHIC and LHC Energies. Universe 2022, 8, 124. https://0-doi-org.brum.beds.ac.uk/10.3390/universe8020124
AMA Style
Chen J, Li B, Wen X, Dong H. Statistical Thermal Model for Particle Production in pp Collisions at RHIC and LHC Energies. Universe. 2022; 8(2):124. https://0-doi-org.brum.beds.ac.uk/10.3390/universe8020124
Chicago/Turabian StyleChen, Jiayu, Baochun Li, Xinjian Wen, and Hongwei Dong. 2022. "Statistical Thermal Model for Particle Production in pp Collisions at RHIC and LHC Energies" Universe 8, no. 2: 124. https://0-doi-org.brum.beds.ac.uk/10.3390/universe8020124
Note that from the first issue of 2016, this journal uses article numbers instead of page numbers. See further details here.