
The Contribution of Large Recurrent Sunspot Groups to Solar Activity: Empirical Evidence


Faculty of Mathematics and Computer Science, University of Lodz, S. Banacha 22, 90-238 Łódż, Poland
Universe 2022, 8(3), 180; https://0-doi-org.brum.beds.ac.uk/10.3390/universe8030180
Submission received: 7 January 2022
/
Revised: 5 February 2022
/
Accepted: 4 March 2022
/
Published: 13 March 2022
(This article belongs to the Special Issue Solar Activity Cycle)
Abstract
:We identify large sunspot nestlets (SN) mostly containing recurrent sunspot groups and investigate the indices of solar activity defined as the 11- or 22-year moving average of the daily areas of the SN. These nestlets, 667 in total, are constructed from the daily 1874–2020 RGO/SOON catalogue, which contains 41,394 groups according to their IDs, with a machine-learning technique. Within solar cycles 15–19, the index contributed disproportionately strongly to the overall solar activity: the index is normalized to a quasi-constant shape by a power function of the activity, where the exponent is approximately . Large SN contribute to solar activity even more in cycle 22, underlying the second largest peak of solar activity within the last Gleissberg cycle in ∼1985. Introducing another composite, moderate SN normalized by the overall activity, we observe its quasi-constant shape in cycles 15–19 and a general anti-correlation with the first normalized composite. The constructed sunspot nestlets constitute a modified catalogue of solar activity. We define the average lifetime per day in 22-year windows for the modified catalogue, in line with Henwood et al. (SoPhys 262, 299, 2010), and reproduce the dynamics of this quantity they revealed for 1900–1965. The average lifetime derived from the moderate SN is found to form a wave with minima at the beginning of the 20th and 21st centuries, resembling the Gleissberg cycle with long minima. The average lifetime characterizing large SN exhibited a deeper minimum at the beginning of the 20th century than 100 years later.
1. Introduction
The largest sunspots are characterized by a particular contribution to solar activity [1,2,3,4,5,6]. Identifying recurrent sunspot groups and adding their sizes to the statistical analysis, Nagovitsyn et al. [7] established that the coefficient of the proportionality in the Gnevyshev–Waldmeier rule is greater than earlier known estimates. The classification of sunspots into large, moderate, and small should ideally be universal going beyond the scope of individual papers. Obridko and Badalyan [2], splitting the range of sunspot areas into three intervals: up to 100 microhemispheres (MH), 100–500 MH, and >500 MH, found that the solar cycle “period” is most clearly detected with large sunspots, whereas the smaller sunspots somewhat unexpectedly follow ∼20 and ∼60 year quasi-periodicities. The contribution of large sunspots to the whole activity can also be related to the properties of quasi-biennial oscillations [8,9]. Mandal and Banerjee [3] worked with the solar cycle strength defined through the total area of specific sunspots emerging during the cycle. According to [3], analyzing cycles 16 to 23, sunspots with areas between 200 and 500 MH contribute more to odd cycle numbers. Nevertheless, Mandal and Banerjee [3] argued that only large sunspots represent the main indicators of solar activity and help quantify the asymmetry between solar hemispheres. On the decadal-to-centennial scale, the secular Gleissberg cycle (see [10,11,12] among others), modulating the amplitude of the solar cycle, affects the long-term properties of sunspots in a different way depending on their size and governs the sunspot formation in general [2,3].
Large and small sunspots are thought to represent the large- and small-scale components of the solar dynamo [3,13]. Obridko and Badalyan [2] conjectured that the formation of large sunspots occurs in the subsurface layers of the Sun, whereas small sunspots are connected to the deep dynamo. The state of the art in dynamo modeling allows model sequences of the sunspots to be generated. These artificial sunspots follow not only the basic regularities but also some of the long-term irregularities of solar activity [14]. The suggested algorithms producing artificial sunspots differ in where the flux originated and how it is transferred through the convection zone [15,16,17]. As the algorithms are driven by the observations of real sunspots, a better understanding of their relevant features, to be reproduced by the models, is required.
The identification of recurrent sunspot groups performed by Nagovitsyn et al. [7] to uncover the relationship between their area and lifetime complements earlier efforts to produce the catalogue of long-lived groups [18,19] and follows the opinion of Ringnes [20] who argued that “a revised catalogue of recurrent spots …would …be very desirable”.
This paper tackles the contribution of large sunspots to general solar activity on annual-to-multi-decadal scales in quantitative and qualitative ways. Addressing this challenge, we construct an algorithm aimed to identify large and moderate recurrent sunspot groups from the Royal Greenwich Observatory (RGO, 1874–1975) and Solar Optical Observing Network (SOON, 1976–2020) daily databases. Designing the details of the identification algorithm, we are motivated to trace the manifestation of strong magnetic field in the same location for several solar rotations. The identified groups, i.e., the groups selected by the algorithm, form so called nestlets (first, introduced by Henwood et al. [19] for a similar purpose). The identification leads us to proxies of strong magnetic field, which are the composites of the solar activity defined as the 11- or 22-year smoothing of the daily area of the sunspot groups included into the constructed nestlets. The temporal variations of the composites compared with general solar activity and the lifetime of the sunspot nestlets constitute the content of the paper, which is structured in a standard way. Section 2 and Section 3 describe the data and the method. Results are presented in Section 4. The discussion is in Section 5. Section 6 concludes. Technical details of the identification algorithm and its detailed comparison with the expert identification of the recurrent groups by [18] and earlier algorithms by Henwood et al. [19] and Nagovitsyn et al. [7] are relegated to the Appendix A, Appendix B, Appendix C and Appendix D.
2. Data
We use the daily series compiled by the Royal Greenwich Observatory (RGO) from 1874 to 1976 and the US Air Force from its Solar Optical Observing Network (SOON) from 1976 onward [10]. The joint catalogue contains 41394 different groups according to their IDs.
The change in the place and facilities of the observation brings inconsistency into the joint RGO/SOON database ([21,22]). The methods of the data processing including the SOON practice of rounding down the limb-area correction factors also affect the consistency of the joint catalog. The web sites https://solarscience.msfc.nasa.gov/greenwch.shtml (accessed on 5 January 2022) and http://solarcyclescience.com/activeregions.html (accessed on 5 January 2022) ([23]) contain RGO/SOON sunspot group data from 1874 onward. Hathaway et al. [24] defined the correction factor for the SOON areas (i.e., the areas associated with 1976 and later years). We denote the set of the sunspot groups from the joint RGO/SOON catalogue.
The choice of the databases is worth commenting on. Great many efforts have been recently made to improve the indices of solar activity (see, e.g., [25,26,27]). The homogeneity of the RGO time series in 1880–1920 were recently questioned and, as a result, the corrections were proposed by Willis et al. [28], Cliver [29]. Clette et al. [30] produced the second version of ISSN adjusting so called observer factor in the definition of the Wolf numbers and working through the discontinuity in the time series, thought to be performed with the Wolf numbers in 1945. Several composites have been built on the sunspot groups: the group sunspot number by Hoyt and Schatten [31] and its extension by Lockwood et al. [32], the “backbone” group number reconstruction by Svalgaard and Schatten [33], and the group number derived by Usoskin et al. [34]. Our choice of the RGO/SOON database is motivated by the requirement to deal with a long time series which contain the position of the spots together with the characteristic of the activity strength.
3. Method
3.1. Focus of the Identification
Large recurrent sunspot groups give a relevant proxy to the strong magnetic field of the Sun manifested at specific locations for weeks. However, the identification of the recurrent groups is uncertain since they are not observed at the “back”side of the Sun (at least, until Solar Terrestrial Relations Observatory, STEREO, [35] and Solar Dynamics Observatory [36] started recording the solar surface invisible from the Earth). Henwood et al. [19] referred to the results of their identification of recurrent groups as nestlets. In contrast to Henwood et al. [19], we focus on the identification of large and moderate recurrent groups and end up with large and moderate nestlets. As we will show later in detail, the design of our identification can lead to errors when a genuine “old” group is vanishing at the appearance on the solar disk but another larger group emerging nearby is included to the nestlets or no groups are identified at all. In the first case, the identification modifies the notion of nestlets introduced by Henwood et al. [19] through an increase of their size. In the second case, the vanishing part of sunspot groups (or the whole group if it returns to the solar disk for the first time) is not included into our nestlets. The identification of disappearing recurrent groups seems to rise uncertainties whereas their contribution to the solar activity associated with the nestlets is minor. As a result, we are biased to omit a minor contribution but avoiding potential erroneous identifications.
3.2. Identification of the Recurrent Groups
The rotation period of the Sun is approximately 27 days. The exact value depends on the latitude, as the Sun exhibits the differential rotation. If a sunspot group leaving the solar disk appears on it once more this occurs ∼14 days later in a neighborhood of the point with the same Carrington coordinates (i.e., the coordinates related to the Sun). The explicit position is affected primarily by a slow drift of the sunspots across the Sun estimated in up to – degrees per day [37,38]. Rare chaotic jumps in the records of specific sunspot groups are mainly explained by errors [39]. However, the appearance or disappearance of sunspots withing a group also affects the reported group position. As a result, a new occurrence of recurrent groups are expected in an ellipse centered at the longitude and latitude of the previous observation. Referring to the ellipse, we mean the points on the two-dimensional plane consisting of the latitudes and the longitudes, which are not related to the embedding of the Sun in the real three-dimensional space. We specify the ellipse in the following way.
Let be the Carrington rotation period that represents a certain average of the periods observed because of the differential rotation of the Sun. Then we put . This roughly represents the move of each group per day across the solar disk caused by the (differential) solar rotation.
Further, we consider the sunspot groups with the longitude located in the range and focus on those that the maximum of their recorded areas exceeds some relatively large threshold A. These groups are going to leave the disk two days later (if they still exist). Let be one of these groups observed at some time (measured in days) with the longitude from the range , the latitude , and the area . For the sake of simplicity in the notation, the identification procedure is explain just for . We intend to look for its new appearance at the left of the solar disk – days later. Let be a group observed at days. Then we introduce the ellipse centered at the Carrington coordinates of the group and endowed with some semi-axes and , which are the parameters of the procedure that has to be adjusted and fixed. If is located within the ellipse, it is a candidate to be identified with the group . Each group can have either 0, or 1, or more such candidates. The group is claimed to be non-recurrent in the first case. A single candidate is identified as in the second case. The group with the area being closest to the area of is identified with in the third case.
Eventually, we choose the semi-axes to minimize the errors of the identification. To this end, we use the sunspot groups that drift 7–10 days along the solar disk. With the threshold MH and the groups observable at least 10 consecutive days, the semi-axes and are adjusted via the maximization of the -score: , where , , and are the numbers of the true positive, false positive, and false negative outcomes of the identification. The adjusted values and of the longitudinal and latitudinal widths of the semi-axes are stable with respect to the drop of T from 10 to 7 days. This stability in T favors the application of the adjusted values to the real identification when . The details of the algorithm are described in the Appendix A, Appendix B, Appendix C and Appendix D.
3.3. Samples of Large and Moderate Nestles
We extract two sub-catalogues of the groups included into the nestlets with our identification algorithm. Let be extracted sunspot groups from such that the maximum of their recorded areas is more than 950 MH. Let be extracted sunspot groups from such that the maximum of their recorded areas is between 700 and 950 MH. Then the sub-catalogues and are our large and moderate nestlets. Controlling the necessity to deal with just large recurrent sunspot groups, we also consider two other sets and of large sunspot groups. The set consists of all (non-necessary recurrent) sunspot groups from such that the maximum of their recorded areas is more than 950 MH. Note that big non-recurrent groups from do not belong to . Regarding the opposite exclusion, if a recurrent group is obtained as the identification of two groups and and, for example, does not show up an area greater than 950 MH, then only is in H, but is not. The set is the union of and . It is defined to exhibit the transition between conclusions obtained with and .
We explore the time series which consist of consequent daily areas of sunspot groups averaged over 11-year sliding windows. The daily areas are taken from the samples , , , , and . Their averages are measured in MH per day. Formally, let be the set of sunspot groups and be the total area of all sunspot groups from associated with day d. Then we put
where is the length of the 11-year moving window, and denote the 11-year moving average of index ISSN (International Sunspot Numbers obtained from WDC-SILSO, Royal Observatory of Belgium, Brussels, [40], http://www.sidc.be/SILSO/(accessed on 5 January 2022)). With these composites, we discuss the contribution of the relatively large sunspot groups to the solar activity. The composite is used to describe the change in the dynamics of the composites as substitutes .
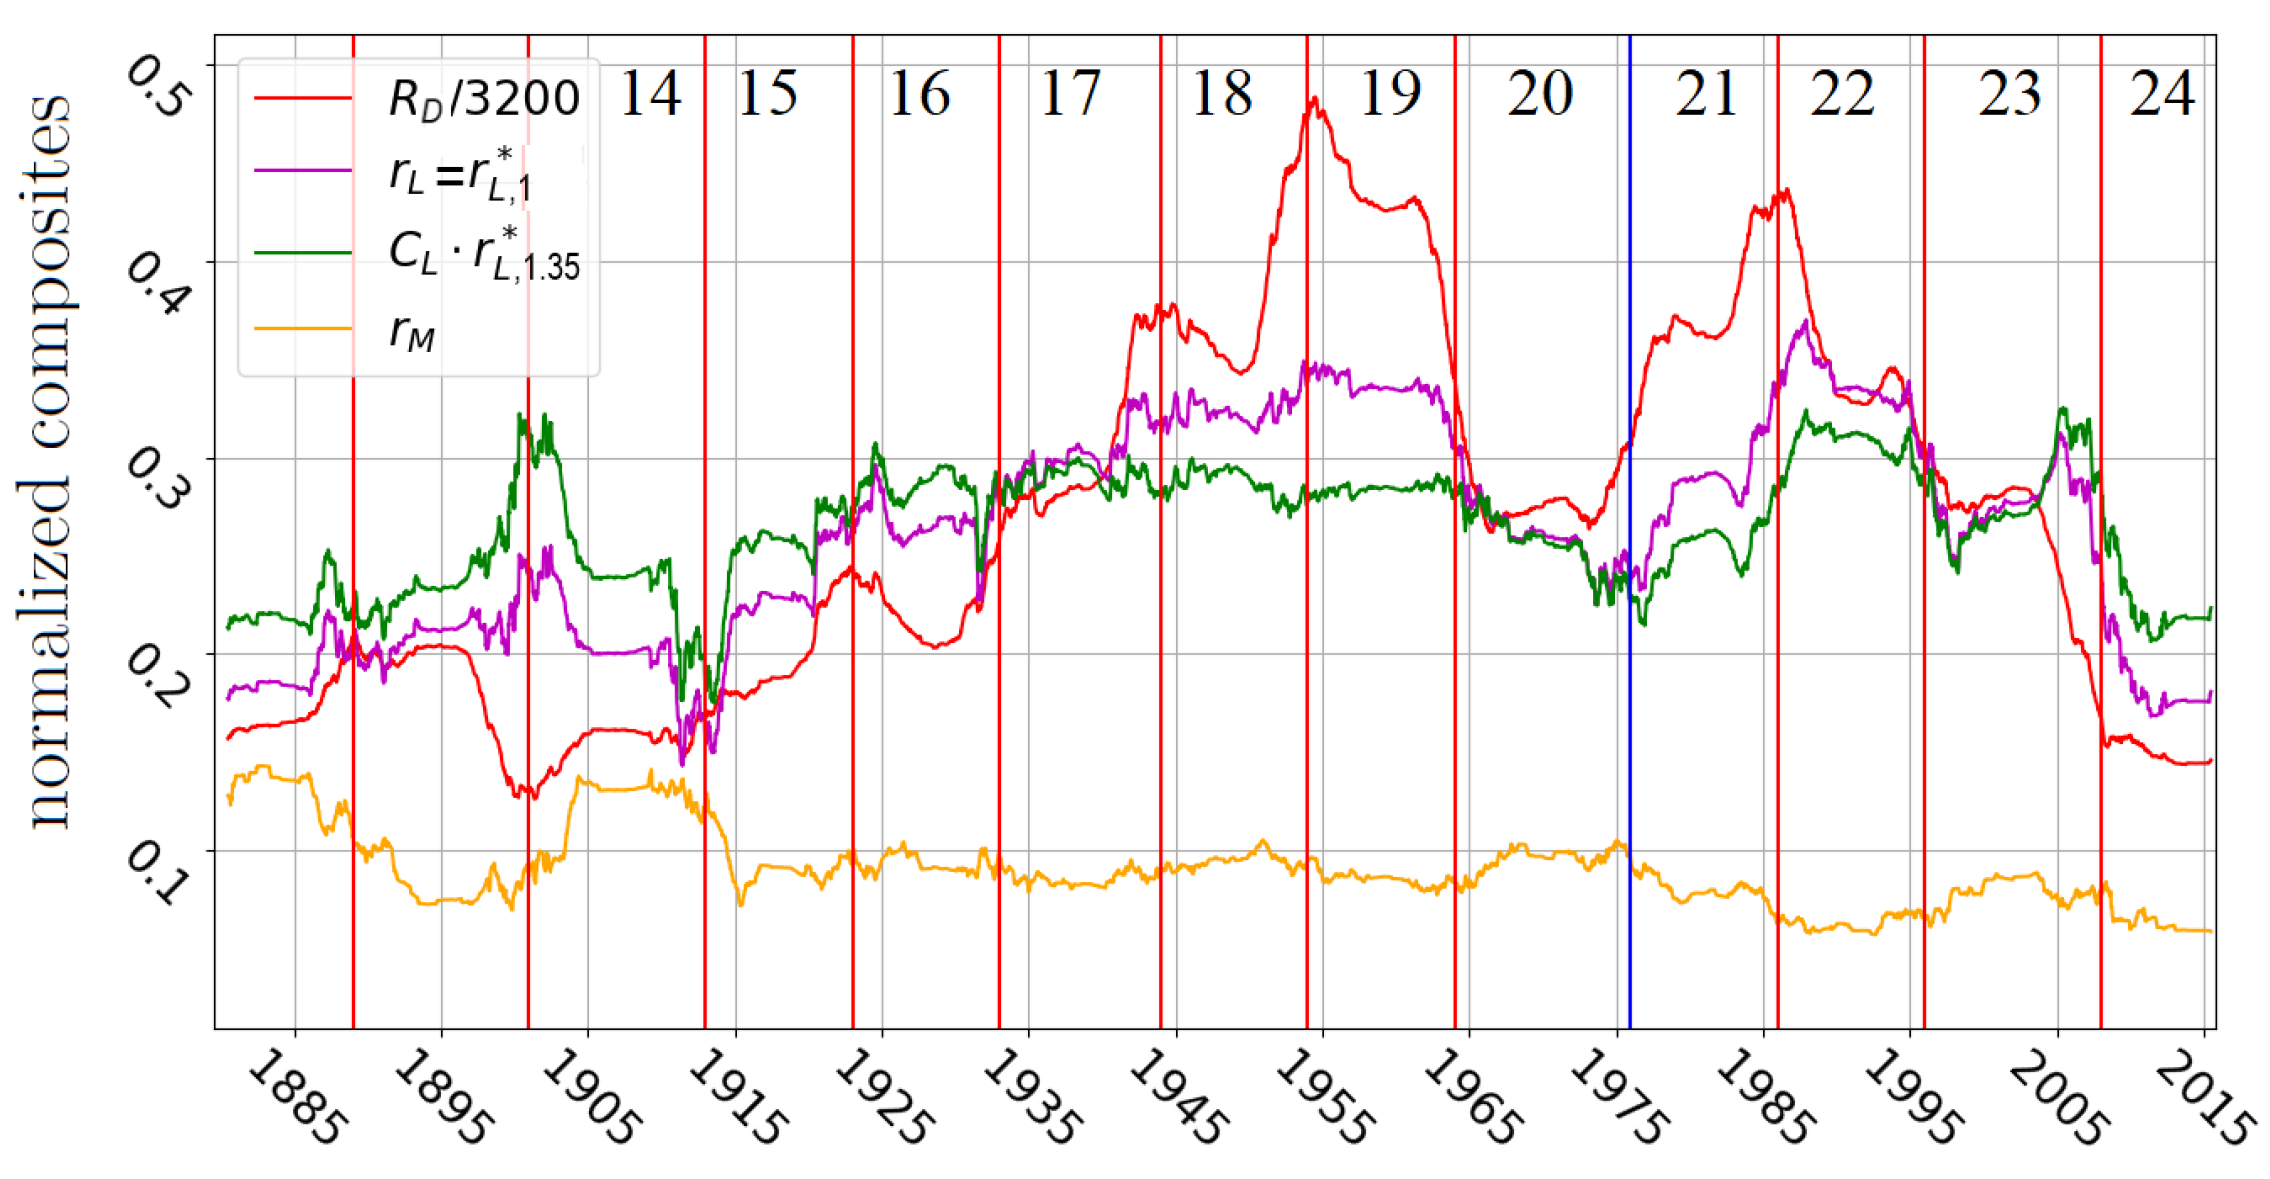
The time series and constitute a part of the series . According to Figure 1, these parts are well correlated with the full series. As is well known, the smoothed ISSN are also correlated with (red and blue curves). In particular, all four curves attain a global minimum, a global maximum, and a second maximum at cycles 13–14, 18–19, and 21–22, respectively (Figure 2). We note that the variability of (orange curve) is smaller than that of (magenta curve).
Estimating the contribution of the different components of to the full index, we normalize the series and into two new series:
where the exponent is adjusted for each composite separately to obtain the flattest graph of with the data of cycles 16–19 (the deviation from the mean value for these data is minimized with the step of in the values of ). The adjusted values of are , , and for the composites , , and , respectively.
4. Results
4.1. Indices of Recurrent Sunspot Groups
The normalized large selected sunspot groups (the magenta curve in Figure 2) still followed after 1915, thus, contributing disproportionately strongly to the overall solar activity. This disproportionality can be assessed quantitatively by using the time series defined through the normalization by the power function, Equation (2). This (green curve in Figure 2 obtained with and shifted via the multiplication by an appropriate factor to uplift it to the range of the values of the other curves) exhibits quasi-constant behavior when t is located in 1925–1965, cycles 16–19. The adjusted value of is not important itself. We emphasize here the very possibility to quantify the specific contribution of the large selected sunspot groups during 4 cycles in a row in a simple way. The variability of was larger before 1925 and after 1965. Nevertheless, the values of equaled to ∼0.25 (in the units of Figure 2) were attained in cycles 14, 15, 20, and 21, which is not far from the values – observed during cycles 16–19.
The weak variability of the normalized composite is observed with the range of from , where is the best estimate. This property characterizes just the large selected sunspot groups. The variability of the normalized composite built on the large (but not necessarily recurrent) groups is stronger (the black curve on Figure 3). The composite collects features of both datasets. As a result, the deviation from the mean value of is between that of and . The standard deviation computed with is less than that found with and on the cycles 16–19. The shift of the optimal exponent of toward 1 for the normalized composites and emphasizes the role of just recurrent groups (selected to the nestlets) in their disproportionate contribution to solar activity.
The normalized moderate selected sunspot groups demonstrated quasi-constant behavior in 1915–1975 followed by slow variations from 1975 onward (the orange curve in Figure 2). In general, the and curves exhibited an anti-correlation (most clearly observed with the 1965–1997 data). Interestingly, the change from to weakens the anti-correlation despite the fact that the composites and correspond to each other by definition. During the short interval from 1898 till 1903 and later from 1997 till 2010, and varied co-directionally. New data allow us to estimate a further agreement between and .
4.2. Recurrent Sunspot Group Lifetime
Blanter et al. [41] claimed that the lifetime of sunspots increased by factor during 1915–1940. They obtained this result indirectly when simulating the solar activity with a modulated AR-1 process. Henwood et al. [19] confirmed this prediction identifying the recurrent sunspot groups from the catalogue known as Greenwich Photo-heliographic Result (GRP), https://www.ngdc.noaa.gov/stp/solar/greenwich.html (accessed on 5 January 2022). We are able to reproduce the dynamics of the lifetime exposed by Henwood et al. [19] with our recurrent sunspot groups. This supports the reliability of our methodology and allows us to make an additional conjecture regarding the lifetime of large recurrent sunspot groups.
We note that the identification of large recurrent groups leads to the modification of the initial catalogue D: the components of the large selected groups are combined, whereas the rest of the groups are left as they are. Let be the modified catalogue. Further, following Henwood et al. [19], if several groups from share the day of the first record, only the group with the largest lifetime is kept and the other groups are eliminated. We denote the resulting catalogue. The lifetime of each group from with the first and the last records separated from the limb on at least is the time difference between them increased by 1 day. If the first or the last records are offset from the limb on less than then 8 days are added to the time difference between these records (or 7 days if the offset is less than ). For any 22-year window the lifetime of each group g associated with this window is summed up and divided by . The result introducing the lifetime per day is denoted and assigned to the center of the window:
where represents the day of the group g’s first record. In words, represents the average number of the days such that the groups from exist in the Sun. The 22-year windows are used to follow Blanter et al. [41] and Henwood et al. [19]. The same definition of the lifetime applied to the catalogues M and L returns us the normalized lifetime per day naturally called and (i.e., the average number of the days such that the groups from M and L, respectively, exist in the Sun).
The normalized lifetime per day shown in Figure 4 in blue and obtained with the approach of paper [19] but with our identification of the recurrent groups repeats the graph constructed by Henwood et al. [19]. The right endpoint of the graph from paper [19] corresponds to 1965, 11 year prior to the move of the observation place occurred in 1976. As a result of this move, the number and the area of the sunspots increased. Corrections were introduced to calibrate the indices of solar activity based on the sunspot groups [21]. However, these corrections do not calibrate the lifetime. Therefore, the comparison of the parts located before 1965 and after 1987 are impeded. We can note based on the right part of the graph itself, that a decrease in started when the sliding window reached the descending phase of cycle 23. This decrease turned to the fall when the data of cycle 24 were substituting for the data of cycle 22 in the sliding window.
The lifetime composites and derived from only large and, respectively, only moderate recurrent sunspot groups follow the rises and falls of . The graphs of and look like a scaled version of . The graph contains a secular wave with the maximum at cycles 18–19, which resembles the Gleissberg cycle. The anomalous 20th cycle affects mostly the composite that characterizes the large selected sunspot groups, causing a drop followed by a rise which violates a steady decrease of the wave of the Gleissberg cycle. The adequate calibration of the lifetime has to shift the right (i.e., after 1976) part of the composites downward, but the exact position has not been determined yet. Nevertheless, the peculiarities of our identification algorithm, which matches the components with similar areas, makes the inconsistency related to large recurrent groups smaller. Therefore, the calibrated right part of the (blue) graph might fall at the right end to the level of the beginning of the 20th century, thus staying in line with the existence of the Gleissberg-cycle wave (which seems to be the case for ). On the contrary, the fall of the (magenta) at the right to the level attained a century ago seems very unlikely.
5. Discussion
This paper reveals new regularities and irregularities of solar activity on the decadal-to-multi-decadal scale. Applying a machine learning technique to identify large recurrent groups from the daily 1874–2020 RGO/SOON catalogue we select the nestlets of sunspot groups and examine a proxy of solar activity defined as the daily area of these groups averaged over 11 years. This proxy is a part of the index which represents the 11-year moving average of the daily areas of all sunspot groups. The index is related to various strongly correlated proxies of solar activity, discussed in details, for example, by Lockwood et al. [26], which are inferred from the sunspot groups. The construction of the nestlet catalogue complements efforts performed to produce and calibrate records of solar activity [26,27,33,34,42,43].
We posit that the indices and exhibit a strong correlation (Figure 1). The contribution of large sunspot nestlets to solar activity is established to be disproportionately strong in terms of the relationship between and (Figure 2). The disproportionality is estimated quantitatively by the normalization of the index by the power function of the full index. The proportional contribution is given by the exponent . However the normalization with does not exclude a positive correlation with solar activity. A larger exponent is required, which is . The normalized time series exhibited a fixed level during cycles 15–19 and attained the values close to this level in cycles 14 and 20–23 (Figure 2). We stress that the preliminary selection of the recurrent groups is important to quantify the properties of the large sunspot groups. The composite built on the large sunspot groups from the initial catalogue still contributes to the overall activity disproportionately strongly, but weaker than does. The normalization of to by a power function of the full index that intends to flatten the graph within cycles 16–19 requires the exponent being closer to 1 than and results in a less flatter part of than that of (Figure 3). The peculiar role of the largest sunspots found here is in line with the conclusions of other papers [3,44,45,46].
Our additional empirical findings are based on the fraction of days such that the sunspot nestlets exist in the Sun. These fractions are computed within 22-year sliding windows. The strongest contribution of the large sunspot nestlets to the overall solar activity occurred during its second largest maximum in cycles 21–22 (see and curves in Figure 1 and Figure 2, respectively) when the fraction of the days with these large nestlets exhibited rather regular values (Figure 4). Thus, the maximum of occurred in cycles 21–22 was driven primarily by the growth in the area of the largest groups rather than in their number per day.
The moderate nestlets are characterized by the indices and , which represent the 11-year average of their daily areas and 22-year average of their number per day, respectively. The ratio of to the full index exhibited a constant level in cycles 15–19 and a strong anti-correlation with the normalized index (Figure 2). The deep minima of solar activity observed in ∼1900 and 2008 are characterized by the short termination of the anti-correlation between large and moderate long-lived sunspot group composites and co-directional changes in the two series. These episodes may signal the beginning of a new Gleissberg cycle. We note that moderate non-recurrent sunspot groups attained the main maximum in cycles 21–22 [2], in contrast to the recurrent groups. We support the conjecture by Henwood et al. [19] regarding the existence of the Gleissberg cycle in the dynamics of the lifetime (with the quantity that they introduced), arguing that the index , which represents the average daily number of the moderate nestlets observed in the Sun, followed a secular wave with minima in approximately 1906 and 2005. Moreover, the index is characterized by rather extent previous minimum of the Gleissberg cycle around 1900 (Figure 4). Therefore, the presented results suggest that the minimum of the centennial cycle started in solar cycle 23 and followed by solar cycle 24 may be long without actually entering a Grand Minima epoch. In this case, we should not expect a quick return of solar activity to the high level recorded in the mid of 20th century. The study of the average lifetime of different recurrent sunspot groups, which is more natural characteristic than the fraction , can shed more light on the properties of the Gleissberg cycle. But this is worth doing in a separate study.
Our identification of the recurrent groups is similar to that performed by Nagovitsyn et al. [7], but we focus on moderate and large groups ending up with a more accurate identification of just these groups with at least the training set related to the visible part of the Sun, Figure A1. With 1944–1976 year data, a turn from (related to [7]) to ellipse reduces the number of errors from 15 to 3 (see Table A2 with the complete list of the IDs of the groups related to the errors). As the drift of sunspot groups depends on their area [10], one may adjust the dependence of the ellipse axes on the area of the recurrent sunspots when identifying all recurrent sunspot groups. The direct comparison between the results obtained with our and Henwood et al. [19]’s identification procedures is not well defined, as nobody knows what groups are indeed recurrent. As an example, we take 8 groups which are observed in 1986, called recurrent by Henwood et al. [19], and satisfied our criteria of the moderate/large group identification. All of them are indeed identified as recurrent by our algorithm (see Appendix C ). Furthermore, the conclusions regarding the solar proxies built on the identified groups are comparable, and we completely reproduce the dynamics of the lifetime found by Henwood et al. [19] with the 1874–1976 data (Figure 4). The reproduction of the time variability of the lifetime found by Henwood et al. [19] and Blanter et al. [41] gives additional credibility to our identification mechanism.
Our large and moderate nestlets are related to but differ from sunspot nests, active regions, active longitudes, and complexes of activity. The nests were defined by Castenmiller et al. [47] as the groups of sunspots that keep their location during 6–15 solar rotations. The sunspot nests and the other terms reported above are introduced to describe the persistence of the strong magnetic field at fixed location (region, longitude) in the Sun (see [48,49,50] among others). This phenomenon can be associated with several sunspot groups of different sizes located within a broad region, in contrast to a single group found in smaller regions and selected to the nestlets.
6. Conclusions
We have emphasized that large recurrent sunspot groups contributed disproportionately strongly to the overall solar activity in 1915–2005, probably except a neighborhood of 1975. The 11-year moving average of the areas of these groups normalized to by the 11-year moving average of the areas of all groups with the exponent exhibited a weak variability around a constant level during cycles 15–19, thus, giving evidence for the estimate . The quasi-constant behavior of was followed by a drop in the anomalous cycle 20 and a rise to its global maximum in cycles 21–22. The average fraction of the days with the large nestlets in the Sun kept exhibiting regular values at the time of this maximum of .
In contrast to the large selected sunspot groups, the moderate ones followed the solar activity as it was: , whereas the pattern of their active days given by resembled the Gleissberg cycle with minima at the beginning of the 20th and 21st centuries.
The particular role of the long-lived sunspot groups highlighted in this paper may be explained by interactions of two multi-scale processes which contribute to solar dynamo. One process is explicitly connected to the global component of the dynamo being responsible for the sunspot formation. The other is related to the turbulent diffusion destroying the sunspots. One may assume that the sunspot formation process continues with the development of the sunspots in the Sun. The sunspot area enlarges when the spots rise into the surface layers from the base of the convective zone. The growth in the area remains regular while the moderate recurrent sunspot groups are created. The regularities of this creation found in this paper are probably governed by the Gleissberg cycle. However, the largest sunspot groups, which are extreme events in the probability distribution of the sunspot groups with respect to their areas [46], exhibit more complex behavior, as derived here and by other authors (see [2,3,13]). Better understanding of the processes related to the amplification of the magnetic field in the surface layers may shed light on the anomalous contribution of the largest recurrent sunspot groups to the overall activity.
Funding
This research received no external funding.
Institutional Review Board Statement
Not applicable.
Informed Consent Statement
Not applicable.
Data Availability Statement
The data used in this paper are freely available at https://solarscience.msfc.nasa.gov/greenwch.shtml (accessed on 5 January 2022) and http://solarcyclescience.com/activeregions.html (accessed on 5 January 2022).
Acknowledgments
I express my deepest gratitude to Vladimir Fufaev who designed the computer code extracting nestlets from the database. I am also thankful to Mikhail Shnirman for fruitful discussions during the work on the paper.
Conflicts of Interest
The author declares no conflict of interest. The funders had no role in the design of the study; in the collection, analyses, or interpretation of data; in the writing of the manuscript, or in the decision to publish the results.
Appendix A. Rules Applied to Define Recurrent Sunspot Groups
In this section, we describe in detail the algorithm which is designed to identify large and moderate recurrent sunspot groups. These groups are extracted from the catalogue of RGO/SOON records that contain the Carrington coordinates of the groups, the observed area, and the observation time, among other characteristics.
Let us number the groups from : , , …. A sunspot group numbered by k is described by the sequence of all its records , where is the number of records and consists of the longitude , latitude , area and time of the observation (accurate to a thousandth of a day). The coordinates x and y considered in the Stonyhurst system in the above notation are transformed from the Carrington coordinates given in the records [51]. Note, the Carrington-to-Stonyhurt transformation is inverse to one that is applied to design the records of the sunspot groups. The origin in the Stonyhurst system is located at the intersection of the Sun’s equator and the central meridian as seen from the Earth. Therefore, the pairs of observed sunspot groups’ longitude and latitude are expected to belong to the square . We recall that each sunspot group moves approximately per day across the solar disk because of solar rotation.
Two groups from are identified as matching parts of a single recurrent group in the following case. The first group , called further a source, has a record with the longitude located in the section . The second group , , is expected to be observed after days inside the corresponding region. The following rule reformulates this in a more rigorous way.
Rule 1.
Let and be two positive parameters that will be specified later. The group is called the complement of the source group , if it has a record such that the recorded time belongs to the day-long interval centered at , i.e.,
and the coordinates , are located inside the ellipse in the -plane with semi-axes and . This ellipse is centered at the point with the latitude and the longitude shifted by modulus 360 :
The center of the ellipse has approximately the same Carrington coordinates as those from the record .
Rule 1′.
If the large recurrent groups are searched for, the recorded area of the complement has to be larger than a threshold A fixed to 100 MH: .
Rules 1 and 1′ do not provide the uniqueness of the complement. Resolving the multiplicity problem, we impose the following rule.
Rule 2.
All possible sources are arranged in descending order with respect to the areas of the groups. If Rule 1 allows us to put several complements into correspondence with a source, then the group with the largest area is chosen as the complement.
Once the source and the complement are matched by the algorithm, the records of are assigned to (and is excluded from further consideration).
We need to say a word about the search for the complement of those groups that have already been identified as recurrent with Rules 1 and 2 (i.e., the third and consequent returns of the groups to the solar disk are the goal of the identification). Formally, when the group is identified as recurrent, the search for the next complement is fully defined by Rules 1 and 2. However, we introduce an additional
Rule 3.
The complement is searched only for such (already identified) recurrent groups that the maximum of their areas does not exhibit a large drop from the penultimate to ultimate appearances. Namely, let and be the maxima of the areas during the penultimate and ultimate appearances of a solar group . Then the complement is searched for if .
The purpose of Rule 3 is to trace each recurrent group to its complete disappearance. As is well known, when sunspots start decaying they do it rather quickly (Petrovay and van Driel-Gesztelyi [52] quantified the sunspot decay). Then a recurrent group shrunk to less than a half of its maximal area is likely to disappear before its next appearance. There are no exact rules that distinguish between small recurrent and “new born” groups at the limb. In rare cases, we erroneously neglect the last fragment of a recurrent sunspot group.
The contribution of the last fragment to the composites and is small and, therefore, the complication of the identification at this stage seems unnecessary.
In rare cases, the group can attain the threshold or of moderate or large sunspot groups at the non-first appearance on the solar disk. We account for this possibility by performing a search for a backward complement in the following way.
Rule 4.
Let the group from the initial catalogue with , where Ω is or , be observed near the limb, i.e.,
. Then the source of is searched in the ellipse defined by (A2) (but the notation is different, as plays the role of the complement) with the additional requirement
Rules 3 and 4 represent the observation that typical sunspot groups quickly attain the maximum but decay slowly. We verify that the constants and from conditions 3 and 4, which look somewhat arbitrary, are flexible.
Appendix B. Choice of the Ellipse Semi-Axes
Further, we explain the choice of the parameters. In order to adjust the semi-axes and of the ellipse, we introduce the training set
which consists of sunspot groups , , such that their maximal observed area is larger than A and the location of the first recorded position rotates with the Sun to a point which is still visible from the Earth. We distinguish between the recurrent and non-recurrent groups in the training set:
The supervised training is well defined for the training set, where determines the target of the identification. The time between the last observation and the moment of the identification of the sunspot groups is changed in (A1) from used for the real identification to values from 7 to 10 days characterizing the training set.
There are two types of the errors. Type I errors are false positive identifications ( is their number), i.e., the groups identified as recurrent, whereas they are not. Type II errors are false negatives () which misidentify recurrent groups. If the number of the correct identifications of the recurrent groups is , then the positive prediction value and the true predictive rate are
The training is designed to maximize the score
adjusting the semi-axes and of the ellipse along the longitudes and latitudes. The identification is performed with Rules 1, 1′, and 2.
Figure A1.
Training: The score calculated on sunspot groups from the training set with the low threshold A of the maximal area, the variable time gap T between the observations and the longitudinal and latitudinal semi-axes of the ellipse and , respectively. Upper row is corresponding to , lower – to .

The values of and are adjusted separately for each A. The parameter A affects the choice of and : in general, larger values of A result in a broader ellipse. The observation agrees with the conclusions of Hathaway [10] that, in particular, cover more distant passages of larger groups. The increase-ellipse strategy can potentially catch the groups which move substantially across the Sun (in the Carrington coordinates) but is threatened by the necessity to distinguish between several groups appearing in the large ellipse. Identifying large recurrent groups, we reduce the number of the false identifications by looking for the complements with relatively large areas (Rule 1′).
A general dependence of the ellipse on A is not described here. However, the adjusted values of the axes of the ellipse are almost the same for the moderate and large sunspot groups. Aggregating the best parameters over different choices of T and A, we pick up for both values of A: 950 and 700 MH (chosen to define the large and moderate recurrent groups in the main text). According to Figure A1a, if is fixed to , the score increases up to –, attains the maximum, and, eventually, saturates. Approximately the same behavior of is observed for (but we skip the graphs). Figure A1b illustrates the choice of as the local maximum of the graphs. In general, the curves observed with different values of T agree with one another (Figure A1a,b). Then we argue that the choice of the parameters performed with T corresponding to 8–10 days is likely to be adequate for days as required for the real identification.
Interestingly, the typical shift of the sunspots along the Sun is known to be small [10]. This suggests the choice of a narrower ellipse. For example, the choice of corresponds to that in in the paper by Nagovitsyn et al. [7]. Nevertheless, fixing this narrower ellipse, one ends up with a smaller score (Figure A1c). Nagovitsyn et al. [7], intending to identify all recurrent groups, used the relatively small .
This result is confirmed by Figure A1d–f. One can see that maximal value of score is approximately , whereas the maximal score for is more than . Moreover, the monotonicity of these functions is completely different. Figure A1d shows that for the maximal values of score is observed as . According to Figure A1e, if is fixed to , saturates at and rapidly decreases when . Finally, Figure A1f shows that if , the curves disagree with one another. This indicates that the increment of and tends to errors.
Aiming at large recurrent sunspot groups, we fix the larger as the training suggests. Further changing of from upward affects the score weakly, and we stop at , taking into account the evidence of small shifts known for the majority of the spots. We compare the identifications of the large recurrent groups with the value fixed to and in more details (and ). There are two types of the errors during identification. Clearly, a growth in reduces the number of the type II () errors at the expense of an increase in the number of the type I () errors. The Table A1 justifies that the reduction of the type II errors is reliable if is switched from to as it is shown in Figure A1. To be precise, we increase the number of uncertain complements from ∼25 to ∼125 out of 968 and find the complement in the wider ellipse 34 times when the complement in the narrower ellipse is absent. Matching the area of the source and the complements, one reduces the number of wrong identifications as it follows from the analysis of the training set (the identification score is increased by ).

Table A1.
The number of the type I and II errors for large ( MH) and moderate ( MH) recurrent groups; .
Table A1.
The number of the type I and II errors for large ( MH) and moderate ( MH) recurrent groups; .
| MH | Ellipse Size | Ellipse Size | Number of the Groupsin the Training Set |
|---|---|---|---|
| Error type I () | 14 | 8 | 529 |
| Error type II () | 148 | 27 | |
| MH | Number of the groupsin the training set | ||
| Error type I () | 26 | 22 | 920 |
| Error type II () | 238 | 43 |
Table A2.
The errors in the identification of large sunspot groups with the ellipses of the sizes (roughly corresponding to [7]) and used in this paper on the training set (A3) defined with the 1944–1976 RGO/SOON catalogues and . The RGO/SOON ID are given; the pairs of the ID show the two groups that are erroneously united into a single group.
| MH | ||
|---|---|---|
| Error type I | (18872, 18882), | (19061, 19062), |
| (18959, 18971) | ||
| Error type II | 18559, 21356, 19200, 21506 | 17782, 18756 |
| 14838, 16486, 18756, 20125, 23119 | ||
| 14717, 15638, 17161, 17782 |
Appendix C. Comparison with Other Identifications
We also compare our identification with that performed by Henwood et al. [19] and RGO, presented by [18] who processed GPR(linked) and RGO catalogues, respectively. Following Henwood et al. [19], we choose 1896 for the comparison. Then RGO and GPR(linked) are characterized by 26 and, respectively, 28 sunspot groups identified as recurrent by Maunder [18] or Henwood et al. [19]; 15 groups are common. Since our algorithm identifies large and moderate long-lived groups, we examine here only those groups that shown up the area being larger than 700 MH at least once. There are 8 such sunspot groups suggested to be recurrent by Maunder [18] or Henwood et al. [19]. Here is the list:
- (1)
- The matching of the groups with ID 4285–4296 presented in RGO and GPR(linked) is also with our catalogue ;
- (2)
- 4369–4386 is presented in GPR(linked) and ;
- (3)
- 4376–4399 presented in RGO and is replaced by the matching 4376–4395 in GPR(linked);
- (4)
- 4416–4435–4448 in GPR(linked) corresponding to 4416–4435–4446 in RGO is identified as 4435–4447 in (Rule 4 violated);
- (5)
- 4428–4441 is presented in GPR(linked) and ;
- (6)
- 4456–4473 is presented in RGO, GPR(linked), and (note that GPR(linked) contains the matching 4457–4473 in addition).
There are two other matching 4256–4278 and 4295–4314 with both RGO and GPR(linked) catalogues. In these cases, the area of the source groups was larger than 950 MH but the area of the complement is smaller than 100 MH. That is, these matching pairs violate our identification Rule 1′. We conclude that our identification of the recurrent groups nicely correspond to the expert identification performed by Maunder [18] and Henwood et al. [19].
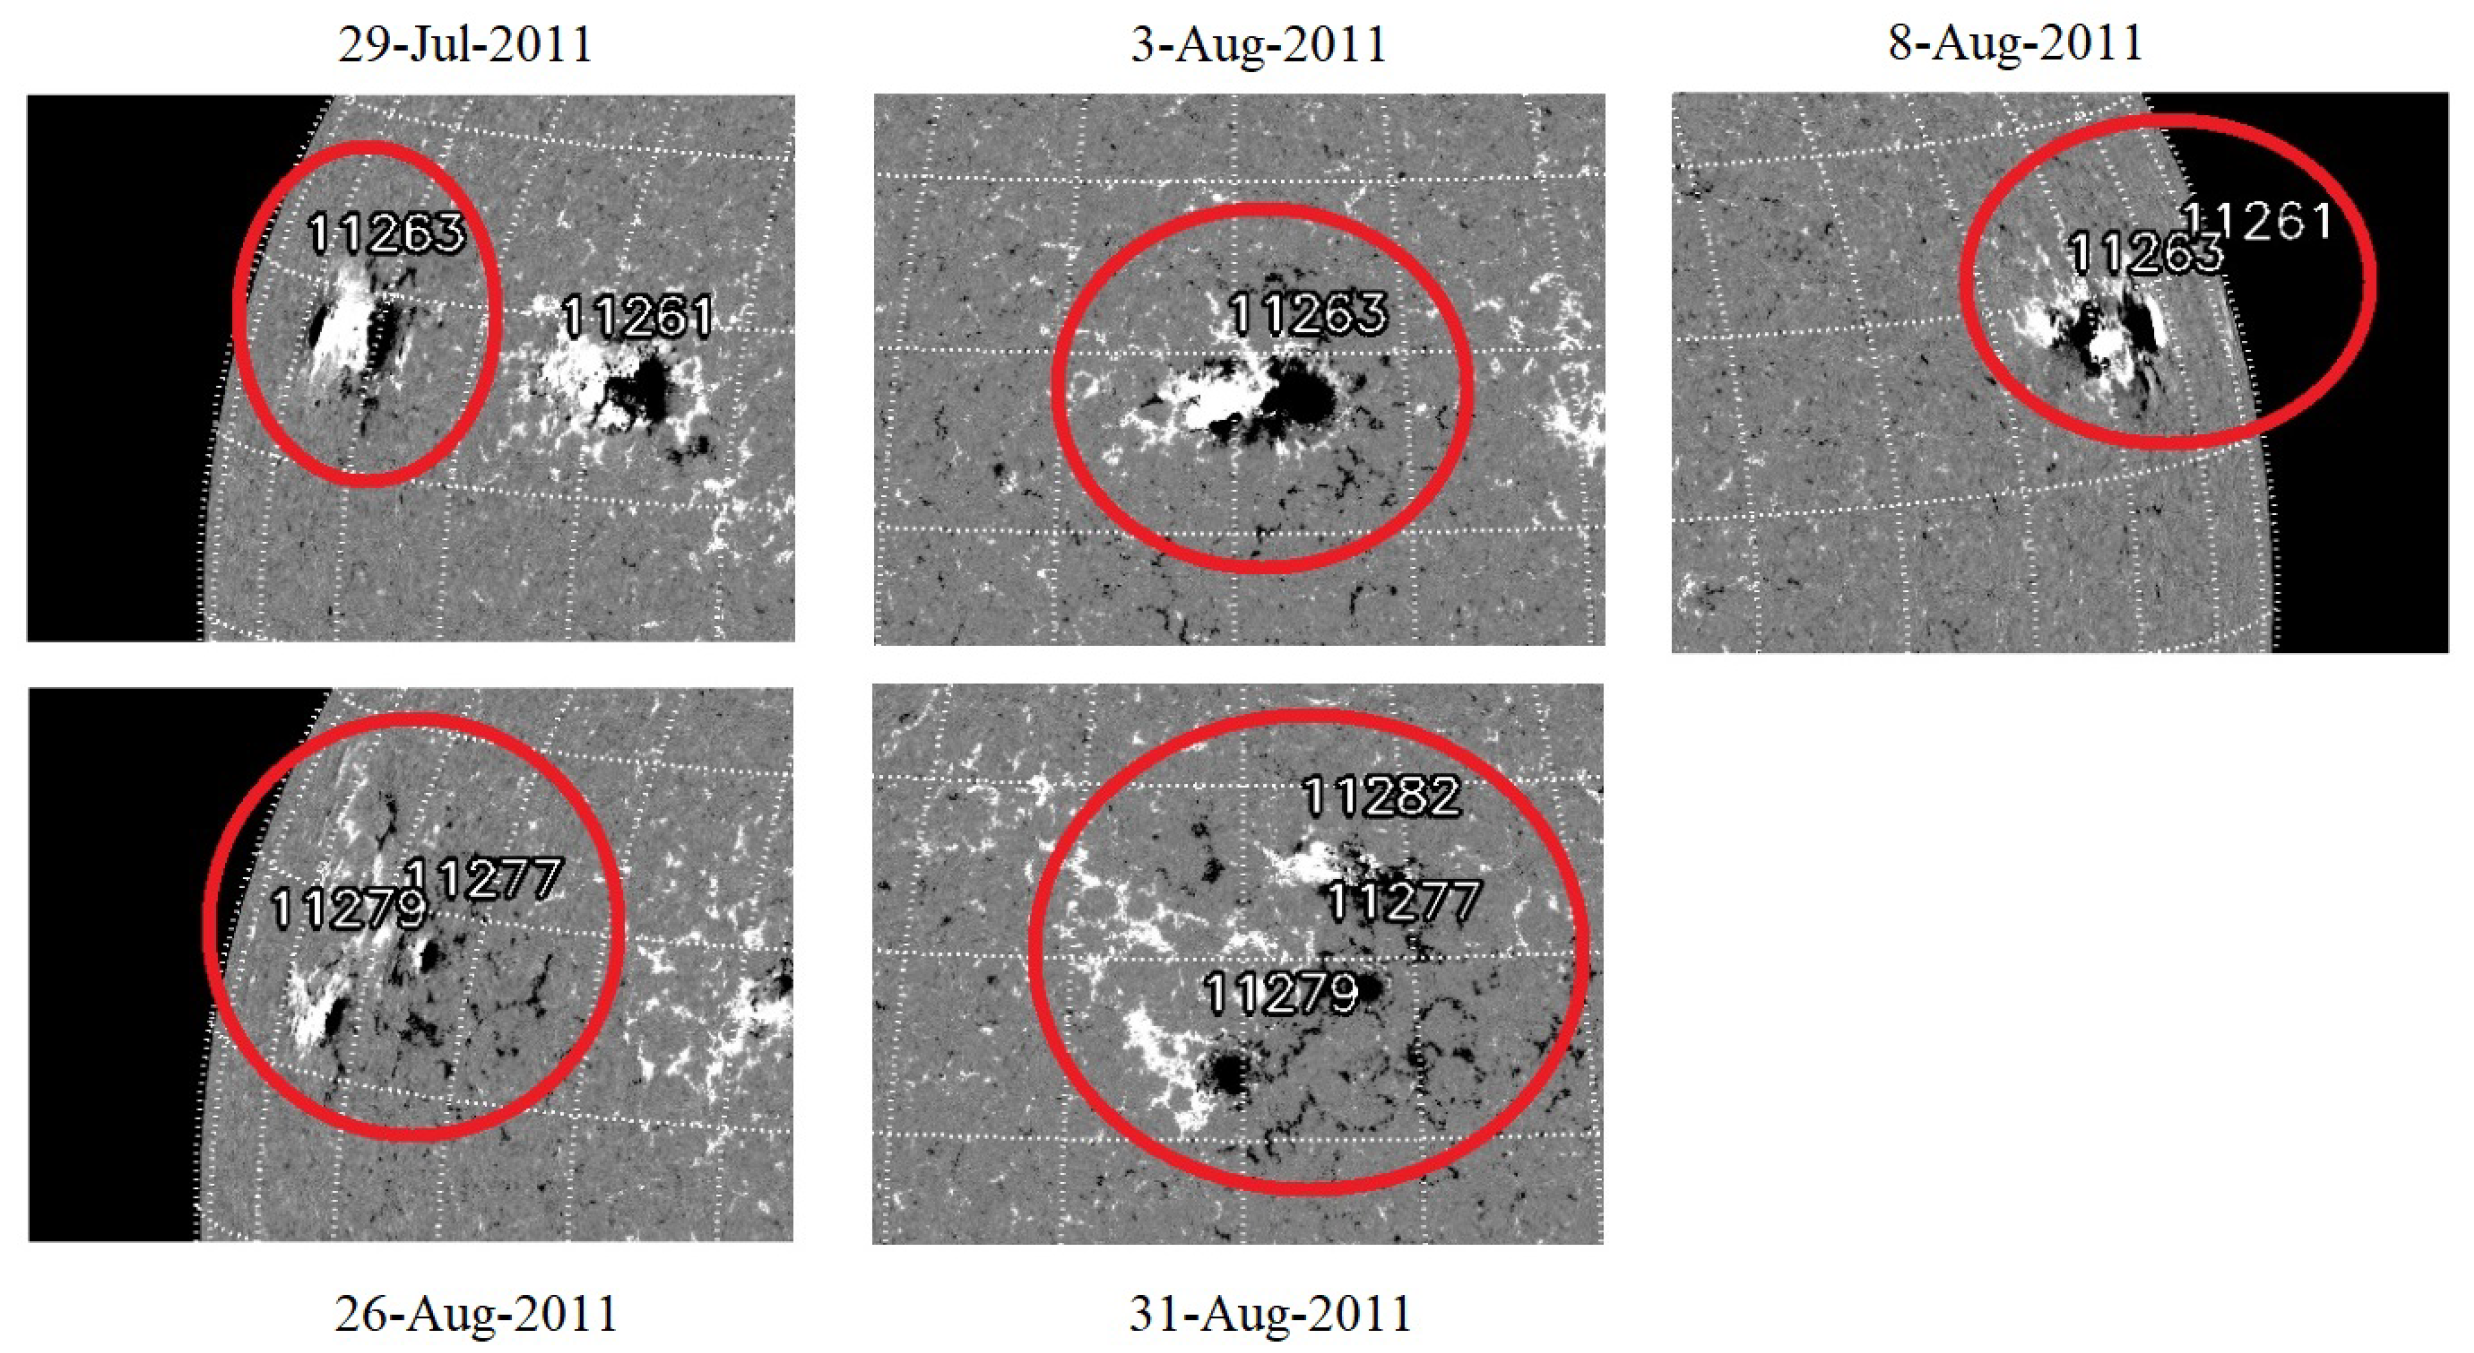
Appendix D. Example of Potentially Wrong Identification
Figure A2 gives an example of a confusing identification: groups 11277 (the nearest) and 11279 (selected by our algorithm) appear near the location where group 11263 was previously detected. The usage of the STEREO observations suggests that this identification is wrong but leaves a room for some concerns. We recall that the goal of the identification is to quantify the role of the strong magnetic field associated with large nestlets through the composites built on the 11 or 22-year averages of the identified groups. The error in this particular identification affects the composite weakly, as both potential complements are not characterized by a large discrepancy in their areas. Even if both complements were incorrect (i.e., group 11263 vanishes at the back side of the Sun, which is unlikely) the appearance of a new large group at approximately the same location may be caused by the strong magnetic field we are going to characterize. Therefore, the inclusion of any of these groups into the composite is likely to be relevant.
Figure A2.
The movement of the sunspot group 11263–11277/11279 (recorded from 29 July 2011 till 4 September 2011) supposed to be recurrent. Data are freely downloaded from SolarMonitor.org (accessed on 5 January 2022).
Figure A2.
The movement of the sunspot group 11263–11277/11279 (recorded from 29 July 2011 till 4 September 2011) supposed to be recurrent. Data are freely downloaded from SolarMonitor.org (accessed on 5 January 2022).

References
- Rieutord, M.; Rincon, F. The Sun’s supergranulation. Living Rev. Sol. Phys. 2010, 7, 1–82. [Google Scholar] [CrossRef] [Green Version]
- Obridko, V.; Badalyan, O. Cyclic and secular variations sunspot groups with various scales. Astron. Rep. 2014, 58, 936–944. [Google Scholar] [CrossRef]
- Mandal, S.; Banerjee, D. Sunspot sizes and the solar cycle: Analysis using Kodaikanal white-light digitized data. Astrophys. J. Lett. 2016, 830, L33. [Google Scholar] [CrossRef] [Green Version]
- Javaraiah, J. North-south asymmetry in small and large sunspot group activity and violation of even-odd solar cycle rule. Astrophys. Space Sci. 2016, 361, 208. [Google Scholar] [CrossRef] [Green Version]
- Usoskin, I.G.; Kovaltsov, G.A.; Chatzistergos, T. Dependence of the Sunspot-group size on the level of solar activity and its influence on the calibration of solar observers. Sol. Phys. 2016, 291, 3793–3805. [Google Scholar] [CrossRef] [Green Version]
- Osipova, A.; Nagovitsyn, Y. The Waldmeier effect for two sunspot populations. Geomagn. Aeron. 2017, 57, 1092–1100. [Google Scholar] [CrossRef]
- Nagovitsyn, Y.; Ivanov, V.; Skorbezh, N. Refinement of the Gnevyshev-Waldmeier Rule Based on a 140-Year Series of Observations. Astron. Lett. 2019, 45, 396–401. [Google Scholar] [CrossRef]
- Bazilevskaya, G.; Broomhall, A.M.; Elsworth, Y.; Nakariakov, V. A combined analysis of the observational aspects of the quasi-biennial oscillation in solar magnetic activity. Space Sci. Rev. 2014, 186, 359–386. [Google Scholar] [CrossRef]
- Popova, E.; Yukhina, N. The quasi-biennial cycle of solar activity and dynamo theory. Astron. Lett. 2013, 39, 729–735. [Google Scholar] [CrossRef]
- Hathaway, D.H. The Solar Cycle. Living Rev. Sol. Phys. 2015, 12, 4. [Google Scholar] [CrossRef]
- Le Mouël, J.L.; Lopes, F.; Courtillot, V. Identification of Gleissberg cycles and a rising trend in a 315-year-long series of sunspot numbers. Sol. Phys. 2017, 292, 43. [Google Scholar] [CrossRef]
- Petrovay, K. Solar cycle prediction. Living Rev. Sol. Phys. 2020, 17, 1–93. [Google Scholar] [CrossRef] [Green Version]
- Mu noz-Jaramillo, A.; Senkpeil, R.R.; Windmueller, J.C.; Amouzou, E.C.; Longcope, D.W.; Tlatov, A.G.; Navovitsyn, Y.A.; Pevtsov, A.A.; Chapman, G.A.; Cookson, A.M.; et al. Small-scale and global dynamos and the area and flux distributions of active regions, sunspot groups, and sunspots: A multi-database study. Astrophys. J. 2015, 800, 48–67. [Google Scholar] [CrossRef] [Green Version]
- Hazra, G. Recent advances in the 3D kinematic Babcock-Leighton solar dynamo modeling. arXiv 2020, arXiv:2009.03810. [Google Scholar] [CrossRef]
- Yeates, A.; Mu noz-Jaramillo, A. Kinematic active region formation in a three-dimensional solar dynamo model. Mon. Not. R. Astron. Soc. 2013, 436, 3366–3379. [Google Scholar] [CrossRef] [Green Version]
- Miesch, M.S.; Dikpati, M. A three-dimensional Babcock-Leighton solar dynamo model. Astrophys. J. Lett. 2014, 785, L8. [Google Scholar] [CrossRef] [Green Version]
- Karak, B.B.; Miesch, M. Recovery from Maunder-like grand minima in a Babcock–Leighton solar dynamo model. Astrophys. J. Lett. 2018, 860, L26. [Google Scholar] [CrossRef] [Green Version]
- Maunder, A. Catalogue of Recurrent Groups of Sun Spots for the Years 1874 to 1906 Compiled by Mrs. Annie SD Maunder, from the Ledgers of Groups of Sun Spots Published in the Greenwich Observations, 1886–1907. Greenwich Obs. Astron. Magn. Meteorol. Made R. Obs. Ser. 1909, 69, O1–O50. [Google Scholar]
- Henwood, R.; Chapman, S.; Willis, D. Increasing lifetime of recurrent sunspot groups within the Greenwich photoheliographic results. Sol. Phys. 2010, 262, 299–313. [Google Scholar] [CrossRef] [Green Version]
- Ringnes, T. Secular variations of long-lived sunspots. Astrophys. Nor. 1964, 8, 303. [Google Scholar]
- Foukal, P. An Explanation of the Differences Between the Sunspot Area Scales of the Royal Greenwich and Mt. Wilson Observatories, and the SOON Program. Sol. Phys. 2014, 289, 1517–1529. [Google Scholar] [CrossRef]
- Giersch, O.; Kennewell, J.; Lynch, M. Reanalysis of Solar Observing Optical Network Sunspot Areas. Sol. Phys. 2018, 293, 17. [Google Scholar] [CrossRef]
- Hathaway, D. USAF/NOAA Sunspot Data; 1875–2020. Available online: http://solarcyclescience.com/activeregions.html (accessed on 5 January 2022).
- Hathaway, D.; Wilson, R.; Reichmann, E. Group Sunspot Numbers: Sunspot Cycle Characteristics. Sol. Phys. 2002, 211, 357–370. [Google Scholar] [CrossRef]
- Balmaceda, L.; Solanki, S.; Krivova, N.; Foster, S. A homogeneous database of sunspot areas covering more than 130 years. J. Geophys. Res. Space Phys. 2009, 114, A7. [Google Scholar] [CrossRef] [Green Version]
- Lockwood, M.; Owens, M.; Barnard, L.; Usoskin, I. An Assessment of Sunspot Number Data Composites over 1845–2014. Astrophys. J. 2016, 824, 54–70. [Google Scholar] [CrossRef] [Green Version]
- Mandal, S.; Krivova, N.A.; Solanki, S.K.; Sinha, N.; Banerjee, D. Sunspot area catalogue revisited: Daily cross-calibrated areas since 1874. Astrophys. J. 2020, 640, A78. [Google Scholar]
- Willis, D.; Wild, M.; Appleby, G.; Macdonald, L. The Greenwich Photo-heliographic Results (1874–1885): Observing Telescopes, Photographic Processes, and Solar Images. Sol. Phys. 2016, 291, 2553–2586. [Google Scholar] [CrossRef] [Green Version]
- Cliver, E. Sunspot number recalibration: The ∼1840–1920 anomaly in the observer normalization factors of the group sunspot number. J. Space Weather Space Clim. 2017, 7, A12. [Google Scholar] [CrossRef] [Green Version]
- Clette, F.; Svalgaard, L.; Vaquero, J.M.; Cliver, E.W. Revisiting the sunspot number. In The Solar Activity Cycle; Springer: Berlin/Heidelberg, Germany, 2015; pp. 35–103. [Google Scholar]
- Hoyt, D.V.; Schatten, K.H. Group sunspot numbers: A new solar activity reconstruction. Sol. Phys. 1998, 179, 189–219. [Google Scholar] [CrossRef]
- Lockwood, M.; Owens, M.; Barnard, L. Centennial variations in sunspot number, open solar flux, and streamer belt width: 1. Correction of the sunspot number record since 1874. J. Geophys. Res. Space Phys. 2014, 119, 5172–5182. [Google Scholar] [CrossRef] [Green Version]
- Svalgaard, L.; Schatten, K.H. Reconstruction of the sunspot group number: The backbone method. Sol. Phys. 2016, 291, 2653–2684. [Google Scholar] [CrossRef] [Green Version]
- Usoskin, I.G.; Kovaltsov, G.A.; Lockwood, M.; Mursula, K.; Owens, M.; Solanki, S.K. A new calibrated sunspot group series since 1749: Statistics of active day fractions. Sol. Phys. 2016, 291, 2685–2708. [Google Scholar] [CrossRef]
- Kaiser, M.; Kucera, T.; Davila, J.; Cyr, O.; Guhathakurta, M.; Christian, E. The STEREO mission: An introduction. Space Sci. Rev. 2008, 136, 5–16. [Google Scholar] [CrossRef]
- Pesnell, W.; Thompson, B.; Chamberlin, P. The solar dynamics observatory (SDO). In The Solar Dynamics Observatory; Springer: Berlin/Heidelberg, Germany, 2011; pp. 3–15. [Google Scholar]
- Balthasar, H.; Wöhl, H. Differential rotation and meridional motions of sunspots in the years 1940–1968. Astron. Astrophys. 1980, 92, 111–116. [Google Scholar]
- Howard, R.; Gilman, P. Meridional motions of sunspots and sunspot groups. T Astrophys. J. 1986, 307, 389–394. [Google Scholar] [CrossRef]
- Ruždjak, D.; Ruždjak, V.; Brajša, R.; Wöhl, H. Deceleration of the rotational velocities of sunspot groups during their evolution. Sol. Phys. 2004, 221, 225–236. [Google Scholar] [CrossRef]
- SILSO World Data Center. The International Sunspot Number. In International Sunspot Number Monthly Bulletin and Online Catalogue; SILSO World Data Center: Brussels, Belgium, 2020. [Google Scholar]
- Blanter, E.; Le Mouël, J.L.; Perrier, F.; Shnirman, M. Short-term correlation of solar activity and sunspot: Evidence of lifetime increase. Sol. Phys. 2006, 237, 329–350. [Google Scholar] [CrossRef]
- Lockwood, M.; Owens, M.; Barnard, L.; Usoskin, I. Tests of Sunspot Number Sequences: 3. Effects of Regression Procedures on the Calibration of Historic Sunspot Data. Sol. Phys. 2016, 291, 2829–2841. [Google Scholar] [CrossRef] [Green Version]
- Willis, D.M.; Wild, M.N.; Warburton, J.S. Re-examination of the Daily Number of Sunspot Groups for the Royal Observatory, Greenwich (1874–1885). Sol. Phys. 2016, 291, 2519–2552. [Google Scholar] [CrossRef] [Green Version]
- Javaraiah, J. The G–O rule and Waldmeier effect in the variations of the numbers of large and small sunspot groups. Sol. Phys. 2012, 281, 827–837. [Google Scholar] [CrossRef] [Green Version]
- Kilcik, A.; Yurchyshyn, V.; Ozguc, A.; Rozelot, J. Solar cycle 24: Curious changes in the relative numbers of sunspot group types. Astrophys. J. Lett. 2014, 794, L2. [Google Scholar] [CrossRef] [Green Version]
- Shapoval, A.; Le Mouël, J.L.; Shnirman, M.; Courtillot, V. Observational evidence in favor of scale-free evolution of sunspot groups. Astron. Astrophys. 2018, 618, A183. [Google Scholar] [CrossRef] [Green Version]
- Castenmiller, M.; Zwaan, C.; van der Zalm, E.B.J. Sunspot nests. Sol. Phys. 1986, 105, 237. [Google Scholar] [CrossRef]
- Petrie, G. Solar Magnetism in the Polar Regions. Living Rev. Sol. Phys. 2015, 12, 1–102. [Google Scholar] [CrossRef] [Green Version]
- Ugarte-Urra, I.; Upton, L.; Warren, H.; Hathaway, D. Magnetic flux transport and the long-term evolution of solar active regions. Astrophys. J. 2015, 815, 90. [Google Scholar] [CrossRef] [Green Version]
- Gyenge, N.; Singh, T.; Kiss, T.; Srivastava, A.; Erdélyi, R. Active Longitude and Coronal Mass Ejection Occurrences. Astrophys. J. 2017, 838, 18. [Google Scholar] [CrossRef] [Green Version]
- Thompson, W. Coordinate systems for solar image data. Astron. Astrophys. 2006, 449, 791–803. [Google Scholar] [CrossRef] [Green Version]
- Petrovay, K.; van Driel-Gesztelyi, L. Making sense of sunspot decay—I: Parabolic Decay Law and Gnevyshev–Waldmeier Relation. Sol. Phys. 1997, 176, 249–266. [Google Scholar] [CrossRef] [Green Version]
Figure 1.
The 11-year moving averages , , , and of index ISSN and the areas of all, medium, and large selected sunspots, respectively, in line with (1); and are scaled to fit the Y-range.
Figure 1.
The 11-year moving averages , , , and of index ISSN and the areas of all, medium, and large selected sunspots, respectively, in line with (1); and are scaled to fit the Y-range.

Figure 2.
The normalized composites and of the areas of the moderate and large selected sunspot groups; specific normalization and the composite of the areas of the all sunspots (both rescaled by an appropriate constant and number , respectively).
Figure 2.
The normalized composites and of the areas of the moderate and large selected sunspot groups; specific normalization and the composite of the areas of the all sunspots (both rescaled by an appropriate constant and number , respectively).

Figure 3.
The composites (black), (gray), (magenta) obtained through the normalization (2) with a power function of the activity, where equalled to , , and , respectively, is adjusted to each composite separately. Scaled solar activity given with the index (red) and the boundaries of the solar cycles (vertical lines) are for illustrative purposes.

Figure 4.
The 22-year moving averages (in blue), (in magenta), and (in yellow) of the lifetime per day calculated for the groups from the catalogues , , and representing large recurrent sunspot groups, moderate recurrent sunspot groups and all groups recorded after the identification and related to that examined in [19]. Daily ISSN (scaled) is in black.

Publisher’s Note: MDPI stays neutral with regard to jurisdictional claims in published maps and institutional affiliations. |
© 2022 by the author. Licensee MDPI, Basel, Switzerland. This article is an open access article distributed under the terms and conditions of the Creative Commons Attribution (CC BY) license (https://creativecommons.org/licenses/by/4.0/).
Share and Cite
MDPI and ACS Style
Shapoval, A. The Contribution of Large Recurrent Sunspot Groups to Solar Activity: Empirical Evidence. Universe 2022, 8, 180. https://0-doi-org.brum.beds.ac.uk/10.3390/universe8030180
AMA Style
Shapoval A. The Contribution of Large Recurrent Sunspot Groups to Solar Activity: Empirical Evidence. Universe. 2022; 8(3):180. https://0-doi-org.brum.beds.ac.uk/10.3390/universe8030180
Chicago/Turabian StyleShapoval, Alexander. 2022. "The Contribution of Large Recurrent Sunspot Groups to Solar Activity: Empirical Evidence" Universe 8, no. 3: 180. https://0-doi-org.brum.beds.ac.uk/10.3390/universe8030180
Note that from the first issue of 2016, this journal uses article numbers instead of page numbers. See further details here.